recent progress in convective phenomena monitoring and forecasting at the inm f. martín, f....
Post on 21-Dec-2015
216 views
TRANSCRIPT
RECENT PROGRESS IN CONVECTIVE RECENT PROGRESS IN CONVECTIVE PHENOMENAPHENOMENA
MONITORING AND FORECASTING AT MONITORING AND FORECASTING AT
THE INMTHE INM
F. Martín, F. Elizaga, I. San Ambrosio and J. M. F. Martín, F. Elizaga, I. San Ambrosio and J. M.
FernándezFernández [email protected]
Servicio de Técnicas de Análisis y Predicción, STAPServicio de Técnicas de Análisis y Predicción, STAP(Forecasting and Analysis Techniques Service)(Forecasting and Analysis Techniques Service)
Instituto Nacional de Meteorología, INMInstituto Nacional de Meteorología, INMwww.inm.eswww.inm.es
Summary of the presentation
– Outlook of convection monitoring at INM– Integration of remote sensing data and NWP
output: •Regional level: hail moduleRegional level: hail module•National levelNational level
– Doppler radar-based products – Specific products for end-users– Conclusions

Convection monitoring at INM: Convection monitoring at INM: Basic approachBasic approach
• Specific oriented NWP output for deep moist convection: CAPE, CIN, SRH,… Maps from ECMWF and HIRLAM models
• Pseudo sounding derived from NWP models and thunderstorm oriented parameters
• MSG imagery and Nowcasting SAF products
• Integration of remote sensing data:– Regional level– National level
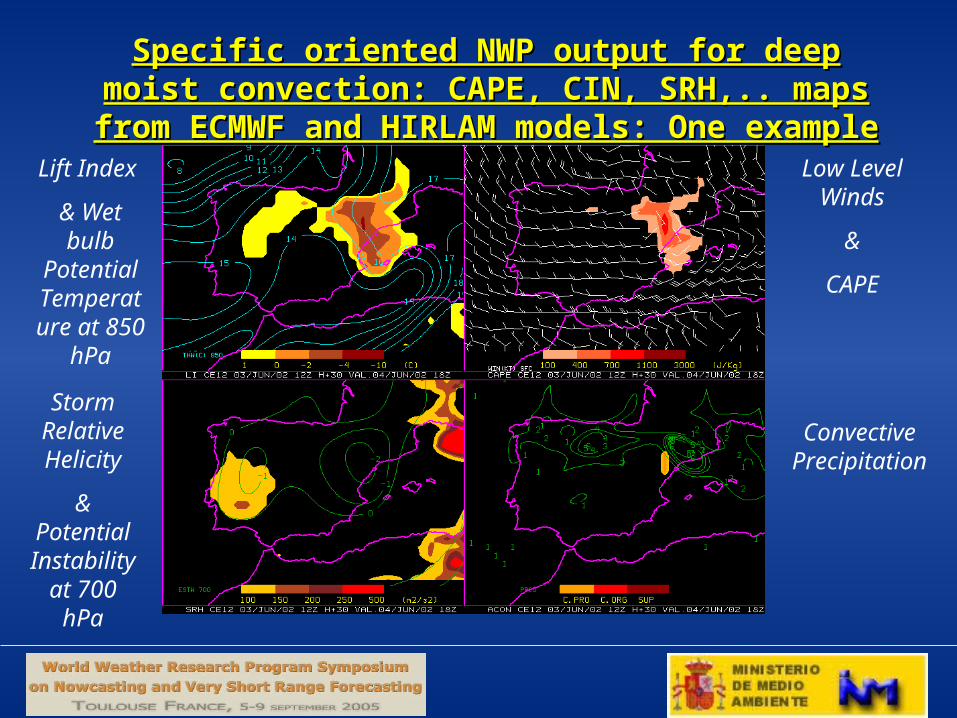
Specific oriented NWP output for deep moist convection: Specific oriented NWP output for deep moist convection: CAPE, CIN, SRH,.. maps from ECMWF and HIRLAM CAPE, CIN, SRH,.. maps from ECMWF and HIRLAM
models: One examplemodels: One exampleLift Index
& Wet bulb
Potential Temperature at 850
hPa
Convective Precipitation
Low Level Winds
&
CAPE
Storm Relative Helicity
& Potential Instability
at 700 hPa

Integration of CG lightning and radar dataIntegration of CG lightning and radar data
Data and methodologyData and methodology
• Data – Regional radar data: 1 PPI + 12 CAPPIs (0.5-16 km) + derived radar products (Echotop, VIL,
ZMAX, ..) in non Doppler mode, every 10 min., 2 Km x2 Km. Other data in Doppler mode
– National composite radar data: PPI, CAPPI-2.5 Km height, VIL, Echotop, ZMAX… en non Doppler mode, every 10 min., 2 Km x2 Km. Other data in Doppler mode
– CG data, MSG-MET8 imagery and HIRLAM/ECMWF model output
• Procedures for radar-based convective identification Two procedures have been adapted for monitoring and tracking of radar-based convective storms , taking to account the INM radar data and facilities:
– Bidimensional procedure, 2D, is applied on lowest radar elevation on PPI/CAPPI/ZMAX images: Steiner-Youter-Houze, SYH, technique (regional and national data!!!)
– Three dimensional procedure, 3D, is applied on the 12 CAPPIs: SCIT algorithm (“Storm Cell Identification and Tracking”), developed by Johnson et al. (1998). At regional level!!!.

Integration of lightning and radar data:Integration of lightning and radar data:(I)(I)
• Radar and lighting data fusion– 2D. PPI (CAPPIo ) (t) + lightning data (t-10 min., t) are
combined. Radar-based convective objects + CG strikes– Spatial integration at “t” and backward movement of 2D
convective structure up to t-10 min., for a temporal integration– Linear extrapolation of lightning and 2D convective structures up
to 60 min.------------------------------------------------------------------
• Cluster analysis– Non radar-combined “CG” strikes are
clustered by just distance criterion – Tracking and linear extrapolation of lightning clusters are not
applied in the operational procedure

Integration of Integration of lightning and lightning and
radar dataradar data
Regional and Regional and National levels:National levels:
Flow ChartFlow Chart(II)(II)
MSG imagery as a background image (2005)
IR10.8 at night
HRVIS
daytime

Integration of lightning and radar data: Integration of lightning and radar data: (III)(III)
• Identification of convective structures, 2D:– Radar data to use:
• Regional level: The lowest PPI (or a low CAPPI)• National level: ZMAX composite image
– SYH, procedure for convective – stratiform separation (2D)
– SYH convective criteria:– Intensity criterion – Peakedness or gradient criterion– Surrounding area criterion
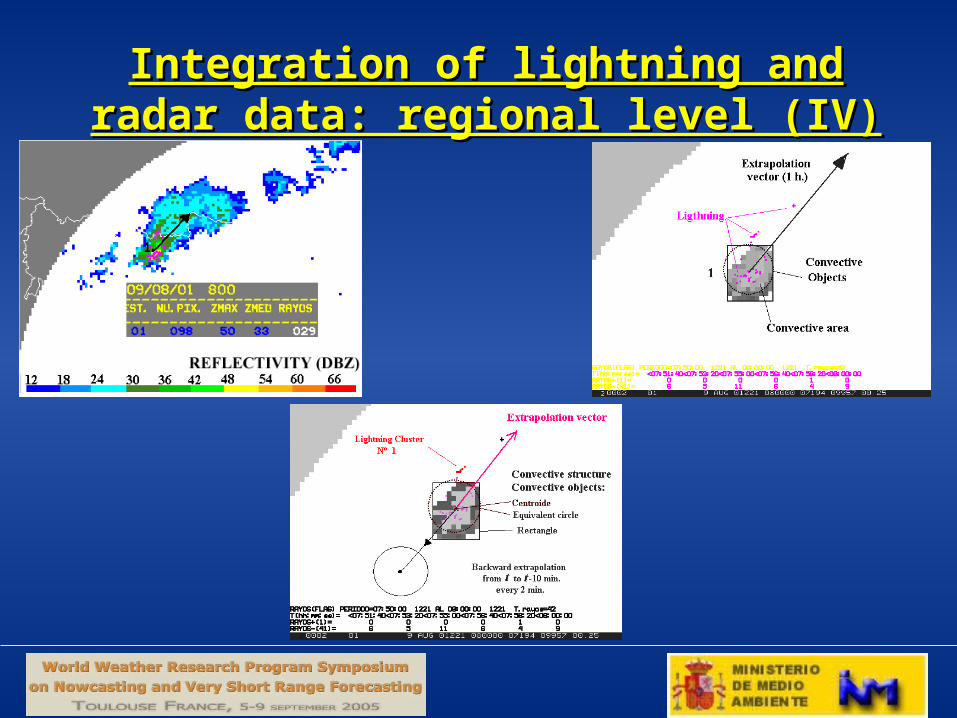
Integration of lightning and radar data: Integration of lightning and radar data: regional level (IV)regional level (IV)

Cluster Procedure (I)Cluster Procedure (I)
• Data – CG strikes, which have not been combined with
convective radar structures, are clustered• Procedure
– A lightning cluster is a set of CG flashes if for any lightning “i” exists at least other “j” and the distance
Dij ≤10 km– A cluster is analysed if its CG number is superior or
equal to 10 strikes (number of positive and negative strikes, centroid location, maximum and minimum distances among strikes)
– None extrapolation is performed

Cluster Procedure (II)Cluster Procedure (II)
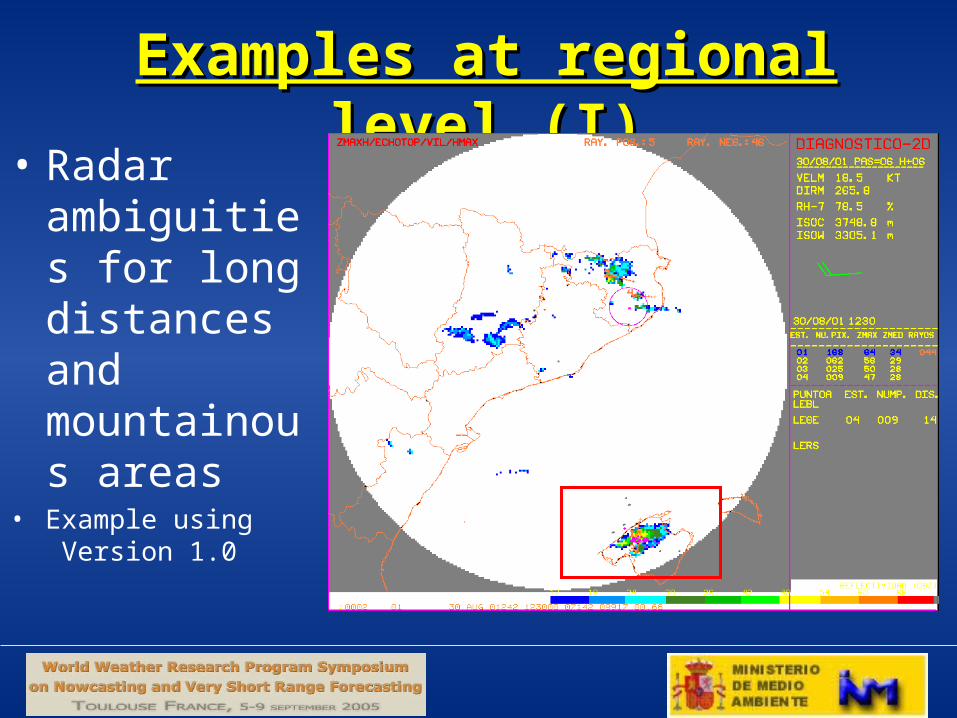
Examples at regional level (I)Examples at regional level (I)• Radar
ambiguities for long distances and mountainous areas
• Example using Version 1.0
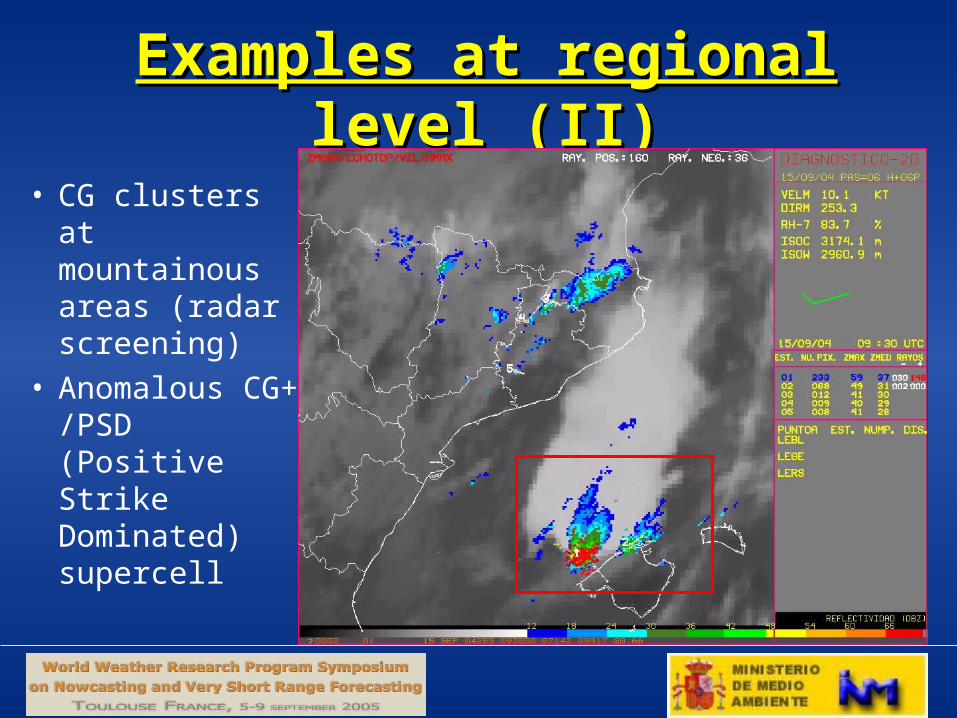
Examples at regional level (II)Examples at regional level (II)
• CG clusters at mountainous areas (radar screening)
• Anomalous CG+ /PSD (Positive Strike Dominated) supercell
Integration of lightning and radar data: Integration of lightning and radar data: national level (I)national level (I)
• Identification of convective structures– Radar image to use: A national composite image of maximum of
reflectivity from regional radar data, ZMAXZMAX, every 10 min., 2 x 2 km
– When a national pixel is covered by different radars, the maximum value of ZMAX is selectedmaximum value of ZMAX is selected
– SYH procedure for convective – stratiform separation is applied– The same procedure of assignment of CG and convective radar-
based structure data is applied at national level – Clustering procedure is applied when CG lightings have not been
assigned.

Integration of lightning and radar data: Integration of lightning and radar data: national level (II)national level (II)
• Example:
Thunderstorms over the Iberian Peninsula and airports graphical warning
Airports
Identification of 3D convective cellIdentification of 3D convective cell
-SCIT: “Storm Cell Identification and Tracking” procedure, developed by Johnson et al. (1998), has been adapted at INM using the 12 CAPPIs from regional radar data every 10 minutes.
- 3D Cell properties, extrapolation and tracking are performed
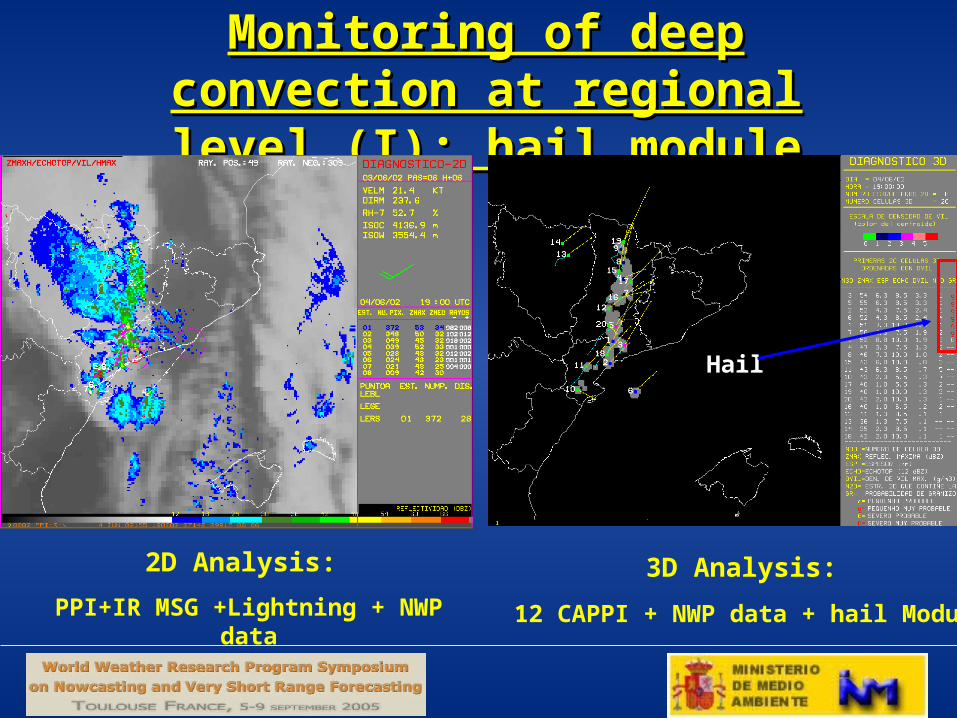
Monitoring of deep convection at Monitoring of deep convection at regional level (I): hail moduleregional level (I): hail module
2D Analysis:
PPI+IR MSG +Lightning + NWP data
3D Analysis:
12 CAPPI + NWP data + hail Module
Hail
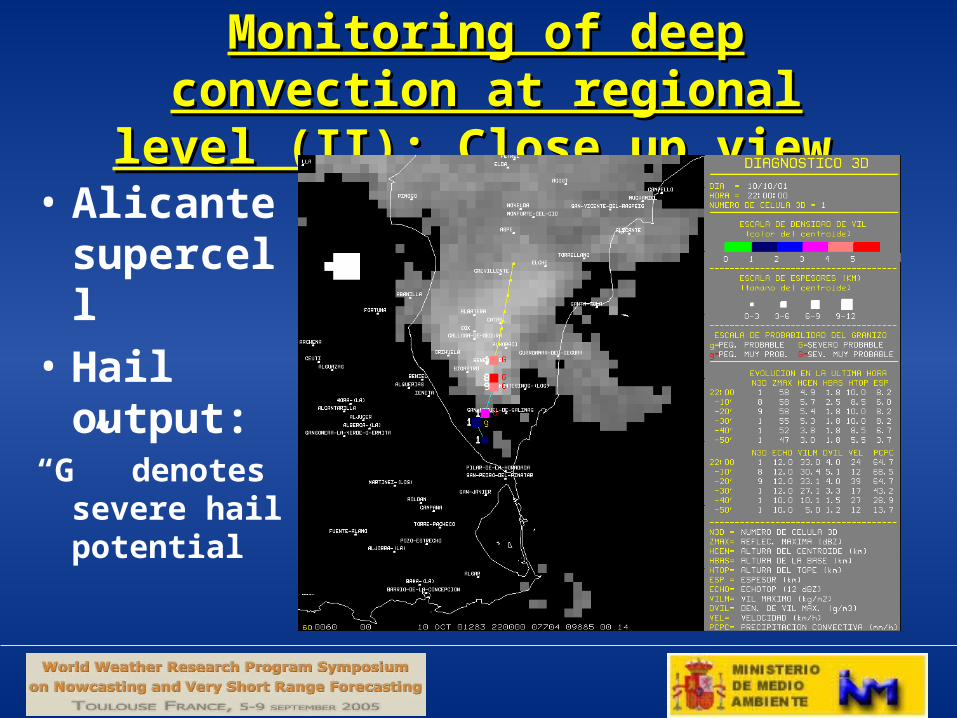
Monitoring of deep convection at Monitoring of deep convection at regional level (II): Close up view regional level (II): Close up view
• Alicante supercell
• Hail output:
“G” denotes severe hail potential
Doppler radar-based productsDoppler radar-based products
• VAD (Velocity Azimuth Display)
• Identification of mesocyclone (Version 0.1 non operational)

VAD productsVAD products
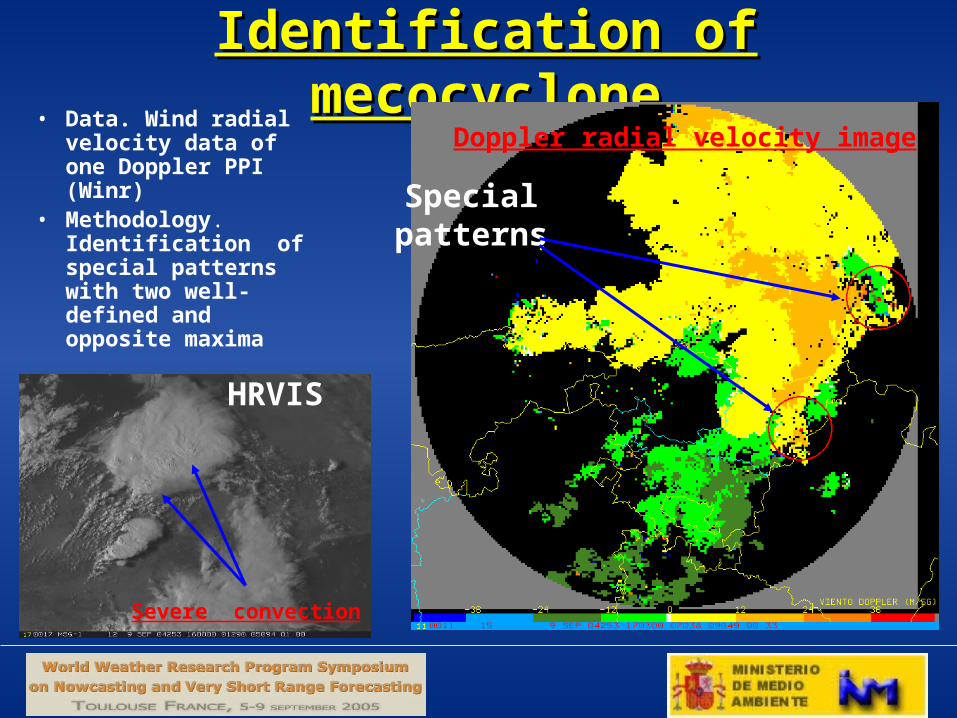
Identification of mecocycloneIdentification of mecocyclone• Data. Wind radial
velocity data of one Doppler PPI (Winr)
• Methodology. Identification of special patterns with two well-defined and opposite maxima
Special patterns
HRVIS
Doppler radial velocity image
Severe convection
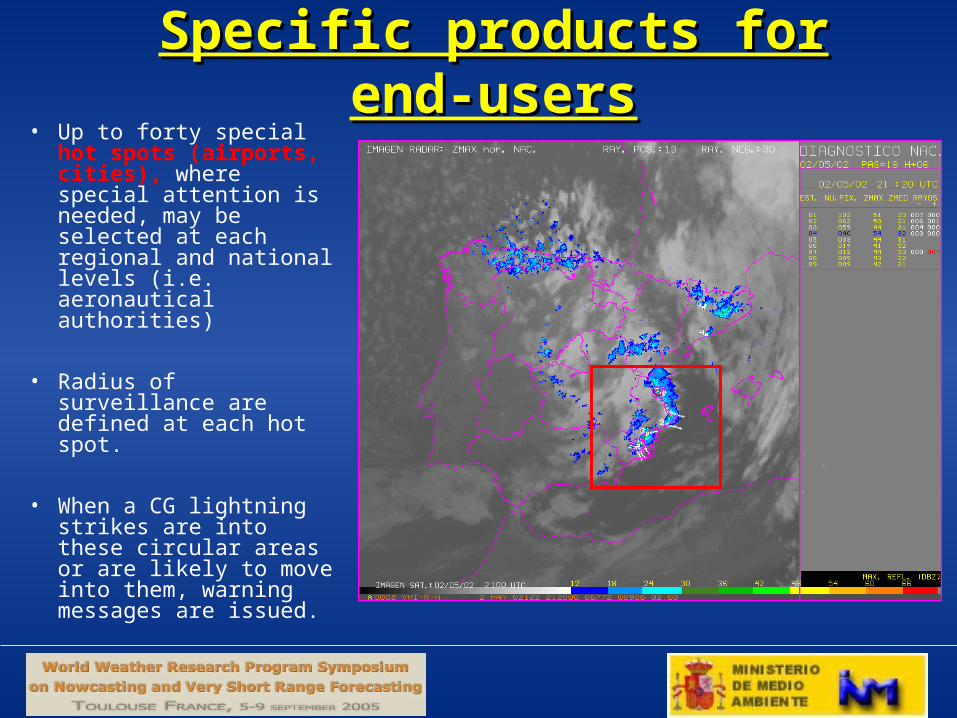
Specific products for end-usersSpecific products for end-users• Up to forty special hot
spots (airports, cities), where special attention is needed, may be selected at each regional and national levels (i.e. aeronautical authorities)
• Radius of surveillance are defined at each hot spot.
• When a CG lightning strikes are into these circular areas or are likely to move into them, warning messages are issued.
ConclusionsConclusions• Objective procedures have been developed at INM to
integrate different types of data at national and regional levels for monitoring deep moist convection.
• Graphical and text format products are generated automatically for helping forecasters
• External end-users are requiring special tailored products associating remote sensing information such as CG products.
• Doppler radar-based products will be developed in the next future for monitoring convective wind velocity patterns (mesocyclone, intense convergence and divergence).
• In the next future, GIS information will be included in the automatic procedures to enhance all remote sensing information.