recent republican dominance in appalachia a thesis …
TRANSCRIPT

RECENT REPUBLICAN DOMINANCE IN APPALACHIA
A Thesis
by
KEVIN OSHNOCK
Submitted to the School of Graduate Studies
at Appalachian State University
in partial fulfillment of the requirements for the degree of
MASTER OF ARTS
December, 2019
Department of Government and Justice Studies

RECENT REPUBLICAN DOMINANCE IN APPALACHIA
A Thesis
by
KEVIN OSHNOCK
December 2019
APPROVED BY:
Dr. William Hicks
Chairperson, Thesis Committee
Dr. Adam J. Newmark
Member, Thesis Committee
Dr. Phillip Ardoin
Member, Thesis Committee
Dr. Phillip Ardoin
Chairperson, Department of Government and Justice Studies
Mike McKenzie, Ph.D.
Dean, Cratis D. Williams School of Graduate Studies

Copyright by Kevin Oshnock 2019
All Rights Reserved
iv
Abstract
RECENT REPUBLICAN DOMINANCE IN APPALACHIA
Kevin Oshnock
B.A., Westminster College
M.A., Appalachian State University
Chairperson: William Hicks
Why has Appalachia voted increasingly Republican in the 21st Century? I find that
Appalachian citizens are more likely to vote for Republican candidates than citizens in other
regions, controlling for race, education, income, and rural-urban status among other things. This
phenomenon is shaped by both policy preferences and culture. Due to this combination of
expressive and instrumental concerns, a large number of Democrats in the region have been
disaffected from the national party and have become frequent Republican voters or identifiers.
This trend first appeared at the Presidential level in the early or mid-2000s and trickled down to
other national and state races by 2012. Ultimately, the geographic isolation of the region has led
to a unique history and political culture that have created a much more Republican friendly
landscape compared to other parts of the country today.
v
Acknowledgments
I want to give a deep and sincere thanks to my advisor Dr. Hicks. When I started this
project a couple years ago, I needed a lot of help as it was my first time in a political science
program. He has given me an immense amount of knowledge in statistical research and taught
me a variety of techniques that have guided me throughout this project. Also, our weekly thesis
discussions really helped me to hone my theory and adequately address the literature. Working
under Dr. Hicks has been awesome. I also want to thank my other committee members. Many
of my early discussions with Dr. Ardoin were especially helpful in the formation of this project,
and Dr. Newmark has immensely increased my overall knowledge of American political science.
Along with that, Dr. William Schumann helped me with the Appalachian perspective and gave
this project a voice outside of the department, and a few critical ideas came directly from him.
Furthermore, I want to give a big thanks to Dr. Renee Scherlen both for a good understanding of
methods and also for specific critiques made as I designed this research project. Lastly, I want to
thank all of the professors that I have had throughout my time at Appalachian State University as
they have collectively given me the skills and knowledge needed to do research in political
science.
vi
Table of Contents
Abstract ......................................................................................................................... iv
Acknowledgments ........................................................................................................... v
Introduction .................................................................................................................... 1
Literature Review ............................................................................................................ 5
Theory .......................................................................................................................... 18
Data and Methods ......................................................................................................... 41
Results .......................................................................................................................... 45
Conclusion .................................................................................................................... 78
References .................................................................................................................... 82
Appendix ...................................................................................................................... 89
Vita ............................................................................................................................. 103

1
Introduction
On the day after the 2016 Election, the New York Times posted an article titled “6
Books to Help Understand Trump’s Win,” and on that list was Hillbilly Elegy, a book written
about social problems in Appalachia. In the book, J. D. Vance (2016) talks about the
problems that he sees in the culture and predicted that Trump would do well with
Appalachian voters because he was sympathetic and cognizant of their fears. Little did
Vance know just how well Donald Trump would do in the region.
Appalachia is generally defined as the mountainous region stretching from northern
Alabama through southern New York (see appendix). Since the 1990s, no region of the
county has seen a larger shift in voting towards the Republican Party. After the Civil War,
the entire South supported the Democratic Party except for large sections of Appalachia
which supported the Republican Party due to their support for the Union during the war (Key
1949; McKinney 1998). For example, only five Democrats have won countywide elections
in Mitchell County, North Carolina, since the Civil War and all five races had extraordinary
circumstances surrounding them (Thomas 1990). Mitchell County was the most pro-Union
county in all of North Carolina (Oshnock 2018). These allegiances largely held until 1932.
With FDR’s New Deal coalition, parties became more class based with the Democratic Party
supporting a broad array of the working class, unions, and immigrants (Key 1955). Because
of this, many of the coal and industrial counties of Appalachia joined the Democratic Party.
After 1968, southern Appalachian counties that once voted Democratic due to Civil War
allegiances became much more Republican, but FDR Democrats still controlling many
counties into the early 2000s (Schaffner 2012). The persistence of Democratic support was

2
especially strong in areas with a lot of coal or industry in central and northern Appalachia
more generally.
In 1984, Ronald Reagan won a total landslide victory winning 59 percent of the
popular vote and 49 states but lost badly throughout many of the coal and industrial counties
of Appalachia. In Pennsylvania, Ronald Reagan lost only 11 counties with 10 of them being
in Western Pennsylvania. With similar results in other parts of the region, the “Reagan
Democrats” were nowhere to be found in Appalachia (Leip 1980). In contrast, Donald
Trump only lost about 10 counties throughout the entire region. Many of the counties that
rejected Reagan by a wide margin giving him only 30 or 40 percent of their vote share
resoundingly endorsed Donald Trump with over 70 or even 80 percent of the vote this time
around (NYT 2016). It is important to note that this shift has been steady from the late 1990s
to the present and was not a phenomenon of either Donald Trump or Ronald Reagan. West
Virginia, the only state that is entirely Appalachian, went from a safe Democratic state in the
early 1990s to a safe Republican state in the mid 2000s. In President Obama’s resounding
win in 2008, most of the country shifted towards the Democratic Party except for Appalachia
and some other counties in the South. Despite being a very bad year for Republicans, the
party made significant gains in much of Appalachia, and this trend has only continued into
the modern era. West Virginia was the second best state for Trump in the 2016 Election
behind only the Republican stronghold of Wyoming, but it was one of the five worst states
for Reagan in 1980 (Leip 1980: NYT 2016).
Unlike in the state of California or Virginia, the large swing in voting behavior and
partisanship in Appalachia is not because of a large change in the electorate due to migration.
Instead, Appalachia has roughly the same people as they did in the 1980s simply one

3
generation removed and yet there has been a mass change in their politics. Nationally,
partisanship and voting trends are generally quite stable for individuals, and yet in the 21st
century, a large proportion of Appalachians are becoming more Republican both in their
partisanship and voting behavior. Something unique is going on here, and scholars have yet
to adequately address this topic.
Also, Appalachia is important to modern politics because the region strongly
influences who wins many large states on the East Coast and will keep Republicans
competitive or dominant in most of these states for years to come. Sutton (2001; 2005)
argues that Appalachia was especially important in both elections for George W. Bush.
Sutton believes that Bush won the election of 2000 due to his strong showing in Appalachian
Ohio, West Virginia, Kentucky, and Tennessee, all states that Bill Clinton won twice, and
Sutton says that Bush won Ohio in 2004 by running up the numbers in its Appalachian
counties. Sutton believes that the loss of West Virginia for Democrats was especially
surprising, since Bush was the first non-incumbent Republican to win the state since before
the New Deal.
Today, Appalachia is a key factor in winning both the Electoral College and the U. S.
Senate. While other parts of the country have become more Democratic due to significant
immigration and migration, Appalachia has balanced them out and has kept the parties
competitive nationally. Not counting parts of the region that Republicans have won easily in
recent elections, Appalachia affects about 90 Electoral votes in competitive or semi-
competitive states and about 14 competitive Senate seats today. In 2016 Republicans won
most of both (NYT 2016). Without Appalachia, Republicans would have a lot less control
over the federal government. Few scholars have even written about Appalachian politics

4
since 2008, so my contribution is to both add to that conversation and address this new
political phenomenon that no other scholars are really talking about.
The next section will give a literature review on Appalachian politics and other
related topics. Next, the theory section lays out many my arguments about Appalachia and
other key variables. After that, I discuss the data and methods followed by their results. The
results sections analyzes raw election data, looks specifically at Appalachia in the 2016
election, and finally looks at Appalachia over time from 2008 to 2016. The paper concludes
with a discussion of why Appalachia matters in national politics and ideas for further
research.

5
Literature Review
Vote Choice
In general, political scientists agree that party, ideology, issues, and candidate
personality are all important in voting behavior (Lewis-Beck et al. 2011). However, there is
disagreement about how important each factor is, and many scholars also believe that
sociological factors like race, class, gender, religion, family values, and others also matter.
Overall, there are a number of vote choice models in the United States with a few that
standout.
Under the Columbia Model, social groups are the main influence on voting with
family at the center of it all (Berelson, Lazarsfeld, and McPhee 1954). To Berelson and
colleagues, family shapes interests and preferences, and identification with a political party is
merely an expression of those values. In general, most families tend to have similar political
views and reinforce each others’ biases. Friends and religion also play an important role.
Most people seek out friends and co-workers to reinforce their existing beliefs as well.
However, if opinions of family, friends, or religion differ during an election, then the person
is pulled in different directions. They are more likely to decide late or not vote at all. Also,
campaigns and the media do not usually persuade anyone or change minds. Instead, they
bring people back to their original views.
Scholars of the Michigan model strongly disagree with the notion that party
identification does not really matter (Campbell et al. 1960). Instead, they argue that people
have a psychological attachment to the party they with which identify. Party is at the center
of politics, and it filters both people’s issue perceptions and candidate evaluations. Converse
(1964) argues that when people have an ideology or “near ideology,” it filters a range of

6
other perceptions in politics. However, social groupings are especially important for less
ideological and less informed voters. Zaller (1992) also supports the Michigan model. He
says that although people get most of their information from the media and political elites,
they process it very differently. People are more likely to accept and seek out information
from elites and media sources friendly to their political party. He also does not believe that
people have one true preference on the issues but instead have conflicting views that lead
them to different conclusions at different times.
The last major model of voting is rational choice. Downs (1957) argues that voting is
like economic behavior in that when deciding for whom to vote, people do a cost-benefit
analysis of each candidate and choose the one that gives them the maximum utility.
Ultimately, people sum up their interests and choose the candidate that is closer to them, and
if people do not see an advantage to vote for one candidate over the other then they often will
not vote. Instead of being central to one’s psychology or social group, political parties and
ideology are simply a useful shortcut to use rather than taking the time to learn all about a
wide range of candidates and issues. Concrete government actions are still what really
matter to voters. Popkin (1994) agrees saying that party identification is simply a running
tally of party and that using shortcuts for voting is rational. He disagrees with those in the
Michigan model who say that partisanship leads to irrationality. Instead, Popkin views
strong partisans as people who largely agree with a party on the issues, so it is logical that
they vote for candidates of their own party. Also when people start voting against or leaving
their old party, it is because their running tally is not what it used to be.
Compared to the other two models, the rational choice model clearly places the most
importance on issues independent of other factors. While the Michigan model believes there
7
is a relatively static attachment to party, the rational choice model is especially useful in
looking at why people switch parties or begin to vote for a different political party. Downs
(1957) argues that if one group is in power, then the party not in power should appeal to
social minority groups disaffected with the party in power and specific needs of fringe voters,
which Hillygus and Shields (2008) call persuadable voters. They argue that people who vote
for candidates of the other party are most likely to do so based upon wedge issues on which
they disagree with their own party. Instead of adopting the party line on a host of issues,
people who identify with a political party will still keep distinct opinions on many issues.
Political parties are coalitions, and these cross pressures can cause people to vote for the
other party or switch parties over time. Popkin (1994) agrees saying people are more likely
to vote on an issue if candidates talk about that issue more. However, some scholars have
been heavily critical of the rational choice model. Green and Shapiro (1994) question how
realistic the model is because perhaps people are not rational. My argument accepts some
ideas from the rational choice model, and it also accepts some ideas from the Michigan
school model. In my opinion, these models are more complementary than others believe.
There is a growing literature on the role of identity in political decision making today.
Huddy, Mason, and Aaroe (2015) argue that people have a variety of identities important to
them including not only race, class, and gender but also religious and ethnic identities. These
identities lead to an emotional attachment to political parties and with it stability in party
identification and vote choice. Along with that, Davis and Mason (2016) find that
polarization today is not caused by partisan attachment alone. Instead, the confluence of
multiple social identities such as party and ideology heading in the same direction leads to
increased straight ticket voting for the party with which one identifies. Today, political

8
identity is a social identity too, and political identity today increasingly aligns with other
identities. Cramer (2016) agrees saying that group consciousness is a powerful force in
political decision making. She argues that rural people often favor limited government even
if that stance might not line up with their economic self interests because of the power of
group consciousness. Political identity is increasingly leading to bias and anger against the
other side. Sheppard (2013) also believes that the working class identity is critical to why
some people are becoming more Republican. In looking at Pennsylvania, he argues that
there is a blue collar identity founded on nationalism, religion, and a social order that is
threatened by post-materialists which is causing small towns to become more Republican and
large cities to become more Democratic. My argument also agrees with this newer branch of
the Michigan model.
While most political scientists agree that the economy has a significant impact on
elections, recent scholarship shows the importance of the economic outlook of voters as well.
Durr (1993) argues that expectations of a strong economy will result in people favoring more
liberal policies, while the anticipation of declining economic conditions will move the
national policy mood in a more conservative direction. MacKuen, Erikson, and Stimson
(1989) find that people will take into account their expectations for the future when voting,
and De Boef and Kellstedt (2004) largely agree. Essentially, scholars believe that economic
anxiety causes people to vote more Republican.
Southern Politics
There is a long literature on the idea that the South is a unique political region, and
since the Civil War, there is an abundance of evidence that it is politically different due to its
history and culture. V. O. Key (1949) argues that the history of slavery and the Civil War

9
has led to heavily racial polarization in the South with Southern whites heavily favoring the
Democratic Party. It is the only region of the country with a large minority of black people,
and as such, the white people in the region tend to vote together in order to maintain white
control of politics and keep the federal government from interfering with racial politics in the
South. Acharya, Blackwell, and Sen (2018) also believe that the unique history of the South
has led to the region to be exceptional politically. Attitudes on politics and race have been
passed down and reinforced over generations by families, schools, churches and other social
structures. Ultimately, the history of the South has led to a unique political culture.
In looking at the Republican transformation of the region after the 1968 election,
Black and Black (2003) make similar conclusions. The Civil Rights Act was passed in the
1960s over the objections of Southern Democrats, and this led to Republican growth in the
region. Southerners were resentful of this national legislation. They agree with Key that the
South is largely Republican today due to racial politics. In areas with a lot of minorities, race
and racial issues have a larger affect on politics to this day than they do in more homogenous
areas. Therefore, racial issues continue to be prominent in Southern politics. However,
Black and Black disagree with the historical argument and instead believe that the
suburbanization of the South and the movement away from heavy agriculture in the 1980s
and 1990s were key factors in recent Republican dominance in the region.
While most scholars still believe that the South is politically exceptional, McKee
(2012) thinks that Republican exceptionalism may fade in the future due to demographic
change in the region, specifically Hispanic immigration. While it is not exactly clear why
and there is some scholarly debate, the South as a region matters politically. Therefore,
perhaps other regions like Appalachia matter too.
10
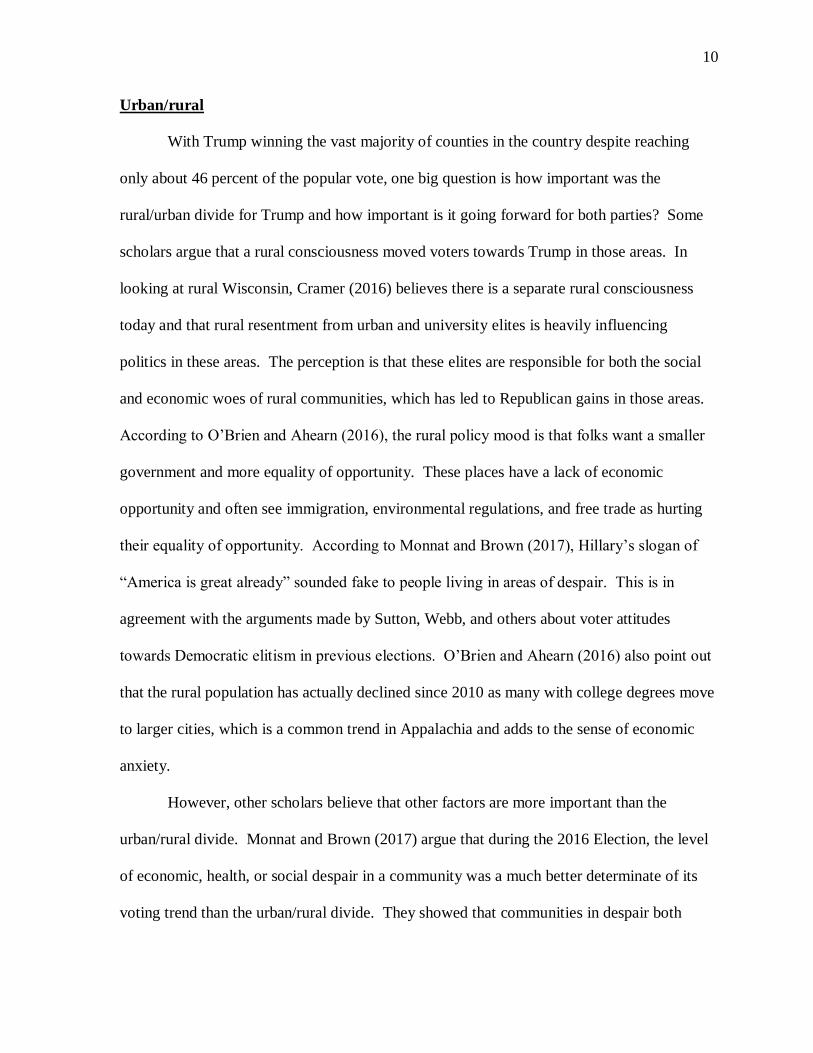
Urban/rural
With Trump winning the vast majority of counties in the country despite reaching
only about 46 percent of the popular vote, one big question is how important was the
rural/urban divide for Trump and how important is it going forward for both parties? Some
scholars argue that a rural consciousness moved voters towards Trump in those areas. In
looking at rural Wisconsin, Cramer (2016) believes there is a separate rural consciousness
today and that rural resentment from urban and university elites is heavily influencing
politics in these areas. The perception is that these elites are responsible for both the social
and economic woes of rural communities, which has led to Republican gains in those areas.
According to O’Brien and Ahearn (2016), the rural policy mood is that folks want a smaller
government and more equality of opportunity. These places have a lack of economic
opportunity and often see immigration, environmental regulations, and free trade as hurting
their equality of opportunity. According to Monnat and Brown (2017), Hillary’s slogan of
“America is great already” sounded fake to people living in areas of despair. This is in
agreement with the arguments made by Sutton, Webb, and others about voter attitudes
towards Democratic elitism in previous elections. O’Brien and Ahearn (2016) also point out
that the rural population has actually declined since 2010 as many with college degrees move
to larger cities, which is a common trend in Appalachia and adds to the sense of economic
anxiety.
However, other scholars believe that other factors are more important than the
urban/rural divide. Monnat and Brown (2017) argue that during the 2016 Election, the level
of economic, health, or social despair in a community was a much better determinate of its
voting trend than the urban/rural divide. They showed that communities in despair both

11
urban and rural both voted much more Republican in 2016 compared to 2012. Monnat and
Brown continue by stating that many in the white working class have a shattered sense of
community and that Trump understood their fears. They also argue that immigration as an
economic issue played a major factor in these communities as local residents feared job loss
from newcomers, and they theorize that the message from the Democratic Party to blue collar
workers has mostly been that their work is not important as white collar jobs and that they do
not matter anymore. Essentially, the divide is more blue collar vs. white collar instead of
urban/rural, with which Sheppard (2013) agrees. Regardless of which is more important,
both the urban/rural and blue collar/white collar divides seem pretty important in politics
today both nationally and in Appalachia.
Appalachian Politics
Looking back in history, this is not the first time that Appalachia is uniquely
Republican. V. O. Key (1949) and Gordon McKinney (1998) argue that Appalachia had an
exceptional voting pattern after the Civil War in its preference for the Republican Party due
to strong Unionism in the region compared to the lowland South, which voted solidly
Democratic for nearly 100 years after the war. In fact, several Appalachian counties have
never in their history voted for a Democratic President. Also, the region was far more pro-
Union during the Civil War than the lowland South, and became one of the poorest parts of
America by the mid 1900s (Key 1949). However, research focused on contemporary politics
in Appalachia is heavily lacking. Very few authors have examined the politics of the region
today while several others mention it only in passing.
While the voting shift in Appalachia towards the Republican Party is very apparent,
the cause of this shift is less clear and has been the subject of some debate with the existence

12
of two clear trends. Most scholars agree that in the Bush years of the 2000s, the shift is
largely due to social or cultural issues with foreign policy opinions being important too
(Sutton 2001 2005; Webb 2005). During the Obama and Trump years, there exists much less
consensus and much less is written specially about Appalachia. The literature suggests that
Republicans could be gaining votes from 2008-2016 because of economic anxiety, a rural
consciousness, ethnic identity, social issues, or perhaps racial attitudes.
Scholars disagree about whether there is a distinctly Appalachian culture driving
voting behavior, but most scholars of the region think that the local culture is driving force in
its politics. Sutton (2001; 2005; 2009) examines every national election between 2000 and
2008 and finds that the region voted increasingly Republican throughout the decade because
it is more socially conservative on a host of issues. Specifically, Sutton argues that gun
control and abortion drove many Appalachians to the Republican Party, and noted that unlike
Gore, the National Rifle Association was very visible and mobilized in favor of Bush. Also,
Sutton argues that the gay marriage bans on the ballot in many Appalachian states mostly in
2004 significantly helped the Republican Party in the region. Furthermore, although Sutton
argues that economic issues did not dominate the electoral shift of the 2000s, he believes that
they did play a part in Al Gore’s defeat in 2000 and Obama’s poor showing in the region in
2008 due to Gore’s support for environmental regulations, the anger of northern Appalachian
steel workers that the Clinton Administration did not do more to stop cheap steel imports,
and Obama’s open hostility towards coal. Lastly, Sutton argues that the region is very anti-
elitist and that drove Appalachians away from President Obama. He argues that Obama
really hurt himself in the region when he said that Western Pennsylvanians “get bitter, they
cling to their guns or religion or antipathy towards people not like them” (Sutton, 2009).
13
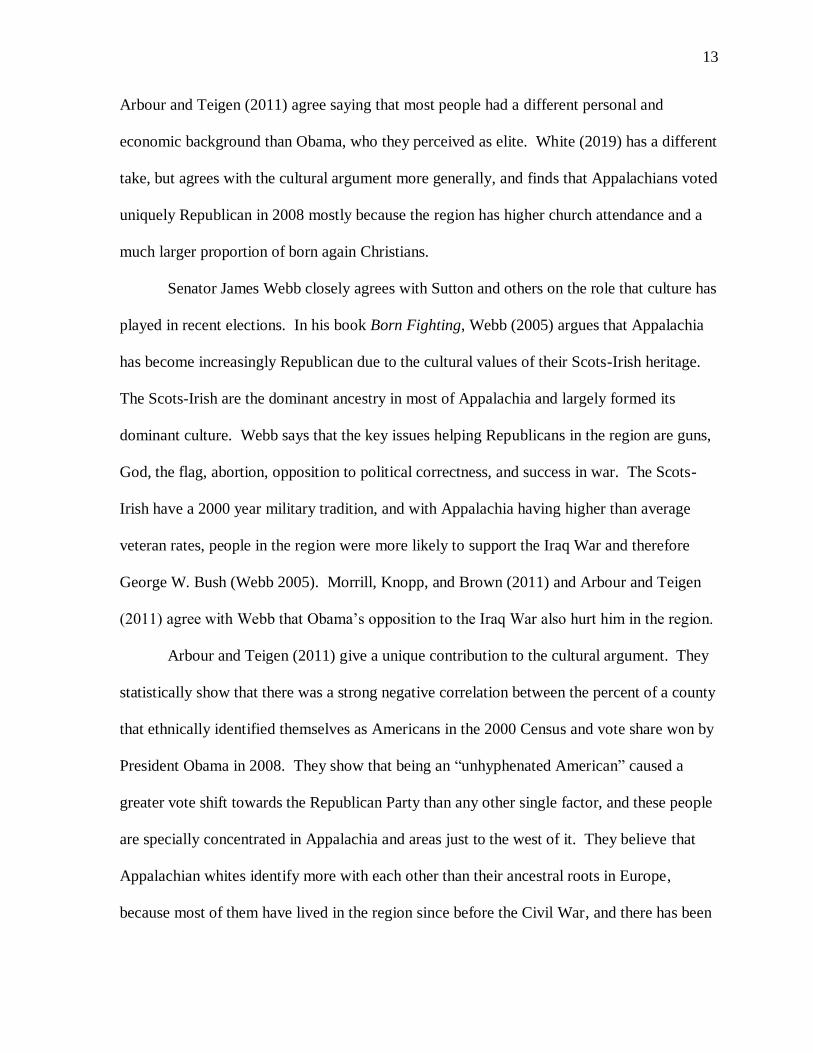
Arbour and Teigen (2011) agree saying that most people had a different personal and
economic background than Obama, who they perceived as elite. White (2019) has a different
take, but agrees with the cultural argument more generally, and finds that Appalachians voted
uniquely Republican in 2008 mostly because the region has higher church attendance and a
much larger proportion of born again Christians.
Senator James Webb closely agrees with Sutton and others on the role that culture has
played in recent elections. In his book Born Fighting, Webb (2005) argues that Appalachia
has become increasingly Republican due to the cultural values of their Scots-Irish heritage.
The Scots-Irish are the dominant ancestry in most of Appalachia and largely formed its
dominant culture. Webb says that the key issues helping Republicans in the region are guns,
God, the flag, abortion, opposition to political correctness, and success in war. The Scots-
Irish have a 2000 year military tradition, and with Appalachia having higher than average
veteran rates, people in the region were more likely to support the Iraq War and therefore
George W. Bush (Webb 2005). Morrill, Knopp, and Brown (2011) and Arbour and Teigen
(2011) agree with Webb that Obama’s opposition to the Iraq War also hurt him in the region.
Arbour and Teigen (2011) give a unique contribution to the cultural argument. They
statistically show that there was a strong negative correlation between the percent of a county
that ethnically identified themselves as Americans in the 2000 Census and vote share won by
President Obama in 2008. They show that being an “unhyphenated American” caused a
greater vote shift towards the Republican Party than any other single factor, and these people
are specially concentrated in Appalachia and areas just to the west of it. They believe that
Appalachian whites identify more with each other than their ancestral roots in Europe,
because most of them have lived in the region since before the Civil War, and there has been

14
little in-migration or immigration into the region since then. Unlike other areas, their
community identity was formed long ago. This agrees with Robinson and Noriega (2010)
who found that rural areas with large scale in-migration are becoming much more
Democratic in contrast to those with little in-migration. Bishop (2008) diverges slightly
arguing that when people move, they often cluster with other people who they agree with
politically. In the late 1990s, he found that 79 percent of Republicans who migrated moved
to Republican counties, and few Democrats were willing to move to an area that was
dominated by Republicans.
However, some scholars disagree with Sutton and Webb that uniquely Appalachian
cultural values have caused the growing Republican dominance in the region. Instead,
Bickel and Brown (2008) argue that voting patterns in Appalachia are simply the aggregate
affects of national trends looking at the 2004 election. They argue that Appalachia was not
exceptional and that its voting behavior can be explained by factors such as income,
education, ethnicity, family, marriage status, age, and the urban/rural divide. However, this
is the only recent study to argue against Appalachian exceptionalism in its politics, though it
only looked at 2004. Also, the control variables in their model are a bit questionable based
on existing political theory. Their model does not include controls for party, ideology, age
over 24, religion, or gender, different definitions of Appalachia, and only looks at aggregate
level results. Bickel and Brown’s research fits in more broadly with the recent trend in the
study of Appalachia where scholars try to “debunk” the works of the region’s earliest
authors.
Overall there are five main models of Appalachia. While many older authors
(Campbell 1921; Frost 1899; Kephart 1913; Wilson 1914) and some contemporary scholars

15
(Oshnock, 2013) argue that isolation of the region led to an exceptional regional culture,
most contemporary authors try to redefine Appalachian exceptionalism or claim that it never
existed in the first place. Many new scholars embrace other models such as the colonialism
(Lewis and Johnson 1978) and world systems analysis (Dunaway 1996) models. These
models refute both the isolation and the culture of poverty models (Weller 1965), and they
argue that Appalachia is uniquely poor because of the global capitalist system that exploits
the region as a colony. However, these models tend to focus on poverty more than politics in
general. Eller (2008), a scholar of these models, believes that politics in the region is not
driven by a distinct ethnic heritage but is instead driven by a unique confluence of race, class,
and gender. Lastly is the post-modern model of Appalachia under which the region is only
imagined and therefore does not really exist and is only exceptional in our imaginations or
due to outside conceptions of the region (Shapiro 1986).
Other scholars have looked specifically at the role that race played in Appalachian
elections especially when Obama was on the ballot. Many scholars agree that race was not a
major factor or that it did not hurt President Obama, but there is some disagreement. Morrill,
Knopp, and Brown (2011) believe that race was a factor in Appalachia and that many people
bought into the idea that Obama was a Muslim born in another country. Monnat and Brown
(2017) argue that race played a role in the election of 2016 as well in two different ways.
First off, Trump’s racially charged language moved voters. Secondly, when minorities look
back in time, they see the struggle for civil rights and a time where they were not as well off
as today, but many blue collar whites can look back to the glory days of the 1950s-1970s
where they could easily make a good living by getting a job at a factory right out of high
school. Monnat and Brown (2017) also noted similar conservative voting trends in the

16
industrial areas of Europe. However, many other scholars disagree. White (2019) found that
racial attitudes played a role in vote choice in 2008 in Appalachia but only slightly affected
votes for Obama. While attitudes on race mattered, religion mattered far more.
Sutton (2009) does not believe that race was a major factor in Appalachia against
Obama pointing out how well recent black Democratic candidates did in Senate and
gubernatorial races across the region. Sutton also contrasted the 2008 campaigns of Barack
Obama and that of Senator Mark Warner in Southwest Virginia in which Warner won the
region by a larger than two to one margin and Obama lost the region baldy. Sutton argues
that Warner won the region by taking the opposite approach as Obama on cultural issues and
by adopting policy stances more in line with the region. Beachler (2011) agrees saying that
race did not hinder Obama as he did two percentage points better with white voters than John
Kerry nationally and was the only Northern Democrat to win a Southern state since the 1960s
realignment. Arbour and Teigen (2011) found ethnicity to be a strong factor in the election,
but not race in general. Taylor (2011) took a slightly different take on race but largely agreed
with the scholars above. He argued that race has long been a factor in elections but that
having a black candidate did not change that in a significant way and that voting shifts in
recent elections were more based on political polarization or local issues. This is very fitting
with V. O. Key’s (1949) model, which states that white people vote in a more racially
polarized fashion when they live in close proximity to a large number of black people. While
those conditions are true in the Deep South, it is certainly not the case in Appalachia as it is
one of the least racially diverse places in America today. White (2019) agrees saying that
racial attitudes are much stronger in the South than in Appalachia and that much of Key’s
theories still hold today. Lastly, McQuarrie (2017) found that in the Rust Belt, both whites
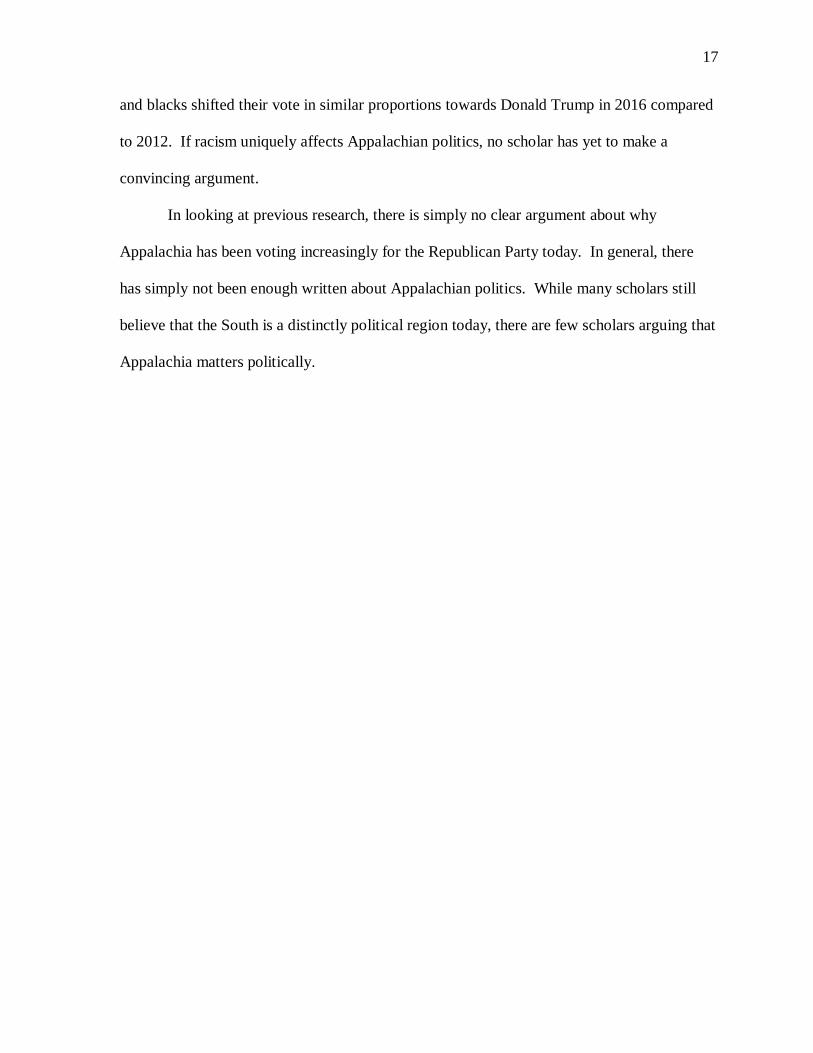
17
and blacks shifted their vote in similar proportions towards Donald Trump in 2016 compared
to 2012. If racism uniquely affects Appalachian politics, no scholar has yet to make a
convincing argument.
In looking at previous research, there is simply no clear argument about why
Appalachia has been voting increasingly for the Republican Party today. In general, there
has simply not been enough written about Appalachian politics. While many scholars still
believe that the South is a distinctly political region today, there are few scholars arguing that
Appalachia matters politically.

18
Theory
Recent Republican dominance in Appalachia has two main causes: culture and
issues. In the 21st Century, both the rational choice and Michigan models of vote choice help
explain why Appalachians increasingly support the Republican Party in their voting
behavior. While this trend is driven more by culture, the region is increasingly receptive to
the Republican Party on the issues. The dominant culture of the region is simply far more
conducive to the Republican Party today than to the Democratic Party. Along with that,
America today is very polarized, and political identity is increasingly linked to cultural
identity (Mason 2018). In Appalachia, this identity is leading more and more people to
become disillusioned with the Democratic Party and identify with and vote for the
Republican Party. Ultimately, the geographic isolation of the region has fostered this unique
Appalachian culture that has been passed down for generations along with a unique set of
demographics making it the most Republican region in the country today. Appalachian
isolation is driving both their culture and policy preferences to be more Republican friendly.
While scholars debate the importance of instrumental versus expressive partisanship
nationally (Abramowitz and Saunders 2011; Huddy, Mason, and Aaroe 2015), no such
debate is needed in Appalachia as both factors are moving Appalachians in the same
direction. The Republican shift in the region is also consistent from a rational choice
perspective (Downs 1957). Not only does the modern Democratic Party not look like or talk
like Appalachians, it is also increasingly taking positions at odds with Appalachian residents,
which are far more inclined to favor the Republican position on the issues than the average
American (CCES 2016). As the Democratic Party platform has moved farther to the left
throughout the 21st century on social issues, the average Appalachian is increasingly closer to
19
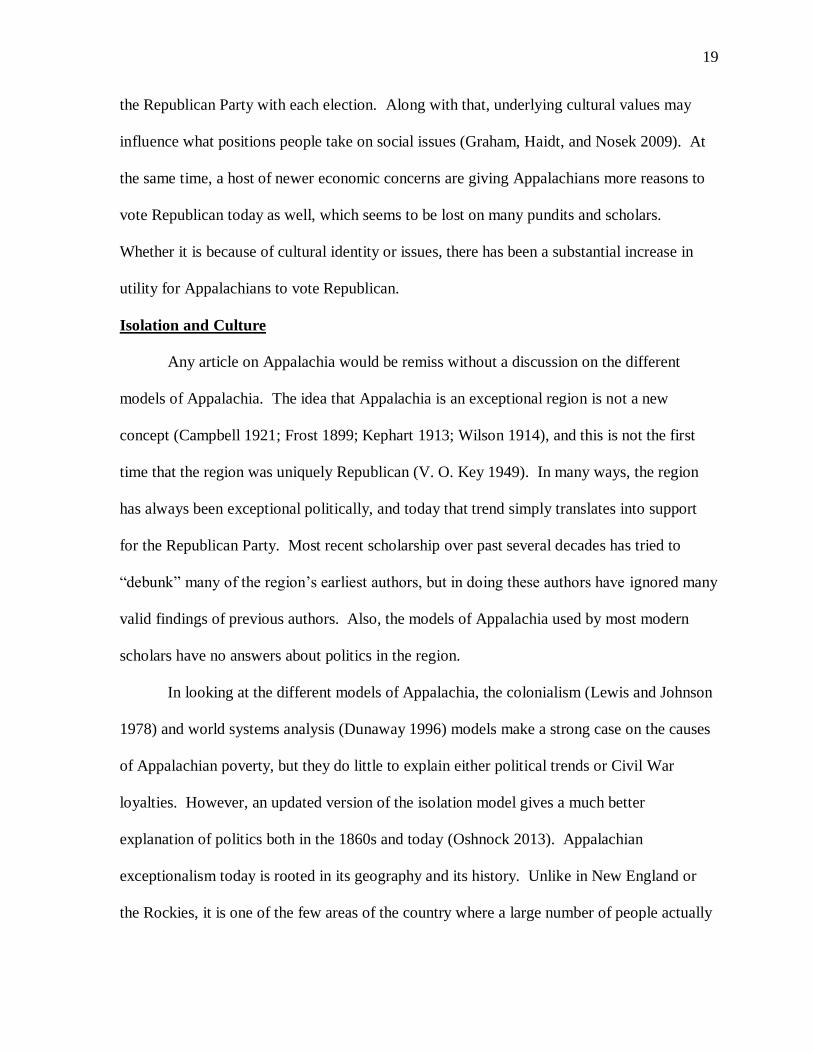
the Republican Party with each election. Along with that, underlying cultural values may
influence what positions people take on social issues (Graham, Haidt, and Nosek 2009). At
the same time, a host of newer economic concerns are giving Appalachians more reasons to
vote Republican today as well, which seems to be lost on many pundits and scholars.
Whether it is because of cultural identity or issues, there has been a substantial increase in
utility for Appalachians to vote Republican.
Isolation and Culture
Any article on Appalachia would be remiss without a discussion on the different
models of Appalachia. The idea that Appalachia is an exceptional region is not a new
concept (Campbell 1921; Frost 1899; Kephart 1913; Wilson 1914), and this is not the first
time that the region was uniquely Republican (V. O. Key 1949). In many ways, the region
has always been exceptional politically, and today that trend simply translates into support
for the Republican Party. Most recent scholarship over past several decades has tried to
“debunk” many of the region’s earliest authors, but in doing these authors have ignored many
valid findings of previous authors. Also, the models of Appalachia used by most modern
scholars have no answers about politics in the region.
In looking at the different models of Appalachia, the colonialism (Lewis and Johnson
1978) and world systems analysis (Dunaway 1996) models make a strong case on the causes
of Appalachian poverty, but they do little to explain either political trends or Civil War
loyalties. However, an updated version of the isolation model gives a much better
explanation of politics both in the 1860s and today (Oshnock 2013). Appalachian
exceptionalism today is rooted in its geography and its history. Unlike in New England or
the Rockies, it is one of the few areas of the country where a large number of people actually

20
live deep in the mountains in the isolated coves, ridges, and hollers, and this creates both real
and perceived isolation from the rest of the country. This has fostered a distinct local culture
rooted in traditional American values and a strong attachment to our founding fathers and
Christianity. Also, Civil War bonds die hard, and due to the limited migration into the
region, those loyalties still affect politics today. Ultimately, the isolation of the region has
caused a uniquely Republican voting pattern above and beyond what its personal and
demographic characteristics would predict, but also by shaping those very same
demographics. Because of the mountains, the region is older, whiter, less educated, poorer,
more rural, more religious, and has preserved much of the traditional culture of the early
Scots-Irish settlers. Essentially, the mountains have acted as a barrier to new people, new
ideas, and new economic activities over time. The demographics of the region have barely
changed over the last one hundred years, and the mountains have made the region uniquely
Republican today.
In looking broadly at culture, Republicans clearly have the advantage in Appalachia
today. The local cultural in the region has been around for a long time, and is has its roots in
its early settlers. Many of the first settlers were of Scots-Irish decent, and Appalachia has by
far more Scots-Irish ancestors than any other region of the country (Rubenstein 2011). The
Scot-Irish have a unique history dating back centuries. On a host of cultural values, the
Scots-Irish decedents are opposed to the national Democratic Party today (Webb 2005).
Despite the large number of Scots-Irish in the region, most people in the region do not have
that ancestry. However, the Scots-Irish have formed much of the dominant culture of the
region that persists until this day leading more people in the region to identify simply as
“American” in the census than anything else. Appalachians have not only assimilated but
21
have Americanized themselves (Arbour and Teigen 2011). Conversely, other rural areas of
the country have a very different ancestral identity. For example, more people in the Great
Plaines identify their ancestry as German than anything else, and most people in rural New
England identity their ancestry as English or French (Rubenstein 2011).
I make several main arguments about why Appalachia is a unique region of the
country today. Appalachians are fiercely independent, which makes them shy away from a
large federal government and a host of social programs even if they benefit from those
programs. They also have a deep and old sense of patriotism that goes all the way back to
the Civil War and the American Revolution and a strong belief in the exceptionalism of
America today. These values are antithetical to the modern Democratic Party’s view of
American history and America’s place in the world. The Democratic Party today has a
foreword looking view of patriotism with a hope of what America could be, whereas the
Republican Party’s conception of patriotism is one looking back at time rooted in American
history and exceptionalism over time and is nationalistic. Also because of their isolation,
Appalachians are deeply proud of their local communities and heavily value their local
culture which makes them especially suspicious of outside elites who look down upon them
and their way of life. Lastly, the mountains have maintained somewhat of a frontier spirit.
People up in the mountains simply have a different way of life.
Many Appalachian values are rooted in the history of the region. The demographics
of the region are exceptional today compared to the rest of America, but this is not a new
phenomenon. While scholars of the early 1900s caricatured and exaggerated the life of
Appalachians at times, many of their key findings still hold up today. They astutely point out
that the region had unique demographics even back then. While a key focus in politics today

22
is white vs. non-white, scholars of the early 1900s saw the region as being distinctly Anglo-
Saxon (Campbell 1921; Frost 1899; Kephart 1913; Wilson 1914). While large numbers of
Eastern and Southern European immigration moved to coastal cities during the late 1800s
and early 1900s, much of Appalachia remained relatively untouched by immigration, and as
a whole, the region had less immigration than other regions. However, a significant number
of immigrants from Europe and black migrants from the Deep South moved to central and
northern Appalachia to work in the coal fields and factories.
I argue that while these new residents certainly added to the local culture, they did not
come in large enough numbers to fundamental transform it. Instead, the people living there
today feel less connected to their home countries and regions and more Appalachian and
more American with every generation. This is aided by the fact that the region has seen very
little migration to the region since the 1950s according to the US Census. Fostered by the
isolation that the mountains provide, the earlier settlers passed down the dominant culture of
the region to those migrants that came in the late 1800s and early 1900s. As a result, even
the once ethnic neighborhoods in the more urban parts of the region are voting more and
more Republican today compared to the same ethnic neighborhoods in New York or New
Jersey (NYT 2016). In Appalachia, many of the early institutions created by the Scots-Irish
still exist, and the regional culture matters.
Why then is the Appalachian dummy variable consistently significant in both voting
models and models of policy preference despite controlling for other key variables like race,
education, income, and religion? I argue that it is part identity and part policy. I believe that
if the social identity measure of partisanship were applied to a random sample of Americans,
folks who live in Appalachian counties likely would have higher levels of Republican

23
identity regardless of where they place themselves on an instrumental scale. However, the
main difference for expressive partisanship lies with the Democrats in the region. They
simply have a weaker expressive identity with their political party than Democrats outside of
the region. However, I break Republicans up into two groups: new Republicans and
traditional Republicans. Traditional Appalachian Republicans feel pretty comfortable where
they are, but the new Republicans who are mostly former Democrats are still adjusting to
their new partisanship. They have a much weaker expressive partisanship than traditional
Republicans, but in contrast to other regions, their expressive support for the Republican
Party continues to grow every year. Appalachia is a region in political transition, and new
Republicans will continue to feel comfortable with the Republican Party if the national
Democratic Party continues to run candidates who are too liberal on the issues and do not
respect the region’s culture. Lastly, Appalachian independents feel more at home with the
Republican Party than do independents nationally (CCES 2016).
Appalachia has sorted into the Republican Party, making the Republican Party an
important avenue for Appalachian citizens to protect and advance their identity. While
specific policies are important, so are underlying values, and the effects of cultural identity
are strengthened when a group feels like it is under attack (Huddy, Mason, and Aaroe 2015).
Since 2008, Appalachians have increasingly perceived that their identity to be under attack
by Democratic elites and pundits in the mainstream media. Appalachians perceive that these
elites share a disdain for them especially when they say that the future of America belongs to
educated women and immigrants in suburban areas and secular coastal cities. The way they
talk gives the perception that the future of America is not in places like Appalachia or with
people who share their cultural values. As a result, Appalachians have economic anxiety as
24
well as cultural anxiety. It has become more important for people to vote with the dominant
culture of the region and especially for Democrats and independents who must choose
between the two (Huddy, Mason, and Aaroe 2015). Democrats and independents in
Appalachia are cross pressured both by their cultural identity and on the issues, leading an
increasing number of them to vote for or change their identification to the Republican Party.
One thing easy to study is the effect of issues in the region on vote choice, and clearly
issues affect Appalachian voting behavior. Expressive partisanship is also an important
reason why, net of control variables, voter behavior for Appalachian residents differs from
other regions, but there is a problem. It is not possible to measure partisan identity, thus
construed, nor Appalachian identity using existing data sets. That being said, the finding that
Appalachian voters differ is consistent with the above arguments and has both expressive and
instrumental elements to it. This leads to hypothesis one:
H1—Appalachians votes more Republican than other regions of the country for variety of
elected offices controlling for other variables.
Issues
While the culture of Appalachia is moving people towards the Republican Party,
culture and identity alone cannot explain this trend. Substantive issue disagreements with the
national Democratic Party are also a driving force. In Appalachia, many Democrats have
been cross pressured since the early 2000s on social issues, and since 2008, they have been
increasingly cross pressured on new economic issues as well. As the national Democratic
Party took markedly more liberal stances on social issues into the 2000s, socially
conservative Appalachians became more attracted to the Republican Party on guns, abortion,
and other moral issues like gay marriage. However, many FDR Democrats stayed with
Democratic Party well into the 2000s because of their support for traditional economic issues
25
like unions, Social Security, taxes, and others even if they disagreed with their party on social
issues. Also, many Democratic candidates and office holders of the early to mid 2000s were
much more socially conservative than they are today. After 2012, the blue dogs are mostly
gone. As I will show in the results section, Appalachians were increasingly cross pressured
towards the Republican Party in the Obama and Trump years on social issues as well as
certain economic issues since the Democratic Party continued to move farther left away from
the median voter in the region (Downs 1957).
Instead of taking new issue positions to fit their historic partisanship as the old
Michigan model suggests, many people in the region have changed their voting behavior or
partisanship to better fit with their issue positions and cultural identity (Popkin 1994). While
the old Michigan model does provide some insights into the behavior of traditional
Republicans in the region, it simply does not give a good explanation for partisan change and
cannot explain why there are so many new Republican voters and identifiers. As the parties
have changed their policy positions, Appalachians have generally changed their partisanship
rather than abandon deeply held core beliefs emanating from their culture. Lastly because
guns and especially immigration and trade were more salient in 2016 due to Trump’s
rhetoric, people cross pressured by those issues were more likely to vote based on them in the
last election (Hillygus and Shields 2008; Rabinowitz and Macdonald 1989).
Appalachians generally oppose gun control for a variety of reasons. As Democratic
candidates have moved significantly to the left on this issue over the last two decades,
Appalachians have increasingly felt at odds with the Democratic Party. While Al Gore’s gun
proposals certainly hurt him, John Kerry at least made an attempt to win over gun rights
supporters and hunters. At the same time, many blue dog Democrats in the region were very

26
pro-gun at lower offices. While many people were concerned about Obama on gun control,
he kept many cross pressured partisans by offering vague support for the Second
Amendment. He did not call for any specific new gun laws in 2008 and only called for a
semi-automatic weapons ban in 2012. In contrast, Hillary took a much more hostile tone
towards the Second Amendment and often talked about the long list of gun control proposals
she supported, which did not play well in Appalachia. Thus, I offer hypothesis 2:
H2—Appalachians are more pro-gun than the average American.
Immigration is an issue that is especially salient today and is uniquely opposed by
Appalachians. As Appalachia has had the least immigration and migration in the country
since the 1820s, this is no surprise. Many of the immigrants and migrants came to certain
parts of the region in the late 1800s and early 1900s. They joined the Democratic Party and
generally passed that partisanship down to the next generations. However, younger
generations and even older residents now view themselves as entirely American and have
been thoroughly influenced by the dominant culture in Appalachia, so they are increasingly
voting Republican. Unlike many of the new cosmopolitan cities and suburbs, the cultural
identity of the region was formed long ago, so people do not see an advantage of letting a
large number of people with a different cultural and values into the country. Even
Appalachian urban areas have very few immigrants today. For example according to the US
Census (2018), the foreign born population of Allegheny County (Pittsburgh) and Knox
County (Knoxville) is only five percent, and those are the two largest cities in Appalachia.
Conversely outside of Appalachia, the foreign born population of Mecklenburg County
(Charlotte) is 15 percent, and in Los Angeles County it is as high as 34 percent.
27
Immigration also has an economic component. I argue that a large influx of low
skilled workers from other counties takes jobs away from Americans and drives down their
wages. Since few immigrants live in Appalachia, the bigger effect in the region is wage
suppression and the fact that companies are more likely to locate operations where cheap
labor is readily available. Appalachia has an abundant labor supply, but it is cheaper for
companies to import foreign workers in other regions. Not only is there a cultural push
against immigration, but there is also a rational argument from an economic standpoint.
Also, the parties have clearer and more polarized stances on immigration today. In the mid
2000s, both parties had a mix of pro and anti-immigration factions, but that is not the case
today. Accordingly, hypothesis 3 states:
H3—Appalachians support more restrictions on immigration compared to non-Appalachians.
The cultural of Appalachia leads people to have strong feelings against abortion.
While the importance of religion in the region certainly plays a driving role in this, so does
the instilled family values of the region. The Scots-Irish are uniquely opposed to abortion
(Webb 2005), so perhaps that value has been ingrained in the dominant culture of the region.
However while people in the region frequently bring up the importance of the issue, I am not
entirely confident about why Appalachians are so against abortion.
H4—Appalachians are more pro-life than non-Appalachians.
In the Obama and Trump era, economic issues have also been driving Appalachian to
the Republican Party. In many ways, the Democratic Party of JFK and FDR is dead. Instead
of focusing on issues important to the average American worker, the modern Democratic
Party is increasingly catering to a gentrified, white collar base living in coastal cities. This is
part substance and part branding. As such, I argue that Appalachia is increasingly disaffected

28
with the Democratic Party on economic issues. However, the Republican Party does not yet
have a total advantage on economic issues. Instead, the Democrats have simply lost the clear
advantage that they had for much of the 20th Century, and there is increasing utility for
Appalachians to support the Republican Party on economic issues. This is especially true
under the Republican Party of Donald Trump. Trump’s populist wing of the party is far
more appealing to Appalachians on economic issues than the establishment or the strict
conservative wings that have dominated the Republican Party since the 1960s. The
Republican Party today is winning over Appalachians not only on expressive identity and
social issues but also on economic policy preferences.
Few regions have had more energy resources than Appalachia, and with a long
tradition of coal jobs, it is no surprise that Appalachians are uniquely concerned that
environmental regulations and climate change restrictions are a direct threat to their local
economy. On one hand, there is a cultural component to coal as well. Coal is deeply
imbedded into the culture of the region which causes people with no connection to the
industry to still support it more than people in other regions. Friends of Coal stickers are
common, and the culture of coal is also more masculine, which further helps the Republican
Party (Bell 2016). However, economics is the main driving force against environmental
restrictions in the region due to the poor state of the local economy.
Traditionally, blue collar workers supported the Democratic Party and the owners and
white collar workers supported the Republican Party, but today there is much more of a
divide between materialists and post-materialists. The workers and owners are both
materialists and have joined together under the Republican Party. Workers want to keep
their jobs or get them back, and owners want to make money. However post-materialists

29
want environmental restrictions to reduce pollution and fight global climate change, so they
have increasingly embraced the Democratic Party. Post materialists are generally wealthy,
white collar workers who are more supportive of paying higher taxes or increased electricity
bills to help the environment, so for them, it is more of a social issue. However as an
economically distressed region, there are few post materialists in Appalachia.
Also, many Appalachians are still employed by fossil fuel or industrial jobs, and
beyond that there is a perception that coal, oil, steel, and manufacturing are good for
Appalachia despite the declining number of these jobs. This perception is partially because
the jobs that remain typically pay quite well, and when those jobs leave, good paying jobs
generally do not replace them. Instead, most of these people are forced to work low end
service sector jobs or live off of government assistance, and communities fall into despair.
However, these feelings are also increased by the dominant culture of coal that surrounds
much of the region. As a result, Appalachians support these types of jobs and oppose
environmental restrictions that they see as a threat to them. While coal itself is mostly in
decline, the culture of coal is not, and the fracking and oil boom in northern Appalachian
only adds to already existing feelings. People in the region broadly support the energy
industry, and the environmental positions of the Democratic Party under President Obama
and Hillary Clinton are a big reason why people in the region are leaving it. Accordingly,
hypothesis 5 states that:
H5—Appalachians are more likely to oppose to environmental regulations compared to non-
Appalachians.
Appalachians also have good reasons to be skeptical of free trade and globalization
more broadly. While free trade may provide broad benefits to the national economy, there
are winners and losers, and Appalachia has clearly not been winning under these agreements

30
(Rogowski 2017). Free trade brings in cheaper products, which white collar workers benefit
from, but it comes at the expense of sending industrial jobs overseas. When someone goes
from having a good paying factory or mining job to a low paying service sector job, having
cheaper products at Walmart does not make up their loss in wages. Instead, their quality of
life dramatically declines. As free trade deals like NAFTA have hurt the regional economy,
many residents are supportive of President Trump’s rhetoric on protectionist trade policies.
This is especially important in support for Trump as many other Republican elites still
support free trade. In the northern and central parts of Appalachia, some of which overlaps
with the Rust Belt, I argue that people are especially against free trade after seeing significant
job losses. While many people outside of industrial areas have simply begun to adopt their
party’s stances on trade, many blue collar workers in the Rust Belt have long held
convictions against free trade and are simply in increasing alignment with the Republican
Party of Trump. Also since many of these people are new Republicans, they simply held on
to their anti-free trade beliefs from when they were Democrats. In contrast, white collar jobs
are typically not sent overseas, and many of those jobs are increasingly reliant on a large
volume of trade, which is why many politicians today support open trade policies even if the
trade rules are more restrictive on American exports. Also, if the colonialism or world
systems models of Appalachia are correct and the region is being exploited by global
capitalism, then free trade and increased global capitalism will only add to the exploitation of
the region and should be rejected by Appalachians at the polls (Dunaway 1996; Lewis and
Johnson 1978). Thus, I offer hypothesis 6:
H6—Appalachians are more likely to oppose free trade compared to non-Appalachians.
31
In looking at the economy more broadly, Appalachia has long been a poorer region
for a long time. While the colonialism and world systems analysis models (Dunaway 1996;
Lewis and Johnson 1978) make some good points, they mostly ignore the effects of
geography on the regional economy. The isolation and mountainous terrain of the region
puts Appalachia at a comparative disadvantage today compared to flatter areas of the US.
Transportation of all sorts is more difficult and more expensive to build because of the
mountains. Not only does the region have only two navigable rivers leaving it, but much of
the region is too rugged to build a railroad in a cost effective manner due to the grading and
blasting required. Both of these factors put the region at a substantial disadvantage for
transporting bulk goods. On top of that, the roads and highways connecting towns in the
region to the outside world are much rougher and less apt to handle truck traffic. Even in the
region’s larger cities, the highways are far worse than they are in coastal cities. Also
compared to flat areas, building new high quality highways is significantly more expensive,
and many of the state highways today are barely suitable for eighteen wheelers, which is a
problem that does not exist in flat, rural areas. The region also lags far behind in broadband,
airports, and other infrastructure. As such, the broader infrastructure of the region is worse
than in flat and coastal areas, which makes companies less likely to bring jobs into the
region. The rugged terrain simply makes it harder for the local economy to prosper.
Ultimately, it is not really surprising that Appalachians have more economic anxiety
which generally leads people to vote more Republican (Durr 1993). Throughout much the
region, poverty is rather visible with older buildings all over the landscape and many areas
having had little new development in decades. Even in northern Appalachia, parts of which
were once wealthy due to the steel industry, rusting out factories can be seen everywhere, the
32
airports are empty with limited flights, and people get the sense the glory days for the region
have passed.
The 2016 Election provided a great contrast on this issue. Hillary argued that people
should vote for her to keep the good economy that President Obama created going, but the
economy is a much different story in Appalachia making those statements feel fake to local
residents. While the Democrats can take some credit for ending the Great Recession
nationally, the Appalachian recession has been going on for decades with no end in sight. I
argue that Appalachians appreciated the fact that Trump acknowledged their economic
concerns, and “Make America Great Again” was a much more appealing message than
“America is already Great” given the persistence of poverty in the region. Economic
optimism is simply stronger in the Sunbelt. Lastly, economic anxiety compounds views on
immigration. Most countries in the region have net out-migration (Rubenstein 2011), and
many residents say that they want their own kids to get jobs and stay in the region rather than
see companies hire foreigners. Therefore, I offer hypothesis 7:
H7—Appalachians have exceptionally high levels of economic anxiety compared to non-
Appalachians.
Different types of Elections and Timing
Appalachia is a region in transition, but the exact nature of that transition is not
entirely clear. I offer a few main arguments. In Appalachia, a large number of individuals
are slowly changing their voting behavior and partisanship to become more Republican.
However, this transition often does not happen overnight. There is a phase where people
often vote a split ticket, identify as independents, or are less likely to vote overall. There is a
period where usually Democratic voters often fluctuate back and forth over several election
cycles before become regular Republican voters or identifying as Republicans, and the same

33
is true in the reverse. This phase can be very short or very long depending on the individual.
At the same time, young Appalachians do not have a historic partisanship to rely on so they
are especially influenced by their culture. All of these are happening at the same time.
As the Presidential vote is the leading indicator of voting trends in the reason, the
Republican voting trend in Appalachia showed up here first and has been the most durable,
and it has existed at least since 2008. Aggregate election results suggest that the region
began shifting in the early 2000s, but there is no suitable data set before 2008 to test this at
the individual level. I argue that before switching parties or regularly voting for the other
party, disillusioned Democrats in the region began voting for Republican Presidents while
still supporting Democratic candidates for lower national, state, and local offices. While the
overall Republican voting trend in Appalachia appeared around or shortly after the start of
the 21st century, it dramatically accelerated during the Obama Presidency and continues to
grow with every election although it is not entirely clear why.
Around 2010-2012, this trend started to strongly trickle down to races at lower levels
of government. I argue that many more conservative or blue dog Democrats became
increasingly disillusioned with the national Democratic Party due to the actions of President
Obama once in office. As their attachment to the Democratic Party faded, people became
increasingly open to voting for Republican candidates and eventually to joining Republican
Party. The effect is the strongest in the House of Representatives because the House is the
most structurally tied to the Presidency since they are less well known then Senators yet are
still part of the federal government. Also, the number of individual candidates and races
helps to mitigate the distinctiveness of any one race in a regression model.

34
However, the Republican voting trend is the weakest among Senators and governors
simply because candidates for those offices are often drastically different than their national
parties. Senators and governors are much better known than members of the House allowing
them to more easily stand out as different from their respective national parties. As of 2019,
Democrats hold a Senate seat in West Virginia and the governorship in Louisiana, while
Republicans hold a Senate seat in Maine and the governorship in Massachusetts, Vermont,
and Maryland. It is the easiest for governors to run on a platform different from the national
party and comparatively easier for Senators to do it than members of the House. However, is
much harder for candidates to run against the dominant ideology of a state or district. Also,
while there are about 25 House races in Appalachia every two years, there are typically only
five to ten Senate races meaning a few candidates can significantly alter any partisan trend in
voting. Finally, lower level state races and county races will be the last to change as former
partisan leanings will persist for much longer and old school Democrats can prosper for
much longer when national issues are taken off of the table.
On President Trump, Appalachians are supportive of him due to both the issue
positions he takes and the way he makes them feel. I argue that while many do not expect
miracles, they appreciate the respect and demeanor Trump takes when talking about the
common man in stark contrast to the elitism used by recent Democratic Presidential
candidates. Also, they saw someone who would fight for them. Culturally, most people in
the region could better relate to Donald Trump than Hillary Clinton. However, this was not
the case for Mitt Romney or John McCain. Instead, the Republican voting trend during those
elections was mostly due to Democratic disillusionment and agreement on the issues with
those candidates. Trump is the only recent Republican candidate for President to inspire

35
Appalachians on a broad scale to vote for him. For example, turnout in 2016 was roughly the
same as it was nationally in 2012, but it was up by over seven percent in West Virginia with
similar results throughout Appalachia (NYT 2012 2016).
Control and Other Variables
Party and ideology are the two most important variables in politics. As such, they
have a major influence on vote choice, issue preferences, and most things related to politics.
Therefore, I offer hypothesis 8 and 9:
H8—Republicans are more likely to support Republican candidates and issues.
H9—Conservatives are more likely to support Republican candidates and issues.
I argue that people living in rural areas are fundamentally different than people living
in big cities. They have a different way of life, different values, and different economies than
urban America. As such, they are also voting increasingly Republican today and share many
similarities with Appalachia. Generally speaking, rural identity today is increasingly at odds
with the white collar, cosmopolitan nature of the modern Democratic Party which does not
seem to value rural America and its distinctly different culture. Along with that, rural culture
is more socially conservative and also has higher levels of economic anxiety today largely
due to the effects of globalization. As such, both Appalachian and rural areas more generally
have been negatively impacted by current free trade agreements. Therefore, I offer
hypothesis 10:
H10—Rural people are more likely to support Republican candidates and issues.
I argue that white people tend to vote more Republican than non-whites for a few
reasons. Generally speaking, small ethnic minorities will mostly unite under one political
party to maximize their political power as a group. For African Americans, the history and
legacy of slavery, segregation, and racism exacerbates this trend and strengthens racial

36
identity. As a result, the vast majority of black people vote for Democrats today under the
current party system. Other minority groups are more variant, but most tend to favor the
Democratic Party. New immigrants tend to be more Democratic regardless of race, and most
Asians and Hispanics came to the US in the last 40 years (Rubenstein 2011). Also, most of
these people came from counties with larger welfare states making many Democratic policies
seem more appealing. Lastly, while American Indians usually do not vote in federal or state
elections, they often support Democratic candidates since they generally support more
services and funding on the reservations. Overall, the picture is very complicated. While
race is an important factor in politics, the underlying ethnicity and culture matter
significantly more. Unfortunately, it is difficult to control for ethnicity using existing data
bases. Therefore, I offer hypothesis 11:
H11—Whites are more likely to support Republican candidates and issues than non-whites.
Overall, I argue that older Americans today tend to be slightly more Republican and
slightly more conservative on the issues. However, the effect is often weak because people
also became much more attached to their political party as they get older and are less likely
to switch or cross over when voting. However, Baby Boomers and the Silent Generation and
more conservative than younger Americans on a host of issues and lifestyles. Therefore, I
offer hypothesis 12:
H12—Older Americans today are slightly more likely to support Republican candidates and
are more likely to favor the Republican position on most issues.
Men and women are different. Whether those views are social constructions of
gender or natural differences created by God, men and women have different core desires
and a different worldview which naturally leads to different attitudes on politics. I argue that
Women are generally more liberal than men on most issues and especially on social issues
37
like abortion, gay marriage, and gun control (CCES 2016). Along with that, the Democratic
Party’s focus on inclusiveness for women has been especially attractive for young, educated
women. Conversely, men tend to not only be more conservative on the issues but also more
drawn to the Republican Party on style. The Republican Party expressively relates better to
men, which is especially true in the Trump era. The Republican Party is also more accepting
of traditional masculinity more generally. Thus, I offer hypothesis 13:
H13—Men are more likely to support Republican candidates and issue positions than women.
I argue that people with higher incomes tend to be more Republican, because the
Republican Party has traditionally supported smaller government and lower taxes benefiting
the personal finances of this group. Also, wealthy people enjoy a certain amount of class
privilege, so for many it is important to protect the status quo. However, income matters a
lot less today because both high and low income earners are voting more based on social
issues or their identities irrespective of their economic interests (Huddy, Mason, and Aaroe
2015). Also, it is less clear today whose economic interests each party favors especially with
the growing materialist and post-materialist divide between blue and white collar workers.
H14— People with a higher income are slightly more likely to support Republican candidates
and issues.
I argue that religious people are far more likely to vote Republican because of their
worldview. Christians believe in God, the Bible, and objective truth. Therefore, they
fundamentally reject many of the postmodern, secular, and Marxist ideas of the modern
Democratic Party. Along with that, they are far more conservative on a host of social issues.
This effect is compounded by the fact that the Democratic Party is moving farther to the left
on those issues and increasingly embracing a secular world view. Democrats are talking
about faith differently today and generally talking about it a lot less than they used to. As
38
such, even many non-Christians of faith are increasingly pulled towards the Republican
Party. However, I expect there to be some difference between denominations. Thus, I offer
hypothesis 15:
H15— Religious people are more likely to support Republican candidates and issues.
I argue that college is a transformative experience for many people that ultimately
affects how they feel politically, and this is especially true for women who go to college.
College tends to make people more liberal on a host of issues while also changing their world
view (CCES 2016). For the non-religious, it also gives them a much more enlightened form
a secularism that makes the Democratic Party especially appealing. Also, since the
Democratic Party in increasingly catering to a white collar economy, it is logical from an
economics standpoint for college educated voters to be more favorable to that party.
Furthermore, educated people simply seem to have a different set of values and lifestyle than
people without a college degree. Lastly, they find the rhetoric and style of President Trump
to be especially distasteful. Thus, I offer hypothesis 16:
H16— People with a college degree are more likely to support Democratic candidates and
issues.
Racial attitudes are important in politics overall but not unique in the Appalachian
region. While a host of demographic factors will affect these attitudes and racism is still an
issue in the US, I argue that the Appalachian culture does not add to racial resentment which
sets it apart from the South more generally. While the lowland South has historically favored
a hierarchical society, Appalachians have long been more egalitarian. Slavery was a lot
different in mountains and many mountaineers harbored resentment towards plantation
owners (Inscoe 1996). During the Civil War, white Union soldiers operating in the region
and local partisans cooperated with local blacks in the guerrilla war against local

39
Confederates. After the war, the Republican Party in the South was mostly made up of
former Unionists and black people. In the coal and industrial areas of the region, both whites
and non-whites joined the FDR coalition in the 1930s. There is a long history of political
cooperation between whites and blacks in the region. Also, racial attitudes today continue to
be stronger where there is more diversity (Key 1949).
Lastly while White (2019) found that Appalachians have slightly stronger racial
resentment than the average American, he uses the very broad definition of Appalachia
created by the Appalachian Regional Commission (ARC). Their definition includes large
sections of flat counties Alabama, Mississippi, and parts of the Piedmont in North Carolina
and South Carolina that my definition does not include (see appendix). It is not a stretch to
say that people living in those areas feel a whole lot more Southern than they do
Appalachian, and adding them in to a sample of mountaineers will naturally increase racial
feelings in the aggregate. Up in the mountains, a very different history and culture exists. As
such, racial attitudes in Appalachia are simply a combination of basic personal and
demographic characteristics (Eller 2008). Therefore, I offer hypothesis 17:
H17— Racial attitudes are not driving the Republican voting trend in Appalachia.
Demographics as Destiny
The theory of demographics as destiny essentially states that the Obama coalition of
women, young voters, and minorities will continue to expand allowing the Democratic Party
to dominate national politics as the country becomes more diverse and educated, but this
theory does not account for the folks on the other end of the spectrum. Appalachia is the
exact opposite of the type of places where the Democratic Party is growing today—newly
urbanizing, ethnically diverse, wealthy, and educated suburbs with lots of recent migrants
40
and immigrants. As the national Democratic Party increasingly leaves Appalachia behind,
Appalachians continue to vote more and more Republican. Isaac Newton said that for every
action there is an equal and opposite reaction, and in political terms that is true of Appalachia
today. In many ways, this same phenomenon is present in other rural areas as well, but those
areas lack the isolation and the historic lack of recent migration that the Appalachian
Mountains provide. While rural areas across America are becoming more Republican today,
this alone does not explain the new Republican trend in Appalachia.

41
Data and Methods
The main sources used for this project are election results, the Cooperative
Congressional Elections Survey (2008-2018), and a limited number of interviews. Defining
Appalachia is a critical first step, and exactly which counties are Appalachian is somewhat
problematic and not entirely clear. I take a middle of the road approach with a definition that
is broader than many historians but more narrow than the Appalachian Regional
Commission, which includes flat counties in Mississippi and areas that were added not
because of their geography or history but because modern politicians wanted to bring home
more earmark spending back to their home districts. Instead of using the ARC’s definition, I
focus on areas that are genuinely mountainous and are culturally considered Appalachian.
My main definition of Appalachia stretches from the northern counties of Alabama through
northern Pennsylvania. For the quantitative analysis, the term Appalachia is defined as the
semi-core and super-core of the region combined, but some models test multiple definitions
of the region at the same time (see maps in appendix). The different regions of the country
are operationalized consistent with historical and cultural data. From 1980 through the 2008
election, the longtime scholar of Appalachian politics David Sutton (2009) typically analyzed
counties in four distinct categories within Appalachia: Democratic mining, distressed, urban,
and mountain Republicans. This study looks at those same four categories but also adds in a
fifth category and looks at counties with large universities and uses most of the same
counties as Sutton.
To better understand the nature of the shift within Appalachia, a limited number of
interviews were conducted. One key group the author was interested in were people who
were once Democrats and became Republicans recently or those who still identify as

42
Democrats but voted for Donald Trump in 2016. I found these folks by using the snowball
technique and by looking for them at Republican events in the region. While the CCES data
comprise the core of this study, interviews were used to help drive early theory and
hypotheses and to better understand the nuances of the five different types of Appalachian
counties.
The CCES is administered online by YouGov to acquire a very large sample that
normally exceeds 50,000 participants and is largely representative of the US down to the
Congressional District level. YouGov uses Census data to help match the participants it
selects to help ensure that their sample population is representative of the US based on
gender, age, race, education, employment status, interest in politics, born again status,
partisanship, and ideology. The study is administered cooperatively by individual teams of
scholars typically attached to a university who purchase 1,000 person samples at a time.
Also, YouGov hires a team of statisticians to weight the common content data to further
ensure its accuracy. This thesis uses the common content data that is easily available to the
public.
Table 1: Description of Variables Used
Dependent Variables Range Independent Variables Range
Gun Control 0-4 Appalachia 0-1
Abortion 0-6 Rural2 0-8
Immigration 0-4 White 0-1
Environment 0-4 Age 18-99
Trade 0-1 Male 0-1
Economy 0-4 PID 0-6
Racial Resentment 0-16 Ideology 0-4
Presidential Vote 0-1 Income 0-15
Senate vote 0-1 Religion 0-3
House vote 0-1 College 0-1
Governor vote 0-1
Higher values translate to the Republican position or vote for a Republican. Source: CCES 2008-2016
43
In this study, the CCES is used to compare the Appalachian region to the rest of the
country and show Appalachian exceptionalism. The CCES has county level data, which
allows for the comparison of attitudes, opinions, and voting behavior in Appalachia versus
the rest of the country. On most of the six issues examined, the CCES asked a variety of yes
or no questions on those topics except for economic anxiety which is measured by feelings
towards the direction of the economy on a five point scale. On topics with multiple
questions, those answered were added together to create an index for each issue. On gun
control, immigration, the economy, and the environment, the scales are all 0-4. For abortion
the scale is 0-6, and on trade it is 0-1. Higher values indicate pro-gun rights, prolife, anti-
immigration, anti-environmental restrictions, anti-free trade, and increased economic anxiety.
For racial resentment, an index was created from four questions that all had a four point
scales. The racial resentment scale goes from 0-16 with 0 being the least resentful and 16
being the most resentful. They are different than the standard four questions used by the
ANES, but one can logically conclude that folks with high or low racial resentment on the
standard ANES scale would answer in a similar fashion to the questions used by the CCES.
On vote for President, Senate, House, and governor, 0 is a vote for the Democratic candidate
and a 1 is a vote for the Republican with others omitted. After running regression models on
all six key issues and vote for President, comparisons were made to compare people who
crossed parties in their voting in 2016 or switched from 2012 to 2016. While some of the
samples for party switchers were rather small, collectively there is a decent sample size and
all of the evidence points in the same direction.
For control variables, dummy variables were created for whites, males, and people
with a college degree having a value of 1. Income is in intervals from 0-15 as set by the

44
CCES, and age is in years. Party identification uses the standard 7 point scale (0-6) and
ideology the standard 5 point scale (0-4). The religion variable is based on how important
people view religion on a scale from 0-4 with higher values equating to greater religiosity.
Rural is not included in the CCES, so two other controls for this variable at the county level
are tested. I created one metric (rural), and a second version (rural2) that uses the standard
Beale Codes with 0 being the most urban and 8 being the most rural is used instead. For all
control variables, the same exact measurements were used across time, and in all models,
traditional coefficients are used. For further information, see the appendix for full coding
and discussion of each variable mentioned above.

45
Results
2016 National Election Results
Table 2 shows Republican votes for President from 1980 to 2016 in various regions.
Appalachia is the only region to become significantly more Republican, and no region has
undergone a larger political shift in either direction during that time period. While the Great
Plains and the South are reliably Republican regions that have seen little change in the 21st
Century, Appalachia has increased its Republican vote share in every election. While voting
trends have remained roughly even in the East Coast outside of Appalachia with some
sorting, Republicans have fared far worse in the western third of the country. In 2016, gains
in Appalachia and certain Midwestern states greatly contributed to Trump’s victory.
President Trump was supported by Appalachia, which is especially remarkable giving the
fact that the region voted for Bill Clinton twice in 1992 and 1996 (Wolf 2013). Appalachia
has kept the Republican Party competitive and at times dominant in the 21st Century.
Table 2: Republican Vote by Region in Presidential Elections
1980
2000
2004
2008
2012
2016
Change from
1980-2000
Change from
2000-2016
Appalachia 51 55 59 59 62 65 +4 +10
New England 45 37 41 37 39 38 -7 +1
Mid-Atlantic 48 40 44 40 40 41 -8 +1
The South 51 54 57 53 54 52 +3 -2
Midwest 50 48 50 43 46 48 -2 +0
Great Plains 61 60 61 59 62 61 -1 +1
Mountain West 61 57 59 51 54 48 -4 -9
Southwest 53 43 46 39 40 34 -10 -9
West Coast 49 45 46 39 40 37 -4 -8
US Total 51 48 51 46 48 46 -3 -2 Percentages are Republican vote totals among all candidates on the ballot. Source: The New York Times 2004-2016; Wolf 2013 2017; Leip 1980 2000.
During the 2016 Republican primaries, Appalachia proved to be one of Donald
Trump’s strongest regions in the country. Despite facing a contested 4 way race, Trump won
nearly every county in the region losing only 11 out of roughly 350. Some may dismiss this

46
saying that Trump simply appeals to rural voters more broadly, but it was Ted Cruz who won
some of the most rural counties in America including half of the Plains states. However, Ted
Cruz did not fare so well in Appalachia. Trump’s dominance was especially evident in Ohio,
where despite losing the state to popular governor John Kasich, he still carried most of
Ohio’s Appalachian counties. Governor Kasich won nearly every county in the state outside
of the region, but he lost all but three counties in Appalachian Ohio to Donald Trump.
Trump won every single county in the rest of northern Appalachia, and he easily swept West
Virginia, Eastern Tennessee, and Northern Georgia.
Table 3: Percentage of Republican Senate control in Appalachia over Time
2000 2002 2004 2006 2008 2010 2012 2014 2016 2018
US Senate Appalachia 79 83 83 79 75 75 79 96 96 96
US Total 50 51 55 49 41 47 45 54 52 53
House of
Representatives
Appalachia 62 68 68 52 48 80 88 92 92 88
US Total 52 54 54 48 42 57 55 58 57 47 Source: The New York Times 2000-2018.
Table 3 shows similar results looking at national legislative elections. Generally
speaking, Republican Senate candidates have tended to do pretty well in the Appalachian
sections of their states since 2000. However, Joe Manchin of West Virginia is the only
Democratic Senator to win an election in the region since 2012, and he is very different from
the average Democratic Senator. He is widely regarded as the most conservative Democrat
based on roll call votes in the Senate, and his style is very different from almost anyone else
in the party at the national level. In looking at the House, the Republicans reversal of
fortunes is ever starker. While Republicans start the 2000s with a slight advantage, they
actually control a minority of seats in Appalachia in 2008. However, Democratic members
of Congress were mostly wiped out through the early 2010s. Clearly, redistricting cannot
explain this since the biggest change was between 2008 and 2010 under the same maps. In
47
2016, Democrats only won two seats in the region both in Pennsylvania, and only the seat
centered around downtown Pittsburgh is safely in their column. Today, the vast majority of
Congressional districts in Appalachia are no longer competitive.
Table 4 shows that the Republican Party has good news in all types of Appalachian
counties outside of those with a large university. They have a major electoral advantage in
the mountain Republican, distressed, and Democratic mining counties. The mountain
Republican counties are labeled as such because they have voted strongly Republican since
the 1860s, and Civil War loyalties still play a factor in elections today. In traditionally
Republican counties, one main reason people have stuck with the party is because all of their
ancestors were Republicans. Most people will adopt the same political preferences as their
parents (Lewis-Beck et al. 2011), and people in these counties say that the Republican Party
has always been a good fit for them on the issues. Based on interviews, there have not been
strong enough cross pressures in the mountain Republican counties at any point since the
Civil War to convince many people to start voting for Democratic candidates.

48
Table 4: Different Types of Appalachian Counties: Presidential Vote Percentage 1980-2016 Demographic County Name Reagan
1980 Bush 2000
Bush 2004
McCain
2008 Romney 2012
Trump 2016
Republican
Change
1980-2000
Republican
Change
2000-2016
National
Popular Vote
51 48 51 46 48 46 -3 -2
Democratic Pike (KY) 41 44 47 56 74 80 +3 +36 Mining Knott (KY) 23 31 36 53 73 76 +8 +45
Harlan (KY) 38 47 60 72 81 85 +9 +38
Buchanan (VA) 43 39 46 52 67 79 -4 +40
Boone (WV) 35 36 41 43 64 74 +1 +37
Mingo (WV) 28 38 43 55 70 83 +10 +44
McDowell (WV) 27 32 37 45 64 74 +5 +42
Distressed Letcher (KY) 44 46 53 65 78 80 +2 +34
Menifee (KY) 36 52 48 46 57 72 +15 +20
Pike (OH) 45 51 52 48 49 66 +6 +15
Forest (PA) 56 60 61 55 60 70 +4 +10
Hancock (TN) 70 65 69 71 75 83 -5 +18
Wyoming (WV) 39 44 57 61 77 83 +5 +39
Demographic County Name Reagan 1980
Bush 2000
Bush 2004
McCain
2008 Romney 2012
Trump 2016
Republican
Change
1980-2000
Republican
Change
2000-2016
Urban Areas Buncombe, NC
(Asheville)
49 54 50 42 43 40 +5 -14
Hamilton, TN
(Chattanooga)
56 55 58 55 56 55 -1 0
Knox, TN
(Knoxville)
56 58 62 61 64 59 +2 +1
Cabell, WV
(Huntington)
49 51 55 54 56 59 +2 +8
Kanawha, WV
(Charleston)
46 48 51 49 55 57 +2 +9
Allegheny, PA
(Pittsburgh)
44 40 42 42 42 39 -4 -1
Lackawanna, PA
(Scranton)
46 36 42 36 36
46 -8 +10
Madison, AL
(Huntsville)
47 55 59 57 59 55 +8 0
Mountain Fannin (GA) 55 68 71 73 78 81 +13 +16
Republicans Jackson (KY) 82 84 84 84 86 89 +2 +5
Garrett (MD) 64 71 73 69 74 77 +7 +6
Mitchell (NC) 69 76 73 70 75 78 +7 +2
Johnson (TN) 75 66 72 70 74 82 -9 +16
Grant (WV) 75 79 81 75 83 88 +4 +9
Demographic County Name Reagan 1980
Bush 2000
Bush 2004
McCain
2008 Romney
2012 Trump 2016
Republican
Change
1980-2000
Republican
Change
2000-2016
University Centre (PA) 48 53 52 43 49 46 +5 -7
Athens (OH) 41 38 36 31 31 38 -3 0
Montgomery (VA) 47 52 54 47 49 45 +5 -7
Watauga (NC) 51 56 53 47 50 46 +5 -10
Source: The New York Times 2004-2016; Leip 1980 2000.
There were significant cross pressures, however, in the Democratic mining and
distressed counties. The Democratic mining label may appear to be a misnomer since Trump
49
won more than 70 or 80 percent in most of them, but these counties were heavily Democratic
from 1932 until the early 2000s. The Democratic Party had a stronghold in many coal and
industrial counties in Appalachia in Western Pennsylvania, West Virginia, Southeast Ohio,
Eastern Kentucky, and Eastern Tennessee, and Northern Alabama because they had strong
union support and a large number of workers, many of whom were eastern and southern
European immigrants. Unions served both as a political and a social institution that
ultimately helped the party in the region. Also, many of these new settlers did not have
longstanding political ties dating back to the Civil War and immigrants have historically been
inclined to support the Democratic Party (Key 1949).
In elections since 2000, Democratic mining and distressed counties have by far seen
the biggest shifts towards the Republican Party with many of them voting almost as strongly
as the mountain Republican counties. Most of these counties saw a 30 to 50 point swing in
the 21st century alone. While the mountain Republicans saw only a small shift towards
Trump in 2016, it is hard to go up that much in counties that have routinely voted for
Republicans with more than 70 or 80 percent anyway. Untimely, both Democratic mining
and distressed counties have become more Republican in recent elections for mostly the
same reasons today, and the differences between the two lie in the past not the present. Both
have a history with coal, but the Democratic mining counties simply had stronger unions and
stronger Democratic dominance in the past. Today they are very similar in that both types of
counties are poorer, generally more isolated, still support coal today, and overall they
strongly favor more socially conservative policies. According to local, they perceive that
both their livelihoods and their culture are directly threatened by the Democratic Party, and
therefore they have joined with the Republicans in droves.
50
Urban and university counties are the least favorable towards Republicans in the
region. Overall, Republicans still win many of the urban counties, but lose all of the
university counties. The size of the city clearly mattered in 2016 as it did nationally with
Democrats winning three counties in Appalachia with larger cities and Republicans wining
five counties with smaller ones. Still, Republicans have held roughly even or made modest
gains in every county except Buncombe from 2000-2016. This is especially significant given
the fact that nationally, the Democratic Party has made large gains in urban areas. Outside of
Asheville, those urban gains have not translated to Appalachia. Even in Pittsburgh the
largest city in the region, Republicans have maintained remarkably steady support for a large
urban area due to its Appalachian character. In 2004, US Airways abandoned its hub in
Pittsburgh and moved it to Charlotte, and in many ways this is emblematic of the divergence
in politics between these two cities in the 21st century. In 2000, President Bush easily won
Mecklenburg County 58-41, but received only 40 percent of the votes in Allegheny County.
However in 2016, Trump won nearly the same percentage as Bush in Allegheny County but
badly lost in Mecklenburg County by more than two to one (Leip 2000; NYT 2016). Over
that time period, Charlotte has had a thriving economy and has grown rapidly attracting
many young, college educated migrants and immigrants, and a new culture has emerged in
the city that has led to strong growth for the Democratic Party. Conversely according to the
US Census, relatively few people have moved to Pittsburgh over the last few decades leaving
it with a much more conservative culture tied to its history of steel, coal, and mountainous
roots.
In examining Buncombe County, the growth of the Democratic Party seems pretty
clear. Unlike most urban counties in Appalachia, Buncombe County has seen signification

51
in-migration, and Asheville has styled itself as the “San Francisco of the east” with a culture
different than in other parts of Appalachia. This has attracted many very liberal young
people who consistently vote Democratic to move to the area. In comparison, Knox County,
Tennessee, is the only other urban county in the region to have significant population growth
in recent years, but Knoxville is not known as a liberal city. Its new residents have not
dramatically reshaped politics there as many of them are themselves native Appalachians
from other parts of eastern Tennessee. This is fitting with national trends where people are
more likely to move places where their political ideology is already dominant (Bishop 2008).
In the same way that large scale migration changed the political character of coal and
industrial counties in the 1930s, it is changing the character of Buncombe County today.
In looking at university counties, Republicans have seen the biggest declines in these
counties since 2000, and Trump lost all four counties in 2016. These results are fairly
intuitive as young people tend to be more Democratic, and the Democratic Party today has an
advantage among college educated voters. Universities bring in both a short term number of
young voters and increase the number people who plan to permanently live and work in the
county who have a college degree. All of these counties are a blue dot in a sea of red
surrounded by much more rural and Republican counties that do not have this influx of
educated people from other regions. Also, local party leaders believe that reforms passed in
the last ten or fifteen years like early voting, same day registration, and voting on campus
have greatly helped the Democratic Party in these counties. Previously, most students would
vote absentee back in their home towns rather than in the county they went to college in,
thereby having a much smaller political effect on those counties. However given these
trends, it is surprising that three out of the four counties are still competitive and that two

52
backed Republicans in Senate elections 2016. This is likely because the student populations
at these schools tend to be much more Republican than the national average due to the fact
that many of the students are drawn from the local Appalachian counties themselves.
Northwestern North Carolina has long been one of the most Republican parts of the state, and
central Pennsylvania is often labeled as “Pennsyltucky” or “the state of Northern Alabama.”
Still of the roughly 10 counties won by Hillary Clinton in the region, all 10 could be
classified as either urban or university counties.
Appalachian Exceptionalism: Individual Level Results in 2016
Table 5: Opinions in Appalachia vs. the rest of the US
Non-
Appalachia
Appalachia Northern
Appalachia
Central
Appalachia
Southern
Appalachia
Gun Control (0-4) 1.48 1.64 1.54 1.71 1.77
Abortion (0-6) 2.64 3.19 3.00 3.38 3.41
Immigration (0-4) 1.97 2.39 2.32 2.52 2.43
Environment (0-4) 1.49 1.78 1.68 1.99 1.80
Trade (0-1) 0.47 0.55 0.52 0.55 0.59
Econ Anxiety (0-4) 2.11 2.48 2.42 2.64 2.44
N 60,979 3,621 1,836 787 998 Values indicate the mean score on each index for people in that region or sub-region.
Source: CCES 2016
The following section shows the exceptionalism of Appalachia in its politics based on
issue opinions and voting in the region. Table 5 compares the mean scores of Appalachians
on a variety of issue indexes with the mean scores of Americans who live outside of the
region. On average, Appalachians take a substantially more Republican position on host of
issues identified by the literature to be important, and this trend is consistent throughout the
region. As Appalachia is the most Republican region in the country today, this not
surprising. Central Appalachia is the most Republican on a majority of the issues, and this
overall trend coincides well with the electoral shift in West Virginia and surrounding
counties. The biggest distinctions for central Appalachia are on immigration, the
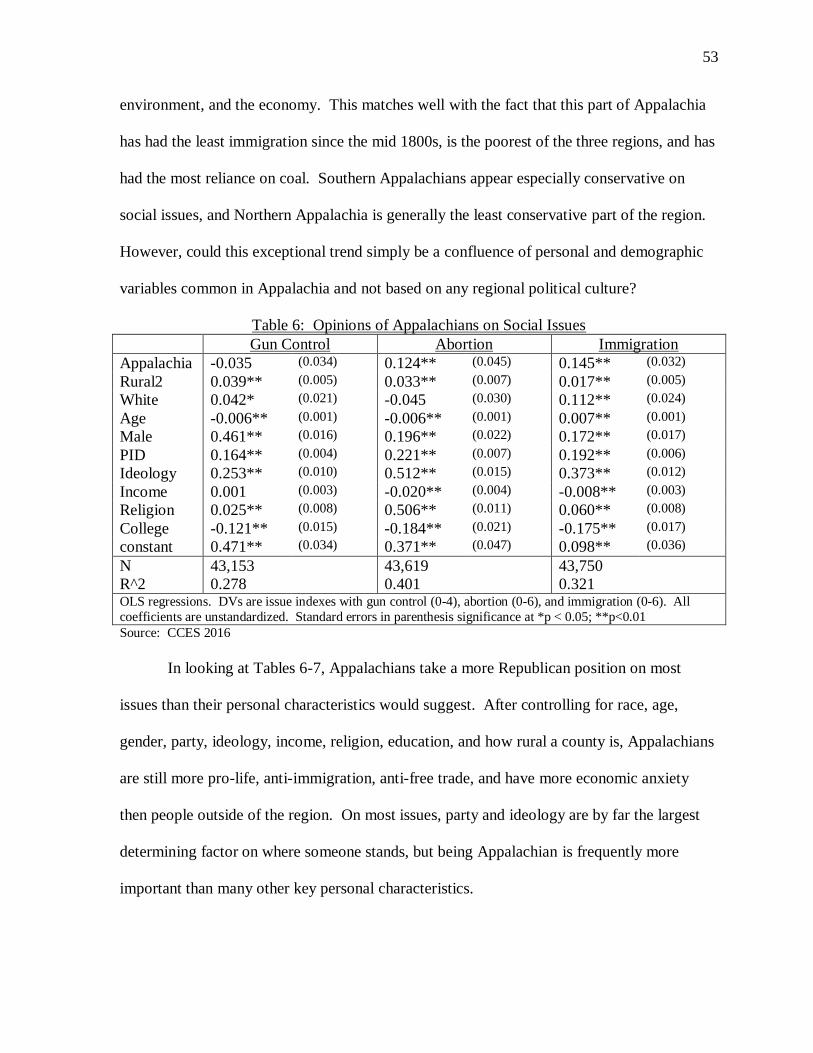
53
environment, and the economy. This matches well with the fact that this part of Appalachia
has had the least immigration since the mid 1800s, is the poorest of the three regions, and has
had the most reliance on coal. Southern Appalachians appear especially conservative on
social issues, and Northern Appalachia is generally the least conservative part of the region.
However, could this exceptional trend simply be a confluence of personal and demographic
variables common in Appalachia and not based on any regional political culture?
Table 6: Opinions of Appalachians on Social Issues
Gun Control Abortion Immigration
Appalachia -0.035 (0.034) 0.124** (0.045) 0.145** (0.032)
Rural2 0.039** (0.005) 0.033** (0.007) 0.017** (0.005)
White 0.042* (0.021) -0.045 (0.030) 0.112** (0.024)
Age -0.006** (0.001) -0.006** (0.001) 0.007** (0.001)
Male 0.461** (0.016) 0.196** (0.022) 0.172** (0.017)
PID 0.164** (0.004) 0.221** (0.007) 0.192** (0.006)
Ideology 0.253** (0.010) 0.512** (0.015) 0.373** (0.012)
Income 0.001 (0.003) -0.020** (0.004) -0.008** (0.003)
Religion 0.025** (0.008) 0.506** (0.011) 0.060** (0.008)
College -0.121** (0.015) -0.184** (0.021) -0.175** (0.017)
constant 0.471** (0.034) 0.371** (0.047) 0.098** (0.036)
N
R^2
43,153
0.278
43,619
0.401
43,750
0.321
OLS regressions. DVs are issue indexes with gun control (0-4), abortion (0-6), and immigration (0-6). All
coefficients are unstandardized. Standard errors in parenthesis significance at *p < 0.05; **p<0.01
Source: CCES 2016
In looking at Tables 6-7, Appalachians take a more Republican position on most
issues than their personal characteristics would suggest. After controlling for race, age,
gender, party, ideology, income, religion, education, and how rural a county is, Appalachians
are still more pro-life, anti-immigration, anti-free trade, and have more economic anxiety
then people outside of the region. On most issues, party and ideology are by far the largest
determining factor on where someone stands, but being Appalachian is frequently more
important than many other key personal characteristics.

54
This trend is rather evident looking at social issues in Table 6. While support for gun
rights in the region is largely based on its demographic characteristics, being Appalachian is
a fairly significant determinate of abortion and immigration. On abortion, being Appalachian
is a more important factor on average than race or age and is only a slightly less important
factor than gender or having a college degree. On immigration, being Appalachian is more
important than race, age, income the urban/rural divide, and is nearly as important as having
a college degree and gender. These are both statistically significant and substantive effects.
Appalachians scored 20 percent higher on abortion index and 21 percent higher on the
immigration index than non-Appalachians.
Table 7: Opinions of Appalachians on Economic Issues
Environment Trade Economic Anxiety
Appalachia 0.046 (0.041) 0.031* (0.012) 0.128** (0.029)
Rural2 0.031** (0.006) 0.008** (0.002) 0.025** (0.004)
White -0.041 (0.025) 0.071** (0.009) 0.012 (0.019)
Age 0.007** (0.001) 0.005** (0.000) 0.002** (0.000)
Male 0.178** (0.019) 0.096** (0.007) -0.151** (0.014)
PID 0.223** (0.006) 0.039** (0.002) 0.184** (0.005)
Ideology 0.367** (0.012) -0.000 (0.004) 0.159** (0.010)
Income 0.006 (0.003) 0.000 (0.001) -0.036** (0.002)
Religion 0.064** (0.009) -0.014** (0.003) -0.004 (0.006)
College -0.078** (0.018) -0.015* (0.007) -0.155** (0.012)
constant -0.447** (0.038) 0.051** (0.015) 1.405** (0.031)
N
R^2
43,681
0.309
43,675
0.093
42,928
0.291
OLS regressions. DVs are issue indexes with gun control (0-4), abortion (0-6), and immigration (0-6). All
coefficients are unstandardized. Standard errors in parenthesis significance at *p < 0.05; **p<0.01 Source: CCES 2016
Table 7 presents some key economic issues in the region, and Appalachians are also
more in line with the Republican Party than demographics alone would predict. While
Appalachians overall are only as opposed to environmental restrictions as demographics
predict they would be, a model not included in the table above did show that central
Appalachians are opposed to environmental restrictions which coincides well with the visible

55
sentiment on the ground in coal country (see appendix). On trade, being Appalachian is
more important than education, income, and even ideology. Ideology was not significant
likely because of the confusion on the issue with the Republican Party of Trump supporting
protectionist trade policies and the conservative movement and party historically supporting
free trade orthodoxy. In looking at economic attitudes, being from Appalachia is more
imperative than race, age, the urban/rural divide, and religion and nearly as important as
gender or having a college degree. Not surprising, having a higher income makes people
much more optimistic about the future of the economy on average. Ultimately, while social
issues have been a major factor in why Appalachians have shifted so heavily towards the
Republican Party, it is hard to deny the role that new economic issues have played as well.
Table 8: The 2016 Election in Appalachia
President Senate House
Appalachia 1.503** (0.191) 1.161 (0.165) 1.658** (0.176)
Rural2 1.086** (0.020) 1.077** (0.018) 1.095** (0.017)
White 2.727** (0.218) 1.619** (0.125) 1.863** (0.133)
Age 1.005* (0.002) 0.993** (0.002) 0.998 (0.002)
Male 1.589** (0.092) 1.267** (0.072) 1.319** (0.067)
PID 2.551** (0.051) 2.001** (0.036) 2.129** (0.036)
Ideology 2.609** (0.108) 2.023** (0.083) 1.962** (0.074)
Income 1.001 (0.010) 1.008 (0.010) 1.012 (0.008)
Religion 1.272** (0.036) 1.256** (0.033) 1.279** (0.030)
College 0.563** (0.033) 0.793** (0.044) 0.828** (0.041)
constant 0.002** (0.000) 0.016** (0.002) 0.010** (0.001)
N
R^2
35,701
0.601
26,351
0.458
35,346
0.494
Logit odds ratios of voting Republican over Democrat. All coefficients are unstandardized. Standard errors in
parenthesis significance at *p < 0.05; **p<0.01 Source: CCES 2016
In Appalachia, people were more likely to vote Republican in 2016 than personal
characteristics alone would predict for both Presidential and Congressional races. After
controlling for all of the major demographic variables, mountaineers were still one and a half
times more likely to vote for Donald Trump than people outside of the region with the same
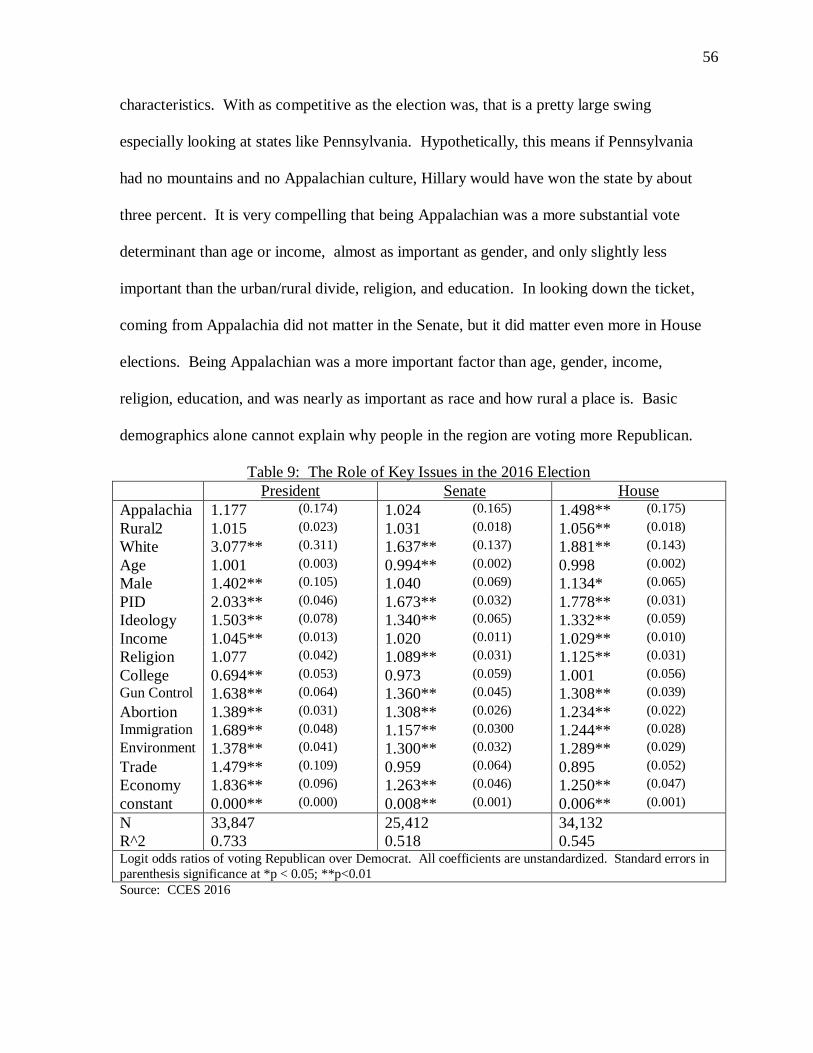
56
characteristics. With as competitive as the election was, that is a pretty large swing
especially looking at states like Pennsylvania. Hypothetically, this means if Pennsylvania
had no mountains and no Appalachian culture, Hillary would have won the state by about
three percent. It is very compelling that being Appalachian was a more substantial vote
determinant than age or income, almost as important as gender, and only slightly less
important than the urban/rural divide, religion, and education. In looking down the ticket,
coming from Appalachia did not matter in the Senate, but it did matter even more in House
elections. Being Appalachian was a more important factor than age, gender, income,
religion, education, and was nearly as important as race and how rural a place is. Basic
demographics alone cannot explain why people in the region are voting more Republican.
Table 9: The Role of Key Issues in the 2016 Election
President Senate House
Appalachia 1.177 (0.174) 1.024 (0.165) 1.498** (0.175)
Rural2 1.015 (0.023) 1.031 (0.018) 1.056** (0.018)
White 3.077** (0.311) 1.637** (0.137) 1.881** (0.143)
Age 1.001 (0.003) 0.994** (0.002) 0.998 (0.002)
Male 1.402** (0.105) 1.040 (0.069) 1.134* (0.065)
PID 2.033** (0.046) 1.673** (0.032) 1.778** (0.031)
Ideology 1.503** (0.078) 1.340** (0.065) 1.332** (0.059)
Income 1.045** (0.013) 1.020 (0.011) 1.029** (0.010)
Religion 1.077 (0.042) 1.089** (0.031) 1.125** (0.031)
College 0.694** (0.053) 0.973 (0.059) 1.001 (0.056)
Gun Control 1.638** (0.064) 1.360** (0.045) 1.308** (0.039)
Abortion 1.389** (0.031) 1.308** (0.026) 1.234** (0.022)
Immigration 1.689** (0.048) 1.157** (0.0300 1.244** (0.028)
Environment 1.378** (0.041) 1.300** (0.032) 1.289** (0.029)
Trade 1.479** (0.109) 0.959 (0.064) 0.895 (0.052)
Economy 1.836** (0.096) 1.263** (0.046) 1.250** (0.047)
constant 0.000** (0.000) 0.008** (0.001) 0.006** (0.001)
N
R^2
33,847
0.733
25,412
0.518
34,132
0.545
Logit odds ratios of voting Republican over Democrat. All coefficients are unstandardized. Standard errors in
parenthesis significance at *p < 0.05; **p<0.01 Source: CCES 2016
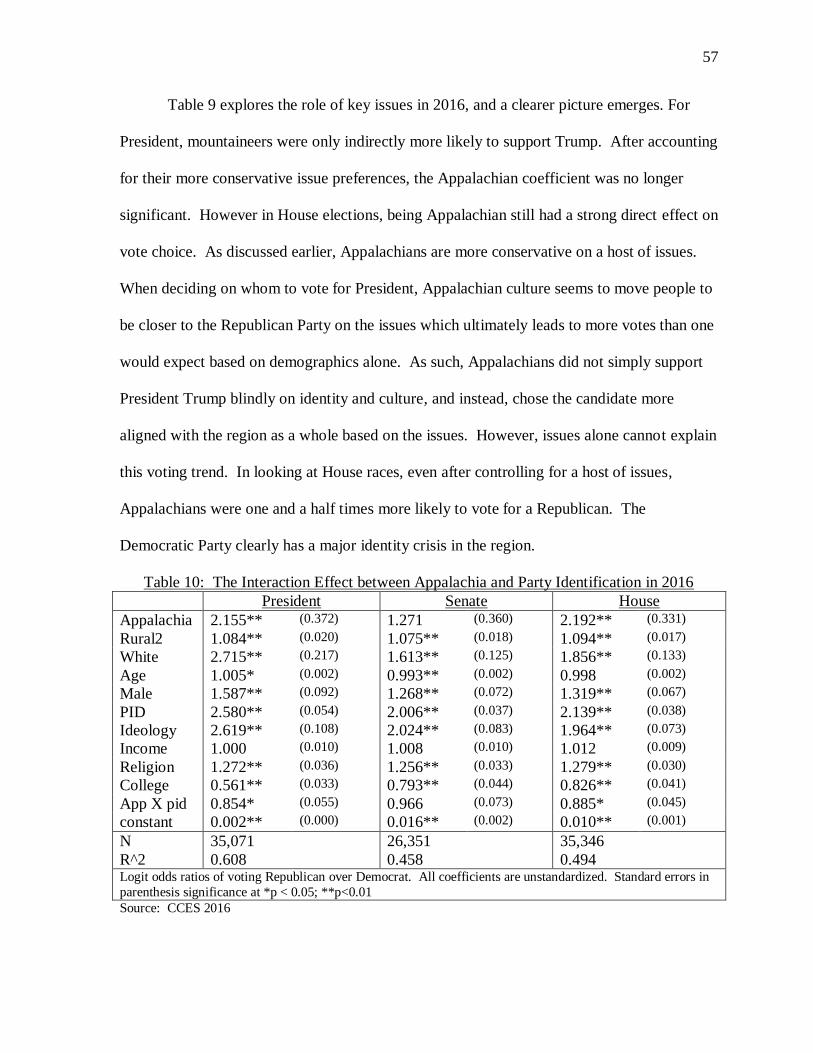
57
Table 9 explores the role of key issues in 2016, and a clearer picture emerges. For
President, mountaineers were only indirectly more likely to support Trump. After accounting
for their more conservative issue preferences, the Appalachian coefficient was no longer
significant. However in House elections, being Appalachian still had a strong direct effect on
vote choice. As discussed earlier, Appalachians are more conservative on a host of issues.
When deciding on whom to vote for President, Appalachian culture seems to move people to
be closer to the Republican Party on the issues which ultimately leads to more votes than one
would expect based on demographics alone. As such, Appalachians did not simply support
President Trump blindly on identity and culture, and instead, chose the candidate more
aligned with the region as a whole based on the issues. However, issues alone cannot explain
this voting trend. In looking at House races, even after controlling for a host of issues,
Appalachians were one and a half times more likely to vote for a Republican. The
Democratic Party clearly has a major identity crisis in the region.
Table 10: The Interaction Effect between Appalachia and Party Identification in 2016
President Senate House
Appalachia 2.155** (0.372) 1.271 (0.360) 2.192** (0.331)
Rural2 1.084** (0.020) 1.075** (0.018) 1.094** (0.017)
White 2.715** (0.217) 1.613** (0.125) 1.856** (0.133)
Age 1.005* (0.002) 0.993** (0.002) 0.998 (0.002)
Male 1.587** (0.092) 1.268** (0.072) 1.319** (0.067)
PID 2.580** (0.054) 2.006** (0.037) 2.139** (0.038)
Ideology 2.619** (0.108) 2.024** (0.083) 1.964** (0.073)
Income 1.000 (0.010) 1.008 (0.010) 1.012 (0.009)
Religion 1.272** (0.036) 1.256** (0.033) 1.279** (0.030)
College 0.561** (0.033) 0.793** (0.044) 0.826** (0.041)
App X pid 0.854* (0.055) 0.966 (0.073) 0.885* (0.045)
constant 0.002** (0.000) 0.016** (0.002) 0.010** (0.001)
N
R^2
35,071
0.608
26,351
0.458
35,346
0.494
Logit odds ratios of voting Republican over Democrat. All coefficients are unstandardized. Standard errors in
parenthesis significance at *p < 0.05; **p<0.01 Source: CCES 2016

58
In exploring why Appalachians are increasingly voting Republican today, there is one
significant interaction effect that may hold the key. Appalachian Democrats are far more
likely to vote for a Republican than Democrats outside of the region controlling for a host of
other factors. In looking at Democrats who voted for Trump, only race and ideology were
more important factors, and in House races being Appalachians was second in importance
only to ideology. In both cases, Democrats in Appalachia were more than twice as likely to
vote for a Republican than were Democrats outside of the region. That is massive and really
illustrates the story of Democratic disillusionment in the region. This is one of the main
reasons why Appalachia is becoming so Republican. Not only are Republican candidates
winning strong backing from members of their own party in the region, but they are also
winning over a much larger number of Democrats than one would expect in the polarized
political climate that exists today.
Table 11: Percent Vote for Republican candidates by Political Affiliation
President US House
Party Identification Non-App Appalachia Non-App Appalachia
Republican 92 94 91 93
Independent 63 76 58 71
Democrat 8 19 11 28 Percentages are Republican vote totals among all candidates on the ballot. A chi^2 test indicates that the differences
between Appalachians and non-Appalachians is statistically significant at p<0.01. Source: CCES 2016
While Donald Trump did better with Appalachians across political parties, he only
saw a small increase in the vote share among Republicans living in the region. However,
true independents in Appalachia were substantially more likely to vote for Trump than true
independents outside of the region, and while most Democrats ultimately voted for Hillary,
more than twice as many Appalachian Democrats crossed over and voted for Trump than
their counterparts in other areas of the country. This trend was even starker in the House
where a whopping 28 percent of Democrats choose to elect a Republican representative,
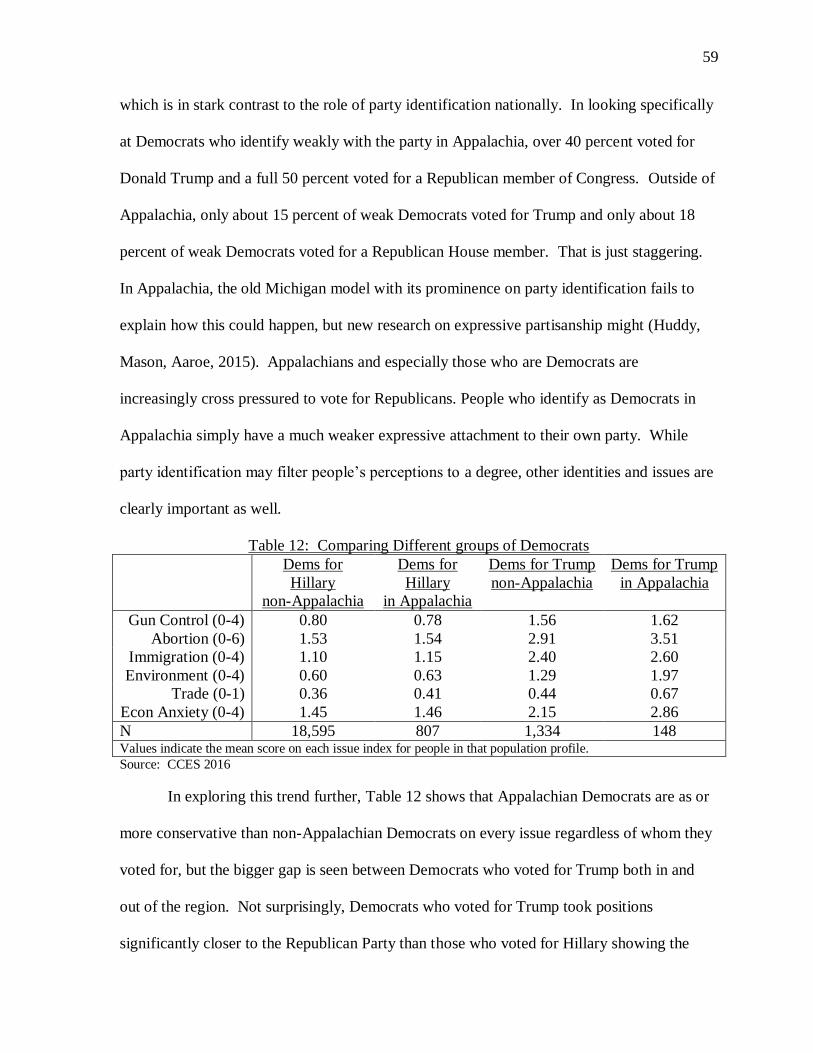
59
which is in stark contrast to the role of party identification nationally. In looking specifically
at Democrats who identify weakly with the party in Appalachia, over 40 percent voted for
Donald Trump and a full 50 percent voted for a Republican member of Congress. Outside of
Appalachia, only about 15 percent of weak Democrats voted for Trump and only about 18
percent of weak Democrats voted for a Republican House member. That is just staggering.
In Appalachia, the old Michigan model with its prominence on party identification fails to
explain how this could happen, but new research on expressive partisanship might (Huddy,
Mason, Aaroe, 2015). Appalachians and especially those who are Democrats are
increasingly cross pressured to vote for Republicans. People who identify as Democrats in
Appalachia simply have a much weaker expressive attachment to their own party. While
party identification may filter people’s perceptions to a degree, other identities and issues are
clearly important as well.
Table 12: Comparing Different groups of Democrats
Dems for
Hillary
non-Appalachia
Dems for
Hillary
in Appalachia
Dems for Trump
non-Appalachia
Dems for Trump
in Appalachia
Gun Control (0-4) 0.80 0.78 1.56 1.62
Abortion (0-6) 1.53 1.54 2.91 3.51
Immigration (0-4) 1.10 1.15 2.40 2.60
Environment (0-4) 0.60 0.63 1.29 1.97
Trade (0-1) 0.36 0.41 0.44 0.67
Econ Anxiety (0-4) 1.45 1.46 2.15 2.86
N 18,595 807 1,334 148 Values indicate the mean score on each issue index for people in that population profile.
Source: CCES 2016
In exploring this trend further, Table 12 shows that Appalachian Democrats are as or
more conservative than non-Appalachian Democrats on every issue regardless of whom they
voted for, but the bigger gap is seen between Democrats who voted for Trump both in and
out of the region. Not surprisingly, Democrats who voted for Trump took positions
significantly closer to the Republican Party than those who voted for Hillary showing the
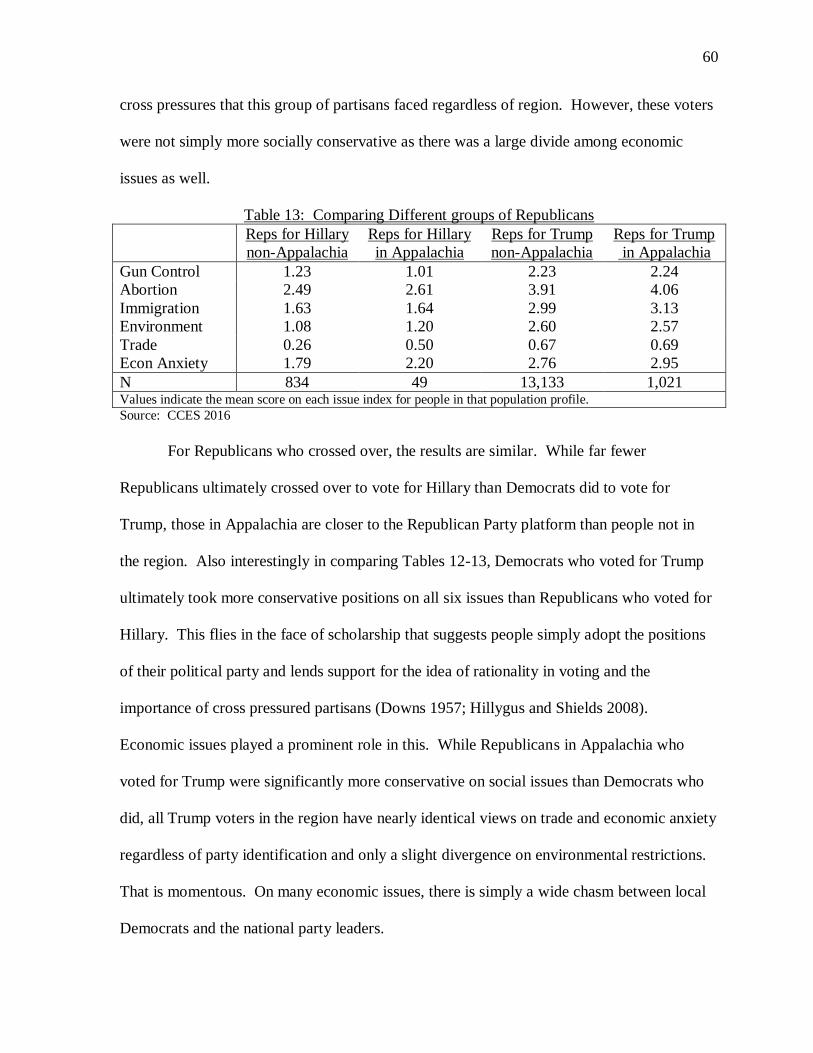
60
cross pressures that this group of partisans faced regardless of region. However, these voters
were not simply more socially conservative as there was a large divide among economic
issues as well.
Table 13: Comparing Different groups of Republicans
Reps for Hillary
non-Appalachia
Reps for Hillary
in Appalachia
Reps for Trump
non-Appalachia
Reps for Trump
in Appalachia
Gun Control 1.23 1.01 2.23 2.24
Abortion 2.49 2.61 3.91 4.06
Immigration 1.63 1.64 2.99 3.13
Environment 1.08 1.20 2.60 2.57
Trade 0.26 0.50 0.67 0.69
Econ Anxiety 1.79 2.20 2.76 2.95
N 834 49 13,133 1,021 Values indicate the mean score on each issue index for people in that population profile. Source: CCES 2016
For Republicans who crossed over, the results are similar. While far fewer
Republicans ultimately crossed over to vote for Hillary than Democrats did to vote for
Trump, those in Appalachia are closer to the Republican Party platform than people not in
the region. Also interestingly in comparing Tables 12-13, Democrats who voted for Trump
ultimately took more conservative positions on all six issues than Republicans who voted for
Hillary. This flies in the face of scholarship that suggests people simply adopt the positions
of their political party and lends support for the idea of rationality in voting and the
importance of cross pressured partisans (Downs 1957; Hillygus and Shields 2008).
Economic issues played a prominent role in this. While Republicans in Appalachia who
voted for Trump were significantly more conservative on social issues than Democrats who
did, all Trump voters in the region have nearly identical views on trade and economic anxiety
regardless of party identification and only a slight divergence on environmental restrictions.
That is momentous. On many economic issues, there is simply a wide chasm between local
Democrats and the national party leaders.

61
Table 14: Comparing Voters who Switched from 2012-2016
Obama Trump
Voters
non-Appalachia
Obama Trump
Voters in
Appalachia
Romney Hillary
Voters
Non-Appalachia
Romney Hillary
voters in
Appalachia
Gun Control 1.57 1.62 1.07 0.98
Abortion 2.88 3.17 2.31 2.41
Immigration 2.46 2.68 1.72 1.56
Environment 1.36 1.82 1.29 1.34
Trade 0.50 0.56 0.34 0.49
Econ Anxiety 2.25 2.73 1.89 2.08
N 1,953 168 810 44 Values indicate the mean score on each issue index for people in that population profile. Source: CCES 2016
Similar results are seen for those who switched their vote from 2012 to 2016. Among
people who voted for both President Obama in 2012 and President Trump in 2016, those in
Appalachia are closer to the Republican Party on every issue often by a substantial margin,
and similar results can been seen for the few Appalachians who voted for both Mitt Romney
and Hillary Clinton. In comparing Obama Trump voters in Appalachian vs. non-Appalachia,
the biggest difference is on the environment and economic anxiety showing the importance
of those issues in the region. While they were more conservative on social issues, economic
attitudes are a major factor for vote switchers in Appalachia.
Table 15: Comparing Voters who did not Switch from 2012-2016
Obama Hillary
Voters
non-Appalachia
Obama Hillary
Voters in
Appalachia
Romney Trump
Voters
Non-Appalachia
Romney Trump
voters in
Appalachia
Gun Control 0.80 0.72 2.31 2.33
Abortion 1.50 1.64 3.98 4.16
Immigration 1.13 1.21 3.06 3.12
Environment 0.58 0.68 2.76 2.72
Trade 0.37 0.47 0.70 0.72
Econ Anxiety 1.43 1.47 2.80 2.93
N 17,922 755 13,006 932 Values indicate the mean score on each issue index for people in that population profile. Source: CCES 2016
In general, there are far fewer differences between Appalachians and non-
Appalachians who did not switch their votes from 2012-2016. However, they still take a

62
slightly more Republican stance on almost every issue, and consistent Democratic voters in
Appalachia still face more cross pressures than their counterparts outside of the region with
an especially large gap on trade. On the Republican side, this data suggests that strong
Republicans in Appalachia will likely not be going anywhere anytime soon. However for
Democrats, weak partisans, and pure independents in Appalachia, this evidence suggests that
these cross pressures have and will continue to convince many of them to vote Republican
into the future.
Table 16: Racial Resentment in Appalachia
Model 1 Model 2 Model 3
Appalachia 0.029 (0.080)
AppSuperCore 0.006 (0.116)
AppSemiCore 0.033 (0.105)
AppPeriphery -0.235 (0.124)
NorthApp 0.000 (0.112)
CentralApp 0.088 (0.152)
SouthApp 0.041 (0.144)
Rural2 0.006 (0.012) 0.006 (0.012) 0.006 (0.012)
White 0.667** (0.053) 0.667** (0.053) 0.667** (0.053)
Age 0.001 (0.001) 0.001 (0.001) 0.001 (0.001)
Male 0.557** (0.040) 0.557** (0.040) 0.557** (0.040)
PID 0.417** (0.012) 0.417** (0.012) 0.417** (0.012)
Ideology 0.865** (0.027) 0.865** (0.027) 0.865** (0.027)
Income -0.011 (0.006) -0.011 (0.006) -0.011 (0.006)
Religion 0.106** (0.020) 0.106** (0.020) 0.106** (0.020)
College -0.363** (0.038) -0.363** (0.038) -0.363** (0.038)
constant 1.102** (0.084) 1.102** (0.084) 1.102** (0.084)
N
R^2
43,427
0.321
43,427
0.321
43,427
0.321
OLS regressions. DV is the racial resentment index (0-16). All coefficients are unstandardized. Standard
errors in parenthesis significance at *p < 0.05; **p<0.01 Source: CCES 2016
While most scholars believe that race does not uniquely play a role in Appalachian
elections, some scholars disagree and pundits in the media sometimes depict people living in
the region as racist hillbillies. Therefore, it is worth testing empirically. While racial
resentment certainly played a role in the 2016 and has historically in elections, Appalachians

63
are no more racially resentful than non-Appalachians. Each part of Appalachia is tested
individually to see if a particular part of Appalachia is more likely to be racist, but none of
those values were statistically significant. This is in stark contrast to most of the models in
this study that found being Appalachian to be a statistically important variable on a host of
issues and in voting.
Table 17: Voting Models with Racial Resentment Added
President House
Model 1 Model 2 Model 3 Model 4
Appalachia 1.503** (0.191) 1.532** (0.203) 1.658** (0.176) 1.666** (0.187)
Rural2 1.086** (0.020) 1.086** (0.021) 1.095** (0.017) 1.099** (0.017)
White 2.727** (0.218) 2.274** (0.213) 1.863** (0.133) 1.605** (0.120)
Age 1.005* (0.002) 1.005* (0.002) 0.998 (0.002) 0.997 (0.002)
Male 1.589** (0.092) 1.353** (0.088) 1.319** (0.067) 1.175** (0.062)
PID 2.551** (0.051) 2.433** (0.055) 2.129** (0.036) 2.006** (0.035)
Ideology 2.609** (0.108) 1.929** (0.097) 1.962** (0.074) 1.589** (0.065)
Income 1.001 (0.010) 1.005 (0.011) 1.012 (0.008) 1.015 (0.009)
Religion 1.272** (0.036) 1.252** (0.039) 1.279** (0.030) 1.263** (0.031)
College 0.563** (0.033) 0.637** (0.040) 0.828** (0.041) 0.913 (0.048)
RaceResent 1.487** (0.020) 1.249** (0.013)
constant 0.002** (0.000) 0.001** (0.000) 0.010** (0.001) 0.007** (0.001)
N
R^2 (psudo)
35,701
0.601
34,858
0.667
35,346
0.494
35,139
0.520
Logit odds ratios of voting Republican over Democrat. All coefficients are unstandardized. Standard errors in
parenthesis significance at *p < 0.05; **p<0.01
Source: CCES 2016
In looking at voting models that include racial resentment, it is clear that attitudes on
race are not driving the Republican voting trend in Appalachia. On the contrary, adding
racial attitudes to the Presidential vote model actually increases the Appalachian odds ratio
despite being a very substantive independent variable on its own with the super-core of the
region driving this trend (see additional models in the appendix). In vote for President in
2016, racial resentment was far more important than anything but party identification,
roughly equal to ideology, and yet it cannot explain why Appalachians are more likely to
support Republican candidates than non-Appalachians. Unfortunately, Appalachia has long

64
been mischaracterized by outsiders. Just as local color artists in the 1920s mythologized the
people living in the region as backwards (Shapiro 1986) and people in the 1960s blamed
poverty in the region on their culture (Weller 1965), many outsiders today blame electoral
losses of the Democratic Party in Appalachia simply on racism. This is nothing more than an
inaccurate caricature of the region not supported by statistics or traditional political theories
on racially polarized voting (Key 1949). Instead of racial attitudes, the data suggest that
Appalachians are voting differently because of policy preferences, economic attitudes, and
dominant political culture of the region.
Table 18: Comparison between Appalachia and the Plains: Issues Gun Control Abortion Immigration Environment Trade Economic
Anxiety
App -0.033 (0.034)
0.125** (0.044)
0.142** (0.032)
0.051 (0.041)
0.030* (0.014)
0.127** (0.029)
Plains 0.039 (0.040)
0.162 (0.059)
-0.060 (0.046)
0.090 (0.054)
-0.015 (0.019)
-0.012 (0.035)
Rural2 0.039** (0.005)
0.033** (0.007)
0.017** (0.005)
0.030** (0.006)
0.009** (0.002)
0.026** (0.004)
White 0.042* (0.021)
-0.045 (0.030)
0.112** (0.024)
-0.042** (0.025)
0.071** (0.009)
0.012 (0.019)
Age -0.006** (0.001)
-0.006** (0.001)
0.007** (0.001)
0.007** (0.001)
0.005** (0.000)
0.002** (0.000)
Male 0.461** (0.015)
0.196** (0.022)
0.172** (0.017)
0.178** (0.019)
0.096** (0.007)
-0.151** (0.014)
PID 0.164** (0.004)
0.221** (0.007)
0.192** (0.006)
0.223** (0.006)
0.039** (0.002)
0.184** (0.005)
Ideology 0.253** (0.010)
0.513** (0.015)
0.373** (0.012)
0.367** (0.012)
-0.000 (0.005)
0.159** (0.010)
Income 0.001 (0.003)
-0.020** (0.004)
-0.008** (0.003)
0.006 (0.003)
0.000 (0.001)
-0.036** (0.002)
Religion 0.025** (0.008)
0.506** (0.011)
0.061** (0.008)
0.063** (0.009)
-0.014** (0.003)
0.004** (0.007)
College -0.121** (0.015)
-0.184** (0.021)
-0.176** (0.017)
-0.078** (0.017)
-0.015* (0.006)
-0.155** (0.012)
constant 0.471** (0.034)
0.371** (0.047)
0.098** (0.036)
-0.447** (0.037)
0.051** (0.015)
1.404** (0.031)
N
R^2
43,103
0.277
43,619
0.410
43,750
0.321
43,681
0.309
43,675
0.093
42,928
0.291 OLS regressions. DVs are issue indexes with gun control (0-4), abortion (0-6), immigration (0-6), environment (0-
4), trade (0-1), and economic anxiety (0-4). All coefficients are unstandardized. Standard errors in parenthesis
significance at *p < 0.05; **p<0.01 Source: CCES 2016

65
Table 19: Comparison between Appalachia and the Plains: The 2016 Election
President Senate House
Appalachia 1.504** (0.191) 1.120 (0.170) 1.676** (0.186)
GreatPlains 1.008 (0.148) 1.789** (0.220) 1.258 (0.225)
Rural2 1.081** (0.020) 1.065** (0.018) 1.094** (0.017)
White 2.711** (0.216) 1.611** (0.125) 1.864** (0.133)
Age 1.004* (0.002) 0.993** (0.002) 0.998 (0.002)
Male 1.588** (0.092) 1.264** (0.071) 1.317** (0.067)
PID 2.553** (0.051) 2.001** (0.036) 2.128** (0.036)
Ideology 2.611** (0.108) 2.027** (0.083) 1.964** (0.074)
Income 1.000 (0.010) 1.008 (0.010) 1.011 (0.008)
Religion 1.271** (0.036) 1.253** (0.033) 1.279** (0.030)
College 0.562** (0.033) 0.792** (0.044) 0.827** (0.041)
constant 0.002** (0.000) 0.016** (0.002) 0.010** (0.001)
N
R^2
35,071
0.607
26,351
0.459
35,346
0.494
Logit odds ratios of voting Republican over Democrat. All coefficients are unstandardized. Standard errors in
parenthesis significance at *p < 0.05; **p<0.01 Source: CCES 2016
In tables 18-19, the final modes for 2016 compares Appalachia to the Great Plains
states, and this comparison was chosen because these are the two most Republican regions
today. While being Appalachian was statistically significant for most issues and in their vote
for President and House in 2016, being from the Great Plains was not statistically significant
for single issue and only matter in the unpredictable US Senate races. Ultimately, the Great
Plains is one of the most Republican regions in the country today, and the tables above
suggest that it is simply because of its personal and demographic characteristics and not due
to any unique culture of the region. This is somewhat ironic as the Plains states have been
strongly Republican since the 1800s, so if party alone were driving this unique voting trend,
one would to expect to find it here. Both the Plains and Appalachia are mostly white, blue
collar, older, and rural regions, but only one of them is becoming more Republican with
every election. Something unique is going on in the Appalachian Mountains.

66
Previous Elections and Advanced Models
Table 20: Presidential Elections over Time
2008 2012 2016
Appalachia 1.524** (0.181) 1.515* (0.255) 1.503** (0.191)
Rural2 1.066** (0.017) 1.027 (0.021) 1.086** (0.020)
White 2.920** (0.206) 3.580** (0.353) 2.727** (0.218)
Age 1.011** (0.002) 1.007** (0.002) 1.005* (0.002)
Male 1.064 (0.058) 1.007 (0.072) 1.589** (0.092)
PID 2.484** (0.039) 3.299** (0.089) 2.551** (0.051)
Ideology 2.743** (0.098) 2.909** (0.149) 2.609** (0.108)
Income 1.025** (0.009) 1.033** (0.012) 1.001 (0.010)
Religion 1.350** (0.036) 1.386** (0.047) 1.272** (0.036)
College 0.681** (0.038) 0.862 (0.077) 0.563** (0.033)
constant 0.001** (0.000) 0.000** (0.000) 0.002** (0.000)
N
R^2 (psudo)
31,415
0.644
36,880
0.688
35,701
0.601
Logit odds ratios of voting Republican over Democrat. All coefficients are unstandardized. Standard errors in
parenthesis significance at *p < 0.05; **p<0.01 Source: CCES 2008 2012 2016
Clearly, the exceptional voting trend in Appalachia was not simply a fluke related to
President Trump. Instead, there has been a very durable trend over time. Over the last few
Presidential elections, Appalachians have been consistently a little more than one and a half
times likely to vote for a Republican President than non-Appalachians controlling for a host
of other variables. In looking at other independent variables over time, their importance
often varied from elections to election, and in some elections they did not matter. While
being Appalachian mattered in every election, gender, income, college, and rural status only
sometimes mattered for President over time.

67
Table 21: House of Representatives over Time
2008 2010 2012 2014 2016
Appalachia 0.954 (0.120)
1.108 (0.217)
1.480* (0.249)
1.340* (0.166)
1.658** (0.176)
Rural2 0.989 (0.014)
1.030 (0.021)
1.105** (0.019)
1.060** (0.017)
1.095** (0.017)
White 1.882** (0.129)
1.734** (0.149)
2.207** (0.092)
1.569** (0.136)
1.863** (0.133)
Age 0.999 (0.002)
1.003 (0.003)
0.995* (0.002)
1.001 (0.002)
0.998 (0.002)
Male 0.938 (0.049)
0.964 (0.063)
1.087 (0.071)
1.100 (0.062)
1.319** (0.067)
PID 2.042** (0.031)
2.485** (0.057)
2.737** (0.023)
2.223** (0.041)
2.129** (0.036)
Ideology 2.149** (0.071)
3.370** (0.161)
2.241** (0.045)
2.008** (0.094)
1.962** (0.074)
Income 1.028** (0.009)
1.017 (0.010)
1.019 (0.011)
1.019* (0.010)
1.012 (0.008)
Religion 1.126** (0.029)
1.117** (0.036)
1.264** (0.033)
1.129** (0.029)
1.279** (0.030)
College 0.788** (0.042)
0.783** (0.050)
0.883 (0.071)
0.719** (0.041)
0.828** (0.041)
constant 0.010** (0.001)
0.003** (0.001)
0.003** (0.182)
0.013** (0.002)
0.010** (0.001)
N
R^2 (psudo)
22,408
0.521
29,527
0.620
31,415
0.622
27,199
0.505
35,346
0.494
Logit odds ratios of voting Republican over Democrat. All coefficients are unstandardized. Standard errors in
parenthesis significance at *p < 0.05; **p<0.01 Source: CCES 2008 2010 2012 2014 2016
In looking at the House results instead of a durable effect, being Appalachian has
simply been growing in importance over the past ten years. Interestingly, Appalachia
became statistically significant for the first time in 2012 at the same time as the urban/rural
divide and both have grown together in tandem. The region is more Republican above and
beyond just how rural it is. Also in the past few elections, being Appalachian has been
statistically significant even when things like age, income, gender, and college have not been.

68
Table 22: US Senate over Time
2008 2010 2012 2014 2016
Appalachia 1.156 (0.190)
1.066 (0.229)
1.308 (0.268)
1.790** (0.349)
1.161 (0.165)
Rural2 1.025 (0.020)
1.068** (0.027)
1.000 (0.024)
1.023 (0.027)
1.077** (0.018)
White 2.059** (0.193)
2.072** (0.231)
1.560** (0.167)
1.850** (0.195)
1.619** (0.125)
Age 1.000 (0.002)
1.001 (0.003)
0.999 (0.003)
1.000 (0.003)
0.993** (0.002)
Male 1.115 (0.080)
0.999 (0.034)
1.016 (0.080)
1.155 (0.092)
1.267** (0.072)
PID 2.287** (0.046)
2.865** (0.086)
2.930** (0.080)
2.452** (0.069)
2.001** (0.036)
Ideology 2.207** (0.100)
3.880** (0.230)
2.562** (0.130)
2.225** (0.119)
2.023** (0.083)
Income 1.001 (0.011)
1.016 (0.013)
1.034** (0.013)
0.998 (0.014)
1.008 (0.010)
Religion 1.235** (0.043)
1.213** (0.049)
1.222** (0.042)
1.160** (0.043)
1.256** (0.033)
College 0.892 (0.065)
0.761** (0.062)
0.946 (0.071)
0.957 (0.076)
0.793** (0.044)
constant 0.004** (0.001)
0.001** (0.000)
0.001** (0.000)
0.005** (0.001)
0.016** (0.002)
N
R^2 (psudo)
12,745
0.581
22,649
0.683
24,708
0.641
14,047
0.559
26,351
0.458
Logit odds ratios of voting Republican over Democrat. All coefficients are unstandardized. Standard errors in
parenthesis significance at *p < 0.05; **p<0.01 Source: CCES 2008 2010 2012 2014 2016
Table 23: Governor over Time
2010 2014
Appalachia 1.933** (0.334) 0.964 (0.134)
Rural2 1.005 (0.024) 0.995 (0.017)
White 1.817** (0.175) 1.868** (0.135)
Age 0.999 (0.003) 1.004* (0.002)
Male 1.014 (0.073) 1.163** (0.065)
PID 2.340** (0.058) 2.256** (0.041)
Ideology 3.448** (0.177) 2.154** (0.086)
Income 1.024* (0.012) 1.026** (0.009)
Religion 1.121** (0.037) 1.163** (0.030)
College 0.749** (0.053) 0.800** (0.045)
constant 0.001** (0.001) 0.007** (0.001)
N
R^2 (psudo)
24,038
0.605
27,978
0.511
Logit odds ratios of voting Republican over Democrat. All coefficients are
unstandardized. Standard errors in parenthesis significance at *p < 0.05; **p<0.01 Source: CCES 2008 2010 2012 2014 2016
In looking at Senate and governor races, Appalachia only mattered occasionally.
However, the same could be said for most of the independent variables expect for party,
ideology, religion, and race. Clearly, partisanship alone is much harder to predict how
people will vote in these races because of how vastly different some of the candidates are
from their national parties.
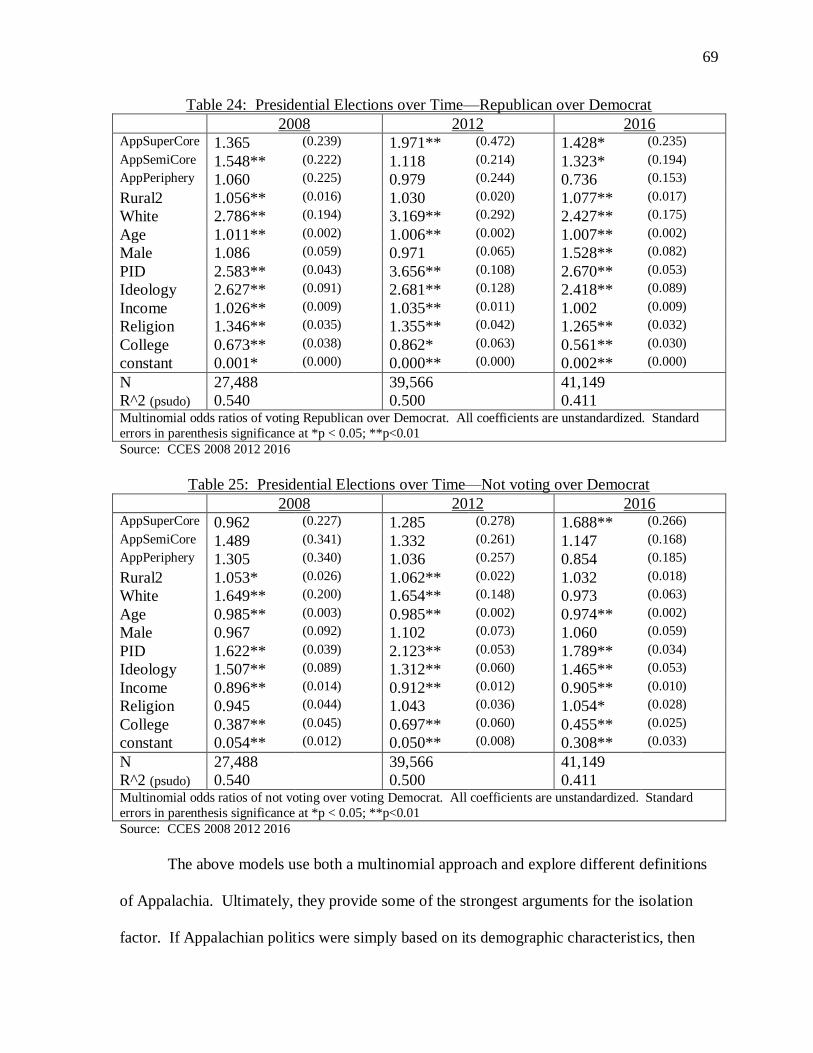
69
Table 24: Presidential Elections over Time—Republican over Democrat
2008 2012 2016 AppSuperCore 1.365 (0.239) 1.971** (0.472) 1.428* (0.235)
AppSemiCore 1.548** (0.222) 1.118 (0.214) 1.323* (0.194)
AppPeriphery 1.060 (0.225) 0.979 (0.244) 0.736 (0.153)
Rural2 1.056** (0.016) 1.030 (0.020) 1.077** (0.017)
White 2.786** (0.194) 3.169** (0.292) 2.427** (0.175)
Age 1.011** (0.002) 1.006** (0.002) 1.007** (0.002)
Male 1.086 (0.059) 0.971 (0.065) 1.528** (0.082)
PID 2.583** (0.043) 3.656** (0.108) 2.670** (0.053)
Ideology 2.627** (0.091) 2.681** (0.128) 2.418** (0.089)
Income 1.026** (0.009) 1.035** (0.011) 1.002 (0.009)
Religion 1.346** (0.035) 1.355** (0.042) 1.265** (0.032)
College 0.673** (0.038) 0.862* (0.063) 0.561** (0.030)
constant 0.001* (0.000) 0.000** (0.000) 0.002** (0.000)
N
R^2 (psudo)
27,488
0.540
39,566
0.500
41,149
0.411
Multinomial odds ratios of voting Republican over Democrat. All coefficients are unstandardized. Standard
errors in parenthesis significance at *p < 0.05; **p<0.01 Source: CCES 2008 2012 2016
Table 25: Presidential Elections over Time—Not voting over Democrat
2008 2012 2016 AppSuperCore 0.962 (0.227) 1.285 (0.278) 1.688** (0.266)
AppSemiCore 1.489 (0.341) 1.332 (0.261) 1.147 (0.168)
AppPeriphery 1.305 (0.340) 1.036 (0.257) 0.854 (0.185)
Rural2 1.053* (0.026) 1.062** (0.022) 1.032 (0.018)
White 1.649** (0.200) 1.654** (0.148) 0.973 (0.063)
Age 0.985** (0.003) 0.985** (0.002) 0.974** (0.002)
Male 0.967 (0.092) 1.102 (0.073) 1.060 (0.059)
PID 1.622** (0.039) 2.123** (0.053) 1.789** (0.034)
Ideology 1.507** (0.089) 1.312** (0.060) 1.465** (0.053)
Income 0.896** (0.014) 0.912** (0.012) 0.905** (0.010)
Religion 0.945 (0.044) 1.043 (0.036) 1.054* (0.028)
College 0.387** (0.045) 0.697** (0.060) 0.455** (0.025)
constant 0.054** (0.012) 0.050** (0.008) 0.308** (0.033)
N
R^2 (psudo)
27,488
0.540
39,566
0.500
41,149
0.411
Multinomial odds ratios of not voting over voting Democrat. All coefficients are unstandardized. Standard
errors in parenthesis significance at *p < 0.05; **p<0.01 Source: CCES 2008 2012 2016
The above models use both a multinomial approach and explore different definitions
of Appalachia. Ultimately, they provide some of the strongest arguments for the isolation
factor. If Appalachian politics were simply based on its demographic characteristics, then

70
how narrowly or broadly one defines the region should not matter. However, under a more
narrow definition of the region incorporating only the more isolated and rugged counties in
the region, being Appalachian matters the most. At the same time, in the peripheral parts of
Appalachia like upstate New York, much of northern Alabama, and the flatter western
fringes of the region, being Appalachian has not been significant in any of the last three
presidential elections. Cleary, the isolation of the region matters. While White (2019) found
the Appalachia dummy variable to no longer be statistically significant in 2008 after
controlling for religion, he uses the very broad definition used by the ARC that includes
many of these fringe counties along with relatively flat areas in Mississippi and the
piedmont. In the heart of the Appalachian Mountains at higher elevations and with more
rugged terrain, people are especially likely to favor Republican candidates.
Also, the Appalachian affect was compounded in 2016 in that people were both much
more likely to choose Trump over Hillary while also being much more likely to stay home
rather than vote for Hillary in the isolated core of Appalachia. This provides a clearer picture
of disillusionment with the Democratic Party in the region. While some former Democratic
voters and cross pressured partisans went ahead and voted for Trump, many others were not
quite ready to vote for a Republican yet, but they certainly were not going to go out and cast
a vote for Clinton either. If things in Appalachia continue the way they have been going,
some of these people will become future Republican voters in subsequent elections.

71
Table 26: House of Representatives over Time—Republican over Democrat
2008 2010 2012 2014 2016 AppSuperCore 1.020
(0.194)
0.999 (0.238)
1.536* (0.346)
1.167 (0.191)
1.934** (0.267)
AppSemiCore 0.919 (0.124)
0.895 (0.164)
1.753** (0.307)
1.533** (0.216)
1.497** (0.205)
AppPeriphery 0.725 (0.129)
1.331 (0.292)
1.338** (0.279)
1.896** (0.361)
1.373* (0.230)
Rural2 0.989 (0.014)
1.034 (0.018)
1.094** (0.019)
1.052** (0.015)
1.098** (0.016)
White 1.700** (0.111)
1.657** (0.120)
1.896** (0.157)
1.427** (0.105)
1.774** (0.117)
Age 0.999 (0.002)
1.003 (0.002)
0.996 (0.002)
1.003 (0.002)
1.000 (0.002)
Male 0.968 (0.049)
1.030 (0.057)
1.097 (0.070)
1.164** (0.057)
1.326** (0.063)
PID 2.101** (0.032)
2.470** (0.048)
3.061** (0.076)
2.219** (0.037)
2.209** (0.038)
Ideology 2.069** (0.066)
3.054** (0.117)
2.278** (0.096)
1.942** (0.072)
1.930** (0.065)
Income 1.029** (0.008)
1.026** (0.009)
1.026* (0.010)
1.014 (0.008)
1.013 (0.008)
Religion 1.134** (0.028)
1.136** (0.031)
1.242** (0.037)
1.150** (0.027)
1.270** (0.028)
College 0.784** (0.040)
0.774** (0.043)
0.847* (0.056)
0.772** (0.038)
0.836** (0.039)
constant 0.010** (0.001)
0.003** (0.001)
0.002** (0.000)
0.013** (0.002)
0.009** (0.001)
N
R^2 (psudo)
24,779
0.362
38,467
0.381
37,217
0.385
41,740
0.299
42,535
0.312
Multinomial odds ratios of voting Republican over Democrat. All coefficients are unstandardized. Standard errors
in parenthesis significance at *p < 0.05; **p<0.01 Source: CCES 2008 2010 2012 2014 2016
Table 27: House of Representatives over Time—Not Voting over Democrat
2008 2010 2012 2014 2016 AppSuperCore 1.958**
(0.338)
1.393 (0.272)
1.244 (0.249)
1.349 (0.214)
2.100** (0.293)
AppSemiCore 1.308 (0.214)
0.856 (0.137)
1.558** (0.241)
1.567** (0.182)
1.311* (0.182)
AppPeriphery 0.936 (0.178)
1.445* (0.233)
1.470 (0.310)
1.989** (0.344)
1.345 (0.246)
Rural2 0.984 (0.017)
1.019 (0.016)
1.039* (0.018)
0.985 (0.013)
1.031* (0.016)
White 1.011 (0.075)
1.038 (0.059)
0.987 (0.066)
0.800** (0.042)
0.924 (0.054)
Age 0.977** (0.002)
0.948** (0.002)
0.975** (0.002)
0.962** (0.001)
0.977** (0.002)
Male 0.874* (0.059)
0.641** (0.031)
0.858** (0.049)
0.938 (0.040)
0.966 (0.048)
PID 1.423** (0.025)
1.622** (0.029)
1.799** (0.035)
1.500** (0.022)
1.571** (0.025)
Ideology 1.318** (0.051)
1.361** (0.042)
1.233** (0.042)
1.360** (0.039)
1.386** (0.044)
Income 0.928** (0.009)
0.902** (0.007)
0.920** (0.0090
0.931** (0.007)
0.926** (0.008)
Religion 0.952 (0.029)
1.036 (0.024)
1.000 (0.027)
1.104** (0.022)
1.079** (0.025)
College 0.562** (0.038)
0.450** (0.022)
0.640** (0.041)
0.487** (0.021)
0.561** (0.027)
constant 0.460** (0.059)
7.772** (0.864)
0.637** (0.071)
2.320** (0.185)
0.435** (0.042)
N
R^2 (psudo)
24,779
0.362
38,467
0.381
37,217
0.385
41,740
0.299
42,535
0.312
Multinomial odds ratios of not voting over voting Democrat. All coefficients are unstandardized. Standard errors
in parenthesis significance at *p < 0.05; **p<0.01 Source: CCES 2008 2010 2012 2014 2016
In looking at the multinomial House election results, a fairly durable Appalachian
trend can be seen as well. While being Appalachia is not significant before 2012 in choosing
a Republican over a Democrat, a lot of Appalachians in the heart of the region stayed home
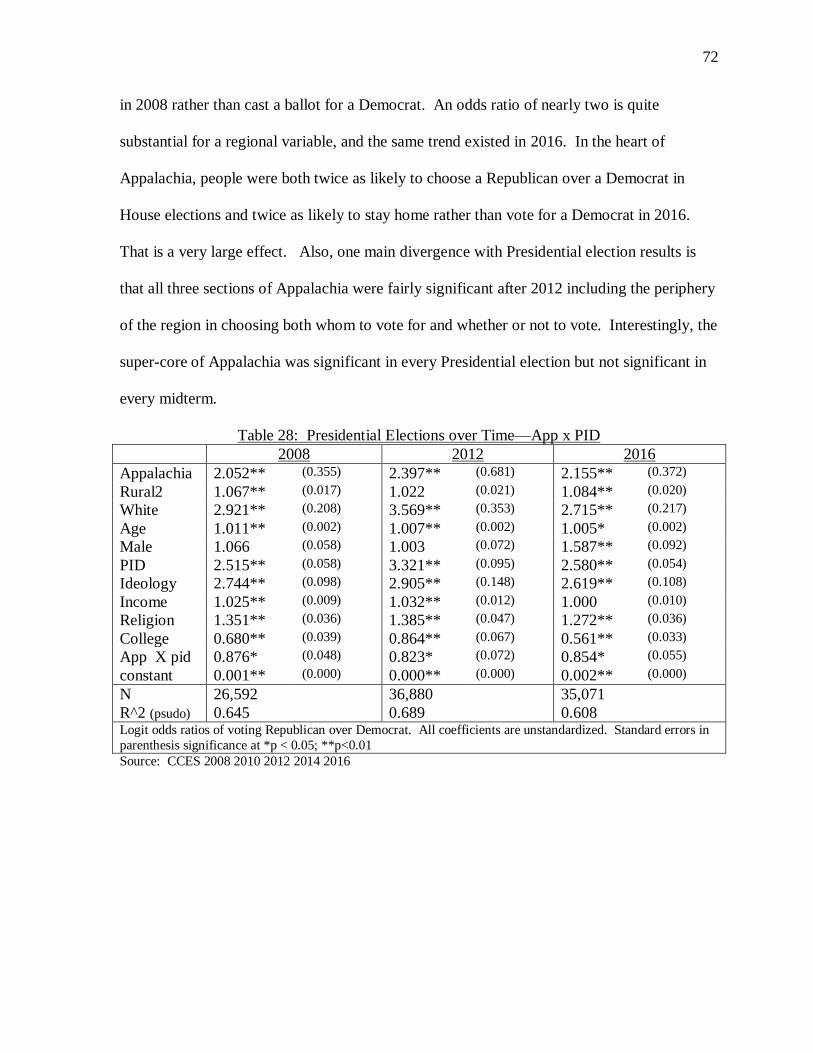
72
in 2008 rather than cast a ballot for a Democrat. An odds ratio of nearly two is quite
substantial for a regional variable, and the same trend existed in 2016. In the heart of
Appalachia, people were both twice as likely to choose a Republican over a Democrat in
House elections and twice as likely to stay home rather than vote for a Democrat in 2016.
That is a very large effect. Also, one main divergence with Presidential election results is
that all three sections of Appalachia were fairly significant after 2012 including the periphery
of the region in choosing both whom to vote for and whether or not to vote. Interestingly, the
super-core of Appalachia was significant in every Presidential election but not significant in
every midterm.
Table 28: Presidential Elections over Time—App x PID
2008 2012 2016
Appalachia 2.052** (0.355) 2.397** (0.681) 2.155** (0.372)
Rural2 1.067** (0.017) 1.022 (0.021) 1.084** (0.020)
White 2.921** (0.208) 3.569** (0.353) 2.715** (0.217)
Age 1.011** (0.002) 1.007** (0.002) 1.005* (0.002)
Male 1.066 (0.058) 1.003 (0.072) 1.587** (0.092)
PID 2.515** (0.058) 3.321** (0.095) 2.580** (0.054)
Ideology 2.744** (0.098) 2.905** (0.148) 2.619** (0.108)
Income 1.025** (0.009) 1.032** (0.012) 1.000 (0.010)
Religion 1.351** (0.036) 1.385** (0.047) 1.272** (0.036)
College 0.680** (0.039) 0.864** (0.067) 0.561** (0.033)
App X pid 0.876* (0.048) 0.823* (0.072) 0.854* (0.055)
constant 0.001** (0.000) 0.000** (0.000) 0.002** (0.000)
N
R^2 (psudo)
26,592
0.645
36,880
0.689
35,071
0.608
Logit odds ratios of voting Republican over Democrat. All coefficients are unstandardized. Standard errors in
parenthesis significance at *p < 0.05; **p<0.01 Source: CCES 2008 2010 2012 2014 2016

73
Table 29: House of Representatives over Time—App X PID
2008 2010 2012 2014 2016
Appalachia 1.349 (0.240)
2.335** (0.482)
2.380** (0.602)
1.126 (0.223)
2.192** (0.331)
Rural2 0.989 (0.014)
1.026 (0.020)
1.105** (0.021)
1.061** (0.017)
1.094** (0.017)
White 1.878** (0.130)
1.735** (0.151)
2.184** (0.203)
1.573** (0.136)
1.856** (0.133)
Age 0.999 (0.002)
1.002 (0.003)
0.995* (0.002)
1.001 (0.002)
0.998 (0.002)
Male 0.938 (0.049)
0.967 (0.063)
1.087 (0.077)
1.102 (0.062)
1.319** (0.067)
PID 2.057** (0.032)
2.560** (0.060)
2.759** (0.066)
2.218** (0.043)
2.139** (0.038)
Ideology 2.149** (0.071)
3.370** (0.161)
2.230** (0.106)
2.005** (0.094)
1.964** (0.073)
Income 1.028** (0.009)
1.017 (0.011)
1.019 (0.011)
1.019* (0.010)
1.012 (0.009)
Religion 1.125** (0.029)
1.114** (0.036)
1.265** (0.042)
1.130** (0.029)
1.279** (0.030)
College 0.787** (0.042)
0.779** (0.050)
0.884 (0.063)
0.719** (0.040)
0.826** (0.041)
App X pid 0.893* (0.047)
0.731** (0.055)
0.818* (0.078)
1.077 (0.076)
0.885* (0.045)
constant 0.010** (0.001)
0.003** (0.001)
0.003** (0.001)
0.013** (0.002)
0.010** (0.001)
N
R^2 (psudo)
22,408
0.521
29,527
0.622
31,415
0.622
27,199
0.505
35,346
0.494
Logit odds ratios of voting Republican over Democrat. All coefficients are unstandardized. Standard errors in
parenthesis significance at *p < 0.05; **p<0.01 Source: CCES 2008 2010 2012 2014 2016
For President, not only is being Appalachian a durable variable over time but so is the
interaction effect between Appalachia and party identification. In each of the last three
Presidential elections, Appalachian Democrats were more than twice as likely to vote for a
Republican President as Democrats in other parts of the country controlling for all of the
other variables. This means that Trump winning one fifth of Appalachian Democrats was not
a fluke but instead a durable trend over time. At the same time, recent Republican
Presidential candidates have won less than one in ten Democrats nationally.
In the House, a similar trend can be seen over time simply with more variance. The
same interaction effect is evident in four of the five elections above. In three of those
elections just like for President, Appalachian Democrats are notably more than twice as
likely to cross parties in their vote choice. In Appalachia, the idea that partisan identification
filters everything about politics goes right out the window. Instead of adopting the issue
positions and accepting the candidates of the modern Democratic Party, Appalachian
Democrats are increasingly shopping around for other options come election time.

74
Figure 1
Source: CCES 2008 2010 2012 2014 2016 2018
Figure 2
Source: CCES 2008 2010 2012 2014 2016 2018
0
10
20
30
40
50
60
2008 2010 2012 2014 2016 2018
Party Identification in Appalachia
Democrat Republican Independent
0
10
20
30
40
50
60
1 2 3 4 5 6
Party Identification Outside of Appalachia
Democrat Republican Independent

75
Figure 3
Source: CCES 2008 2010 2012 2014 2016 2018
Figure 4
Source: CCES 2008 2010 2012 2014 2016 2018
The interaction effect between Appalachia and party identification fits well in looking
at partisanship and ideology over time. In looking at ideology, conservatives have always
outnumbered liberals, but their advantage is far stronger in Appalachia. Nationally, there
have been few changes in the number of conservatives, but there has been significant growth
0
10
20
30
40
50
60
2008 2010 2012 2014 2016 2018
Ideology in Appalachia
Liberal
Conservative
Moderate
0
5
10
15
20
25
30
35
40
45
2008 2010 2012 2014 2016 2018
Ideology Outside of Appalachia
Liberal
Conservative
Moderate

76
in Appalachia. Overall, Appalachians are simply far more conservative than the average
American.
There is an even starker contrast when it comes to partisanship. In 2008, Figure 1
shows that there were more Democrats than Republicans in Appalachia, but the number of
people that identify as Democrats has steadily decreased over the last ten years dropping over
10 percentage points total, and the Republican Party has seen a 10 percent increase in
identification over that same time. That’s a substantial shift especially given the fact that
partisan breakdown nationally is nearly unchanged over that same time span. In combining
this with the interaction effect above, two things are happening at once. Over the last decade,
more and more Appalachians are leaving the Democratic Party every year and becoming
Republicans, and at the same time, people in the region who still identify as Democrats are
voting much more Republican than their other personal and demographic characteristics
would predict.
A Word on the 2018 Midterm Election in Appalachia
In looking at the election results from the 2018 midterms, Republican dominance has
persisted in the region. Joe Manchin is still the only Democratic Senator to win over
Appalachian voters in their state, and as discussed earlier, he is far from the average
Democrat. However, he only won by three points after winning by 24 percent in 2012 (NYT
2012-2018). Even for a more conservative Democrat, the winds are not blowing in his favor
today. In the House, there was one bright spot for Democrats in the special election for the
18th District of Pennsylvania in early 2018. Democrat Conor Lamb pulled off the upset
winning the race by less than one point. However, Lamb took the full Republican or partially
Republican position on a host of issues. He took the full Republican position on gun control,
77
trade, and mostly agreed with Republicans on environmental restrictions, and he took a soft
pro-choice stance on abortion. Also, his identity and the way he talked on the campaign trail
were far different than most national Democratic candidates. He talked about economic
anxiety in a way that resonated with Appalachians, and many people said he sounded more
like a Republican. While it is hard to read too much into a special election given their unique
nature, issues clearly played a role in why this Democrat was acceptable to voters who have
rejected other Democratic candidates by large margins over the past several election cycles.
In looking at the 2018 House midterms nationally, it was a great year for Democrats
where they picked up a net of 39 seats (NYT 2018). However, they did not pick up a single
seat in Appalachia, and in fact, they were aided by new Congressional maps drawn by the
Pennsylvania Supreme Court in February of 2018. Under the old maps, Democrats likely
would have lost one seat in Appalachia losing the district won in the special election earlier
that year. Conversely, Democrats picked up two seats in the Great Plains. After the
midterms, Democrats control 22 percent of Congressional district in the Plains and still only
12 percent in Appalachia and zero outside of Pennsylvania. In the region, Democratic
candidates are still increasingly at a disadvantage.

78
Conclusion
In its voting, Appalachia is now the most Republican region in the entire country, and
only time will tell if or when the party hits a ceiling in the region. Republicans have
increased their vote share in Appalachia in every election since the 1990s, and this trend is
likely to continue. Appalachians behave different politically. Today, they take more
conservative issue stances and are more likely to vote Republican than their personal and
demographic characteristics would predict. This is true for a host of political offices and a
host of issues. Also, this trend is stronger in the more isolated areas of Appalachia, and it
matters less if at all on the geographic fringes of the region. The isolation of the Appalachian
Mountains affects politics, and the more isolated people are, the more exceptionally
Republican they are today. Furthermore, Appalachia is a region in political transition.
Appalachia is seeing a large shift towards the Republican Party without any significant in-
migration. In Appalachia, it is mostly the same people simply one generation removed, and
they have become dramatically more Republican in a short period of time. Many people in
Appalachia today are either new Republicans or Democrats who do not really identify with
their party. These disaffected Democrats are increasingly leaving the party and new
Republicans are increasingly strengthening their partisanship. As V. O. Key (1955) argues,
large voting shifts are possible even without a critical election. Appalachia matters when it
comes to politics, and it is largely Republican in its voting behavior today.
In the last few decades, there have been many voting shifts in elections throughout
the country with significant sorting for both parties. Among the developments the solid
South has fallen in Virginia, Trump shattered the “Blue Wall,” the Frost Belt is looking a
whole lot redder, and Democrats are making significant inroads in many western states.

79
Many scholars debate which direction the parties should go to win national elections and the
impact of demographics as destiny (Frank 2004; Knuckey 2015; Sheppard 2013), but a
discussion on Appalachia is often left out of that debate.
Today, Appalachia has a major impact on American politics. On one hand, the recent
dominance of the Democratic Party in northern Virginia has more than overpowered
Republican gains in southwestern Virginia. Virginia may not vote with the rest of the old
Confederacy again for a long time. However, a very different story has played out in
Pennsylvania in 2016. With the Appalachian region of the state comprising well over half of
the state’s population, Trump’s wide margin of victory throughout the region allowed him to
become the first Republican Presidential candidate to win the state since 1988 and did so in
very different fashion than candidates have historically (Heineman 2008). Despite what
some scholars have theorized (Sheppard 2013), Democratic gains in the Philadelphia suburbs
were not enough to outweigh the growth of Republican support among Appalachians in 2016
(NYT 2016). Also, North Carolina and Georgia were very competitive 2016 in the lowland
counties, but the strong Republican showing the mountains kept both states comfortably
Republican. Lastly, Appalachia also mattered by playing an important role in the 2016
Republican Primary. Appalachia was Trump’s best region of the country in the primary too,
and without Appalachia, Trump would have had a much tougher time putting away Ted
Cruz. Today, Appalachia is a driving force in the Republican Party.
In looking ahead to the 2020 Election and beyond, there is some discussion between a
Rustbelt and a Sunbelt strategy for the Democratic Party, but in both cases Appalachians play
an important role in key states. Appalachians vote in several large states that are important to
win the Electoral College. Appalachia may keep states like North Carolina and Georgia

80
safely in the Republican column most elections while also giving them an advantage in Ohio
and a chance to win in Pennsylvania. No Republican has ever won the White House without
Ohio, and without Pennsylvania, the Democrat’s path to 270 becomes very difficult. Based
on these numbers, elections in Appalachia are clearly worth studying further and have
national implications.
More research is needed on expressive partisanship. In the models above, issues
clearly still mater quite a lot in elections, but they cannot account for all of the difference
between Republican and Democratic voters. However, much of the recent scholarship on
expressive partisanship focuses on how people behave when their expressive and
instrumental partisanship do not line up, and more research is needed on when they do. In
Appalachia, people both feel more at home and agree more with the Republican Party on the
issues, and the same appears to be true for other rural areas.
Further research is also needed on the urban/rural divide more generally and
Appalachia’s role in that. In many regression models, Appalachia and rural areas are
statistically significant or not significant at the same time, and in models over time, both of
their coefficients appear to be increasing together. Perhaps Appalachia is a super-rural area
that is leading rural culture in other areas through say country music. One could argue that
Appalachia or the South embody rural cultural, so perhaps other parts of rural America are
taking their cures from them. Certainly, more research is needed to better understand this
situation. Also, more research is need specifically on the Rust Belt and the Frost Belt. Both
were key in Trump’s win in 2016, but much of the Rust Belt is not very rural and lies outside
of Appalachia. At the same time, few scholars are talking about recent Republican strength in
the northern fringes of the East Coast and Midwest. Lastly, the Democratic Party can still

81
win in some parts of Appalachia, but will the national party run candidates anytime soon that
fit with the region? It is not likely.

82
References
Abramowitz, Alan I., and Kyle L. Saunders. 2011. “Is Polarization a Myth?” In
Controversies in Voting Behavior, eds. Richard G. Niemi, Herbert F. Weisberg, and
David C. Kimball. Washington, DC: CQ Press, 266-289.
Acharya, Avidit, Matthew Blackwell, and Maya Sen. 2018. Deep Roots: How Slavery Still
Shapes Southern Politics. Princeton: Princeton University Press.
Aldrich, John H. 2011. Why Parties? A Second Look. Chicago: University of Chicago
Press.
Arbour, Brian K., and Jeremy M. Teigen. 2011. “Barack Obama’s ‘‘American’’ Problem:
Unhyphenated Americans in the 2008 Elections.” Social Science Quarterly 92 (3):
563-587.
Bageant, Joe. 2007. Deer Hunting with Jesus: Dispatches from America's Class War. New
York: Broadway Books.
Beachler, Donald W. 2011. “Barack Obama and the South: demography as electoral
opportunity.” Patters of Prejudice 45 (1-2): 155-175.
Bell, Elizabeth. 2016. Fighting King Coal: The Challenges of Micromobilization in Central
Appalachia. Cambridge: Massachusetts Institute of Technology Press.
Berelson, Bernard R., Paul F. Lazarsfeld, and William N. McPhee. 1954. Voting: A Study of
Opinion Formation in a Presidential Campaign. Chicago: University of Chicago
Press.
Bianco, William T., and David T. Cannon. 2013. American Politics Today. 3rd
edition. New
York: W. W. Norton & Company.
Bickel, Robert, and Cheryl Brown. 2008. “Appalachian Counties in Appalachian States: Is
there a Distinctively Appalachian Voting Pattern?” Journal of Appalachian Studies
14 (1-2): 99-124.
Bishop, Bill. 2008. The Big Sort: Why the Clustering of Like-Minded America is Tearing
Us Apart. Boston: Houghton Mifflin Company.
Black, Earl, and Merle Black. 2003. The Rise of Southern Republicans. Cambridge:
Harvard University Press.
Bullock, Charles S. III, Donna R. Hoffman, and Ronald Keith Gaddie. 2006. “Regional
Variations in the Realignment of American Politics, 1944–2004.” Social Science
Quarterly 87: 494–518.

83
Burnham, Walter Dean. 1970. Critical Elections: And the Mainsprings of American
Politics. New York: W. W. Norton & Company.
Campbell, Angus, Phillip E. Converse, Warren E. Miller, and Donald E. Stokes. 1960. The
American Voter. Chicago: University of Chicago Press.
Campbell, John C. 1921. The Southern Highlander and His Homeland. New York: Russell
Sage Foundation.
Converse, Phillip E. 1964. “The nature of belief systems in mass publics.” In Ideology and
Discontent, ed, D. E. Apter. New York: Free Press of Glencoe, 206-261.
Cooperative Congressional Election Study. 2008-2018. https://cces.gov.harvard.edu/
(December 5, 2019)
Cramer, Katherine J. 2016. The Politics of Resentment: Rural Consciousness in Wisconsin
and the Rise of Scott Walker. Chicago: University of Chicago Press.
De Boef, Suzanna, and Paul M. Kellstedt. 2004. “The Political (and Economic) Origins of
Consumer Confidence.” American Journal of Political Science 48 no. 4 (October):
633-649.
Davis, Nicholas T., and Lilliana Mason. 2016. “Sorting and the Split-Ticket: Evidence from
Presidential and Subpresidential Elections.” Political Behavior 38: 337-354.
Downs, Antony. 1957. An Economic Theory of Democracy. New York: Harper.
Dunaway, Wilma A. 1996. The First American Frontier: Transition to Capitalism in
Southern Appalachia, 1700-1860. Chapel Hill: The University of North Carolina
Press.
Durr, Robert H. 1993. “What Moves Policy Sentiment?” American Political Science
Review 87 (1): 158-170.
Eller, Ron. 2008. “Obama’s ‘Appalachian Problem’? It’s not so Easy.” Daily Yonder.
Accessed March 1, 2019. https://www.dailyyonder.com/obamas-appalachian-
problem-its-not-so-easy./
Frank, Thomas. 2004. What’s the Matter with Kansas? How Conservatives Won the Heart
of America. New York: Metropolitan Books.
Frost, William G. 1899 “Our Contemporary Ancestors in the Southern Mountains.” Atlantic
Monthly 83 (497): 311-319.

84
Graham, Jesse, Jonathan Haidt, and Brian A. Nosek. 2009. “Liberals and Conservatives
Rely on Different Sets of Moral Foundations.” Journal of Personality and Social
Psychology 96 (5): 1029-1046.
Green, Donald, and Ian Shapiro. 1994. Pathologies of Rational Choice Theory: A Critique
of Applications in Political Science. New Haven, CT: Yale University Press.
Heineman, Kenneth J. 2008. “A Tale of Two Cities: Pittsburgh, Philadelphia, and the
Elusive Quest for a New Deal Majority in the Keystone State.” The Pennsylvania
Magazine of History and Biography 132 (4): 311-340
Hersh, Eitan D., and Clayton Nall. 2016. “The Primacy of Race in the Geography of
Income-Based Voting: New Evidence from Public Voting Records.” American
Journal of Political Science 60 (2): 289–303.
Hillygus, D. Sunshine, and Todd G. Shields. 2008. The Persuadable Voter: Wedge Issues
in Presidential Campaigns. Princeton, NJ: Princeton University Press.
Huddy, Leonie, Lilliana Mason, and Lene Aaroe. 2015. ”Expressive Partisanship:
Campaign Involvement, Political Emotion, and Partisan Identity.” American Political
Science Review 109 (1): 1-17
Inscoe, John C. 1996. Mountain Masters: Slavery Sectional Crisis Western North Carolina.
Knoxville: University of Tennessee Press.
Kephart, Horace. 1913. Our Southern Highlanders. New York: Outing Publishing
Company.
Key, V. O. Jr. 1949. Southern Politics in State and Nation. New York: Alfred A. Knopf.
Key, V. O. Jr. 1955. "A Theory of Critical Elections." The Journal of Politics 17: 3–18.
Key, V. O. Jr. 1959. “Secular Realignment and the Party System.” The Journal of Politics
21 (2): 198-210.
Knuckey, Jonathan. 2015. “The Survival of the Democratic Party outside the South: An
Update and Reassessment.” Party Politics 21 (4): 539–552.
Lewis-Beck, Michael S., William G. Jacoby, Helmut Norpoth, and Herbert F. Weisberg.
2011. The American Voter Revisited. Ann Arbor: The University of Michigan Press.
Lewis, Helen M. and Linda Johnson. 1978. Colonialism in Modern America: The
Appalachian Case. Appalachian Consortium Press.
Leip, Dave. 1980-2018. Election Atlas. https://uselectionatlas.org/ (February 15, 2018)

85
MacKuen, Michael B., Robert S. Erikson, and James A. Stimson. 1989.
“Macropartisanship.” American Political Science Review 83 (4): 1125-1142.
Mayhew, David R. 2004. Congress: The Electoral Connection. New Haven, CT: Yale
University Press.
Mason, Lilliana. 2015. “I Disrespectfully Agree: The Differential Effects of Partisan
Sorting on Social and Issue Polarization.” American Journal of Political Science 59
(1): 128-145.
Mason, Lilliana. 2018 “Ideologues Without Issues: The Polarizing Consequences of
Ideological Identities.” Public Opinion Quarterly 82 special issue: 280-301.
McKee, Seth C. 2012. “The Past, Present, and Future of Southern Politics.” Southern
Cultures 18 (3): 95-117.
McKinney, Gordon B. 1998. Southern Mountain Republicans: 1865-1900. Knoxville:
University of Tennessee Press.
McQuarrie, Michael. 2017. “The Revolt of the Rust Belt: Place and Politics in the Age of
Anger.” British Journal of Sociology 68: 120-152.
Monnat, Shannon M., and David L. Brown. 2017. “More than a Rural Revolt: Landscapes
of Despair and the 2016 Presidential Election.” Journal of Rural Studies 55:
227-236.
Morrill, Richard, Larry Knopp, and Michael Brown. 2011. “Anomalies in Red and Blue II:
Towards an Understanding of the Roles of Setting, Values, and Demography in the
2004 and 2008 U.S. Presidential Elections.” Political Geography 30: 153-168.
New York Times. 2000. Election 2000.
www.nytimes.com/topic/subject/presidential-election-of-2000
(February 15, 2018)
New York Times. 2002. Election 2002.
https://www.nytimes.com/2002/11/06/opinion/election-2002-mr-bush-s-big-
night.html
(February 15, 2018)
New York Times. 2004. Election 2004.
https://archive.nytimes.com/www.nytimes.com/ref/elections2004/2004President.html
(February 15, 2018)
New York Times. 2006. Election 2006
https:// www.nytimes.com/ref/us/politics/08RESULTS_SENANALYSIS.html
(February 15, 2018)

86
New York Times. 2008. Election Results, 2008. January, 9.
https://www.nytimes.com/elections/2008/results/president/map.html
(February 15, 2018)
New York Times. 2010. Election 2010.
https://www.nytimes.com/elections/2010/results/senate.html
(February 15, 2018)
New York Times. 2012. Election 2012.
https://www.nytimes.com/elections/2012/results/president.html
(February 15, 2018)
New York Times. 2014. Election 2014. December, 17.
https://www.nytimes.com/elections/2014/results/senate
(February 15, 2018)
New York Times. 2016. Election 2016.
https://www.nytimes.com/elections/2016/results/president
(February 15, 2018)
New York Times. 2018. Election 2018.
https://www.nytimes.com/interactive/2018/11/06/us/elections/results-dashboard-
live.html
(March 20, 2019)
O’Brien, Douglas J., and Mary Clare Ahearn. 2016. “Rural Voice and Rural Investments:
The 2016 Election and the Future of Rural Policy.” Choices 31 (4): 1-14.
Oshnock, Kevin. 2013. “The Isolation Factor: Differing Loyalties of Watauga and
Buncombe Counties during the Civil War.” North Carolina Historical Review 90
(4): 385-413.
Oshnock, Kevin. 2018. “A Northern Wedge Thrust into the Heart of the Confederacy:
Watauga, Mitchell, and Yancey Counties during the Civil War.” Manuscript
submitted for publication.
Popkin, Samuel L. 1994. The Reasoning Voter: Communication and Persuasion in
Presidential Campaigns. Chicago: University of Chicago Press.
“Quick Facts.” 2018. US Census Bureau. https://www.census.gov/ (February 15, 2018)
Rabinowitz, George, and Stuart Elaine Macdonald. 1989. “A Directional Theory of Issue
Voting.” American Political Science Review 80: 17-43.

87
Rogowski, Ronald. 2017. “Political Cleavages and Changing Exposure to Trade.” In
Essential Readings in Comparative Politics, 5th Edition, ed, Patrick H. O’Neil and
Ronald Rogowski. New York: W. W. Norton & Company.
Robinson, Tony, and Stephen Noriega. 2016. “Voter Migration as a Source of Electoral
Change in the Rocky Mountain West.” Political Geography 29: 28-39.
Rubenstein, James. 2011. The Cultural Landscape: An Introduction to Human Geography,
10th Edition. New York: Pearson.
Schaffner, Brian F. 2012. Politics, Parties, & Elections in America Political Parties and
Elections in America, 7th edition. Boston: Wadsworth.
Shapiro, Henry D. 1986. Appalachia on Our Mind: The Southern Mountains and
Mountaineers in the American Consciousness, 1870-1920. Chapel Hill: The
University of North Carolina Press.
Sheppard, Si. 2013. “Beyond the New Deal: The Postmaterialist Divide in Pennsylvania
Presidential Elections.” The Forum 11 (2): 179-207.
Sundquist, James L. 1983. Dynamics of the Party System: Alignment and Realignment of
Political Parties in the United States. Washington, D. C.: Brookings Institution
Press
Sutton, David. 2001. “No Tennessee Waltz In Appalachia: The Elections of 2000.”
Appalachian Journal 28 (3): 294-303.
Sutton, David. 2005. “‘Living Poor and Voting Rich’ in Appalachia.” Appalachian Journal
32 (3): 340-351.
Sutton, David. 2009. “The 2008 Presidential Election in Appalachia: Reading from the
Margins.” Appalachian Journal 36 (3/4): 188-198
Taylor, Steven. 2011. “Racial Polarization in the 2008 U.S. Presidential Election.” The
Western Journal of Black Studies 35 (2): 118-127.
Thomas, Walter. My Toe Valley Heritage. Bakersville, NC: Mitchell County Historical
Society, 1990.
Twenty Second Census of the United States. 2000.
Vance, J. D. 2016. Hillbilly Elegy: A Memoir of a Family and Culture in Crisis. New York:
Harper.
Walsh, Katherine Cramer. 2012. “Putting Inequality in Its Place: Rural Consciousness and
the Power of Perspective.” American Political Science Review 106 (3): 517-532.
88
Webb, James. 2005. Born Fighting: How the Scots-Irish Shaped America. New York:
Broadway Books.
Weller, Jack. 1965. Yesterday’s People: Life in Contemporary Appalachia. Lexington:
University of Kentucky Press.
White, Steven. 2019. “Race, Religion, and Obama in Appalachia.” Social Science
Quarterly 100 (1): 38-59.
Wilson, Samuel T. 1914. The Southern Mountaineers. New York: Presbyterian Home
Missions.
Wolf, Steven. 2013. “What if Appalachia were a state? Democrats would likely gain in the
Senate and Electoral College.” Daily Kos. November, 19.
https://www.dailykos.com/stories/2013/11/19/1255733/-Political-Geography-What-
if-Appalachia-Were-its-Own-State (February 15, 2018).
Wolf, Steven. 2017. “Forget 'imperial' California: Donald Trump only won the Electoral
College thanks to Appalachia.” Daily Kos. January, 4.
https://www.dailykos.com/stories/2017/1/4/1613126/-Forget-imperial-California-
Donald-Trump-only-won-the-Electoral-College-thanks-to-Appalachia (February 15,
2018).
Zaller, John R. 1992. The Nature and Origins of Mass Opinion. New York: Cambridge
University Press.
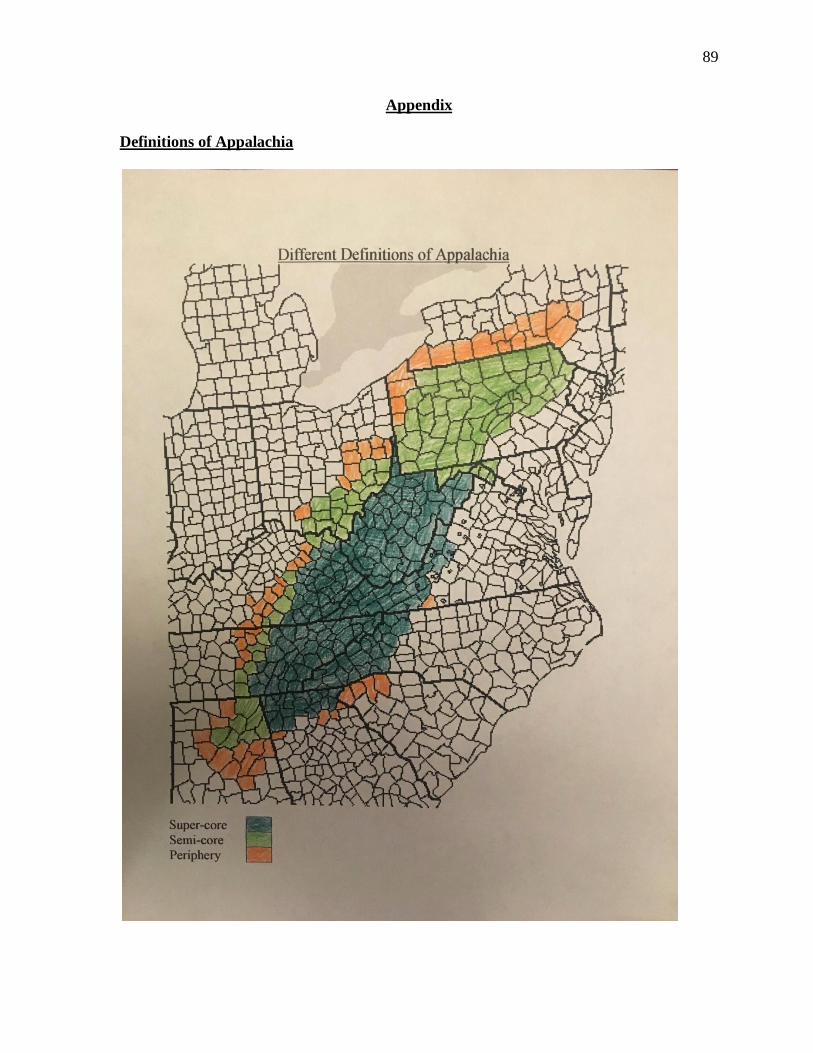
89
Appendix
Definitions of Appalachia
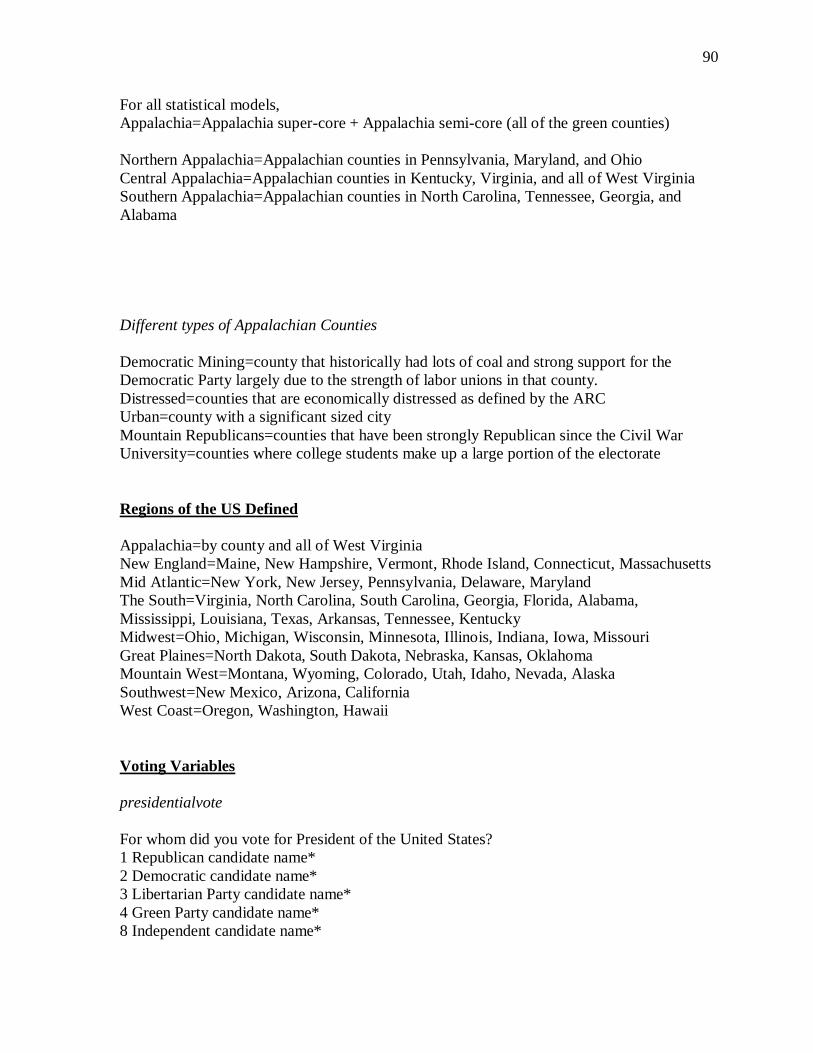
90
For all statistical models,
Appalachia=Appalachia super-core + Appalachia semi-core (all of the green counties)
Northern Appalachia=Appalachian counties in Pennsylvania, Maryland, and Ohio
Central Appalachia=Appalachian counties in Kentucky, Virginia, and all of West Virginia
Southern Appalachia=Appalachian counties in North Carolina, Tennessee, Georgia, and
Alabama
Different types of Appalachian Counties
Democratic Mining=county that historically had lots of coal and strong support for the
Democratic Party largely due to the strength of labor unions in that county.
Distressed=counties that are economically distressed as defined by the ARC
Urban=county with a significant sized city
Mountain Republicans=counties that have been strongly Republican since the Civil War
University=counties where college students make up a large portion of the electorate
Regions of the US Defined
Appalachia=by county and all of West Virginia
New England=Maine, New Hampshire, Vermont, Rhode Island, Connecticut, Massachusetts
Mid Atlantic=New York, New Jersey, Pennsylvania, Delaware, Maryland
The South=Virginia, North Carolina, South Carolina, Georgia, Florida, Alabama,
Mississippi, Louisiana, Texas, Arkansas, Tennessee, Kentucky
Midwest=Ohio, Michigan, Wisconsin, Minnesota, Illinois, Indiana, Iowa, Missouri
Great Plaines=North Dakota, South Dakota, Nebraska, Kansas, Oklahoma
Mountain West=Montana, Wyoming, Colorado, Utah, Idaho, Nevada, Alaska
Southwest=New Mexico, Arizona, California
West Coast=Oregon, Washington, Hawaii
Voting Variables
presidentialvote
For whom did you vote for President of the United States?
1 Republican candidate name*
2 Democratic candidate name*
3 Libertarian Party candidate name*
4 Green Party candidate name*
8 Independent candidate name*
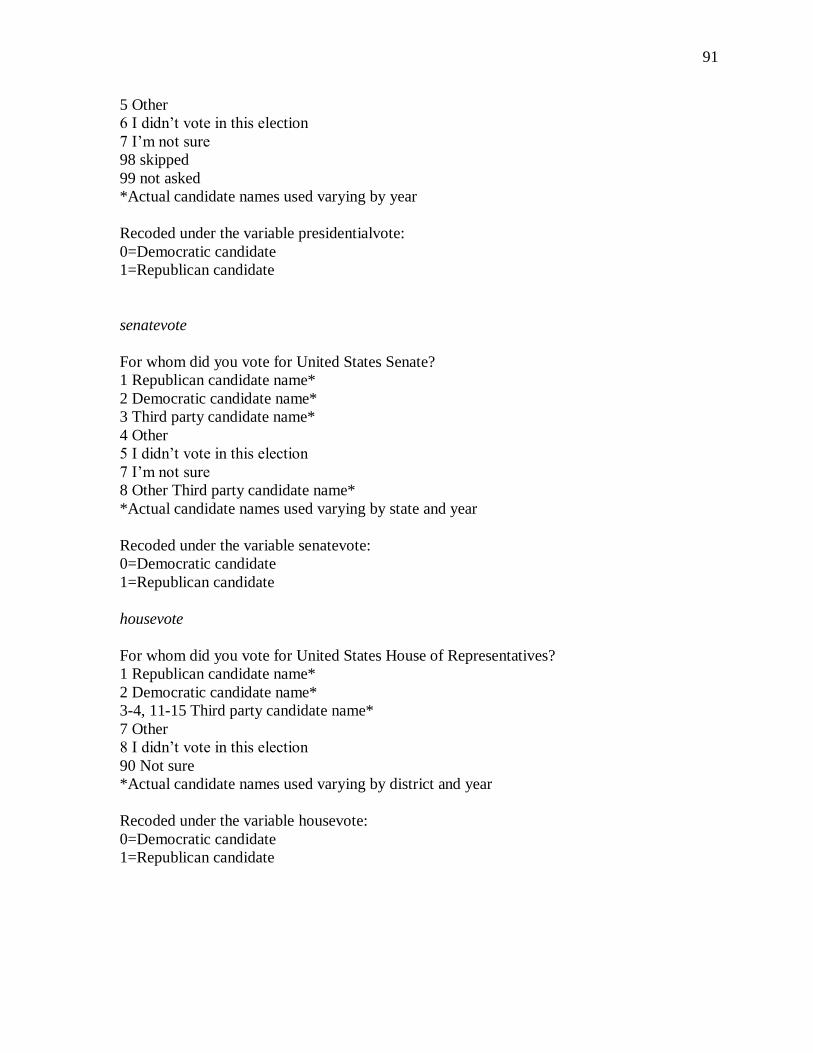
91
5 Other
6 I didn’t vote in this election
7 I’m not sure
98 skipped
99 not asked
*Actual candidate names used varying by year
Recoded under the variable presidentialvote:
0=Democratic candidate
1=Republican candidate
senatevote
For whom did you vote for United States Senate?
1 Republican candidate name*
2 Democratic candidate name*
3 Third party candidate name*
4 Other
5 I didn’t vote in this election
7 I’m not sure
8 Other Third party candidate name*
*Actual candidate names used varying by state and year
Recoded under the variable senatevote:
0=Democratic candidate
1=Republican candidate
housevote
For whom did you vote for United States House of Representatives?
1 Republican candidate name*
2 Democratic candidate name*
3-4, 11-15 Third party candidate name*
7 Other
8 I didn’t vote in this election
90 Not sure
*Actual candidate names used varying by district and year
Recoded under the variable housevote:
0=Democratic candidate
1=Republican candidate

92
governorvote
For whom did you vote for governor?
1 Republican candidate name*
2 Democratic candidate name*
7 Other
8 I didn’t vote in this race
9 I did not vote
10 Not sure
*Actual candidate names used varying by state and year
Recoded under the variable governorvote:
0=Democratic candidate
1=Republican candidate
Multinomial regressions
0=Democratic candidate
1=Republican candidate
2=non-voter
Issue Variables
gunrights
On the issue of gun regulation, do you support or oppose each of the following proposals?
Background checks for all sales, including at gun shows and over the Internet
1 Support
2 Oppose
8 skipped
9 not asked
Prohibit state and local governments from publishing the names and addresses of all gun
owners
1 Support
2 Oppose
8 skipped
9 not asked
Ban assault rifles
1 Support
2 Oppose
8 skipped
9 not asked

93
Make it easier for people to obtain concealed-carry permit
1 Support
2 Oppose
8 skipped
9 not asked
To create the gun control index, responses were added together with the response closer to
the Democratic platform being 0 and the response closer to the Republican Party platform
being 1. Therefore, the position of the Democratic Party on the index is 0 and that of the
Republican Party is 4.
prolife
Do you support or oppose each of the following proposals?
Always allow a woman to obtain an abortion as a matter of choice
1 Support
2 Oppose
8 skipped
9 not asked
Permit abortion only in case of rape, incest or when the woman’s life is in danger
1 Support
2 Oppose
8 skipped
9 not asked
Prohibit all abortions after the 20th week of pregnancy
1 Support
2 Oppose
8 skipped
9 not asked
Allow employers to decline coverage of abortions in insurance plans
1 Support
2 Oppose
8 skipped
9 not asked
Prohibit the expenditure of funds authorized or appropriated by federal law for any abortion
1 Support
2 Oppose
8 skipped
9 not asked

94
Make abortions illegal in all circumstances
1 Support
2 Oppose
8 skipped
9 not asked
To create the abortion index, responses were added together with the response closer to the
Democratic platform being 0 and the response closer to the Republican Party platform being
1. Therefore, the position of the Democratic Party on the index is 0 and that of the
Republican Party is 6.
immigration
What do you think the U.S. government should do about immigration? Select all that apply.
Grant legal status to all illegal immigrants who have held jobs and paid taxes for at least 3
years, and not been convicted of any felony crimes
1 Support
2 Oppose
8 skipped
9 not asked
Increase the number of border patrols on the U.S.-Mexican border
1 Support
2 Oppose
8 skipped
9 not asked
Grant legal status to people who were brought to the US illegally as children, but who have
graduated from a U.S. high school
1 Support
2 Oppose
8 skipped
9 not asked
Identify and deport illegal immigrants
1 Support
2 Oppose
8 skipped
9 not asked
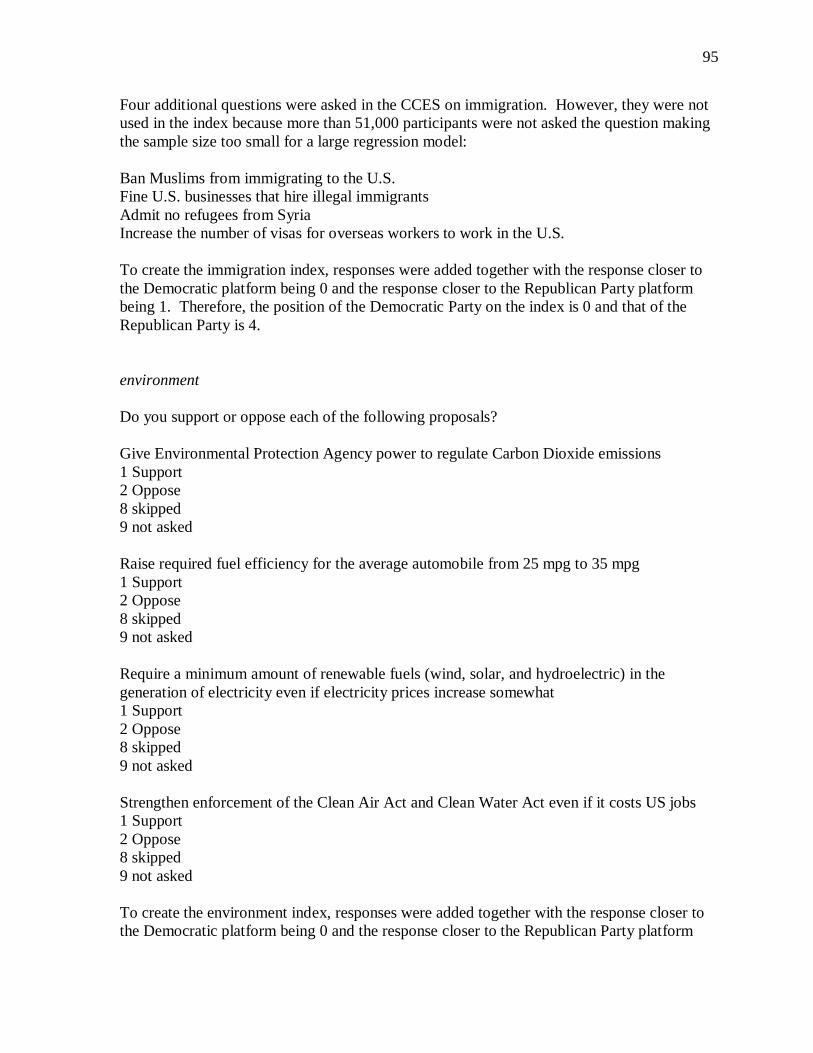
95
Four additional questions were asked in the CCES on immigration. However, they were not
used in the index because more than 51,000 participants were not asked the question making
the sample size too small for a large regression model:
Ban Muslims from immigrating to the U.S.
Fine U.S. businesses that hire illegal immigrants
Admit no refugees from Syria
Increase the number of visas for overseas workers to work in the U.S.
To create the immigration index, responses were added together with the response closer to
the Democratic platform being 0 and the response closer to the Republican Party platform
being 1. Therefore, the position of the Democratic Party on the index is 0 and that of the
Republican Party is 4.
environment
Do you support or oppose each of the following proposals?
Give Environmental Protection Agency power to regulate Carbon Dioxide emissions
1 Support
2 Oppose
8 skipped
9 not asked
Raise required fuel efficiency for the average automobile from 25 mpg to 35 mpg
1 Support
2 Oppose
8 skipped
9 not asked
Require a minimum amount of renewable fuels (wind, solar, and hydroelectric) in the
generation of electricity even if electricity prices increase somewhat
1 Support
2 Oppose
8 skipped
9 not asked
Strengthen enforcement of the Clean Air Act and Clean Water Act even if it costs US jobs
1 Support
2 Oppose
8 skipped
9 not asked
To create the environment index, responses were added together with the response closer to
the Democratic platform being 0 and the response closer to the Republican Party platform

96
being 1. Therefore, the position of the Democratic Party on the index is 0 and that of the
Republican Party is 4.
trade
Congress considers many issues. If you were in Congress would you vote FOR or AGAINST
each of the following?
Trans-Pacific Partnership Act Free trade agreement among 12 Pacific nations (Australia,
Brunei, Canada, Chile, Japan, Malaysia, Mexico, New Zealand, Peru, Singapore, and the
US).
1 For
2 Against
8 skipped
9 not asked
Since this is the only question in the CCES on trade, there is not index simply a 0 for
supporters of the free trade deal and a 1 for opponents of it. While there would be more
questions, people who support the TPP likely support free trade, the Democratic position of
Hillary Clinton and President Obama, and opponents of the agreement are either opposed to
are skeptical of free trade and therefore closer to the Republican Party of Donald Trump.
economy
OVER THE PAST YEAR the nation’s economy has ...?
1 Gotten much better
2 Gotten better
3 Stayed about the same
4 Gotten worse
5 Gotten much worse
6 Not sure
8 skipped
9 not asked
The index for economic anxiety uses only the question above which is measured by feelings
on the direction of the economy. People who see the economy improving are coded as a 0
and people who see it getting a lot worse are coded as a 4. There was also a question in the
CCES specifically about the future economy, but it only asked about expectations of
household income, and a host of research says sociotropic factors matter a lot more important
in voting than pocketbook.

97
Control Variables
rural
(created by the author)
0 Urban—a large or significant sized city. Cutoff around 400,000 for the county minus
suburbs.
1 Suburban—a suburb to a major city
2 Exurban/Small City—small cities adjacent to urban areas or independent of them.
3 Rural—lacks any significant sized city, under 120,000 population or low population
density
rural2
(Beale codes-1)
0 Metro - Counties in metro areas of 1 million population or more
1 Metro - Counties in metro areas of 250,000 to 1 million population
2 Metro - Counties in metro areas of fewer than 250,000 population
3 Nonmetro - Urban population of 20,000 or more, adjacent to a metro area
4 Nonmetro - Urban population of 20,000 or more, not adjacent to a metro area
5 Nonmetro - Urban population of 2,500 to 19,999, adjacent to a metro area
6 Nonmetro - Urban population of 2,500 to 19,999, not adjacent to a metro area
7 Nonmetro - Completely rural or less than 2,500 urban population, adjacent to a metro area
8 Nonmetro - Completely rural or less than 2,500 urban population, not adjacent to a metro
area
At first, I decided to create my own metric for the rural/urban divide because there are not
many in existence and those that are like the Beale codes tend to do a poor job of controlling
for suburban areas by, which are increasingly of focus in politics today. However, a
weakness of this version is that there are significant differences among rural counties and
some counties were difficult to classify between urban and small city and small city or rural.
The Beale codes classify both urban and most suburban areas in the same category, but this
system is still easier ot defend in scholarly works. Therefore, the 2nd
version of rural using
Beale codes was used throughout the results section.
white
What racial or ethnic group best describes you?
1 White
2 Black
3 Hispanic
4 Asian
5 Native American
8 Middle Eastern
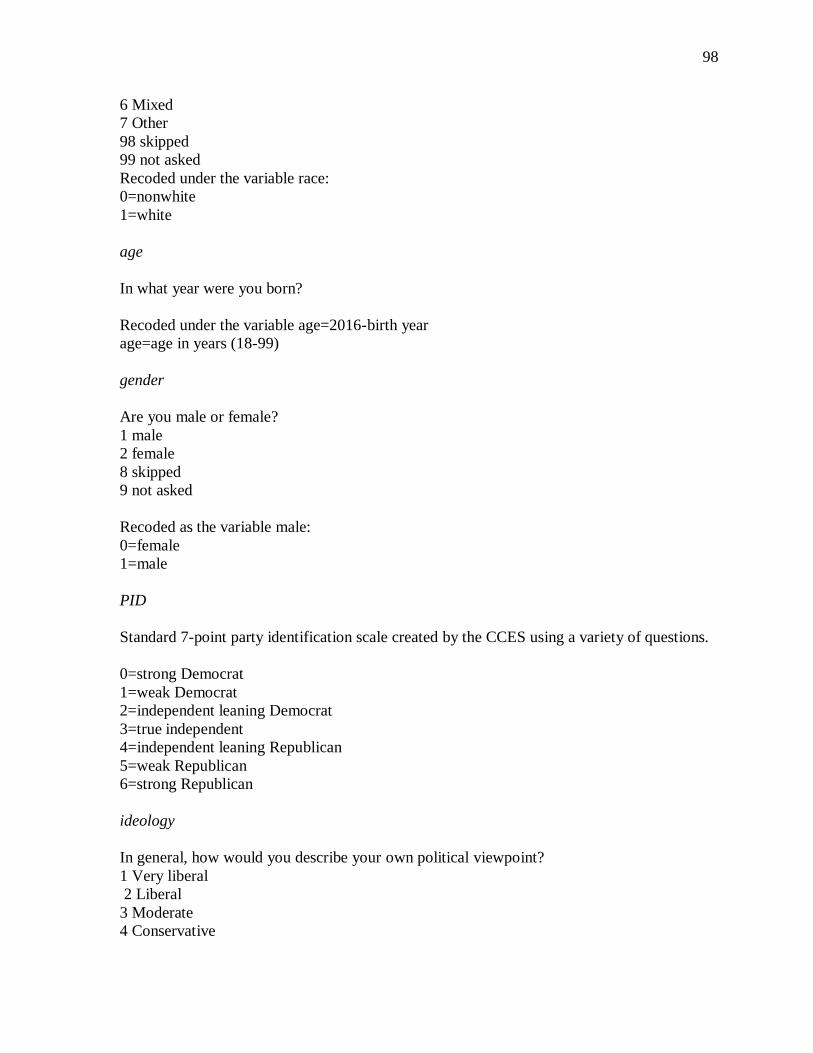
98
6 Mixed
7 Other
98 skipped
99 not asked
Recoded under the variable race:
0=nonwhite
1=white
age
In what year were you born?
Recoded under the variable age=2016-birth year
age=age in years (18-99)
gender
Are you male or female?
1 male
2 female
8 skipped
9 not asked
Recoded as the variable male:
0=female
1=male
PID
Standard 7-point party identification scale created by the CCES using a variety of questions.
0=strong Democrat
1=weak Democrat
2=independent leaning Democrat
3=true independent
4=independent leaning Republican
5=weak Republican
6=strong Republican
ideology
In general, how would you describe your own political viewpoint?
1 Very liberal
2 Liberal
3 Moderate
4 Conservative

99
5 Very conservative
6 Not sure
8 skipped
9 not asked
Recoded as the standard 5-point party identification scale:
0=very liberal
1=liberal
2=moderate
3=conservative
4=very conservative
income
Thinking back over the last year, what was your family’s annual income?
1 Less than $10,000
2 $10,000 - $19,999
3 $20,000 - $29,999
4 $30,000 - $39,999
5 $40,000 - $49,999
6 $50,000 - $59,999
7 $60,000 - $69,999
8 $70,000 - $79,999
9 $80,000 - $99,999
10 $100,000 - $119,999
11 $120,000 - $149,999
31 $150,000 or more
97 Prefer not to say
12 $150,000 - $199,999
13 $200,000 - $249,999
14 $250,000 - $349,999
15 $350,000 - $499,999
16 $500,000 or more
98 skipped
99 not asked
32 $250,000 or more
Recoded as the variable income:
0 Less than $10,000
1 $10,000 - $19,999
2 $20,000 - $29,999
3 $30,000 - $39,999
4 $40,000 - $49,999
5 $50,000 - $59,999
6 $60,000 - $69,999
7 $70,000 - $79,999
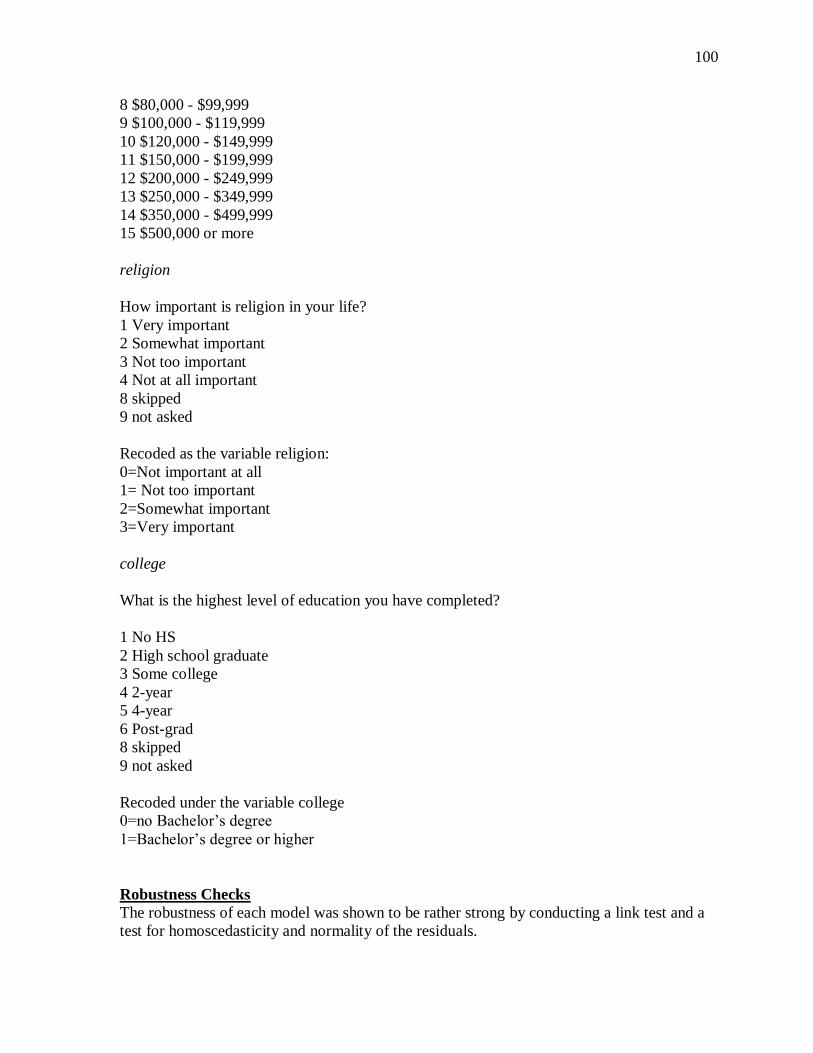
100
8 $80,000 - $99,999
9 $100,000 - $119,999
10 $120,000 - $149,999
11 $150,000 - $199,999
12 $200,000 - $249,999
13 $250,000 - $349,999
14 $350,000 - $499,999
15 $500,000 or more
religion
How important is religion in your life?
1 Very important
2 Somewhat important
3 Not too important
4 Not at all important
8 skipped
9 not asked
Recoded as the variable religion:
0=Not important at all
1= Not too important
2=Somewhat important
3=Very important
college
What is the highest level of education you have completed?
1 No HS
2 High school graduate
3 Some college
4 2-year
5 4-year
6 Post-grad
8 skipped
9 not asked
Recoded under the variable college
0=no Bachelor’s degree
1=Bachelor’s degree or higher
Robustness Checks
The robustness of each model was shown to be rather strong by conducting a link test and a
test for homoscedasticity and normality of the residuals.
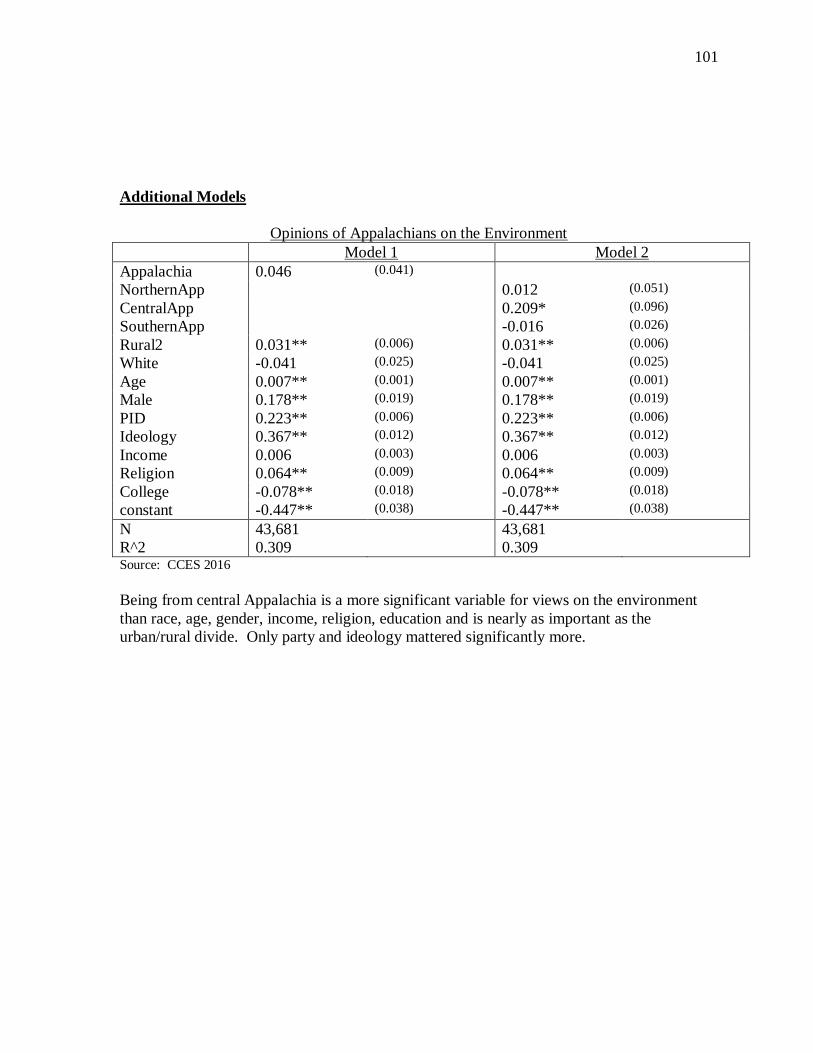
101
Additional Models
Opinions of Appalachians on the Environment
Model 1 Model 2
Appalachia 0.046 (0.041)
NorthernApp 0.012 (0.051)
CentralApp 0.209* (0.096)
SouthernApp -0.016 (0.026)
Rural2 0.031** (0.006) 0.031** (0.006)
White -0.041 (0.025) -0.041 (0.025)
Age 0.007** (0.001) 0.007** (0.001)
Male 0.178** (0.019) 0.178** (0.019)
PID 0.223** (0.006) 0.223** (0.006)
Ideology 0.367** (0.012) 0.367** (0.012)
Income 0.006 (0.003) 0.006 (0.003)
Religion 0.064** (0.009) 0.064** (0.009)
College -0.078** (0.018) -0.078** (0.018)
constant -0.447** (0.038) -0.447** (0.038)
N
R^2
43,681
0.309
43,681
0.309
Source: CCES 2016
Being from central Appalachia is a more significant variable for views on the environment
than race, age, gender, income, religion, education and is nearly as important as the
urban/rural divide. Only party and ideology mattered significantly more.

102
Voting in Different Parts of Appalachia with Racial Resentment Added in 2016
President House
Model 1 Model 2 Model 3 Model 4
AppSuperCore 1.526* (0.293) 1.768** (0.355) 1.992** (0.230) 2.107** (0.321)
AppSemiCore 1.463* (0.240) 1.376 (0.236) 1.500** (0.226) 1.465** (0.222)
AppPeriphery 0.715 (0.164) 0.722 (0.199) 1.300 (0.217) 1.431 (0.262)
Rural2 1.086** (0.020) 1.086** (0.021) 1.095** (0.017) 1.099** (0.017)
White 2.727** (0.218) 2.274** (0.213) 1.863** (0.133) 1.605** (0.120)
Age 1.005* (0.002) 1.005* (0.002) 0.998 (0.002) 0.997 (0.002)
Male 1.589** (0.092) 1.353** (0.088) 1.319** (0.067) 1.175** (0.062)
PID 2.551** (0.051) 2.433** (0.055) 2.129** (0.036) 2.006** (0.035)
Ideology 2.609** (0.108) 1.929** (0.097) 1.962** (0.074) 1.589** (0.065)
Income 1.001 (0.010) 1.005 (0.011) 1.012 (0.008) 1.015 (0.009)
Religion 1.272** (0.036) 1.252** (0.039) 1.279** (0.030) 1.263** (0.031)
College 0.563** (0.033) 0.637** (0.040) 0.828** (0.041) 0.913 (0.048)
RaceResent 1.487** (0.020) 1.249** (0.013)
constant 0.002** (0.000) 0.001** (0.000) 0.010** (0.001) 0.007** (0.001)
N
R^2 (psudo)
35,701
0.601
34,858
0.667
35,346
0.494
35,139
0.520
Logit odds ratios. Standard errors in parenthesis significance at *p < 0.05; **p<0.01
Source: CCES 2016
In the super core of Appalachia, adding racial resentment to the voting model increased the
Appalachian odds ratio by over 50% and brings it up to 1.768 which is rather substantial.
Overall, Appalachian exceptionalism is clearly driven by the heart of the region and not by
the periphery
103
Vita
Kevin Oshnock was born in Pittsburgh, Pennsylvania, to Thomas and Diane Oshnock.
He grew up in Plum, Pennsylvania and entered Westminster College to study history. In
2008, he was awarded a Bachelor of Arts degree. Afterward, he entered graduate school at
Appalachian State University and was awarded a Master of Arts degree in history in 2010.
He then taught high school social studies for the next few years before returning to
Appalachian State University to study political science. He earned a Master of Arts degree in
political science in 2019. Kevin Oshnock has as deep love of politics, history, hiking, and
the Appalachian Mountains.