recent trends and challenges for the european metropolises …€¦ · recent trends and challenges...
TRANSCRIPT
Recent trends and challenges for the European metropolises in a globalised competitive economy
Christian Vandermotten
Athens, June 12, 2008
BESTUFS Conference
Institut de Gestion de l’Environnement et d’Aménagement du Territoire
Faculté des Sciences
Main cities as centres of metropolitan areas :
metropolisation as a regional factMorphological urban areas : high density cores (> 650 inhab./sq. km). That is now only a part of the metropolitan realityFunctional urban areas : adding to the MUA a commuting basin, sending each day to the core at least 10 % of its active populatonLet us consider here only the situation of the main FUAs (more than 500.000 inhabitants)
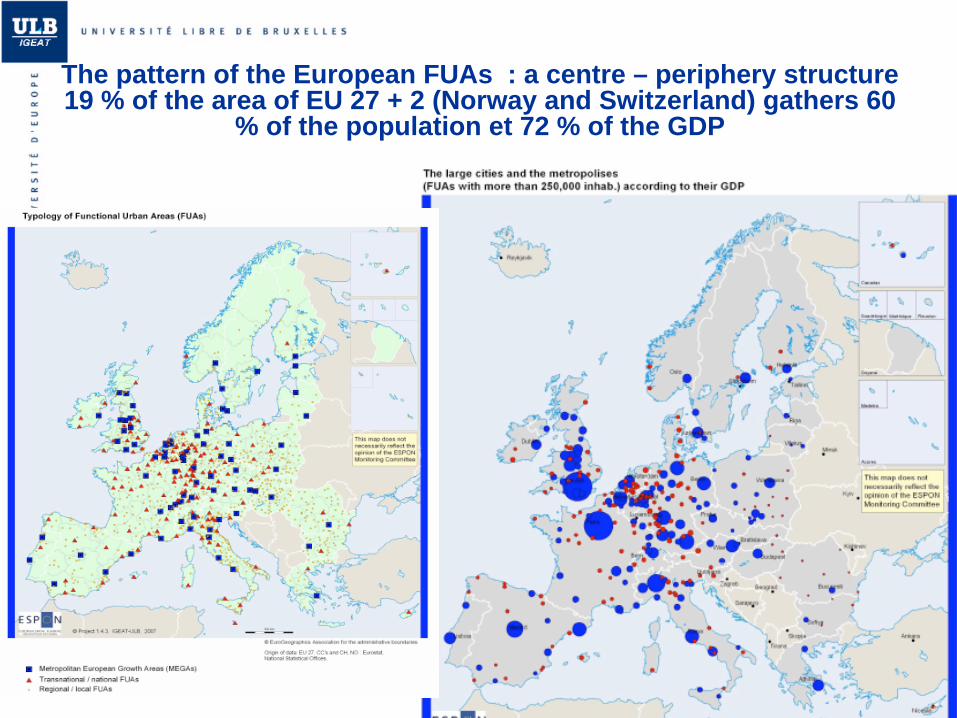
The pattern of the European FUAs : a centre – periphery structure 19 % of the area of EU 27 + 2 (Norway and Switzerland) gathers 60
% of the population et 72 % of the GDP
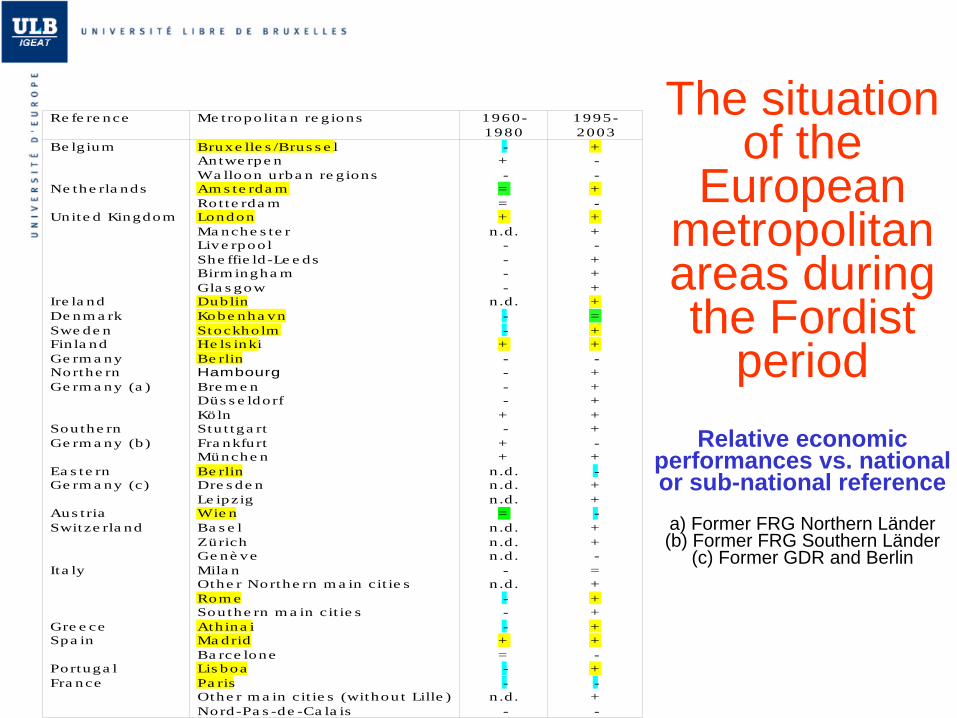
The situation of the
European metropolitan areas during the Fordist
period Relative economic
performances vs. national or sub-national reference
a) Former FRG Northern Länder (b) Former FRG Southern Länder
(c) Former GDR and Berlin
Re fe re nce Me tropo lita n re g ions 1960-1980
1995-2003
Be lg ium
Ne the rla nds
Unite d Kingdom
Ire la ndDe nm a rkSwe de nFin la ndGe rm a nyNorthe rnGe rm a ny (a )
Southe rnGe rm a ny (b )
Ea s te rnGe rm a ny (c)
Aus t riaSwitze rla nd
Ita ly
Gre e ceSpa in
Portuga lFra nce
Bruxe lle s /Brus s e lAntwe rpe nWa lloon u rba n re g ionsAm s te rda mRot te rda mLondonMa nche s te rLive rpoo lShe ffie ld -Le e dsBirm ingha mGla s gowDublinKobe nha vnStockho lmHe ls inkiBe rlinHambourgBre m e nDüs s e ldorfKölnStu t tga rtFra nkfurtMünche nBe rlinDre s de nLe ipzigWie nBa s e lZürichGe nè veMila nOthe r Northe rn m a in cit ie sRom eSouthe rn m a in cit ie sAth ina iMa dridBa rce loneLis boaPa risOthe r m a in cit ie s (withou t Lille )Nord-Pa s -de -Ca la is
-+-
==+
n.d .----
n .d .--
+----
+-
++
n .d .n .d .n .d .
=n .d .n .d .n .d .
-n .d .
---
+=--
n .d .-
+--+-++-++++=++-+++++-+-++-++-=+++++-+-+-
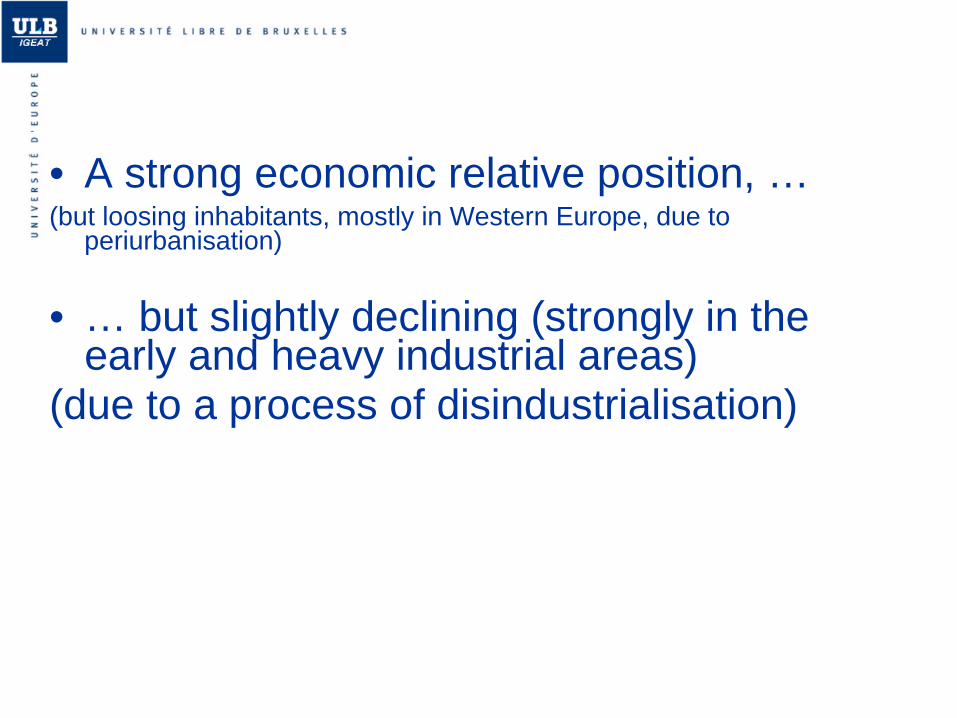
• A strong economic relative position, …(but loosing inhabitants, mostly in Western Europe, due to
periurbanisation)
• … but slightly declining (strongly in the early and heavy industrial areas)
(due to a process of disindustrialisation)
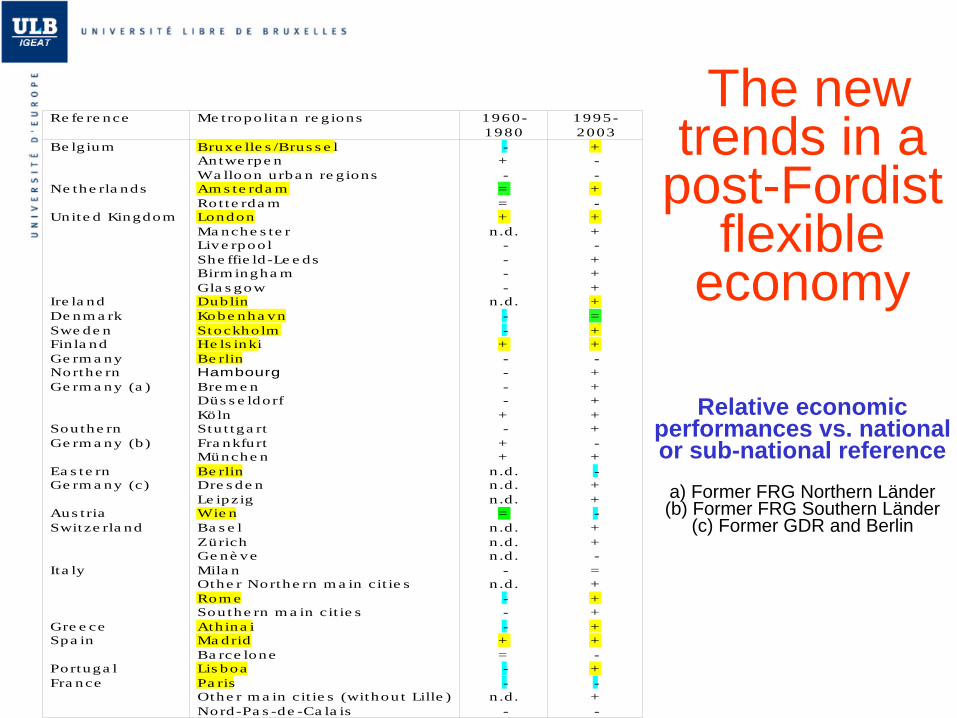
The new trends in a
post-Fordist flexible
economy
Relative economic performances vs. national or sub-national reference
a) Former FRG Northern Länder (b) Former FRG Southern Länder
(c) Former GDR and Berlin
Re fe re nce Me tropo lita n re g ions 1960-1980
1995-2003
Be lg ium
Ne the rla nds
Unite d Kingdom
Ire la ndDe nm a rkSwe de nFin la ndGe rm a nyNorthe rnGe rm a ny (a )
Southe rnGe rm a ny (b )
Ea s te rnGe rm a ny (c)
Aus t riaSwitze rla nd
Ita ly
Gre e ceSpa in
Portuga lFra nce
Bruxe lle s /Brus s e lAntwe rpe nWa lloon u rba n re g ionsAm s te rda mRot te rda mLondonMa nche s te rLive rpoo lShe ffie ld -Le e dsBirm ingha mGla s gowDublinKobe nha vnStockho lmHe ls inkiBe rlinHambourgBre m e nDüs s e ldorfKölnStu t tga rtFra nkfurtMünche nBe rlinDre s de nLe ipzigWie nBa s e lZürichGe nè veMila nOthe r Northe rn m a in cit ie sRom eSouthe rn m a in cit ie sAth ina iMa dridBa rce loneLis boaPa risOthe r m a in cit ie s (withou t Lille )Nord-Pa s -de -Ca la is
-+-
==+
n.d .----
n .d .--
+----
+-
++
n .d .n .d .n .d .
=n .d .n .d .n .d .
-n .d .
---
+=--
n .d .-
+--+-++-++++=++-+++++-+-++-++-=+++++-+-+-
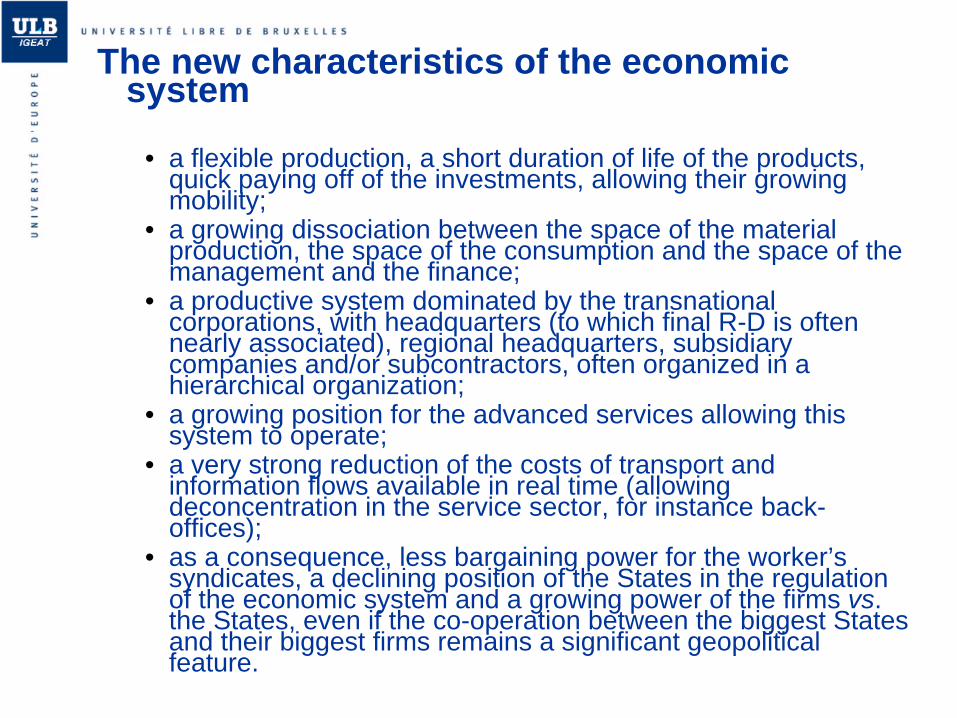
The new characteristics of the economic system
• a flexible production, a short duration of life of the products, quick paying off of the investments, allowing their growing mobility;
• a growing dissociation between the space of the material production, the space of the consumption and the space of the management and the finance;
• a productive system dominated by the transnational corporations, with headquarters (to which final R-D is often nearly associated), regional headquarters, subsidiary companies and/or subcontractors, often organized in a hierarchical organization;
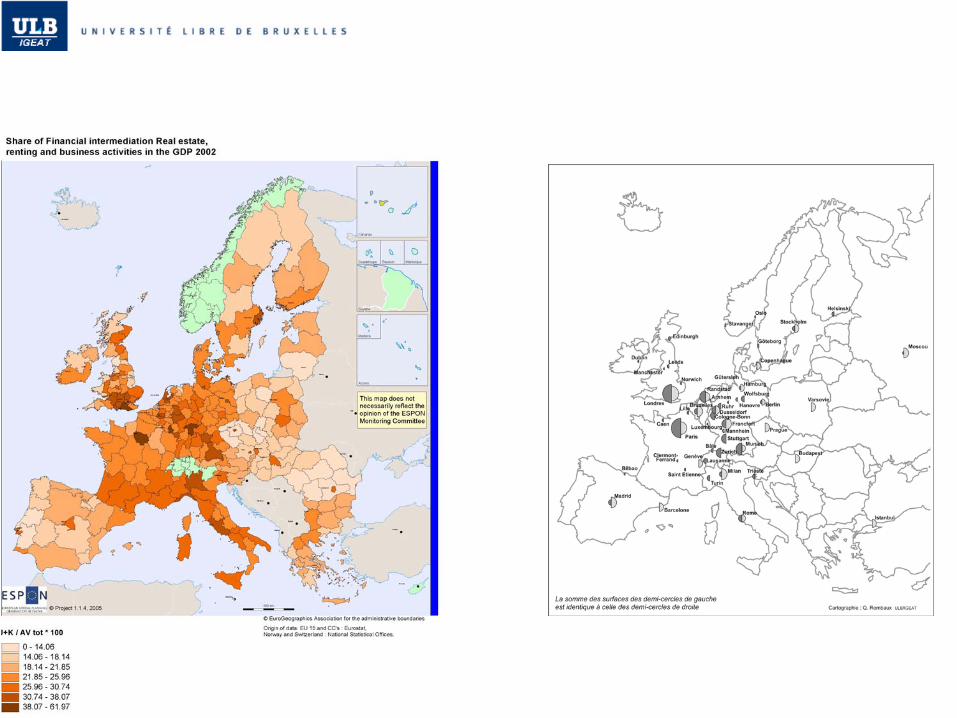
• a growing position for the advanced services allowing this system to operate;
• a very strong reduction of the costs of transport and information flows available in real time (allowing deconcentration in the service sector, for instance back- offices);
• as a consequence, less bargaining power for the worker’s syndicates, a declining position of the States in the regulation of the economic system and a growing power of the firms vs. the States, even if the co-operation between the biggest States and their biggest firms remains a significant geopolitical feature.
What are the bases for this renewal of the growth of the metropolitan areas in the globalised economy
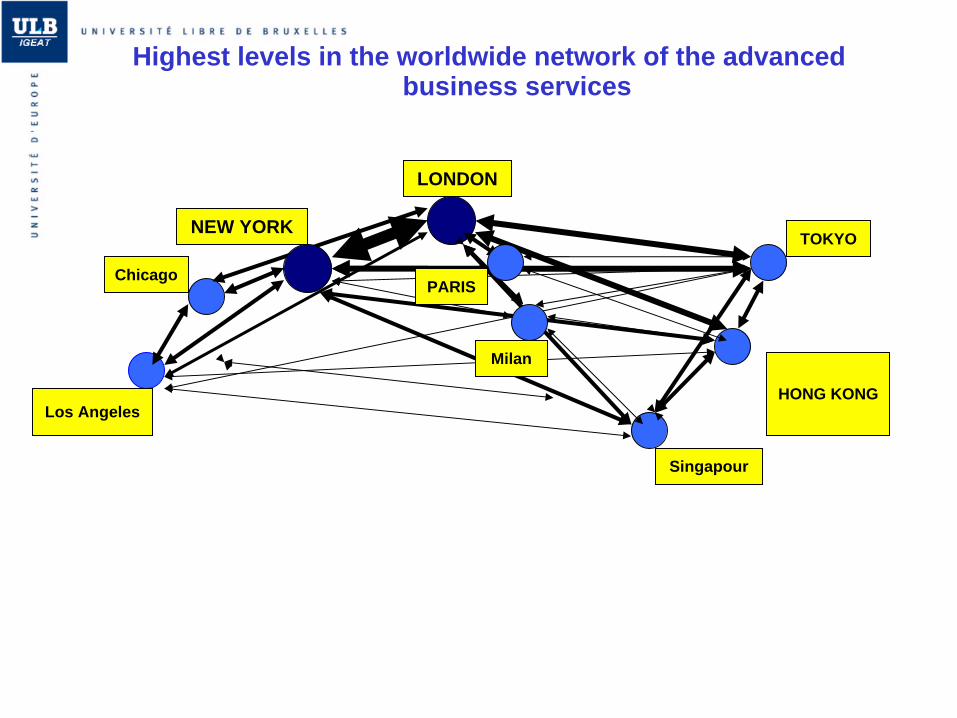
1. A strong decisional base (headquarters of big transnational corporates, strong linkages in the advanced services networks, strong position in the financial and business services sector)
LONDON
NEW YORKTOKYO
Chicago
Los Angeles
PARIS
Milan
HONG KONG
Singapour
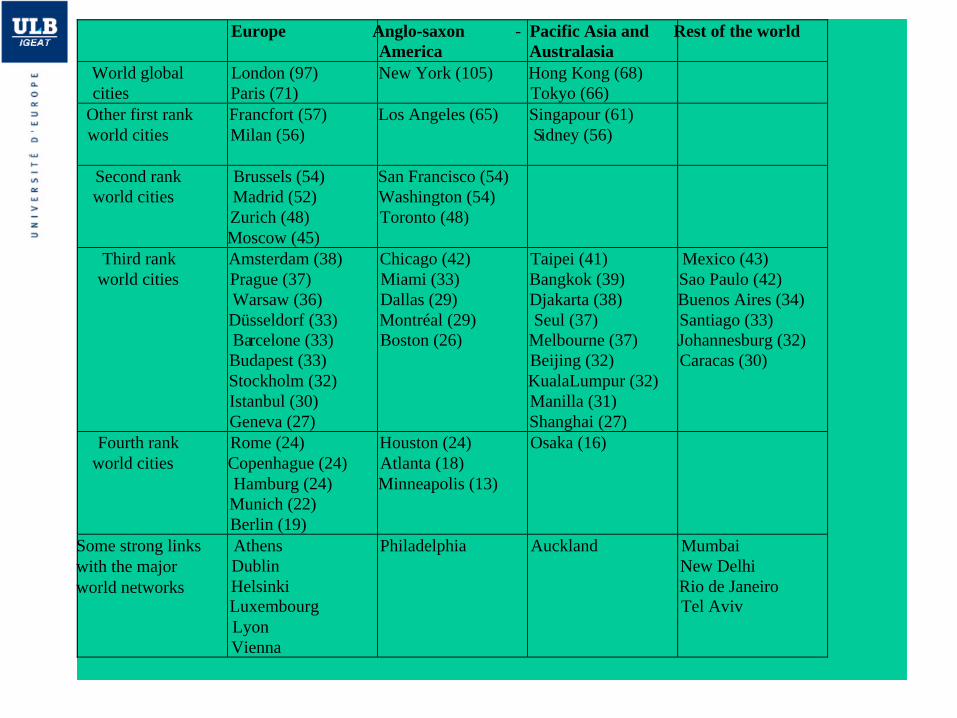
Highest levels in the worldwide network of the advancedbusiness services
Europe Anglo-saxon -America
Pacific Asia and Australasia
Rest of the world
World global cities
London (97) Paris (71)
New York (105) Hong Kong (68) Tokyo (66)
Other first rankworld cities
Francfort (57) Milan (56)
Los Angeles (65) Singapour (61) Sidney (56)
Second rank world cities
Brussels (54) Madrid (52) Zurich (48) Moscow (45)
San Francisco (54) Washington (54) Toronto (48)
Third rank world cities
Amsterdam (38) Prague (37) Warsaw (36) Düsseldorf (33) Barcelone (33) Budapest (33) Stockholm (32) Istanbul (30) Geneva (27)
Chicago (42) Miami (33) Dallas (29) Montréal (29) Boston (26)
Taipei (41) Bangkok (39) Djakarta (38) Seul (37)
Melbourne (37) Beijing (32) KualaLumpur (32) Manilla (31) Shanghai (27)
Mexico (43) Sao Paulo (42) Buenos Aires (34) Santiago (33) Johannesburg (32) Caracas (30)
Fourth rank world cities
Rome (24) Copenhague (24) Hamburg (24) Munich (22) Berlin (19)
Houston (24) Atlanta (18) Minneapolis (13)
Osaka (16)
Some strong linkswith the majorworld networks
AthensDublinHelsinkiLuxembourgLyonVienna
Philadelphia Auckland MumbaiNew DelhiRio de JaneiroTel Aviv
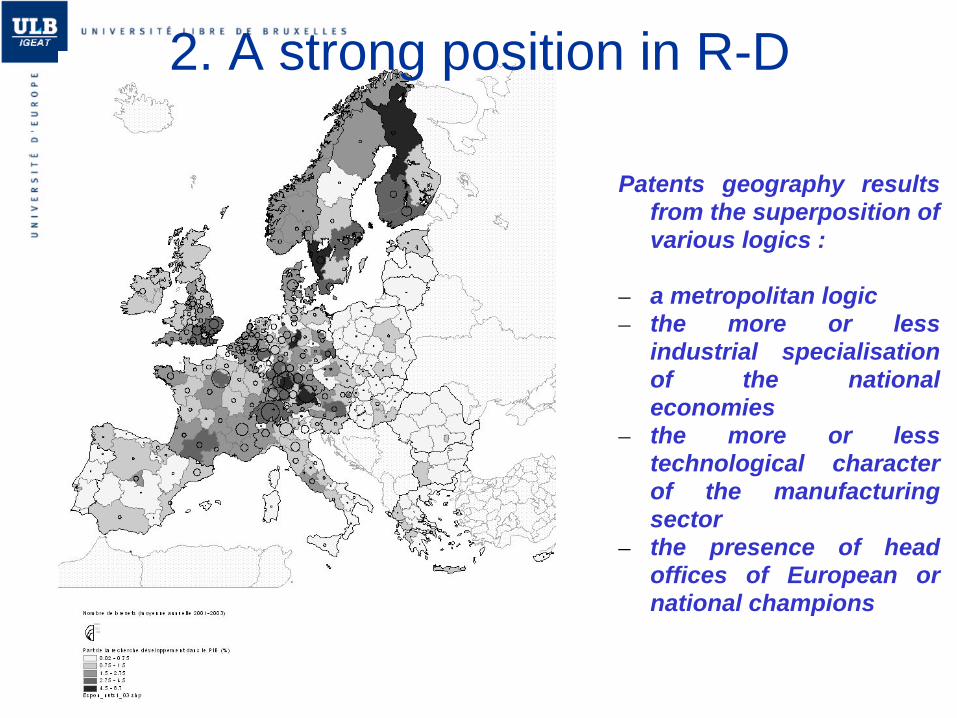
2. A strong position in R-D
Patents geography results from the superposition of various logics :
– a metropolitan logic– the more or less
industrial specialisation of the national economies
– the more or less technological character of the manufacturing sector
– the presence of head offices of European or national champions

Conclusion : the growing advantages of the decisional places
a very high level of productivity for the decisional and top-level services in the main agglomerations (for instance in Ile-de- France 60 % higher than the French average):the best multiplicator effects, linked to volume of the internal supply and demand;the best competitivity effects, linked to the best linkages with the world economy;the best productivity effects, linked to the largest and most qualified manpower basins (numerous well-educated people, “escalator” effects, cultural attractiveness, etc.), the accessibility to a large supply of services and (perhaps the most important), a large and quick access to formal and more informal flows of information (in particular, face-to-face informal contacts);
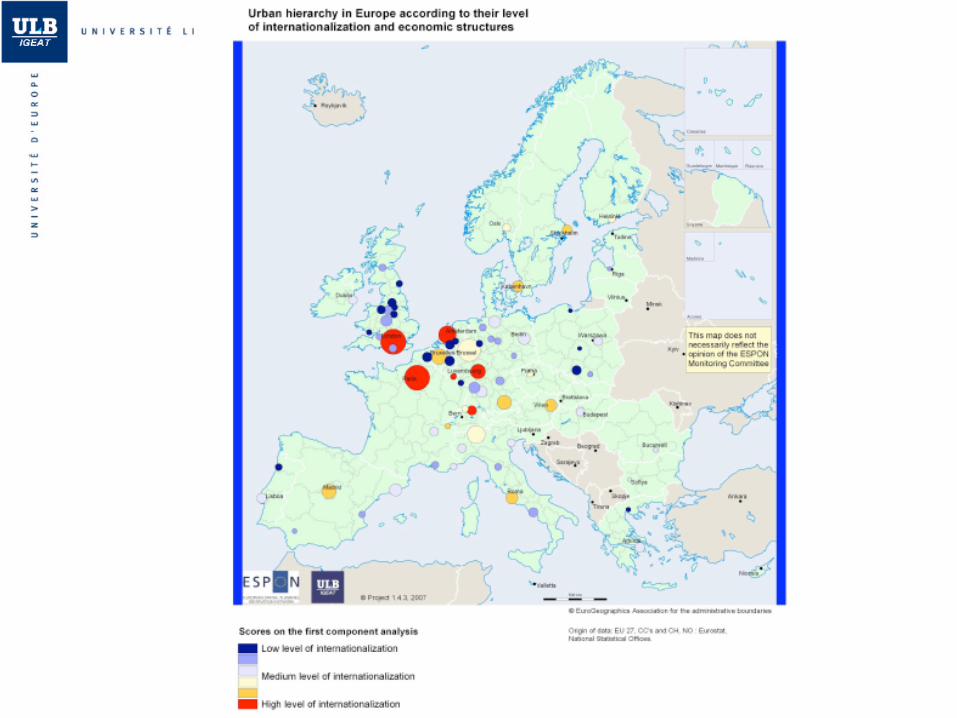
But some metropolitan areas are however performing better than
others
The functional index considers :
• The administrative position of the city ;• Its importance regarding to the location of the
main international and national firms ;• Its importance regarding to its knowledge basis ;• Its position into the transportation networks ;• Its touristic importance and heritage value.
The internationalisation index
considers :
• The location of the headquarters of the main firms (Forbes data);
• The location of the advanced services firms and their connectivity into the firms networks (GaWC data) ;
• The aerial connectivity.
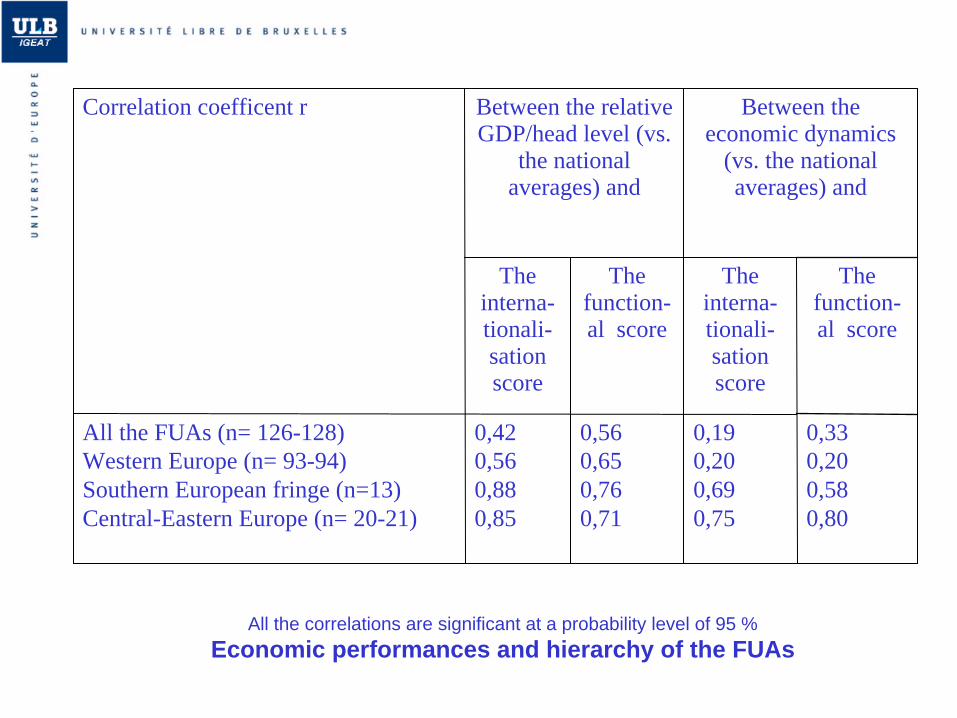
0,330,200,580,80
0,190,200,690,75
0,560,650,760,71
0,420,560,880,85
All the FUAs (n= 126-128) Western Europe (n= 93-94) Southern European fringe (n=13) Central-Eastern Europe (n= 20-21)
The function-al score
The interna- tionali- sation score
The function- al score
The interna- tionali- sation score
Between the economic dynamics
(vs. the national averages) and
Between the relative GDP/head level (vs.
the national averages) and
Correlation coefficent r
All the correlations are significant at a probability level of 95 %Economic performances and hierarchy of the FUAs
• It is a positive correlation between the GDP level and the functional position of the cities
• This correlation is the strongest in « peripheral » Europe
• The correlation between the economic dynamics of the cities and their functional position is at new the strongest in « peripheral » Europe
• In « central » Europe, in more dense urban networks, more various factors could explain local successes or failures of the cities, in particular for the second-level cities
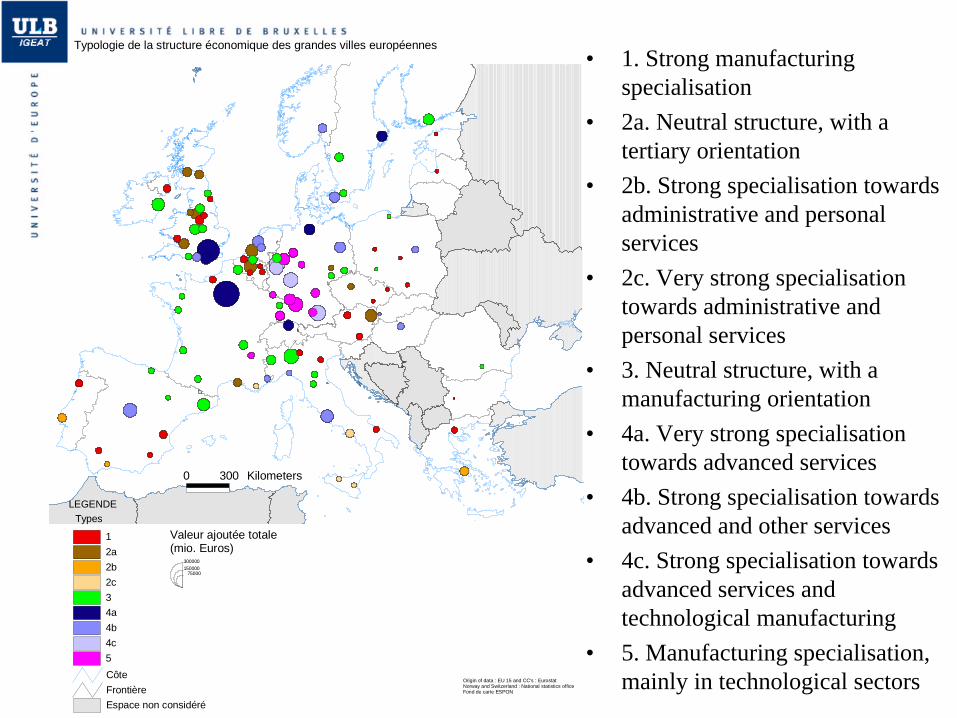
• 1. Strong manufacturing specialisation
• 2a. Neutral structure, with a tertiary orientation
• 2b. Strong specialisation towards administrative and personal services
• 2c. Very strong specialisation towards administrative and personal services
• 3. Neutral structure, with a manufacturing orientation
• 4a. Very strong specialisation towards advanced services
• 4b. Strong specialisation towards advanced and other services
• 4c. Strong specialisation towards advanced services and technological manufacturing
• 5. Manufacturing specialisation, mainly in technological sectors
0 300 Kilometers
Typologie de la structure économique des grandes villes européennes
Origin of data : EU 15 and CC's : Eurostat Norway and Switzerland : National statistics officeFond de carte ESPON
LEGENDE
Espace non considéré
CôteFrontière
12a2b2c34a4b4c5
Types
300000
75000150000
Valeur ajoutée totale(mio. Euros)
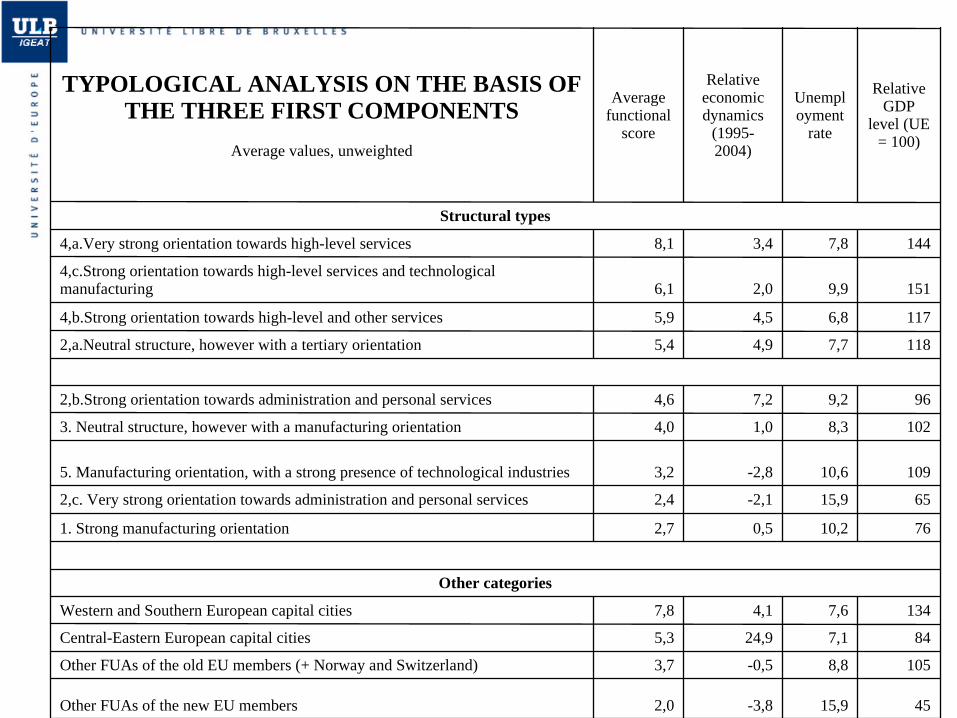
4515,9-3,82,0Other FUAs of the new EU members
1058,8-0,53,7Other FUAs of the old EU members (+ Norway and Switzerland)
847,124,95,3Central-Eastern European capital cities
1347,64,17,8Western and Southern European capital cities
Other categories
7610,20,52,71. Strong manufacturing orientation
6515,9-2,12,42,c. Very strong orientation towards administration and personal services
10910,6-2,83,25. Manufacturing orientation, with a strong presence of technological industries
1028,31,04,03. Neutral structure, however with a manufacturing orientation
969,27,24,62,b.Strong orientation towards administration and personal services
1187,74,95,42,a.Neutral structure, however with a tertiary orientation
1176,84,55,94,b.Strong orientation towards high-level and other services
1519,92,06,14,c.Strong orientation towards high-level services and technological manufacturing
1447,83,48,14,a.Very strong orientation towards high-level services
Structural types
Relative GDP
level (UE = 100)
Unempl oyment
rate
Relative economic dynamics
(1995- 2004)
Average functional
score
TYPOLOGICAL ANALYSIS ON THE BASIS OF THE THREE FIRST COMPONENTS
Average values, unweighted
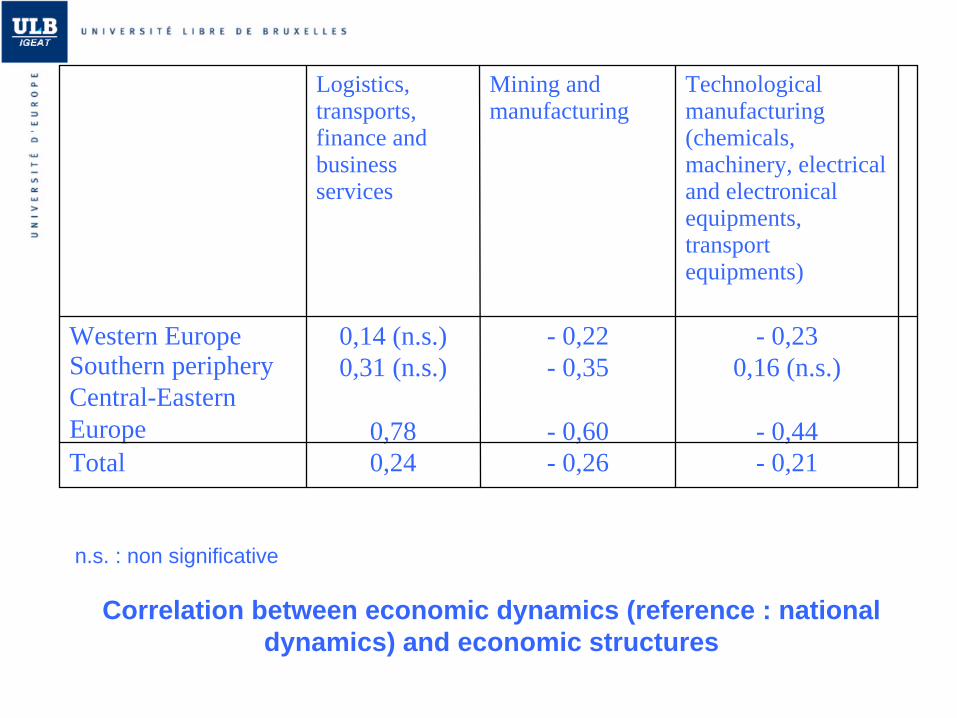
- 0,21- 0,260,24Total
- 0,230,16 (n.s.)
- 0,44
- 0,22- 0,35
- 0,60
0,14 (n.s.) 0,31 (n.s.)
0,78
Western Europe Southern peripheryCentral-Eastern Europe
Technological manufacturing (chemicals, machinery, electrical and electronical equipments, transport equipments)
Mining and manufacturing
Logistics, transports, finance and business services
n.s. : non significative
Correlation between economic dynamics (reference : national dynamics) and economic structures
Conclusions
• The most internationalised metropolitan areas benefit from good economic performances, but inside the logics of each national economy. These performances are however lower in the most industrial internationalised cities, e.a. the German metropolises
• The international orientation and the functional scores are higher in the Western European major cities than in the «peripheral » European ones, but it is in this part of Europe that the dynamics and the relative advantages of the capital cities are the strongest
• The most peripheral, industrial and less international-oriented cities present less good performances, with the exception of the « peripheral » capital cities, where the metropolisation processes are very strong
• An industrial orientation is globally a handicap for the growth of the cities, even if manufacturing is oriented towards technological industries. This «manufacturing handicap » is the worse in Central-European cities
• In Western Europe, the dynamics of the second-level cities seems to be more linked to various factors, including the dynamics of their regional environment
• The most peripheral and the most industrial cities suffer globally from the highest unemployment levels

What can help for performing better ?
1. The local conditions : the immaterial factors are more and more important
a. An high level tertiary education and R-D systemb. A good quality of life, environment and urban
fabrics and renewalc. Good public transportsd. Security (what implies weak social dualisation)
e. The quality of heritage and culturef. A strong position in the national and international
networks: the weight of the national history (with the same population, Rhine-Ruhr doesn’t compete as well as Paris or London in the international networks)
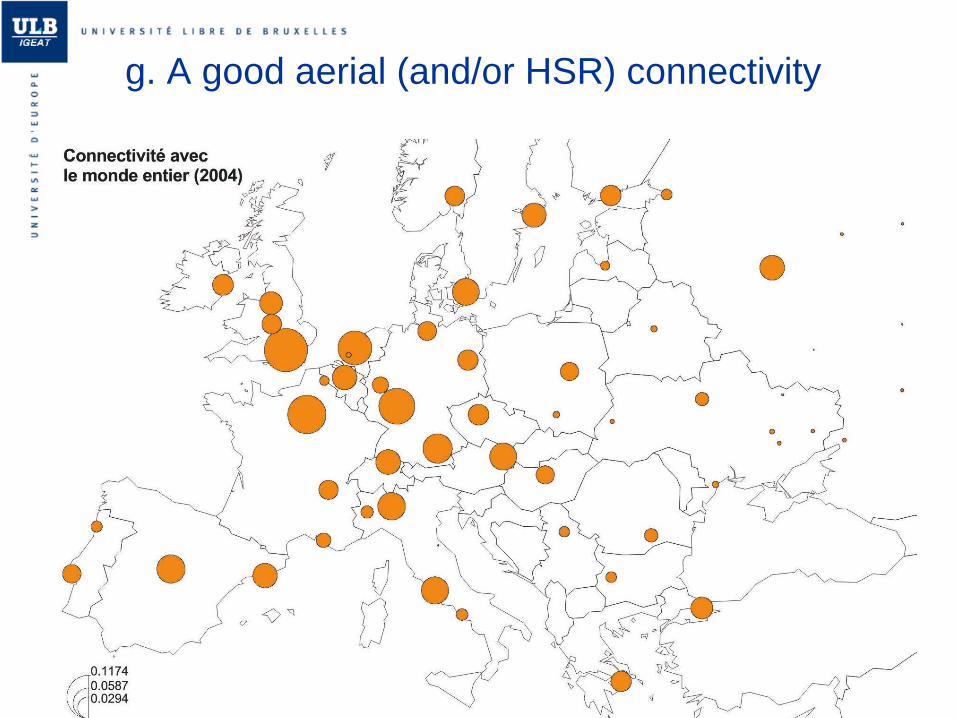
g. A good aerial (and/or HSR) connectivity
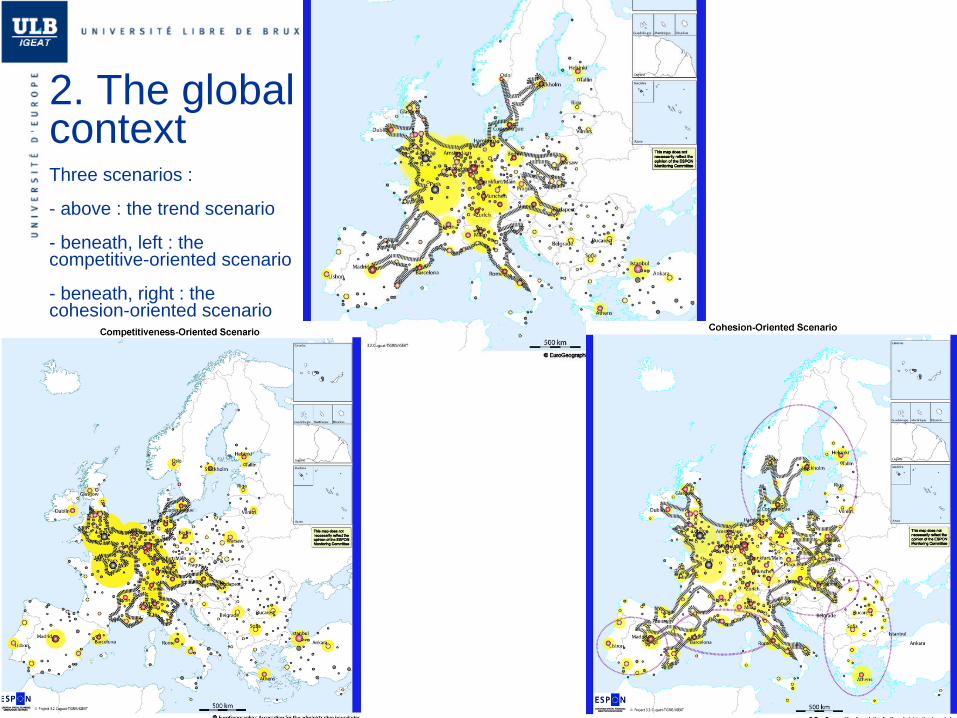
2. The global context Three scenarios :
- above : the trend scenario
- beneath, left : the competitive-oriented scenario
- beneath, right : the cohesion-oriented scenario

Which threats ?

1. The risks of the benchmarking : the same receipts for each city and the cult of the « big projects »
2. The dualisation threat
The labor market of the metropolitan areas asks more and more high-specialised and
very well educated people….
… but the metropolitan areas gather more and more poor and low educated
immigrants (even if they are attracting too for young well educated)
#
#
#
#
#
#
#
#
#
#
#
#
#
#
#
#
#
#
#
#
#
#
#
#
#
#
#
#
#
#
#
#
#
#
#
#
#
#
#
#
0 400 Kilometers
The content of this mapdoes not necessarily reflect the opînion ofthe espon monitoringcommittee
Origin of data : EU 15 and CC's : own calculation based on Eurostat dataNorway and Switzerland : National statistics officeSource : ESPON DatabaseCratography : IGEAT-ULB
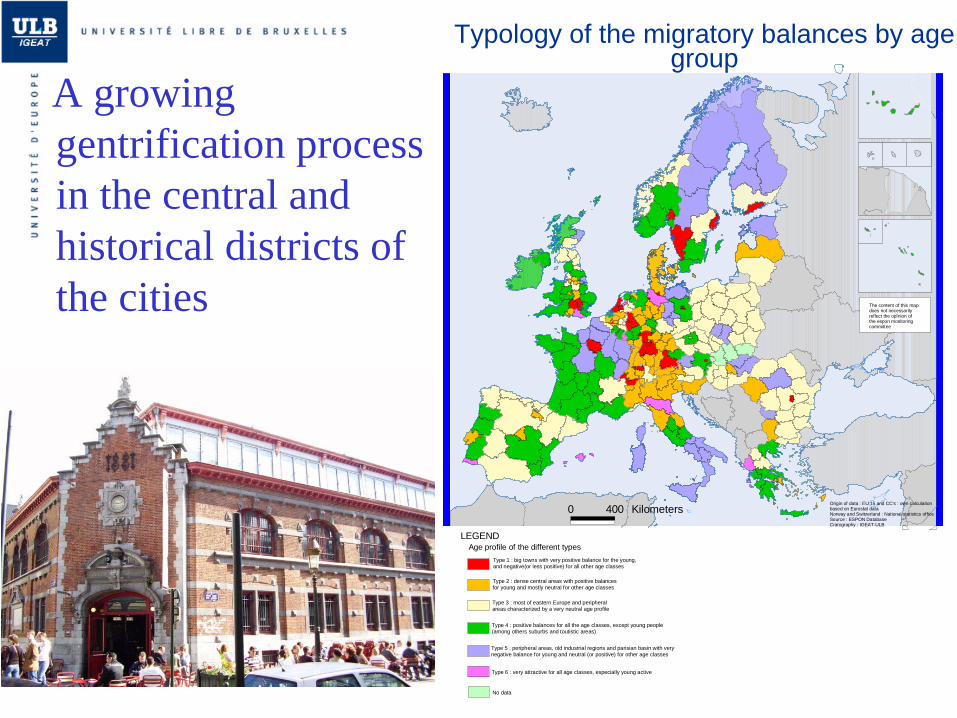
LEGEND
Type 1 : big towns with very positive balance for the young, and negative(or less positive) for all other age classes
Type 2 : dense central areas with positive balancesfor young and mostly neutral for other age classes
Type 3 : most of eastern Europe and peripheral areas characterized by a very neutral age profile
Type 4 : positive balances for all the age classes, except young people (among others suburbs and toutistic areas)
Type 5 : peripheral areas, old industrial regions and parisian basin with very negative balance for young and neutral (or positive) for other age classes
Type 6 : very attractive for all age classes, especially young active
No data
Age profile of the different types
Typology of the migratory balances by age group
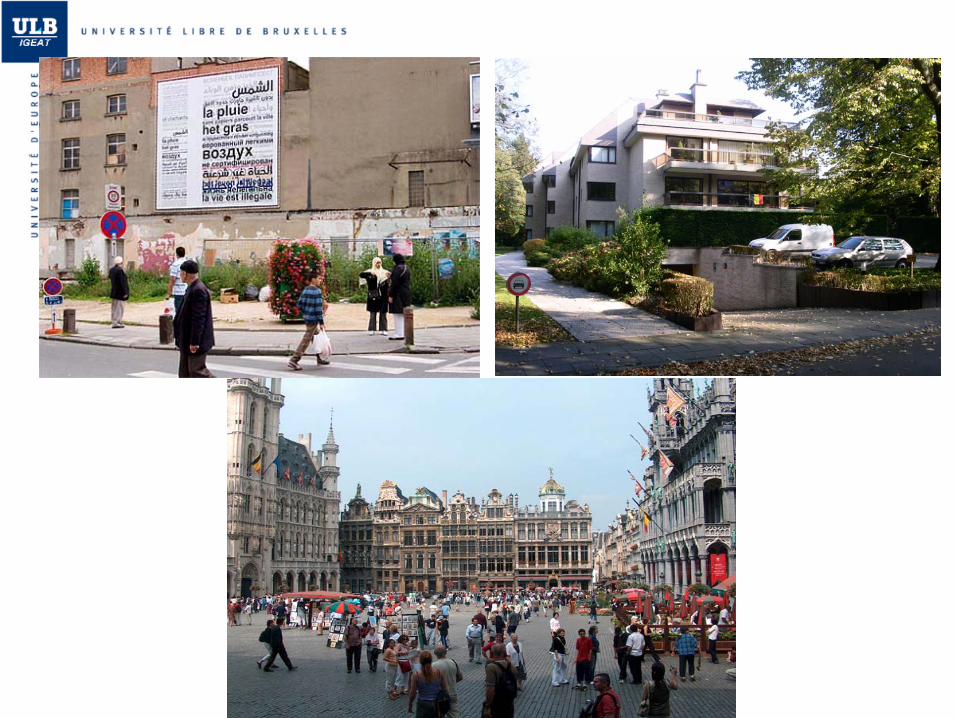
A growing gentrification process in the central and historical districts of the cities
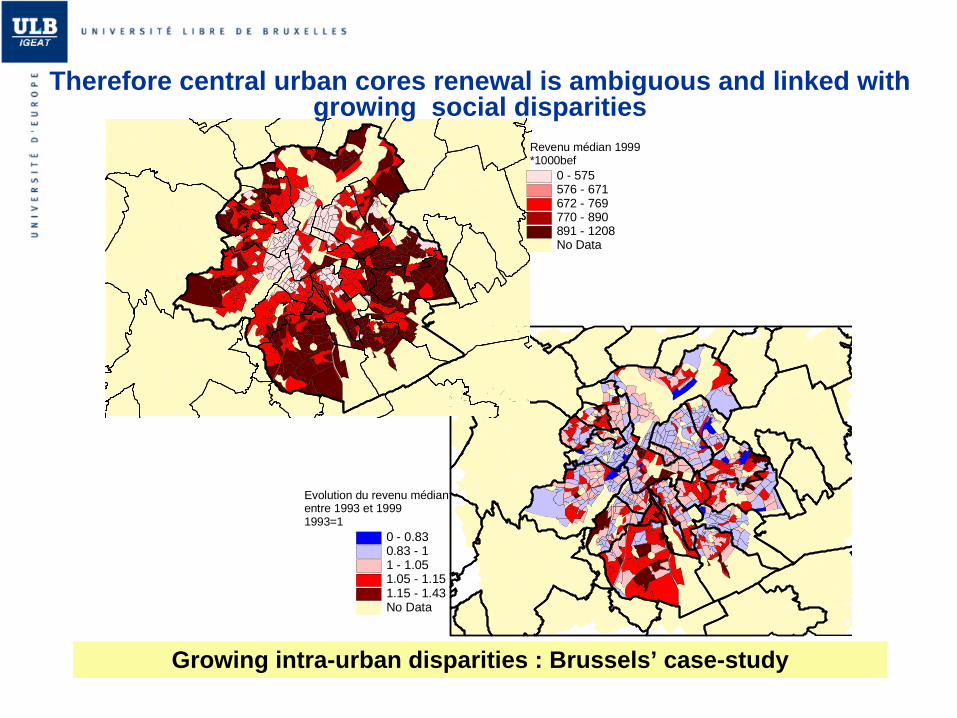
Growing intra-urban disparities : Brussels’ case-study
0 - 0.830.83 - 11 - 1.051.05 - 1.151.15 - 1.43No Data
Evolution du revenu médian entre 1993 et 19991993=1
0 - 575576 - 671672 - 769770 - 890891 - 1208No Data
Revenu médian 1999*1000bef
Therefore central urban cores renewal is ambiguous and linked with growing social disparities

3. The core-periphery relations and the lack of metropolitan governance,
… in the frame of a persisting periurbanisation process (affecting now not only residence but more and more some parts of the business services sector : logistics, services for enterprises, etc.)
General conclusions
• Globalisation processes tend to reinforce the strongest European places and regions, that is benefiting for the main metropolitan areas
• These processes weaken regional and social cohesion at different scales, from the global to the local
• European structural politics are not strong enough for avoiding these fundamental trends, as much as they tend today more towards competitiveness than towards cohesion
• In this framework, metropolitan regions are more and more looking to inter-metropolises competition, using the tools of the benchmarking, with the risk of proposing everywhere the same kinds of projects, and so not changing really the ranking of the comparative advantages of the cities, giving only advantages to the international investors at the expense of the public funding
• The global positive economic evolution of the metropolitan areas doesn’t solve the question of a growing dualisation process
• And the question of the metropolitan governance remains also often unsolved