recent trends in customer and supplier payment periods
TRANSCRIPT

Recent Trends in Customer and Supplier Payment Periods November 2019
ECCBSO FSA WG Page 1
News release:
RECENT TRENDS IN CUSTOMER AND SUPPLIER PAYMENT PERIODS:
A Statistical Analysis based on Accounting Data
2019 November
Recent Trends in Customer and Supplier Payment Periods November 2019
ECCBSO FSA WG Page 2
Members of the Financial Statement Analysis Working Group (FSA WG):
Merve Artman (Chairwoman)
Central Bank of the Republic of Turkey
Carla Ferreira (Vice-chairwoman)
Bank of Portugal
Eva Esteban
Bank of Spain
Carolin Schuerg
Deutsche Bundesbank
Valentina Nigro
Bank of Italy
Letizia Sampoli
Cerved Group Spa
Pierrette Heuse
National Bank of Belgium
Eray Gökgör
Central Bank of the Republic of Turkey
Mariana Oliveira
Bank of Portugal
Ewa Sokolowska
National Bank of Poland
Heraklios Lykiardopoulos
Bank of Greece
Hélène Charasson-Jasson
Bank of France
Disclaimer
The views expressed in this paper are those of the authors and do not necessarily represent those of
the ECCBSO or those of the institutions involved. The trade credit indicators used in this study are
calculated based on a harmonized definition. Nevertheless, the publication reflects national charts of
accounts, which may not be completely harmonized.

Recent Trends in Customer and Supplier Payment Periods November 2019
ECCBSO FSA WG Page 1
Contents
1. Motivation .................................................................................................................................. 1
2. Summary Table and Key Results ................................................................................................ 1
3. Detailed results .......................................................................................................................... 3
3.1. DSO and DPO results in 2017, by sector and size ................................................................................................ 3
3.3. DSO and DPO, comparison between 2000, 2008 and 2017 ................................................................................ 6
Annexes ............................................................................................................................................. 10
Annex I: Methodology....................................................................................................................... 10
Data description ....................................................................................................................................................... 10
Ratio Definition ........................................................................................................................................................ 10
Annex II – Participating countries and sector/size criteria ............................................................... 11
Annex III – Number of companies by country and size (2017) ......................................................... 12
Annex IV – Number of companies by country and sector (2017) ..................................................... 13
Annex V – Explanation about legislation in countries ...................................................................... 13
Recent Trends in Customer and Supplier Payment Periods November 2019
ECCBSO FSA WG Page 1
1. Motivation
Trade credits play a major role in the financing of the companies, and an essential financial device
in business. The motivation for the creditor is often a marketing consideration for further business
relationships in the future, while for the debtor, trade credit may be used as an alternative to other
credit channels. It gives the company the time to control the purchased goods or services in due time
or the possibility of using an asset as input in the production process before it has been paid.
However, these business-to-business payments only played a secondary role in financial statement
analysis in the past. That is why Financial Statement Analysis Working Group (FSA WG) assesses the
trade credit collection and payment periods by means of two key financial ratios: Days Sales
Outstanding (DSO) and Days Payables Outstanding (DPO).
This news release aims at presenting the most recent trends in trade credits of European non-
financial corporations, using accounting information provided by financial statements. Results relate
to three sectors, all sizes except micro and the eight countries participating in the working group:
Belgium, Germany, France, Italy, Poland, Portugal, Spain and Turkey. This report covers the results of
the previous report1 and extends the period of analysis to 2017 (the latest year for which data are
available).
2. Summary Table and Key Results
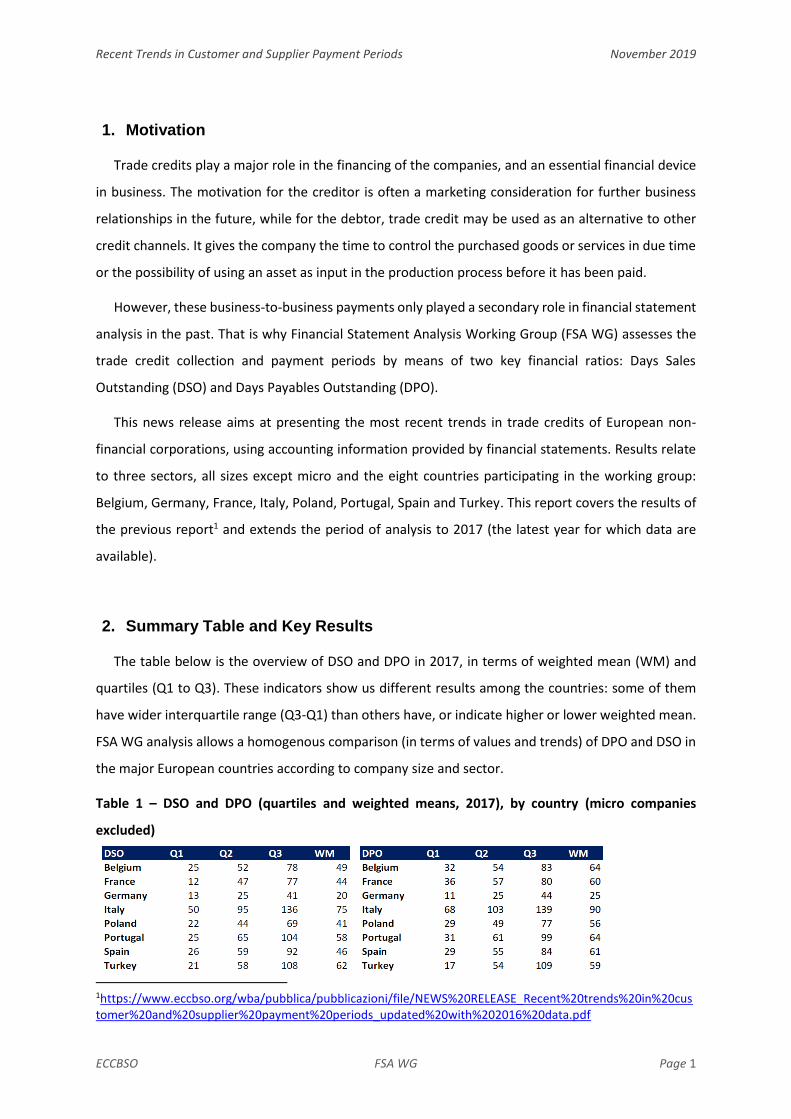
The table below is the overview of DSO and DPO in 2017, in terms of weighted mean (WM) and
quartiles (Q1 to Q3). These indicators show us different results among the countries: some of them
have wider interquartile range (Q3-Q1) than others have, or indicate higher or lower weighted mean.
FSA WG analysis allows a homogenous comparison (in terms of values and trends) of DPO and DSO in
the major European countries according to company size and sector.
Table 1 – DSO and DPO (quartiles and weighted means, 2017), by country (micro companies
excluded)
1https://www.eccbso.org/wba/pubblica/pubblicazioni/file/NEWS%20RELEASE_Recent%20trends%20in%20customer%20and%20supplier%20payment%20periods_updated%20with%202016%20data.pdf

Recent Trends in Customer and Supplier Payment Periods November 2019
ECCBSO FSA WG Page 2
There are some key ideas that can be kept in mind from our study concerning the customer and
supplier payment periods of non-financial corporations. Likewise, the previous news release, the
shortest payment days are observable in Germany, whereas longest ones are observable in Italy, other
countries showing intermediate values. As was already concluded in previous works of the Working
Group, this variety of behaviors can be explained by many factors: at the macroeconomic level, the
difference in legislations and payment cultures and at the microeconomic level, the difference in
corporation structure (e.g. firms belonging to a group or not), in bargaining power and in commercial
policy.
In 2017, large companies have the shortest days in terms of customer payments and the difference
between large firms and small and medium sized ones is more obvious in customer than supplier
payments. Construction is the sector with the longest payment days for almost all countries and the
highest volatility through the observed period. In 2017, more than 50% of companies in all countries,
except Italy and Portugal, have average payment periods below the legal limits, exceeding 75% in
Germany.
Most countries have managed to decrease all quartile values of these indicators from 2008 to 2017.
In 2017, interquartile ranges are lower for supplier than for customer payments. Some countries have
seen an increasing percentage of companies with payment periods exceeding 90 days. However, we
can observe the decline in both customer and supplier payments over 90 days for Portugal, Spain and
France from 2008 to 2017.

Recent Trends in Customer and Supplier Payment Periods November 2019
ECCBSO FSA WG Page 3
3. Detailed results
3.1. DSO and DPO results in 2017, by sector and size
Figures 1 and 2 show the weighted means of DSO2 for all countries at size and sector
breakdown. The shortest delays belong to large companies, however in some countries like Belgium
and France, there is a small dispersion between size classes. In Spain, Italy and Portugal the differences
between size classes are more significant, mainly between large companies, on one hand, and small
and medium-sized ones, on the other.
Figure 1 – DSO (weighted means, 2017), by country and size (micro companies excluded)
Italian and Turkish large companies have the highest DSO values. Small companies have the
longest delays in almost all countries, except in Spain and Poland (with very small differences when
compared with medium-sized companies). Overall, small and medium-sized companies have similar
collecting behaviors, which are separated from large companies.
DSO by sector show that construction has the longest delay for almost all countries except
Turkey. Belgium and Germany present their lowest DSO values in the manufacturing sector, while
for all the other countries the trade sector shows the lowest results.
2 Micro companies are excluded.
49
20
44
75
41
58
46
62
0
20
40
60
80
100
120
Belgium Germany France Italy Poland Portugal Spain Turkey
Small Medium-sized Large Total
Recent Trends in Customer and Supplier Payment Periods November 2019
ECCBSO FSA WG Page 4
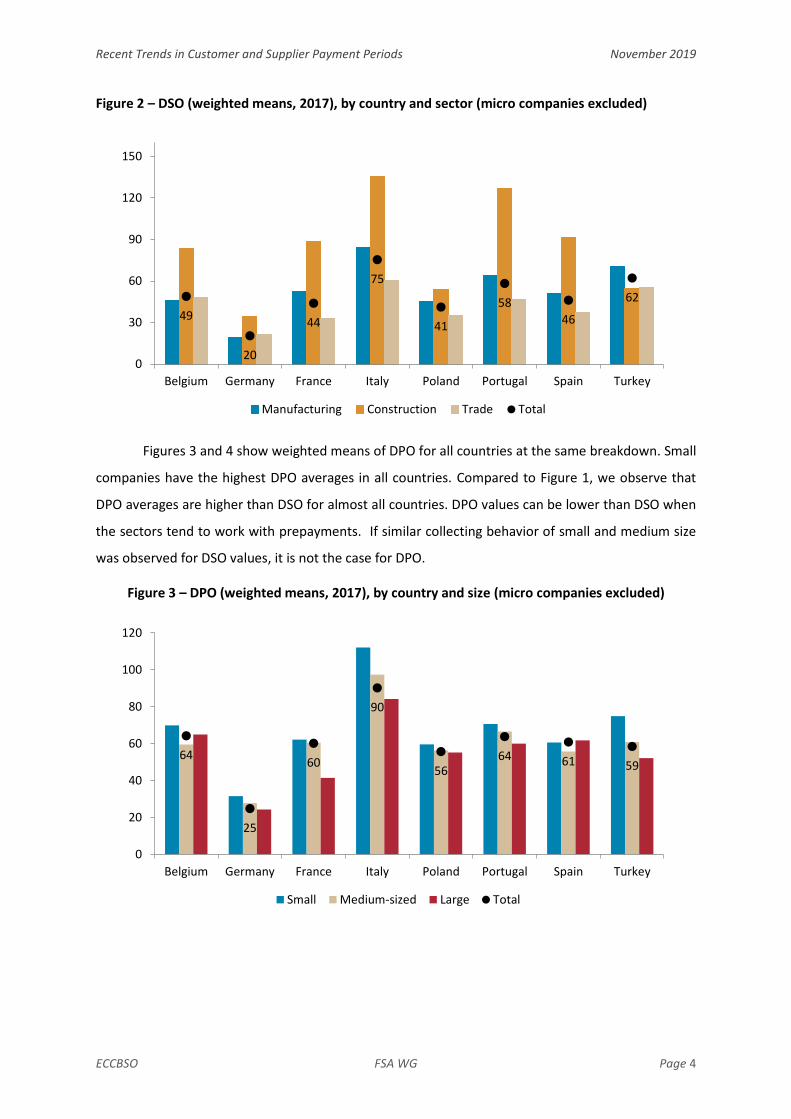
Figure 2 – DSO (weighted means, 2017), by country and sector (micro companies excluded)
Figures 3 and 4 show weighted means of DPO for all countries at the same breakdown. Small
companies have the highest DPO averages in all countries. Compared to Figure 1, we observe that
DPO averages are higher than DSO for almost all countries. DPO values can be lower than DSO when
the sectors tend to work with prepayments. If similar collecting behavior of small and medium size
was observed for DSO values, it is not the case for DPO.
Figure 3 – DPO (weighted means, 2017), by country and size (micro companies excluded)
49
20
44
75
41
58
46
62
0
30
60
90
120
150
Belgium Germany France Italy Poland Portugal Spain Turkey
Manufacturing Construction Trade Total
64
25
60
90
5664 61 59
0
20
40
60
80
100
120
Belgium Germany France Italy Poland Portugal Spain Turkey
Small Medium-sized Large Total

Recent Trends in Customer and Supplier Payment Periods November 2019
ECCBSO FSA WG Page 5
Figure 4 – DPO (weighted means, 2017), by country and sector (micro companies excluded)
In line with the DSO results, the construction sector has the highest DPO values. For almost all
countries, the trade sector has the lowest DPO as expected from the nature of the business.
Table 2 displays the trade credit balance (TCB), which shows the liquidity advantage,
calculated from the difference between DSO and DPO (see Annex 1). Negative figures are highlighted
for the main sectors (manufacturing, construction and trade). For the majority of the countries, TCB is
negative in the trade sector. This result is related to the retail trade sector, which has the lowest TCB;
in this sector, payables are usually higher than receivables. The manufacturing sector has a positive
TCB for most of the countries. Some countries seem to easily finance themselves through trade
credits. This is the case for Poland, Spain, Belgium and Italy, which have negative TCBs in two of the
three main sectors.
Table 2 – Trade Credit Balance (TCB) (weighted means, 2017), by country and sector (micro companies excluded)
64
25
60
90
5664 61 59
0
30
60
90
120
150
180
210
Belgium Germany France Italy Poland Portugal Spain Turkey
Manufacturing Construction Trade Total
Belgium France Germany Italy Poland Portugal Spain Turkey
Sector Code BE FR DE IT PL PT ES TR
Manufacturing C -6 11 1 6 1 11 0 20
Construction F 6 38 13 -1 -6 35 -1 -14
Trade G -12 -9 4 -6 -10 -4 -11 8
Motor Vehicle Trade G-45 -14 -23 3 -26 -6 -18 -23 11
Wholesale Trade G-46 -7 4 9 16 2 19 8 16
Retai l Trade G-47 -28 -30 -13 -46 -38 -38 -37 -23
2017
Recent Trends in Customer and Supplier Payment Periods November 2019
ECCBSO FSA WG Page 6
3.3. DSO and DPO, comparison between 2000, 2008 and 2017
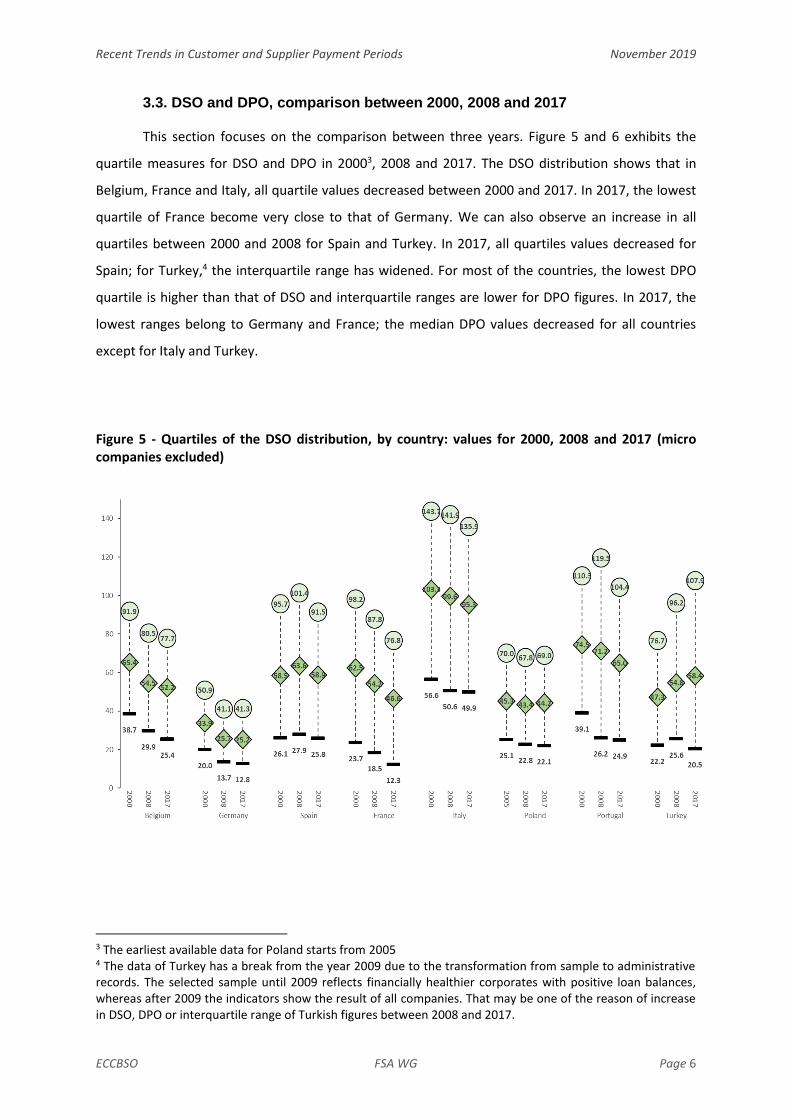
This section focuses on the comparison between three years. Figure 5 and 6 exhibits the
quartile measures for DSO and DPO in 20003, 2008 and 2017. The DSO distribution shows that in
Belgium, France and Italy, all quartile values decreased between 2000 and 2017. In 2017, the lowest
quartile of France become very close to that of Germany. We can also observe an increase in all
quartiles between 2000 and 2008 for Spain and Turkey. In 2017, all quartiles values decreased for
Spain; for Turkey,4 the interquartile range has widened. For most of the countries, the lowest DPO
quartile is higher than that of DSO and interquartile ranges are lower for DPO figures. In 2017, the
lowest ranges belong to Germany and France; the median DPO values decreased for all countries
except for Italy and Turkey.
Figure 5 - Quartiles of the DSO distribution, by country: values for 2000, 2008 and 2017 (micro companies excluded)
3 The earliest available data for Poland starts from 2005 4 The data of Turkey has a break from the year 2009 due to the transformation from sample to administrative records. The selected sample until 2009 reflects financially healthier corporates with positive loan balances, whereas after 2009 the indicators show the result of all companies. That may be one of the reason of increase in DSO, DPO or interquartile range of Turkish figures between 2008 and 2017.

Recent Trends in Customer and Supplier Payment Periods November 2019
ECCBSO FSA WG Page 7
Figure 6 – Quartiles of the DPO distribution, by country: values for 2000, 2008 and 2017 (micro companies excluded)
Due to the effect that late payments have on the liquidity and survival of companies, mainly
on SMEs, national governments, according to European Directives, have established laws to limit the
maximum payment period allowed in commercial transactions. These laws are summarized in Table
3, which show a convergence of payment limits from 2013 onwards due to the transposition of the
2011/7/EU Directive. The comparison of this table with the information in Figures 5 and 6 shows that
in 2008 around 50% of companies in Germany, Spain and France complied with the current legislation.
In 2017, more than 50% of companies in all countries except Italy and Portugal have their average
payment periods below the legal limits, exceeding 75% in Germany.

Recent Trends in Customer and Supplier Payment Periods November 2019
ECCBSO FSA WG Page 8
Table 3 – Maximum suppliers payment period (days, business to business – B2B) allowed by law, by
country
(See Annex 5 for details.)
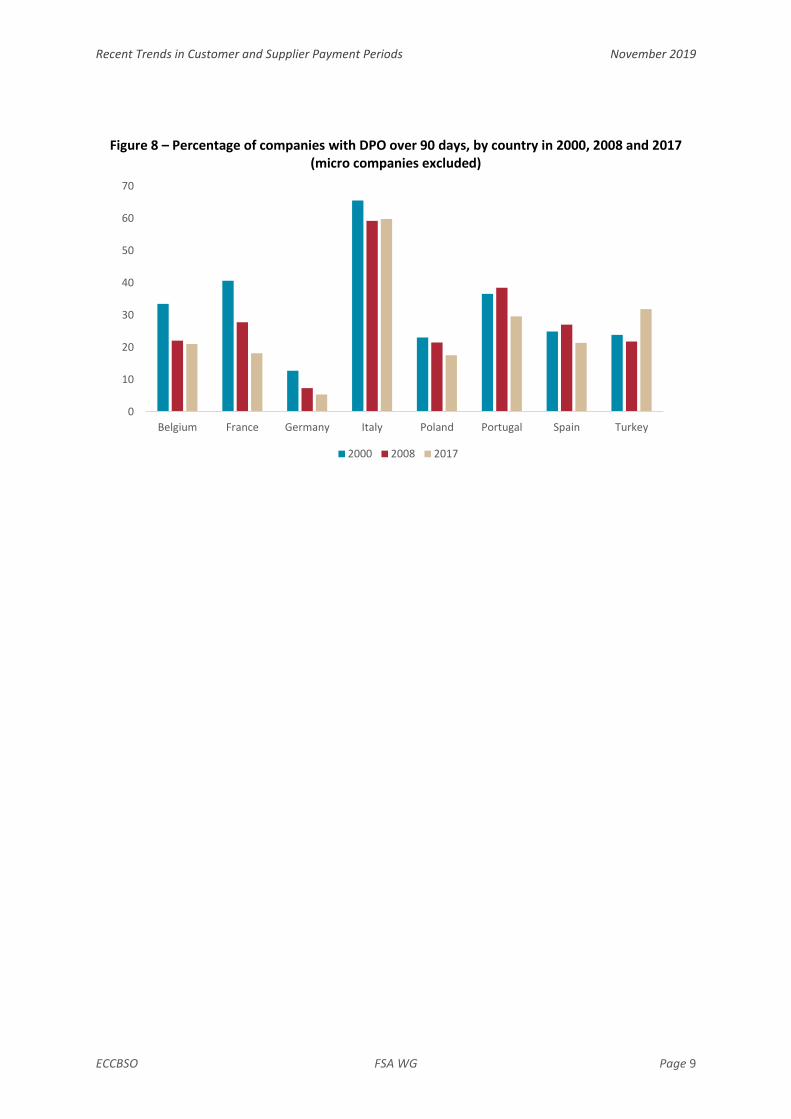
Figures 7 and 8 show the percentages of companies that have DSO and DPO over 90 days. We
can observe the decline in both customer and supplier payments over 90 days for Portugal, Spain and
France.
Figure 7 – Percentage of companies with DSO over 90 days, by country in 2000, 2008 and 2017 (micro companies excluded)
2008 2009 2010 2011 20122013 and
onwards
Law 02/08/2002 (1*) 30 30 30 30 30
Law 22/11/2013(1**) 30/60
France (2) Law LME 2008-776 60 60 60 60 60 60
Law 286 BGB
Law 271a BGB/ 2014
Law 1/2012 60
Law 192/ 2012 60
Law 139/ 2003
Law 403/ 2013
Portugal (6) Law 62/2013 60
Law 3/2004 60 60
Law 15/2010 85 85 75 60
Turkey (8) Law 6102/2011 60 60 60
Spain (7)
30 30 30 30 30 30/60
Maximum suppliers payment period (days) permitted by law (B2B)
Germany (3)
Italy (4)
Poland (5)
30 30 30 30 30 60
Country Legislation
Belgium (1)
0
10
20
30
40
50
60
70
Belgium France Germany Italy Poland Portugal Spain Turkey
2000 2008 2017
Recent Trends in Customer and Supplier Payment Periods November 2019
ECCBSO FSA WG Page 9
Figure 8 – Percentage of companies with DPO over 90 days, by country in 2000, 2008 and 2017 (micro companies excluded)
0
10
20
30
40
50
60
70
Belgium France Germany Italy Poland Portugal Spain Turkey
2000 2008 2017

Recent Trends in Customer and Supplier Payment Periods November 2019
ECCBSO FSA WG Page 10
Annexes
Annex I: Methodology
Data description
This FSA WG research project, like the previous ones, has been conducted based on
extensive samples of financial statements included in the databases managed by each country. For
this study, we consider entities belonging to the non-financial sector, which is mainly composed by
the legal forms of corporations and cooperatives. By definition, sole proprietors are not included in
this study as they are not considered as part of the non-financial sector, according to the European
System of National and Regional Accounts (ESA 2010).
The observations cover a time span ranging from 2000 to 2017, which is the most recent year
with data available for all countries. This study uses individual financial statements and focuses on the
manufacturing, construction and trade sectors, because these branches are amongst the most
homogeneous ones in terms of activity and market conditions.
This study follows the EU Commission Recommendation concerning the definition of micro,
small, medium-sized and large enterprises, by using the turnover criterion. The thresholds are deflated
using the Harmonized Index of Consumer Prices (HICP) of the Euro area. Year 2015 is selected as the
base year for calculations. For Poland and Turkey, the threshold values are converted into the national
currencies by using each country’s real effective exchange rate versus the Euro Area-18 trading
partners. Micro companies are excluded from the analysis, because these firms are not directly
comparable across countries due to different data collection methods and suffer from outliers and
volatility in the ratios.
Ratio Definition
FSA WG decided on a net approach (net amount of money exchanged with the
customers/suppliers of the companies by prepayments)
Days Sales Outstanding (DSO) is the average number of days the customer receivables is “on
the books”. The lower DSO means the sooner the customers pay to firms.
Numerator 360X(Trade receivables-customer prepayments)
Denominator Net turnover

Recent Trends in Customer and Supplier Payment Periods November 2019
ECCBSO FSA WG Page 11
Days Payables Outstanding (DPO) is the average number of days a company takes before
paying its suppliers. The lower DPO, the faster a company pays its trade credit.
Numerator 360X(Trade payables-advances to suppliers)
Denominator Purchases
Trade Credit Balance (TCB) is the difference between days sales and days payables
outstanding. The lower the TCB, the more successful the company in managing its liquidity.
Numerator 360X[(Trade receivables-customer prepayments)- (Trade payables-advances to suppliers)]
Denominator Net turnover
Outlier observations, classified as observations that satisfy any of the following conditions, are
excluded:
𝑃25(𝐷𝑆𝑂 𝑜𝑟 𝐷𝑃𝑂) − 6 × 𝐼𝑄𝑅
𝑃75(𝐷𝑆𝑂 𝑜𝑟 𝐷𝑃𝑂) + 6 × 𝐼𝑄𝑅
P25 (or Q1): 25th percentile (or first quartile)
P75 (or Q3): 75th percentile (or third quartile)
IQR: Interquartile range (which is equal to P75-P25)
Annex II – Participating countries and sector/size criteria
Participating Countries Code
Belgium BE
France FR
Germany DE
Italy IT
Poland PL
Portugal PT
Spain ES
Turkey TR

Recent Trends in Customer and Supplier Payment Periods November 2019
ECCBSO FSA WG Page 12
Sector Code NACE Rev.2
Manufacturing C C
Construction F F*
Trade G G Motor Vehicle Trade G-45 G-45
Wholesale Trade G-46 G-46
Retail Trade G-47 G-47
Total To To
*except F43.1-"Demolition and site preparation"
Sizes Code Sales Thresholds* in millions of Euros
Micro SZ1 Sales≤ €2M
Small SZ2 €2M< Sales≤ €10M
Medium SZ3 €10M< Sales≤ €50M
Large SZ4 Sales> €50M
Total without Micro SZ0 Sales> €2M
*2015 base year, deflated by HICP (Harmonized Index of Consumer Prices) in each year
Annex III – Number of companies by country and size
YEAR COUNTRY Large Medium Small
Total
without
micro Micro Total
Belgium 1,571 4,052 1,974 7,597 1,138 8,735
France 5,219 17,515 56,664 79,398 64,424 143,822
Germany 4,209 7,631 8,663 20,503 5,469 25,972
Italy 4,440 16,478 39,399 60,317 99,466 159,783
Poland 833 4,098 7,738 12,669 6,092 18,761
Portugal 570 2,351 9,953 12,874 131,027 143,901
Spain 1,133 3,859 20,534 25,526 177,957 203,483
Turkey 4,096 18,260 57,600 79,956 154,392 234,3482017

Recent Trends in Customer and Supplier Payment Periods November 2019
ECCBSO FSA WG Page 13
Annex IV – Number of companies by country and sector (micro companies
excluded)
Annex V – Explanation about legislation in countries
(1*) From 2002 onwards (Directive 2000/35/EU), the common delay in B2B transactions is maximum
30 days, except express agreement between parties.
(1**) Since the Law of 22 Nov 2013 (Directive 2011/7/EU), the delay in B2B transactions is maximum
30 days, but firms can agree on a longer period (even more than 60 days, which is the maximum delay
according to the EU directive) if it can’t be considered as unfair for the creditor.
(2) The maximum legal payment period is 30 days for road freight transport and car rental, in
accordance of the Law n°2006-10 enacted in 2006. It is 30 and in some cases 20 days for perishable
goods.
(3) In response to the Directive 2011 /7/EU Germany enacted a law in 2014, which states a payment
period of 60 days for B2B. Before that, there was no law especially for B2B but an overall payment
period of 30 days.
(4) Law 1/2012 applies to food retailers vs. food producers. Law 192/2012 is the adoption of Directive
2011/7/EU.
(5) From 2013 and onwards, for public companies, the payment period is 60 days, and for private it is
30 days.
(6) Despite the 60 days rule, the Portuguese Law (like the Directive 2011/7/EU) says that there may
be circumstances in which undertakings require more extensive payment periods. It should therefore
YEAR COUNTRY Manufacturing Construction Trade Total
Motor
Vehicle
Trade
Wholesale
Trade Retail Trade
Belgium 2,327 929 4,341 7,597 732 2,922 687
France 21,142 13,030 45,226 79,398 6,667 21,172 17,387
Germany 8,845 2,926 8,732 20,503 1,527 5,693 1,512
Italy 29,135 5,662 25,520 60,317 3,185 16,481 5,854
Poland 6,244 1,511 5,636 13,391 572 3,640 1,424
Portugal 4,342 1,207 7,325 12,874 843 4,160 2,322
Spain 8,248 2,325 14,953 25,526 1,611 9,885 3,457
Turkey 30,242 8,636 41,078 79,956 2,882 29,390 8,8062017

Recent Trends in Customer and Supplier Payment Periods November 2019
ECCBSO FSA WG Page 14
remain possible for the parties expressly agree on payment periods longer than 60 calendar days,
provided, however, that such extension is fair to the creditor.
(7) Modified in 2010 response to the economic crisis with high levels of late payments, since it had a
low applicability in the business reality.
(8) It should be possible for the parties expressly agree on payment periods longer than 60 calendar
days, if such extension is fair to the creditor. However, the payment period shall not exceed 60 days
in cases where the creditor is small or medium enterprises or agricultural or animal producer.