recent trends in fires and land cover change in western indonesia douglas o. fuller department of...
TRANSCRIPT

Recent trends in fires and land cover change in Western Indonesia
Douglas O. FullerDepartment of Geography and Regional Studies
University of Miami, Florida
Collaborators: T.C. Jessup, Agus Salim, Erik Meijaard, Martin Hardiono

Talk Outline
• Background – Drivers, Ecology, Consequences
• The ENSO-fire relationship – Understanding climate and human actions
• Carbon Emissions, Peat swamp forest, and REDD
• Projecting the future with land change models

Carbon Emissions
• 1.2 Gt yr-1 (12 percent of the global total) from tropical deforestation and forest degradation (Nature Geoscience 2009)
• Pan et al. (Science 2011) report a global forest sink of 1.1 Gt yr-1
• 0.3 Gt yr-1 from tropical peat fires, mostly in Indonesia (4 percent of global total)
• Emissions from Indonesia (Sumatra and Borneo) estimated at 30x during the 2006 El Nino vs. the 2000 La Nina

Study area:
Kalimantan

Vegetation Cover

Social, Economic, and Cultural Consequences of Fire
• 1997 fires cost Indonesia ~ $1 billion in lost tourism, transportation and health impacts.
• Rampant land conversion implicated in the loss of cultural diversity
• Region-wide effects: haze spreads over much of Southeast Asia

The haze dilemma

GHG Emissions
Peat fires important in Indonesia: 1997-98 fires emitted 40 percent CO2 from fossil fuels.Source: Page et al. Nature, 2002
Indonesia forest cover 95-120 million ha, 2-4 percent annual deforestation rate.

Selective Logging Disturbed Lowland Forest
Alang-alang “savanna” Agricultural burning
Process of Land-cover Change in Kalimantan, Indonesia
No fire ??

The fire transition
• A new theory that accounts for anthropogenic changes in tropical fire regimes through time:– Fires are rare in closed forests except during
exceptional climatic events (extreme El Nino for example)
– Fires become more seasonal as forests are converted and remaining high biomass needs to be removed quickly to make way for plantations
– As permanent crops are established and land values rise, fires diminish as people practice fire suppression to protect valued assets

Lit fires
Total active
Nu
mb
er
of
fire
s (r
ela
tive
)
DM
SP
-OL
S
300 600 900 1200 1500 1800 2100 2400
AV
HR
Rm
orn
ing
AV
HR
Ra
fte
rno
on
DM
SP
-OL
S
Time of day
MO
DIS
EO
S-A
M1
MO
DIS
EO
S-P
M1
AT
SR
-1
Some Satellite Systems for Mapping Fire
Diurnal Patterns of Burning and Satellite Overpass
Fuller, 2000, Prog. Phys. Geogr.

Landsat TM image showing industrial plantations

Fire vs. ENSO indices
1
1.5
2
2.5
3
3.5
4
4.5
-20
-10
0
10
20
30
40A
ug 9
6
Fe
b 9
7
Aug
97
Fe
b 9
8
Aug
98
Fe
b 9
9
Aug
99
Fe
b 0
0
Aug
00
Jan
01
Jul 0
1
ATSR nighttime fires
SOININO1+2NINO3NINO4NO3.4
LOG
AT
SR
Fire
Co
unt
EN
SO
Inde
x
Fuller & Murphy, 2006, Clim Change

0
0.5
1
1.5
2
2.5
3
3.5
4
-15 -10 -5 0 5 10
Lo
g1
0 Fire
co
unt
s in
low
lan
d fo
rest
Southern Oscillation Index
0
0.5
1
1.5
2
2.5
3
3.5
4
-15 -10 -5 0 5 10
Lo
g1
0 F
ire c
ou
nts
in n
on-f
ore
st
Southern Oscillation Index
0
0.5
1
1.5
2
2.5
3
3.5
4
-15 -10 -5 0 5 10
Lo
g 10 F
ire c
ou
nts
in s
wa
mp
/man
gro
ve f
ore
st
Southern Oscillation Index
Non-forest (agriculture, degraded land, pasture)
Tropical moist forest
Swamp and mangrove forest
r = 0.75
Fire-SOI: The influence of land-cover type
Fuller & Murphy, 2006, Clim Change

Annual Time Scale
0
5000
1 x 10⁴
1.5 x 10⁴
2 x 10⁴
2.5 x 10⁴
3 x 10⁴
-40 -30 -20 -10 0 10 20 30
To
tal f
ire
cou
nts
Annual Sum of SOI
1998
1997
2001 1999
2000
Fuller & Murphy, 2006, Clim Change

Extending the Time Series Using MODIS Fire
Overlap

Fuller & Meijaard, 2010, submitted

0
2000
4000
6000
8000
1 104
0 50 100 150 200 250 300
Fir
es
8-day Count
0
50
100
150
200
250
300
350
400
0 50 100 150 200 250 300
Sea
sona
l fac
tor
8-day Count
0
500
1000
1500
2000
2500
3000
3500
0 50 100 150 200 250 300
Tre
nd
8-day Count
0
0.5
1
1.5
2
2.5
0 50 100 150 200 250 300
Irre
gu
lar
(ra
ndo
m)
Co
mp
on
en
t
8-day Count
TS Models and Decomposition:
Xt = St + Rt + et → additive modelXt = St x Rt x et → multiplicative model
St
Rt
et
Xt

ALL-M PSF-A LOW-A MONT-A P/S-M O/M-M
NINO1+2-M -0.28(-37)-0.21(-45)0.25(-9)-0.19(-2)0.24(6)
0.22(-11)0.21(-11)0.25(-9)0.33(41)0.30(3)
0.19(-11)0.19(-13)0.29(22)0.32(34)0.28(6)
0.20(23)-0.22(27)0.28(23)0.42(41)0.20(-23)
0.24(-37)0.18(12)-0.24(-37)0.16(-17)0.24(6)
-0.30(-37)-0.23(-45)0.26(-8)-0.22(-6)0.20(46)
NINO3-M 0.40(-10)-0.24(-37)0.48(-8)0.18(-7)0.32(-11)
0.42(-11)0.24(4)0.46(-8)0.17(26)0.45(-12)
0.38(-11)0.22(-3)0.46(-9)0.33(8)0.40(-12)
0.23(-7)0.17(6)0.31(-6)0.18(-37)0.22(-10)
0.39(-11)-0.16(-37)0.42(-8)0.17(-7)0.35(-12)
0.38(-10)-0.27(-38)0.48(-8)0.21(8)0.24(-11)
NINO4-M 0.39(-10)0.35(-3)0.40(-10)0.29(-3)0.38(-11)
0.34(-11)0.30(-21)0.36(-6)0.28(-10)0.47(-14)
0.31(-11)0.27(-21)0.41(-9)0.25(-10)0.41(-11)
0.22(-5)0.19(-21)0.28(-4)0.23(-18)0.26(-8)
0.39(-10)0.31(-3)0.41(-10)0.26(-2)0.38(-11)
0.37(-10)0.33(-3)0.39(-10)0.27(-3)0.33(-10)
NINO3.4-M 0.41(-10)0.33(-8)0.47(-8)0.16(1)0.39(-12)
0.41(-12)0.34(0)0.44(-7)0.25(1)0.50(-14)
0.37(-12)0.30(-9)0.47(-9)0.23(1)0.45(-12)
0.25(-6)0.34(2)0.33(-5)0.27(2)0.26(-10)
0.40(-10)0.29(-4)0.43(-8)0.17(31)0.40(-12)
0.39(-9)0.31(2)0.45(-8)0.15(1)0.32(-12)
Cross-correlations between fire and ENSO, 2001-2010
Black = whole series, red = 2001-2006, blue = 2007-2010 (May)
Fuller & Meijaard, 2010, submitted

Evidence consistent with the decoupling hypothesis:
1) Maximum cross-correlations decreased across the two time segments (except for PSF);
2) Time lags between fires and ENSO increased noticeably;
3) Seasonality increased in certain transitional land
cover types (especially fire-susceptible forests)

Peat = carbon = $$$$2 billion pledged to help Indonesia implement REDD+
“Soros wants to turn Indonesia into a pilot project for
his carbon trading plan.”


Evidence of changefrom Landsat
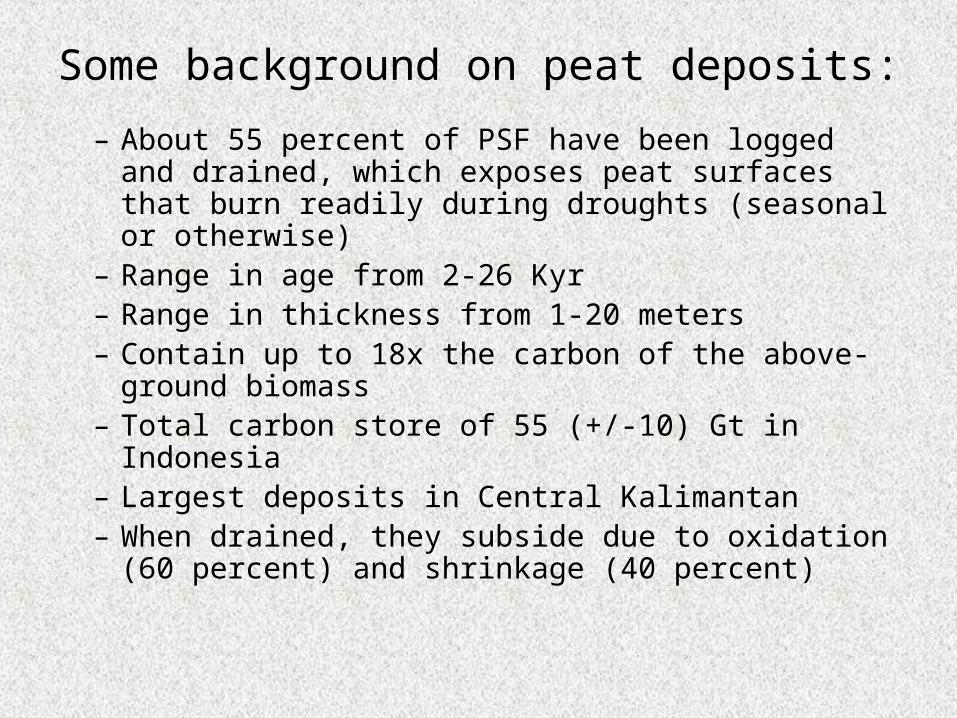
Some background on peat deposits:
– About 55 percent of PSF have been logged and drained, which exposes peat surfaces that burn readily during droughts (seasonal or otherwise)
– Range in age from 2-26 Kyr– Range in thickness from 1-20 meters– Contain up to 18x the carbon of the above-ground
biomass– Total carbon store of 55 (+/-10) Gt in Indonesia– Largest deposits in Central Kalimantan– When drained, they subside due to oxidation (60
percent) and shrinkage (40 percent)

Hooijer et al., 2010, Biogeosciences

Peat depths from core samples
Jaenicke et al. (2009), Geoderma

Change in carbon stocks
Cconversion = Σi{(CAFTERi − CBEFOREi ) · ∆A TO OTHERSi } → gross emissions
where: Cconversion = change in carbon stocks on land converted to another land category, t C yr−1;
CAFTERi = carbon stocks on land type i immediately after the conversion,t C ha−1;
CBEFOREi = carbon stocks on land type i before the conversion, t C ha−1;
∆A TO OTHERSi = area of land use i converted to another land use category in a certain year, ha yr−1; i = type of land use converted to another land use category.
Source: IPCC, 2006, IPCC Guidelines for National Greenhouse Gas Inventories.

More to the point….how REDD is supposed to work
0.18
0.2
0.22
0.24
0.26
0.28
0.3
0.32
0.34
2006 2008 2010 2012 2014 2016 2018 2020 2022
Baseline (BAU)REDD intervention
Em
issi
ons
(Gt
yr-1
)
Year
Potential incomefrom emissionsreductions ($ / t C / yr)

Hutan Rawa circa 1995
Hutan Rawa – MoF map 2006
Hutan Rawa 2005
3,505,425 ha of Hutan Rawa 2,660,692 ha of Hutan Rawa
Ministry of Forestry Maps
Both maps derived from interpretation of Landsat imagery

Research Design
Pre-process GIS data
Develop validation
(reference) data set
Determine values for
CBEFOREi/CAFTERi
Simulatedland covermaps
Perform validation
LUCC Models
Model calibration
Simulate forward X time steps
Simulated land coverbased on model calibrations
0.18
0.2
0.22
0.24
0.26
0.28
0.3
0.32
0.34
2006 2008 2010 2012 2014 2016 2018 2020 2022
Baseline (BAU)REDD intervention
Em
issi
on
s (G
t yr
-1)
Year
Potential incomefrom emissionsreductions ($ / t C / yr)
END PRODUCT REL CURVES
Modeling loop

Fires 1997
Fires 2005 Deforestation 1995-2005
Rivers
Reforestation
Local roads

GEOMOD - 2020
LCM - 2020
0.8 million ha lost
1.39 million ha lost
Constrained 3x3
2005
0.9 million ha lost
Dinamica EGO - 2020
Fuller et al., 2011, Environmental Management

reforestation/regeneration (RR) between 2005-2010 and protection of Sebangau NP
~48,000 ha of regrowth through replanting or natural regeneration
National Park

BAU vs. Some Regeneration
2020: Regeneration scenario:2.28 million ha
2020 BAU (no PSF regenerationConsidered) 1.86 million ha

Forest Loss Projections
Fuller et al., 2011, Env. Mgmt

Conclusions
• LUCC models are useful to explore possible outcomes given a range of scenarios
• Our results indicate that Indonesia can meet between 36-81 percent of its 2020 target for reduced greenhouse gas emissions of 0.78 Gt CO2 equivalent (e) by implementing peatland restoration and other REDD interventions in Central Kalimantan.

Research Frontiers
• Results reflect emissions from deforestation only not degradation (RED not REDD)
• Fluxes from oxidizing peat not well known, so emissions baselines are difficult to establish
• More accurate accounting will include degradation and carbon sequestration (Gtnet)
• Extend fire analysis to continue testing fire transition theory using cross-border comparisons

THANK YOU!