recent trends on institutional investors statistics 011208 · recent trends on institutional...
TRANSCRIPT

ISSN 1995-2864 Financial Market Trends © OECD 2008
FINANCIAL MARKET TRENDS – ISSN 1995-2864 - © OECD 2008 1
Recent Trends in Institutional Investors
Statistics
Eric Gonnard, Eun Jung Kim and Isabelle Ynesta*
Data to measure and analyse the increasing role of institutional investors in capital markets has been collected and published by the OECD for a number of years. This dataset is now integrated in the framework of the OECD Financial Accounts. This article presents an overview of institutional investors’ assets, their components and their development in the aggregate and by country.
* The authors are statisticians in the Division of National Accounts and Financial Statistics in the OECD Statistics Directorate. The
views expressed herein are those of the authors and do not necessarily reflect those of the OECD or the governments of its Member countries. The authors are solely responsible for any errors.

RECENT TRENDS ON INSTITUTIONAL INVESTORS STATISTICS
2 FINANCIAL MARKET TRENDS – ISSN 1995-2864 – © OECD 2008
I. Background
Institutional investors statistics are integrated
into OECD Financial Accounts
Data to measure and analyse the increasing role of institutional investors in capital markets has been collected and published by the OECD for a number of years. In 2004, the OECD Working Party on Financial Statistics decided to pursue this activity but to integrate it in the framework of the OECD Financial Accounts. Therefore, an additional yearly table (Table 7IA) was sent to OECD member countries in parallel to the joint OECD/Eurostat questionnaire on financial accounts.
II. Methodology
Presenting an overview of institutional
investors’ assets
The purpose of this article is to present an overview of institutional investors’ assets based on the OECD “Institutional Investors’ assets” (table 7IA) data collected from Central Banks and National Statistical Offices1. It has been prepared by the OECD Financial Statistics section. The OECD database is accessible via DotStat, the OECD online data warehouse, under the theme “Finance” http://dotstat/wbos/index.aspx.
Six asset types and four main types of
institutional investors
For each country the database contains information broken down
• by asset type: Currency and deposits (AF2), Securities other than shares (AF33), Loans (AF4), Shares and other equities (AF5), Other financial assets and Total non-financial assets (AN). While the sub-classification of the above assets corresponds to SNA93, a further breakdown between assets issued by residents and non-residents is available for the instruments AF33, AF4 and AF5;
• by type of institutional investor: (1) Investment funds, (2) Insurance companies, (3) Pension funds, and (4) Other forms of institutional savings. Sub-categories of these type of investors are also available: within the investment funds category, one distinguishes Open-end companies, further broken down into Money market funds and Other mutual funds, and Closed-end companies, of which Real estate funds. Insurance companies are broken down into Life insurance companies and Non-life insurance companies.
Non-consolidated data to improve
In order to improve the comparability across countries, non-consolidated data are used in this article, as consolidated data are not

RECENT TRENDS ON INSTITUTIONAL INVESTORS STATISTICS
FINANCIAL MARKET TRENDS – ISSN 1995-2864 - © OECD 2008 3
comparability always available. Monetary values are expressed in USD constant prices (reference year, 2000) to eliminate the effects of inflation and exchange rates.
Total of 17 countries represents over 90% of
overall OECD activity
Total OECD figures are based on 17 countries for which data are comparable over the period 1995-2005 (instead of 30 countries – of which data for 12 countries are not comparable over the period and one, New Zealand, does not report any data on institutional investors’ assets). However, these 17 countries represent more than 90% of institutional investors’ activity within all OECD countries.
Total OECD (17) figures comprise Australia, Austria, Belgium, Canada, Denmark, Finland, France, Germany, Greece, Japan, Luxembourg, the Netherlands, Norway, Spain, Turkey, the United Kingdom and the United States.
III. Presentation
General trends over the period 1995-2007
This article presents, in tables and graphs, general trends of institutional investors’ assets across OECD countries over the period 1995-2007 as well as details of the composition of institutional investors’ portfolio by country.1It also provides information on the weight of assets issued by non-residents as well as on the relative importance of non-financial assets held by institutional investors.
Institutional investors have been gaining in
importance
Institutional investors have been gaining in importance in OECD countries: within the OECD (17) area, institutional investors recorded increases in their assets with a yearly average of 6.6 per cent over the period 1995-2005. Total institutional investors’ assets in the OECD area amounted to more than US$ 40.3 trillion in 2005, corresponding to 162.6 per cent of GDP. The United States holds the lion’s share, with the half of the market share, followed by Japan and the United Kingdom with respectively 18% and 8.4% of the area.
Degree of institutionalisation
differs markedly across countries
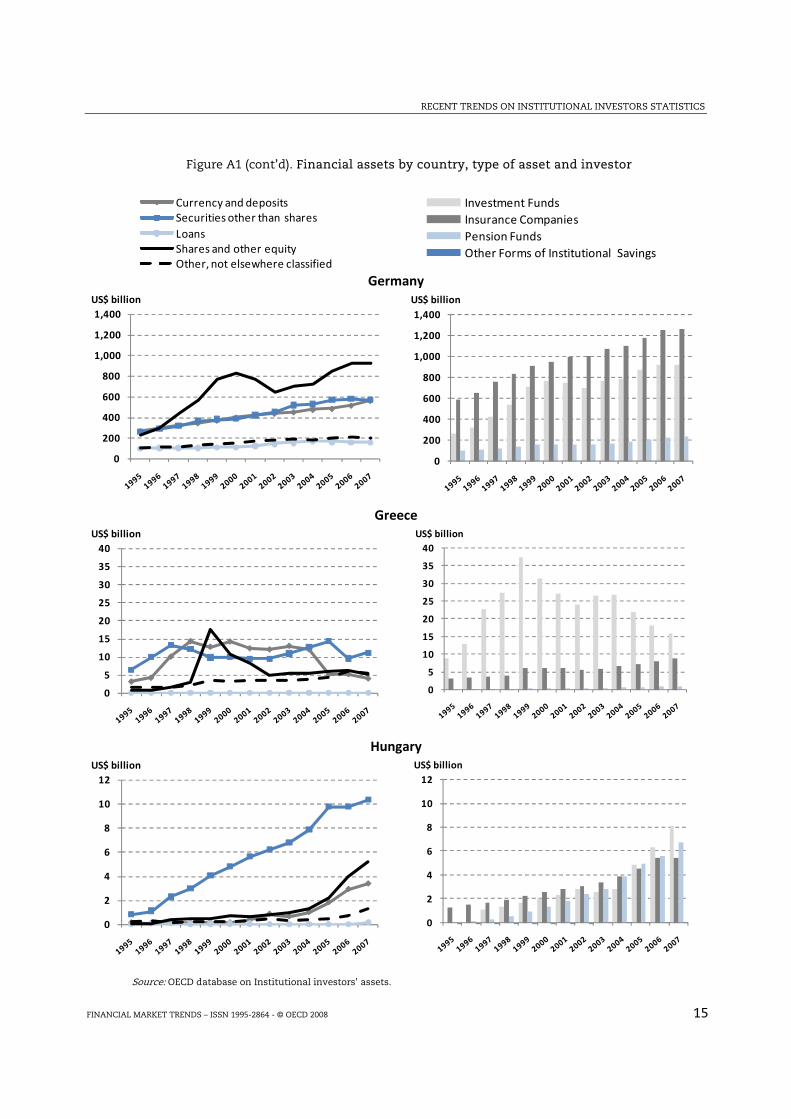
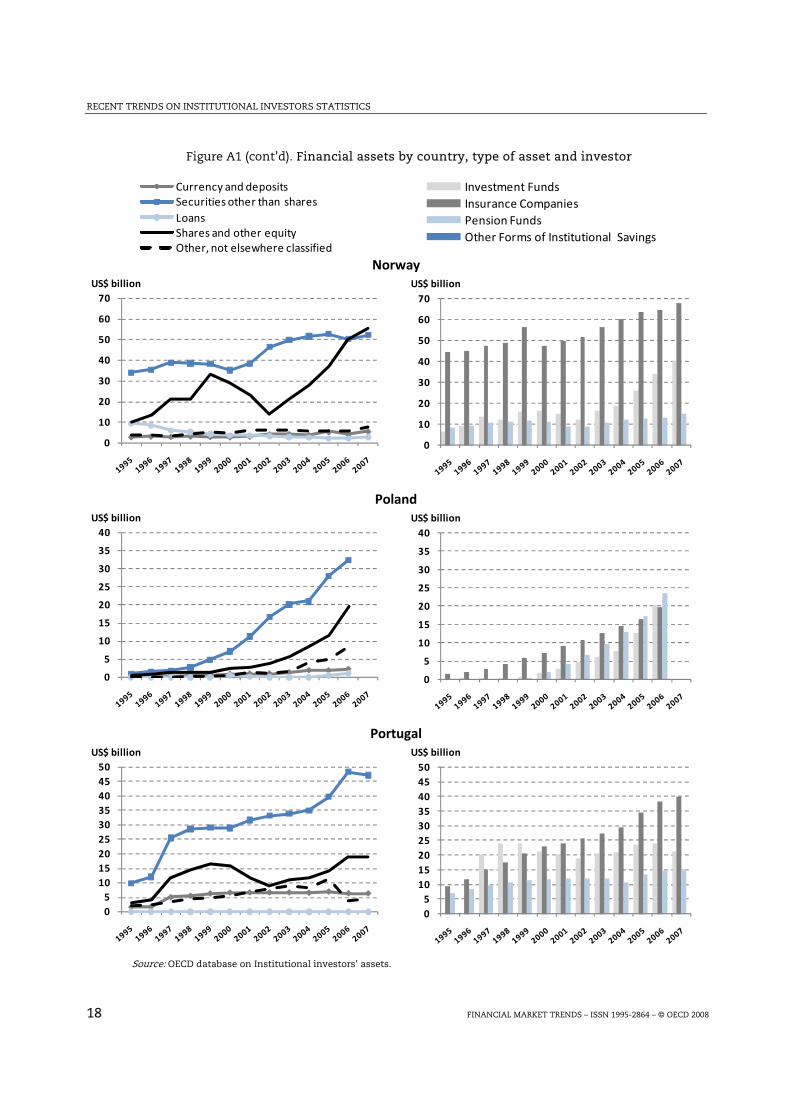
The degree of institutionalisation differs markedly across countries: differences in term of percentage of financial assets held by institutional investors over GDP ranged from 6.1% in Turkey to 483.4% in Ireland (Table 1). During the period 1995-2005, this percentage for OECD countries raised from 110.2% to 162.6%. Some countries, where the financial assets in proportion to GDP are structurally low compared to the other countries, experienced a high annual average growth during the period: Poland (36.4%), Turkey (28.3%) and Hungary (21%) (Figure 1).
1 The data providers are: Australian Bureau of Statistics, Oesterreichische Nationalbank, National Bank of Belgium, Statistics Canada,
Czech Statistical Office, Statistics Denmark, Statistics Finland, Banque de France, Bundesbank (Germany), Bank of Greece, Magyar Nemzeti Bank (Hungary), Central Bank of Iceland, Central Statistics Office Ireland, Banca d'Italia, Economic and Social Research Institute - Cabinet Office (Japan),The Bank of Korea, Ministry of Finance (Mexico), Statistics Netherlands, Statistics Norway, Central Statistical Office, Banco de Portugal, National Bank of Slovakia, Banco de España, Statistics Sweden, Swiss National Bank, Treasury CMB (Turkey), Office for National Statistics (United Kingdom), and United States Federal Reserve Board.

RECENT TRENDS ON INSTITUTIONAL INVESTORS STATISTICS
4 FINANCIAL MARKET TRENDS – ISSN 1995-2864 – © OECD 2008
Table 1. Financial assets of institutional investors
In per cent of GDP (1)
1995 1996 1997 1998 1999 2000 2001 2002 2003 2004 2005 2006 2007
Australia 82.6 90.5 102.4 110.2 122.2 126.1 126.0 118.3 120.6 129.6 141.5 152.3 .Austria 43.5 50.2 57.6 65.0 78.6 84.1 87.0 90.7 97.9 105.8 125.3 130.3 128.2Belgium 31.0 35.8 44.3 70.5 79.8 83.0 84.6 80.1 87.0 95.6 105.0 110.7 111.1Canada 94.0 107.9 118.6 126.2 131.6 128.1 125.2 117.7 122.2 127.5 134.1 144.4 146.4Czech Republic 16.7 17.5 15.5 13.5 15.9 16.3 13.8 16.8 17.1 19.5 19.0 18.4 22.4Denmark 83.2 89.7 100.0 106.8 120.5 123.3 121.1 118.9 130.4 150.3 172.6 176.6 181.3Finland 50.4 59.1 63.7 70.0 90.9 86.1 82.5 83.1 92.9 103.4 120.9 133.1 132.4France 75.9 84.6 95.0 104.5 123.5 130.7 129.6 123.9 131.6 147.6 160.2 174.0 171.4Germany 56.4 63.4 74.6 84.0 97.0 99.3 99.3 97.2 105.2 107.3 116.0 119.1 117.3Greece 11.5 15.4 23.5 26.9 36.2 30.1 25.5 22.2 23.0 22.6 19.3 16.7 15.3Hungary
(2)3.4 4.3 7.5| 8.9 11.0 12.6 14.2 16.2 16.4 19.0 24.5 28.4 32.9
Iceland . . . . . . 105.5 112.1 129.5 145.0 167.9 180.3 198.1Ireland . . . . . . 334.1 331.5 362.8 389.3 483.4 549.0 555.3Italy 25.9 33.4 44.9 65.5 96.8 94.3 90.6 84.8 90.0 90.9 97.1 98.1 86.7Japan 98.7 94.5 101.5 102.1 110.8 106.1 104.2 107.4 117.5 123.5 145.2 148.4 .Korea . . . . . . . 67.6 64.9 68.6 73.9 80.1 91.6Luxembourg
(3)37.1 54.8 77.7 93.8 104.2 108.6 114.2 106.9 117.7 129.9 149.6 . .
Mexico (2)
1.3 1.3 1.3 1.4 5.3| 4.6 6.6 7.0 7.4 7.3 8.2 9.7 .Netherlands 146.0 158.5 170.4 181.4 197.9 189.5 176.3 159.1 171.3 182.4 201.8 206.4 196.9New Zealand . . . . . . . . . . . . .Norway 42.8 43.6 46.4 45.4 51.8 44.8 43.3 42.3 48.0 50.3 54.8 58.3 61.9Poland
(4)1.4 1.8 2.4 3.1 4.4| 6.8 9.4 13.0 15.8 18.5 23.6 30.1 .
Portugal (2)
18.1 21.3 47.4 52.7| 53.8 52.1 50.6 49.9 53.6 54.4 63.1 66.6 65.4Slovak Republic
(4)(5). . . . . 0.6 6.5| 7.3 9.7 11.8 15.6| 16.2 .
Spain 33.5 43.7 54.8 62.9 63.3 59.2 58.0 56.2 60.5 63.5 66.1 64.6 60.5Sweden
(3)48.6 58.3 66.9 73.7 87.1 87.0 127.7| 108.0 120.5 128.8 150.7 159.3 .
Switzerland . . . . 206.9 214.1 212.5 192.7 208.8 219.3 253.6 . .Turkey 0.8 1.2 1.2 1.4 2.4 2.3 3.3 3.9 5.5 5.6 6.1 4.4 .United Kingdom 162.1 170.6 192.5 200.3 224.9 210.3 191.8 165.4 175.4 181.4 207.4 . .United States 140.8 151.6 166.9 180.7 195.4 185.1 177.4 163.1 181.7 187.8 191.2 202.5 211.2OECD (17) total
(6)110.2 116.8 129.4 139.0 152.8 146.8 141.5 132.9 145.8 152.2 162.6 . .
1. Investment companies, insurance companies, pension funds and other forms of institutional savings, non-consolidated data.2. Excluding investment companies: Hungary (1995-96), Portugal (1995-97) and Mexico (1995-98). 3. Including only insurance companies: Luxembourg (1995-2005), Sweden (1995-2000).4. Excluding pension funds: Poland (1995-98), Slovak Republic (2000-05).5. Excluding insurance and pension funds: Slovak Republic (2000)6. OECD (17) total excludes countries for which data are not available or comparable over the period 1995-2005.Source : OECD database on Institutional investors' assets

RECENT TRENDS ON INSTITUTIONAL INVESTORS STATISTICS
FINANCIAL MARKET TRENDS – ISSN 1995-2864 - © OECD 2008 5
Table 2. Financial assets of institutional investors
In billions of constant 2000 USD(1)
1995 1996 1997 1998 1999 2000 2001 2002 2003 2004 2005 2006 2007
Australia 273 310 367 416 479 504 523 506 537 593 667 740 .Austria 72 85 99 116 145 161 167 177 193 214 260 280 284Belgium 63 74 94 153 178 193 198 190 209 236 264 287 296Canada 557 649 744 824 907 929 924 894 945 1017 1100 1222 1272Czech Republic 9 10 8 7 9 9 8 10 10 12 13 13 17Denmark 116 128 148 161 186 197 195 193 212 250 294 313 326Finland 49 59 68 78 105 105 103 106 120 139 167 193 200France 878 989 1135 1292 1578 1736 1753 1693 1818 2089 2310 2564 2581Germany 971 1101 1320 1517 1786 1887 1911 1870 2019 2085 2271 2401 2422Greece 12 17 27 32 44 38 34 30 33 34 30 27 26Hungary (2) 1 2 3| 4 5 6 7 8 9 11 14 17 20Iceland . . . . . . 10 10 12 14 18 20 23Ireland . . . . . . 341 361 412 463 612 735 788Italy 259 337 462 683 1025 1035 1012 952 1010 1036 1112 1144 1026Japan 4386 4314 4711 4639 5028 4952 4874 5036 5589 6033 7229 7565 .Korea . . . . . . . 384 380 421 472 539 646Luxembourg (3) 6 8 13 16 19 22 24 23 26 30 36 . .Mexico (2) 7 6 7 8 32| 30 42 45 48 50 58 71 80Netherlands 454 509 573 634 727 724 686 619 669 728 821 871 860New Zealand . . . . . . . . . . . . .Norway 60 64 72 73 84 75 74 74 84 92 103 112 124Poland (4) 2 3 4 5 7| 12 16 23 29 36 47 64 .Portugal (2) 17 20 46 53| 57 57 57 57 61 62 72 77 77Slovak Republic(4)(5) . . . . . 0 1| 2 2 3 4| 4 .Spain 159 213 277 332 350 344 349 347 385 418 450 457 445Sweden (3) 101 123 145 166 205 214 317| 274 312 347 420 462 .Switzerland . . . . 499 535 537 489 529 570 675 . .Turkey 2 3 3 4 6 6 8 10 16 17 20 16 .United Kingdom 2007 2171 2527 2718 3143 3051 2848 2507 2732 2918 3397 . .United States 11223 12542 14436 16287 18400 18074 17453 16308 18627 19954 20908 22761 24220OECD (17) total (6) 21286 23237 26612 29291 33167 32997 32125 30583 34214 36847 40329 . .
1. Investment companies, insurance companies, pension funds and other forms of institutional savings, non-consolidated data.2. Excluding investment companies: Hungary (1995-96), Portugal (1995-97) and Mexico (1995-98). 3. Including only insurance companies: Luxembourg (1995-2005), Sweden (1995-2000).4. Excluding pension funds: Poland (1995-98), Slovak Republic (2000-05).5. Excluding insurance and pension funds: Slovak Republic (2000)6. OECD (17) total excludes countries for which data are not available or comparable over the period 1995-2005.Source : OECD database on Institutional investors' assets.

RECENT TRENDS ON INSTITUTIONAL INVESTORS STATISTICS
6 FINANCIAL MARKET TRENDS – ISSN 1995-2864 – © OECD 2008
Figure 1. Financial assets of institutional investors 1995-2005
In per cent of GDP and average annual growth
0% 50% 100% 150% 200% 250% 300%
Turkey
Mexico
Slovak Republic
Czech Republic
Greece
Poland
Hungary
Norway
Portugal
Spain
Korea
Italy
Belgium
Germany
Finland
Austria
Canada
Australia
Japan
Luxembourg**
Sweden
France
OECD (17) total
Iceland
Denmark
United States
Netherlands
United Kingdom
Switzerland
Ireland
2005 % of GDP 1995 % of GDP
483%
0% 10% 20% 30% 40%
Turkey
Mexico
Slovak Republic
Czech Republic
Greece
Poland
Hungary
Norway
Portugal
Spain
Korea
Italy
Belgium
Germany
Finland
Austria
Canada
Australia
Japan
Luxembourg**
Sweden
France
OECD (17) total
Iceland
Denmark
United States
Netherlands
United Kingdom
Switzerland
Ireland
Annual average growth 1995*-2005
* Due to data availability, the starting year used to calculate the annual average growth is different from 1995 for the following countries: Hungary (1997), Portugal (1998), Mexico, Poland and Switzerland (1999), Iceland, Ireland and Sweden (2001), and Korea (2002).
** Luxembourg’s position does not reflect the entire activity of institutional investors since only insurance companies are included here.
Source: OECD database on Institutional investors' assets.
For further reading, see: Schich, S. and M. Weth (2006), "Potential pension fund demand for high-quality long-term bonds: Quantifying ‘scarcity’ of suitable investments", OECD Financial Market Trends Vol. 2006/1, No. 90.

RECENT TRENDS ON INSTITUTIONAL INVESTORS STATISTICS
FINANCIAL MARKET TRENDS – ISSN 1995-2864 - © OECD 2008 7
Figure 2. Total financial assets by type of investor
OECD (17) total(1), 1995-2005
0%
2%
4%
6%
8%
10%
12%
14%
16%
0
2,000
4,000
6,000
8,000
10,000
12,000
14,000
16,000
Investment Funds Insurance Companies Pension Funds Other Forms of Institutional Savings
US$ billion
1995 2005 Average annual growth (second axis)
1. See figures by country in the Annex (Figure A1). Note: Differences with Figure 3 may occur due to roundings.
Source: OECD database on Institutional investors' assets.
Investment funds have exceeded insurance
companies as the most significant institutional
investors
Insurance companies which used to be the most significant institutional investors have been exceeded by investment funds which represent 35.7 per cent of total assets in 2005. Other forms of institutional savings recorded the highest increases during the period 1995-2005 – on average 16.3 per cent – followed by investment funds (9.2%) and insurance companies and pension funds with around 5 per cent over the period (Figure 2). The importance of the four basic types of institutional investors varies substantially across countries: pension funds are important sources of institutional savings in Australia, Canada Iceland, the Netherlands and Switzerland, while investment funds are the main actors for Austria, Greece, Ireland and Turkey and insurance companies for Belgium, Norway and Sweden.

RECENT TRENDS ON INSTITUTIONAL INVESTORS STATISTICS
8 FINANCIAL MARKET TRENDS – ISSN 1995-2864 – © OECD 2008
Figure 3. Financial assets by type of asset
Institutional investors OECD (17) total(1), 1995-2005
0
2,000
4,000
6,000
8,000
10,000
12,000
14,000
16,000
18,000
20,000
1995 1996 1997 1998 1999 2000 2001 2002 2003 2004 2005
Currency and deposits Securities other than shares Loans Shares and other equity Other, n.e.c.
1. See figures by country in the Annex (Figure A1 and Table A1). Note: Differences with Figure 2 may occur due to roundings.
Source: OECD database on Institutional investors' assets.
Weight of shares and other equity increased
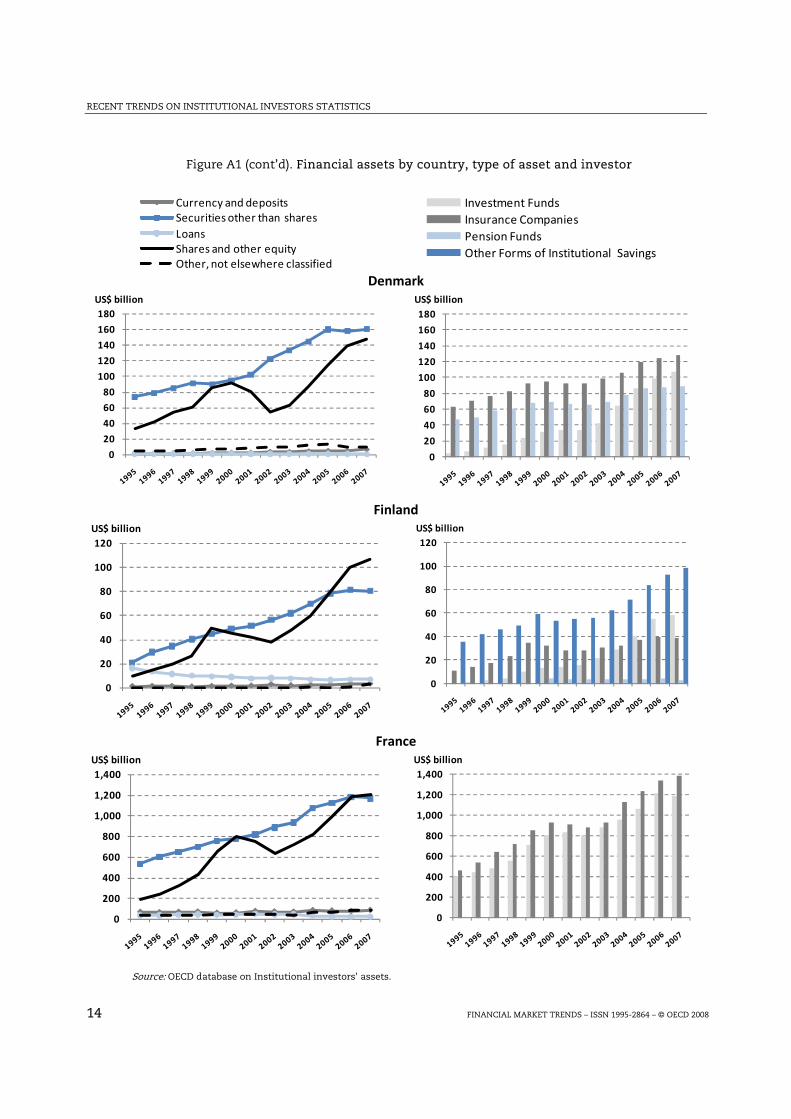
Regarding the type of financial assets held, from 1995 to 2005, the weight of shares and other equity in the institutional investors’ financial balance sheets increased with an annual average growth of 9.1 per cent, despite the period of the burst of the stock exchange bubble in 2000-2002 (Figure 3). Securities other than shares show a steady annual growth of 5.6 per cent over the period. Australia, Canada, Luxembourg, Sweden, the United Kingdom and the United States show a preference for equity investment, while asset managers in most other countries traditionally focus more on fixed-income markets (Annex, Figure A1).

RECENT TRENDS ON INSTITUTIONAL INVESTORS STATISTICS
FINANCIAL MARKET TRENDS – ISSN 1995-2864 - © OECD 2008 9
Figure 4. Financial assets issued by non residents
In per cent of each asset, 2005(1)
1. Detailed tables by country over the period 1995-2007 are shown in the Annex (Table A1).
Source: OECD database on Institutional investors' assets.
Financial assets are increasingly issued by
non-residents
Financial assets are becoming increasingly global in scope: in 2005 about 40% of the financial assets are issued by non-residents (Figure 4) whereas the share was around 13% in 1995. Non-residents are becoming particularly important in countries like Belgium and Finland with a share higher than 60% and Netherlands and Portugal with a share higher than 70% in 2007 (Annex, Table A1). For these countries, three fourth of securities other than shares are issued by non residents.

RECENT TRENDS ON INSTITUTIONAL INVESTORS STATISTICS
10 FINANCIAL MARKET TRENDS – ISSN 1995-2864 – © OECD 2008
Table 3. Non-financial assets by type of investor
In per cent of total assets, 2005
Australia (1) 8.7 24.7 4.6 5.4 4.3 10.5Austria 1.6 0.4 3.4 3.8 0.4 .Belgium 3.9 . 1.5 1.5 0.4 53.3Canada 0.9 0.0 1.4 3.6 0.0 .Czech Republic 5.8 0.2 7.6 10.0 1.2 .Greece . . . . . .Hungary 2.4 5.6 0.7 1.4 0.2 0.5Iceland 2.1 6.0 0.9 1.1 0.9 .Italy 0.7 - 1.8 1.1 13.0 -Luxembourg 0.1 . 0.1 0.1 . .Mexico 10.7 0.2 26.4 . . .Netherlands 4.1 11.0 3.5 3.5 3.5 1.8Poland 4.4 . 4.4 8.6 0.0 .Portugal 9.9 19.7 4.5 3.0 8.1 .Slovak Republic 6.2 . 6.2 6.6 . .Spain 2.3 2.4 2.3 2.9 0.2 .Switzerland 8.8 6.5 9.4 8.2 10.3 .Turkey 5.8 6.2 4.6 7.8 . .United Kingdom 4.0 2.2 4.3 5.1 3.3 .United States 2.3 . 0.9 0.8 0.9 40.5
1. Australia (2004).
2. Other forms of institutional savings include Belgian saving pension funds, Hungarian health funds and income replacement funds, Italian individual portfolio management, Netherlands'insurance companies and pension funds not supervised by the insurance Supervisory Board, US bank personal trusts.
Note: Excluded countries due to scarcity of data: Denmark, Finland, France, Germany, Ireland, Japan, Korea, Norway, Sweden.
Source : OECD database on Institutional investors' assets.
Institutional investors
Grand totalInvestment
funds
Insurance Companies and Pension
Funds
Insurance Companies
Autonomous Pension Funds
Other Forms of Institutio-nal Savings
(2)

RECENT TRENDS ON INSTITUTIONAL INVESTORS STATISTICS
FINANCIAL MARKET TRENDS – ISSN 1995-2864 - © OECD 2008 11
Non-financial assets data are scarce and less
detailed
The analysis of non-financial assets held by institutional investors can only be carried out for twenty OECD countries, and even, among these countries, the detail on the distribution of non-financial assets between institutional investors is scarce. Table 3 illustrates the share of total non-financial assets held by institutional investors in 2005. In four countries, institutional investors hold a significant proportion of non-financial assets. In Switzerland, the share of non-financial assets held by the various categories of institutional investors is around 8%, while in Australia, the Netherlands and Portugal, mainly investment funds invest in non-financial assets.

RECENT TRENDS ON INSTITUTIONAL INVESTORS STATISTICS
12 FINANCIAL MARKET TRENDS – ISSN 1995-2864 – © OECD 2008
Annex
Figure A1. Financial assets by country, broken down by type of asset and investor
0500
Currency and depositsSecurities other than sharesLoansShares and other equityOther, not elsewhere classified
020,000
Investment FundsInsurance CompaniesPension FundsOther Forms of Institutional Savings
Australia
050
100150200250300350400450500
US$ billion
050
100150200250300350400450500
US$ billion
Austria
0
20
40
60
80
100
120
140
160US$ billion
0
20
40
60
80
100
120
140
160US$ billion
Source: OECD database on Institutional investors' assets.

RECENT TRENDS ON INSTITUTIONAL INVESTORS STATISTICS
FINANCIAL MARKET TRENDS – ISSN 1995-2864 - © OECD 2008 13
Figure A1 (cont’d). Financial assets by country, type of asset and investor
0500
Currency and depositsSecurities other than sharesLoansShares and other equityOther, not elsewhere classified
020,000
Investment FundsInsurance CompaniesPension FundsOther Forms of Institutional Savings
Belgium
0
20
40
60
80
100
120
140
160
180US$ billion
0
20
40
60
80
100
120
140
160
180US$ billion
Canada
0
100
200
300
400
500
600
700US$ billion
0
100
200
300
400
500
600
700US$ billion
Czech Republic
0
2
4
6
8
10
12US$ billion
0
2
4
6
8
10
12US$ billion
Source: OECD database on Institutional investors' assets.
RECENT TRENDS ON INSTITUTIONAL INVESTORS STATISTICS
14 FINANCIAL MARKET TRENDS – ISSN 1995-2864 – © OECD 2008
Figure A1 (cont’d). Financial assets by country, type of asset and investor
0500
Currency and depositsSecurities other than sharesLoansShares and other equityOther, not elsewhere classified
020,000
Investment FundsInsurance CompaniesPension FundsOther Forms of Institutional Savings
Denmark
0
20
40
60
80
100
120
140
160
180US$ billion
0
20
40
60
80
100
120
140
160
180US$ billion
Finland
0
20
40
60
80
100
120US$ billion
0
20
40
60
80
100
120US$ billion
France
0
200
400
600
800
1,000
1,200
1,400US$ billion
0
200
400
600
800
1,000
1,200
1,400US$ billion
Source: OECD database on Institutional investors' assets.
RECENT TRENDS ON INSTITUTIONAL INVESTORS STATISTICS
FINANCIAL MARKET TRENDS – ISSN 1995-2864 - © OECD 2008 15
Figure A1 (cont’d). Financial assets by country, type of asset and investor
0500
Currency and depositsSecurities other than sharesLoansShares and other equityOther, not elsewhere classified
020,000
Investment FundsInsurance CompaniesPension FundsOther Forms of Institutional Savings
Germany
0
200
400
600
800
1,000
1,200
1,400US$ billion
0
200
400
600
800
1,000
1,200
1,400US$ billion
Greece
0
5
10
15
20
25
30
35
40US$ billion
0
5
10
15
20
25
30
35
40US$ billion
Hungary
0
2
4
6
8
10
12US$ billion
0
2
4
6
8
10
12US$ billion
Source: OECD database on Institutional investors' assets.

RECENT TRENDS ON INSTITUTIONAL INVESTORS STATISTICS
16 FINANCIAL MARKET TRENDS – ISSN 1995-2864 – © OECD 2008
Figure A1 (cont’d). Financial assets by country, type of asset and investor
0500
Currency and depositsSecurities other than sharesLoansShares and other equityOther, not elsewhere classified
020,000
Investment FundsInsurance CompaniesPension FundsOther Forms of Institutional Savings
Iceland
0
2
4
6
8
10
12
14
16US$ billion
0
2
4
6
8
10
12
14
16US$ billion
Italy
0
100
200
300
400
500
600
700US$ billion
0
100
200
300
400
500
600
700US$ billion
Japan
0
500
1,000
1,500
2,000
2,500
3,000
3,500
US$ billion
0
500
1,000
1,500
2,000
2,500
3,000
3,500
US$ billion
Source: OECD database on Institutional investors' assets.

RECENT TRENDS ON INSTITUTIONAL INVESTORS STATISTICS
FINANCIAL MARKET TRENDS – ISSN 1995-2864 - © OECD 2008 17
Figure A1 (cont’d). Financial assets by country, type of asset and investor
0500
Currency and depositsSecurities other than sharesLoansShares and other equityOther, not elsewhere classified
020,000
Investment FundsInsurance CompaniesPension FundsOther Forms of Institutional Savings
Korea
0
50
100
150
200
250
300
350
400US$ billion
0
50
100
150
200
250
300
350
400US$ billion
Luxembourg
0
5
10
15
20
25
30
35
40US$ billion
0
5
10
15
20
25
30
35
40US$ billion
Netherlands
0
100
200
300
400
500
600US$ billion
0
100
200
300
400
500
600US$ billion
Source: OECD database on Institutional investors' assets.
RECENT TRENDS ON INSTITUTIONAL INVESTORS STATISTICS
18 FINANCIAL MARKET TRENDS – ISSN 1995-2864 – © OECD 2008
Figure A1 (cont’d). Financial assets by country, type of asset and investor
0500
Currency and depositsSecurities other than sharesLoansShares and other equityOther, not elsewhere classified
020,000
Investment FundsInsurance CompaniesPension FundsOther Forms of Institutional Savings
Norway
0
10
20
30
40
50
60
70US$ billion
0
10
20
30
40
50
60
70US$ billion
Poland
0
5
10
15
20
25
30
35
40US$ billion
0
5
10
15
20
25
30
35
40US$ billion
Portugal
05
101520253035404550
US$ billion
05
101520253035404550
US$ billion
Source: OECD database on Institutional investors' assets.

RECENT TRENDS ON INSTITUTIONAL INVESTORS STATISTICS
FINANCIAL MARKET TRENDS – ISSN 1995-2864 - © OECD 2008 19
Figure A1 (cont’d). Financial assets by country, type of asset and investor
0500
Currency and depositsSecurities other than sharesLoansShares and other equityOther, not elsewhere classified
020,000
Investment FundsInsurance CompaniesPension FundsOther Forms of Institutional Savings
Spain
0
50
100
150
200
250US$ billion
0
50
100
150
200
250US$ billion
Sweden
0
50
100
150
200
250
300US$ billion
0
50
100
150
200
250
300US$ billion
Switzerland
0
50
100
150
200
250
300
350US$ billion
0
50
100
150
200
250
300
350US$ billion
Source: OECD database on Institutional investors' assets.

RECENT TRENDS ON INSTITUTIONAL INVESTORS STATISTICS
20 FINANCIAL MARKET TRENDS – ISSN 1995-2864 – © OECD 2008
Figure A1 (cont’d). Financial assets by country, type of asset and investor
0500
Currency and depositsSecurities other than sharesLoansShares and other equityOther, not elsewhere classified
020,000
Investment FundsInsurance CompaniesPension FundsOther Forms of Institutional Savings
Turkey
02468
101214161820
US$ billion
02468
101214161820
US$ billion
United Kingdom
0200400600800
1,0001,2001,4001,6001,8002,000
US$ billion
0200400600800
1,0001,2001,4001,6001,8002,000
US$ billion
United States
0
2,000
4,000
6,000
8,000
10,000
12,000
14,000US$ billion
0
2,000
4,000
6,000
8,000
10,000
12,000
14,000US$ billion
Source: OECD database on Institutional investors' assets.

RECENT TRENDS ON INSTITUTIONAL INVESTORS STATISTICS
FINANCIAL MARKET TRENDS – ISSN 1995-2864 - © OECD 2008 21
Table A1. Financial assets issued by non residents
As a percent of each type of asset held by institutional investors(1)
1995 1996 1997 1998 1999 2000 2001 2002 2003 2004 2005 2006 2007
Australia (2)
Securities 8 8 9 11 12 14 17 17 15 17 19 21 .Loans 2 1 1 3 3 13 13 14 12 11 7 5 .Shares 21 22 24 24 28 27 28 27 26 24 25 25 .Total 15 15 17 18 22 22 24 23 22 22 23 24 .
AustriaSecurities 21 25 30 33 47 53 59 65 67 71 74 76 77Loans . 0 0 1 1 2 1 1 1 2 4 6 8Shares 21 22 24 29 33 44 37 28 29 28 31 35 31Total 16 18 23 27 36 44 42 42 43 45 48 51 48
BelgiumSecurities 13 15 18 37 39 47 51 57 62 69 71 73 75Loans . . . 0 4 1 1 1 1 0 2 4 5Shares 36 36 41 51 58 62 62 60 63 63 64 62 63Total 19 21 26 40| 46 51 53 54 58 63 64 64 66
CanadaSecurities . . . . . . . . . . . . .Loans . . . . . . . . . . . . .Shares 34 33 35 40 42 44 45 43 42 39 38 42 40Total . . . . . . . . . . . . .
FinlandSecurities 4 7 8 13 29 52 62 69 72 79 79 80 76Loans 0 0 1 0 0 0 0 1 1 0 5 0 1Shares 6 10 15 18 26 41 45 44 50 50 54 54 55Total 3 6 9 13 25 43 50 54 59 62 64 63 62
FranceSecurities . . . . . . . . . . . . .Loans 2 2 3 2 2 3 4 7 5 16 11 10 13Shares . . . . . . . . . . . . .Total . . . . . . . . . . . . .
GermanySecurities 18 17 21 18 30 36 43 48 48 53 56 59 58Loans 6 5 6 8 9 16 17 19 17 16 17 14 9Shares (3) 20 24 30 44 58 65 63 60 57 58 59 59 55Total 16 16 21 25 39 46 47 46 46 48 52 53 50
GreeceSecurities 9 6 5 8 8 11 28 38 48 52 64 63 72Loans . . . . . . . . . . . . .Shares 9 10 6 6 3 7 8 10 12 16 20 21 20Total 9 6 5 7 5 9 18 28 35 41 51 47 55
Hungary Securities 1 0 0 0 0 0 1 2 1 1 1 2 3Loans . . . . . . . . - 13 3 5 3Shares . . 7 12 16 22 18 17 19 22 31 38 45Total 1 0 1 2 2 3 2 4 3 4 7 12 17
Italy (3)
Securities - - - - 31 35 35 32 34 34 40 41 38Loans . . . . . . . . . . . . .Shares - - - - 47 50 55 57 63 66 70 71 71Total - - - - 39 43 44 41 45 46 52 54 52
Notes and sources: See at the end of the table.

RECENT TRENDS ON INSTITUTIONAL INVESTORS STATISTICS
22 FINANCIAL MARKET TRENDS – ISSN 1995-2864 – © OECD 2008
Table A1 (cont’d). Financial assets issued by non residents
As a percent of each type of asset held by institutional investors(1)
1995 1996 1997 1998 1999 2000 2001 2002 2003 2004 2005 2006 2007
NetherlandsSecurities 23 26 32 39 52 59 68 72 75 78 80 82 81Loans 3 3 3 3 4 4 5 5 3 4 3 12 12Shares 54 50 52 55 66 68 69 67 68 69 71 72 76Total 24 26 31 37 50 54 58 58 62 66 69 71 73
Norway (3)
Securities 0 0 0 0 0 0 0 0 0 0 0 0 0Loans . . . . . . . . . . . . .Shares 20 24 29 46 54 61 58 54 56 54 55 53 51Total 15 17 21 29 37 42 39 35 37 39 41 44 43
PolandSecurities . . 0 0 0 1 3 1 7 3 4 3 .Loans . . . . . . . . . . - - .Shares . . 0 0 0 0 1 3 1 2 3 4 .Total . . 0 0 0 0 2 2 6 3 4| 4 .
PortugalSecurities 6 10 22 30 45 57 63 67 73 77 79 81 80Loans . . - - - - - - - - - - -Shares 12 10 11 13 21 26 32 31 26 29 43 48 51Total 8 10 18 24 36 46 54 59 62 65 70 71 71
SpainSecurities 4 5 10 22 28 42 55 60 64 60 59 56 53Loans . . . . . . . . . . . . .Shares 5 6 13 25 43 51 50 43 44 45 50 53 49Total 4 5 10 22 32 45 53 56 58 55 55 54 52
SwedenSecurities 3 8 12 16 20 32 26 25 25 27 26 21 .Loans 15 14 14 20 17 15 8 1 1 0 2 1 .Shares 35 34 37 40 36 39 44 42 43 41 41 41 .Total 15 20 24 28 29 35 37 33 34 34 35 34 .
SwitzerlandSecurities . . . . 50 51 53 52 56 58 59 . .Loans . . . . 14 12 16 22 21 27 35 . .Shares . . . . 51 50 56 56 54 51 49 . .Total . . . . 46 46 51 50 51 52 52 . .
United KingdomSecurities 15 15 13 16 14 16 18 17 17 18 18 . .Loans 4 3 4 4 6 8 10 14 8 11 8 . .Shares 27 26 24 25 29 29 31 33 34 36 39 . .Total 23 23 21 22 25 25 27 26 27 28 30 . .
1.
2. Excluding investment companies: Australia (all assets).3. Excluding insurance and pension funds: Germany (only AF5 Shares), Italy, Norway.Source : OECD database on Institutional investors' assets.
Assets AF33 Securities other than shares , AF4 Loans and AF5 Shares other than equity are broken out out between assets issued by residents and assets issued by non-residents.