recent wetland trends in anne arundel county, maryland
TRANSCRIPT

National Wetlands Inventory
March 1992
Recent Wetland Trends in Anne Arundel County, Maryland
(1981-82 to 1988-90)
U.S. DEPARTMENT of the INTERIOR
FISH and WILDLIFE SERVICE
u.s.. FISH .... WILD.I..IF£
SERVICE

NATIONAL WETLANDS INVENTORY March 1992
RECENT WETLAND TRENDS IN ANNE ARUNDEL COUNTY, MARYLAND (1981-82 to 1988-90)
U.S. Depnrtm.ont of tho Intonor
Fish and Wildlife Service, Region 5

Recent Wetland Trends in Anne Arundel County, Maryland (1981-82 to 1988-90)
Ralph W. Tiner and David B. Foulis U.S. Fish and Wildlife Service
Fish and Wildlife Enhancement Region 5
Newton Comer, MA 02158
Prep~ed for: Maryland Department of Natural Resources
Water Resources Administration Nontidal Wetlands Division
Annapolis, MD 21401
March 1992

ACKNOWLEDGMENTS
Funding for this project was provided by the Maryland Department of Natural Resources, Water Resources Administration through an existing cooperative agreement with the U.S. Fish and Wildlife Service. David G. Burke was the project officer and we appreciate his interest in monitoring wetland trends in Maryland.
Several individuals associated with the Service's National Wetlands Inventory Project provided technical support necessary to complete this study. Becky Stanley helped in obtaining necessary aerial photographs and plotted work areas on the mylar overlays. Glenn Smith provided quality control of photo interpretation done by the junior author. Don Woodard coordinated the compilation of acreage statistics. Joanne Gookin helped organize statistical results in a readily useable format. Joan Gilbert entered acreage data for computer analysis and typed the manuscript. We gratefully acknowledge their support.
i

INTRODUCTION
Wetlands are subjected to a multitude of impacts, both natural and human-induced. Wetlands may change from one type to another, e.g., emergent wetland to scrub-shrub wetland, due to natural succession or to minor filling or drainage. Most wetlands change more slowly over time. Knowledge of wetland losses and gains is important for evaluating the effect of government programs designed to protect them and for developing effective strategies to reverse undesirable trends.
In 1990, the Maryland Department of Natural Resources, Water Resources Administration provided funding to the U.S. Fish and Wildlife Service, Region 5 to initiate county-based wetland trend studies in Maryland. The Department is interested in learning how wetlands have recently changed in the state and how pressures to alter wetlands vary from county to county across the state. The purpose of this report is to present the tmdings of the wetland trend analysis study for Anne Arundel County, the first county to be completed under this agreement.
STUDY AREA
The study area is Anne Arundel County, Maryland situated on the Atlantic Coastal Plain and bordering Chesapeake Bay (Figure I). The County has a land surface area of 418 square miles (Hoffman 1992). This area is covered by the following large-scale (I :24,000) U.S. G~logical S~ey topographic quadrangles: Annapolis, Bowie, Bristol, Curtis Bay, Deale, Gibson Island, Kent Island, Laurel, Lower Marlboro, Love Point, North Beach, Odenton, Relay. Round Bay, Savage, South River, Sparrows Point, and Swan Point.
METHODS
Wetland trend analysis involves comparing aerial photography from at least two time periods. For the present study, aerial photos from 1981-82 and from 1988-90 were examined and compared to determine the extent of wetland changes (losses, gains, or changes in wetland type) that occurred during that time period in Anne Arundel. County.
The 1981-82 photography was 1:58,000-scale color infrared (CIR) aerial photography acquired by the U.S. Geological Survey's National High-Altitude Photography Program (NHAP). The 1988-90 photography was 1:40,OOO-scale color infrared (CIR) aerial photography acquired by the National Aerial Photography Program (NAPP). Wetlands and deepwater habitats were initially interpreted on the 1:58,000 photography. Wetlands and deepwater habitats were classified according to the Service's official wetland classification system (Cowardin, et al. 1979), following standard NWl mapping conventions (National
Wetlands Inventory, 1990). These interpretations served as the basis for evaluating current wetland status and trends.

Figure 1. Location of Study Area - Anne Arundel County, Maryland;
Anne Arundel County
Washington, D.C.
Odenton -----.;;
little Patuxent River
Davidsonville ----..Jj4.
Patuxent River
Jug
Baltimore
~...,}----r- Annapolis
Patapsco River
~-- Pasadena
Magothy River
Severn River
-",.---- West River
Shady Side
Deale
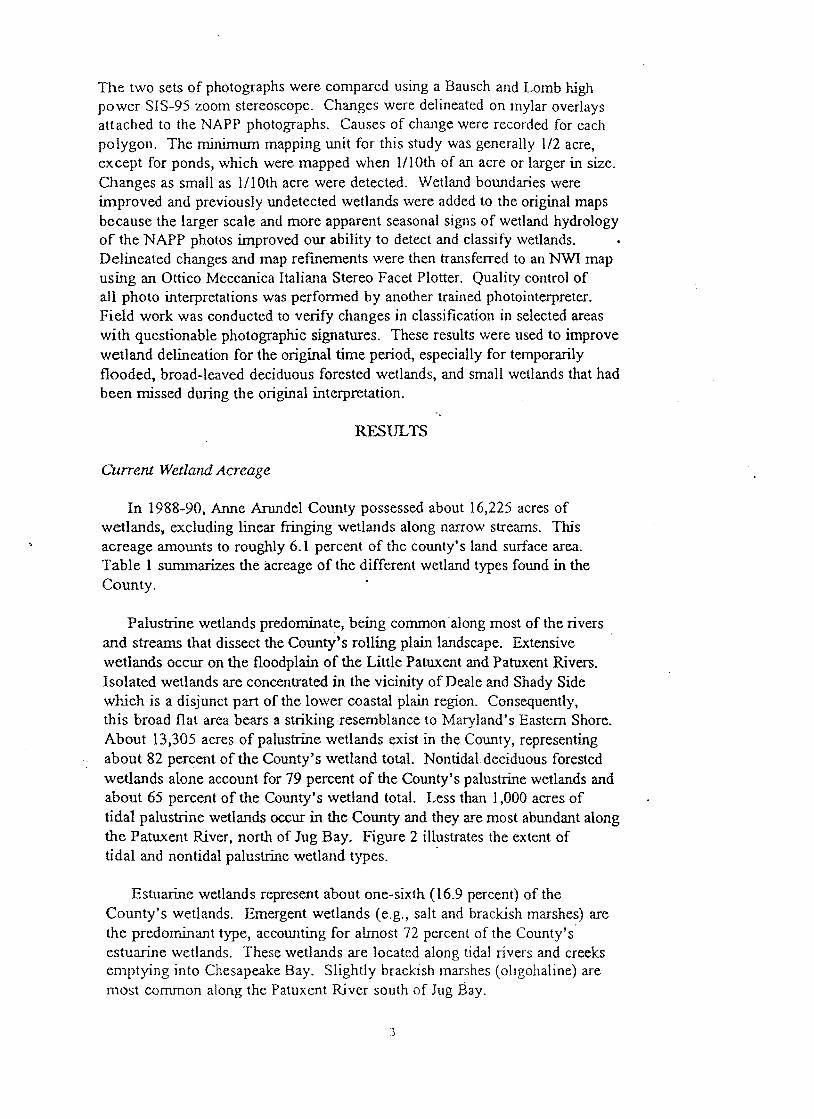
The two sets of photographs were compared using a Bausch and Lomb high power SIS-95 zoom stereoscope. Changes were delineated on mylar overlays attached to the NAPP photographs. Causes of change were recorded for each polygon. The minimum mapping unit for this study was generally 112 acre, except for ponds, which were mapped when llIOth of an acre or larger in size. Changes as small as Ill0th acre were detected. Wetland boundaries were improved and previously undetected wetlands were added to the original maps because the larger scale and more apparent seasonal signs of wetland hydrology of the NAPP photos improved our ability to detect and classify wetlands. Delineated changes and map refinements were then transferred to an NWI map using an Ottico Meccanica Italiana Stereo Facet Plotter. Quality control of all photo interpretations was performed by another trained photo interpreter. Field work was conducted to verify changes in classification in selected areas with questionable photographic signatures. These results were used to improve wetland delineation for the original time period, especially for temporarily flooded, broad-leaved deciduous forested wetlands, and small wetlands that had been missed during the original interpretation.
RESULTS
Current Wetland Acreage .
In 1988-90, Anne Arundel County possessed about 16,225 acres of wetlands, excluding linear fringing wetlands along narrow streams. This acreage amounts to roughly 6.1 percent of the county's land surface area. Table 1 summarizes the acreage of the different wetland types found in the County.
Palustrine wetlands predominate, being common·along most of the rivers and streams that dissect the County's rolling plain landscape. Extensive . wetlands occur on the floodplain of the Little Patuxent and Patuxent Rivers. Isolated wetlands are concentrated in the vicinity of Deale and Shady Side which is a disjunct part of the lower coastal plain region. Consequently, this broad flat area bears a striking resemblance to Maryland's Eastern Shore. About 13,305 acres of palustrine wetlands exist in the County, representing about 82 percent of the County's wetland totaL Nontidaldeciduous forested wetlands alone account for 79 percent of the County's palustrine wetlands and about 65 percent of the County's wetland total. Less than 1,000 acres of tidal palustrine wetlands occur in the County and they are most abundant along the Patuxent River, north of Jug Bay. Figure 2 illustrates the extent of tidal and nontidal palustrine wetland types. .
Estuarine wetlands represent about one-sixth (16.9 percent) of the County's wetlands. Emergent wetlands (e.g., salt and brackish marshes) are the predominant type, accounting for almost 72 percent of the County's' estuarine wetlands. These wetlands are located along tidal rivers and creeks emptying into Chesapeake Bay. Slightly brackish marshes (oligohahne) are most common along the Patuxent River south of Jug Bay.
]

Table 1. 1988-90 acreage of wetland types in Anne Arundel County, Maryland.
PALUSTRINE WETLANDS
Tidal Emergent Nontidal Emergent
SeasonaU y Flooded/Saturated Seasonally Flooded Temporarily Flooded Semipermanently Flooded Permanently Flooded Subtotal Nontidal
Total Palustrine Emergent Wetlands
Tidal Forested Nontidal Forested
Evergreen Temporarily Flooded
Deciduous SeasonaU y Flooded/Saturated Seasonally Flooded Temporarily Flooded Dead Other Subtotal Nontidal
Total Palustrine Forested Wetlands
Tidal Scrub-shrub Nontidal Scrub-shrub
Seasonally Flooded/Saturated Seasonally Flooded Temporarily Flooded Other Subtotal Nontidal
Total Palustrine Scrub-shrub Wetlands
Aquatic Beds
Total Palustrine Vegetated Wetlands
Unconsolidated Bottoms (ponds) Unconsolidated Shores
Total Palustrine Nonvegetated Wetlands
GRAND TOTAL PALUSTRINE WETLANDS
(continued)
4
365.0
144.7 94.9
123.5 142.4
5.8 (511.3)
876.3
403.7
7.2
855.6 2,134.6 7,486.9
60.5 3.6
(10,548.4)
10,952.1
93.4
87.6 109.9 211.8 42.4
(451.7)
545.1
14.7
12,388.2
857.8 58.6
916.4
13,304.6

ESTUARINE WETLANDS
Emergent Regularly Flooded Irregularly Flooded Oligohaline
Tolal Estuarine Emergent Wetlands
Scrub-shrub
Tolal Estuarine Vegetated Wetlands
Unconsolidated Shore Sand (Beach) Mud ([idal Flat)
Total Estuarine Unconsolidated Shores
GRAND TOTAL ESTUARINE WETLANDS·
RIVERINE WETLANDS
Tidal Emergent Nontidal Unconsolidated Shore
GRAND TOTAL RIVERINE WETLANDS
LACUSTRINE WETLANDS
Emergent
GRAND TOTAL LACUSTRINE WETLANDS
TOTAL WETLANDS
26.0 1,644.8
293.7
1,964.5
33.7
1,998.2
115.3 628.9
744.2
2,742.4
154.3 1.3
155.6
22.2
22.2
16,224.8

0'
Figure 2. 1988-90 acreage of palustrine wetland types in Anne Arundel County, Maryland.
Thousands of acres
12
10 I .. '
8
6 1"
.. ..
I .. 4
2
0 ~ 0
0,(:$
<v~
.. .. . .. - .. .. .. .. .. .. .. .. '", ., -, '., ,- .. .. .. .. .. .. .. .. .. .. .. .. .. .: .. ,. .. .. .. .. .. .. .. .. .. .. .. .. .. ..
. " . ~ .. '" ."'.... ...: ~ ... e· .. .. ~:- .. '
.. ~.' .. .. .. .. .. .. .. .. .
o ~0 ""
0Cj
«O~
.§> ~
~,Cj CJ,.::f.
o
0° <?O~
DTidal - Nontidal

Recent Wetland Trends
The results of the wetland trend analysis study for Anne Arundel County are presented in Tables 2 through 7. The following discussion highlights the more significant or interesting fmdings.
Vegetated Wetlands
Given the short time period examined (approximately 7.5 years), most of the wetlands in the county remained unchanged. Only 1.5 percent of the wetlands changed in some way (Table 2). Fifty-six percent of these changes involved filling wetlands to create land for development (upland). Palustrine forested wetlands were the most negatively impacted with about 112 acres converted to upland. The major causes of wetland destruction were road and highway construction, house lot creation, commercial and industrial development, and expansion of public facilities (e.g., government buildings and access roadways) (Figure 3). Temporarily flooded wetlands received the brunt of the adverse impacts (fable 3), with 71 percent of the loss of palustrine vegetated wetlands to upland involving temporarily flooded forested wetlands (Table 4). Change from one wetland type to another accounted for less than one third of the total change in the 1981-82 wetlands (Table 2). Most of these type changes were caused by timber harvest (15 acres) or road and highway construction (12.2) acres. Beavers played a modest role in altering wetland types, with 7.5 acres affected. Other factors influencing vegetation patterns in Anne Arundel County's wetlands included natural succession and transmission corridor deyelopment.
In addition to the losses of vegetated wetlands, there were some gains (Table 5). Gains from nonvegetated wetlands and from uplands were nearly equal (12.5 acres and 13.4 acres, respectively). Most of the gains from upland involved the creation of palustrine emergent wetlands (freshwater marshes). These new marshes were established in sand and gravel pits or along the shores of newly created ponds. Some marsh creation may have been initiated as mitigation for permitted wetland destruction during this period. Despite slight gains in vegeta~ed wetlands, there was a net loss of about 153 acres of vegetated wetlands between 1981-82 and 1988-90.
Nonvegetated Wetlands
In marked contrast to the downward trend in vegetated wetlands, non vegetated wetlands are increasing, largely due to pond construction. In Anne Arundel County, there was a net gain of about 159 acres in nonvegetated wetlands between 1981-82 and 1988-90 (Table 6). Nearly all of this gain was attributed to the construction of freshwater ponds. Over 81 percent of these ponds were created in uplands, while the remainder were built in vegetated ""vethmds, mostly in po.luotrino emert;cnt wetland;). AIIllO~l 30 pe:rcem of me new upland ponds were created in sand and gravel pits or on farmland, but most of the ponds were built in other areas (Table 7).
7

Figure 3. Causes of vegetated wetland conversion (loss) to upland in Anne Arundel County, Maryland (1981-82 to 1988-90).
00 Public Facilities Dev. (22.2 acres)
Unknown (6.2 acres)
Sand & Gravel Pits (4.3 acres)
Agriculture (3.3 acres) Marina (2.1 acres)
Perce ntages are rounded off
Comm./lnd. Development (25.6 acres)
Housing (37.3 acres)
Roads/Highways (38.2 acres)

Table 2. Recent changes of vegetated wetlands in Anne Arundel County (1981- 82 to 1988-90).
Wetland Type
Converted to Upland
(acres)
Palustrine Emergent 20.2
Palustrine Scrub-Shrub 1.3
Palustrine Forested 111.5
Palustrine Aquatic Bed 0.3
Lacustrine Emergent 0
Estuarine Emergent 5.4
Estuarine Scrub-Shrub 0.3
139.2
Changed to Other Changed to Vegetated Wetlands* Nonvegetated
(acres) Wetlands (acres)
12.0 18.9
3.2 4.4
54.8 7.8
o o
o o
1.5 7.2
o o
71.5 38.3
Converted to Deepwater Habitat (acres)
d
o
o
o
o
1.1
0.3
1.4
* Represents changes in class (e.g., emergent to. scrub-shrub) but not changes in water regime within a given wetland class.
Table 3. Recent conversion of hydrologically similar palustrine vegetated wetlands to upland developments in Anne Arundel County (1981-82 to 1988-90).
Palustrine Wetland Type Acres % ofTotaI.Loss
Temporaril y Flooded 105.5 79.1
Seasonally Flooded 17.1 12.8
Seasonally Flooded/Saturated 9.2 6.9
Semipermanently Flooded 0.8 0.6
Seasonally Flooded-Tidal 0.7 0.6
133.3 100.0
9

Table 4. Recent changes in palustrine forested wetlands in Anne Arundel County (1981-82 to 1988-90).
Converted to Changed to Other Total Upland Wetland Types'" Loss
Forested Wetland Type (acres) (acres) (acres)
Seasonally Flooded/Saturated 8.8 14.9 23.7
Seasonally Flooded 7.7 8.7 16.4
Temporarily Flooded 94.3 31.2 125.5
SemipermanentlylPermanently Flooded*'" 0 1.1 1.1
Seasonally Flooded-Tidal 0.7 1.1 1.8
111.5 57.0 168.5
Includes both changes in class (e.g., forested to emergent) and changes in water regime within class.
* '" Represents dead forested wetlands.
10

Table 5. Recent gains in vegetated wetlands in Anne Arundel County (1981-82 to 1988-90)~
Gain from Gain from Nonvegetated Other Gain from
Wetlands Vegetated Wetlands Upland Wetland Type (acres) (acres) (acres)
Estuarine Emergent 2.1 * 0 2.3
Estuarine Scrub-shrub 0 1.5 0
Palustrine Emergent 9.3 13.5 7.7
Palustrine Scrub-shrub 0.4 40.3 1.3
Palustrine Forested 0 --16.2** 2.1 ***
Palustrine Aquatic Bed 0.7 0 0
12.5 71.5 13.4
* Includes 1.8 acres from estuarine subtidal bottoms.
** Represents altered hydrology of forested wetlands to create semipermanently flooded or permanently flooded dead forested wetlands.
*** Represents flooded upland forest primarily due to road construction.
1 1

..... N
Table 6. Recent gains and·losses in nonvegetated wetlands in Anne Arundel County (1981-82 to 1988-90)
Palustrine Unconsolidated Bottom
Palustrine Unconsolidated Shore
Estuarine Unconsolidated Shore
GAINS
Created from Upland
(acres)
145.1
22.8
0.4
168.3
Created in Vegetated Wetlands (acres)
22.3
8.8
7.2
38.3
LOSSES
Changed to Changed to Other Non-
Converted to Vegetated vegetated Upland Wetlands Wetlands (acres) (acres) (acres)
20.9 10.2 2.5
15.2 0.3 1.5
l.1 0.3 0.5
37.2 10.8 4.5
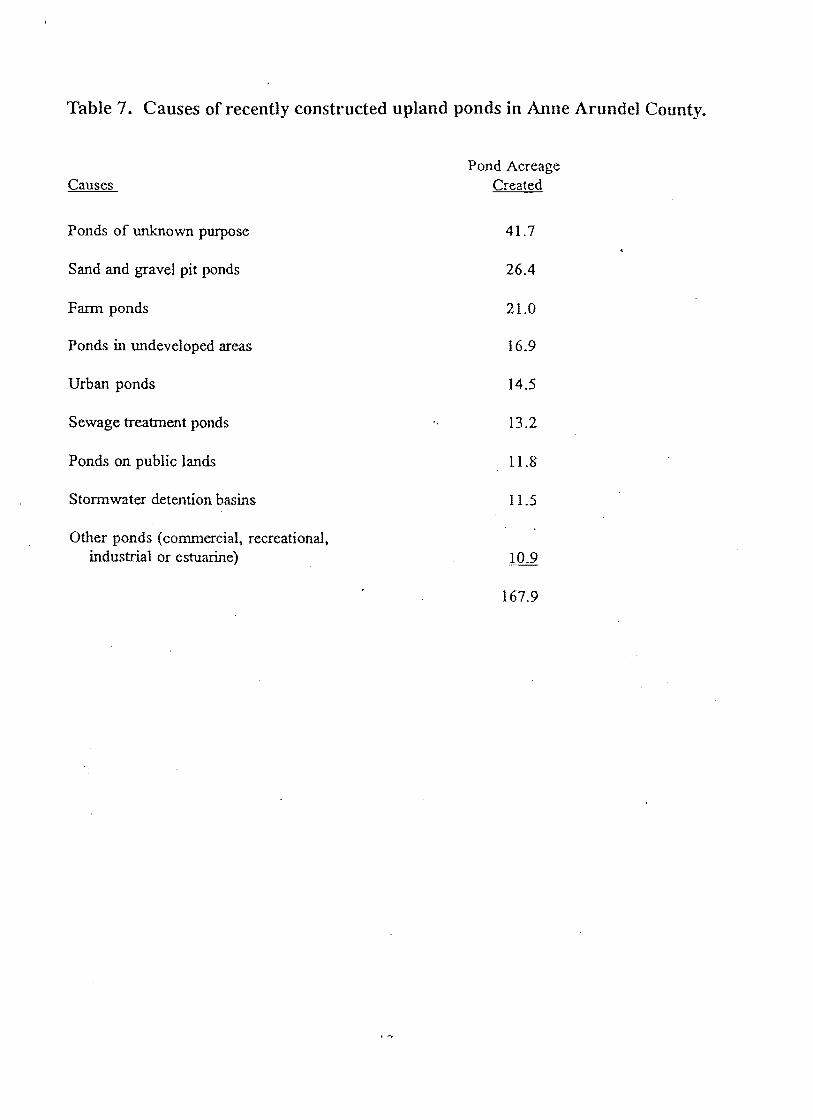
Table 7. Causes of recently constructed upland ponds in Anne Arundel County.
Causes
Ponds of unknown purpose
Sand and gravel pit ponds
Farm ponds
Ponds in undeveloped areas
Urban ponds
Sewage treatment ponds
Ponds on public lands
Stonnwater detention basins
Other ponds (commercial, recreational, industrial or estuarine)
Pond Acreage Created
41.7
26.4
21.0
16.9
14.5
13.2
11.8
11.5
167.9

Summary
Anne Arundel County has about 6.1 percent of its land area covered by wetlands. A total of 16,225 acres of wetlands was identified in the County by the Service's National Wetlands Inventory. Palustrine forested wetland is the dominant wetland type.
Between 1981-82 and 1988-90, the County lost about 179 acres of vegetated wetlands, with roughly 139 acres converted to upland. Temporarily flooded forested wetland was the most frequently converted type. During the study period, pond construction increased the acreage of nonvegetated wetlands by 159 acres. The overall trend for the County's wetlands were losses of vegetated wetlands and gains in nonvegetated wetlands (ponds). The significance of the increase in ponds to fish and wildlife species has not been assessed and remains a point for discussion. The losses of vegetated wetlands, however, represent known losses of valuable fish and wildlife habitats and areas providing other wetland' functions,. While this report documents recent trends in the County's wetlands, it does not address changes in the quality of the remaining wetlands. As urban development increases, the quality of wetlands can be expected to deteriorate due to urban runoff, increased sedimentation, groundwater withdrawals, increased water pollution, and other factors, unless adequate safeguards are. taken to protect not only the existence of wetlands, but their quality. . .
REFERENCES
Coward in, L.M., V. Carter, F.C. Golet, and T. LaRoe. 1979. Classification of Wetlands and Deepwater Habitats of the United States. U.S. Fish and Wildlife Service, Washington, DC. FWS/OBS-79/31. 103 pp .
. Hoffman, M.S. (editor). 1992. The World AJmanac and Book of Facts. Newspaper Enterprise Association, Inc., New York. 960 pp.
National Wetlands Inventory .. 1990. Photointerpretation Conventions for the National Wetlands Inventory. U.S. Fish and Wildlife Service, St. Petersburg, FL. 45 pp. plus appendices.
11.