recent work in well performance analysis for tight gas ... · presentation at marathon oil marathon...
TRANSCRIPT

Presentation at Marathon OilMarathon Shale Workshop: Reservoir Engineering Session
Recent Work in Well Performance Analysis for Tight Gas Sands and Gas ShalesT.A. Blasingame/Texas A&M U. (06 November 2009) Sl
ide
—1/
63
Recent Work inWell Performance Analysis for
Tight Gas Sands and Gas Shales
Presentation at Marathon OilMarathon Shale Workshop: Reservoir Engineering Session
06 November 2009 — Houston, TX
Tom BLASINGAMEDepartment of Petroleum Engineering
Texas A&M UniversityCollege Station, TX 77843-3116 (USA)
+1.979.845.2292 — [email protected]

Presentation at Marathon OilMarathon Shale Workshop: Reservoir Engineering Session
Recent Work in Well Performance Analysis for Tight Gas Sands and Gas ShalesT.A. Blasingame/Texas A&M U. (06 November 2009) Sl
ide
—2/
63
SPE 110187Evaluating the Impact of Waterfrac
Technologies on Gas Recovery Efficiency: Case Studies Using Elliptical
Flow Production Data Analysis
D. Ilk,* Texas A&M U.J.A. Rushing, Anadarko Petroleum Corp.R.B. Sullivan, Anadarko Petroleum Corp.
and T.A. Blasingame, Texas A&M U.*Department of Petroleum Engineering
Texas A&M UniversityCollege Station, TX 77843-3116
+1.979.458.1499 — [email protected]

Presentation at Marathon OilMarathon Shale Workshop: Reservoir Engineering Session
Recent Work in Well Performance Analysis for Tight Gas Sands and Gas ShalesT.A. Blasingame/Texas A&M U. (06 November 2009) Sl
ide
—3/
63
Elliptical Flow Type Curves: [Amini et al (2007)]
●Discussion: Elliptical Flow Type Curves■ Equivalent constant rate type curves shown in qD versus tDA format.■ Elliptical fracture conductivity: FE = 1, 10, 100, 1000.■ Elliptical geometry parameter: ξ0 = 0.25, 0.50, 0.75, 1, 1.50, 1.75, 2, 3, 4, 5.
■ Type curve for a fractured well centered in a closed (homogeneous) elliptical reservoir — FE=10, various ξ0-values; qD functions versus tDA format.
■ Type curve for a fractured well centered in a closed (homogeneous) elliptical reservoir — FE=1, various ξ0-values; qD functions versus tDA format.

Presentation at Marathon OilMarathon Shale Workshop: Reservoir Engineering Session
Recent Work in Well Performance Analysis for Tight Gas Sands and Gas ShalesT.A. Blasingame/Texas A&M U. (06 November 2009) Sl
ide
—4/
63
Elliptical Flow Type Curves: [Amini et al (2007)]
●Discussion: Elliptical Flow Type Curves■Objective: To demonstrate the elliptical boundary model as a diagnostic
to establish the elliptical (transition) flow regime using production data.■We utilize type curve solutions in terms of the equivalent constant rate
case presented in "decline" form (qD and tDA).
■ Properties that can be estimated using production data analysis based on elliptical flow:— Effective gas permeability, k, md — Effective fracture half-length, xf, ft— Effective fracture conductivity, FE— Contacted gas-in-place, G, BSCF— Effective drainage area, A, acres
■ The characteristic elliptical boun-dary parameter (ξ0) correlates all of the aspects of the drainage area and the fracture half-length:
5.0
0 )2sinh(12
⎥⎦
⎤⎢⎣
⎡=
ξπAx f

Presentation at Marathon OilMarathon Shale Workshop: Reservoir Engineering Session
Recent Work in Well Performance Analysis for Tight Gas Sands and Gas ShalesT.A. Blasingame/Texas A&M U. (06 November 2009) Sl
ide
—5/
63
Procedure:Step 1: Data Overview: "Production History Plot"
General data quality/correlation.Step 2: Data Correlation: "pwf (or ptf) vs. Rate Plot"
Crude comparison — used only for general trends.Step 3: Clean/Edit Data for Clarity: Log-Log Data Plot(s)
Remove spurious data from base data trends (e.g., q/Δp).Step 4: Identify Flow Regimes (Diagnostics): Log-Log Data Plot(s)
Characteristic flow regimes from normalized PI-style plots.Step 5: Compare Data to Reservoir Model:
"Type Curve" matching (data onto a reservoir model).Step 6: Refine Match/Model:
Improve match of model parameters (k, s, xf, FcD, ...) using individual type curves, simulation models, and/or regres-sion methods.
Step 7: Summary History Match:Final "history match" of model and raw data (pwf and q).
Production Analysis: Overview

Presentation at Marathon OilMarathon Shale Workshop: Reservoir Engineering Session
Recent Work in Well Performance Analysis for Tight Gas Sands and Gas ShalesT.A. Blasingame/Texas A&M U. (06 November 2009) Sl
ide
—6/
63
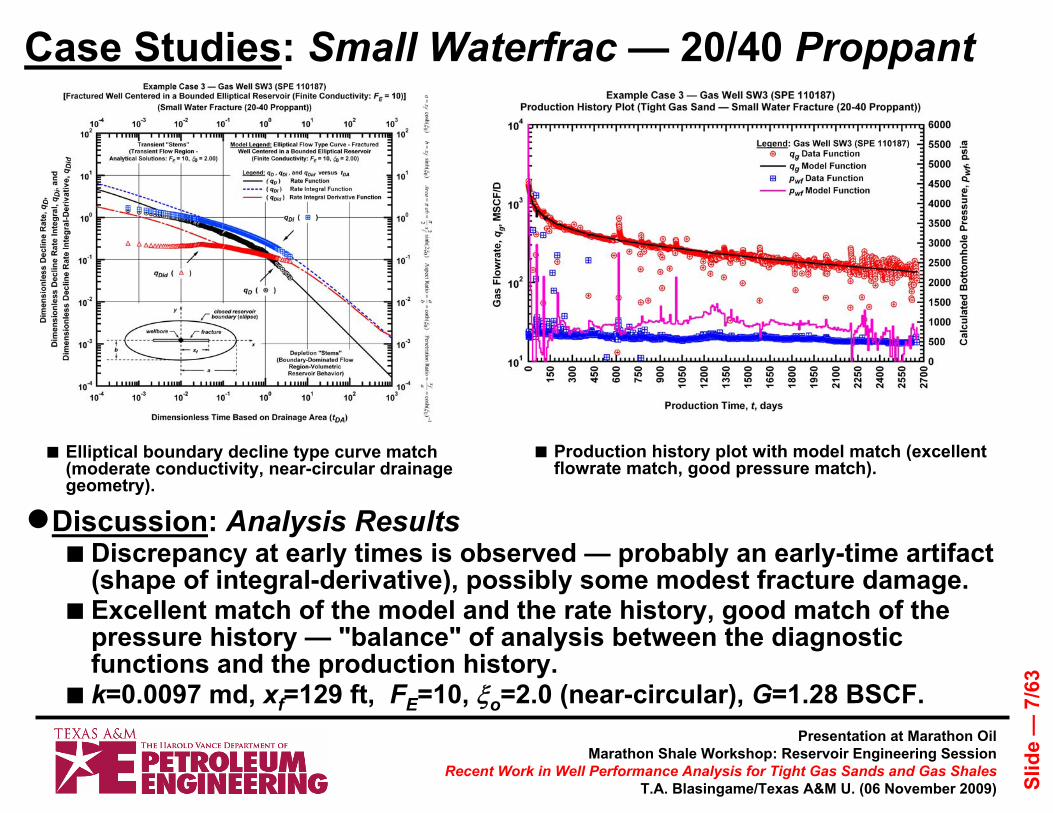
Case Studies: Small Waterfrac — 20/40 Proppant
●Discussion: Diagnosis of the Well Performance Data■ A consistent character in the rate and pressure functions is observed
— qg and pwf data correlation appears to be good to very good.■ qg/Δpp diagnostic functions appear to be relevant — earliest third of
data appear off-trend (weak qg and pwf correlation at early time?).■ Treatment — 7745 bbls of slick water; 63,000 lbs 20/40 proppant.
■ Diagnostic log-log plot (dimensionless rate decline and rate decline integral functions).
■ Production history plot (daily flowrate and pressure measurements).
Presentation at Marathon OilMarathon Shale Workshop: Reservoir Engineering Session
Recent Work in Well Performance Analysis for Tight Gas Sands and Gas ShalesT.A. Blasingame/Texas A&M U. (06 November 2009) Sl
ide
—7/
63
Case Studies: Small Waterfrac — 20/40 Proppant
●Discussion: Analysis Results■ Discrepancy at early times is observed — probably an early-time artifact
(shape of integral-derivative), possibly some modest fracture damage.■ Excellent match of the model and the rate history, good match of the
pressure history — "balance" of analysis between the diagnostic functions and the production history.
■ k=0.0097 md, xf=129 ft, FE=10, ξo=2.0 (near-circular), G=1.28 BSCF.
■ Production history plot with model match (excellent flowrate match, good pressure match).
■ Elliptical boundary decline type curve match (moderate conductivity, near-circular drainage geometry).

Presentation at Marathon OilMarathon Shale Workshop: Reservoir Engineering Session
Recent Work in Well Performance Analysis for Tight Gas Sands and Gas ShalesT.A. Blasingame/Texas A&M U. (06 November 2009) Sl
ide
—8/
63
Case Studies: Large Waterfrac — 20/40 Proppant
●Discussion: Diagnosis of the Well Performance Data■ Erratic pressure and rate data observed from 600-1200 days (we were
told a workover was performed to remedy a "tubing or packer leak").■ Significant well clean-up effects in the pressure data during the first 2
months of production (poor correlation?).■ qg/Δpp diagnostic functions indicate a strong transient flow signature
(≈ 1/2 → high fracture conductivity), BDF is also observed.■ Treatment — 7300 bbls of slick water; 247,500 lbs 20/40 proppant.
■ Diagnostic log-log plot (dimensionless rate decline and rate decline integral functions).
■ Production history plot (daily flowrate and pressure measurements).

Presentation at Marathon OilMarathon Shale Workshop: Reservoir Engineering Session
Recent Work in Well Performance Analysis for Tight Gas Sands and Gas ShalesT.A. Blasingame/Texas A&M U. (06 November 2009) Sl
ide
—9/
63
Case Studies: Large Waterfrac — 20/40 Proppant
●Discussion: Analysis Results■ Excellent type curve match obtained using an elliptical flow model with a
high fracture conductivity (all flow regimes matched!).■Outstanding match of the model and the rate history (qg), good match of
the pressure history (pwf) — surface pressure data is not representative of the bottomhole condition (up to 600 hr) due to "tubing/packer" leak.
■ k=0.0039 md, xf=184 ft, FE=1000, ξo=1.50 ("fat" ellipse), G=3.31 BSCF.
■ Production history plot with model match (excellent flowrate match, fair pressure match).
■ Elliptical boundary decline type curve match (very high conductivity, "fat" elliptical drainage geometry).

Presentation at Marathon OilMarathon Shale Workshop: Reservoir Engineering Session
Recent Work in Well Performance Analysis for Tight Gas Sands and Gas ShalesT.A. Blasingame/Texas A&M U. (06 November 2009) Sl
ide
—10
/63
Case Studies: Hybrid Waterfracs
●Discussion: Diagnosis of the Well Performance Data■ Erratic nature of the flowrate profile is seen (liquid loading). Major
features of the liquid loading observed for the flowrate data are reasonably well-correlated with the calculated bottomhole pressures.
■ Very clear diagnostic trends are obtained after judicious editing of the qg/Δpp function (1/2 slope during transient flow, 1/1 slope for BDF).
■ Treatment — 2082 bbls of slick water + 4827 bbls of cross-link gel; 510,140 lbs 20/40 proppant.
■ Diagnostic log-log plot (dimensionless rate decline and rate decline integral functions).
■ Production history plot (daily flowrate and pressure measurements).

Presentation at Marathon OilMarathon Shale Workshop: Reservoir Engineering Session
Recent Work in Well Performance Analysis for Tight Gas Sands and Gas ShalesT.A. Blasingame/Texas A&M U. (06 November 2009) Sl
ide
—11
/63
●Discussion: Analysis Results■ Extraordinary "type curve match" is observed for this case — the well
is effectively stimulated and a low reservoir permeability is expected.■Model flowrate response corresponds well with the observed flowrate
data. The pressure match is not as poor as it might seem given the very erratic nature of the flowrate function.
■ k=0.0030 md, xf=200 ft, FE=1000, ξo=1.00 ("thin" ellipse), G=1.60 BSCF.
■ Production history plot with model match (very good flowrate match, acceptable pressure match).
■ Elliptical boundary decline type curve match (very high conductivity, "thin" elliptical drainage geometry).
Case Studies: Hybrid Waterfracs

Presentation at Marathon OilMarathon Shale Workshop: Reservoir Engineering Session
Recent Work in Well Performance Analysis for Tight Gas Sands and Gas ShalesT.A. Blasingame/Texas A&M U. (06 November 2009) Sl
ide
—12
/63
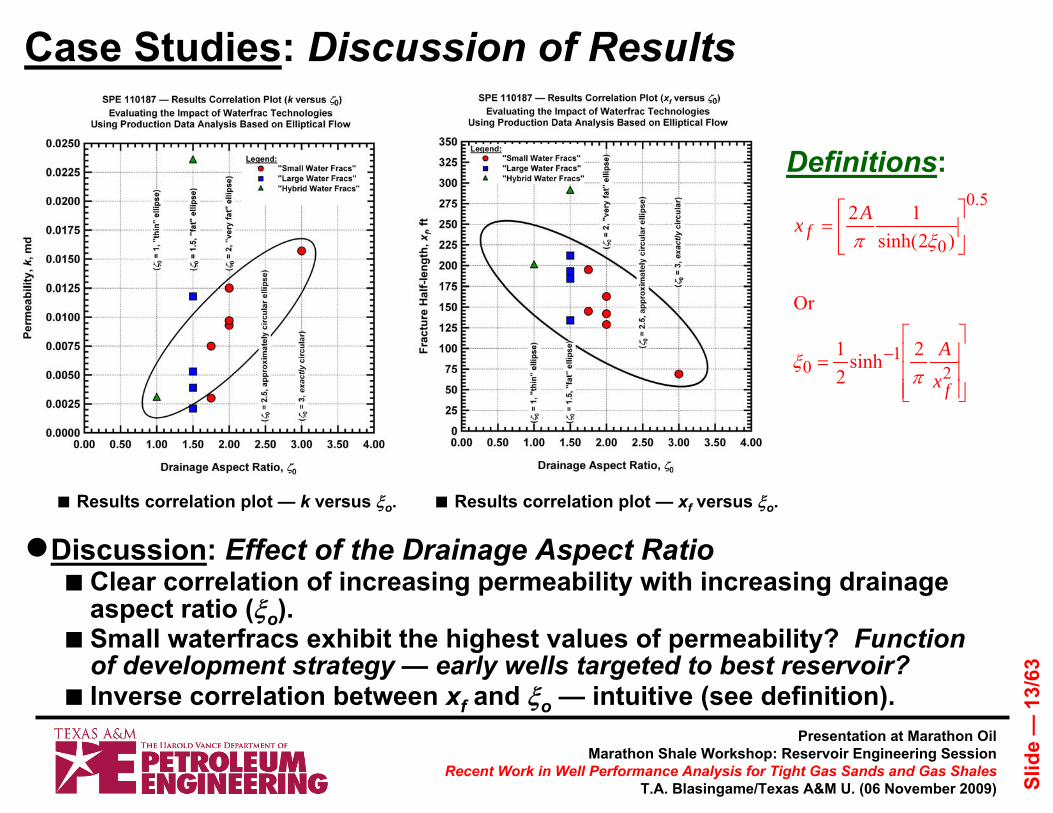
Case Studies: Discussion of Results
●Discussion: Effect of the Contacted Gas-In-Place■ Expectation — higher reservoir permeabilities, higher contacted gas-
in-place estimates.■Most small waterfrac cases are off-trend (a single on-trend point with
high permeability and high contacted gas-in-place estimate is noted).■ Excellent correlation of contacted gas-in-place with fracture half-
length — confirming that "the fracture defines the reserves."
■ Results correlation plot — G versus xf.■ Results correlation plot — G versus k.
Presentation at Marathon OilMarathon Shale Workshop: Reservoir Engineering Session
Recent Work in Well Performance Analysis for Tight Gas Sands and Gas ShalesT.A. Blasingame/Texas A&M U. (06 November 2009) Sl
ide
—13
/63
Case Studies: Discussion of Results
●Discussion: Effect of the Drainage Aspect Ratio■ Clear correlation of increasing permeability with increasing drainage
aspect ratio (ξo).■ Small waterfracs exhibit the highest values of permeability? Function
of development strategy — early wells targeted to best reservoir?■ Inverse correlation between xf and ξo — intuitive (see definition).
■ Results correlation plot — xf versus ξo. ■ Results correlation plot — k versus ξo.
Definitions:
⎥⎥⎥
⎦
⎤
⎢⎢⎢
⎣
⎡=
⎥⎦
⎤⎢⎣
⎡=
−2
10
5.0
0
2sinh21
Or
)2sinh(12
f
f
x
A
Ax
πξ
ξπ

Presentation at Marathon OilMarathon Shale Workshop: Reservoir Engineering Session
Recent Work in Well Performance Analysis for Tight Gas Sands and Gas ShalesT.A. Blasingame/Texas A&M U. (06 November 2009) Sl
ide
—14
/63
D. Ilk, Texas A&M UniversityA.D. Perego, Anadarko Petroleum Corp. J.A. Rushing, Anadarko Petroleum Corp.T.A. Blasingame, Texas A&M UniversityDepartment of Petroleum Engineering
Texas A&M UniversityCollege Station, TX 77843-3116
+1.979.458.1499 — [email protected]
SPE 116731Exponential vs. Hyperbolic Decline in Tight Gas
Sands — Understanding the Origin and Implications for Reserve Estimates Using Arps' Decline Curves

Presentation at Marathon OilMarathon Shale Workshop: Reservoir Engineering Session
Recent Work in Well Performance Analysis for Tight Gas Sands and Gas ShalesT.A. Blasingame/Texas A&M U. (06 November 2009) Sl
ide
—15
/63
Rationale For This WorkASSUMPTION: The Arps decline parameter, b, defines the decline
behavior when tight gas sand reserves are assessed.REALITY: Difficult to identify the correct b-parameter during
the early decline period — selection of the wrong b-parameter greatly impacts reserve estimates.
b. (Log-log plot) Production forecast of a tight gas well.a. (Semilog plot) Production forecast of a tight gas well.

Presentation at Marathon OilMarathon Shale Workshop: Reservoir Engineering Session
Recent Work in Well Performance Analysis for Tight Gas Sands and Gas ShalesT.A. Blasingame/Texas A&M U. (06 November 2009) Sl
ide
—16
/63
Overview: Loss Ratio (Definition and Behavior)Loss Ratio: (basis for exponential rate decline)
Loss Ratio Derivative: (basis for hyperbolic rate decline)dtdq
qD g
g/
1−≡
⎥⎥⎦
⎤
⎢⎢⎣
⎡−≡⎥⎦
⎤⎢⎣⎡≡
dtdqq
dtd
Ddtdb
g
g/
1
]exp[ tDqq igig −=
)/1()(1 bi
gig
tbD
+=
[From: Johnson, R.H. and Bollens, A.L.: "The Loss Ratio Method of Extrapolating Oil Well Decline Curves," Trans., AIME (1927) 77, 771.]

Presentation at Marathon OilMarathon Shale Workshop: Reservoir Engineering Session
Recent Work in Well Performance Analysis for Tight Gas Sands and Gas ShalesT.A. Blasingame/Texas A&M U. (06 November 2009) Sl
ide
—17
/63
Overview: Arps' Rate Decline FunctionsCase Rate-Time Relation Cumulative-Time Relation
]exp[ tDqq igig −=
)/1()(1 bi
gig
tbD
+=
)(1 tDq
qi
gig +=
Exponential: (b=0)
Hyperbolic: (0<b<1)
Harmonic: (b=1)
]]exp[[1 tDDq
G ii
gip −−=
])(1[1 )(1
)/1(1 bi
i
gip tbD
Dbq
G −+−−
=
)ln(1 tDDq
G ii
gip +=
[From: Arps, J.J: "Analysis of Decline Curves," Trans., AIME (1945) 160, 228-247.]
Presentation at Marathon OilMarathon Shale Workshop: Reservoir Engineering Session
Recent Work in Well Performance Analysis for Tight Gas Sands and Gas ShalesT.A. Blasingame/Texas A&M U. (06 November 2009) Sl
ide
—18
/63
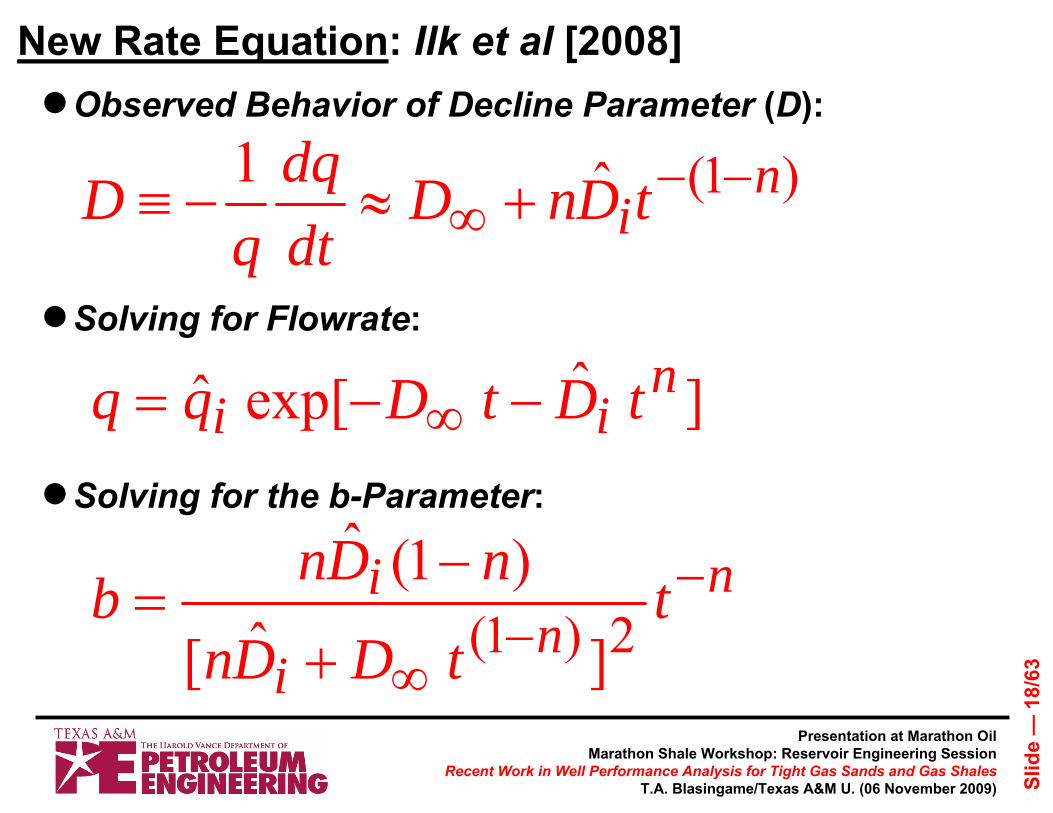
New Rate Equation: Ilk et al [2008]
)1(ˆ1 nitDnD
dtdq
qD −−
∞ +≈−≡
●Observed Behavior of Decline Parameter (D):
●Solving for Flowrate:
] ˆ exp[ ˆ nii tDtDqq −−= ∞
●Solving for the b-Parameter:
nn
i
i ttDDn
nDnb −
−∞+
−= 2)1( ] ˆ[
)1(ˆ

Presentation at Marathon OilMarathon Shale Workshop: Reservoir Engineering Session
Recent Work in Well Performance Analysis for Tight Gas Sands and Gas ShalesT.A. Blasingame/Texas A&M U. (06 November 2009) Sl
ide
—19
/63
Field Examples: Small WF Gas Well (SWF2)
●Discussion: Small Waterfrac Gas Well (SWF2)■ Liquid loading effects are obvious in the latter portion of the flowrate data.■ The onset of the boundary-dominated flow regime is observed.■ D∞ is set to 0 initially, then tuned to the latest data — we obtain a very
good match of the D-parameter data trend with the power-law models.■ We observe a very good match of the flowrate data with the "base" power-
law exponential model (i.e., D∞=0).
"q-D-b" Plot: SWF2D-parameter data trend exhibits a power-law behavior — essentially a straight line.b-parameter data trend is not constant (contrary to hyperbolic formulation).Computation of the b-parameter is severely affected by noise.

Presentation at Marathon OilMarathon Shale Workshop: Reservoir Engineering Session
Recent Work in Well Performance Analysis for Tight Gas Sands and Gas ShalesT.A. Blasingame/Texas A&M U. (06 November 2009) Sl
ide
—20
/63
●Discussion: Small Waterfrac Gas Well (SWF2)■ The hyperbolic rate relation (b=1) yields the highest reserves estimate.■ Excellent matches of data are achieved using the power-law exponential
model for both the D∞=0 and the D∞≠0 cases.■ The lower bound for the reserves estimate is 2.3 BSCF, which is con-
sistent with our results from the model-based PA study (SPE 114947).
Field Examples: Small WF Gas Well (SWF2)
a. Semi-log plot — empirical matches are shown using power-law exponential and hyperbolic models.
b. Log-log plot — empirical matches are shown using power-law exponential and hyperbolic models.

Presentation at Marathon OilMarathon Shale Workshop: Reservoir Engineering Session
Recent Work in Well Performance Analysis for Tight Gas Sands and Gas ShalesT.A. Blasingame/Texas A&M U. (06 November 2009) Sl
ide
—21
/63
Field Examples: Large WF Gas Well (LWF2)
●Discussion: Large Waterfrac Gas Well (LWF2)■ Erratic rate behavior caused by liquid loading is seen in the latter portion
of the rate data.■ The behavior of the computed D- and b-parameters is almost identical to
the previous case suggesting (to some degree) consistency of the data.■ Outstanding matches of the computed D- and b-parameters with the
power-law exponential model are observed.
"q-D-b" Plot: LWF2D-parameter data trend exhibits a power-law behavior — essentially a straight line.b-parameter data trend is not constant (contrary to hyperbolic formulation).Computation of the b-parameter is signifi-cantly affected by noise.

Presentation at Marathon OilMarathon Shale Workshop: Reservoir Engineering Session
Recent Work in Well Performance Analysis for Tight Gas Sands and Gas ShalesT.A. Blasingame/Texas A&M U. (06 November 2009) Sl
ide
—22
/63
●Discussion: Large Waterfrac Gas Well (LWF2)■ Estimation of the reserves using the hyperbolic rate decline relation is
almost five times higher than the contacted gas-in-place predicted previously using a model-based match (SPE 114947).
■ Outstanding matches of the data are obtained using the power-law exponential model, both the D∞=0 and the D∞≠0 cases.
■ The D∞≠0 model provides the most conservative estimate of reserves.
Field Examples: Large WF Gas Well (LWF2)
a. Semi-log plot — empirical matches are shown using power-law exponential and hyperbolic models.
b. Log-log plot — empirical matches are shown using power-law exponential and hyperbolic models.

Presentation at Marathon OilMarathon Shale Workshop: Reservoir Engineering Session
Recent Work in Well Performance Analysis for Tight Gas Sands and Gas ShalesT.A. Blasingame/Texas A&M U. (06 November 2009) Sl
ide
—23
/63
Field Examples: Hybrid WF Gas Well (HWF1)
●Discussion: Hybrid Waterfrac Gas Well (HWF1)■ Severe liquid loading is observed at late times.■ The computed D- and b-parameters reflect the effects of liquid loading —
however; the D-parameter data trend is essentially power-law.■ Good matches of the computed D- and b-parameters are obtained using
the power-law exponential model.
"q-D-b" Plot: HWF1D-parameter data trend exhibits a power-law behavior — essentially a straight line.b-parameter data trend is not constant (contrary to hyperbolic formulation).Computation of the b-parameter is severely affected by noise.

Presentation at Marathon OilMarathon Shale Workshop: Reservoir Engineering Session
Recent Work in Well Performance Analysis for Tight Gas Sands and Gas ShalesT.A. Blasingame/Texas A&M U. (06 November 2009) Sl
ide
—24
/63
Field Examples: Hybrid WF Gas Well (HWF1)
●Discussion: Hybrid Waterfrac Gas Well (HWF1)■ The hyperbolic rate relation (b=1) yields the highest reserve estimate.■ Reasonable matches of the rate data are obtained using the power-law
exponential model for both the D∞=0 and the D∞≠0 cases.■ The power-law exponential model applied using D∞≠0 provides the most
conservative estimate of reserves (as is expected) — this result is quite comparable to the model-based results obtained in SPE 114947.
a. Semi-log plot — empirical matches are shown using power-law exponential and hyperbolic models.
b. Log-log plot — empirical matches are shown using power-law exponential and hyperbolic models.

Presentation at Marathon OilMarathon Shale Workshop: Reservoir Engineering Session
Recent Work in Well Performance Analysis for Tight Gas Sands and Gas ShalesT.A. Blasingame/Texas A&M U. (06 November 2009) Sl
ide
—25
/63
D. Ilk, Texas A&M UniversityJ.A. Rushing, Anadarko Petroleum Corp.T.A. Blasingame, Texas A&M UniversityDepartment of Petroleum Engineering
Texas A&M UniversityCollege Station, TX 77843-3116
+1.979.845.4064 — [email protected]
SPE 125031Decline Curve Analysis for HP/HT Gas Wells:
Theory and Applications

Presentation at Marathon OilMarathon Shale Workshop: Reservoir Engineering Session
Recent Work in Well Performance Analysis for Tight Gas Sands and Gas ShalesT.A. Blasingame/Texas A&M U. (06 November 2009) Sl
ide
—26
/63
Orientation: Rate-Time Relation
●Discussion: Rate-Time Gas Flow Relation (Knowles et al)■ Basis is the linearization of the nonlinear "μgcg" term (Ansah, et al).■ D-function and b-function are formulated using the definitions for loss-
ratio and the derivative of the loss-ratio.
From: Knowles R.S. 1999. Development and Verification of New Semi-Analytical Methods for the Analysis and Prediction of Gas Well Performance. M.S Thesis, Texas A&M University, College Station, Texas.Ansah, J., Knowles, R.S., and Blasingame, T.A. 2000. A Semi-Analytic (p/z) Rate-Time Relation for the Analysis andPrediction of Gas Well Performance. SPEREE. 3 (6): 525-533.
2
2
])exp[)1()1((]exp[4
DdwDwDwD
DdwDwDDd
tppptppq−−−+
−=
])exp[)1(1(])exp[)1(1(
DdwDwDwD
DdwDwDwDwDD tppp
tppppD++−++−
=
Dd
Dd
DdD dt
dqq
D 1−=
["Loss-Ratio"]
Rate-Time Relation:
Dimensionless D-function (DD):
b-function (b): ["Derivative of Loss-Ratio"]
⎥⎦
⎤⎢⎣
⎡−=
)/( DdDdDd
Dd dtdqq
dtdb
2
2
])exp[)1(1()1(]exp[2
DdwDwDwD
wDDdwD
tpppptpb
++−
−=

Presentation at Marathon OilMarathon Shale Workshop: Reservoir Engineering Session
Recent Work in Well Performance Analysis for Tight Gas Sands and Gas ShalesT.A. Blasingame/Texas A&M U. (06 November 2009) Sl
ide
—27
/63
Orientation: Rate-Cumulative Production Relation
●Discussion: Rate-Cumulative Gas Flow Relation■ The definition of the loss-ratio can be re-cast in terms of rate and cumula-
tive production.■ A quadratic relationship exists between rate and cumulative production.
From: Knowles R.S. 1999. Development and Verification of New Semi-Analytical Methods for the Analysis and Prediction of Gas Well Performance. M.S Thesis, Texas A&M University, College Station, Texas.Ansah, J., Knowles, R.S., and Blasingame, T.A. 2000. A Semi-Analytic (p/z) Rate-Time Relation for the Analysis andPrediction of Gas Well Performance. SPEREE. 3 (6): 525-533.
pD
DdD dG
dqD −=
["Loss-Ratio"]
Rate-Cumulative Production Relation:
Dimensionless D-function (DD):
b-function (b): ["Derivative of Loss-Ratio"]
22
1 pDpDDd GGq αα +−=
⎥⎥⎦
⎤
⎢⎢⎣
⎡−=
)/(1
pDDdpDDd dGdqdG
dqb
)1( pDD GD −= α
2
2
)1(2
22
−
+−=
pD
pDpD
G
GGb
α
αα
)1(/2 2wDp−=α

Presentation at Marathon OilMarathon Shale Workshop: Reservoir Engineering Session
Recent Work in Well Performance Analysis for Tight Gas Sands and Gas ShalesT.A. Blasingame/Texas A&M U. (06 November 2009) Sl
ide
—28
/63
Orientation: Analysis Methodology
●Discussion: Methodology■ The main goal is to match the data with the model using the definitions
for the q-D-b functions during the boundary-dominated flow regime.■ b-function → 0.5 for high drawdown cases (almost constant behavior).

Presentation at Marathon OilMarathon Shale Workshop: Reservoir Engineering Session
Recent Work in Well Performance Analysis for Tight Gas Sands and Gas ShalesT.A. Blasingame/Texas A&M U. (06 November 2009) Sl
ide
—29
/63
Field Example: HP/HT Tight Gas Well
●Field Example: Application of the Methodology■ 3.5 years of daily data are available for a hydraulically fractured well
completed in a HP/HT gas reservoir.■ Well clean-up effects, liquid-loading, and operational changes are
observed in the data trends. ■ The flowrate data are reviewed prior to analysis; and any erroneous/
redundant data points are removed.■ The half-slope trend is evident in the rate-integral derivative function.
pi = 14000 psia and TR = 260oF

Presentation at Marathon OilMarathon Shale Workshop: Reservoir Engineering Session
Recent Work in Well Performance Analysis for Tight Gas Sands and Gas ShalesT.A. Blasingame/Texas A&M U. (06 November 2009) Sl
ide
—30
/63
Field Example: HP/HT Tight Gas Well
a. — qg versus Gp (Cartesian plot). b. — D-function versus t (Cartesian plot). c. — b-function versus t (Cartesian plot).
d. — qg versus t (Semilog plot). e. — D-function versus t (Semilog plot). f. — b-function versus t (Semilog plot).
●Field Example: Application of the Methodology■ For the computation of D- and b-parameter data functions we remove the
outlying data points; then we perform the numerical differentiation.■ Our analysis provides a gas-in-place estimate of approximately 8.0 BSCF.

Presentation at Marathon OilMarathon Shale Workshop: Reservoir Engineering Session
Recent Work in Well Performance Analysis for Tight Gas Sands and Gas ShalesT.A. Blasingame/Texas A&M U. (06 November 2009) Sl
ide
—31
/63
Field Example: HP/HT Tight Gas Well
●Field Example: Application of the Methodology■ Reasonable matches of the D-function with the data using the semi-
analytical model is achieved (post-transient flow only).■ The matches of the b-function data with the semi-analytical model are
problematic — data indicate no unique characteristic behavior.■ Computation of the b-parameter data function is severely affected by
factors such as liquid loading.

Presentation at Marathon OilMarathon Shale Workshop: Reservoir Engineering Session
Recent Work in Well Performance Analysis for Tight Gas Sands and Gas ShalesT.A. Blasingame/Texas A&M U. (06 November 2009) Sl
ide
—32
/63
Field Example: HP/HT Tight Gas Well
●Field Example: Application of the Methodology■ We observe a good match of the flowrate data with the model (except for
the early time data affected by "cleanup").■ The "power-law exponential" model yields Gp,max ≈ 8.0 BSCF.■ Gas-in-place estimates are consistent comparing the methods we used.

Presentation at Marathon OilMarathon Shale Workshop: Reservoir Engineering Session
Recent Work in Well Performance Analysis for Tight Gas Sands and Gas ShalesT.A. Blasingame/Texas A&M U. (06 November 2009) Sl
ide
—33
/63
Field Example: HP/HT Tight Gas Well
●Field Example: Application of the Methodology■ An analytical reservoir model (vertical well with a finite conductivity
vertical fracture) is used to confirm the analysis results.■ Excellent match of the flowrate data and a reasonable match of the
bottomhole pressure history are obtained.■ All of the models yield consistent estimates of reserves/gas-in-place.

Presentation at Marathon OilMarathon Shale Workshop: Reservoir Engineering Session
Recent Work in Well Performance Analysis for Tight Gas Sands and Gas ShalesT.A. Blasingame/Texas A&M U. (06 November 2009) Sl
ide
—34
/63
Summary and Conclusions:●Summary:■We utilize a semi-analytical rate relation given by Knowles
[1999] and generalized by Ansah [2000] for the direct estimation of gas-in-place.
■The semi-analytical relation is formulated in terms of the Arps' D- and b-functions for diagnosis and analysis.
■ "Power-law exponential" rate decline relation is used to augment and validate our other analyses.
●Conclusions:■For high drawdown cases, the value of the Arps' b-parameter
should converge to approximately 0.5 during boundary-dominated flow regime.
■The straight line linearization scheme is validated — including application to cases of HP/HT gas reservoirs.
■The use of the D- and b-data functions provides a unique insight into flow regime identification and the simultaneous matching of the data. We conclude that this approach is a robust mechanism for estimating gas reserves.
■Model-based analysis (if applicable) should be performed to validate the results of the semi-analytical/empirical methods addressed in this work.

Presentation at Marathon OilMarathon Shale Workshop: Reservoir Engineering Session
Recent Work in Well Performance Analysis for Tight Gas Sands and Gas ShalesT.A. Blasingame/Texas A&M U. (06 November 2009) Sl
ide
—35
/63
S.M. Currie, Texas A&M UniversityD. Symmons, Consultant
D. Ilk, Texas A&M UniversityT.A. Blasingame, Texas A&M UniversityDepartment of Petroleum Engineering
Texas A&M UniversityCollege Station, TX 77843-3116
+1.979.845.4064 — [email protected]
Reserves Estimation in Tight Gas/Shale Gas Reservoirs using the Continuous EUR
Concept(manuscript in preparation for presentation at the
2010 SPE Unconventional Gas Conference)

Presentation at Marathon OilMarathon Shale Workshop: Reservoir Engineering Session
Recent Work in Well Performance Analysis for Tight Gas Sands and Gas ShalesT.A. Blasingame/Texas A&M U. (06 November 2009) Sl
ide
—36
/63
Continuous EUR: Simulated Case
●Discussion: Continuous EUR using Arps' Hyperbolic Decline■ Subsets of data are matched using the Arps' hyperbolic decline relation. ■ EUR of each subset is estimated (qgi is fixed).

Presentation at Marathon OilMarathon Shale Workshop: Reservoir Engineering Session
Recent Work in Well Performance Analysis for Tight Gas Sands and Gas ShalesT.A. Blasingame/Texas A&M U. (06 November 2009) Sl
ide
—37
/63
Continuous EUR: Simulated Case
●Discussion: Continuous EUR using Power-Law Exponential Model■ EUR of each subset of data is estimated progressively.■ We do not fix any model parameter for the power-law exponential model.■ EUR stabilizes when boundary-dominated flow regime is established.

Presentation at Marathon OilMarathon Shale Workshop: Reservoir Engineering Session
Recent Work in Well Performance Analysis for Tight Gas Sands and Gas ShalesT.A. Blasingame/Texas A&M U. (06 November 2009) Sl
ide
—38
/63
Continuous EUR: Simulated Case
●Discussion: Continuous EUR using Arps' Hyperbolic Decline■ Hyperbolic b-parameter value decreases with time.■ EUR estimate decreases over time and stabilizes at late times.■ EUR estimate using the power-law exponential model is more
conservative at early times.

Presentation at Marathon OilMarathon Shale Workshop: Reservoir Engineering Session
Recent Work in Well Performance Analysis for Tight Gas Sands and Gas ShalesT.A. Blasingame/Texas A&M U. (06 November 2009) Sl
ide
—39
/63
Continuous EUR: Field Case
●Discussion: Continuous EUR using Arps' Hyperbolic Decline■ Almost 2000 days of daily production data are available.■ b-parameter value ranges between 0.99 (all data) and 2.2 (earliest portion
— 50 days) for the subsets of data.

Presentation at Marathon OilMarathon Shale Workshop: Reservoir Engineering Session
Recent Work in Well Performance Analysis for Tight Gas Sands and Gas ShalesT.A. Blasingame/Texas A&M U. (06 November 2009) Sl
ide
—40
/63
Continuous EUR: Field Case
●Discussion: Continuous EUR using Power-Law Exponential Model■ All of the matches for each part of the data set are almost outstanding.■ Additional data constrain the EUR estimate.■ Boundary-dominated flow regime effects are being established at late
times.

Presentation at Marathon OilMarathon Shale Workshop: Reservoir Engineering Session
Recent Work in Well Performance Analysis for Tight Gas Sands and Gas ShalesT.A. Blasingame/Texas A&M U. (06 November 2009) Sl
ide
—41
/63
Continuous EUR: Field Case
●Discussion: Continuous EUR using Arps' Hyperbolic Decline■ Almost 50 percent decrease is observed in the EUR estimate when Arps'
hyperbolic relation is used.■ We advise caution when Arps' hyperbolic decline is used for estimating
reserves — in particular, at early times.

Presentation at Marathon OilMarathon Shale Workshop: Reservoir Engineering Session
Recent Work in Well Performance Analysis for Tight Gas Sands and Gas ShalesT.A. Blasingame/Texas A&M U. (06 November 2009) Sl
ide
—42
/63
C.M. Freeman, Texas A&M UniversityG.J. Moridis, Lawrence Berkeley National Lab.
D. Ilk, Texas A&M UniversityT.A. Blasingame, Texas A&M UniversityDepartment of Petroleum Engineering
Texas A&M UniversityCollege Station, TX 77843-3116
+1.979.845.4064 — [email protected]
SPE 124961A Numerical Study of Tight Gas
and Shale Gas Reservoir Systems

Presentation at Marathon OilMarathon Shale Workshop: Reservoir Engineering Session
Recent Work in Well Performance Analysis for Tight Gas Sands and Gas ShalesT.A. Blasingame/Texas A&M U. (06 November 2009) Sl
ide
—43
/63
●Discussion: van Kruysdijk and Dullaert [1989] Flow Regime Concept:■ Complex pressure profile behavior evolves due to fracture interference.■ Onset of compound linear period marked by rate decline.
a. Formation linear flow. b. Compound linear flow. c. Pseudo-elliptical flow.
Numerical Simulation Model: Concept

Presentation at Marathon OilMarathon Shale Workshop: Reservoir Engineering Session
Recent Work in Well Performance Analysis for Tight Gas Sands and Gas ShalesT.A. Blasingame/Texas A&M U. (06 November 2009) Sl
ide
—44
/63
Numerical Simulation Model: Concept
●Discussion: van Kruysdijk and Dullaert [1989] Flow Regime Concept:■ Complex pressure profile behavior evolves due to fracture interference.■ Onset of compound linear period marked by rate decline.

Presentation at Marathon OilMarathon Shale Workshop: Reservoir Engineering Session
Recent Work in Well Performance Analysis for Tight Gas Sands and Gas ShalesT.A. Blasingame/Texas A&M U. (06 November 2009) Sl
ide
—45
/63
Numerical Simulation Model: Modeling
●Discussion: Linear (Planar) Fracture — Repetitive Element■Repetitive element used to represent flow of individual fractures.■ Fracture interference modeled by a no-flow boundary.

Presentation at Marathon OilMarathon Shale Workshop: Reservoir Engineering Session
Recent Work in Well Performance Analysis for Tight Gas Sands and Gas ShalesT.A. Blasingame/Texas A&M U. (06 November 2009) Sl
ide
—46
/63
●Discussion: Effects of Fracture Spacing■ Rate and auxiliary functions merge during compound linear flow.■ Smaller fracture spacing causes earlier fracture interference effect.
Flowrate Behavior: Effects of Completion

Presentation at Marathon OilMarathon Shale Workshop: Reservoir Engineering Session
Recent Work in Well Performance Analysis for Tight Gas Sands and Gas ShalesT.A. Blasingame/Texas A&M U. (06 November 2009) Sl
ide
—47
/63
●Nonlinear Depletion:■ Sorption surfaces near
fracture are significantly more depleted.
■ Pressure/Density/SorptiveStorage is not intuitively related.
Flowrate Behavior: Effects of Desorption
x
y
Flowrates with Various Langmuir Volumes.Dimensionless Desorption Map
Dimensionless Density Map

Presentation at Marathon OilMarathon Shale Workshop: Reservoir Engineering Session
Recent Work in Well Performance Analysis for Tight Gas Sands and Gas ShalesT.A. Blasingame/Texas A&M U. (06 November 2009) Sl
ide
—48
/63
●Discussion: Effect of Matrix Permeability■ Matrix permeability affects the early time rate behavior in particular.■ Convergence of rate profiles are observed at late times.
Flowrate Behavior: Effects of Medium

Presentation at Marathon OilMarathon Shale Workshop: Reservoir Engineering Session
Recent Work in Well Performance Analysis for Tight Gas Sands and Gas ShalesT.A. Blasingame/Texas A&M U. (06 November 2009) Sl
ide
—49
/63
Conclusions and Remaining Issues:●Conclusions:■For TGSG reservoir systems, many factors affect performance.■Numerical modeling must be robust and tied to flow physics.■Desorption effects originate near fractures.■The well completion controls early time behavior.■Complex fractures (any type) substantially enhance early rates.
x
y
Flowrates with Various Langmuir Volumes.Dimensionless Desorption Map
Dimensionless Density Map

Presentation at Marathon OilMarathon Shale Workshop: Reservoir Engineering Session
Recent Work in Well Performance Analysis for Tight Gas Sands and Gas ShalesT.A. Blasingame/Texas A&M U. (06 November 2009) Sl
ide
—50
/63
●Issues for Well Performance in TGSG Systems:■Correct assessment of the fracture distribution must be made
to ensure proper flow regime identification and forecasting.■Desorption is highly nonlinear, but it defies direct assessment.■Assessment of fracture conductivity is non-unique.■Well completion issues are critical — particularly well clean-up.
Conclusions and Remaining Issues:

Presentation at Marathon OilMarathon Shale Workshop: Reservoir Engineering Session
Recent Work in Well Performance Analysis for Tight Gas Sands and Gas ShalesT.A. Blasingame/Texas A&M U. (06 November 2009) Sl
ide
—51
/63
Tom BLASINGAMEDepartment of Petroleum Engineering
Texas A&M UniversityCollege Station, TX 77843-3116 (USA)
+1.979.845.2292 — [email protected]
Tight Gas/Shale Gas Well Performance Analysis:
Future View
Presentation at Marathon OilMarathon Shale Workshop: Reservoir Engineering Session
06 November 2009 — Houston, TX

Presentation at Marathon OilMarathon Shale Workshop: Reservoir Engineering Session
Recent Work in Well Performance Analysis for Tight Gas Sands and Gas ShalesT.A. Blasingame/Texas A&M U. (06 November 2009) Sl
ide
—52
/63
x
yPressure
MonitoringPoint No. 1
PressureMonitoringPoint No. 2
HydraulicFracture
Wellbore
X
X
x
y
x
yPressure
MonitoringPoint No. 1
PressureMonitoringPoint No. 2
HydraulicFracture
Wellbore
X
X
Numerical Model Considers:●Reservoir Layering.●kv/kh ratio.●Fracture Length, xf.●Fracture Conductivity, FcD.Analysis/Validation Approach:●Fit q(t) with Arps' hyperbolic relation.●Compare reserves to model at 30 years.
Decline Analysis: Tight Gas SystemsSPE 109625 (2007)Estimating Reserves in Tight Gas Sands at HP/HT Reservoir Conditions: Use and Misuse of an Arps Decline Curve MethodologyJ.A. Rushing, A.D. Perego, R.B. Sullivan, Anadarko Petroleum, and T.A. Blasingame, Texas A&M U.

Presentation at Marathon OilMarathon Shale Workshop: Reservoir Engineering Session
Recent Work in Well Performance Analysis for Tight Gas Sands and Gas ShalesT.A. Blasingame/Texas A&M U. (06 November 2009) Sl
ide
—53
/63
b. Elliptical flow type curve solution — high fracture conductivity case.
a. Elliptical flow type curve solution — low fracture conductivity case.
Vertical TG/SG Wells: Elliptical Flow Domination
c. Elliptical boundary configurations (finite con-ductivity fracture case [Amini, et al (2007)].
SPE 106308 (2007)Evaluation of the Elliptical Flow Period forHydraulically-Fractured Wells in Tight GasSands — Theoretical Aspects and PracticalConsiderationsS. Amini, D. Ilk, and T. A. Blasingame,SPE, Texas A&M U.

Presentation at Marathon OilMarathon Shale Workshop: Reservoir Engineering Session
Recent Work in Well Performance Analysis for Tight Gas Sands and Gas ShalesT.A. Blasingame/Texas A&M U. (06 November 2009) Sl
ide
—54
/63
a. Pressure profile at 0 year (0 hr).
b. Pressure profile at 1 year (8768 hr).
c. Pressure profile at 5.59 years (49,010 hr).
d. Pressure profile at 9.26 years (81,200 hr).
e. Pressure profile at 18.44 years (161,700 hr).
f. Pressure profile at 44.10 years (386,600 hr).
Results Generated Using:Ecrin Product Suite, Kappa Engineering, Sophia-Antipolis, France (2008).
Vertical TG/SG Wells: Elliptical Flow Domination

Presentation at Marathon OilMarathon Shale Workshop: Reservoir Engineering Session
Recent Work in Well Performance Analysis for Tight Gas Sands and Gas ShalesT.A. Blasingame/Texas A&M U. (06 November 2009) Sl
ide
—55
/63
a. Rate performance behavior for a horizontal well with 4 trans-verse fractures — infinite-acting reservoir (analog to van Kruysdijk and Dullaert work). Fine-scale numerical model .
Horizontal TG/SG Wells: Compound Linear Flow
c. Schematic diagram for the "compound linear flow" concept [van Kruysdijk and Dullaert (1989)].
Presented at the 2nd European Conference on the Mathematics of Oil Recovery, Cambridge, England (1989).A Boundary Element Solution of the Transient Pressure Response of Multiply Fractured Horizontal WellsC.P.J.W. van Kruysdijk and G.M. Dullaert, Shell
b. Specialized derivative plot (ref: van Kruysdijk and Dullaert) for a horizontal well with 4 transverse fractures — infinite- and finite-acting reservoir cases. Fine-scale numerical model .

Presentation at Marathon OilMarathon Shale Workshop: Reservoir Engineering Session
Recent Work in Well Performance Analysis for Tight Gas Sands and Gas ShalesT.A. Blasingame/Texas A&M U. (06 November 2009) Sl
ide
—56
/63
Base Simulation Modelfor Horizontal Well with Multiple Hydraulic Fractures
Top View HorizontalWell
MultipleVertical
Fractures
SPE 119897: Schematic Model for Simulation

Presentation at Marathon OilMarathon Shale Workshop: Reservoir Engineering Session
Recent Work in Well Performance Analysis for Tight Gas Sands and Gas ShalesT.A. Blasingame/Texas A&M U. (06 November 2009) Sl
ide
—57
/63
●Discussion: Horizontal Wells with Transverse Fractures■ Very high resolution simulation case.■ Very good D-parameter and good b-parameter computed from results.■ Excellent rate match using the new model (all regimes).
SPE 119897: q-D-b Plot — Numerical SimulationFinite-Acting
Reservoir Case

Presentation at Marathon OilMarathon Shale Workshop: Reservoir Engineering Session
Recent Work in Well Performance Analysis for Tight Gas Sands and Gas ShalesT.A. Blasingame/Texas A&M U. (06 November 2009) Sl
ide
—58
/63
●Discussion: Horizontal Wells with Transverse Fractures■ Very high resolution simulation case.■ Transient D- and b-parameters at late times (quasi-radial flow).■ Impossible to predict reserves.
SPE 119897: q-D-b Plot — Numerical SimulationInfinite-Acting
Reservoir Case

Presentation at Marathon OilMarathon Shale Workshop: Reservoir Engineering Session
Recent Work in Well Performance Analysis for Tight Gas Sands and Gas ShalesT.A. Blasingame/Texas A&M U. (06 November 2009) Sl
ide
—59
/63
Horizontal TG/SG Wells: Diagnostics?Q1.Compound Linear Flow Domination? (transient flow)A1. Possibilities for estimating reservoir properties:
a. Just give up — impossible to resolve anything. (default)b. "Lump" k, xf, and Lwell into a "parameter." ("mechanistic model")c. Develop testing practices to estimate properties. (maybe…)d. Other model concepts (e.g., propagating ellipse). (very tedious)
Q2.Estimating Reserves?A2. Issues:
a. Extremely long transition to boundary-dominated flow. (reality)b. Hyperbolic rate relation will overestimate reserves. (as always)c. Power-law/exponential rate relation? (more validation)
Q3.Role of simulation/modeling?A3. In the short-term, simulation/modeling is the primary
tool at our disposal — the analogy of using a hammer in place of a screwdriver comes to mind… (sometimes effective, but always a sub-optimal solution — particu-larly in the hands of children).

Presentation at Marathon OilMarathon Shale Workshop: Reservoir Engineering Session
Recent Work in Well Performance Analysis for Tight Gas Sands and Gas ShalesT.A. Blasingame/Texas A&M U. (06 November 2009) Sl
ide
—60
/63
Tom BLASINGAMEDepartment of Petroleum Engineering
Texas A&M UniversityCollege Station, TX 77843-3116 (USA)
+1.979.845.2292 — [email protected]
BlasingameCurrent Projects/Interests
Presentation at Marathon OilMarathon Shale Workshop: Reservoir Engineering Session
06 November 2009 — Houston, TX

Presentation at Marathon OilMarathon Shale Workshop: Reservoir Engineering Session
Recent Work in Well Performance Analysis for Tight Gas Sands and Gas ShalesT.A. Blasingame/Texas A&M U. (06 November 2009) Sl
ide
—61
/63
Current Work: Blasingame●Projects: Status■ Simple Rate-Time Models for Shale Gas Systems (active)■ Diagnostics and Simplified Production Analysis (active)■ Analytical/Numerical Models for Shale Gas (active)■ IPR for Solution Gas-Drive Systems (nearing closure)
●Concepts: Status■ Production Mechanisms for Shale Gas Systems (start-up)■ Petrophysical Properties of Shales (2010)■ Continuous EUR (start-up)
●Focus Priority■ Simple Rate-Time Models for Shale Gas Systems very high■ Analytical/Numerical Models for Shale Gas very high■ Continuous EUR very high■ Production Analysis for Shale Gas Systems high■ Correlation/Quality Control for Data Analysis high■ Petrophysical Properties of Shales/Tight Gas Sands medium

Presentation at Marathon OilMarathon Shale Workshop: Reservoir Engineering Session
Recent Work in Well Performance Analysis for Tight Gas Sands and Gas ShalesT.A. Blasingame/Texas A&M U. (06 November 2009) Sl
ide
—62
/63
Students: Blasingame●Boulis: Extended Hyperbolic Models for DCA (M.S./complete)●Carballo: TBA (Gas Reservoir Eng.?) (Ph.D. coursework — DL)●Currie: Simple Rate-Time Models for Shale Gas Systems (M.S./active)●Freeman: Numerical Models for Shale Gas Well Performance (M.S./active)● Ilk: Production Analysis — Tight Gas Systems (Ph.D./active)● Jam: Analytical Models for Shale Gas Well Performance (M.S./active)● Johnson: Simplified Production Analysis for Gas Wells (B.S./complete)●Mendel: PTA/PA for Heavy Oil Production Systems (B.S./complete)●Nass: IPR For Solution Gas-Drive Reservoirs (M.S./active — DL)●Olsen: Reserves Practices (M.S./start-up — DL)

Presentation at Marathon OilMarathon Shale Workshop: Reservoir Engineering Session
Recent Work in Well Performance Analysis for Tight Gas Sands and Gas ShalesT.A. Blasingame/Texas A&M U. (06 November 2009) Sl
ide
—63
/63
Recent Work inWell Performance Analysis for
Tight Gas Sands and Gas ShalesEnd of Presentation
Tom BLASINGAMEDepartment of Petroleum Engineering
Texas A&M UniversityCollege Station, TX 77843-3116 (USA)
+1.979.845.2292 — [email protected]
Presentation at Texas A&M U.17 November 2009 — College Station, TX