recession and prospects for recovery, comparing u.k. and u.s.... “the great recession in the u.k....
Post on 19-Dec-2015
218 views
TRANSCRIPT

Recession and prospects for recovery, comparing U.K. and U.S.
...“The Great Recession in the
U.K. Labour Market: A Transatlantic View” (National Institute Economic Review, No.214, October 2010)
Michael W. L. Elsby (Edinburgh, Michigan, NBER)
Jennifer C. Smith (Warwick)
ONS Labour Market Statistics Conference, 2 March 2011
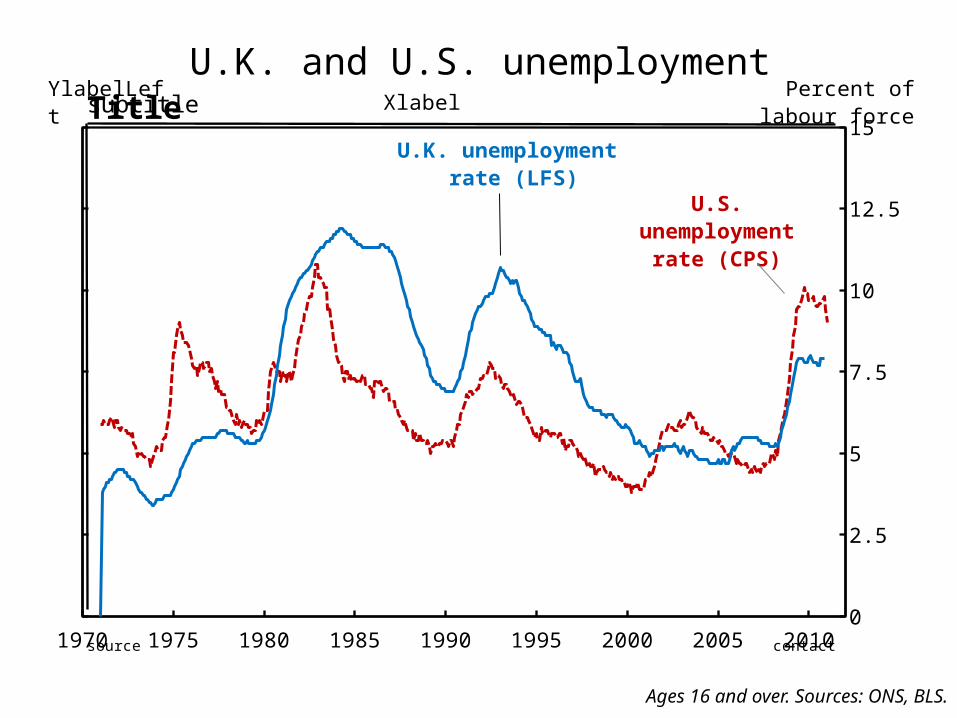
U.K. and U.S. unemployment
1970 1975 1980 1985 1990 1995 2000 2005 20100
2.5
5
7.5
10
12.5
15
contactsource
subtitleTitle XlabelYlabelLeft Percent of labour force
U.K. unemployment rate (LFS)
U.S. unemploymentrate (CPS)
Ages 16 and over. Sources: ONS, BLS.

Unemployment flows
• Why is looking at unemployment flows useful?• Law of Motion for Unemployment:
Change in unemployment = inflows – outflows.• Rearrange:
Change in log unemployment rate≈ Change in log inflow rate minus Change in log outflow rate
• So we can tell what drove the recessionary rise in unemployment ...
• And we can see whether flows are moving in an appropriate way to get unemployment back down.

1970 1975 1980 1985 1990 1995 2000 2005 2010
0.100
1.000
contactsource
subtitleTitle XlabelClaimant outflow rate U to E transition rate
Claimant outflow rate
Series3
Unemployment outflow rates
Sources: Authors’ calculations using ONS NOMIS, GB (data from Petrongolo and Pissarides (2008) prior to 1983), LFS microdata, and using Shimer’s (2007) method on BLS CPS duration data.

1970 1975 1980 1985 1990 1995 2000 2005 2010
0.100
1.000
0.200
contactsource
subtitleTitle XlabelClaimant outflow rate U to E transition rate
Claimant outflow rate
U to E transitionrate (LFS)
Series3
1970 1975 1980 1985 1990 1995 2000 2005 20100.100
1.000
contactsource
subtitleTitle XlabelOutflow rate
Outflow rateRecession
Unemployment outflow rates
Sources: Authors’ calculations using ONS NOMIS, GB (data from Petrongolo and Pissarides (2008) prior to 1983), LFS microdata, and using Shimer’s (2007) method on BLS CPS duration data.

1970 1975 1980 1985 1990 1995 2000 2005 2010contactsource
subtitleTitle XlabelClaimant inflow rate E to U transition rate
Claimant inflow rate
Series3
Sources: Authors’ calculations using ONS NOMIS, GB (data from Petrongolo and Pissarides (2008) prior to 1983), LFS microdata, and using Shimer’s (2007) method on BLS CPS duration data.
Unemployment inflow rates

1970 1975 1980 1985 1990 1995 2000 2005 2010contactsource
subtitleTitle XlabelClaimant inflow rate E to U transition rate
Claimant inflow rate
E to U transition rate (LFS)
Series3
Sources: Authors’ calculations using ONS NOMIS, GB (data from Petrongolo and Pissarides (2008) prior to 1983), LFS microdata, and using Shimer’s (2007) method on BLS CPS duration data.
Unemployment inflow rates

Unemployment inflow rates
1970 1975 1980 1985 1990 1995 2000 2005 2010
0.100
Inflow rate
1970 1975 1980 1985 1990 1995 2000 2005 2010contactsource
subtitleTitle XlabelClaimant inflow rate E to U transition rate
Claimant inflow rate
E to U transition rate (LFS)
Series3
Sources: Authors’ calculations using ONS NOMIS, GB (data from Petrongolo and Pissarides (2008) prior to 1983), LFS microdata, and using Shimer’s (2007) method on BLS CPS duration data.

U.K. unemployment inflow and outflow rates
1970 1975 1980 1985 1990 1995 2000 2005 2010contactsource
subtitleTitle XlabelClaimant inflow rate E to U transition rate
Claimant inflow rate
E to U transition rate (LFS)
Series3
1970 1975 1980 1985 1990 1995 2000 2005 2010
0.100
1.000
0.200
contactsource
subtitleTitle XlabelClaimant outflow rate U to E transition rate
Claimant outflow rate
U to E transitionrate (LFS)
Series3
Sources: Authors’ calculations using ONS NOMIS, GB (data from Petrongolo and Pissarides (2008) prior to 1983).
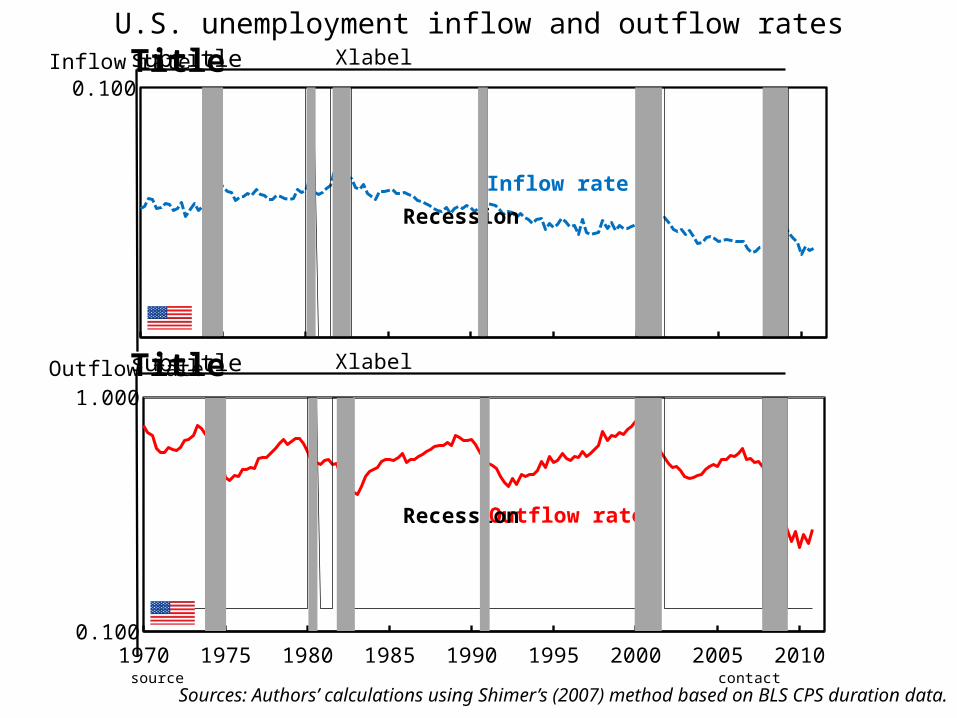
U.S. unemployment inflow and outflow rates
1970 1975 1980 1985 1990 1995 2000 2005 2010
0.100
contactsource
subtitleTitle XlabelInflow rate
Inflow rate
Recession
1970 1975 1980 1985 1990 1995 2000 2005 20100.100
1.000
contactsource
subtitleTitle XlabelOutflow rate
Outflow rateRecession
Sources: Authors’ calculations using Shimer’s (2007) method based on BLS CPS duration data.

Unemployment decomposition
Change in log unemployment rate≈ Change in log inflow rate
minus Change in log outflow rate
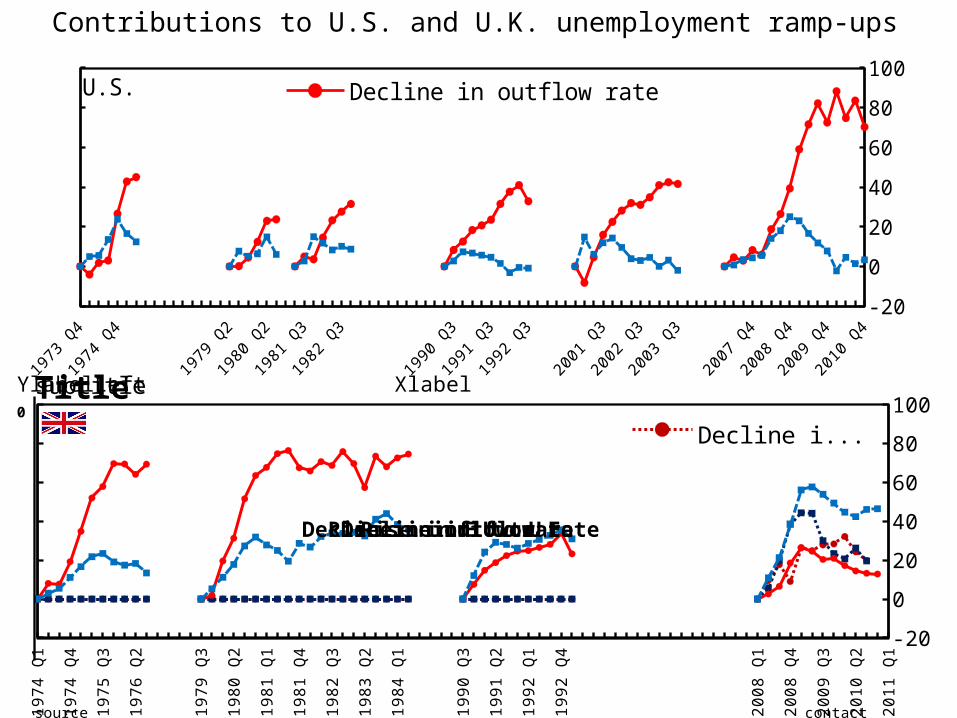
Contributions to U.S. and U.K. unemployment ramp-ups
-20
0
20
40
60
80
100Decline in outflow rate Rise in inflow rateU.S.
19
74
Q1
19
74
Q3
19
75
Q1
19
75
Q3
19
76
Q1
19
76
Q3
19
79
Q4
19
80
Q2
19
80
Q4
19
81
Q2
19
81
Q4
19
82
Q2
19
82
Q4
19
83
Q2
19
83
Q4
19
84
Q2
19
90
Q4
19
91
Q2
19
91
Q4
19
92
Q2
19
92
Q4
20
08
Q1
20
08
Q3
20
09
Q1
20
09
Q3
20
10
Q1
20
10
Q3
20
11
Q1
-20
0
20
40
60
80
100
Decline in U t...
contactsource
subtitleTitle XlabelYlabelLeft0
Rise in inflow rateDecline in outflow rateRise in E to UDecline in U to E
Flow rates: further implications
• The huge decline in the U.S. outflow rate has a corollary in an unprecedented rise in U.S. long-term unemployment.
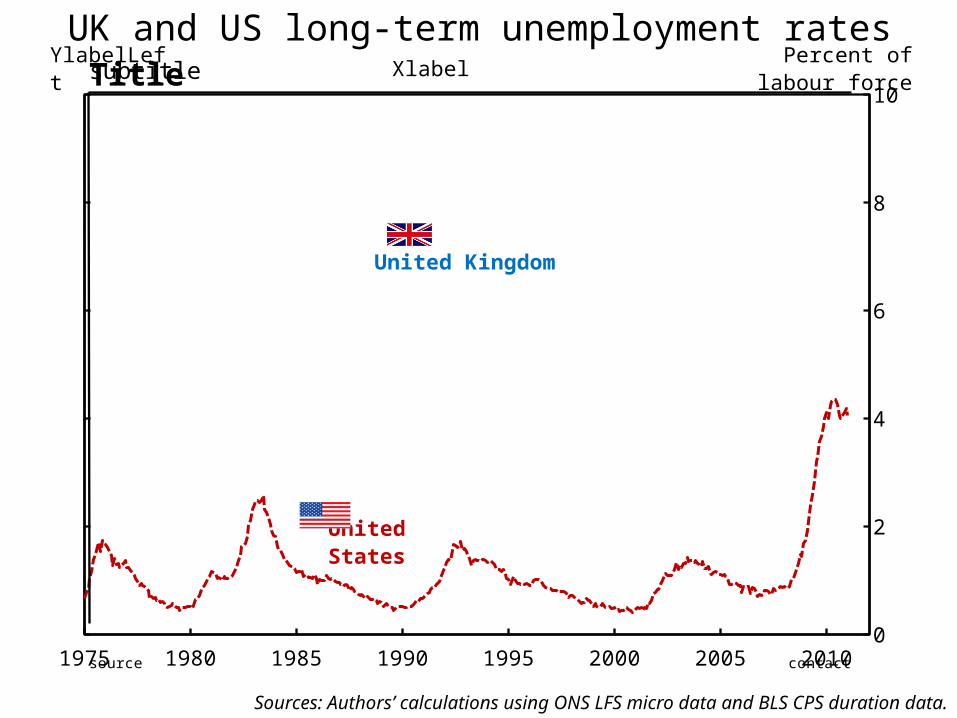
UK and US long-term unemployment rates
1975 1980 1985 1990 1995 2000 2005 20100
2
4
6
8
10
contactsource
subtitleTitle XlabelYlabelLeft Percent of labour force
United Kingdom
United States
Sources: Authors’ calculations using ONS LFS micro data and BLS CPS duration data.
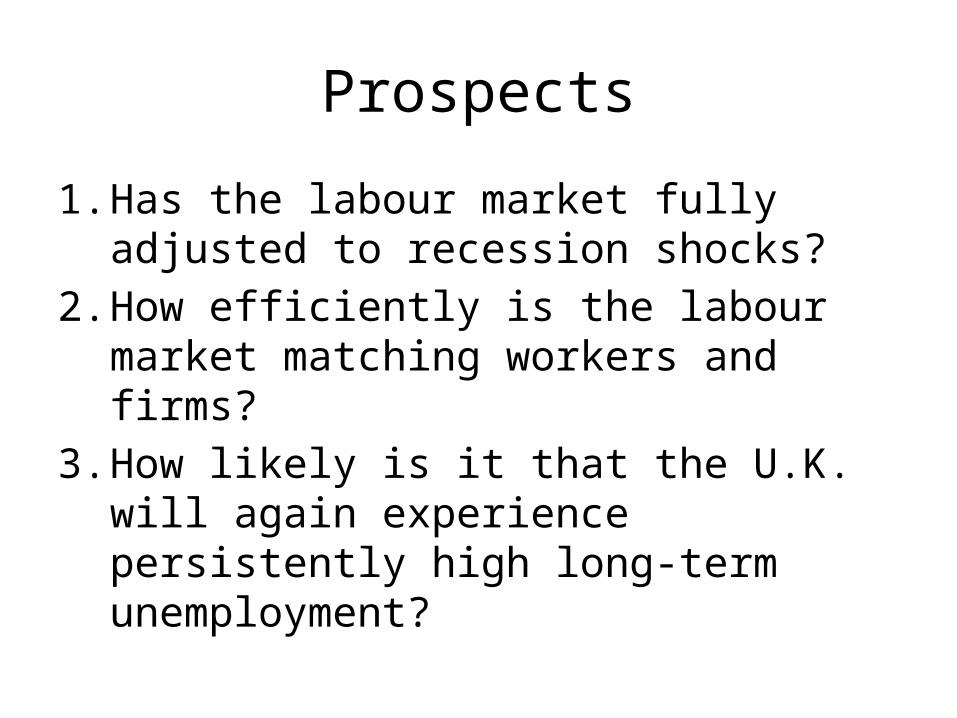
Prospects
1. Has the labour market fully adjusted to recession shocks?
2. How efficiently is the labour market matching workers and firms?
3. How likely is it that the U.K. will again experience persistently high long-term unemployment?

1. Adjustment to shocks
• Shocks to inflows or outflows change the unemployment rate at which the economy would settle, in the absence of further shocks. (This is termed the ‘flow steady-state’ unemployment rate.)
• Another rearrangement of the Law of Motion for Unemployment gives a formula:Steady state unemployment rate= inflow rate / (inflow rate + outflow rate)
• Because actual unemployment is always converging towards the moving target of flow steady state unemployment, flow steady state unemployment acts as a leading indicator for actual unemployment.
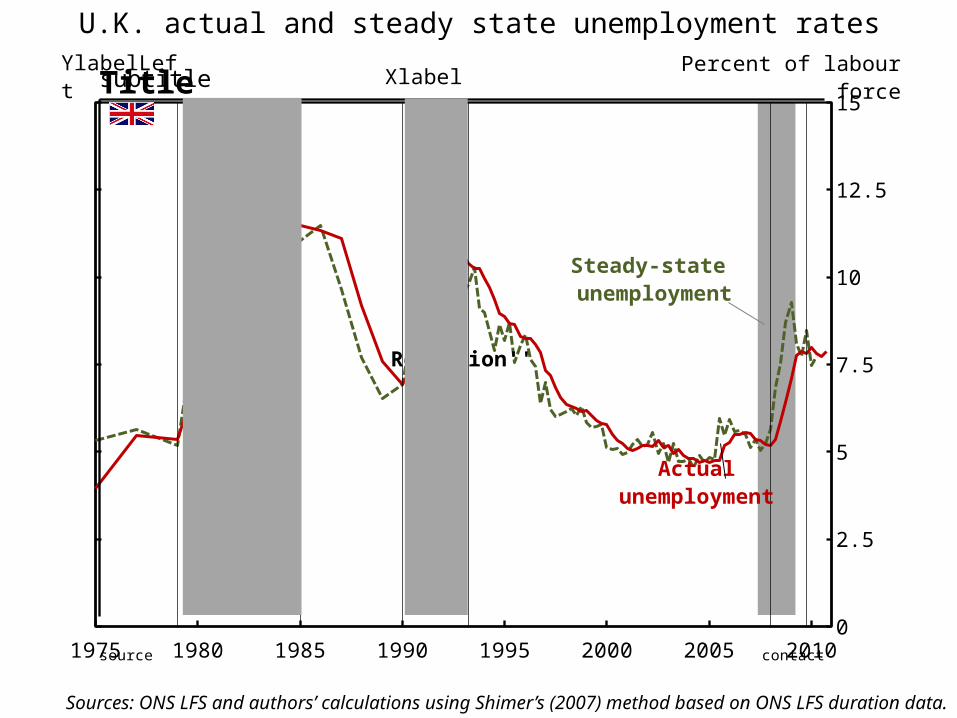
U.K. actual and steady state unemployment rates
1975 1980 1985 1990 1995 2000 2005 20100
2.5
5
7.5
10
12.5
15
contactsource
subtitleTitle XlabelYlabelLeft Percent of labour force
Actual unemployment
Steady-state unemployment
Recession''
Sources: ONS LFS and authors’ calculations using Shimer’s (2007) method based on ONS LFS duration data.

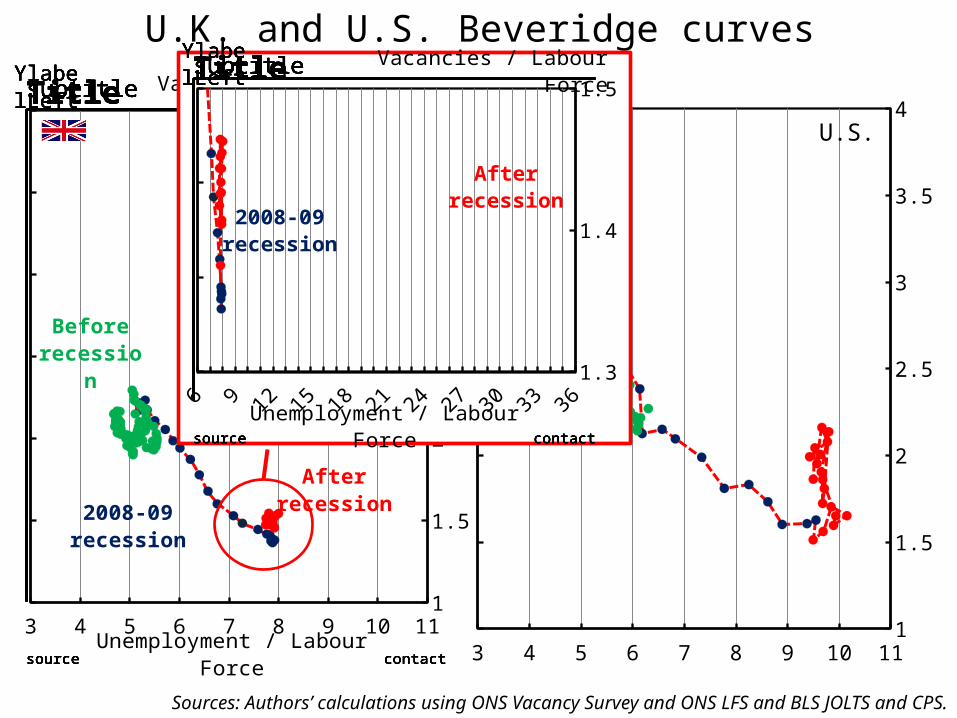
2. Matching efficiency
A reduction in unemployment is predicated on two conditions:1. Are job openings being created? 2. How effectively will such job openings be
filled?

3 4 5 6 7 8 9 10 111
1.5
2
2.5
3
3.5
4
U.K. and U.S. Beveridge curves
3 4 5 6 7 8 9 10 111
1.5
2
2.5
3
3.5
4
contactsource
subtitleTitleYla-belLeft
Vacancies / Labour Force
2008-09 recession
Before re-cession
contactsource
subtitleTitleYla-belLeft
contactsource
subtitleTitleYla-belLeft
contactsource
subtitleTitleYla-belLeft
contactsource
subtitleTitleYla-belLeft
contactsource
subtitleTitle
Unemployment / Labour Force
Yla-belLeft
After recession
Sources: Authors’ calculations using ONS Vacancy Survey and ONS LFS and BLS JOLTS and CPS.
U.S.
3 4 5 6 7 8 9 10 111
1.5
2
2.5
3
3.5
4
contactsource
subtitleTitleYla-belLeft
Vacancies / Labour Force
2008-09 recession
Before re-cession
contactsource
subtitleTitleYla-belLeft
contactsource
subtitleTitleYla-belLeft
contactsource
subtitleTitleYla-belLeft
contactsource
subtitleTitleYla-belLeft
contactsource
subtitleTitle
Unemployment / Labour Force
Yla-belLeft
After recession
3 4 5 6 7 8 9 10 111
1.5
2
2.5
3
3.5
4U.S.
U.K. and U.S. Beveridge curves
Sources: Authors’ calculations using ONS Vacancy Survey and ONS LFS and BLS JOLTS and CPS.
1.3
1.4
1.5
contactsource
subtitleTitleYla-belLeft Vacancies / Labour Force
2008-09 re-cession
contactsource
subtitleTitleYla-belLeft
contactsource
subtitleTitleYla-belLeft
contactsource
subtitleTitleYla-belLeft
contactsource
subtitleTitleYla-belLeft
contactsource
subtitleTitle
Unemployment / Labour Force
Yla-belLeft
After reces-sion
3. Long-term unemployment
• It is possible to predict future long-term unemployment by looking at current unemployment of various durations and how outflow rates vary across durations.

1990 1995 2000 2005 20100
0.05
0.1
0.15
0.2
contactsource
subtitleTitle XlabelYlabelLeft U to E monthly transition rate
<1
1 to 3
3 to 6
6 to 12
>12
Aggregate
Job finding rates by unemployment duration
Sources: Authors’ calculations using ONS LFS micro data.
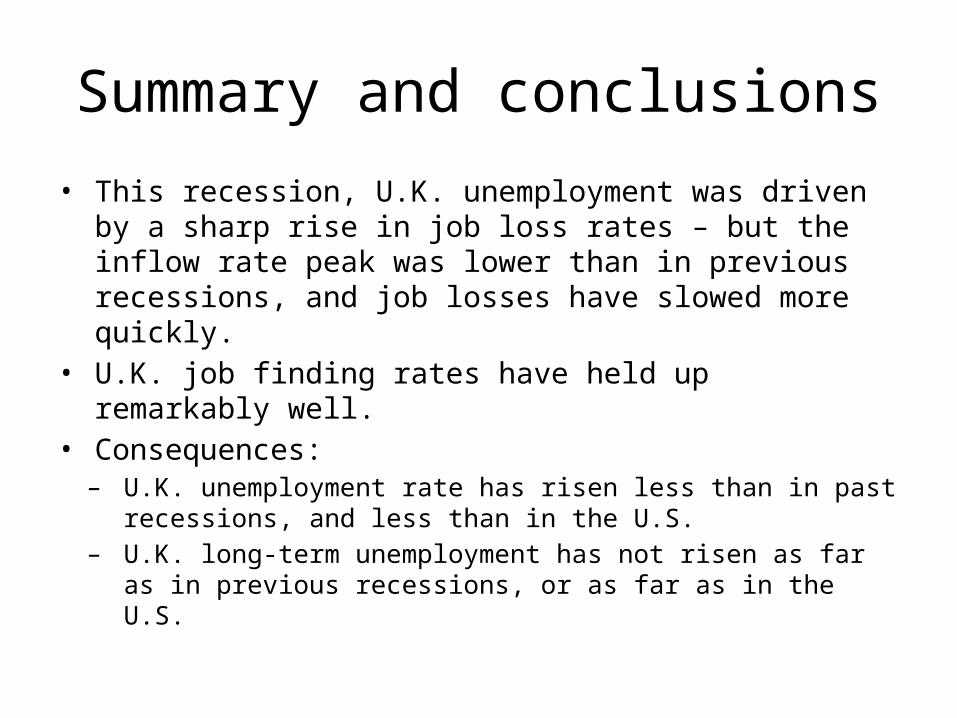
Summary and conclusions
• This recession, U.K. unemployment was driven by a sharp rise in job loss rates – but the inflow rate peak was lower than in previous recessions, and job losses have slowed more quickly.
• U.K. job finding rates have held up remarkably well.• Consequences:
– U.K. unemployment rate has risen less than in past recessions, and less than in the U.S.
– U.K. long-term unemployment has not risen as far as in previous recessions, or as far as in the U.S.

Summary and conclusions
• The U.K. labour market seems to have adapted fully to the shocks of the recent recession.
• There are possible signs of lower matching efficiency, but it is difficult to be sure, as vacancy creation has been low.
• Low outflow rates from short-term unemployment give some cause for concern. However, there has been a substantial recovery in job finding rates by the long-term unemployed. These two constitute a reduction in duration dependence.