recharge rates to deep aquifer layers estimated with 39ar, kr … pur… · ·...
TRANSCRIPT

1
Recharge rates to deep aquifer layers estimated with
39Ar, 85Kr and 14C data: A case study in Odense
(Denmark)
Roland Purtschert
University of Bern,
Switzerland
Troels Bjerre,
Johann Linderberg
VCS
Denmark
Klaus Hinsby
Geological Survey of
Denmark and Greenland

Starting point, Objectives
Deep groundwater
Fast circulation, residence times of decades → vulnerabe
Slower circulation, RT of centuries -> less vulnerable?
Gra
ph
ics, U
SG
S
Increasing interest in pre-modern
groundwater due to
Overexploitation
Contamination
Effects of climate change
Investigation of potential and
limitations of tracers beyond the 50
years age limit.
Determination of recharge rates,
residence times and renewal rates
Combination of tracer methods and
numerical modelling

0 5 10 kilometers
Study site: Odense river catchment, Funen Denmark
Well fields
Photo Jan Kofoed Winther
Total area 1046 km2
Direction of
groundwtaer flow Odense Water Ltd is one of the largest water utilities in Denmark with a
groundwater abstraction permission of ~14 mill. m³/year
The groundwater is mainly abstracted from rather shallow aquifers
(quaternary sand deposits) on 7 wellfields around the city of Odense.
The catchments of the wellfields are dominated by conventional farming
and urban areas
The groundwater table is close to the surface and the low lying areas are
generally drained by tile drains

Topography
from Hansen et al, 2009
The catchment area
is characterised by
two high areas rising
to 130 m above sea
level divided by a
wide and shallow
depression
stretching NE–SW

Hydrogeology
0 5 10kilometers
Sand/gravel
Clayey till
Sandy till
Fractured Clay
Chalk
Several ice advances and subsequent ice retreats during the Weichselian glaciation have
formed the present landscape and geology (Houmark-Nielsen & Kjær 2003)
Main aquifers are found in semi-confined units of glaciofluvial sand and gravel deposits at
varying depths overlain by glacial till.
Tertiary marls and clay forms the lower boundary of the Quaternary aquifer system
Geology of the quaternary deposits is rather complex and heterogeneous
Interconnected hydrostatigraphic units with a typical thickness of 10-15 meter
Troldborg, 2004

6
Timescales of groundwater dating methods
(10.7 yr)
(269 yr)
(Half-life)
Dating range
Meth
od
s
years
Sampling in GAB, Australia

7
85Kr-39Ar: Key data
85Kr 39Ar
Half-life: 10.7 269
Decay mode: b b
Modern isotope ratio (2008) ~3·10-11 8.1·10-16
Atoms/Liter water 58‘000 8‘700
Activity (Bq/L water) 1.2 10-4 7.1 · 10-7 → 22 decays/yr
Input function
Water sample volume:
1-2 tons! Note: Water residence times are based on a isotope ratio (39Ar/Ar, 85Kr/Kr
etc) and are therefore (rather) insensitive to
Details of recharge conditions (the addition of excess air, recharge temperature)
Degree of degassing (both in nature and during sampling)
(In contrast to 3H/3He, SF6 etc that are based on absolute concentrations)

Sampling and detection method
Sampling for 85Kr, 39Ar and 14C
Active and passive shielding in underground lab
Water degassing in the field 39Ar and 85Kr activity measurement by
Low Level Counting

Spontaneous fission
U (n)
Th
Al, Mg..(α,n)
Subsurface
Production 39K(n,p)39Ar
39Ar production
Pore-
Water
p n
n
+
+
n n
p
n n
n
p p
p
n n
p n
n
-
n
nth
nt
h
+
e-
0
-
-
-
e-
e-
0
e+
e+
n
4n n
2
p
n
-
-
-
+
-
Atmospheric Production 40Ar(n,2n)39Ar
0.104 dpm/L Argon
(100% modern)
T1/2=269 years
cosmic rays 0
50
100
150
200
250
300
0 200 400 600 800 1000
groundwater residence time (years)
%m
od
ern
300%mod
200%mod
0%mod
100%mod
50%mod
Subsurface secular
equilibrium

39Ar depth profile
25 50 75 100 125 150 175 200100
80
60
40
20
0
Nort
hin
g
Easting
Odense
Holmehaven
Borreby
Lunde
Soeby
scre
en d
epth
(m
)
39Ar (% modern)
0.15m/yr
40.00
60.00
80.00
100.0
120.0
140.0
160.0
180.0
181.5
39Ar (%modern)

39Ar spatial distribution
25 50 75 100 125 150 175 200100
80
60
40
20
0
Nort
hin
g
Easting
Odense
Holmehaven
Borreby
Lunde
Soeby
scre
en d
epth
(m
)
39Ar (% modern)
0.15m/yr
40.00
60.00
80.00
100.0
120.0
140.0
160.0
180.0
181.5
39Ar (%modern)
25 50 75 100 125 150 175 200100
80
60
40
20
0
Nort
hin
g
Easting
Odense
Holmehaven
Borreby
Lunde
Soeby
scre
en
de
pth
(m
)
39Ar (% modern)
0.15m/yr
40.00
60.00
80.00
100.0
120.0
140.0
160.0
180.0
181.5
39Ar (%modern)

39Ar-85Kr depth profile
25 50 75 100 125 150 175 200100
80
60
40
20
0
Nort
hin
g
Easting
Odense
Holmehaven
Borreby
Lunde
Soeby
scre
en
de
pth
(m
)
39Ar (% modern)
0.15m/yr
40.00
60.00
80.00
100.0
120.0
140.0
160.0
180.0
181.5
39Ar (%modern)
0 10 20 30 40 50 60 70 80
100
80
60
40
20
0
mean s
cre
en d
epth
(m
)
85Kr (dpm/cc Kr)
mo
de
rn w
ate
r

39Ar-85Kr depth profile
25 50 75 100 125 150 175 200100
80
60
40
20
0
Nort
hin
g
Easting
Odense
Holmehaven
Borreby
Lunde
Soeby
scre
en d
epth
(m
)
39Ar (% modern)
0.15m/yr
40.00
60.00
80.00
100.0
120.0
140.0
160.0
180.0
181.5
39Ar (%modern)
0 2 4 6 8 10 12 14
100
80
60
40
20
0
mean s
cre
en d
epth
(m
)
85Kr (dpm/cc Kr)
DL

50
55
60
65
70
75
80
85
90
95
50 55 60 65 70 75 80 85 90 95
39Ar (%modern)
depth
(m
)
Single well age gradient
Vmean: 0.25 m/yr
Top screen
Bottom screen

Expected age distribution and dispersion in heterogeneous alluvial aquifer system
A wide rather than a piston piston-flow-like age distribution can be expected
because of
The heterogeneity of the system
The spatially distributed recharge
Mixing in the extended screen intervals of the extraction wells
WATER RESOURCES RESEARCH, VOL. 38, 2002

120
30
40
50
60
70
90120
20
30
40
507080120
0
2
4
6
8
10
12
14
16
18
20
20 40 60 80 100 120
39Ar (%modern)
85K
r (d
mp
/cc K
r)
Data
AD3
AD2
AD1
Age distribution: 39Ar and 85Kr data
0 100 200 300 400
pro
po
rtio
n
age (yrs)
(Tm=100 yr)
AD1
AD2
AD3
Assumed Age Distributions
Measured 85Kr and 39Ar activities can consistently be interpreted if dispersive mixing is
taken into account (AD2-AD3)
Modern 39Ar values in samples low in 85Kr are suspicious for produced underground
Detection limit 85Kr

Age spectra 39Ar-14C
0 500 1000 1500 2000
0
2
4
6
8
10
12
14
16
#
0 500 1000 1500 2000
0
2
4
#
39Ar (35 samples)
14C (7 samples)
350 yrs
<2000 yrs
Explanation?
Correted 14C ages (F&G Model)

Geochemical correction of 14C activities
0
50
100
200
300
400
500
600
800
1000
50000
20
40
60
80
100
120
20 25 30 35 40 45 50 55 60
14C (pmC)
39A
r (%
mo
dern
)
decay curve
piston flow
ages
2 Komponentmixing?
Geochemical Evolution
Geochemical correction
Two component mixing is not consistent (or at least very unlikely) within the
hydro-geologial context
Geochemical correction models are not sufficient to eliminate the discrepancy
between 39Ar and 14C ages

Diffusive exchange with stagnant zones (Sudicky, 1981)
5000
1000
800
600
500
400
300
200
100
50
0
0
20
40
60
80
100
120
20 25 30 35 40 45 50 55 60
14C (pmC)
39A
r (%
mo
dern
)
+ diffusion
decay curve
piston flow
ages
Time Steady State
b
a
L
Aquifer(active flow zone)
Aquitard (stagnant)
DL
Averages estimates (System of parallel layers; Sanford, 1997)
Porosity (Active & stagnant) : 0.3
Thickness flow zone: 20 m
Thickness stagnant zone: 40 m
Diffusioncoeff. (14C): 3.15 10-3 m2/yr
Diffusioncoeff. (39Ar): 2.6 10-3 m2/yr
Aquifer layers Aquitard layers

Mixing-Dispersion
0
50
100
200
300
400
500
600
800
1000
50000
20
40
60
80
100
120
20 25 30 35 40 45 50 55 60
14C (pmC)
39A
r (%
mo
dern
)
+ diffusion + dispersion
decay curve
piston flow
ages
0 100 200 300 400
pro
po
rtio
n
age (yrs)
(Tm=100 yr)
AD1
AD2
AD3
0
20
40
60
80
100
120
0 500 1000 1500 2000
Ac
tiv
ity
Time
Dispersive mixing reduces the
apparent decay rate of 39Ar relative to 14C

Subsurface Production of 39Ar
5000
1000
800
600
500
400
300
200
100
50
0
100
190
280
370
460550
10002000
0
20
40
60
80
100
120
20 25 30 35 40 45 50 55 60
14C (pmC)
39A
r (%
mo
dern
)
+ diffusion + dispersion
+ underground production
decay curve
piston flow
ages
Tracer model
ages
Assumed subsurface
secondary equilibrium:
30%modern
Summary: The combined contribution of isotope exchange with the aquifer
rocks, diffusive exchange with aquitards, dispersion and eventually underground
production resolves the discrepancy between 39Ar and 14C ages: The resulting
age span ranges between recent and 500-700 years (and not up to 2000 years
as indicated by 14C data)

Age spectra
0 100 200 300 400 500 600 700 800
0
5
10
15
20
240±270
80±84
196±90
0 100 200 300 400 500 600 700 800
0
5
10
15
20
Corrected 14
C-39
Ar tracer ages
Uncorrected 39
Ar ages
0 200 400 600 800
0
5
10
15
20
years
Numerical particle tracking ages

Age spectra
0 100 200 300 400 500 600 700 800
0
5
10
15
20
240±270
80±84
196±90
0 100 200 300 400 500 600 700 800
0
5
10
15
20
Corrected 14
C-39
Ar tracer ages
Uncorrected 39
Ar ages
0 200 400 600 800
0
5
10
15
20
years
Numerical particle tracking ages
Similar age range
Discrepancy at the lower age
limit

-60
-59
-58
-57
-56
-55
-54
-53
-8.7 -8.6 -8.5 -8.4 -8.3 -8.2 -8.1 -8.0 -7.9
d18
O (‰)
d2H
(‰)
0
10
20
30
40
50
60
70
80
90
100
-8.60 -8.50 -8.40 -8.30 -8.20 -8.10 -8.00 -7.90
d18
O (‰)
mean
dep
th b
elo
w s
urf
ace (
m)
Stable isotopes d18O-d2H
18
0.56 0.8d O
T Cd C
‰ / °C18
0.28 150100
d Oh m
m ‰ (Schrag, 1996)
(Poage , 1996) 50 yr
300 yr
600 yr
Time
IPC
C 2
00
1, M
an
n e
t al, 1
99
9

Water Budget
~1046 km2
Precipitation*: 600-1000 mm (av: 840mm)
Evaporation*: 500-600 mm (av. 550)
Recharge*: ~290 mm
Shallow layers
(< 50-60 m)
Deep layers
(>50-60 m)
Drain to river, (run off,
shallow aquifers*: 203 mm
Other boundaries, storage change*
Recharge to deep layers 40 mm
(from corrected 39Ar-14C ages)
303 (100%)
Volumes Mio m3 (%)
880
-575
212 (70%)
14 (4 %) Abstraction* (2006) 17 mm
42 (13%)
35 (13%)
* Data from Hansen, 2006
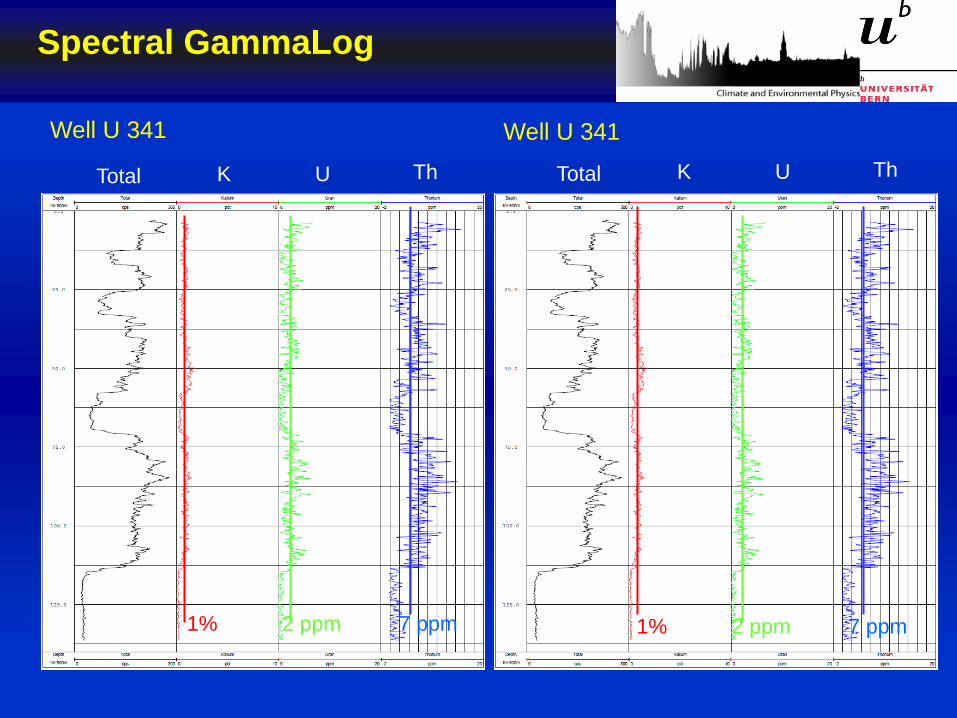
Spectral GammaLog
Well U 341
U Total K Th
Well U 341
U Total K Th
2 ppm 1% 7 ppm 2 ppm 1% 7 ppm

High 39Ar values: Hypothesis
27
Sand/gravel
Clayey till
Sandy till
Fractured Clay
Chalk
CR
25 50 75 100 125 150 175 200100
80
60
40
20
0
Nort
hin
g
Easting
Odense
Holmehaven
Borreby
Lunde
Soeby
scre
en
de
pth
(m
)
39Ar (% modern)
0.15m/yr
40.00
60.00
80.00
100.0
120.0
140.0
160.0
180.0
181.5
39Ar (%modern) 85Kr free

Conclusions
The relation between 85Kr and 39Ar indicates pronounced dispersive mixing in accordance with the heterogeneous structure of the aquifer.
Uncorrected 39Ar- and 14C-model age scales differ by ~1 order of magnitude (Note: 14C model ages consider geochemical corrections).
The consideration of a whole set of processes (rather than a single one) results in a consistent 14C- and 39Ar-age range between 20 years and ~700 years.
Underground production of 39Ar is locally relevant in particular in the northern part of the study area. A general assessment of this effect needs more detailed investigation.
Combined and integrated tracer data including 39Ar allow for the estimation of flow dynamic and recharge rate of groundwater in deeper aquifer layers that are out of range of transient tracers (3H/3He, SF6 etc).
Vertical age profiles have potential as climate records on the millennium scale (instead of horizontal “flow lines” with notorious limited sampling points)

29
Thank you

Spatial variation of recharge rates
BolbroBolbroBolbroBolbroBolbroBolbroBolbroBolbroBolbro
100 5
kilometer
HolmehavenHolmehavenHolmehavenHolmehavenHolmehavenHolmehavenHolmehavenHolmehavenHolmehaven
BorrebyBorrebyBorrebyBorrebyBorrebyBorrebyBorrebyBorrebyBorreby
Nr. SøbyNr. SøbyNr. SøbyNr. SøbyNr. SøbyNr. SøbyNr. SøbyNr. SøbyNr. Søby
LindvedLindvedLindvedLindvedLindvedLindvedLindvedLindvedLindved
DalumDalumDalumDalumDalumDalumDalumDalumDalum
EksercermarkenEksercermarkenEksercermarkenEksercermarkenEksercermarkenEksercermarkenEksercermarkenEksercermarkenEksercermarken
LundeLundeLundeLundeLundeLundeLundeLundeLunde
20 40 60 80 100 120 140 160 180 200
100
80
60
40
20
0
--
13
2.3
1.5
3
7.48.4
3.1
2.3
4
7.6 1
1.4
5
1.2de
pth
(m
)
39Ar (% modern)
20 40 60 80 100 120 140 160 180 200
100
80
60
40
20
0
de
pth
(m
)
39Ar (% modern)
from Dubgaard et al, 2007
Symbol size~85Kr activity