recharge rimac - wordpress.com · recharge rimac authors: david ... head of solar department,...
TRANSCRIPT

Recharge RIMAC
Authors: David Almeida ([email protected]) Daniel Klubis ([email protected]) Cameron McKenzie ([email protected]) Olivia Patterson ([email protected]) IRGN 438: Technology and Operations Management Date: 3/20/09

2
Table of Contents: Acknowledgements....................................................................................... 3
Executive Summary ...................................................................................... 4
Assumptions for Financial and Cost Benefit Analysis .................................. 6
Human Powered Energy............................................................................... 7
Products Currently on the Market.............................................................. 8
RIMAC Implementation Strategy ............................................................... 9
Solar Panel Installation ............................................................................... 11
Overview of Photovoltaic Systems on Campus....................................... 11
Feasibility of Adoption of Photovoltaic for RIMAC................................... 11
Previous Proposals .................................................................................. 12
Analysis Results....................................................................................... 13
Lighting Initiatives ....................................................................................... 16
Overview of Current Lighting System...................................................... 16
Efficiency Measures................................................................................. 16
Feasibility of Retrofit Options................................................................... 17
Behavioral Changes.................................................................................... 19
Computer Changes.................................................................................. 19
Lighting Changes ..................................................................................... 20
Conclusion .................................................................................................. 24

3
Acknowledgements We offer our special thanks to the following individuals for their key contributions to this report: Kirk Belles, Project Analyst, Institutional Research, UCSD Don Chadwick, Director of Facilities Planning and Management / Student Affairs, UCSD Lourdes Dawson, Business Officer, UCSD Student Affairs / Sports Facilities John Dilliott, UCSD Energy / Utilities Manager Zarko Draganic, Electrical Engineer and Consultant Hudson Harr, CEO ReRev Dave Purtel, Maintenance Mechanic, RIMAC Hans Stullken, Head of Solar Department, Oneway Electric Tex Xelowski, Lead Maintenance Mechanic, RIMAC
4
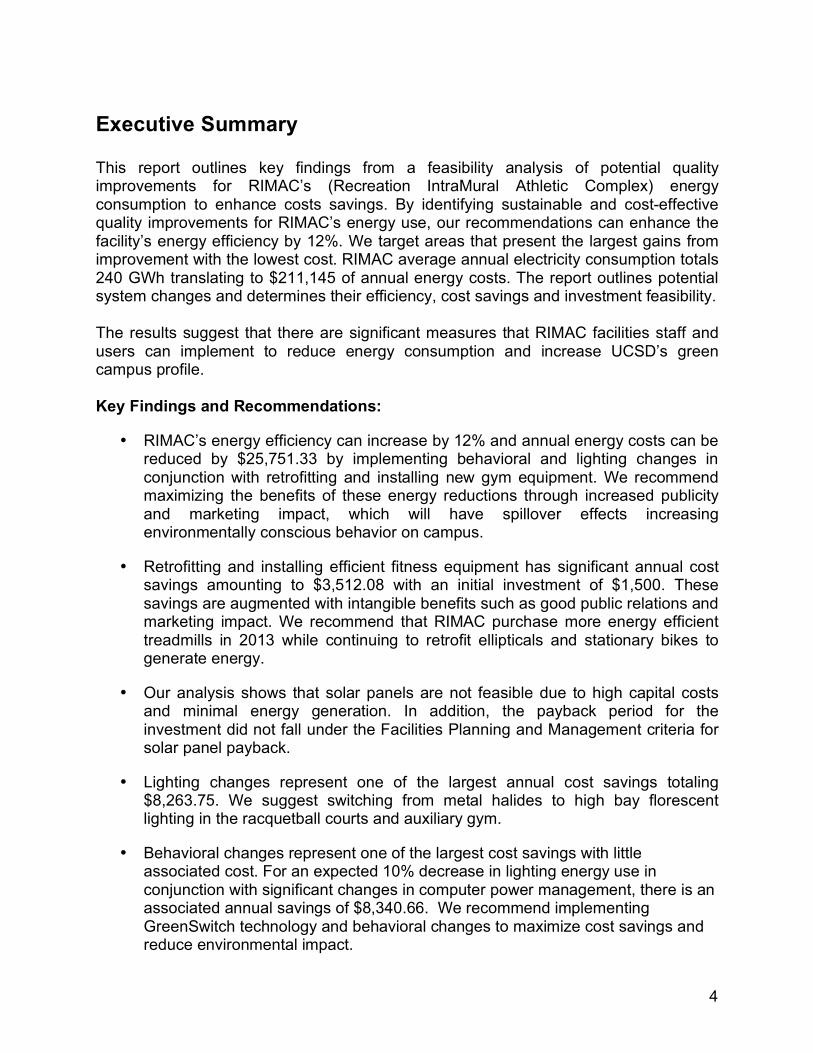
Executive Summary This report outlines key findings from a feasibility analysis of potential quality improvements for RIMAC’s (Recreation IntraMural Athletic Complex) energy consumption to enhance costs savings. By identifying sustainable and cost-effective quality improvements for RIMAC’s energy use, our recommendations can enhance the facility’s energy efficiency by 12%. We target areas that present the largest gains from improvement with the lowest cost. RIMAC average annual electricity consumption totals 240 GWh translating to $211,145 of annual energy costs. The report outlines potential system changes and determines their efficiency, cost savings and investment feasibility. The results suggest that there are significant measures that RIMAC facilities staff and users can implement to reduce energy consumption and increase UCSD’s green campus profile. Key Findings and Recommendations:
• RIMAC’s energy efficiency can increase by 12% and annual energy costs can be reduced by $25,751.33 by implementing behavioral and lighting changes in conjunction with retrofitting and installing new gym equipment. We recommend maximizing the benefits of these energy reductions through increased publicity and marketing impact, which will have spillover effects increasing environmentally conscious behavior on campus.
• Retrofitting and installing efficient fitness equipment has significant annual cost savings amounting to $3,512.08 with an initial investment of $1,500. These savings are augmented with intangible benefits such as good public relations and marketing impact. We recommend that RIMAC purchase more energy efficient treadmills in 2013 while continuing to retrofit ellipticals and stationary bikes to generate energy.
• Our analysis shows that solar panels are not feasible due to high capital costs and minimal energy generation. In addition, the payback period for the investment did not fall under the Facilities Planning and Management criteria for solar panel payback.
• Lighting changes represent one of the largest annual cost savings totaling $8,263.75. We suggest switching from metal halides to high bay florescent lighting in the racquetball courts and auxiliary gym.
• Behavioral changes represent one of the largest cost savings with little associated cost. For an expected 10% decrease in lighting energy use in conjunction with significant changes in computer power management, there is an associated annual savings of $8,340.66. We recommend implementing GreenSwitch technology and behavioral changes to maximize cost savings and reduce environmental impact.

5
Introduction
UCSD’s Environment and Sustainability Initiative engages students and faculty to identify comprehensive solutions to global and local environmental issues. Our team embarked upon a review of RIMAC’s current energy use in order to determine the feasibility of enhancing RIMAC’s building performance through increased energy efficiency and the incorporation of renewable energy technology. RIMAC’s annual electricity consumption totals 240 GWh translating to $211,145 of energy costs in 2008.1 RIMAC currently obtains energy from a cogeneration facility that feeds electricity as well as heated and cooled water and central air into the complex. The fuel used to generate the cogeneration turbine is natural gas bought from SDG&E. Because of the fixed source for water and air, we are unable to propose changes in terms of HVAC or water systems. This means that renewable energy sources, as well as promotion of energy efficient systems, are the primary mechanisms available to reduce RIMAC’s impact on the environment. This report seeks to identify quality improvements for RIMAC’s energy use through a reduction of energy expenses by identifying sustainable and cost-effective methods to enhance the facility’s energy efficiency. We target the areas that present the largest gains from improvement with the lowest cost. While there are potential areas of improvement, the lighting system in RIMAC is very efficient overall. This report will address how to successfully implement our proposed recommendations as well as review the costs associated with these enhancements for RIMAC users and employees. Various measures are available to RIMAC to reduce energy usage and increase cost savings. These measures include reducing energy usage through two components, energy generation and energy efficiencies. These components include generating energy through harnessing the power of human energy through fitness equipment, assessing the feasibility of solar energy, as well as implementing new lighting systems and encouraging behavioral changes.
1 This is incorporating fluctuations in energy pricing according to peak seasons.

6
Assumptions for Financial and Cost Benefit Analysis General Assumptions A number of general assumptions were made in order to quantify the energy cost savings as a result of our initiatives. Below is a brief explanation of each:
• Discount rate for NPV analysis – The discount rate used to calculate the NPV of each system was determined using the market beta for Lifetime Fitness Inc. Lifetime Fitness is a publicly traded company offering health and recreation opportunities through facilities similar to those at RIMAC. Their fitness centers typically include racquetball courts, basketball courts, weight rooms, aerobics rooms and offices for management. As a result we felt their expected return would be similar to that of the RIMAC facility. However, RIMAC carries no debt and does not finance projects using debt, so rather than use Lifetime Fitness’ weighted average cost of capital the market beta was de-levered and an all equity rate of return was calculated using CAPM. The rate was found to be 8.9%. Naturally this analysis is sensitive to the discount rate and tables have been constructed to show its influence on the final outcomes. Results for each initiative were also examined using payback periods and non-discounted energy cost savings as an alternative to NPV.
• Cost per Kilowatt Hour – The cost per kilowatt-hour was assumed to be $0.08 based on the historical cost paid by RIMAC over the last 18 months. Monthly Utilities data for RIMAC including consumption and costs were obtained and from them an average rate was derived. This rate is significantly lower than the commercial market rate of $0.14/KWh and influences the cost effectiveness of our initiatives.
• Inflation Rate – The cost of energy and therefore the energy savings from each
initiative were assumed to grow at the rate of inflation in California. In order to determine an appropriate rate, consumer inflation data for the last 10 years in California was obtained from RAND California. The 10-year historical arithmetic average was found to be 2.85%. Energy cost savings was grown at this rate yearly.

7
Human Powered Energy On any given day, hundreds of UCSD students descend on the RIMAC gym to blow off some stress with a good workout. Why not harness this metabolic activity and convert it to electricity to power the gym? In the past few years there has been a lot of innovation in the area of human-powered exercise technology. In early 2007, a company named Motorwave directly connected 13 elliptical machines to power a set of light bulbs and television screens at a Hong-Kong California Fitness gym. Machine-users were able to immediately see the energy they generated being used in a practical and efficient way. When all of the machines rigged at California Fitness are being used “the power generated amounts to about 300 watts, roughly enough to run three 27-inch television sets, five 60-watt light bulbs or several hundred video iPods.”2 The California Fitness project was the first commercial application of human-powered energy technology and it set the stage for many similar projects. The Green Microgym in Portland took the notion of a sustainable gym even further by aiming to become the first fully carbon neutral exercise facility in the world through the use of solar power and human-powered energy. As gym owner Mike Boesel states, "If you think about a gym, almost all of the exercise equipment has a spinning wheel, and if you can spin a wheel you can make electricity, just like a windmill makes electricity."3 The gym has partnered up with a Texas-based company, Henry Works, to introduce a type of human-generated energy system to the gym called the Human Dynamo. The Human Dynamo is set a of 4 stationary bikes that work in tandem to generate energy, which is then stored in a battery pack and re-routed to power some of the gym’s televisions. Of late, some universities have taken notice of this revolutionary energy generation technology and began to implement a human-generated energy program. A Florida-based sustainable energy company, Re-Rev, recently retrofitted 6 elliptical machines at the University of Florida’s Southwest Recreation Center to generate electricity and put it back on the grid. The Re-Rev system works by re-routing energy produced by the exercise machine to a central grid-tier inverter which converts the DC power to 240/208 Volt 60 Hertz AC. This then feeds back into the building’s breaker panel and is sold to the utility company.4 The Re-Rev system also includes a real-time display screen which shows the machine user how much energy they are generating. The University of Florida plans to expand the Re-Rev system in the near future as more cardio space becomes available and new machines are purchased.
Oregon State University has also implemented a similar Re-Rev system by retrofitting 22 elliptical machines at the Dixon Recreation Center. According to Hudson Harr, owner of Re-Rev, this is the largest human-powered energy installation in the world. The
2 http://www.nowpublic.com/harvesting_energy_from_gym_users 3 http://news.bbc.co.uk/2/hi/technology/7796215.stm 4 Re-Rev Promotional Brochure (provided by the company)

8
Oregon State system will generate 3,500 kilowatts of electricity in a year. The university will be looking to expand the system to 40 machines in the near future.
Products Currently on the Market Some types of gym equipment are more suitable for energy generation than others. Treadmills are the most energy inefficient machines in most gyms, as they are large and complex and must be plugged into an electrical socket to function. Elliptical machines and stationary bikes are naturally much more energy efficient as they are powered by the user and do not require an external source of electricity. Nevertheless, these machines generate a large amount of heat which must be cooled by an air-conditioning system to maintain a comfortable temperature in the gym. This also means they can be made to be more efficient. Most of the human-powered gym technology developed on the market has been focused on ellipticals machines and stationary bikes. The following is a chart that breaks down the human-powered energy products and energy efficient exercise machines currently available on the market:
Company Cost Description Energy
Generation/ Savings
Compatibility
Re-Rev $ 300
per retrofit
Re-routes energy to central grid-tiered
inverter which converts the DC power to AC
power and puts energy back into the grid
100 watts generated per
machine
Precor Elliptical, Cybex Total
Body-Arc
Human Dynamo $7,500
Connects several exercise bikes with
battery that stores the energy generated as
people pedal. The DC power is then converted
to AC
150-400 watts for 4-place Human Dynamo system
Stand-alone system
Green Revolution
$1,299 per bike
System works with spinning bikes. The
energy created through exercise is connected to the electrical power grid
through a grid-tied inverter so energy is put straight back on the grid.
100 watts generated per bike
Stand-alone system
Eco-Power Treadmill5 $4,999 Energy-efficient
treadmill
32% less electricity
generated than a regular treadmill
N/A
5 The Eco-Power treadmill is not human-powered, but it is the most energy-efficient treadmill available on the market.
9
It should be noted that this industry is still in its nascent stage of development and a lot of the aforementioned products are in the prototype phase. Nevertheless, this industry is expected to grow rapidly in the next few years as sustainability and renewable-energy continues to gain traction in the U.S. gym market.
RIMAC Implementation Strategy We propose a realistic, cost-efficient plan to take advantage of the recent breakthroughs in human-powered gym technology and make RIMAC the most energy-efficient and cutting-edge gym in the nation. There are 2 main steps in this plan:
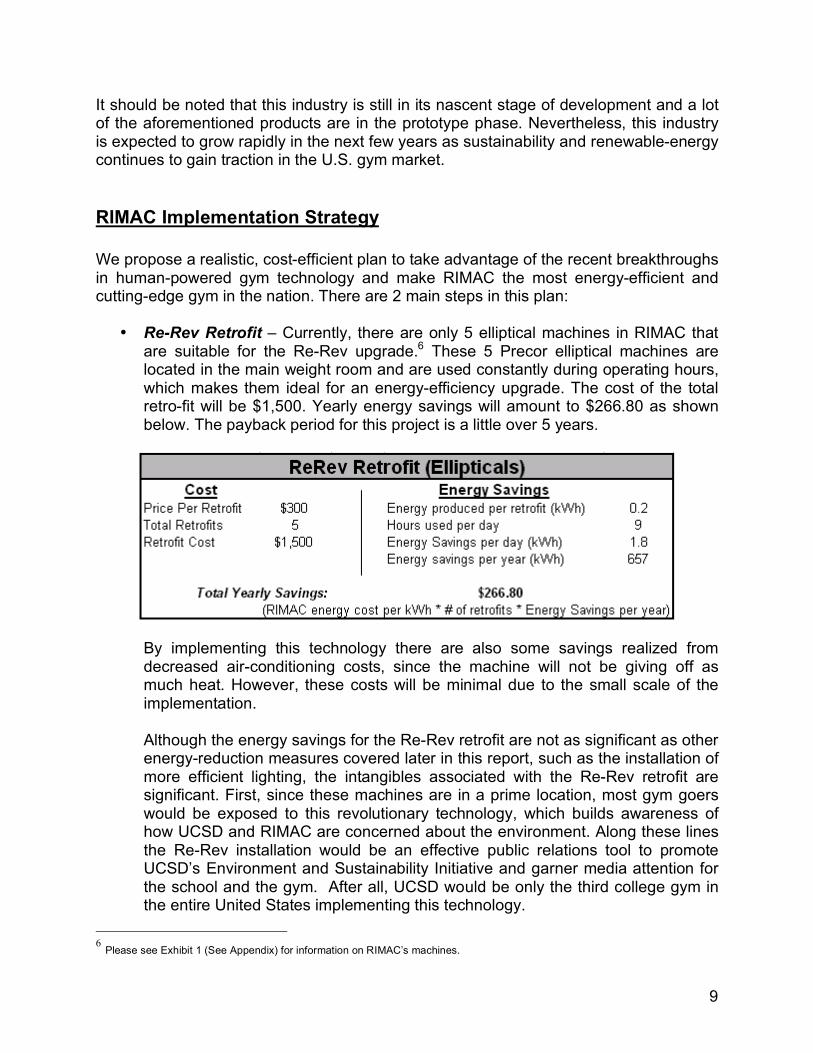
• Re-Rev Retrofit – Currently, there are only 5 elliptical machines in RIMAC that are suitable for the Re-Rev upgrade.6 These 5 Precor elliptical machines are located in the main weight room and are used constantly during operating hours, which makes them ideal for an energy-efficiency upgrade. The cost of the total retro-fit will be $1,500. Yearly energy savings will amount to $266.80 as shown below. The payback period for this project is a little over 5 years.
By implementing this technology there are also some savings realized from decreased air-conditioning costs, since the machine will not be giving off as much heat. However, these costs will be minimal due to the small scale of the implementation.
Although the energy savings for the Re-Rev retrofit are not as significant as other energy-reduction measures covered later in this report, such as the installation of more efficient lighting, the intangibles associated with the Re-Rev retrofit are significant. First, since these machines are in a prime location, most gym goers would be exposed to this revolutionary technology, which builds awareness of how UCSD and RIMAC are concerned about the environment. Along these lines the Re-Rev installation would be an effective public relations tool to promote UCSD’s Environment and Sustainability Initiative and garner media attention for the school and the gym. After all, UCSD would be only the third college gym in the entire United States implementing this technology.
6 Please see Exhibit 1 (See Appendix) for information on RIMAC’s machines.

10
• Eco-power Treadmill – Through interviews with UCSD’s Sports Facilities
Management we learned that RIMAC is given a budget every 5 years for the purchase of new cardiovascular equipment. RIMAC received this funding in 2008 and part of that money went towards 6 new Woodway treadmills. This purchase left 15 older model treadmills ready for replacement in 2013. We would recommend the RIMAC management team to purchase energy-efficient Eco-Power treadmills at that time. These treadmills use 30% less electricity than the standard treadmill. To ensure that RIMAC would not be sacrificing quality with the purchase of EcoPower products, we compared their models with the updated versions of RIMAC’s current treadmill models. We found there to be no loss in quality from the transition. The cost of these Eco-Power machines is actually much lower than that of the Woodway machines that were recently purchased ($4,999 vs. $10,000).
Each Eco-power machine will lead to a yearly savings of $200 per machine, or $3,000 for all of the new machines. When these machines are purchased in 2013 they will save an additional $75,000 from the decreased purchase price as compared to the Woodway treadmills. This additional savings could be used to subsidize the further expansion of Re-Rev technology as it becomes available for more machines in the near future.
Other Human-Powered Options The other human-powered technologies, such as Human Dynamo and Green Revolution, are still too expensive at this point to be a feasible option, although this may change before RIMAC makes their next big machine purchase in 5 years time. Nevertheless, decision-makers in the gym should keep their eye on the market, as this industry is rapidly developing and their may be a significant drop in cost before the next major machine purchase occurs.

11
Solar Panel Installation
Overview of Photovoltaic Systems on Campus Solar panels have become an increasingly popular method to produce clean energy in California and state policies have made efforts to encourage households, commercial and public buildings to invest in renewable energies. UCSD recently installed photovoltaic solar panels across its campus complementing the university’s initiative to reduce carbon emissions. These solar panels7 have produced 272 MWh of electricity for the campus to date.8 The construction of these solar panels has raised the profile of UCSD as a green campus and has significantly contributed to UCSD’s goal of increasing sustainable renewable energy generation. However, solar panel installation has large upfront capital costs that, depending upon the siting, may not justify the energy reduction and cost savings that are generated.
Feasibility of Adoption of Photovoltaic for RIMAC Solar panel generation feasibility depends upon a number of factors, including the generating capacity of the solar panels, the square footage of the roof, as well as the geographical location of the panels. In order to assess the feasibility of implementing photovoltaic solar panel systems at RIMAC, we researched the potential of installing a solar panel system as a way to reduce their overall dependence on UCSD’s centrally located cogeneration facility. To determine the feasibility of a system installation certain assumptions were made: 9
• Hours of Up-Time per Day – Solar panels achieve optimal results under perfectly sunny conditions. The peak wattage they generate per hour is based on these prime conditions. Given UCSD’s geographic location and weather patterns generating peak wattage all day is not possible. In order to determine the equivalent hours of peak wattage a system in our location can produce per day we used data from other solar panel installations currently found on campus. Energy ReCommerce, Inc. provides a website that tracks the total power generated monthly by USCD’s aggregate solar panel system. We obtained access to the site and used this information to back out the hours of peak wattage produced per day. The total up time for a system per day is approximately 4.8 hours. We use this value when calculating the energy savings from a photovoltaic installation.
• Square Footage Available for Installation -- While the RIMAC facility has
200,000 square feet of useable floor space, the roofing available for a solar
7 The panels are located at East Campus Utility Plant, EBU2 North and South, Fleet Services, Gilman Parking, Hopkins Parking and the Price Center 8 This number was provided by the Energy ReCommerce tracking log 9 These assumptions were based upon the Power Light Solar panel proposal

12
installation is much smaller. The RIMAC Arena roof cannot support the installation of solar panels. As a result approximately 22,000 square feet of useable roof space remains for a photovoltaic installation. We assume that almost all of this space can be utilized for an installation to generate as much power using solar energy as possible. The maximum wattage we are able to generate with this space is 20 kW.
• CPUC Incentive – The California Public Utilities Commission (CPUC) offers rebates for renewable energy production. The PBI program applies to large commercial or public sector projects and covers more than 30% of the installed system cost. A solar installation project at RIMAC would be eligible for this incentive and we assume that if a system were in fact installed it would receive the full benefit of this program. Therefore, we adjust the cost of investment for a photovoltaic system by the expected savings from the PBI program.
Previous Proposals RIMAC has received a number of proposals to install photovoltaic panels on the roof. A proposal from Power Light, received five years ago, advocated utilizing panels that generated a total system output of 232 kW. The payback period for this project was estimated to be twelve years, but the analysis offered no net present value analysis of the project. According to their proposal, Power Light offered a turnkey investment that totaled $1,718,736. However, Power Light also incorporated a CPUC Self Generation Incentive of $859,368 as well as purchase of Renewable Energy Certificates (RECs) at a price of $180,000 to be traded on future voluntary markets that are currently under development by the CPUC.10 Although RIMAC rejected this proposal, the incentives and REC credits were quite generous given the power generation capacity of RIMAC. The latest proposal that RIMAC is considering is to develop a partner purchasing agreement, where a private solar power company installs and maintains solar panels on RIMAC’s roof, providing RIMAC with energy at a fee. 10 A REC is "a certificate of proof, issued through the Western Renewable Generation Information System (WREGIS), that one megawatt-hour of electricity was generated by an RPS-eligible renewable energy resource and delivered for consumption by California end-use customers" in accordance with the definition of delivery implemented by the California Energy Commission (CEC). http://www.wregis.org/content/section/4/26/
The arrows mark the suitable area for solar panel installation. The arena cannot support solar paneling.

13
Analysis Results After assessing the feasibility of solar panels at the RIMAC location, we do not recommend accepting a proposal unless there are large incentives offered to make the proposal have a positive net present value. After consultations with Hans Stullken, head of the Solar Department at Oneway Electric, we determined what the optimal photovoltaic panel system for the RIMAC facility would be with the available technology. We factored in the location of the panels, the square footage available and the generation capacity of the system. We then compared the proposed system utilizing Mr. Stullken’s recommendations with the Power Light proposal. The Power Light proposal with its large incentives, RECs and higher generation capacity panels per square foot provided greater energy than the proposed system. Despite the higher generation capacity of the Power Light panels compared to the proposed system, this generation capacity is more than offset by the larger capital investment per panel required for the system. As can be seen the total system output of the Power Light System (232 kW) is much larger than the total system output of the proposed system (10kW). However, the total system costs are proportionately larger for Power Light to the proposed system ($1,718,738 versus $96,558). See table below for a comparison of the Power Light and Proposed System.
Comparison of Power Light Photovoltaic System with Proposed System Solar Panel Specifications Proposed System Power Light System Total System Output (kW) 10 232 Power generated per panel (kW) 0.205 2.715 Cost per Unit ($) $850 $14,908.56 Number of Units Required 48.78 85.45 System Size (sq ft) 10267.7 18500 Square Foot per Unit 210.48 216.49 PV Cost ($) $41,463 $1,273,991 Inverter and Tower Cost ($) $34,904 $101,000 System Mount Cost ($) $4,098 -- Installation Cost ($)* $16,093 $343,747 Total System Cost $96,558 $1,718,738 * Represents 20% of Equipment Cost.
For a solar panel system utilizing the latest solar technology (Sharp ND 224U1F),11 total system output per year is 17,649.23 kWh. The total system cost (including installation fees and materials) is valued at $96,558. However, RIMAC can take advantage of CPUC incentives, particularly the Performance Based Incentive, which gives a rebate of $46,101 rendering the total system cost to $50,456.97. RIMAC currently uses energy from UCSD’s cogeneration facility, which charges electricity costs at $0.08 per kW. This
11 Products utilized for our analysis were recommended by photovoltaic panel specialist Hans Stullken, head of the solar department at Oneway Electric, in conjunction with background research.

14
means that RIMAC could benefit from a total yearly energy cost savings of $1,411.94 from installing a photovoltaic system. See below for a review of the total cost and savings for the proposed system. Proposed System Output
Proposed System Output System Output kWh per year 17649.23077 System Output kWh per month 1470.769231 PBI Incentive for this system $46,101 New System Cost $50,456.97 Energy Cost (per kW) 0.08 Yearly Energy Savings $1411.94
Both systems do not generate enough cost savings to justify the investment. Our analysis reveals a negative net present value for the system even after twenty-five years. Without utilizing a discount value, the payback period for the system is approximately twenty-three years, which far exceeds the optimal ten-year payback period that is the primary investment criteria according to UCSD Facilities Planning and Management. (See below for a comparison of the Payback and NPV for the proposed system). Solar Panel Comparison of Payback and NPV
In order to determine if RIMAC would benefit substantially from carbon emissions reductions from a cost benefit analysis standpoint, we estimated the shadow price for a short ton of CO2 from four separate estimates, two academic literature values (Stern & Nordhaus) and two market values (Chicago Climate Exchange (CCX) & European Climate Exchange (ECX)). Both literature values are accepted as the upper and lower bound estimates of the SCC by academics working in this field. The Stern review
As can be seen in the chart, solar panel installation has a negative net present value over an extended period of time.

15
estimates the cost at approximately $23 per ton of CO2e (carbon dioxide equivalent) while Nordhaus takes a more conservative estimate at $7.40 per ton of CO2e. In order to get a picture of how the market is valuing the social cost of carbon12 we turned to two current carbon-trading regimes, a voluntary trading market in the US, the CCX, and a regulated trading market in the EU, the ECX. SCC differed in both of these markets with the SCC in the ECX market valued higher at $26.35 per ton of CO2e, and the SCC in the CCX at a much lower value of $3.34 per ton of CO2e.
Sources Price in $ (Short Ton CO2)
Social Benefit Savings
Stern Review $30.00 $138.72 ECX Average $26.35 $121.84 Nordhaus $27.00 $124.85 CCX Average $3.34 $15.44
The proposed system solar panels are calculated to produce 17,649.23 kWh, with a resulting carbon offset of 4.624 CO2 short tons. This leads to an annual total cost savings range of $15.44 to $138.72. This social benefit does not justify reversing our initial recommendation of not installing solar panels. While solar panel installation appears to be an effective method to reduce fossil fuel energy use through renewable generation, solar panel systems have significant shortcomings. The amount of power generated is dependent on the size of the location, the amount of solar energy received, and the capacity of panels to generate energy. Without having these elements at their full potential, RIMAC cannot justify the high investment costs from these systems.
12 William Nordhaus defines the social cost of carbon (SCC) as the marginal damage caused by an additional ton of carbon emissions, and the optimal carbon price is the price on carbon emissions that balances the incremental costs of reducing carbon emissions with the incremental benefits of reducing climate damages.

16
Lighting Initiatives
Overview of Current Lighting System RIMAC staff rely on a suite of lighting options to light the two hundred thousand square foot facility. Exhibit 2 describes the lighting break down by type, wattage, and location. High efficiency compact fluorescents (CFL) comprise the vast majority of lights used in the interior of the facility, primarily used for recessed emergency lighting as well as for various conference rooms and exit signs. Exhibit 2: Description of Fixtures in the RIMAC Facility
The second largest lighting system utilizes efficient T8 fluorescents primarily for lighting the offices, hallways and weight room. While smaller fixtures are adequate for the offices, hallways, and weight room, the arena, auxiliary gym and the racquetball courts require fixtures with a larger output. These large open areas make use of higher wattage metal halide fixtures to illuminate the space. The exterior of the facility utilizes CFLs and metal halide fixtures to light up the perimeter of the building and the fields. Finally, the building contains a number of windows and skylights providing natural light to the atrium, offices, weight room and the auxiliary gym. The maintenance team, headed by Robert Abalos, is responsible for operating this complex system. While Mr. Abalos manages the maintenance team, maintenance mechanics Tex Xelowski and Dave Purtell carry out the day-to-day operations. Under Mr. Xelowski and Mr. Purtell there are a number of student sports facility representatives responsible for carrying out basic maintenance and custodial procedures. While individuals have the ability to control localized sections of the building (eg. offices), the overall system is controlled and monitored by the maintenance team with the help of a computerized lighting system.
Efficiency Measures While there are potential areas of improvement, the lighting system in RIMAC is very
Type Watts Location
Metal Halide 1500 Field
Metal Halide 1000 Arena
TV Lights (incandescent) 1000 Arena
Metal Halide 400 Racquetball Court
Metal Halide 400 Auxillary Gym
T8 2ft 20 Interior Facility
T8 4ft 40 Interior Facility
CFL (20 varieties) <20 Interior Facility

17
efficient overall. Since the building’s inception in 1995, the building staff have incorporated several measures to improve the lighting system to increase energy efficiency. Beginning in 2006, incandescent bulbs have been replaced with CFLs in the interior of the building.13 These lights were selected because they consume 75 percent less energy than standard incandescent bulbs and have a lifetime that is up to 10 times longer.14 In an effort to track the lifetime of these bulbs, maintenance staff marked each bulb with an installation date. Exhibit 215 displays a recent bulb that was replaced and the installation date, indicating that this bulb was nearly three years old. In addition to implementing CFLs in the interior of the building, all exit signs have also been equipped with CFLs. The building staff have also replaced T12 florescent lights and ballasts with more efficient T8 systems. These systems were chosen because they typically use 32% less energy than the T12 systems.16 Further, the operation of the outdoor lighting system for the building is controlled via the use of photosensors. Photosensors automatically adjust the light output of a lighting system based on detected luminance. Lights connected to a photosensor only turn on when they are needed resulting in greater energy savings for the facility.
Feasibility of Retrofit Options The aforementioned energy efficient measures are prime examples of RIMAC’s commitment to energy savings. However, there are fixtures in the facility that are outdated compared to the present technology. Currently the facility uses 400W metal halide lights in the racquetball courts and the auxiliary gym. When these lights were installed they were no doubt the best option, however compared to other alternatives such as high bay florescent lighting they are more inefficient. There are a number of benefits associated with high bay fixtures compared to metal halides. In contrast to metal halides, high bay fixtures have a much lower wattage, which enables them to consume approximately 50% less energy. These fixtures also offer more consistent lumen output over the entire lamp life and ten thousand more lamp hours than metal halides. In addition to providing brighter light and lasting longer, they also emit less heat than their counterparts. By emitting less heat, these fixtures will indirectly benefit the facility by lowering the amount of energy consumed by the air conditioning system. As a result of these benefits, we recommended that RIMAC replace the 400W metal halides with high bay fixtures. To determine if replacing these fixtures is cost effective, we calculated the energy savings as well as performed a net present value analysis of the project. As the table 13 The scoreboards on the athletic fields continue to use incandescent bulbs. 14 ENERGY STAR http://www.energystar.gov/index.cfm?c=cfls.pr_cfls 15 See Appendix. 16 http://www.energyretrofitters.com/lampballast.html

18
shows, under the assumptions given, converting the 110 metal halide fixtures to a high bay lighting system will result in energy savings of $8,263 per year.
Fixture Type Metal Halide High Bay Florescent
Input Watts Per Fixture 400 234
Hours of Operation Per Year 5657 5657
Per Fixture Findings
Energy Consumption Per Year (kWh) 2262.8 1323.738
Energy Savings Per Year (kWh) 939.062
Utility Cost Per kWh 0.08 0.08
Energy Savings Per Year ($) $75.12
Number of Fixtures Retrofitted 110
Total Energy Savings/Year (kwh) 103296.82
Total Energy Savings/Year ($) $8,263.75 Further, the NPV analysis below indicates that just after four years the project will generate a positive NPV, yielding a NPV of $29,000 in 10 years and $60,000 in 20 years. In addition to a positive NPV, the cash flow analysis indicates the payback period is less than three years for this project.

19
Behavioral Changes Simple changes to the staffs everyday operations can result in energy savings of up to $15,000 in the first year. These behavioral changes are important because they require little to no capital expenditure. We identified three areas where changes in individual behaviors could be modified to reduce energy consumption. These areas include computers, lights, and the electricity consumed by devices when they are turned off otherwise known as phantom load.
Computer Changes Power management features allow both monitors and computers to enter a low-power sleep and standby mode after specified periods of inactivity. These features are standard in Windows operating systems, however these features must be manually activated. While many organizations have adopted power management features for monitors, largely driven by the Environmental Protection Agency’s (EPA) ENERGY STAR Million Monitor Drive17 campaign, implementing these features in computers has not been widespread. According to the EPA only 5 percent of computers have power management systems activated, in contrast to 70 percent for monitor power management.18 For optimal energy savings, the EPA recommends that a computers standby or hibernate mode be activated after 30 minutes of inactivity and monitors should enter sleep mode after 5 minutes of inactivity. Verizon and the Spring Branch Independent School District (SBISD)19 are two successful examples of institutions that have implemented these measures. Through implementing power management features on 185,000 computers, Verizon was able to save $7 million net of project costs. Similarly, SBISD was able to save an annual $230,000 by activating Windows sleep settings on 7,000 computers and monitors. While RIMAC is not equipped with thousands of computers, executing EPA recommended power management features on the 53 computers in the facility will result in significant energy savings. Using the EPA’s ENERGY STAR power management calculator, we calculated a total energy savings of $3,633 in the first year, with a three-year savings of $10,083 for the 53 monitors and computers. In addition to energy cost savings, after three years the project will result in eliminating approximately 105 tons of carbon dioxide emitted into the atmosphere, which is equivalent of planting 22 trees and removing 17 automobiles off the road. This calculation assumes that there are typically 8 hours of work in a day and 6 days in a workweek. In addition this number also assumes that monitors consume 65W in active mode and 2W in the low-power sleep mode, while computers
17 ENERGY STAR Million Monitor Drive Campaign 18 ENERGY STAR SBISD case study 19 http://www.energystar.gov/index.cfm?c=power_mgt.pr_power_mgt_ss

20
consume 153W in active and 4W in sleep mode.20 We suggest that one of the many student employees working at RIMAC be delegated the responsibility to make the necessary changes to the computers in the facility. We feel that this is an easy measure to implement and could be accomplished within one day.
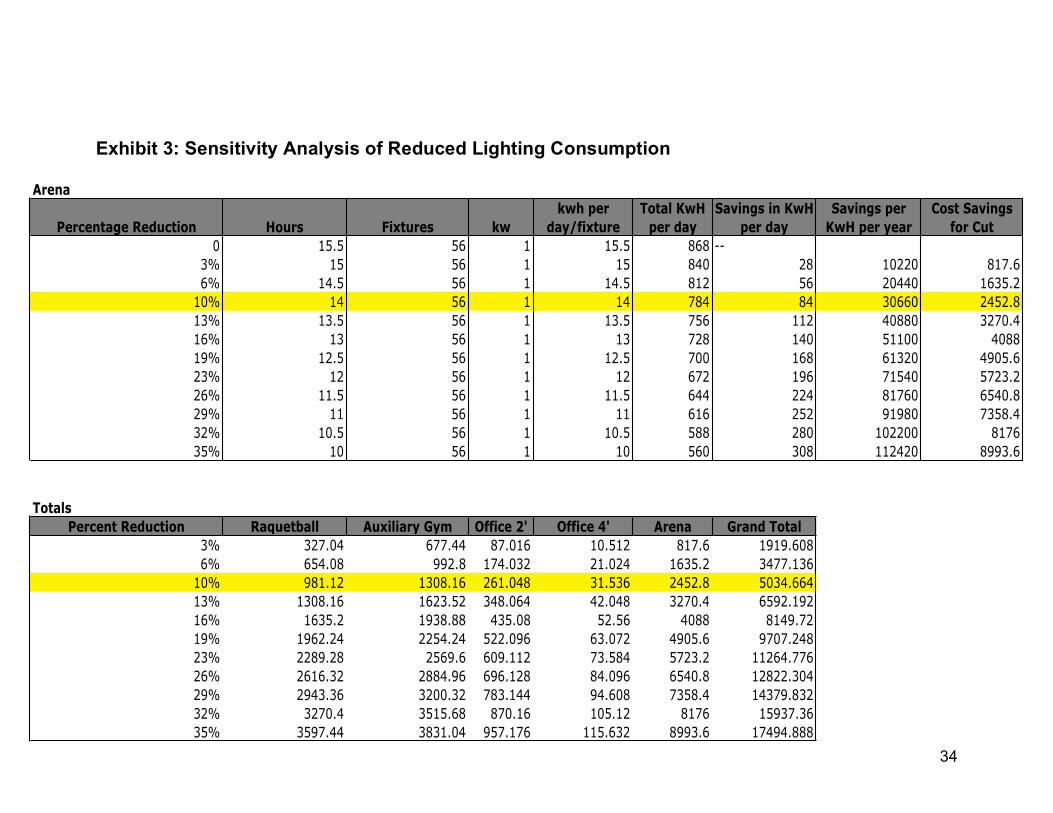
Lighting Changes Another simple, yet effective way to reduce energy costs in RIMAC is by ensuring that lights are turned off when they are not needed. Four areas have been targeted as clear candidates for behavioral changes. These areas are the auxiliary gym, arena, racquetball courts and the offices. Reducing the energy consumption in these areas will result in an overall energy savings of $5,000 in the first year. These energy savings were determined through a sensitivity analysis, which calculated reductions in hourly energy usage. The sensitivity analysis is displayed in Exhibit 3 (See Appendix).
Auxiliary Gym The auxiliary gym is currently not utilizing the daylighting sources available from the large windows and skylights that provide natural light to the gym (see Exhibit 4, which shows that there is sufficient natural light during the day to allow for this reduction). Therefore it is recommended that the auxiliary gym reduce energy consumption by turning on half of the lights during peak daylight hours. This will result in up to $1,300 in energy savings in the first year of implementation.
Arena There are three groups who are delegated authority to light the arena; the maintenance team, the coaches, and the sports facility representatives. While each of these groups has authority, there is no clearly defined role of who is responsible for turning the arena lights off. This ambiguity in the authority results in unnecessary wasteful energy consumption. Due to the high wattage of the fixtures in the arena (100W per fixture), leaving the lights on for only an extra hour a day for a year would result in an additional $2,10221 in energy costs. While the maintenance team monitors the buildings lighting system from a central location, they are often called away from the office for various reasons, which renders them unable to efficiently monitor the arena. However, the maintenance staff is only a fraction of this problem. From discussions with various staff members we learned that out of these three groups, the coaches and sports facility representatives behavior are resulting in wasteful energy consumption. An example of the coaches’ contribution is their lighting preferences during team practices. The arena is routinely divided into four sections when it is used for team practice. While coaches have the ability to light the partition used for practice, 20 This value was determined from the average value of 5 models used at RIMAC: Dell OptiPlex 745, OptiPlex 740, OptiPlex GX620, OptiPlex GX 270, OptiPlex GX260. Values are available from the University of Pennsylvania at http://www.upenn.edu/computing/provider/docs/hardware/powerusage.html 21 72kW*1h*365d=$2102

21
they favor lighting the entire arena. While coaches argue that they require a fully lit arena for peak athletic performance, facility staff suggest that lighting the partition or half of the arena will provide sufficient light for the athletes with the added benefit of reduced energy consumption. In addition to coaches, the sports facility representatives’ actions are also contributing to wasteful energy consumption. According to facility staff, these representatives often leave arena lights on after routine maintenance and cleaning. This wasteful behavior will be difficult to correct and require sufficient incentive mechanisms. Given the competitive nature of athletics and coaching it is recommended that RIMAC staff frame energy conservation measures in a competitive way. One idea would be to pit coaches against each other in a game to see which coach can have the largest reduction in energy savings. Each coach would be responsible for tracking his or her energy consumption data after each practice. This data should be publicly available to increase the competitive nature of the reduction measure. The coach or top coaches would then receive a percentage of the energy cost savings to be used in a discretionary fund for their team. To address the behavior of the sports facility representatives, it is suggested that RIMAC staff implement a sign-up sheet near the arena’s lighting console. Representatives will be responsible for signing this sheet and recording lighting information, specifically when they turn on or off the lights and if the lights were on when they entered the facility. Incorporating this sign-up sheet into the daily responsibilities of representatives will increase accountability and reduce excess lighting costs. Offices While offices do not offer significant cost savings as compared to other areas in the building, they should not be neglected. If these offices reduce their lighting consumption by 10%, this will result in an annual decrease in energy costs up to $263. Racquetball Courts Currently the equipment room office is responsible for operating the racquetball court lights. According to representatives from the equipment room, lights in these courts are turned on when needed and then left on for the duration of the day. Exhibit 5 (see Appendix) displays pictures of unoccupied, fully lit racquetball courts on an average weekday. It is recommended that the operation of these lights be standardized. Similar to the sign up sheet for the sports facility representatives, the equipment room representatives should also implement this strategy. In addition to the sign-up sheet, representatives should also be required to conduct regular sweeps every hour, turning off lights in unoccupied rooms. Accompanying these checks, representatives should also turn off lights once racquetball equipment is returned. Phantom Load Phantom load is defined as the electricity consumed by a device when it is turned off. While this may seem like a small fraction of energy consumption, nationally this

22
accounts for up to six percent of our energy consumption.22 While it is unclear what RIMAC’s phantom load consumption is, we estimated that it was approximately 2% which is a much more conservative estimate than the national average. There many options to reduce this phantom load on the market, however we chose to go with the easiest option for office workers, the GreenSwitch. Once the GreenSwitch is installed, an individual only needs to slide one switch and power is cut to all designated phantom load equipment, so that all non-essential lights are turned off. Installation of this system requires a minimal capital outlay of $1,200 and generates energy savings of $4,222.90 in the first year. Additionally the NPV analysis generated positive values, approaching $50,000 in ten years and $70,000 in 20 years.
22 Sustainability education coordinators, UC Berkeley.

23
As can be seen by the chart below, behavioral changes and adoption of the GreenSwitch technology offers significant cost reductions. This pie chart depicts the no cost / low cost energy savings from instituting lighting and behavioral changes. The greatest gain comes from implementing the GreenSwitch technology, followed by changing computer habits and reducing lighting consumption in the Arena.

24
Conclusion
The results suggest that there are significant measures that RIMAC facilities staff and users can implement to reduce energy consumption and increase UCSD’s green profile. Our recommendations increase RIMAC’s energy efficiency by 12% while cutting annual energy costs by $25,751.33.
Financial Benefits We recommend key decision makers at RIMAC to strongly consider the following strategies for making the gym more sustainable and energy efficient. Human Powered Energy We recommend retrofitting existing Precor machines with the Re-Rev technology as well as replacing existing treadmills in the next machine purchasing period with energy efficient EcoPower treadmills. The implementation of this program will lead to an annual cost savings of $3,512.08 with an initial investment of $1,500. In addition to financial savings, there are intangible benefits that can be realized such as enhanced public image and a focused marketing strategy. Solar Power Generation We do not recommend installing solar panel systems at RIMAC due to location constraints with the current technology available. Despite significant incentives from the state government, our analysis shows that there is a negative NPV for the project in addition to a payback period that is not acceptable to the Facilities Planning and Management Department. Lighting Initiatives There are significant energy savings that can be realized with negligible upfront investment costs, specifically replacing metal halide bulbs with high bay florescent fixtures in the racquetball courts and auxiliary gym realizing an annual cost savings of $8,263.75. Behavioral Changes Behavioral changes are the least costly to implement and can dovetail nicely with the competitive culture of the Athletics department. Very basic changes such as checklists, regular sweeps of the facilities, and a more efficient computer management strategy can lead to annual cost savings of $8,340.66. This assumes an expected 10% decrease in energy use by users of the facility. Furthermore, with a small capital outlay, implementation of GreenSwitch technology can also generate annual energy savings of $4,222.90. Environmental Benefits In addition to significant cost savings that can be realized by implementing our proposal, there are also benefits to the environment from the decrease in CO2 emissions. We calculated the positive environmental impact of our proposed solutions by estimating the shadow price for a short ton of CO2 from four separate estimates, two academic

25
literature values (Stern & Nordhaus) and two market values (Chicago Climate Exchange (CCX) & European Climate Exchange (ECX). We then multiplied the kilowatt-hour savings of our proposals into the market index figures to arrive the social benefit of reducing carbon emissions quantified in U.S. dollars. The figure below summarizes our findings: Social Benefit in US$
Sources
Price in $ (Short Ton
CO2) Solar Benefit
Fitness Equipment
Benefit
Lighting Initiative Benefit
Total Benefit
Stern Review $30.00 $138.72 $230.49 $811.91 $1,181.12 ECX Average $26.35 $121.84 $202.44 $713.13 $1,037.42
Nordhaus $27.00 $124.85 $207.44 $730.72 $1,063.01 CCX Average $3.34 $15.44 $25.66 $90.39 $131.50
The figure shows that implementation of solar, fitness and lighting initiatives can render an annual total benefit range of $131.50 to $1,181.12.
The above chart depicts the lifetime energy cost savings net of investment for the recommended initiatives. As can be seen, with the exception of solar, each of the initiatives offer steadily increasing cost savings over the life of the project.
26
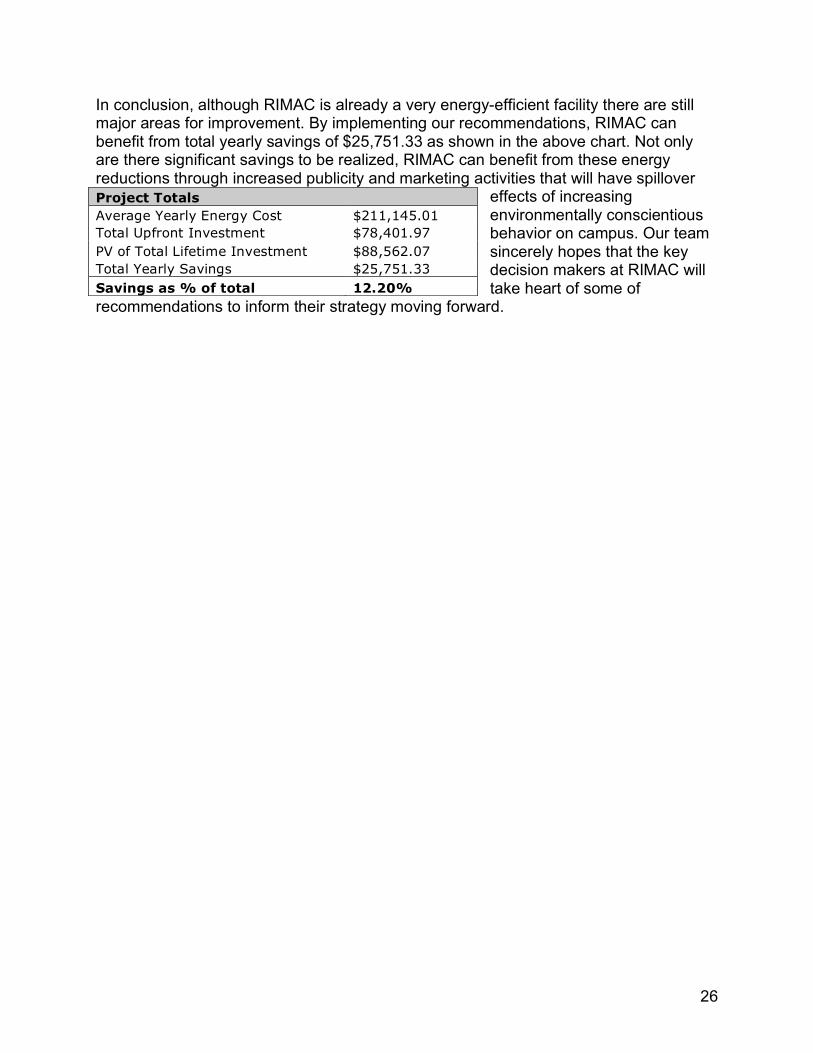
In conclusion, although RIMAC is already a very energy-efficient facility there are still major areas for improvement. By implementing our recommendations, RIMAC can benefit from total yearly savings of $25,751.33 as shown in the above chart. Not only are there significant savings to be realized, RIMAC can benefit from these energy reductions through increased publicity and marketing activities that will have spillover
effects of increasing environmentally conscientious behavior on campus. Our team sincerely hopes that the key decision makers at RIMAC will take heart of some of
recommendations to inform their strategy moving forward.
Project Totals Average Yearly Energy Cost $211,145.01 Total Upfront Investment $78,401.97 PV of Total Lifetime Investment $88,562.07 Total Yearly Savings $25,751.33 Savings as % of total 12.20%

27
Bibliography and Sources List Project Consultants: Don Chadwick, Director of Facilities Planning and Management / Student Affairs, UCSD Lourdes Dawson, Business Officer, UCSD Student Affairs / Sports Facilities John Dilliott, UCSD Energy / Utilities Manager Zarko Draganic, Electrical Engineer and Consultant Hudson Harr, CEO ReRev Glenn Johannsen, ReRev Dave Purtel, Maintenance Mechanic, RIMAC Hans Stullken, Head of Solar Department, Oneway Electric Mike Taggett, Human Dynamo Sean Ronan, GreenSwitch Tex Xelowski, Lead Maintenance Mechanic, RIMAC Gym Equipment Retrofitting: ReRev.com www.rerev.com Human Dynamo http://www.humandynamo.net/ Spin Bike Retrofit http://thegreenmicrogym.com/greenmicrogym.php?itemid=133 Manual Treadmill http://ezshoponline.amazonwebstore.com/ManualTreadmill/M/B000W09O96.htm Green Gyms: The Green Microgym – Portland, Oregon http://thegreenmicrogym.com/ California Fitness – Hong Kong, China http://www.motorwavegroup.com/new/californiafitness.html

28
Lighting Sources: Energy Retrofitters http://www.energyretrofitters.com/howitworks.html Computrols.com http://www.computrols.com/lightingsavings US Department of Energy, Energy Efficiency and Renewable Energy http://www.eere.energy.gov/ EPA Energy Star http://www.energystar.gov/index.cfm?c=power_mgt.pr_power_mgt_ss CPUC Solar Panel Energy Calculator at http://www.csi-epbb.com/Default.aspx US Green Building Council Case Studies found at http://www.usgbc.org/ Articles: Artuso, P., Santiangeli, A. “Energy solutions for sports facilities”, International Journal of Hydrogen Energy, 33, 2008. Borenstein, S. “The Market Value and Cost of Solar Photovoltaic Electricity Production”, Center for the Study of Energy Markets, January 2008. Caamaño, E. and Lorenzo, E. “Modelling and Financial Analysis Tools for PV Grid-connected Systems”, Progress in Photovoltaics: Research and Applications, Vol. 4, 295-305, 1996. Cholakaal, L. “Cost-benefit analysis of a Building Integrated Photovoltaic Roofing system for a school located in Blackburg, Virginia,” May 9, 2006. Energy Star, “What Spring Branch Independent School District Did Over Summer Vacation: Saved $230,000 With Computer Power Management”, www.energystar.gov Energy Star, “Verizon’s Monitor and PC Power Management Initiative could Save $7 Million Annually,” www.energystar.gov Hoff, T.E., Margolis, R.M. “Moving Towards a More Comprehensive Framework to Evaluate Distributed Photovoltaics,” Prepared under NREL Contract AAD-2-31904-03, June 6, 2005. Imamura, E., Uchiyama, Y. “Analysis of Financial Support for Photovoltaic System Installation with the Economic Simulation Model”, Central Research Institute of Electric Power Studies, 1994. Powell, B. “Cost-Benefit Analysis: A Solar-Energy ‘Investor’ Confronts the Economics of His Choice.”

29
Appendix

30
Exhibit 1:

31
Exhibit 2: Compact Florescent Bulb with Installation Date
Exhibit 2 shows a CFL bulb that was removed on March 05, 2009. This picture also indicates when this bulb was installed, a policy the maintenance staff implemented to track the life of these bulbs. This particular bulb had a lifetime of close to 3 years demonstrating the efficiency of these bulbs.

32
Exhibit 3: Sensitivity Analysis of Reduced Lighting Consumption Raquetball Courts
Percentage Reduction Hours Fixtures kw
kwh per
day/fixture
Total KwH
per day
Savings in KwH
per day
Savings per
KwH per year
Cost Savings
for Cut
0 15.5 56 0.4 6.2 347.2 --
3% 15 56 0.4 6 336 11.2 4088 327.04
6% 14.5 56 0.4 5.8 324.8 22.4 8176 654.08
10% 14 56 0.4 5.6 313.6 33.6 12264 981.12
13% 13.5 56 0.4 5.4 302.4 44.8 16352 1308.16
16% 13 56 0.4 5.2 291.2 56 20440 1635.2
19% 12.5 56 0.4 5 280 67.2 24528 1962.24
23% 12 56 0.4 4.8 268.8 78.4 28616 2289.28
26% 11.5 56 0.4 4.6 257.6 89.6 32704 2616.32
29% 11 56 0.4 4.4 246.4 100.8 36792 2943.36
32% 10.5 56 0.4 4.2 235.2 112 40880 3270.4
35% 10 56 0.4 4 224 123.2 44968 3597.44
Auxiliary Gym
Percentage Reduction Hours Fixtures kw
kwh per
day/fixture
Total KwH
per day
Savings in KwH
per day
Savings per
KwH per year
Cost Savings
for Cut
0 15.5 54 0.4 6.2 334.8 --
3% 15 54 0.4 6 324 23.2 8468 677.44
6% 14.5 54 0.4 5.8 313.2 34 12410 992.8
10% 14 54 0.4 5.6 302.4 44.8 16352 1308.16
13% 13.5 54 0.4 5.4 291.6 55.6 20294 1623.52
16% 13 54 0.4 5.2 280.8 66.4 24236 1938.88
19% 12.5 54 0.4 5 270 77.2 28178 2254.24
23% 12 54 0.4 4.8 259.2 88 32120 2569.6
26% 11.5 54 0.4 4.6 248.4 98.8 36062 2884.96
29% 11 54 0.4 4.4 237.6 109.6 40004 3200.32
32% 10.5 54 0.4 4.2 226.8 120.4 43946 3515.68
35% 10 54 0.4 4 216 131.2 47888 3831.04

33
Exhibit 3: Sensitivity Analysis of Reduced Lighting Consumption
Offices 2'
Percentage Reduction Hours Fixtures kw
kwh per
day/fixture
Total KwH
per day
Savings in KwH
per day
Savings per
KwH per year
Cost Savings
for Cut
0 15.5 149 0.04 0.62 92.38 0
3% 15 149 0.04 0.6 89.4 2.98 1087.7 87.016
6% 14.5 149 0.04 0.58 86.42 5.96 2175.4 174.032
10% 14 149 0.04 0.56 83.44 8.94 3263.1 261.048
13% 13.5 149 0.04 0.54 80.46 11.92 4350.8 348.064
16% 13 149 0.04 0.52 77.48 14.9 5438.5 435.08
19% 12.5 149 0.04 0.5 74.5 17.88 6526.2 522.096
23% 12 149 0.04 0.48 71.52 20.86 7613.9 609.112
26% 11.5 149 0.04 0.46 68.54 23.84 8701.6 696.128
29% 11 149 0.04 0.44 65.56 26.82 9789.3 783.144
32% 10.5 149 0.04 0.42 62.58 29.8 10877 870.16
35% 10 149 0.04 0.4 59.6 32.78 11964.7 957.176
Offices 4'
Percentage Reduction Hours Fixtures kw
kwh per
day/fixture
Total KwH
per day
Savings in KwH
per day
Savings per
KwH per year
Cost Savings
for Cut
0 15.5 36 0.02 0.31 11.16
3% 15 36 0.02 0.3 10.8 0.36 131.4 10.512
6% 14.5 36 0.02 0.29 10.44 0.72 262.8 21.024
10% 14 36 0.02 0.28 10.08 1.08 394.2 31.536
13% 13.5 36 0.02 0.27 9.72 1.44 525.6 42.048
16% 13 36 0.02 0.26 9.36 1.8 657 52.56
19% 12.5 36 0.02 0.25 9 2.16 788.4 63.072
23% 12 36 0.02 0.24 8.64 2.52 919.8 73.584
26% 11.5 36 0.02 0.23 8.28 2.88 1051.2 84.096
29% 11 36 0.02 0.22 7.92 3.24 1182.6 94.608
32% 10.5 36 0.02 0.21 7.56 3.6 1314 105.12
35% 10 36 0.02 0.2 7.2 3.96 1445.4 115.632
34
Exhibit 3: Sensitivity Analysis of Reduced Lighting Consumption
Arena
Percentage Reduction Hours Fixtures kw
kwh per
day/fixture
Total KwH
per day
Savings in KwH
per day
Savings per
KwH per year
Cost Savings
for Cut
0 15.5 56 1 15.5 868 --
3% 15 56 1 15 840 28 10220 817.6
6% 14.5 56 1 14.5 812 56 20440 1635.2
10% 14 56 1 14 784 84 30660 2452.8
13% 13.5 56 1 13.5 756 112 40880 3270.4
16% 13 56 1 13 728 140 51100 4088
19% 12.5 56 1 12.5 700 168 61320 4905.6
23% 12 56 1 12 672 196 71540 5723.2
26% 11.5 56 1 11.5 644 224 81760 6540.8
29% 11 56 1 11 616 252 91980 7358.4
32% 10.5 56 1 10.5 588 280 102200 8176
35% 10 56 1 10 560 308 112420 8993.6
Totals
Percent Reduction Raquetball Auxiliary Gym Office 2' Office 4' Arena Grand Total
3% 327.04 677.44 87.016 10.512 817.6 1919.608
6% 654.08 992.8 174.032 21.024 1635.2 3477.136
10% 981.12 1308.16 261.048 31.536 2452.8 5034.664
13% 1308.16 1623.52 348.064 42.048 3270.4 6592.192
16% 1635.2 1938.88 435.08 52.56 4088 8149.72
19% 1962.24 2254.24 522.096 63.072 4905.6 9707.248
23% 2289.28 2569.6 609.112 73.584 5723.2 11264.776
26% 2616.32 2884.96 696.128 84.096 6540.8 12822.304
29% 2943.36 3200.32 783.144 94.608 7358.4 14379.832
32% 3270.4 3515.68 870.16 105.12 8176 15937.36
35% 3597.44 3831.04 957.176 115.632 8993.6 17494.888

35
Exhibit 4: Auxiliary Gym and Daylighting Sources
This exhibit displays the auxiliary gym at 2:00pm on a weekday afternoon. From the picture it is obvious that there is sufficient light provided by the large windows located on the back wall of the auxiliary gym. It is also
important to note that while these windows are showering in natural light the majority of fixtures are on.

36
Exhibit 5: RIMAC Racquetball Courts
The exhibit displays pictures taken on a weekday afternoon of each racquetball court at the RIMAC facility. It is important to note that each of the courts were unoccupied however fully lit. This is a clear example of an area where changes in the behavioral of individual staff members may result in energy savings.