recognition of speech enhanced by blind compensation...
TRANSCRIPT
Recognition of Speech Enhanced by Blind Compensationfor Artifacts of Single-Sideband Demodulation
Mark J. Harvilla, Richard M. Stern
Department of Electrical and Computer Engineering and Language Technologies InstituteCarnegie Mellon University, Pittsburgh, PA 15213 USA
{mharvill,rms}@cs.cmu.edu
AbstractThis paper concerns the automatic recognition of speech thathas been distorted by frequency shifting introduced by atransmitter-receiver frequency mismatch in communicationssystems using single-sideband (SSB) modulation. The degra-dation in recognition accuracy depends both on the frequencyshift induced by mistuned SSB and additive noise, with a re-duction in SNR causing the degradation produced by mistunedSSB to become more profound. We consider the performance ofa method for detecting the frequency shifts introduced by SSB;the shifts can be easily corrected if identified correctly. Theproposed method provides accurate estimates of SSB-inducedfrequency shifts over a wide range of SNRs, if at least approx-imately 80 seconds of speech is available. The use of the al-gorithm provides almost-complete amelioration of the effectsof mistuned SSB even for utterances shorter than 10 seconds,and signal restoration is expected to improve for utterances oflonger duration.Index Terms: speech recognition, speech enhancement, non-linear distortion,single-sideband modulation
1. IntroductionSystems that attempt to transcribe long-range operational point-to-point communications signals, including commercial andmilitary transmissions, must deal with the effects of a wide va-riety of linear and nonlinear distortions. This paper concernsthe automatic recognition of speech that has been distorted byfrequency shifting introduced by a mismatch between the car-rier frequencies of transmitting and receiving oscillators of asingle-sideband (SSB) modulator-demodulator pair. We beginby describing the mathematical origins of the frequency-shifteffect and its impact on speech recognition accuracy. We thenconsider methods that have been developed to detect blindlyand compensate for the frequency shift, as well as the extent towhich these approaches are successful in restoring the speechrecognition accuracy obtained from the compensated signal.
2. Origins of SSB distortionSingle-sideband (SSB) modulation and demodulation has beenpopular in point-to-point communication systems because it re-duces the bandwidth of the modulated signal by a factor of twocompared to conventional double-sideband modulation.
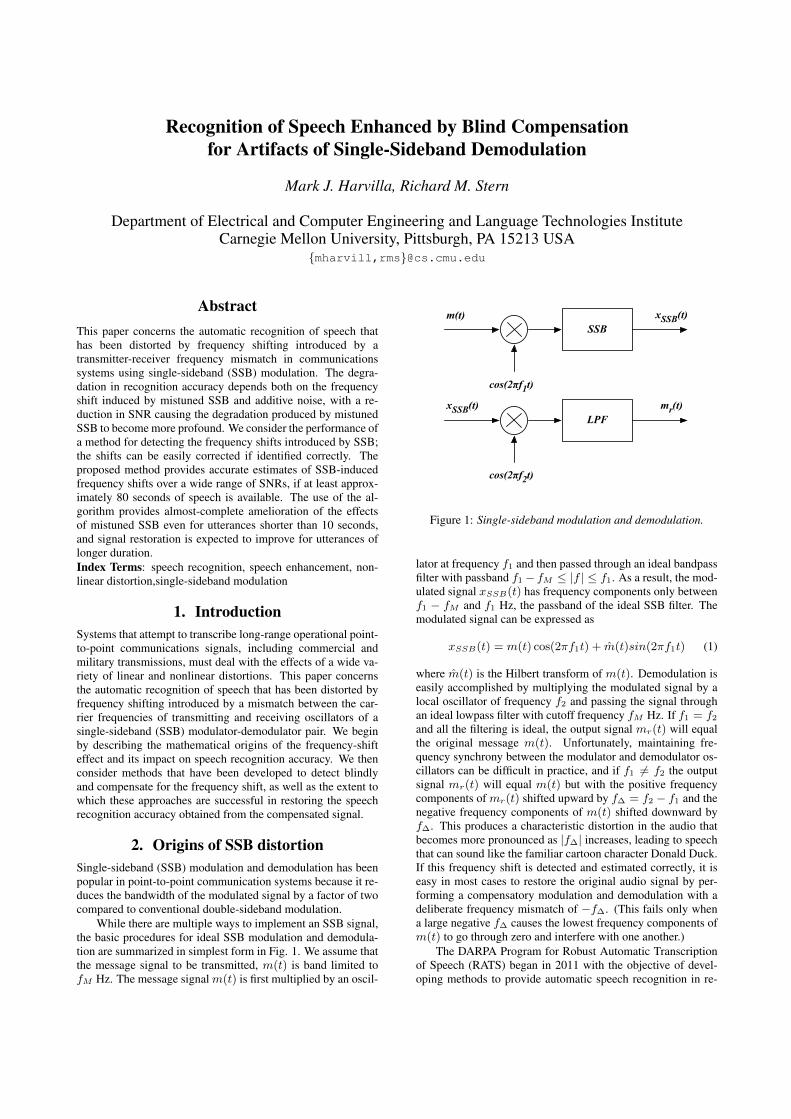
While there are multiple ways to implement an SSB signal,the basic procedures for ideal SSB modulation and demodula-tion are summarized in simplest form in Fig. 1. We assume thatthe message signal to be transmitted, m(t) is band limited tofM Hz. The message signalm(t) is first multiplied by an oscil-
SSB
cos(2πf1t)
m(t) xSSB(t)
LPFxSSB(t) mr(t)
cos(2πf2t)
Figure 1: Single-sideband modulation and demodulation.
lator at frequency f1 and then passed through an ideal bandpassfilter with passband f1− fM ≤ |f | ≤ f1. As a result, the mod-ulated signal xSSB(t) has frequency components only betweenf1 − fM and f1 Hz, the passband of the ideal SSB filter. Themodulated signal can be expressed as
xSSB(t) = m(t) cos(2πf1t) + m̂(t)sin(2πf1t) (1)
where m̂(t) is the Hilbert transform of m(t). Demodulation iseasily accomplished by multiplying the modulated signal by alocal oscillator of frequency f2 and passing the signal throughan ideal lowpass filter with cutoff frequency fM Hz. If f1 = f2
and all the filtering is ideal, the output signal mr(t) will equalthe original message m(t). Unfortunately, maintaining fre-quency synchrony between the modulator and demodulator os-cillators can be difficult in practice, and if f1 6= f2 the outputsignal mr(t) will equal m(t) but with the positive frequencycomponents of mr(t) shifted upward by f∆ = f2 − f1 and thenegative frequency components of m(t) shifted downward byf∆. This produces a characteristic distortion in the audio thatbecomes more pronounced as |f∆| increases, leading to speechthat can sound like the familiar cartoon character Donald Duck.If this frequency shift is detected and estimated correctly, it iseasy in most cases to restore the original audio signal by per-forming a compensatory modulation and demodulation with adeliberate frequency mismatch of −f∆. (This fails only whena large negative f∆ causes the lowest frequency components ofm(t) to go through zero and interfere with one another.)
The DARPA Program for Robust Automatic Transcriptionof Speech (RATS) began in 2011 with the objective of devel-oping methods to provide automatic speech recognition in re-

50 100 150 200 2500
1
2
3
4
5
6
7
Frequency shift (Hz)
Figure 2: Distribution of frequency shifts in selected channel ofthe DARPA RATS data.
−300 −200 −100 0 100 200 3000
20
40
60
80
100
Frequency shift (Hz)
WER
(%)
SNR 5 dBSNR 15 dBClean
Figure 3: Effects of SSB-induced frequency shifts on speechrecognition accuracy for clean speech and speech degraded bystreet noise with SNRs of 5 and 15 dB.
alistic highly-degraded channels. The data used for system de-velopment and evaluation consist of careful simulations of op-erational audio signals, and some of these channels exhibit fre-quency shifts. Fig. 2 is a histogram of the estimated values off∆ for utterances from one such simulated operational channel.
2.1. Impact of SSB-based frequency shifts on speech recog-nition accuracy
As noted above, the distortion produced by frequency shift-ing increases as f∆ increases, and interacts with other factorssuch as additive noise in a nonlinear fashion. Fig. 3 providessome sample error rates obtained using a version of the CMUSphinx-III system with a weakened language model, applyingfrequency shifts in the manner described above to sentencesfrom the DARPA RM1 database in the manner described be-low. Results are plotted for clean speech and speech degradedby digitally-added street noise. We note (unsurprisingly) thatthe observed word error rate (WER) increases monotonically asthe frequency shift increases and the SNR decreases. There is aninteraction between the two types of degradation, as decreasingthe SNR causes recognition accuracy to become impaired forfrequency shifts of increasingly small magnitude.
3. Detection and compensation forfrequency-shifted speech
3.1. Initial detection based on estimated fundamental fre-quency and spectral peak locations
Over the years a small number of algorithms have been pro-posed to detect blindly the values of f∆ for a particular incom-ing utterance. In general these algorithms work by estimatingthe fundamental frequency of voiced segments, typically usingcepstum-based techniques, and then observing the actual peaksin the log spectrum. The frequency shift f∆ is inferred by com-paring indirectly the locations of the actual spectral peaks to thelocations of spectral peaks that would have been produced by atrue harmonic series.
One such algorithm was proposed by Suzuki et al. [1]. TheSuzuki et al. approach begins by estimating the fundamentalfrequency f0 using cepstral techniques, computing the inverseDCT of the log of the spectrum. The estimate of f0 is unaffectedby the value of f∆ because the spectrum of a frequency-shiftedsignal exhibits the same periodocities over frequency regardlessof frequency shift. The estimated fundamental frequency f̂0 isobtained by searching for a maximum in the cesptrum at an ap-propriate quefrency corresponding to the nominal period of theperiodic signal. The peaks of the log spectrum of a frequency-shifted signal will appear at frequencies
fk = kf0 + f∆ (2)
where fk represents the spectral peak corresponding to the cor-rect harmonic, k is the harmonic number, and f0 is the truefundamental frequency. In practice, f0 can be estimated fairlyaccurately because this estimate is based on information fromall the harmonics of the signal, but the estimated locations of theindividual spectral peaks f̂k tend to be more errorful. Suzuki etal. obtained estimates of f∆ by plotting the estimated peaks ofthe log spectrum f̂k as a function of k, fitting a line to thesepoints using linear regression, and producing an estimated fre-quency shift f̂∆ from the intercept of this line with the verticalaxis. Suzuki et al. [2] also proposed a second approach in whichthe f∆ is inferred from the degree of symmetry of the cepstrumin each voiced frame.
3.2. Complete estimation of frequency shift independent ofharmonic number
A major shortcoming of the approach of Suzuki et al. [1] is thatthe algorithm is critically dependent on a correct match betweenthe putative harmonic number k and the frequency of each peakin the log magnitude spectrum. This can be difficult, especiallyin telephone channels in the POTS network which typicallyhave a bandpass frequency response with a low-frequency cor-ner of approximately 300 to 350 Hz. We spent some time work-ing on several ad hoc approaches that, by taking advantage ofa variable f0, could accurately estimate the true frequency shiftindependent of information about the harmonic numbers of thespectral peaks. Ultimately we discovered (to our chagrin) analgorithm developed by Robert J. Dick in 1980 [3] that antic-ipated in a robust and efficient fashion most of the functionalcomponents of our own algorithm. We now describe the ap-proach we use in the present study, which is in essence the Dickalgorithm with a small number of modifications.
Speech is sampled at 16 kHz and short-time Fourier trans-forms are computed in the conventional fashion using 80-msHamming windows with 50% overlap. For each N -point time

frame, the “complex correlation” C[m] is calculated by com-puting the inverse DFT of the magnitude of the N/2 + 1 pos-itive frequency components of the signal’s Fourier transform,padded with N/2− 1 zeros. The resulting complex-valued sig-nal is referred to by Dick as the complex correlation. (This issimilar to the more familiar analytic signal, but is based on theinverse transform of the positive-frequency components of themagnitude of the spectrum, rather than of the original complexspectrum itself.)
An estimate of f0 is obtained by searching for the peak inthe magnitude of C[m] for each time frame, in a similar fash-ion to obtaining an estimate of f0 using the magnitude of thecomplex cepstrum. An estimate of f0 is obtained by the simplerelation
f̂0 = fs/p (3)
where p represents the index in the time domain at which thepeak of C[m] is found and fs is the sampling frequency.
The set of all possible estimates of f∆ for a given frame isobtained from the real and imaginary parts of C[p] according tothe equation
f̂∆r =
(f̂0
2πarctan(=C[p]/<C[p])
)+ rf̂0 (4)
where the index r denotes the individual possible values of f̂∆.In our implementation we improve estimation accuracy by us-ing polynomial interpolation to enable the location of the maxi-mum ofC[m] to lie between two integer values ofm, and usingsimilar interpolation to obtain the values of =C[p] and <C[p]for non-integer values of p.
While Eq. 4 does not have a unique solution, the ambigu-ity is easily resolved because the correct value of r will leadto an estimate of f∆ that remains invariant over multiple anal-ysis frames, even though f0 is constantly changing. In con-trast, the other (incorrect) values of r will produce estimatesf̂∆r that vary over time. This observation enables us to identifythe correct value of r by accumulating a histogram of the mul-tiple frequency estimates f̂∆r on a frame-by-frame basis, eachincremented by the square of the value of maximum C[p] forthe current frame. Note that in order for Eq. 2 to be meaning-ful, the signal must be periodic, so we are principally interestedonly in the voiced frames. Because unvoiced speech is stronglyaperiodic, in contrast, the peak of the complex correlation willhave a small magnitude in the corresponding unvoiced frames.Thus, incrementing the histogram of f̂∆r by the magnitude ofthis peak for each time frame is reasonable in that it implicitlytakes voicing into account. The final estimate of f∆ is obtainedby simply selecting the largest peak in this histogram of fre-quency estimates.
Figure 4 shows the histogram of f̂∆ estimates obtained overapproximately 3.5 seconds of speech for which the true f∆ is−120 Hz. The (correct) value of −120 Hz is adopted for f̂∆
because it is the frequency corresponding to the maximum valueof the histogram. As can be seen, other candidate values of f̂∆
also appear in the histogram at clusters of frequencies separatedby multiples of the fundamental frequency f0.
Figure 5 describes the sensitivity of the compensation al-gorithm to utterance duration. The speech signals had been de-graded by additive noise and linear filtering that modeled theestimated characteristics of selected channels of the 2011 De-velopment Data from the DARPA RATS Program using the El-lis renoiser procedure [4]. The figure shows, as a function
−300 −200 −100 0 100 200 3000
0.1
0.2
0.3
0.4
0.5
Frequency shift (Hz)
Figure 4: Histogram of candidate values of f̂∆ for an utterancewith a true f∆ of -120 Hz. The peak is located at exactly -120Hz and the next-largest peaks are closely grouped in frequency.
0 20 40 60 80 100 12065
70
75
80
85
90
95
100
Approximation Duration of Speech (s)
Estim
atio
n A
ccur
acy
(%)
SNR 18.7 dBSNR 15.6 dBSNR 6 dBSNR 0.9 dB
Figure 5: Percentage of estimates of f∆ that are within 5 Hz ofthe correct value as a function of utterance duration.
of the duration and input SNR, the percentage of utterances forwhich the estimated f̂∆ is within ±5 Hz of the true frequencyshift f∆. For these data it is clear that durations of at least 60seconds are sufficient to provide estimates of the frequency shiftthat are accurate at least 90% of the time. The shapes of thecurves imply an asymptotic rise toward 100% accuracy with in-creasing input duration.
4. Recognition of speech withcompensated frequency shifts
The CMU SPHINX-III speech recognition system was usedwith the DARPA RM1 database to evaluate the impact of blindcompensation for SSB mistuning using both clean and degradedspeech. For these comparisons we used a bigram languagemodel and a three-state HMM-based acoustic model with mix-ture densities consisting of 8 Gaussians. A subset of the RM1database that included 1600 training utterances and 600 test ut-terances was utilized. The ASR was trained using clean datain all cases. The clean test utterances, as well as the utterancesmixed with real-world street noise with SNRs of 15 and 5 dB,were automatically compensated using the SSB mistuning de-tection algorithm described above. Feature extraction was per-formed using standard MFCC coefficients with cepstral meannormalization.

Figure 6: WER obtained for original and blindly-compensatedspeech with SSB-induced frequency shifts using the same con-ditions as in Fig. 3. Filled symbols denote WERs obtained forSSB-compensated speech while open symbols denote WERs forthe original uncompensated speech.
Figure 6 describes the WER obtained for a subset of thefrequency shifts depicted in Fig. 3, before and after blind com-pensation by the method described in Sec. 3.2. For these exper-iments, the compensation was performed on an utterance-by-utterance basis, and the average duration of the utterances wasonly 3.7 seconds with a standard deviation of 1.25 seconds. Itcan be seen that in general the compensation procedure is quiteeffective, especially when the SSB-induced frequency shift islarge in magnitude. Some performance degradation is observedwhen no frequency shift is actually present. This is a conse-quence of the short average duration of the Resource Manage-ment utterances, as noted above. With this short duration, theSSB-induced frequency shifts are correctly estimated to within±10 Hz for only 84.3% of the clean utterances, so 16% of theutterances are inadvertently degraded by mis-estimation of thefrequency shift. From the observations of Fig. 5 we are confi-dent that the accuracy of the SSB estimate will approach 100%as the duration of the input signals is increased.
Figure 7 describes recognition accuracy obtained for ut-terances with additive noise and linear filtering that simulatedthe two channels of the 2011 DARPA RATS development set(Channels D and H) that exhibited substantial frequency shifts.We compare results using three types of training procedures:(1) training using clean speech, (2) “multi-style” training us-ing speech samples that had been degraded by all of the sim-ulated RATS devset channels, and (3) “matched” training inwhich the training data are degraded by the same environmen-tal conditions as the test data. While blind compensation forSSB-induced frequency shifts provided the greatest benefit us-ing multi-style training, some improvement was observed forclean training as well. Very little improvement is seen for thematched-training condition because the ASR system has incor-porated the characteristics of the degraded speech into its acous-tic models, including the frequency shift.
5. SummaryThis paper concerns the automatic recognition of speech thathas been distorted by frequency shifting introduced by atransmitter-receiver frequency mismatch in communicationssystems using a single-sideband (SSB) modulator. We describea previously-developed algorithm that provides very accurate
Clean Multistyle Matched0
50
100
WER
(%)
Channel D (3.5−dB SNR, f6 = −180.9 Hz)
Clean Multistyle Matched0
50
100
WER
(%)
Channel H (3−dB SNR, f6 = −120.7 Hz)
AfterBefore
AfterBeforeAfterBefore AfterBefore
AfterBefore AfterBefore
Figure 7: WER before and after compensation for SSB mistun-ing for two simulated RATS-like channels using various trainingstyles.
estimation of the SSB-induced frequency shifts if about 60 sec-onds of speech are present over a wide range of SNRs. The useof the algorithm provides almost-complete amelioration of theeffects of mistuned SSB even for utterances shorter than 10 sec-onds, and recognition accuracy improves further when longerdurations of degraded speech are available to estimate the fre-quency shifts.
6. AcknowledgementsThis material is based on work supported by the Defense Ad-vanced Research Projects Agency (DARPA) under Contract No.D10PC20024. Any opinions, findings, and conclusions or rec-ommendations expressed in this material are those of the au-thors and do not necessarily reflect the view of DARPA or itsContracting Agent, the U.S. Department of the Interior, Na-tional Business Center, Acquisition & Property ManagementDivision, Southwest Branch. We also thank Kevin Walker atLDC for useful information about the potential sources for theSSB distortion in the DARPA RATS data and Dan Ellis for mak-ing the RATS renoiser tool available.
7. References[1] J. Suzuki, T. Shimamura, and H. Yashima, “Estimation of mistuned
frequency from received voice signal in suppressed carrier SSB,”in Proc. IEEE Global Telecommunications Conference, 1994, pp.1045–1049.
[2] J. Suzuki, Y. Hara, and T. Shimamura, “Improvement in the qual-ity of speech received at suppressed improvement in the quality ofspeech received at suppressed carrier ssb,” in Proc. IEEE GlobalTelecommunications Conference, 1995, pp. 1615–1618.
[3] R. J. Dick, “Co-channel interference separation,” Rome Air Devel-opment Center, Tech. Rep. RADC-TR-80-365, December 1980.
[4] D. P. W. Ellis. RENOISER – utility to decomposeand recompose noisy speech files. [Online]. Available:http://labrosa.ee.columbia.edu/projects/renoiser/