recommendation: buy
TRANSCRIPT

Analyst Eric Ryberg [email protected] Company Overview Schlumberger, (SLB) is the world's leading provider of technology for reservoir characterization, drilling, production, and processing to the oil and gas industry. Working in more than 85 countries and employing approximately 100,000 people who represent over 140 nationalities, Schlumberger supplies the industry's most comprehensive range of products and services, from exploration through production and integrated pore-to-pipeline solutions for hydrocarbon recovery that optimize reservoir performance. After officially merging with Houston based competitor, Cameron, Schlumberger holds around 47.4% of the market share of the Oil & Gas Equipment & Services industry. For the 2016 fiscal year, Schlumberger had a total revenue decline of 21.61% to 27.81 billion, its second straight year of declining revenue. This lead to Schlumberger to report negative earnings per share (EPS) for the first time in the last decade. Stock Performance Highlights 52 week High $87.84 52 week Low $72.00 Raw Beta Value 1.27 Average Daily Volume 6.13m Share Highlights Market Capitalization $109.08b Shares Outstanding 1.34b Book Value per share $30.99 EPS (2016) $(-1.24) P/E Ratio $(-62.94) Dividend Yield per Share $2.00 Company Performance Highlights ROE (-2.06) % ROA (-2.18) % Financial Ratios Current Ratio 1.59 Debt to Equity 87%
Current Price $78.24 Target Price $87.92
One Year Stock Performance:
Source: Bloomberg
SLB Proves Strength through Crisis and looks to Benefit from Stable Oil Prices • Schlumberger’s technological edge and large Industry market share allow it to weather low energy commodity prices better than competitors, allowing SLB to maintain its current value during crude oil price slump • Schlumberger had no single customer account for More than 10% of their consolidated revenue in 2016, allowing no single heavy E&P customer have significant leverage on revenue intake • Large OPEC oil producers are beginning to follow OPEC production limit, which will result in stabilizing crude oil prices for next year, we estimate between $52-$56 • E&P spending surveys currently indicate that 2017 E&P investments in North America will rise by approximately 30%, and global E&P spending growth to 9%, leading to both higher activity and a recovery in service industry pricing.
Recommendation: BUY
KRAUSE FUND| Energy Sector| SPRING 2017
Schlumberger (NYSE: SLB) April 18th, 2017

2 | P a g e S c h l u m b e r g e r ( S L B ) 4 / 1 8 / 1 7
There are four economic indicators that influence Energy Transfer Partners’ performance in future years. These factors include gross domestic product (GDP), supply and demand of oil, upstream capital expenditures, and regulation.
Gross Domestic Product (GDP)
Demand for crude oil is compelled by global economic growth. Oil is the driving force of world economies by its use as the basic fuel for transportation and the power source for limitless industries. The chat below measures the consumption of all world liquid fuel consumption against world GDP growth and WTI crude oil prices. As shown in the chart, it is clear that changes in real GDP have a direct correlation on oil demand and higher GDP growth has historically corresponded with higher liquid fuel consumption.
Source: EIA.govi Looking forward, China’s annual real GDP growth rates have been forecasted to be 6.50% in 2017 and trend around 6.25% in 2018 and 2019. China’s GDP growth rates have slowed down each year since 2010 and these forecast follow the same trendii. China’s first-quarter GDP growth hit 6.9%, which is the highest it has been since in six quarters and is better than economists had predicted. However some economists believe China’s GDP numbers are purposely inflated and they expect GDP to slow down the rest of the yeariii. Analysists say the first quarter of 2017 is going to be as good as it gets for China, and analysts worry China is relying too heavily on infrastructure development to sustain growth in the long term.
India’s real GDP is forecasted to grow at rates of 7.2% in the 2017-18 financial year and is expected to rise gradually to 7.7% in 2019-20iv. We agree with these forecasts, but it is important to note we are worried about significant risks to India’s favorable growth outlook. Such risks include the effects of China’s slowing economy on India, and the lasting effects of the demonetization in November of 2016 which impacted 86% of India’s currency in circulation. Total OECD real GDP growth is forecasted to be 2.0% for 2017 and 2.3% for 2018, while the United States real GDP is forecasted to be 2.4% and 2.8% respectivelyv. We believe OECD’s forecasts to be reasonable based on the modest growth OECD counties have experienced recently due to mature economic conditions and global economic uncertainty.
Source: OECDvi Oil Prices - Supply
OPEC vs. Non-OPEC
All of the world’s oil supply comes from two groups, OPEC and non-OPEC. OPEC is an organization made up of 13 countries, mostly in the Middle-East, and are led by their largest producer, Saudi Arabia. OPEC member countries produce around 40% of the world’s crude oil. With such a large market share, OPEC’s actions have a large influence over international oil prices. Oil markets often respond to changing expectations of future supply and demand. The chart below shows how projections of changes in Saudi Arabia crude oil production results in changes in WTI crude oil prices.
Economic Analysis

3 | P a g e S c h l u m b e r g e r ( S L B ) 4 / 1 8 / 1 7
Source: U.S. EIA, Thomson Reutersvii In 2016 OPEC produced an average of 32.57 million barrels per day of crude oil. Forecasts for 2017 and 2018 OPEC crude oil production is 32.69 and 33.24 million b/d respectively. In November of 2016, OPEC members and 11 other nations led by Russia agreed to oil production cuts in order to decrease the large supply that has rattled oil markets around the globe since 2014. The goal of the agreement is to trim the output by almost 1.8 million b/d, combined. So far in 2017, OPEC has surprisingly followed through with their stated agreement cuts and some countries, such as Saudi Arabia have cut more than they agreed upon. However, the production cuts have had little lasting impact on oil prices.
In 2016 Non-OPEC countries produced an average 58.18 million b/d. Forecasts for 2017 and 2018 are 58.80 and 59.96 million b/d respectively. Non-OPEC supply growth is crucial to world crude oil prices. When non-OPEC supply growth is incapable of meeting oil demand growth, the world is forced to rely increasingly on OPEC to cover the gap. The chart below show how changes in world oil consumption and non-OPEC production have on WTI crude oil prices.
Source: EIA Short-Term Energy Outlook, April 2017viii
Source: EIA Short-Term Energy Outlook, April 2017ix Crude Oil Reserves
Oil reserves are an estimate of the amount of crude oil located in a particular economic region. As shown in the graph below, 81% of the world’s oil reserves are held by OPEC countries, and roughly 65% of OPEC’s reserves are located in the Middle East. In recent years the amount of OPEC’s crude oil reserves have increased due to intensive exploration and enhanced recoveries and at the end of 2015 had around 1.2 trillion barrels. There are trillions of barrels of additional oil in unconventional reserves, but is very difficult to extract and produce large quantities economically. Thus, they are not currently a key driver of oil supply, but no doubt it will be in the future.
Source: OPEC Annual Statistical Bulletin 2016x
Oil Inventories
Oil inventories measure the weekly change in the number of barrels of commercial crude oil. The inventories influence the price of petroleum products, which have a strong impact on inflation. If the amount of crude inventories increase more than expected, it implies weaker demand and is

4 | P a g e S c h l u m b e r g e r ( S L B ) 4 / 1 8 / 1 7
bearish for crude prices, and vice versa. At the end of January crude oil inventories rose 6.5 million barrels and are 5% higher than they were at the end of January in 2016. We expect oil inventories to stay above average over the Source: EIA Short-Term Energy Outlook, April 2017 next 6 months. The graph below shows OECD commercial crude oil and other liquids inventories. As shown in the graph, the OED inventories are expected to remain relatively consistent for the near future.
Oil Prices – Demand
Crude oil is the most basic fuel for transportation and is a major power source for nearly every country and many different industries. Changes in demand have a heavy impact on oil prices and the economy overall and this is driven by both developed countries (OECD) and emerging countries (Non-OECD). Between OECD countries and Non-OECD countries, oil demand is the strongest in emerging and developing nations as they tend to rely much more on manufacturing as compared to developed nations, which rely much more on services. Because manufacturing requires more energy usage than the service industry, the demand is naturally higher. According to the EIA, OECD demand for oil has declined over the past decade and demand for non-OECD countries has increased upwards of 45% in countries such as India, Saudi Arabia, and China. While 2017 and 2018 are expected to have increased oil demand for OECD countries of about 3%, future growth in demand for OECD countries is expected to decrease about 2.50% every year after as service jobs increase versus manufacturing jobs. This decline in demand is also affected by new energy sources coming into play. OECD countries have the resources to look into new, renewable energy sources, and as these energy sources become more viable, demand for oil will continue to decrease. Consumption growth for oil is expected to be 1.6 million b/d and 1.5 million b/d in the years 2017 and 2018, respectively, with 1.2 b/d of the growth in both years coming from Non-OECD consumption and OECD countries consuming 0.4 and 0.3 b/d.
In addition to this, oil prices are expected to increase slightly relative to what they are today, if they increase at all. As of April, oil is currently $52.65/bbl. according to the WTI, and we predict it to stay within that range between roughly $52-$56/bbl. The United States, one of the biggest oil consumers of the OECD countries, plans to rely more on itself to provide oil rather than OPEC countries, especially after the recent election. This could cause uncertainty in where oil prices could go, however, judging by OPEC’s latest decision of cutting production and not seeing a substantial increase in price, we are predicting oil prices to increase slightly, if at all.
Source: EIA Short-Term Energy Outlook, Jan. 2017xi
Upstream Capital Expenditures
Upstream capital expenditures is the collective amount spent by companies looking for and producing gas and oil. It is generally focused on high-growth, low-cost opportunities and is largely dependent on exploration and development convenience. While finding and development (F&D) increased 5% in 2013, it fell 1% in 2014 along with exploration and production (E&P) declining 32% in 2015xii. Per the EIA, lower oil prices reduce expected returns from future production, decreasing incentives for upstream investment spending. As a result, new exploration and development projects may be delayed or canceled, and reduced investments in producing fields can ultimately slow the growth in production. The effects may not be immediate, as some projects can have lead times of many years. However, if the trend continues, future production growth could be lower than originally anticipated. With crude oil prices continuing to fall from last year's levels, some companies have already announced further capital expenditure reductions for 2015. Increasing upstream capital expenditures will generally lead to increased oil supply, which in turn decreases prices. Because of this, periods of rising capital expenditures generally benefit energy service firms providing rigs, equipment, and services necessary to search for and expand oil and gas production.
Forecasts for 2017 see expect to see an increase of 9% according to Barclays latest E&P spending survey with North America spending increasing 32%xiii after a massive decline of 38% in 2016. The rig count forecast will average 730 in 2017 with predictions of roughly 850 at the end of the year. Internationally, spending is expected to increase 2% in 2017 after its decrease of 18% in 2016. National oil companies plan to increase spending by roughly 9%, which will offset the expected international oil companies decline in spending. With these forecasts, upstream capital investment worldwide will climb to 404.6 billion in 2017 from last year’s estimated amount of 377.1 billion.

5 | P a g e S c h l u m b e r g e r ( S L B ) 4 / 1 8 / 1 7
Regulations Energy is one of the most regulated industries in the economy and is heavily affected by government decisions and policies. Often times, governments will increase or decrease subsidies and tax incentives for oil companies depending on the controlling party. In general, higher taxes and royalties lead to decreased oil drilling and capital expenditures in the energy sector. With the recent election in November, Republicans have taken both the House and the Senate, along with President Trump winning the Oval Office. The Republican Party generally views restrictions on business as hindering the economy and are predicted to rollback many environmental regulations which deal directly with the oil industry. Trump has proposed an “America First Energy Plan” and has stated that he wants to stay clear of OPEC imported oil and rely more on America’s drilling abilities. These plans have already begun with Trump’s budget severely cutting the Environmental Protection Agency’s funding and Trump using executive orders to get rid of previous rulings such as the Clean Energy Act. This will effectively benefit companies and give them more power to do business as they please, which should naturally increase revenues in the process. Trying to gain independence from OPEC would cause an increase in crude oil prices but if domestic production increases in the process, then prices are predicted to stat relatively constant. Another policy that has been proposed is a border tax. Bloomberg has predicted a 20% chance of an increased border tax on all imports, including crude oil. This would spark a rise in fuel costs across the country that would most likely hurt East and West Coast refiners more than those near the Gulf of Mexico. Although this border tax has gained momentum since President Trump’s election, it is unlikely that this will actually happen within the next year. If it does come to fruition, oil prices are still predicted to stay relatively the same due to an increase in domestic oil production.
Overview: Schlumberger operates in the Oil & Gas Equipment & Services industry. The industry is known to assist the oil and gas industry in every phase of the exploration and production process of upstream energy companies. Main functions are to assist in drilling, evaluation, and completion of oil and gas wells. The performance of the S&P 500 Energy Sector is illustrated by the graph below.
The red line indicates a 39 week moving average for smoothing purposes.
Source: Net Advantagexiv Key Industry Trends and Developments Exploration and Production Increase As stated earlier according to Barclay’s Exploration & Production spending survey global exploration and production spending will rise 9% in 2017. This is highlighted by a 32% expected increase in North American upstream E&P spending. Since the beginning of 2017, at least eight companies have announced acquisition in the Permian basin (west Texas/southeast New Mexico), totaling over $16 billion. If oil prices drop below $50/bbl., E&P are likely to defer some growth over the year but according to our prediction of $52/bbl. floor for 2017, we are expecting E&P growth to increase as expected, which will cause the Equipment and Services industry to grow. This will lead to an increase in equipment and service providers to increase activity over the next year and we are forecasting that the equipment and service energy sector to still be negative next year but for top, premium equipment and service companies to get back in positive revenue growth. Offshore Drilling Offshore rigs are drilling units used to find oil and gas in open water with depths ranging from 550 ft. to 10,000 ft. The three main types of offshore rigs are semisubmersible, drillship and jackup. The utilization rate of offshore rigs (rigs in used/ total amount of rigs) is an important indicator to gauge demand and activity in the offshore industry. The rig utilization has
Industry Analysis

6 | P a g e S c h l u m b e r g e r ( S L B ) 4 / 1 8 / 1 7
drastically fallen compared to its historical rates over the past decade (cite). Although recent advancements in deep water technology have improved the quality in offshore rigs, the decline of oil prices compared to high offshore extraction cost (as shown in the previous graph) and the high risk in offshore rigs. Although the utilization rate of offshore rigs is low, global oil company’s capex in offshore rigs has increase, which could explain the decline in utilization, due to there being more total rigs available. Schlumberger operates the largest, most efficient stimulation vessels ever built, positioning itself for a possible increase in offshore production if the opportunity arises (cite). Below is a graph highlighting the decline of the 3 main offshore rig utilization over the past decade.
Source: Rigzonexv We decided we want to see the driving factors behind rig utilization in the United States and the previous past 10 year monthly average price, and ran a regression.
Source: Investing.com (Monthly Oil Price)xvi, NOV 63rd Annual RIG CENSUSxvii
Above is a regression run on average annual crude oil price and rig utilization. According to the R^2 crude oil price accounts for just under 40% and the t Stat shows that crude oil is significant, and that for every dollar increase in crude oil prices, there is a .7785% increase in rig utilization. Growth by Acquisition and Mergers The decline of oil prices during late 2014 and 2015 lead to a large amount of mergers & acquisitions over 2016. As companies could no longer operate due to high extraction cost compared to oil prices and high rig operating cost, they either had to leave the market or merge with other companies, allowing larger energy companies the opportunity to acquire smaller companies. For example, Haliburton announced in May of 2016 it is merging with Baker Hughesxviii yet due to anti-trust concerns from the U.S. department of Justice, the merger is being delay, Shell has acquired BG Group in 2016xix, and Schlumberger finalized acquiring Cameron International. When a company’s oil extraction cost is greater than the cost of the price of crude oil the firm is operating at a negative net income and cannot survive. This economic pressure cause firms to stay alive by merging with other companies. Below is a graph of the average breakeven oil price for the top eight types of oil extraction. There is no point below $60/bbl, which suggest that the entire industry is destined to fail, yet assuming that is the oil price average, the companies that will survive and gain market share are the companies that have a lower breakeven point. These are the companies acquiring firms in this bear oil
Rig Utilization U.S Rig Utilzation Can Average Crude Oil Price Price Standard Deviatio2006 96% 84% 66.96166667 0.26%2007 85% 43% 74.94416667 4.09%2008 83% 46% 89.65416667 -5.59%2009 40% 22% 63.92333333 5.25%2010 64% 42% 79.985 1.47%2011 67% 46% 65.35583333 0.68%2012 75% 44% 97.00166667 1.00%2013 67% 37% 64.72333333 -0.18%2014 70% 44% 91.2275 -4.67%2015 51% 41% 49.3075 -2.39%2016 23% 45% 44.46833333 3.55%
Coefficientstandard Erro t StatIntercept 0.098085 0.237729 0.412591Average Crude Oil Price Price 0.007785 0.00324 2.402831R Square 0.390805Adjusted R Square 0.323117Standard Error 0.172591Observations 11

7 | P a g e S c h l u m b e r g e r ( S L B ) 4 / 1 8 / 1 7
market.
Source: Oilprice.comxx *Estimates are based on the 30 largest projects within each group expect to start up in the period 2014-2020
Since we believe that oil prices are to be stable for the next 2-3 years, we are predicting that this trend will slow down into 2017. The energy market went through a shift in 2016 and is looking to become stable over the course of the next couple years. More R&D Spending With wells getting deeper and more complex, companies with in the industry need to improve existing and develop new technology.
Source: Data Collected Through Companies 10-k fillings According to our previous data table our expectation of an increase of research and development cost across the equipment and service energy industry proves to be
correct with an average 2016 of 5.62% R&D expense of revenue and an aver 0.71% industry increase on R&D. Although this data table only consist of three companies, they account for more than 70% according to the next pie chart under comparable company analysis. If the top market capitalizers are spending more on R&D, it is safe to assume that small firms are following this trend as well. This trend may be on the decline for Schlumberger announced in the annual 10-k that they are projecting Research and Development cost to be around 2.9% for the next year. Comparable Company Analysis Due to Schlumberger’s size and diverse product segments, it has very few direct competitors. Among those competitors, in terms of size and product offerings include but are not limited to; Haliburton, Baker Hughes, National Oilwell Varco and Weatherford International. These five companies account for around 80% of the Energy Equipment and Services Industry, illustrated by the image below.
Source: S&P Global Market intelligencexxi A brief description of Schlumberger’s main competitors is as follows: Haliburton (HAL): Serves the upstream oil and gas industry throughout the lifecycle of oil reservoirs- from locating hydrocarbons and managing geological data, to drilling and formation evaluation, well construction, completion and production optimizationxxii Baker Hughes (BHI): Delivers solutions that help oil and gas operators make the most of their reservoirs. National Oilwell Varco (NOV): Provides technical expertise, advanced equipment and operational support necessary for drilling and production. Weatherford International (WFT): Provides evaluation, products and services that ensure well integrity and
2011 2012 2013 2014 2015 2016R&D 1,073 1,153 1,174 1,217 1,094 1,012 Rev 25915 29654 31901 33854 24767 20843R&D% 4.14% 3.89% 3.68% 3.59% 4.42% 4.86%
% Change -0.25% -0.21% -0.09% 0.82% 0.44%R&D 401 460 588 601 487 329Rev 54829 28203 29402 32870 23633 15887R&D% 0.73% 1.63% 2.00% 1.83% 2.06% 2.07%
% Change 0.90% 0.37% -0.17% 0.23% 0.01%R&D 462 497 556 613 466 384Rev 6382 7274 7594 8056 5649 3870
R&D% 7.24% 6.83% 7.32% 7.61% 8.25% 9.92%% Change -0.41% 0.49% 0.29% 0.64% 1.67%
Year Average %: 4.04% 4.12% 4.33% 4.34% 4.91% 5.62%Average Percent Change 0.08% 0.22% 0.01% 0.56% 0.71%
SLB
HAL
BHI
R&D Expense Compare to Annual Revenue

8 | P a g e S c h l u m b e r g e r ( S L B ) 4 / 1 8 / 1 7
drilling reliability, novel reservoir completion and stimulation technology that optimizes recovery.
Source:FactSetxxiii
The table above illustrates some key metrics of Schlumberger and its competitors in 2016. Schlumberger is the only company out of its main competitors to have a positive Earnings before interest, tax, depreciation and amortization. This shows the completive advantage SLB has over its competitors, showing that it can outperform its competitors during a down, bear market.
Another important metric shown in the table is Return on Assets and Return on Equity. Although having a negative return on both these ratios is not necessarily good, it is a good sign how relatively small ROA and ROE are for SLB when compared to its peers. This is a good indicator that Schlumberger is at the top of its industry when it comes to generating return on capital expenditures and creating value for shareholders.
Source: Thomson Onexxiv
Market and Competition (Porter’5 Forces)
Threats of New Entrants
The possibility of new companies entering the Oil and Gas Equipment and Services Industry is highly unlikely. This is primarily because the industry is highly capital
demanding. There are also strict regulations since oil production is one of the most regulated commodities in the world. Lastly, the market is already pretty mature and developed. There is no niche in the market that an incoming firm can fulfill, the existing companies already have all existing possible market share.
Bargaining Power of Suppliers
Suppliers are those who provide the raw materials used in the construction of rigs and other equipment. The bargaining power of the supplier depends on unique nature of their products. For example; if a supplier has industrial diamonds that company will have more bargaining power than suppliers with steel.
This is causation for the R&D to be generally high amongst firms within the equipment and services sector is so high. Each company needs to compete with each other to provide the next great innovation.
Bargaining Power of Buy
Due to record low rig utilization rates, the balance of power is shifted to the buyer. With more options of available rigs, competition between suppliers increases and the buyer benefits. Companies’ equipment services do not differ, which leads buyers to consistently seek out lowest price.
Threat of Substitutes
Although the technology to produce energy substitutes, the actual threat is small. For a company to come up with a substitute product that can threaten the energy industry would take an excessive amount of capital. There would also need to be innovations that outpace current possible substitute methods. Renewable energy sources are making small movements in the industry but have minor to none relative energy sector share. In 2016 solar wind, wood bio mass and other renewables combine for a total of 9.970 quadrillion Btu, while oil alone account for more than 36 quadrillion Btu.
Competition
Name Market Cap (b) Sales (m) EBITDA ROA ROESchlumberger 1.14 27.92 2.7 -1.49% -4.40%Halliburton Company 4.9 15.887 -5.24 -16.34% -46.34%Baker Hughes Inc. 2.62 9.481 -0.69 -11.88% -18.91%National Oilwwell Varco Inc 1.54 7.251 -9.74% -15.88%ENSCO PLC 3.59 2.85 -0.59 -7.74% -16.95%CGG 0.23 1.48 -0.73 -7.20% -38.52%HELMERICH & PAYNE, Inc. 6.03 1.5 -0.45 -1.21% -2.35%Nabors Industires LTD 4.54 2.43 -0.31 -7.31% -21.14%

9 | P a g e S c h l u m b e r g e r ( S L B ) 4 / 1 8 / 1 7
Highly consolidated market sector, with the largest four companies having a combined 79% market-capitalization weight.
General Information
CEO: Paal Kibsaard
Executive VP and CFO: Simon Ayat
President of Operations: Patrick Schorn
Schlumberger was found in 1926 and has become a world leader in providing technology and support for upstream exploration and production energy companies. Schlumberger is an innovator, and leads its industry in oil and gas well data collecting methods. Schlumberger provides services include; seismic and drilling services, subsea production, consulting, software, and information management. Schlumberger current operates in over 85 countries.
Schlumberger operates in each of the major oilfield service markets, and they manage their business operations through four main Groups: Reservoir Characterization, Drilling, Production, and Cameron. Each Group contains a number of technology-based services and product lines, or Technologies.
Source: ThomsonOnexxv
These Technologies cover the whole life cycle of the reservoir and correspond to a number of markets in which Schlumberger holds leading positions. The role of the Groups and Technologies is to support Schlumberger in providing the best service possible to customers and to guarantee that Schlumberger remains several steps ahead of competitors in technological developmentsxxvi.
At this time of last year there were only 3 Groups. However, on April 1, 2016, Schlumberger acquired all of the outstanding shares of Cameron International Corporation. Schlumberger issued 138 million shares of its common stock, valued at approximately $9.9 billion as of the acquisition date, and paid cash of $2.8 billion to acquire Cameron. Cameron is a leading provider of flow equipment products, systems, and services to the oil and gas industry worldwidexxvii.
Corporate Strategy
Schlumberger tries to increase its shareholder value by researching and developing their own new technologies or by purchasing or partnering with other companies. Schlumberger continues to improve relations with their customers by striving to increase the speed and productivity of their products and services. With the latest advances in IT infrastructure and transportation, Schlumberger plans to leverage the scale of its operations to reduce their costs. Schlumberger is strongly involved with the entire Oil and Gas production life cycle by providing the necessary technology and expertise for the downstream, midstream, and upstream mechanisms of the whole market. For the future, Schlumberger intends to ensure reduction in operational non-productive time, double asset utilization, increase workforce productivity by 20%, and reduce support costs by 10%xxviii.
Financial Summary
It would be an understatement to say 2016 was a down year for Schlumberger’s revenues. Schlumberger’s revenue of $27.8 billion in 2016 represented a 22% decrease from 2015, in spite of the $4.2 billion in revenue from three quarters of activates from the acquired Cameron Group. Excluding the Cameron Group, revenue declined 34% and adjusting revenue as if Cameron was acquired at the beginning of 2016 revenue only declined 17.6%. The revenue drop was the result of continued decreases in exploration and production spending from upstream oil and gas companies due to the most intense industry crisis in the last 30 yearsxxix.
Schlumberger’s Reservoir Characterization, Drilling, and Production Group’s revenues dropped 31%, 37%, and 29% respectively. The large revenue decreases were caused by several factors including: cuts in exploration and discretionary spending, reduction of high-margin activities, severe drop in rig count in both North America and international combined with pricing
Company Analysis

10 | P a g e S c h l u m b e r g e r ( S L B ) 4 / 1 8 / 1 7
pressure, and a large decline in Well Services pressure pumping technologies in North Americaxxx.
Products and Markets
Schlumberger operates in each of the major oilfield service markets and manages its business through four primary segments: Reservoir characterization, Drilling, Production, and Cameron. The four segments respectively account for 24%, 30%, 31%, and 15% of their business and each are made up of several sub segments of their products and servicesxxxi.
Reservoir Characterization Group - Finding and defining hydrocarbon resources. These include WesternGeco®, Wireline, Testing & Process, Software Integrated Solutions (SIS) and Integrated Services Management (ISM). Drivers: Reservoir Characterization is driven by the upstream energy sector. As stated earlier, we are confident that E&P will grow by 9% in 2017, increasing revenue for Reservoir Characterization across the Equipment and Services industry Drilling Group - Drilling and positioning of oil and gas wells. These comprise Bits & Drilling Tools, M-I SWACO®, Drilling & Measurements, Land Rigs and Integrated Drilling Services (IDS). Drivers: The key driver for drilling is rig count and rig utilization. This is the standard metric for measuring how many rigs are out in the world and how many of those are being utilized. Rig utilization will increase with either an increase in E&P or an increase in crude oil or an increase in crude oil demand. Production Group - Lifetime production of oil and gas reservoirs. Segments include Well Services, Completions, Artificial Lift, Integrated Production Services (IPS) and Schlumberger Production Management (SPM). Drivers: Five key segments; 1.) Planning 2.) Drilling 3.) Completion 4.) Production 5.) Abandonment. The key factors to success lifetime production of reservoirs in strong estimates in initial planning followed by execution of plan. Oil price and variables affecting extraction cost will play major roles in production of wellxxxii.
Cameron - Pressure and flow control for drilling and intervention rigs, oil and gas wells and production facilities. These include OneSubsea®, Surface Systems, Drilling Systems, and Valves & Measurement.
Product Market
Schlumberger works in more than 85 countries around the world and they manage their business through 35 GeoMarket regions, which are grouped into four geographic areas: North America, Latin America, Europe/CIS/Africa, Middle East and Asia.
Source: Schlumbergerxxxiii
The GeoMarket structure allows customers to contact local field operations and permits Schlumberger to form geographically focused teams to meet local needs and deliver custom solutions. Non-United States operations account for roughly 80% of Schlumberger’s consolidated revenue in 2016.
ThomsonOnexxxiv
Marketing Strategy
Schlumberger, for the most part, use their own staff to market their products and services. Schlumberger’s customer base, business risks and opportunities for growth are almost identical across all of their services.

11 | P a g e S c h l u m b e r g e r ( S L B ) 4 / 1 8 / 1 7
They share their manufacturing, engineering, and research centers throughout the company. Technological innovation, quality of service and price differentiation are the main focus to differentiate from their competitors. Services offered differ based on geographical needs. xxxv
Significant Customers
In 2016, Schlumberger had no single customer account for more than 10% of their consolidated revenuexxxvi. This can be seen as a positive, because even though Schlumberger’s revenues rely heavy on expenditures of their customers, no single customer has significant leverage on them that can drastically effect their revenue intake.
Competition
Completion Environment
Our fundamental outlook, consistent with McGraw Hill Financials, for the oil and gas equipment and services sub-industry for the next 12 months is negative. This is headlined by two headwinds that are likely to persist for service companies. The first, it is unlikely for service companies to see sufficient gains in utilization to enable much pricing traction in 2017, and that Capital IQ estimates upstream capital spending to increase by 6% in 2017. Second, according to Infill Thinking, Saudi Aramco (one of the oilfield service industry’s key clients) is looking to build out in-house capabilities, which we think could enable a possible recovery in oil servicesxxxvii.
With Schlumberger operating in what we predict to stay a bearish market, we find them to be better positioned than their competitors. An advantage opportunity over their competitors is their recent merger agreement of Cameron International Corp. in 2016. This has led to an increase to drilling revenue for the company, yet has also led to an increase of competition for SLB.
Catalysts for Change
E&P Spending
Schlumberger’s financial performance the last two years was heavily impacted by the large decrease in land-based activity, specifically in North America. After nine quarters of record activity decline, the business environment stabilized in the third quarter of 2016 and revenue improved marginally in the fourth quarter, indicating that the bottom of this cycle has been
reached. Schlumberger expects the growth in exploration and production investments in 2017 to be led initially by land operators in North America. E&P spending surveys currently indicate that 2017 E&P investments in North America will rise by approximately 32%, which ought to lead to both higher activity and a recovery in service industry pricing.
Management Change
Effect April 1st, Scott Rowe, President of SLB’s recently acquired Cameron product group, is leaving SLB to become Flowserve’s (FLS) President and CEOxxxviii. Prior to being acquired by SLB, Scott served as President and CEO of Cameron. Schlumberger has yet to announce a new replacement for Scott’s departure and this could bring question about management change.
Government Regulation
The Trump Administration is already making strides to positively impact the oil and gas industry. Trump’s decision to appoint former Exxon Mobile CEO Rex Tillerson to Secretary of State is an early indication that the government will pull back some of their regulations on the energy industry. On February 14, 2017 Trump signed a measure that cancel out a SEC regulation that would have required oil and gas companies to disclose in detail the payments they make to foreign governments. Many people forecast that this is the first of many bills the Trump Administration will pass that will have a positive impact on the oil and gas industry.
Key Investment Positives/Negatives
Positives:
Diverse Revenue Stream
With revenues distributed through four business segments and Schlumberger having a wide presence across the globe give it an advantage by insulating the company against adverse market conditions in any one of the markets. Their worldwide presence decreases exposure to economic conditions or political stability in any one region
Research Capabilities and the Expansion of new products and Services
Schlumberger often conducts research through partnerships with universities and customers around the globe. This guarantees close interaction with top of the line research and it improves Schlumberger’s

12 | P a g e S c h l u m b e r g e r ( S L B ) 4 / 1 8 / 1 7
understanding of clients' challenges and needs. With access to a copious amount of research Schlumberger designs or partners with other companies and designs new innovative products and services. For example in August 2015, Schlumberger and IBM announced that partnered up to provide integrated services to upstream oil and gas customers with the business impact of production operations projects.
Negatives:
Dependence on the Expenditures by the Oil and Gas Industry
The demand for most of Schlumberger’s products and services heavily rely on the level of expenditures by the oil and gas industry for the exploration, development, and production of crude oil and natural gas reserves. Oil prices are a driver for these expenditures, and if oil prices decline it could lead to companies modifying, delaying, or cancelling projects. A significant downturn in the oil and gas industry will result in a large reduction in the need for Schlumberger’s oilfield services. If upstream energy companies do not use levels of capital expenditure growth, Schlumberger’s revenue will be strictly correlated and decrease.
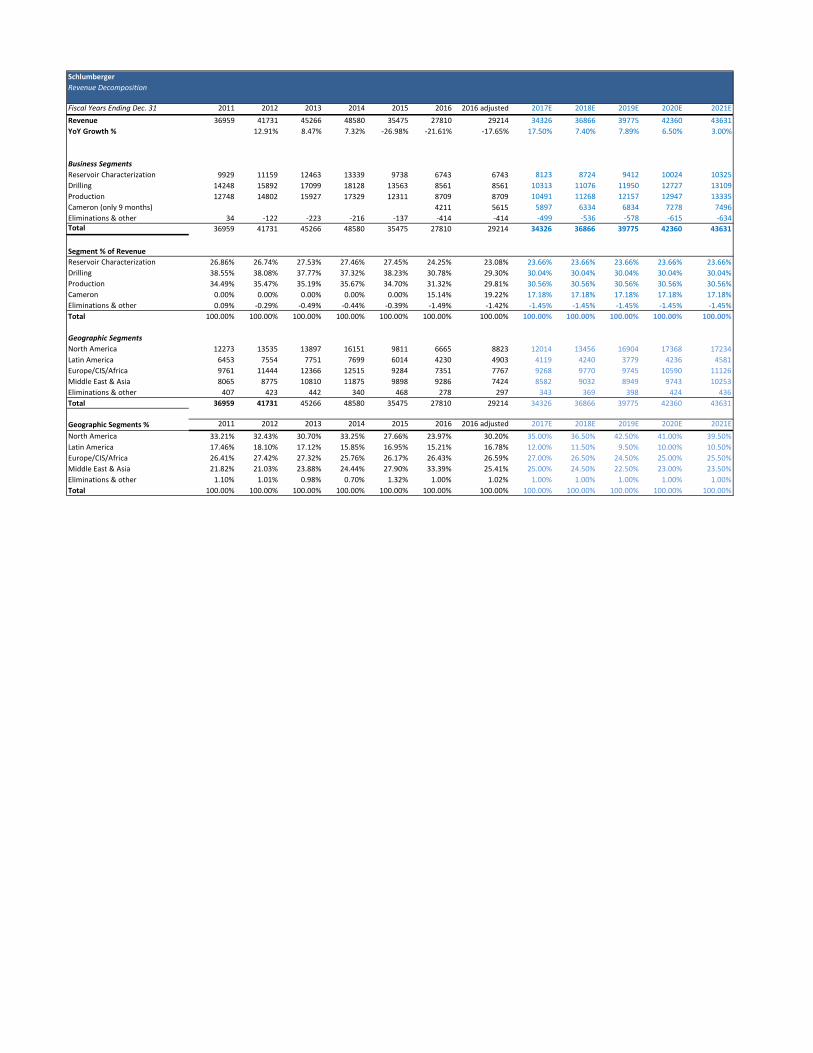
Revenue Growth While calculating future revenue we used a 2016 adjusted revenue, multiplying Cameron’s effect on revenue by 1.25, since their revenue was only recognized after it was acquired a quarter through the 2016 fiscal year. We forecasted revenue growth rate in 2017 is at 17.5%, which is relatively modest when compared to analyst expectations. This expectation is primarily based on the past two low revenues in 2015 and 2016. We believe that 2016 is the floor for SLB’s revenue for the next 5 years and find a revenue that would be in the middle of high oil production and low oil production, for our expectations are consistent with oil prices staying at a stable, and historically relative low crude oil price of $52-$56/bbl. After the double digit increase in 2017 we expect revenue growth to grow around a constant 7% for the next 3 years.
We chose a 3% continuation revenue growth, because that is a realistic average world GDP growth rate and we are trying to avoid a forecast that would lead to SLB out growing the world economy.
The previous graph illustrating the forecasted growth by geographic segment. Note that we are forecasting at large increase in North American revenue growth and a decline in Latin American revenue growth. This assumption stays consistent with our observation of industry analysis and possible implications from new government policy. With all segment revenue being correlated with each other we felt it was not necessary to forecast individual segment revenue percent. Cost of Goods Sold We forecast cost of goods sold as a constant historical average of revenue. Since SLB recently acquired Cameron in 2016 we added a weight of 70% to 2016 COGS average. We believed that this would get use a more reliable prediction of what the firm will look like moving forward into the future. Debt
-30.00%
-20.00%
-10.00%
0.00%
10.00%
20.00%
Project Revenue Growth Rate
-50.00%
0.00%
50.00%
100.00%
Revenue Geographic Sement Growth
North America Latin AmericaEurope/CIS/Africa Middle East & AsiaEliminations & other
Analysis of Valuation Methods

13 | P a g e S c h l u m b e r g e r ( S L B ) 4 / 1 8 / 1 7
While calculating future long-term debt we used a historical average of the past years total current assets (t-1). Current portion of long-term debt was a calculation of the previous year’s current assets (t-1). Stock Repurchases In our analysis we used Schlumberger’s stock repurchasing program for the next two years (around 10,000 stock repurchases) and used historical averages and prediction of stock repurchase to keep cash reserve low and the prediction that Schlumberger wants to increase return on equity. Cost of Equity (Re) Cost of equity was calculated using a raw Beta calculation of 1.27, a historic risk premium of 4.65% and using a 30 year T-Bond as a risk free rate of 2.99%. Using the Capital Asset Pricing Model (Re= Beta*(Rm-Rf) we calculate a cost of equity of 8.90% Cost of Debt (Rd) Since Schlumberger does not have any outstanding bonds issued longer than 2024, and Cameron’s issued bonds would not reflect Schlumberger’s cost of debt, we used Moody’s credit rating of A1 and used an average cost of debt across other companies that have 30 year outstanding bonds and came to a cost of debt of 4.61%. Weighted Average Cost of Capital (WAAC) Using a current weight of equity and debt at 65.20% and 34.80%, respectively, we calculated Schlumberger’s WAAC to be 7.41%. Tax Rate Schlumberger has a current effective tax rate of 25% as the fiscal year ending December 2016. Schlumberger’s valuation is dependent on an effective rate. We forecasted. A decline in taxes would increase the target price. We assume that the tax rate will stay constant at 25% due to uncertainty of tax rate changes and benefits from charge write offs.
Discounted Cash Flow (DCF) - Economic Profit Our DCF/EP model calculates SLB’s intrinsic value as of 4/18, to be $87.92. The DCF/EP model best represents the current value of SLB to shareholders. At the current price of $78.24 (as of 4/18), we calculate our valuation to represent an 8.9% premium of SLB stock. The main contributor to our premium valuation is our revenue growth rate, which lead to an increase net operating capital less adjusted taxes (NOPLAT), which lead to an increase in return on invested capital. Other key assumptions including weighted average cost of capital (WAAC), cost of equity and forecasted invested capital lead to our calculated stock premium The DCF/EP model is superior to the DDM and relative P/S methods in calculating shareholder value because the DCF/EP method is best at capturing Schlumberger’s ability to generate high returns and growth on its invested capital. DDM Our DMM model calculated an intrinsic value of $50.83. This is primarily due to Schlumberger’s ability to generate growth through invested capital. Instead of providing shareholders with value in dividends, Schlumberger reinvest its capital in growth opportunities in the form of capital expenditures. These are qualities of a growth stock and we see Schlumberger maintaining its growth stock status throughout our forecast period and not transitioning to a divided driven stock. For this reason we have decided that the DDM does not accurately represent the intrinsic value of Schlumberger. Relative P/S Valuation We also conducted as P/S valuation model, since the entire energy sector had negative earnings and a EPS valuation would be illogical and provide a negative stock value. We calculated a stock $49.86 for 2017, but just like our DDM model we are choosing to ignore this in our valuation, but it does add value in predicting that a high market capital share company, such as SLB, would trade at a higher premium than its competitors.

14 | P a g e S c h l u m b e r g e r ( S L B ) 4 / 1 8 / 1 7
Impact on DCF Stock Price Beta vs Equity Risk Premium The beta and equity risk premium metrics are pivotal measurement in calculating a target price rang. A 0.1 decrease in our Beta calculation would lead to a stock price of around $94.08, while a .01 increase would lead to an intrinsic value of $79.98. While a 1% increase in our equity risk premium would lead to a value of $86.37 and a 1% decrease would lead to a value of $95.35. Since Schlumberger operates in such a volatile and market correlated sector, we feel that a beta of 1.27 represents Schlumberger’s performance with market fluctuations.
Impact of DCF Stock Price: CV Revenue Growth vs Cost of Debt (Rd) It wsa important we decided on a CV growth rate that would best repersent world growth GDP as we forecast continually into the future. The best and worst case scenario for CV growth lead to an intrinsic value of $90.68 and $85.16 respectively. The difference between to high and low estimates for cost of deb is $14.47, with just a 2% difference.
Impact on WACC: Cost of Equity vs Cost of Debt Changes in the calculate cost of equity and cost of debt have a major effect on the WAAC. Unlike cost of debt, cost of equity relies on other factors including; Beta, risk premium, and the risk free rate. So this sensitivity
analysis shows the volatility the WACC would have if the changes in any of those three factors would calculate a cost of equity shown in the table below.
Impact of DCF Stock Price: COGS vs SG&A Both these factors had little impact of intrinsic stock price. A large increase in the difference between best and worst case scenarios maybe provide for a larger interval but would not be consistent with probably forecast projects and historical analysis.
Important Disclaimer This report was created by students enrolled in the Security Analysis (6F:112) class at the University of Iowa. The report was originally created to offer an internal investment recommendation for the University of Iowa Krause Fund and its advisory board. The report also provides potential employers and other interested parties an example of the students’ skills, knowledge and abilities. Members of the Krause Fund are not registered investment advisors, brokers or officially licensed financial professionals. The investment advice contained in this report does not represent an offer or solicitation to buy or sell any of the securities mentioned. Unless otherwise noted, facts and figures included in this report are from publicly available sources. This report is not a complete compilation of data, and its accuracy is not guaranteed. From time to time, the University of Iowa, its faculty, staff, students, or the Krause Fund may hold a financial interest in the companies mentioned in this report.
87.92 1.17 1.22 1.27 1.32 1.37 1.424.50% 96.63 93.39 90.35 87.49 84.80 82.264.55% 95.76 92.55 89.53 86.69 84.01 81.494.60% 94.92 91.72 88.72 85.89 83.24 80.73
Risk P 4.65% 94.08 90.90 87.92 85.12 82.47 79.984.70% 93.26 90.10 87.14 84.35 81.72 79.254.75% 92.46 89.32 86.37 83.60 80.99 78.53
Impact on DCF Stock Price: Beta, Risk PremiumBeta
87.92 1% 2.00% 3.00% 4.00% 5.00%3.61% 92.63 94.14 95.65 97.15 98.664.11% 88.76 90.20 91.65 93.09 94.534.61% 85.16 86.54 87.92 89.30 90.685.11% 81.79 83.12 84.44 85.77 87.095.61% 78.64 79.91 81.18 82.46 83.73
Rd
Impact on DCF Stock Price: CV Revenue Growth, Cost of DebtCV Revenue Growth
Cost of Equity7.41% 6.90% 7.90% 8.90% 9.90% 10.90%2.61% 5.41% 6.06% 6.71% 7.36% 8.02%3.61% 5.76% 6.41% 7.06% 7.71% 8.36%
Rd 4.61% 6.10% 6.76% 7.41% 8.06% 8.71%5.61% 6.45% 7.10% 7.76% 8.41% 9.06%6.61% 6.80% 7.45% 8.10% 8.76% 9.41%
Impact on WAAC: Cost of Equity, Cost of Debt
COGS87.92 69.00% 70.00% 71.00% 72.00% 73.00%0.50% 88.80 88.13 87.47 86.80 86.140.90% 89.00 88.34 87.67 87.01 86.35
SG&A 1.40% 89.26 88.60 87.93 87.27 86.601.90% 89.52 88.85 88.19 87.53 86.862.50% 89.83 89.16 88.50 87.83 87.17
Impact on DCF Stock Price: Cost of Goods Sold, SG&A
Sensitivity Analysis

15 | P a g e S c h l u m b e r g e r ( S L B ) 4 / 1 8 / 1 7
i “What Drives Crude Oil Prices.” U.S. Energy Information Administration. ii Stephen Letts. (2017, Jan 20) China GDP Surprises with 6.8pc Economic Growth, retrieved from http://www.abc.net.au/news/2017-01-20/china-gdp-surprises-with-6.8pc-growth/8197878 iii Scott Cendrowski. (2017, April 17) China GDP Growth is Booming Again-But for How Long?, retrieved from http://fortune.com/2017/04/17/china-gdp-growth-q1-booming/ iv Scrool. (2017, April 17) India’s economy will grow by 7.2% in 2017-18, predicts World Bank, retrieved from v OPEC.org OPEC share of world crude oil reserves, 2015, retrieved from http://www.opec.org/opec_web/en/data_graphs/330.htm vi “Global Interim Economic Outlook, March 2017” OECD http://www.oecd.org/eco/economicoutlook.htm vii “Short-Term and Summer Fuels Outlook”, April 11, 2017 https://www.eia.gov/outlooks/steo/ viii “Short-Term and Summer Fuels Outlook”, April 11, 2017 https://www.eia.gov/outlooks/steo/ x “OPEC Annual Statistical Bulletin”, March 2017, http://www.opec.org/opec_web/static_files_project/media/downloads/publications/ASB2016.pdf xi “Short-Term Energy Outlook (STEO)” U.S. Energy Information Administration https://www.eia.gov/outlooks/steo/pdf/steo_full.pdf xii OGJ editors “Barclay’s: Global E&P spending growth revised to 9% for 2017” March 14, 2017, http://www.ogj.com/articles/2017/03/barclays-global-e-p-spending-growth-revised-to-9-for-2017.html xiii OGJ editors “Barclay’s: Global E&P spending growth revised to 9% for 2017” March 14, 2017, http://www.ogj.com/articles/2017/03/barclays-global-e-p-spending-growth-revised-to-9-for-2017.html xiv McGraw Hill Financial “S&P Capital IQ” http://www.netadvantage.standardandpoors.com/NASApp/NetAdvantage/SandPSectorCharts.do xvRigzone “Offshore Utilization Data” http://www.rigzone.com/oil/data/rigutilization/ xvi “Crude Oil WTF Futures” Investing,com April 18, 2017, https://www.investing.com/commodities/crude-oil-historical-data xvii NOV “63rd Annual RIG CENSUS” May 2017 https://www.nov.com/uploadedFiles/Content/News_And_Events/News/News_Article_Detail/01PDF/rig-census-2016.pdf xviii Stone “Halliburton and Baker Hughes scrap $28 billion merger” May 2, 2016 http://www.reuters.com/article/us-bakerhughes-m-a-halliburton-idUSKCN0XS1KW xix Bousso “BG shareholders give Shell’s $52 billion acquisition final nod” January 29, 2016 http://uk.reuters.com/article/uk-bg-group-m-a-shell-idUKKCN0V61X9
xxi “Energy Equipment Outlook” S&P500 Global http://marketintelligence.spglobal.com/?camp=CAP_IQ_Brand&kw=s%26p%20global%20market%20intelligence&gclid=CNz9_aSvrtMCFZe1wAodGJYJ-g xxii “About Halliburton” April 18, 2018 http://www.halliburton.com/en-US/about-us/default.page?node-id=hgbr8q6o xxiii Factset “Schlumberger Competitors” April 18, 2017 https://advantage.factset.com/see-the-advantage?utm_campaign=PPC%20Umbrella%20Campaign%202017&utm_source=ppc&gclid=CLiZg4OwrtMCFQm5wAodjpMK8A xxiv “Company Overview” April 18, 2017, https://www.thomsonone.com/Workspace/Main.aspx?View=Action%3dOpen&BrandName=www.thomsonone.com&IsSsoLogin=True xxv “Company Overview” April 18, 2017, https://www.thomsonone.com/Workspace/Main.aspx?View=Action%3dOpen&BrandName=www.thomsonone.com&IsSsoLogin=True xxvi Schlumberger 10-K xxvii Schlumberger 10-K xxviii Thomson One SLB xxix “Schlumberger Background” http://www.slb.com/about/who/backgrounder.asp xxx Schlumberger 10-K xxxi Schlumberger 10-K xxxii “A Closer Look at the Lifetime of an Oil Well- from Beginning to End” March 27th, 2017 https://www.petro-online.com/news/fuel-for-thought/13/breaking_news/a_closer_look_at_the_lifetime_of_an_oil_well_from_beginning_to_end/33960 xxxiii “Contract Drilling” April 18, 2017, http://www.slb.com/services/drilling/contract-drilling.aspx xxxiv “Company Overview” April 18, 2017, https://www.thomsonone.com/Workspace/Main.aspx?View=Action%3dOpen&BrandName=www.thomsonone.com&IsSsoLogin=True xxxv “Company Overview” April 18, 2017, https://www.thomsonone.com/Workspace/Main.aspx?View=Action%3dOpen&BrandName=www.thomsonone.com&IsSsoLogin=True xxxvi Schlumberger 10-K xxxvii “The Offshore Oil Business is Crippled And It May Never Recover” http://oilprice.com/Energy/Crude-Oil/The-Offshore-Oil-Business-Is-Crippled-And-It-May-Never-Recover.html xxxviii “Former Cameron CEO to leave Schlumberger” February 9, 2017 http://www.bizjournals.com/houston/news/2017/02/09/former-cameron-ceo-to-leave-schlumberger.html
SchlumbergerRevenue Decomposition
Fiscal Years Ending Dec. 31 2011 2012 2013 2014 2015 2016 2016 adjusted 2017E 2018E 2019E 2020E 2021ERevenue 36959 41731 45266 48580 35475 27810 29214 34326 36866 39775 42360 43631YoY Growth % 12.91% 8.47% 7.32% -26.98% -21.61% -17.65% 17.50% 7.40% 7.89% 6.50% 3.00%
Business SegmentsReservoir Characterization 9929 11159 12463 13339 9738 6743 6743 8123 8724 9412 10024 10325Drilling 14248 15892 17099 18128 13563 8561 8561 10313 11076 11950 12727 13109Production 12748 14802 15927 17329 12311 8709 8709 10491 11268 12157 12947 13335Cameron (only 9 months) 4211 5615 5897 6334 6834 7278 7496Eliminations & other 34 -122 -223 -216 -137 -414 -414 -499 -536 -578 -615 -634Total 36959 41731 45266 48580 35475 27810 29214 34326 36866 39775 42360 43631
Segment % of RevenueReservoir Characterization 26.86% 26.74% 27.53% 27.46% 27.45% 24.25% 23.08% 23.66% 23.66% 23.66% 23.66% 23.66%Drilling 38.55% 38.08% 37.77% 37.32% 38.23% 30.78% 29.30% 30.04% 30.04% 30.04% 30.04% 30.04%Production 34.49% 35.47% 35.19% 35.67% 34.70% 31.32% 29.81% 30.56% 30.56% 30.56% 30.56% 30.56%Cameron 0.00% 0.00% 0.00% 0.00% 0.00% 15.14% 19.22% 17.18% 17.18% 17.18% 17.18% 17.18%Eliminations & other 0.09% -0.29% -0.49% -0.44% -0.39% -1.49% -1.42% -1.45% -1.45% -1.45% -1.45% -1.45%Total 100.00% 100.00% 100.00% 100.00% 100.00% 100.00% 100.00% 100.00% 100.00% 100.00% 100.00% 100.00%
Geographic SegmentsNorth America 12273 13535 13897 16151 9811 6665 8823 12014 13456 16904 17368 17234Latin America 6453 7554 7751 7699 6014 4230 4903 4119 4240 3779 4236 4581Europe/CIS/Africa 9761 11444 12366 12515 9284 7351 7767 9268 9770 9745 10590 11126Middle East & Asia 8065 8775 10810 11875 9898 9286 7424 8582 9032 8949 9743 10253Eliminations & other 407 423 442 340 468 278 297 343 369 398 424 436Total 36959 41731 45266 48580 35475 27810 29214 34326 36866 39775 42360 43631
Geographic Segments % 2011 2012 2013 2014 2015 2016 2016 adjusted 2017E 2018E 2019E 2020E 2021ENorth America 33.21% 32.43% 30.70% 33.25% 27.66% 23.97% 30.20% 35.00% 36.50% 42.50% 41.00% 39.50%Latin America 17.46% 18.10% 17.12% 15.85% 16.95% 15.21% 16.78% 12.00% 11.50% 9.50% 10.00% 10.50%Europe/CIS/Africa 26.41% 27.42% 27.32% 25.76% 26.17% 26.43% 26.59% 27.00% 26.50% 24.50% 25.00% 25.50%Middle East & Asia 21.82% 21.03% 23.88% 24.44% 27.90% 33.39% 25.41% 25.00% 24.50% 22.50% 23.00% 23.50%Eliminations & other 1.10% 1.01% 0.98% 0.70% 1.32% 1.00% 1.02% 1.00% 1.00% 1.00% 1.00% 1.00%Total 100.00% 100.00% 100.00% 100.00% 100.00% 100.00% 100.00% 100.00% 100.00% 100.00% 100.00% 100.00%

SchlumbergerIncome Statement(in millions)Fiscal Years Ending Dec. 31 2014 2015 2016 2017E 2018E 2019E 2020E 2021ERevenueTotal Revenue 48,580 35,475 27,810 34,326 36,866 39,775 42,360 43,631 Gain on formation of OneSubseaInterest & other income 291 236 200 256 275 295 320 334 ExpensesCost of services 33,854 24,767 20,843 24,377 26,181 28,247 30,083 30,986 Deprication 3,200 3,200 2,700 2,821 2,766 2,766 2,814 2,894 Amortization Expense 344 354 567 808 741 681 625 574 Research & engineering 1,217 1,094 1,012 1,001 1,075 1,160 1,236 1,273 General & administrative 475 494 403 481 516 557 593 611 Impairments & other 1,773 2,575 3,172 450 429 450 473 496 Merger & integration - - 648 - - - - - Interest 369 346 570 850 822 807 819 886 Income (loss) from continuing operations before taxes 7,639 2,881 (1,905) 3,795 4,610 5,402 6,038 6,247 Taxes on income (loss) 1,928 746 (278) 949 1,152 1,351 1,510 1,562 Income (loss) from continuing operations 5,711 2,135 (1,627) 2,846 3,457 4,052 4,529 4,685 Income (loss) from discontinued operations (205) - - - - - - - Net income (loss) 5,506 2,135 (1,627) 2,846 3,457 4,052 4,529 4,685 Net income attributable to noncontrolling 68 63 60 45 48 51 54 58 interestsNet income (loss) attributable to Schlumberger 5,438 2,072 (1,687) 2,801 3,410 4,001 4,474 4,627
Schlumberger amounts attributable to:Income (loss) from continuing operations 5,643 2,072 (1,687) 2,801 3,410 4,001 4,474 4,627 Loss from discontinued operations (205) - - - - - - - Net income (loss) 5,438 2,072 (1,687) 2,801 3,410 4,001 4,474 4,627
Basic earnings per share of SchlumbergerIncome (loss) from continuing operations 4.36 1.63 (1.24) 2.05 2.48 2.89 3.13 3.20 Dividends Declared Per Share 1.60 2.00 2.00 2.00 2.00 2.25 2.25 2.36 Total Shares Outstanding 1,275 1,256 1,391 1,366 1,376 1,385 1,431 1,444
Average shares outstanding:Basic 1,295 1,267 1,357 1,366 1,376 1,385 1,431 1,444
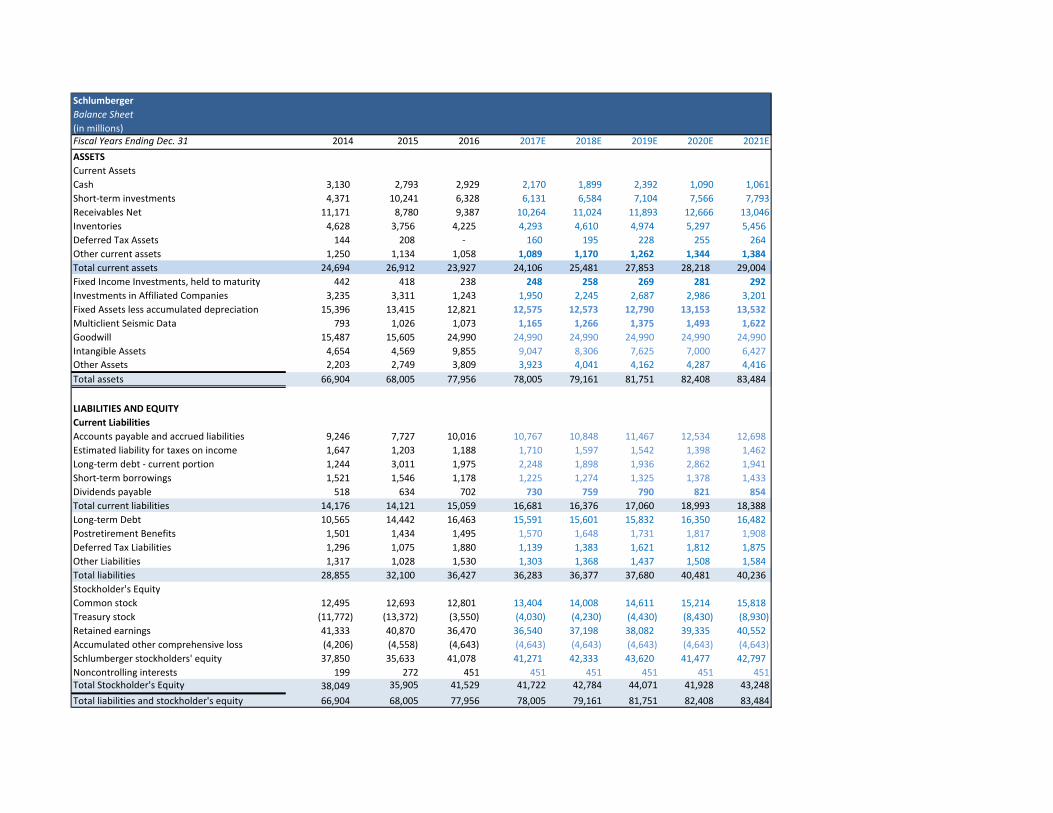
SchlumbergerBalance Sheet(in millions)Fiscal Years Ending Dec. 31 2014 2015 2016 2017E 2018E 2019E 2020E 2021EASSETSCurrent AssetsCash 3,130 2,793 2,929 2,170 1,899 2,392 1,090 1,061 Short-term investments 4,371 10,241 6,328 6,131 6,584 7,104 7,566 7,793 Receivables Net 11,171 8,780 9,387 10,264 11,024 11,893 12,666 13,046 Inventories 4,628 3,756 4,225 4,293 4,610 4,974 5,297 5,456 Deferred Tax Assets 144 208 - 160 195 228 255 264 Other current assets 1,250 1,134 1,058 1,089 1,170 1,262 1,344 1,384 Total current assets 24,694 26,912 23,927 24,106 25,481 27,853 28,218 29,004 Fixed Income Investments, held to maturity 442 418 238 248 258 269 281 292 Investments in Affiliated Companies 3,235 3,311 1,243 1,950 2,245 2,687 2,986 3,201 Fixed Assets less accumulated depreciation 15,396 13,415 12,821 12,575 12,573 12,790 13,153 13,532 Multiclient Seismic Data 793 1,026 1,073 1,165 1,266 1,375 1,493 1,622 Goodwill 15,487 15,605 24,990 24,990 24,990 24,990 24,990 24,990 Intangible Assets 4,654 4,569 9,855 9,047 8,306 7,625 7,000 6,427 Other Assets 2,203 2,749 3,809 3,923 4,041 4,162 4,287 4,416 Total assets 66,904 68,005 77,956 78,005 79,161 81,751 82,408 83,484
LIABILITIES AND EQUITYCurrent LiabilitiesAccounts payable and accrued liabilities 9,246 7,727 10,016 10,767 10,848 11,467 12,534 12,698 Estimated liability for taxes on income 1,647 1,203 1,188 1,710 1,597 1,542 1,398 1,462 Long-term debt - current portion 1,244 3,011 1,975 2,248 1,898 1,936 2,862 1,941 Short-term borrowings 1,521 1,546 1,178 1,225 1,274 1,325 1,378 1,433 Dividends payable 518 634 702 730 759 790 821 854 Total current liabilities 14,176 14,121 15,059 16,681 16,376 17,060 18,993 18,388 Long-term Debt 10,565 14,442 16,463 15,591 15,601 15,832 16,350 16,482 Postretirement Benefits 1,501 1,434 1,495 1,570 1,648 1,731 1,817 1,908 Deferred Tax Liabilities 1,296 1,075 1,880 1,139 1,383 1,621 1,812 1,875 Other Liabilities 1,317 1,028 1,530 1,303 1,368 1,437 1,508 1,584 Total liabilities 28,855 32,100 36,427 36,283 36,377 37,680 40,481 40,236 Stockholder's EquityCommon stock 12,495 12,693 12,801 13,404 14,008 14,611 15,214 15,818 Treasury stock (11,772) (13,372) (3,550) (4,030) (4,230) (4,430) (8,430) (8,930) Retained earnings 41,333 40,870 36,470 36,540 37,198 38,082 39,335 40,552 Accumulated other comprehensive loss (4,206) (4,558) (4,643) (4,643) (4,643) (4,643) (4,643) (4,643) Schlumberger stockholders' equity 37,850 35,633 41,078 41,271 42,333 43,620 41,477 42,797 Noncontrolling interests 199 272 451 451 451 451 451 451 Total Stockholder's Equity 38,049 35,905 41,529 41,722 42,784 44,071 41,928 43,248 Total liabilities and stockholder's equity 66,904 68,005 77,956 78,005 79,161 81,751 82,408 83,484

SchlumbergerCash Flow Statement(in millions)Fiscal Years Ending Dec. 31 2017E 2018E 2019E 2020E 2021E
Cash Flows from Operating Activities:Net Income 2,800.71 3,409.63 4,000.91 4,474.22 4,626.86
Plus: Adjustments for non-cash operating expenses Depreciation expense 2,821 2,766 2,766 2,814 2,894 Amortization expense 808 741 681 625 574
Changes in net working capital accountsAccounts receivable, net (877) (760) (870) (773) (380) Inventories (68) (318) (364) (323) (159) Deferred tax assets (160) (34) (33) (27) (9) Other current assets (31) (81) (92) (82) (40) Accounts payable & accrued liabilities 751 81 619 1,067 164 Estimate Liability for Income Taxes 522 (113) (55) (144) 64
Changes in non-current, operating assets & liabilitiesMultisegment client data (92) (100) (109) (118) (129) Other long-term assets (114) (118) (121) (125) (129) Deferred tax liability (741) 245 238 191 63 Other long-term liabilities (227) 65 68 72 75
Net cash provided by operating activities 5,391 5,785 6,728 7,650 7,615
Cash Flows from Investing Activities:Short-term investments 197 (454) (520) (462) (227) Fixed income held till maturity (10) (10) (11) (11) (12) Investments in Affiliated Companies (707) (295) (442) (299) (215) Postretirement Benefits 75 78 82 87 91
Capital expenditures (2,574) (2,765) (2,983) (3,177) (3,272) Net cash provided (used) by investing activities (3,019) (3,446) (3,873) (3,863) (3,635)
Cash Flows from Financing Activities:Change in current portion of long-term debt, net 273 (350) 38 925 (921) Short-term barrowings 47 49 51 53 55 Dividends payable 28 29 30 32 33 Long-term debt (872) 10 231 518 131 Proceeds from common stock & additional paid-in capital 603 603 603 603 603 Payments of dividends (2,731) (2,751) (3,117) (3,221) (3,411) Payments for treasury stock (Common stock repurchases) (480) (200) (200) (4,000) (500)
Net cash provided (used) by financing activities (3,131) (2,610) (2,363) (5,089) (4,009)
Net Increase (Decrease) in Cash (759) (271) 492 (1,302) (29)
Cash, Beginning Balance 2,929 2,170 1,899 2,392 1,090
Cash, Ending Balance 2,170 1,899 2,392 1,090 1,061

SchlumbergerCommon Size Balance Sheet
Fiscal Years Ending Dec. 31 2014 2015 2016 2017E 2018E 2019E 2020E 2021EASSETSCurrent AssetsCash 6.44% 7.87% 10.53% 6.32% 5.15% 6.01% 2.57% 2.43%Short-term investments 9.00% 28.87% 22.75% 17.86% 17.86% 17.86% 17.86% 17.86%Receivables less allowance for doubtful 23.00% 24.75% 33.75% 29.90% 29.90% 29.90% 29.90% 29.90%Inventories 9.53% 10.59% 15.19% 12.51% 12.51% 12.51% 12.51% 12.51%Deferred taxes 0.30% 0.59% 0.00% 0.47% 0.53% 0.57% 0.60% 0.60%Other current assets 2.57% 3.20% 3.80% 3.17% 3.17% 3.17% 3.17% 3.17%Total Current Assets 50.83% 75.86% 86.04% 70.23% 69.12% 70.03% 66.61% 66.48%Fixed Income Investments, held to maturity 0.91% 1.18% 0.86% 0.72% 0.70% 0.68% 0.66% 0.67%Investments in Affiliated Companies 6.66% 9.33% 4.47% 5.68% 6.09% 6.76% 7.05% 7.34%Fixed Assets less accumulated depreciation 31.69% 37.82% 46.10% 36.63% 34.11% 32.16% 31.05% 31.01%Multiclient Seismic Data 1.63% 2.89% 3.86% 3.40% 3.43% 3.46% 3.52% 3.72%Goodwill 31.88% 43.99% 89.86% 72.80% 67.79% 62.83% 58.99% 57.28%Intangible Assets 9.58% 12.88% 35.44% 26.36% 22.53% 19.17% 16.53% 14.73%Other Assets 4.53% 7.75% 13.70% 11.43% 10.96% 10.46% 10.12% 10.12%Total Assets 137.72% 191.70% 280.32% 227.25% 214.73% 205.54% 194.54% 191.34%
LIABILITIES AND EQUITYCurrent LiabilitiesAccounts payable and accrued liabilities 19.03% 21.78% 36.02% 31.37% 29.42% 28.83% 29.59% 29.10%Estimated liability for taxes on income 3.39% 3.39% 4.27% 4.98% 4.33% 3.88% 3.30% 3.35%Long-term debt - current portion 2.56% 8.49% 7.10% 6.55% 5.15% 4.87% 6.76% 4.45%Short-term borrowings 3.13% 4.36% 4.24% 3.57% 3.46% 3.33% 3.25% 3.28%Dividends payable 1.07% 1.79% 2.52% 2.13% 2.06% 1.99% 1.94% 1.96%Total current liabilities 29.18% 39.81% 54.15% 48.59% 44.42% 42.89% 44.84% 42.14%Long-term Debt 21.75% 40.71% 59.20% 45.42% 42.32% 39.80% 38.60% 37.78%Postretirement Benefits 3.09% 4.04% 5.38% 4.57% 4.47% 4.35% 4.29% 4.37%Deferred Taxes 2.67% 3.03% 6.76% 3.32% 3.75% 4.08% 4.28% 4.30%Other Liabilities 2.71% 2.90% 5.50% 3.80% 3.71% 3.61% 3.56% 3.63%Total liabilities 59.40% 90.49% 130.99% 105.70% 98.67% 94.73% 95.56% 92.22%Stockholder's EquityCommon stock 25.72% 35.78% 46.03% 39.05% 38.00% 36.73% 35.92% 36.25%Treasury stock -24.23% -37.69% -12.77% -11.74% -11.47% -11.14% -19.90% -20.47%Retained earnings 85.08% 115.21% 131.14% 106.45% 100.90% 95.74% 92.86% 92.94%Accumulated other comprehensive loss -8.66% -12.85% -16.70% -13.53% -12.59% -11.67% -10.96% -10.64%Schlumberger stockholders' equity 77.91% 100.45% 147.71% 120.23% 114.83% 109.67% 97.91% 98.09%Noncontrolling interests 0.41% 0.77% 1.62% 1.31% 1.22% 1.13% 1.06% 1.03%Total Stockholder's Equity 78.32% 101.21% 149.33% 121.55% 116.05% 110.80% 98.98% 99.12%Total liabilities and stockholder's equity 137.72% 191.70% 280.32% 227.25% 214.73% 205.54% 194.54% 191.34%

SchlumbergerCommon Size Income Statement
Fiscal Years Ending Dec. 31 2014 2015 2016 2017E 2018E 2019E 2020E 2021ETotal Revenue 100.0% 100.0% 100.0% 100.0% 100.0% 100.0% 100.0% 100.0%Gain on formation of OneSubsea 0.0% 0.0% 0.0% 0.0% 0.0% 0.0% 0.0% 0.0%Interest & other income 0.8% 0.6% 0.5% 0.7% 0.7% 0.8% 0.9% 0.9%ExpensesCost of services 69.7% 69.8% 74.9% 71.0% 71.0% 71.0% 71.0% 71.0%Research & engineering 6.6% 9.0% 9.7% 8.2% 7.5% 7.0% 6.6% 6.6%General & administrative 0.7% 1.0% 2.0% 2.4% 2.0% 1.7% 1.5% 1.3%Impairments & other 2.5% 3.1% 3.6% 2.9% 2.9% 2.9% 2.9% 2.9%Merger & integration 1.4%Interest 0.8% 1.0% 2.0% 2.5% 2.2% 2.0% 1.9% 2.0%Income (loss) from continuing operations before taxesTaxes on income (loss) 0.8% 1.0% 2.0% 2.5% 2.2% 2.0% 1.9% 2.0%Income (loss) from continuing operations 15.7% 8.1% -6.9% 11.1% 12.5% 13.6% 14.3% 14.3%Loss from discontinued operations 4.0% 2.1% -1.0% 2.8% 3.1% 3.4% 3.6% 3.6%Net income (loss) 11.8% 6.0% -5.9% 8.3% 9.4% 10.2% 10.7% 10.7%Net income attributable to noncontrolling -0.4% 0.0% 0.0% 0.0% 0.0% 0.0% 0.0% 0.0%interests 0.0% 0.0% 0.0% 0.0% 0.0% 0.0% 0.0% 0.0%Net income (loss) attributable to Schlumberger 11.2% 5.8% -6.1% 8.2% 9.2% 10.1% 10.6% 10.6%

SchlumbergerValue Driver Estimation
Fiscal Years ending Dec. 31 2013 2014 2015 2016 2017E 2018E 2019E 2020E 2021E NOPLAT
Revenue 45,266 48,580 35,475 27,810 34,326 36,866 39,775 42,360 43,631 Cost of Sales (31,901) (33,854) (24,767) (20,843) (24,377) (26,181) (28,247) (30,083) (30,986) Deprication Expense (3,100) (3,200) (3,200) (2,700) (2,821) (2,766) (2,766) (2,814) (2,894) R&D Expense (1,174) (1,217) (1,094) (1,012) (1,001) (1,075) (1,160) (1,236) (1,273) add:implied interest on op. leases 67.5 61.4 65.7 68.7 68.7 68.7 68.7 68.7 68.7 EBITA 10,265 11,526 7,508 4,267 7,128 7,918 8,762 9,463 9,752 Adjust Tax - - - - - Marginal tax rate 21% 15% 26% 25% 25% 25% 25% 25% 25%
Provision for Income Taxes 1,848 1,928 746 (278) 949 1,152 1,351 1,510 1,562 add: tax shield on interest expense 82 55 90 143 212 206 202 205 221 less: tax shield on interest income (35) (44) (61) (50) (64) (69) (74) (80) (84) less: tax shield on non-operating income - - - - - - - - - add: tax shield on amortization 69 52 92 142 202 185 170 156 143 add:tax on impairments 96 266 670 793 113 107 113 118 124 less:tax on OneSea gain (216) - - - - - add:tax on merger - - - 162 - - - - - add: tax shield on non-operating losses 14 9 17 17 17 17 17 17 17 less: adjusted taxes 1,859 2,266 1,553 928 1,429 1,599 1,778 1,926 1,984
8,406 9,260 5,955 3,339 5,699 6,319 6,983 7,537 7,768 deferred liabilities 1,708 1,296 1,075 1,880 1,139 1,383 1,621 1,812 1,875 deferred assets 288 144 208 - 160 195 228 255 264 add: change from previous year 270 (268) (285) 1,013 (901) 210 204 164 54 NOPLAT 8,676 8,992 5,670 4,352 4,798 6,530 7,188 7,701 7,821
Invested CapitalOperating Current Assets: Cash 465 480 480 405 423 415 415 422 434 Short-term receivables 11,497 11,171 8,780 9,387 10,264 11,024 11,893 12,666 13,046 Inventory 4,603 4,628 3,756 4,225 4,293 4,610 4,974 5,297 5,456 Other current assets 1,467 1,250 1,134 1,058 1,089 1,170 1,262 1,344 1,384 Total CA 18,032 17,529 14,150 15,075 16,069 17,218 18,544 19,730 20,321
Non Interest-Bearing Current Liabiities: Accounts Payable 8,837 9,246 7,727 10,016 10,767 10,848 11,467 12,534 12,698 Dividends Payable 415 518 634 702 730 759 790 821 854 Income Taxes Payable 1,490 1,647 1,203 1,188 1,710 1,597 1,542 1,398 1,462 Total CL 10,742 11,411 9,564 11,906 13,207 13,204 13,798 14,753 15,014
Net Operating Working Capital 7,290 6,118 4,586 3,169 2,861 4,014 4,746 4,977 5,307
Gross PPEless: Accumulated DepreciationNet PPE (fixed assets less accumulated depreciation) 15,096 15,396 13,415 12,821 12,575 12,573 12,790 13,153 13,532
Net Other Operating Assets: Net Intangible Assets 4,709 4,654 4,569 9,855 9,047 8,306 7,625 7,000 6,427 PV Operating Lease 1,343 1,356 1,177 1,235 1,211 1,211 1,232 1,267 1,303 Seismic Data 667 793 1,026 1,073 1,165 1,266 1,375 1,493 1,622 Other Operating Assets 2,017 2,203 2,749 3,809 3,923 4,041 4,162 4,287 4,416 Total Net Other Operating Assets 8,736 9,006 9,521 15,972 15,347 14,824 14,394 14,048 13,768
Other Operating Liabilities: Other Liabilities 1,169 1,317 1,028 1,530 1,303 1,368 1,437 1,508 1,584 Total Other Operating Liabilities 1,169 1,317 1,028 1,530 1,303 1,368 1,437 1,508 1,584
Invested Capital 29,953 29,203 26,494 30,432 29,480 30,043 30,494 30,669 31,022
NOPLAT 8,676 8,992 5,670 4,352 4,798 6,530 7,188 7,701 7,821 Beg Invest Capital 28,989 29,953 29,203 26,494 30,432 29,480 30,043 30,494 30,669 ROIC 29.93% 30.02% 19.42% 16.42% 15.77% 22.15% 23.93% 25.26% 25.50%
Change in Invested Capital 964 (750) (2,709) 3,937 (951) 563 451 176 353 FCF 7,712 9,742 8,378 414 5,749 5,967 6,737 7,526 7,468
Beginning Invest Capital 29,953 29,203 26,494 30,432 29,480 30,043 30,494 30,669 31,022 ROIC 29.93% 30.02% 19.42% 16.42% 15.77% 22.15% 23.93% 25.26% 25.50%WACC 7% 7% 7% 7% 7% 7% 7% 7% 7%EP 6,529 6,773 3,507 2,390 2,544 4,346 4,963 5,443 5,550

SchlumbergerWeighted Average Cost of Capital (WACC) Estimation
Risk Free Rate (30 Year T-Bond) 2.99%Risk Premium 4.65%Beta 1.27Estimated Cost of Equity 8.90%Estimated Cost of Debt 4.61%Estimated Cost of Preferred Stock 2.56%Weight of Equity (from 10k) 65.20%Weight of Debt (from 10k) 34.80%Weight of Preferred Stock 0.00%Current Share Price $78.24Current Shares Outstanding 1391Market Cap 108832WAAC Estimate 7.41%

SchlumbergerDiscounted Cash Flow (DCF) and Economic Profit (EP) Valuation Models
Key Inputs: CV Growth 3% CV ROIC 25.50% WACC 7.41% Cost of Equity 8.90%
Fiscal Years Ending Dec. 31 2017E 2018E 2019E
2020 E
2021E (CV)
Discount Period 1 2 3 4 4DCF ModelNOPLAT 4798 6530 7188 7701 7821Change in Invested Cap -951 563 451 176 353Free Cash Flow (FCF) 5749 5967 6737 7526 7468Terminal Value (T=4) 143811PV of FCF 5353 5173 5438 5655PV of Terminal 108065Value of Operating Ass 129683AdjustmentsExcess Cash 1747Short-Term Investmen 6131Long-Term Marketbale 2198Investments in Affiliate 1950Underfunded Pension -1570(PV of Operating Lease -1211(Short-term Debt) -2248(Long-term Debt) -15591(PV of ESOP) -656Value of Equity 120432/ Shares Outstanding 1391Intrinsic Value (Per Sha 86.58Fraction of Year Elapse 1.015Stock Price (as of 03/3 87.92
EP ModelFiscal Year End 2017E 2018E 2019E 2020E 2021E (CVDiscount Period 1 2 3 4 4Beginning Invested Capital 30432Economic Profit (EP) 2544 4346 4963 5443 5550Terminal Value (T=4) 113141PV of EP, Discounted b 2369 3768 4006 4090PV of Terminal Value 85019PV of Economic Profit 99251Beginning Invested Ca 30432Value of Operating Ass 129683AdjustmentsExcess Cash 1747Short-Term Investmen 6131Long-Term Marketbale 2198Investments in Affiliate 1950Underfunded Pension -1570(PV of Operating Lease -1211(Short-term Debt) -2248(Long-term Debt) -15591(PV of ESOP) -656Value of Equity 120432/Shares Outstanding 1391Intrinsic Value (Per Sha $86.58Fraction of Year Elapse 1.015Stock Price (as of 03/3 $87.92

SchlumbergerDividend Discount Model (DDM) or Fundamental P/E Valuation ModelFiscal Years Ending Dec. 31 2017E 2018E 2019E 2020E 2021EKey Assumptions CV growth 4% CV ROE 30% Cost of Equity 8.9%
Fundamental P/E ModelDiscount Period 1 2 3 4 4Earnings Per Share 2.05 2.48 2.89 3.13 3.20
Future Cash FlowsDividends Per Share Estim 2.00$ 2.00$ 2.25$ 2.25$ 0.85$ TheorFuture Stock Price Estimate 61.83$ PV of Dividend Payments 1.837$ 1.687$ 1.742$ 1.600$ PV of Future Stock Price 43.97
Intrinisic Value (Per Share 50.83$ Fraction of Year Elapsed 1.01549Stock Price (as of 03/31/20 51.62$

VALUATION OF OPTIONS GRANTED IN ESOP
Ticker Symbol SLBCurrent Stock Price $78.24Risk Free Rate 2.99%Current Dividend Yield 2.48%Annualized St. Dev. of Stock Returns 18.68%
(shares stated in thousands)Average Average B-S Value
Range of Number Exercise Remaining Option of OptionsOutstanding Options of Shares Price Life (yrs) Price GrantedRange 1 6,526 52.78 5.20 25.60$ 167,050$ Range 2 7,501 69.79 5.30 16.01$ 120,061$ Range 3 8,767 72.82 6.30 15.38$ 134,831$ Range 4 12,375 84.17 5.90 10.97$ 135,737$ Range 5 11,333 95.89 6.90 8.70$ 98,635$
Total 46,502 78.16$ 6.02 19.81$ 656.32$

Present Value of Operating Lease Obligations (2015) Present Value of Operating Lease Obligations (2014) Present Value of Operating Lease Obligations (2013) Present Value of Operating Lease Obligations (2012)
Operating Operating Operating OperatingFiscal Years Ending Dec. 31 Leases Fiscal Years Ending Dec. 31 Leases Fiscal Years Ending Leases Fiscal Years Ending 87.1374126781606 Leases2016 261 2015 330 2014 318 2013 3712017 205 2016 259 2015 246 2014 2502018 162 2017 197 2016 195 2015 1922019 145 2018 156 2017 165 2016 1542020 129 2019 134 2018 136 2017 129Thereafter 526 Thereafter 554 Thereafter 558 Thereafter 519Total Minimum Payments 1428 Total Minimum Payments 1630 Total Minimum Payments 1618 Total Minimum Payments 1615Less: Interest 251 Less: Interest 274 Less: Interest 275 Less: Interest 262PV of Minimum Payments 1177 PV of Minimum Payments 1356 PV of Minimum Payments 1343 PV of Minimum Payments 1353
Capitalization of Operating Leases Capitalization of Operating Leases Capitalization of Operating Leases Capitalization of Operating Leases
Pre-Tax Cost of Debt 4.61% Pre-Tax Cost of Debt 4.61% Pre-Tax Cost of Debt 4.61% Pre-Tax Cost of Debt 4.61%Number Years Implied by Year 6 Payment 4.1 Number Years Implied by Year 6 Payment 4.1 Number Years Implied by Year 6 Payment 4.1 Number Years Implied by Year 6 Payment 4.0
Lease PV Lease Lease PV Lease Lease PV Lease Lease PV LeaseYear Commitment Payment Year Commitment Payment Year Commitment Payment Year Commitment Payment1 261 249.5 1 330 315.5 1 318 304.0 1 371 354.72 205 187.3 2 259 236.7 2 246 224.8 2 250 228.53 162 141.5 3 197 172.1 3 195 170.3 3 192 167.74 145 121.1 4 156 130.3 4 165 137.8 4 154 128.65 129 103.0 5 134 107.0 5 136 108.6 5 129 103.06 & beyond 129 375.0 6 & beyond 134 394.4 6 & beyond 136 397.6 6 & beyond 129 370.4PV of Minimum Payments 1177.4 PV of Minimum Payments 1355.9 PV of Minimum Payments 1343.0 PV of Minimum Payments 1352.8
Present Value of Operating Lease Obligations (2016) Present Value of Operating Lease Obligations (2011)
Operating OperatingFiscal Years Ending 0.266337073491377 Leases Fiscal Years Ending Leases2017 292 2012 3712018 220 2013 2462019 195 2014 1922020 167 2015 1542021 132 2016 56Thereafter 471 Thereafter 142Total Minimum Payments 1477 Total Minimum Payments 1161Less: Interest 242 Less: Interest 136PV of Minimum Payments 1235 PV of Minimum Payments 1025

Schlumberger Schlumberger LTDRelative Valuation Models Relative Valuation Model P/S)
Sales per share Sales per share P/S P/STicker Company Market Cap (billions) Price 2017E 2018EHAL Halliburton 48.34 $49.12 $2.60 2.44 18.89 20.14BHI Baker Hughes Inc 26.31 $59.85 $2.62 2.46 22.84 24.36FTI TechnipFMC PLC 16.08 $32.35 $1.52 1.43 21.28 34.46NOV National Oilwell Var 14.71 $39.60 $1.95 1.83 20.31 21.65PTEN Patterson-UTI Energ 3.96 $23.80 $3.80 3.56 6.26 6.68WFT Weatherford Interna 5.959 $6.06 $0.93 0.87 6.52 6.95
Average 16.0 19.0
SLB Schlumberger 117.75 $78.24 3.11 2.92P/S Growth -6.21%
Implied Value: Relative P/S (EPS17) 49.86 Relative P/S (EPS18) 55.58

Effects of ESOP Exercise and Share Repurchases on Common Stock Balance Sheet Account and Number of Shares Outstanding
Number of Options Outstanding (shares): 46,502Average Time to Maturity (years): 6.02Expected Annual Number of Options Exercised: 7.7
Current Average Strike Price: 78.16$ Cost of Equity: 7.41%Current Stock Price: $78.24
2016E 2017E 2018E 2019E 2020E 2021EIncrease in Shares Outstanding: 8 8 8 8 8 8Average Strike Price: 78.16$ 78.16$ 78.16$ 78.16$ 78.16$ 78.16$ Increase in Common Stock Account: 603 603 603 603 603 603
Change in Treasury Stock 982 -480 -200 -200 -4,000 -500Expected Price of Repurchased Shares: 78.24$ 84.03$ 90.26$ 96.94$ 104.12$ 111.83$ Number of Shares Repurchased: 13 (6) (2) (2) (38) (4)
Shares Outstanding (beginning of the year) 1,357 1,352 1,366 1,376 1,385 1,431Plus: Shares Issued Through ESOP 8 8 8 8 8 8Less: Shares Repurchased in Treasury 13 (6) (2) (2) (38) (4) Shares Outstanding (end of the year) 1,352 1,366 1,376 1,385 1,431 1,444
Treasure Stock Change 9,822.00 (480.00) (200.00) (200.00) (4,000.00) (500.00)

SchlumbergerKey Management Ratios
Fiscal Years Ending Dec. 31 2014 2015 2016 2017E 2018E 2019E 2020E 2021E
Liquidity RatiosCurrent Ratio (CA/CL) 1.74 1.91 1.59 1.45 1.56 1.63 1.49 1.58Quick Ratio (CA-Inventories/CL) 1.42 1.64 1.31 1.19 1.27 1.34 1.21 1.28Operating Cash Flow Ratio (Op CF/CL) 0.79 0.62 0.42 0.32 0.35 0.39 0.40 0.41
Activity or Asset-Management RatiosAsset Turnover Ratio (Sales/Average Total Assets) 0.73 0.53 0.38 0.44 0.47 0.49 0.52 0.53Receivables Turnover Ratio (Sales/Average Accounts Receivable, net) 4.29 3.56 3.06 3.49 3.46 3.47 3.45 3.39Inventory Turnover Ratio (Sales/ Average Total Inventory) 10.53 8.46 6.97 8.06 8.28 8.30 8.25 8.11
Financial Leverage RatiosDebt to Equity Ratio (Total Debt/SE) 75.84% 89.40% 87.71% 86.96% 85.03% 85.50% 96.55% 93.04%Equity Ratio (SE/Total Assets) 56.87% 52.80% 53.27% 53.49% 54.05% 53.91% 50.88% 51.80%Times Interest Earned Ratio (NI+Income Tax+Interest Expense/Interest 20.96 9.14 -2.45 5.41 6.55 7.63 8.31 7.99
Profitability RatiosGross Margin (Revenue-COGS)/Revenue) 0.30 0.30 0.25 0.29 0.29 0.29 0.29 0.29EBIT Margin (EBIT/Revenue) 0.16 0.09 -0.05 0.14 0.15 0.16 0.16 0.16Profit Margin (Net Income/ Revenue) 0.11 0.06 -0.06 0.08 0.09 0.10 0.11 0.11Return on Assets (Net Income/ Average Total Assets) 8.12% 3.07% -2.31% 3.59% 4.34% 4.97% 5.45% 5.58%Return on Equity (Net Income/ Average Shareholders Equity) 7.00% 2.80% -2.18% 3.36% 4.03% 4.61% 5.20% 5.43%
Payout Policy RatiosPayout Ratio (Dividends per Share/ Earnings Per Share) 0.37 1.23 -1.61 0.98 0.81 0.78 0.72 0.74Dividend Coverage Ratio (EPS/ Dividends Per Share) 2.73 0.82 -0.62 1.03 1.24 1.28 1.39 1.36

Sensitivity Analysis
87.92 1% 2.00% 3.00% 4.00% 5.00%3.61% 92.63 94.14 95.65 97.15 98.664.11% 88.76 90.20 91.65 93.09 94.534.61% 85.16 86.54 87.92 89.30 90.685.11% 81.79 83.12 84.44 85.77 87.095.61% 78.64 79.91 81.18 82.46 83.73
Impact on WAAC: Cost of Equity, Cost of Debt ROECost of Equity 87.92 1.17 1.22 1.27 1.32 1.37 1.42 51.62$ 10% 20% 30% 40% 50%
7.41% 6.90% 7.90% 8.90% 9.90% 10.90% 4.50% 96.63 93.39 90.35 87.49 84.80 82.26 1% 33.35 34.81 35.30 35.54 35.692.61% 5.41% 6.06% 6.71% 7.36% 8.02% 4.55% 95.76 92.55 89.53 86.69 84.01 81.49 2% 33.81 37.17 38.29 38.85 39.183.61% 5.76% 6.41% 7.06% 7.71% 8.36% 4.60% 94.92 91.72 88.72 85.89 83.24 80.73 3% 34.44 40.33 42.29 43.27 43.86
Rd 4.61% 6.10% 6.76% 7.41% 8.06% 8.71% Risk P 4.65% 94.08 90.90 87.92 85.12 82.47 79.98 CV G 4% 35.90 47.69 51.62 53.59 54.775.61% 6.45% 7.10% 7.76% 8.41% 9.06% 4.70% 93.26 90.10 87.14 84.35 81.72 79.25 5% 36.66 51.51 56.46 58.93 60.416.61% 6.80% 7.45% 8.10% 8.76% 9.41% 4.75% 92.46 89.32 86.37 83.60 80.99 78.53 6% 38.92 62.88 70.87 74.86 77.26
COGS87.92 69.00% 70.00% 71.00% 72.00% 73.00%0.50% 88.80 88.13 87.47 86.80 86.140.90% 89.00 88.34 87.67 87.01 86.35
SG&A 1.40% 89.26 88.60 87.93 87.27 86.601.90% 89.52 88.85 88.19 87.53 86.862.50% 89.83 89.16 88.50 87.83 87.17
Impact on DCF Stock Price: Cost of Goods Sold, SG&A
CV Revenue Growth
BetaImpact on DDM Stock Price: ROE vs CV Growth Rate
Rd
Impact on DCF Stock Price: CV Revenue Growth, Cost of Debt
Impact on DCF Stock Price: Beta, Risk Premium