reconciling medical expenditure estimates from the meps
TRANSCRIPT
1
Reconciling Medical Expenditure Estimates from the MEPS and NHEA, 2012
Didem M. Bernard,1 Cathy Cowan,2 Thomas M. Selden,1
David Lassman,2 and Aaron Catlin2
1Agency for Healthcare Research and Quality
2Centers for Medicare & Medicaid Services
Disclaimer: The views expressed in this article are those of the authors, and no official endorsement by the U.S. Department of Health and Human Services, AHRQ, or CMS is intended or should be inferred.
*Corresponding author: Senior Economist, Division of Research and Modeling, Center for Financing,Access, and Cost Trends, Agency for Healthcare Research and Quality, 5600 Fishers Lane, Rockville,MD 20857. [email protected], Tel. (301) 427-1682.
2
Abstract
Objective: Our goal is to reconcile health care expenditure estimates for 2012 from the Medical
Expenditure Panel Survey (MEPS) with those from the National Health Expenditure Accounts
(NHEA). Reconciling these estimates serves two important purposes: it is an important quality-
assurance exercise for improving and ensuring the integrity of each source’s estimates, and it
provides a consistent baseline of health expenditure data for policy simulations. Our results assist
researchers in adjusting the MEPS to be consistent with the NHEA so that the projected impacts
of any policy change, as well as budgetary and tax implications, are consistent with national
health spending estimates.
Data Sources: Our two data sources are (i) the Medical Expenditure Panel Survey produced by
the Agency for Healthcare Research and Quality and (ii) the National Health Expenditure
Accounts produced by the Office of the Actuary at the Centers for Medicare & Medicaid
Services (CMS).
Results: In this study, we focus on personal health care (PHC) spending, which includes the
goods and services rendered to treat or prevent a specific disease or condition in an individual.
The 2012 NHEA estimate for PHC spending is $2,367 billion, and the MEPS estimate is
$1,351 billion. Adjusting the estimates for differences in underlying populations, covered
services, and other measurement concepts reduces the NHEA estimate for 2012 to
$1,718 billion; after adjustments to the NHEA, the MEPS is $367 billion, or 21.4 percent, less
than the adjusted NHEA total in 2012.
Keywords: national health accounts, medical expenditures, health care costs, health financing,
health resource
3
Introduction
The National Health Expenditure Accounts (NHEA) and the Medical Expenditure Panel Survey
(MEPS) provide comprehensive estimates of health care spending in the U.S. The NHEA
estimates are produced annually by the Office of the Actuary at the Centers for Medicare &
Medicaid Services (CMS). Based on aggregate provider revenue data, administrative records of
publicly administered programs, and a variety of other data sources, the NHEA provide, for the
entire U.S. population, aggregate estimates for a full range of health care expenditures, including
medical goods and services, government administration, net cost of insurance, public health
services, and investment in research, structures, and equipment. As a result, the NHEA are
typically regarded as the official source for U.S. government estimates of overall health
spending, and they constitute the only comprehensive data available by type of service and
source of funding. The MEPS is produced annually by the Agency for Healthcare Research and
Quality (AHRQ). It, too, provides detailed estimates of health expenditures, but the MEPS
estimates are based on person-level information from a nationally representative sample of
households in the civilian, non-institutionalized population. Analysts often use the MEPS and the
NHEA in concert, with the MEPS providing person-level data on expenditures, insurance
coverage, and demographics and the NHEA providing aggregate national health spending totals
that are considered the most comprehensive estimates available. Together, these two data sources
can be used for microsimulation models for projecting health spending.
Study Data and Methods
In this paper we reconcile the NHEA and the MEPS for 2012 in order to make use of detailed
estimates from the U.S. Census Bureau’s quinquennial Economic Census. There has been three
prior reconciliations of NHEA and MEPS since 1996. Reconciling the NHEA and the MEPS
4
estimates serves two important purposes. First, it is an important quality-assurance exercise for
improving and ensuring the integrity of each source’s estimates. Identifying service types and
sources of payment that differ substantially between the NHEA and the MEPS helps AHRQ and
CMS focus future research efforts on improving their respective expenditure estimates. Second, a
detailed MEPS-NHEA reconciliation offers useful guidance to analysts seeking to align the
MEPS with the NHEA to obtain a consistent baseline of health expenditure data for policy
simulations and other research that requires household-level data (Bernard, Selden, and
Pylypchuk, 2016; Bernard, Selden, and Pylypchuk, 2015a; Bernard, Selden, and Pylypchuk,
2015b; Heffler et al., 2009; and Cohen J. et al., 2009).
Although each source provides a measure of national spending on personal health care
(PHC), unadjusted estimates are considerably different. We make adjustments to account for the
differences in underlying populations, covered services, and other measurement concepts to
reconcile the expenditure estimates. Once we adjust the NHEA for consistency with the MEPS,
we compare and discuss potential reasons for the differences for each service category and
source of payment. We also discuss how the expenditure estimates have changed since the 1996,
2002, and 2007 reconciliations, focusing on differences from the most recent reconciliation for
2007 (Selden et al., 2001; Sing et al., 2006; and Bernard et al., 2012).
The NHEA
The NHEA measure the total annual dollar amount of health care consumption in the U.S., as
well as the dollar amount invested in medical sector structures and equipment and non-
commercial research (CMS, 2016a and 2016b). In this study, we focus on PHC, which includes
the goods and services rendered to treat or prevent a specific disease or condition in an
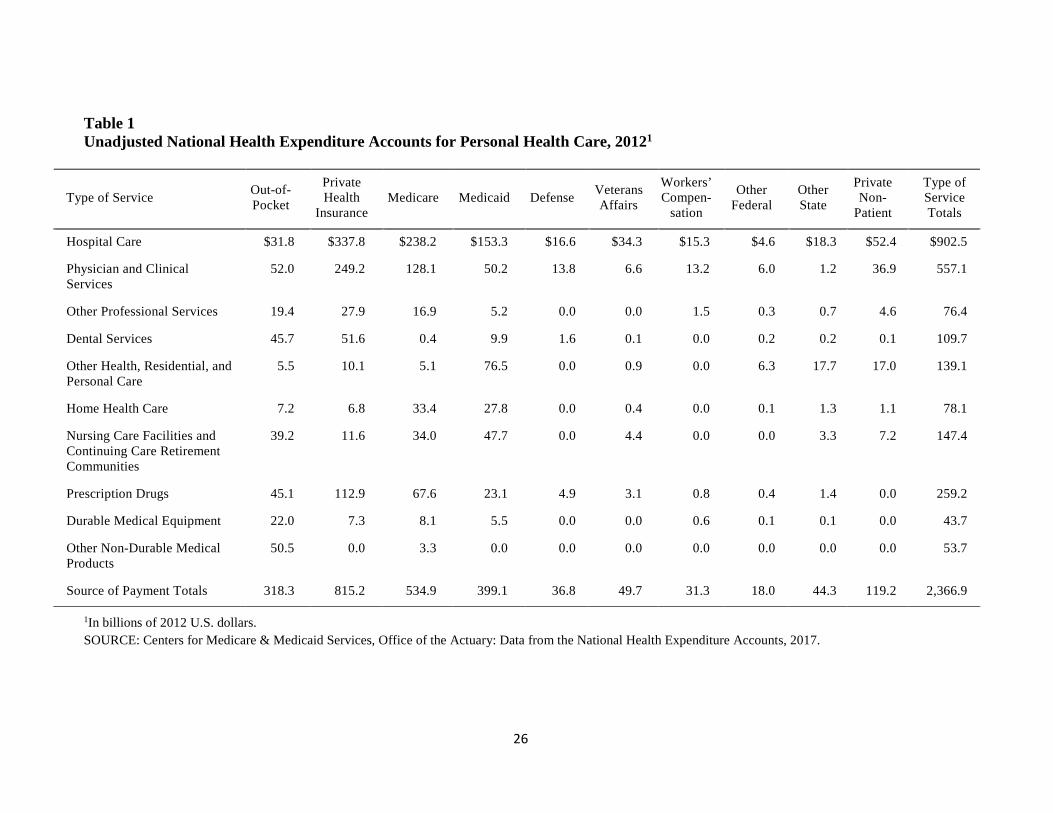
individual. The latest NHEA estimate for PHC spending in 2012 is $2,367 billion (85 percent of
5
total health spending). Table 1 presents the unadjusted NHEA estimates for 2012 by service and
source of payment categories.
The Office of the Actuary develops the NHEA expenditure totals by type of service using
aggregate estimates of provider revenues from data sources such as the U.S. Census Bureau’s
Economic Census and Service Annual Survey, the American Hospital Association (AHA),
IQVIA (retail prescription drug sales), and government administrative data. The Office of the
Actuary does not directly collect any of the data but uses a variety of surveys and other data
sources to construct the estimates. While all of these data sources may have sampling errors or
biases associated with them, it is not possible to develop a single sampling error estimate for the
NHEA.
Hospital care expenditures comprise revenues from all sources, including net patient
revenue (gross charges less contractual adjustments, bad debts, and charity care), non-patient
revenue (such as cafeteria revenue), non-operating revenue, and government appropriations.
Included in the hospital care category are expenditures for hospital services, as well as revenues
received for inpatient pharmacy, hospital-based nursing home care, hospital-based home health
care, and fees for any other services billed by the hospital. Expenditures for physician and
clinical services, dental services, other professional services, home health care, and nursing care
facility and continuing care retirement community services, along with a portion of other health,
residential, and personal care including private ambulance services and Intermediate Care
Facilities for the Intellectually Disabled, are primarily based upon the total receipts/revenue
collected by the 2012 Economic Census (CMS, 2016b). Spending for prescription drugs includes
retail sales of human-use dosage-form drugs, biological drugs, and diagnostic products, and is
net of rebates.
6
For the NHEA expenditures by source of payment, estimates of government program
spending are computed by service using program data such as Medicare claims data, Medicaid
CMS-64 reports from the states, and budget data. The residual of total expenditures for each
good and service category minus spending on government programs is allocated, among out-of-
pocket, private health insurance (PHI), and private non-patient revenue, based on a range of data
sources (including the Census Bureau’s Service Annual Survey, the AHA Annual Survey of
Hospitals, the MEPS, and other data sources). These results are then compared with other study
results (including the MEPS) for reasonableness.
Every five years the NHEA undergo a comprehensive revision that includes the
incorporation of newly available source data, methodological and definitional changes, and
benchmark estimates from the U.S. Census Bureau’s quinquennial Economic Census. The
changes that were incorporated during the more recent comprehensive revision are documented
on the CMS website (https://www.cms.gov/Research-Statistics-Data-and-Systems/Statistics-
Trends-and-reports/NationalHealthExpendData/Downloads/benchmark2014.pdf).
During the most recent comprehensive revision, there was a modification of the NHEA
method used to allocate Medicaid managed care premiums to goods and services. This change
was incorporated for states that have a large percentage of Medicaid managed care spending.
Data from the Medicaid CMS-64 submission were supplemented with data from the AHA
Annual Survey and the MEPS, along with Medicaid program data from such sources as the
Medicaid Analytic Extract (MAX) and the Medicaid Drug Rebate System. The net effect was a
downward revision to the hospital care and home health care estimates, and upward revisions to
physician and clinical services, dental services, and other professional services and nursing care
facilities and continuing care retirement communities.
7
In addition, the Department of Defense (DOD) estimate was revised to incorporate new
data for U.S.-only spending obtained directly from the DOD Medical Expense & Performance
Reporting System, and part of the Veterans Health Administration hospital spending was
reclassified to other health, residential, and personal care spending.
The MEPS
The MEPS is a household survey designed to support nationally representative estimates of
health expenditures and use, health insurance coverage, health status, employment, and
demographic and socioeconomic characteristics of the civilian, non-institutionalized U.S.
population (Cohen, 1997). The MEPS is produced by AHRQ.
The MEPS expenditure data are based on household-reported information on health care
use and expenditures. The survey has an overlapping panel design in which data are collected
through five rounds of interviews during a two and a half-year period to cover use and
expenditures over two calendar years. The MEPS sample includes data from 37,182 individuals,
with a positive sampling weight in calendar year 2012 (AHRQ, 2014). Because households may
have difficulty reporting third-party payments, the MEPS supplements household reports of such
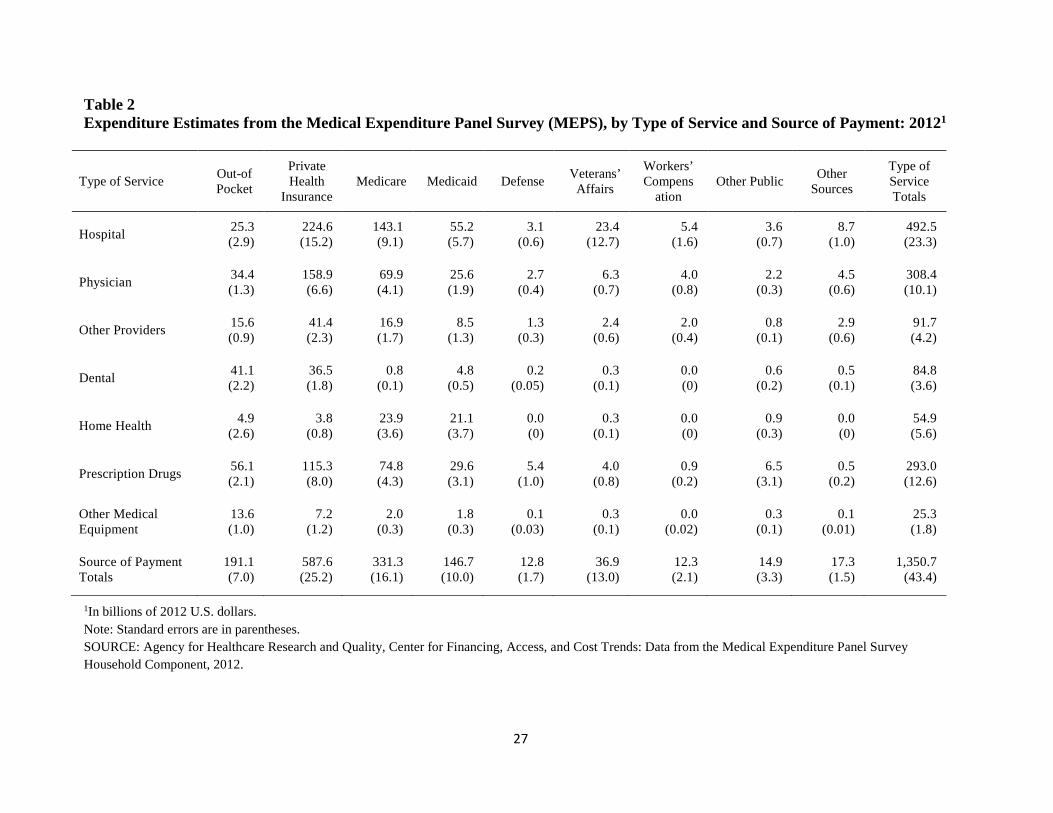
payments with data obtained through a follow-back survey of providers (AHRQ, 2008). Table 2
presents the unadjusted MEPS expenditure estimates for the civilian, non-institutionalized
population by type of service and source of payment in 2012. The total expenditure estimate is
$1,351 billion with a 95-percent confidence interval of $1,286 billion to $1,415 billion.
NHEA and MEPS differences
The NHEA and MEPS differ with respect to included populations, included services, service
category definitions, inclusion of payments such as grants and supplemental payments, public
8
health spending, and investment in medical care for future consumption. Populations that are
included in the NHEA but that are out of scope for the MEPS include active duty military
personnel, foreign visitors to the U.S., and people in institutions such as nursing homes and
assisted living facilities.
The MEPS excludes spending on non-prescription non-durable goods (for example, over-
the-counter medications) and is unlikely to capture other health, residential, and personal care
(OHRPC) services. The NHEA category of OHRPC covers health services provided in non-
traditional settings, including school health care, worksite health care, Medicaid home and
community-based waivers, some ambulance services, and residential mental health and
substance abuse facilities. The largest payer of OHRPC services is Medicaid through its home
and community-based waivers. Because many of these waivers involve non-medical assistance
with activities of daily living, they were deemed out of scope for the purpose of this analysis,
although the MEPS may capture a small amount of personal health care.
While service categories in the NHEA are defined according to the type of establishment
that collected the revenue, in the MEPS they are defined according to the type of service
provided to an individual. For example, expenditures for hospital-based home health care are
included in the hospital care category in the NHEA but are included in the home health category
in the MEPS.
With respect to payments, the MEPS provides estimates for expenditures that are directly
linked to patient care events and accordingly does not measure provider grants and lump-sum
retrospective adjustments that are included in the NHEA. For instance, the MEPS does not
include maternal and child health grants for public and other community health clinics, Medicaid
disproportionate share hospital (DSH) payments, and certain lump-sum provider payments
9
associated with managed care (see discussion below). In terms of funding sources, the MEPS
excludes private non-patient care revenues, such as revenues from philanthropic giving,
cafeterias, and investment income. Finally, the MEPS also does not include public health
programs and investments (research, structures, and equipment).
NHEA adjustments
There are four general types of adjustments that are made to the NHEA for consistency with the
MEPS: (i) alignment of service categories, (ii) adjustment of the scope of included populations,
(iii) adjustment for patient care services not included in the MEPS, and (iv) adjustment for
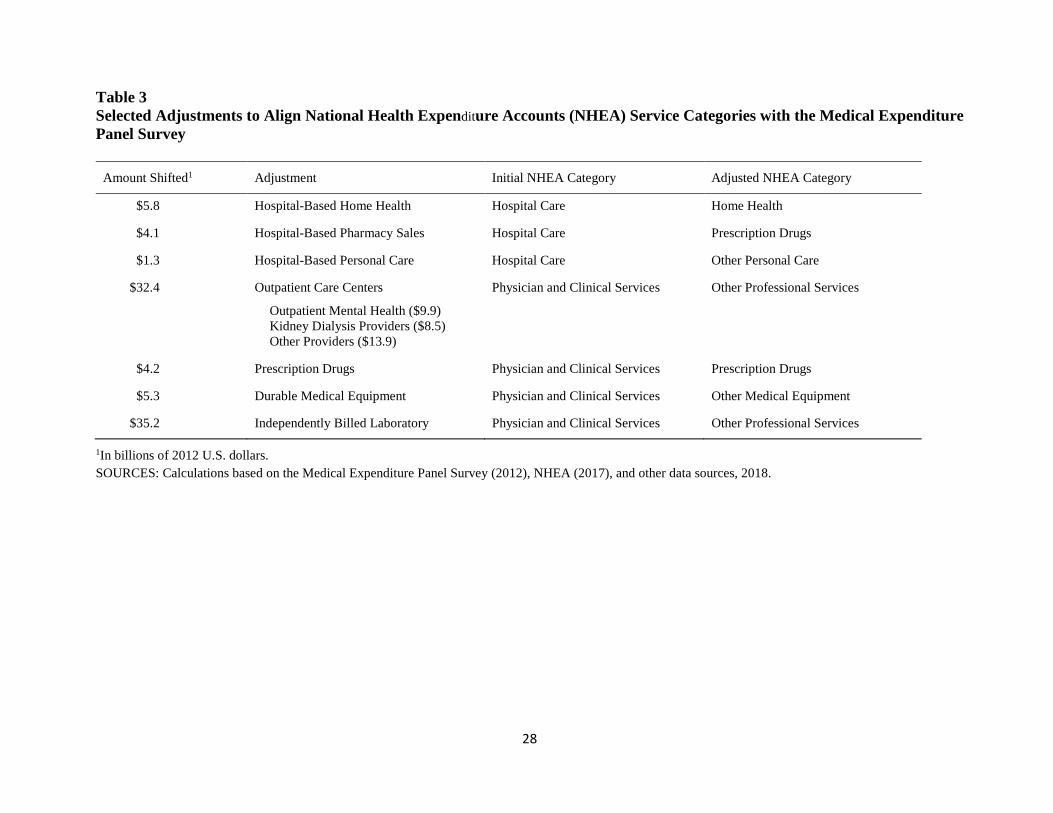
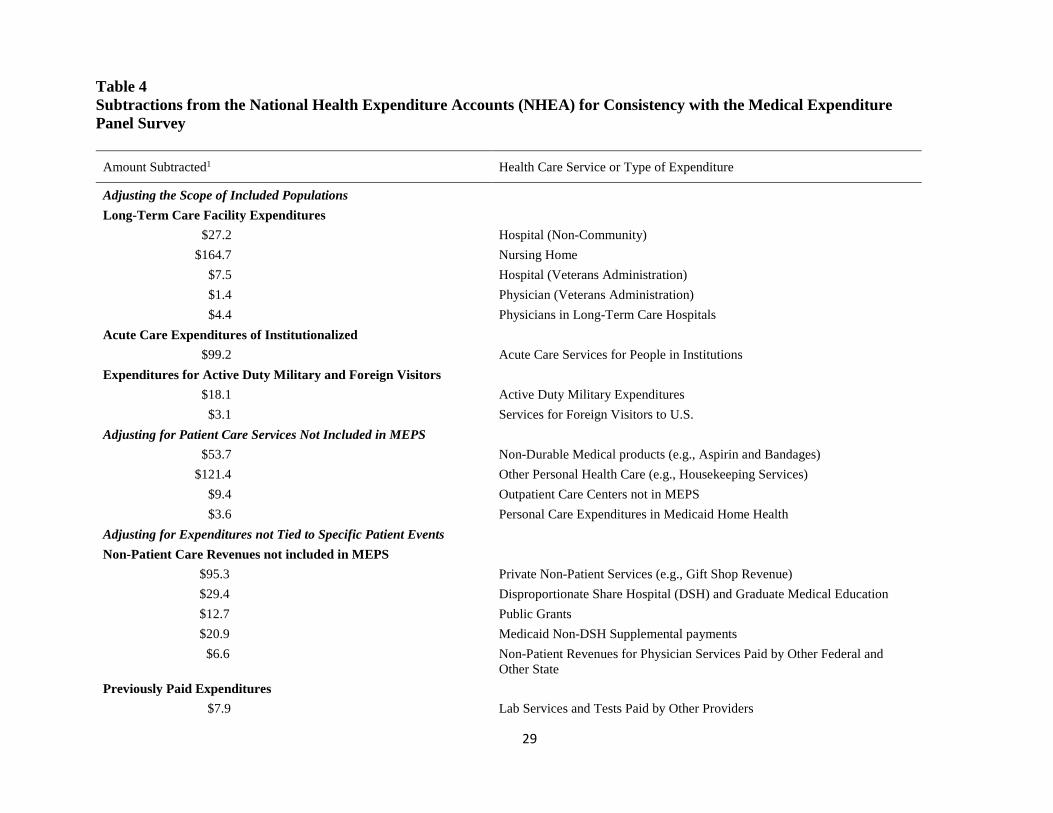
expenditures not tied to specific patient events. Table 3 summarizes some of the adjustments we
make to align the NHEA and MEPS service categories, and Table 4 summarizes the subtractions
from, and additions to, the NHEA that make the included population and patient care
expenditures more consistent with the MEPS. Whereas Tables 3 and 4 provide aggregate service-
level changes, our detailed reconciliation adjusts the NHEA by type of service and source of
payment. These adjustments require detailed estimates for expenditure categories and population
subsets that are often difficult to measure accurately.
One of the adjustments included in Table 4 is for the acute care expenditures of the
institutionalized population. In this reconciliation, we use the same methodology that we used in
the 2007 reconciliation for estimating the amount that the institutionalized population spends on
health care outside of the institution. Acute care expenditures for the institutionalized Medicare
beneficiaries are based on the Medicare Current Beneficiary Survey (MCBS). In addition, we
exclude expenditures for Medicare beneficiaries with skilled nursing facility stays that are longer
than 30 days—stays that are likely to be counted as institutionalization in the MEPS. For
institutionalized Medicaid enrollees without Medicare, we use the Medicaid Statistical
10
Information System; for institutionalized people without Medicare or Medicaid and for the
prison population, we developed the estimates as we did in prior reconciliations by applying age-
specific expenditure estimates from the MEPS and MCBS to population totals from a number of
data sources, including the Social Security Administration and the Department of Justice.
Additionally, we reduced the estimate of institutionalized acute care spending by $22.4 billion—
expenditures that were captured by the MEPS for persons who were institutionalized during the
year and that occurred while these persons were in the community—so that for this reconciliation
we subtract from the NHEA only the amount of spending that is outside the scope of MEPS.
Table 4 also includes adjustments to the NHEA to align with the MEPS other Federal,
other State and Local, and other source of payment categories. We replace the expenditures in
the NHEA other Federal and other State and Local categories with the corresponding MEPS
amounts because these NHEA payment categories are dominated by spending not directly linked
to individual patients. Examples include funds supporting the operation of public and other
community health clinics, such as maternal and child health expenditures and some subsidies for
public clinics and hospitals. With respect to the MEPS other source of payment category, which
includes private non-health insurance payments (primarily property and casualty insurance) and
miscellaneous payment sources, no corresponding category exists in the NHEA. We add this
payment category to the adjusted NHEA, and we offset this addition by removing equal amounts
from the NHEA PHI column (by service category), since property and casualty insurance
payments for medical expenses are included in the NHEA PHI estimate. We remove the NHEA
private non-patient revenue expenditures because these funds (which include revenues from
philanthropic giving, gift shops, cafeterias, and investment income) are not directly linked to a
specific patient care event and therefore are not captured by the MEPS (but can be used by
11
hospitals to offset costs). Due to a lack of reliable estimates, we make no adjustment for provider
revenues received from uncompensated care pools or similar indigent care programs that
reimburse providers in some states for care, though such payments are unlikely to have been
captured by the MEPS.
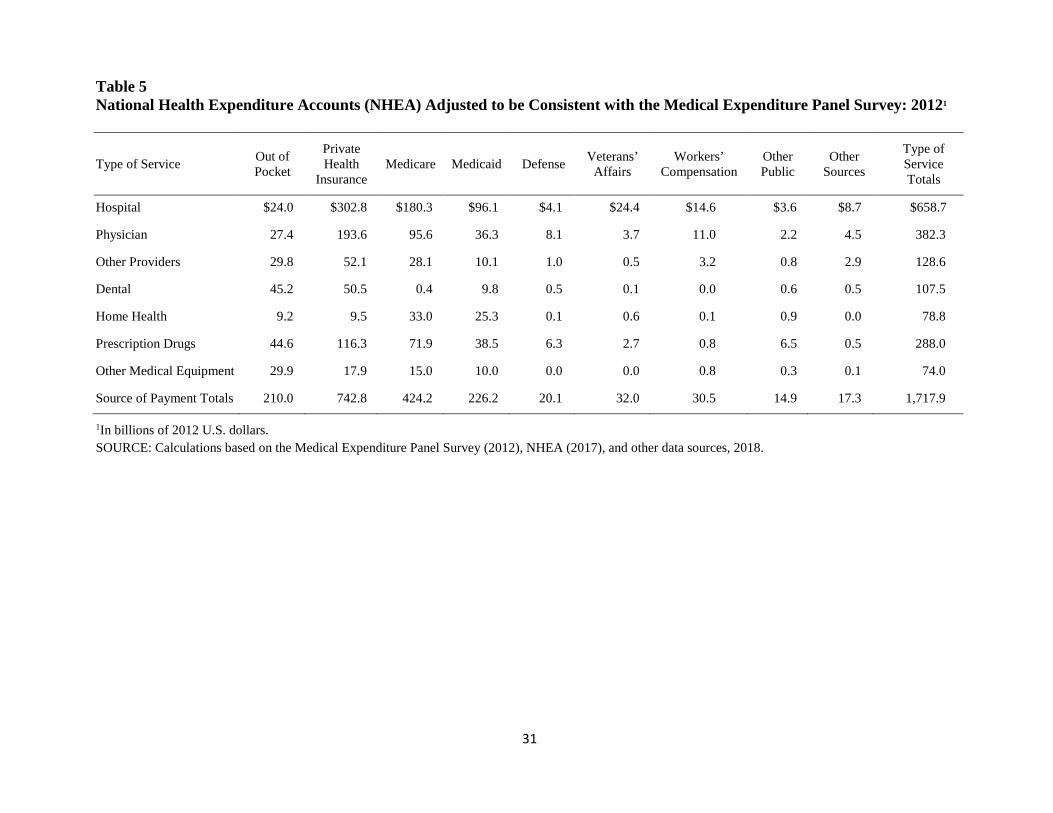
Study Findings
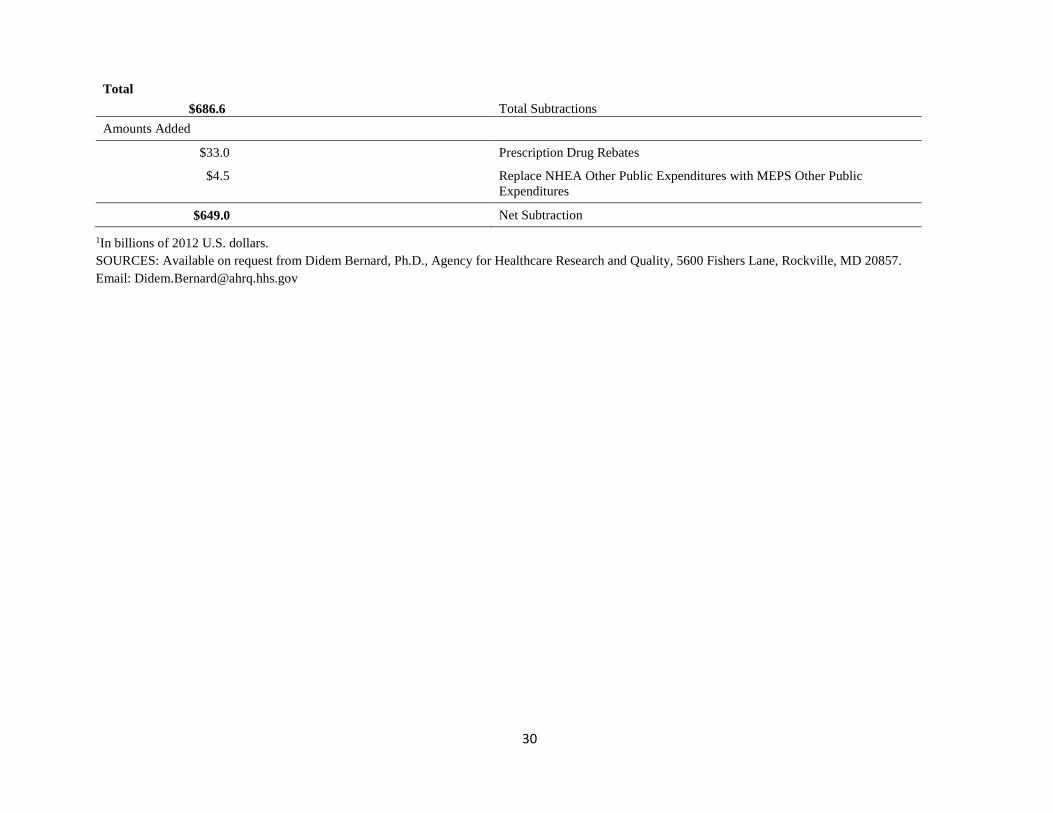
The adjusted NHEA estimate for 2012 is $1,717.9 billion (Table 5), compared with the
unadjusted NHEA estimate of $2,366.9 billion (Table 1). Thus, our reconciliation removes $649
billion from the NHEA. The total MEPS expenditure estimate is $1,350.7 billion (Table 2), or
$367.2 billion—21.4 percent—less than the adjusted NHEA total (Table 6).
Comparisons with previous reconciliations
There have been three prior reconciliations between the NHEA and MEPS. The NHEA-MEPS
difference of 21.4 percent is higher than the differences found in 2007 (17.6 percent), in 2002
(13.8 percent), and in 1996 (6.7 percent). However, this apparent widening of the MEPS-NHEA
gap should be interpreted with caution. As discussed by Sing et al. (2006), the 2002
reconciliation differed in many respects from the 1996 reconciliation; that is, estimates of acute
care spending by the institutionalized were improved, Economic Census data were better aligned
for use in the reconciliation due to the shift in industry coding (from the Standard Industrial
Classification to the North American Industry Classification System), and in several instances
the definition of what was deemed in scope for the MEPS was broadened to include certain hard-
to-measure spending categories. All of these modifications in methodology had the effect of
widening the apparent gap between the NHEA and MEPS between 1996 and 2002.
12
With respect to the difference between 2002 and 2007, once again methodological
improvements complicate interpretation. One such enhancement was that, for the 2007
reconciliation, for the first time, the NHEA included ambulance expenditures beyond those paid
by Medicare and Medicaid (an increase of $7.9 billion or 0.6 percent of the adjusted NHEA).
Moreover, the 2007 analysis further refined estimates of acute care spending by the
institutionalized. In addition to drawing upon better data, the 2007 analysis included a
$14.7-billion adjustment, not explicitly made in 2002, for expenditures of individuals
institutionalized part of the year for health care use during time they spent in the community. It is
also important to note that, as is the case with any survey database, estimates in the MEPS
fluctuate from year to year, in part due to random sampling variation. Relative standard errors for
the MEPS aggregate expenditure estimates generally range between two and three percent, and
estimates by type of service and source of payment can have larger relative standard errors. The
2002 reconciliation pooled MEPS data from 2002 and 2003, a factor that helped reduce variation
but that also narrowed the overall NHEA-MEPS gap by nearly two percentage points.
The increased gap between 2007 and 2012 from 17.6 to 21.4 percent, is explained in part
by three key factors. First, the MEPS experienced a sharp drop in the number of household-
reported office-based visits in 2010-2012, requiring adjustments to the final weights in the full-
year consolidated MEPS public use files for 2010 through 2012. This drop also led to intensive
efforts to improve MEPS field procedures and interviewer behavior in 2013-2014 (Zuvekas,
Beiner, and Dicks, 2017).
A second factor is that the levels subtracted from the NHEA for nursing home spending
and the institutionalized population remained almost as high in 2012 as in 2007, while the levels
added from prescription drug rebates were much larger. Adjusted nursing home expenditures, the
13
largest subtraction from the NHEA, were $144.5 billion in 2007 (10.6 percent of adjusted
NHEA) compared to $164.7 billion in 2012 (9.6 percent). Likewise, the acute care expenditures
of the institutionalized population, the third largest subtraction from the NHEA, were $98.1
billion in 2007 (7.2 percent of adjusted NHEA) compared to $98.7 billion in 2012 (5.8 percent).
Prescription drug rebates, an addition to the NHEA, were $17.3 billion in 2007 (1.3 percent of
adjusted NHEA) versus $33.0 billion in 2012 (1.9 percent). A third factor that explains the gap
increase is the replacement of the NHEA other public expenditures with the MEPS other public
expenditures, which decreased adjusted NHEA by $1.3-billion in 2007 and increased adjusted
NHEA by $4.5 billion in 2012. The result was an additional increase of $5.8 billion ($1.3 billion
+ $4.5 billion) in the NHEA-MEPS gap from 2007 to 2012.
In the remainder of the paper we discuss the differences between the MEPS and NHEA
expenditure estimates by type of service and source of payment, focusing on the largest service
and payment categories.
Comparison by service category
The adjusted NHEA expenditure estimates are greater than those from the MEPS for most
service categories (Table 6). In both the NHEA and MEPS, the two largest spending categories
are hospital and physician, which together account for 65.4 percent of the overall NHEA-MEPS
difference. For the hospital sector, the MEPS is $166.2 billion, or 25.2 percent, lower than the
adjusted NHEA. PHI accounts for 47.1 percent of the difference in hospital expenditures, while
Medicaid accounts for 24.6 percent and Medicare 22.4 percent. For out-of-pocket hospital
spending, the MEPS is 6 percent, or $1.3 billion, higher than the adjusted NHEA. A comparison
between the MEPS and Truven MarketScan and OptumLabs claims data for 2008-2013 revealed
that part of the shortfall in the MEPS may stem from the survey’s data including too few stays
14
with extreme costs. Although cases with spending greater than $100,000 in the 2013 MEPS data
accounted for 13 percent of total expenditures, such cases accounted for 18.7 percent and
21.8 percent of total expenditures in Truven MarketScan and OptumLabs claims data in 2013,
respectively (Zuvekas, 2017). Long hospitalizations and those that result in death,
institutionalization, or a change in residence following discharge all pose difficulties for
measurement by the MEPS.
The MEPS spending for physician services is $73.9 billion, or 19.3 percent, below the
adjusted NHEA spending. As mentioned previously, there was a significant drop in the number
of household-reported office-based visits in MEPS in 2010-2012, requiring adjustments to the
final weights in the full-year consolidated MEPS public use files for 2010 through 2012. It is
important to recognize that there may be imperfections in our alignment of the NHEA and MEPS
that lead to hospital expenditures being reported as physician expenditures. It may not always be
clear to the MEPS respondents whether a particular ambulatory visit is to a physician office or
clinic or it is to an outpatient facility owned by a hospital. In prior reconciliations, the gap for
hospital expenditures was smaller than that for physician expenditures, a result that we had
interpreted as the MEPS respondents being able to recall major events, such as hospitalizations
or emergency room visits, more easily than office or clinic visits. However, in 2012 we find that
the gap is larger for hospital than the gap for physician services in percentage terms.
Other factors may help explain the NHEA-MEPS gap for the physician sector. Although
the reconciliation makes several adjustments for provider payments not linked to patient events
(such as the removal from the NHEA of Medicaid DSH, Graduate Medical Education, Indirect
Medical Education, and private non-patient revenues), there may be other provider payments that
are not directly linked to events collected in the MEPS. For example, although the MEPS
15
contains event-level expenditures for capitated as well as fee-for-service (FFS) events, the MEPS
misses provider payments tied to performance and global fees charged for administration—
payments that are likely to be increasingly prevalent (Burwell, 2015). Duplicative payments also
pose a potential problem for the NHEA insofar as these accounts rely on data collected at the
office or clinic level. If revenue received by one establishment were to be paid out to other
establishments (in essence as subcontractors), then double-counting would arise. We subtract
$7.9 billion from the NHEA to avoid double-counting payments that physician offices and
clinics receive from hospitals for laboratory services, since these payments are already included
in the NHEA hospital estimates. However, other duplicative payments have likely grown over
time as integration among health care providers, such as hospitals and physician practice groups,
has increased (Koch, Wendling, and Wilson, 2017).
Another factor that could be contributing to the gap in spending for physician services in
the MEPS and the NHEA is the method used in the latter source to estimate physician spending
for Medicaid. Specifically, the NHEA Medicaid estimates include expenditures related to
managed care plans or capitated payments that are distributed by service type by first removing
12.5 percent of total payments associated with a net cost factor and then allocating the remaining
paid benefit total to service categories using the distribution method described earlier in the
paper. This distribution method assigns an estimated amount of managed care spending to
services such as physician spending, while this spending is reported by service in the MEPS.
For the next largest spending category, prescription drugs, the MEPS expenditures are
1.7 percent, or $4.9 billion, above the adjusted NHEA. However, there are larger differences
across payment sources for this category: out-of-pocket and Medicare expenditures are larger in
the MEPS, and PHI and Medicaid expenditures are greater in the adjusted NHEA.
16
The NHEA-MEPS difference for the other providers category in 2012 is $36.8 billion,
with the MEPS 28.6 percent below the adjusted NHEA. A major contributor to this gap is
underreporting of separately billed laboratory tests in the MEPS. Such expenditures would not be
captured in the provider follow-back survey.
With respect to the dental category, the 2012 NHEA-MEPS gap is $22.7 billion, with the
MEPS 21.1 percent below the adjusted NHEA. One caveat pertaining to this estimate is that
some dental care is provided outside of dental establishments (for example, in clinics) so that
comparing the MEPS expenditures with those in the adjusted NHEA dental category may
modestly understate the true difference.
The extent to which the MEPS is below the adjusted NHEA for the Home Health
category narrowed between 2007 and 2012, from 38.6 to 30.3 percent, while for other medical
equipment (OME) the gap widened from 57.3 to 65.8 percent. These results should be
interpreted with caution, as sampling variation can lead to year-to-year variations in the MEPS
for relatively rare health care events such as those represented by these two expenditure
categories. Nevertheless, it is clear that large NHEA-MEPS gaps exist in all years for these
expenditure categories. The MEPS respondents likely have difficulty reporting some types of
durable medical equipment (DME) and/or home help as health care goods and services. Also, 29
percent of the NHEA-MEPS gap for OME arises because the MEPS events that are reported as
ambulance services amount to $4.7 billion whereas the adjusted NHEA estimate is $18.9 billion
(not shown in tables). Reconciling the NHEA and MEPS ambulance spending, however, is
complicated by the possibility that at least some ambulance expenditures in the MEPS are folded
into other provider bills. Additionally, by design, the MEPS is unlikely to capture a large
percentage of DME purchases. Alignment issues would also arise if not all hospice (home
17
health) dollars reported in the MEPS were identified as such by respondents or billing records
from the medical provider survey.
Yet another factor driving the NHEA-MEPS gaps for home health and OME may be
fraud and abuse. We discuss below the possible contribution of improper payments to these gaps,
but it is worthwhile to note that a report by the Government Accountability Office (GAO) found
that home health care and the DME portion of OME are the services that are most vulnerable to
such abuses (GAO, 2012).
Comparison by source of payments
The four largest payment source categories from the adjusted NHEA are all greater than those
from the MEPS, with differences of 35.2 percent for Medicaid, 21.9 percent for Medicare, 9.0
percent for out-of-pocket spending, and 20.9 percent for PHI. (Table 6).
For Medicaid and the Children’s Health Insurance Program (CHIP), a likely contributor
to the 35.2-percent gap is that the MEPS undercounts Medicaid enrollees. The MEPS 2012
contains 50.5 million person-years of Medicaid coverage. Based on tabulated CMS MAX
estimates, an approximate benchmark for the non-institutionalized population is 59.3 million
person-years, inclusive of separate state enrollment in CHIP and exclusive of enrollees with
restricted benefits through emergency and family-planning eligibility (calculations based on
CMS, 2018). Thus, the MEPS undercounts Medicaid enrollment in 2012 by approximately 15
percent. A portion of this MEPS undercount likely involves hard-to-survey persons who might
also have above-average expenditures, such as the homeless and those residing in settings at the
margins between “community” and “institution.” Future research using matched administrative
claims data may help clarify the distribution of MEPS underreporting by service type and
determine the extent to which undercounting the Medicaid population contributes to the gap in
18
Medicaid spending. Another potential explanation for the NHEA-MEPS Medicaid gap is
fraudulent payments. According to a GAO analysis citing CMS, such payments totaled $22.5
billion in 2009 (GAO, 2012). In fiscal year (FY) 2015, CMS identified $36.4 million in
Medicaid overpayments, $14.8 million of which was recovered. In addition, $106.4 million was
recovered through the Medicaid Recovery Audit Program, and $852.9 million was recovered
through the Medicaid Integrity Program (CMS, 2016c). Payments such as these that are not
reported by the MEPS respondents may help to explain some of the NHEA-MEPS gap.
Our reconciliation shows the MEPS Medicare spending to be $92.9 billion, or 21.9
percent, below the adjusted NHEA. Previous methodological investigations using the MEPS data
linked to Medicare claims data found that Medicare beneficiaries systematically underreport
some types of health care services and goods, such as office-based visits and DME (Zuvekas and
Olin, 2009a and 2009b), while accurately reporting inpatient stays (Zuvekas and Olin, 2009a)
and prescription medications (Hill, Zuvekas, and Zodet, 2011). The previous finding of larger
gaps for ambulatory visits than for inpatient care is consistent with our results. One factor to
consider with respect to the overall NHEA-MEPS Medicare gap—and in the case of the Home
Health and OME categories in particular—is the potential for fraud and abuse. CMS estimates
that program integrity activities saved Medicare $21.2 billion in FY 2013, $18.0 billion in FY
2014, and $17.0 billion in FY 2015 and that prevention of improper payments and recovery of
overpayments represented 84.5 percent and 15.5 percent of these savings, respectively, in
FY 2015 (CMS, 2016c). While a portion of the NHEA-MEPS gap may be explained by
expenditure amounts not being reported by MEPS respondents, undetected fraud and abuse may
be a much larger problem.
19
For out-of-pocket expenditures, the MEPS is 9.0 percent below the adjusted NHEA,
which is less than one-half the difference for overall expenditures. Out-of-pocket estimates are
considered to be a strength of the MEPS as they are more readily reported by households. In the
NHEA, out-of-pocket and PHI are residual source-of-payment categories, and the allocation of
expenditures between them is sensitive to the underlying assumptions regarding total and
government spending.
The MEPS estimate for PHI is $155.1 billion, or 20.9 percent, below the adjusted NHEA.
In prior reconciliations (2002 and 2007), the PHI gap was approximately twice as large in
percentage terms as it was for Medicare and in 2012 the gap was similar. One might expect the
gap for Medicare to be larger than for PHI given that the MEPS can miss expenditures when
respondents living alone die during the year or when persons are discharged from hospital stays
either to institutions or to a different residence in the community—situations that arise
disproportionately for Medicare beneficiaries. Perhaps Medicare beneficiaries, notwithstanding
their age and/or disability, are simply better respondents than those with private insurance, due to
fewer time pressures, simpler family structures, better bookkeeping, and/or less complex
insurance arrangements.
The PHI gap could also stem from our adjustment for the institutionalized population.
The institutional adjustment is based on data from MCBS, and while MCBS expenditures are
based on claims for Medicare, they are self-reported (and subject to potential undercounting) for
PHI. If our subtraction of spending by the institutionalized population reduces the NHEA by the
correct amount for Medicare, but by too little for PHI, this discrepancy could contribute to a
larger PHI gap for the non-institutionalized population.
20
It is also noteworthy that the NHEA PHI is calculated as part of a residual. Provider
survey data are used for total spending estimates, administrative data are used for government
spending estimates, and then PHI, out-of-pocket, and other private expenditures are calculated by
subtracting government administrative data from total spending. Consequently, if there were any
conceptual or measurement differences between the provider data and the administrative data,
they would be reflected partially in the PHI estimate. However, when PHI premium estimates are
compared with other sources, such as the MEPS Insurance Component, the Bureau of Labor
Employer Costs for Employee Compensation, and various other private health insurance surveys,
the results are very similar. Finally, our estimate of a 20.9-percent NHEA-MEPS gap for PHI is
approximately the same as the gap found between the MEPS and Marketscan and OptumLab
claims data (Zuvekas, 2017). The MEPS was lower than Marketscan by 17.0 and 24.0 percent in
2012 and 2013, respectively. Relative to estimates from OptumLabs, MEPS, was lower by 13.0
in 2012 and 20.0 percent in 2013.
Conclusions
As has been the case historically, total health care expenditure estimates from the MEPS have
been lower than the adjusted NHEA; in 2012 they differed by $367.2 billion, or 21.4 percent.
There are key factors that likely result in the MEPS being lower and other factors that lead to the
adjusted NHEA begin higher. However, there is also some sensitivity in these calculations since
aligning the two estimates entails numerous assumptions and since the adjustments we
implement are subject to error. It is difficult to test the sensitivity of the results to all the
assumptions underlying the steps involved in reconciling the two sources of data because many
of the assumptions are interrelated. However, we believe that the results presented here provide
an adequate estimate of the relationship between the NHEA and MEPS.
21
The differences we observe across service types and sources of payment suggest that
measurement issues in the MEPS and the NHEA may contribute to the gaps. For the MEPS, the
reconciliation highlights the importance of improving methods not only for data collection from
high-expenditure cases but also for corrections for survey attrition. The MEPS may also be able
to enhance collection procedures for high-cost hospital and physician expenditures that occur just
before the sampled persons dies or is placed in a nursing home (cases in which it is difficult for
the MEPS to locate a respondent to report use and expenditures).
For the NHEA, measurement issues may explain some of the gaps in PHI and out-of-
pocket expenditures. Since private expenditures in the NHEA are calculated as residual, they are
subject to measurement errors associated with provider surveys and program data. Another
potential issue is that improper payments due to fraud and abuse are included in the NHEA,
whereas such amounts captured by the MEPS are unknown.
As a closing caveat, we note that we conducted this analysis for 2012 in order to make
use of detailed estimates from the quinquennial Economic Census (available in that year).
Nevertheless, researchers who wish to apply the 2012 NHEA-MEPS results presented in this
paper to more recent years of the MEPS should be aware that because of sampling variation,
editing changes in the MEPS, changes in the NHEA, and—in some cases—program
modifications, uncritical application of factors derived from our 2012 analysis to other years of
the MEPS may result in unreliable estimates by service type and source of payment. While we
find a 21.4 percent gap between adjusted NHEA and MEPS, the overall growth rates in the
NHEA and MEPS from 2007 and 2012 are fairly consistent (23.6 percent and 19.5 percent,
respectively).

22
References
Agency for Healthcare Research and Quality. (2008). Design, Methods, and Field Results of the
Medical Expenditure Panel Survey Medical Provider Component (MEPS MPC)—2006
Calendar Year Data, Methodology Report No. 23. Retrieved January 29, 2018, from
https://meps.ahrq.gov/mepsweb/data_stats/Pub_ProdResults_Details.jsp?pt=Methodology+
Report&opt=2&id=882
Agency for Healthcare Research and Quality. (2014). 2012 Full Year Consolidated Data File
(HC-155) Medical Expenditure Panel Survey Household Component. Retrieved January
29, 2018, from http://www.meps.ahrq.gov
Bernard, D., Cowan, C., Selden, T., Cai, L., Catlin, A., & Heffler, S. (December, 2012).
Reconciling Medical Expenditure Estimates from the MEPS and NHEA, 2007. Medicare &
Medicaid Research Review, 2(4), E1–E20.
Bernard, D., Selden, T., & Pylypchuk, Y. (2015a). Aligning the MEPS to aggregate US
benchmarks in 2007. AHRQ Working Paper 15001.
https://meps.ahrq.gov/mepsweb/data_files/publications/workingpapers/wp_15001.pdf
Bernard, D., Selden, T., & Pylypchuk, Y. (2015b). Aligning the MEPS to aggregate US
benchmarks in 2010. AHRQ Working Paper 15002. 2015.
https://meps.ahrq.gov/mepsweb/data_files/publications/workingpapers/wp_15002.pdf
Bernard, D., Selden, T., & Pylypchuk, Y. (2016). The Distribution of Public Spending for Health
Care in the United States In Measuring and Modeling Health Care Costs, Edited by A.
Aizcorbe, C. Baker, E. Berndt, & D. Cutler. 2016.
23
Burwell, S.M. (2015). Setting Value-Based Payment Goals—HHS Efforts to Improve U.S.
Health Care. New England Journal of Medicine. 372;10, 897-899. DOI:
10.1056/NEJMp1500445
Centers for Medicare and Medicaid Services. (2016a). National Health Expenditure by service
and source of funds CY 1960-2016. Baltimore MD. Retrieved January 29, 2018, from
Centers for Medicare and Medicaid Services. https://www.cms.gov/Research-Statistics-
Data-and-Systems/Statistics-Trends-and-
Reports/NationalHealthExpendData/NationalHealthAccountsHistorical.html
Centers for Medicare and Medicaid Services. (2016b). National Health Expenditure Accounts:
Methodology Paper, 2016. Definitions, Sources and Methods. 2016. Baltimore MD.
Retrieved January 29, 2018, from https://www.cms.gov/Research-Statistics-Data-and-
Systems/Statistics-Trends-and-Reports/NationalHealthExpendData/Downloads/DSM-
16.pdf
Centers for Medicare and Medicaid Services. (2016c). Annual Report to Congress on the
Medicare and Medicaid Integrity Programs For fiscal Year 2015. Accessed on February 9,
2018 at https://www.cms.gov/About-CMS/Components/CPI/Downloads/2015-final-rtc-
06232017.pdf
Centers for Medicare & Medicaid Services. (2018). The Medicaid Analytic eXtract 2012.
Accessed on February 12, 2018 from https://www.medicaid.gov/medicaid/data-and-
systems/macbis/max/index.html

24
Cohen, S.B. (1997). Sample Design of the 1996 Medical Expenditure Panel Survey Household
Component. MEPS Methodology Report No. 2. Pub. No. 97-0027. Washington, DC:
Agency for Health Care Policy and Research. U.S. Government Printing Office.
Cohen, J., Cohen, S., & Banthin, J. (2009, July). The Medical Expenditure Panel Survey A
National Information Resource to Support Healthcare Cost Research and Inform Policy
and Practice. Medical Care, 47(7) Suppl 1, S44-S50.
Government Accountability Office. (2008, May). Medicaid. CMS Needs More Information on
the Billions of Dollars Spent on Supplemental Payments. GAO-08-614. Retrieved May 10,
2012, from http://www.gao.gov/assets/280/276050.pdf
Government Accountability Office. (2012, September). Health Care Fraud Types of Providers
Involved in Medicare, Medicaid, and the Children’s Health Insurance Program Cases.
GAO-12-820. Retrieved May 10, 2018, from https://www.gao.gov/assets/650/647849.pdf
Government Accountability Office. (2014, March). Medicare Fraud, Progress Made, but More
Action Needed to Address Medicare Fraud, Waste and Abuse. GAO-14-560T. Retrieved
February 26, 2018, from http://www.gao.gov/products/GAO-14-560T
Heffler, S., Nuccio, O., & Freeland, M. (2009, July). An Overview of the NHEA With
Implications for Cost Analysis Researchers. Medical Care, 47(7) Suppl 1, S37-S43.
Hill, S., Zuvekas, S.H., & Zodet, M.W. (2011). Implications of the Accuracy of MEPS
Prescription Drug Data for Health Services Research. Inquiry 48(3): 242-259.
Koch, T.G., Wendling, B.W., & Wilson, N.E. (2017). How vertical integration affects the quantity
and cost of care for Medicare beneficiaries. Journal of Health Economics. 52: 19-32.
25
Sing, M., Banthin, J.S., Selden, T.M., Cowan, C.A., & Keehan, S.P. (2006, Fall). Reconciling
Medical Expenditure Estimates from the MEPS and NHEA, 2002. Health Care Financing
Review, 28(1), 25-40.
Selden, T.M., Levit, K., Cohen, J.W., Zuvekas, S.H., Moeller, J.F., McKusick, D., & Arnett, R.
(2001, Fall). Reconciling Medical Expenditure Estimates from the MEPS and NHA, 1996.
Health Care Financing Review, 23(1), 161-178.
U.S. Census Bureau: Economic Census 2007, Health Care and Social Assistance. Industry and
Subject Series. U.S. Department of Commerce. Retrieved June 21, 2012, from
http://www.census.gov
Zuvekas, S., Olin, G. (2009a). Validating Household Reports of Health Care Use in the Medical
Expenditure Panel Survey. Health Services Research 44(5): 1679-1699.
Zuvekas, S., Olin, G. (2009b). Accuracy of Medicare Expenditures in the Medical Expenditure
Panel Survey. Inquiry 46(1): 92-108.
Zuvekas, S. (2017, October). Comparing MEPS Use and Expenditure Estimates for the Privately
Insured to Truven MarketScan and OptumLabsTM Claims Data, 2008-2013. Agency for
Healthcare Research and Quality Working Paper No. 17001. Retrieved February 9, 2018,
from https://meps.ahrq.gov/data_files/publications/workingpapers/wp_17001.pdf
Zuvekas, S., Biener, A., & Hicks, W. (2017, October). The Effect of Survey Enhancements on
the Quality of Reporting in the Medical Expenditure Panel Survey, 2008-2015.
26
Table 1 Unadjusted National Health Expenditure Accounts for Personal Health Care, 20121
Type of Service Out-of-Pocket
Private Health
Insurance Medicare Medicaid Defense Veterans
Affairs
Workers’ Compen-
sation
Other Federal
Other State
Private Non-
Patient
Type of Service Totals
Hospital Care $31.8 $337.8 $238.2 $153.3 $16.6 $34.3 $15.3 $4.6 $18.3 $52.4 $902.5
Physician and Clinical Services
52.0 249.2 128.1 50.2 13.8 6.6 13.2 6.0 1.2 36.9 557.1
Other Professional Services 19.4 27.9 16.9 5.2 0.0 0.0 1.5 0.3 0.7 4.6 76.4
Dental Services 45.7 51.6 0.4 9.9 1.6 0.1 0.0 0.2 0.2 0.1 109.7
Other Health, Residential, and Personal Care
5.5 10.1 5.1 76.5 0.0 0.9 0.0 6.3 17.7 17.0 139.1
Home Health Care 7.2 6.8 33.4 27.8 0.0 0.4 0.0 0.1 1.3 1.1 78.1
Nursing Care Facilities and Continuing Care Retirement Communities
39.2 11.6 34.0 47.7 0.0 4.4 0.0 0.0 3.3 7.2 147.4
Prescription Drugs 45.1 112.9 67.6 23.1 4.9 3.1 0.8 0.4 1.4 0.0 259.2
Durable Medical Equipment 22.0 7.3 8.1 5.5 0.0 0.0 0.6 0.1 0.1 0.0 43.7
Other Non-Durable Medical Products
50.5 0.0 3.3 0.0 0.0 0.0 0.0 0.0 0.0 0.0 53.7
Source of Payment Totals 318.3 815.2 534.9 399.1 36.8 49.7 31.3 18.0 44.3 119.2 2,366.9
1In billions of 2012 U.S. dollars. SOURCE: Centers for Medicare & Medicaid Services, Office of the Actuary: Data from the National Health Expenditure Accounts, 2017.
27
Table 2 Expenditure Estimates from the Medical Expenditure Panel Survey (MEPS), by Type of Service and Source of Payment: 20121
Type of Service Out-of Pocket
Private Health
Insurance Medicare Medicaid Defense Veterans’
Affairs
Workers’ Compens
ation Other Public Other
Sources
Type of Service Totals
Hospital 25.3 (2.9)
224.6 (15.2)
143.1 (9.1)
55.2 (5.7)
3.1 (0.6)
23.4 (12.7)
5.4 (1.6)
3.6 (0.7)
8.7 (1.0)
492.5 (23.3)
Physician 34.4 (1.3)
158.9 (6.6)
69.9 (4.1)
25.6 (1.9)
2.7 (0.4)
6.3 (0.7)
4.0 (0.8)
2.2 (0.3)
4.5 (0.6)
308.4 (10.1)
Other Providers 15.6 (0.9)
41.4 (2.3)
16.9 (1.7)
8.5 (1.3)
1.3 (0.3)
2.4 (0.6)
2.0 (0.4)
0.8 (0.1)
2.9 (0.6)
91.7 (4.2)
Dental 41.1 (2.2)
36.5 (1.8)
0.8 (0.1)
4.8 (0.5)
0.2 (0.05)
0.3 (0.1)
0.0 (0)
0.6 (0.2)
0.5 (0.1)
84.8 (3.6)
Home Health 4.9 (2.6)
3.8 (0.8)
23.9 (3.6)
21.1 (3.7)
0.0 (0)
0.3 (0.1)
0.0 (0)
0.9 (0.3)
0.0 (0)
54.9 (5.6)
Prescription Drugs 56.1 (2.1)
115.3 (8.0)
74.8 (4.3)
29.6 (3.1)
5.4 (1.0)
4.0 (0.8)
0.9 (0.2)
6.5 (3.1)
0.5 (0.2)
293.0 (12.6)
Other Medical Equipment
13.6 (1.0)
7.2 (1.2)
2.0 (0.3)
1.8 (0.3)
0.1 (0.03)
0.3 (0.1)
0.0 (0.02)
0.3 (0.1)
0.1 (0.01)
25.3 (1.8)
Source of Payment Totals
191.1 (7.0)
587.6 (25.2)
331.3 (16.1)
146.7 (10.0)
12.8 (1.7)
36.9 (13.0)
12.3 (2.1)
14.9 (3.3)
17.3 (1.5)
1,350.7 (43.4)
1In billions of 2012 U.S. dollars. Note: Standard errors are in parentheses. SOURCE: Agency for Healthcare Research and Quality, Center for Financing, Access, and Cost Trends: Data from the Medical Expenditure Panel Survey Household Component, 2012.
28
Table 3 Selected Adjustments to Align National Health Expenditure Accounts (NHEA) Service Categories with the Medical Expenditure Panel Survey
Amount Shifted1 Adjustment Initial NHEA Category Adjusted NHEA Category
$5.8 Hospital-Based Home Health Hospital Care Home Health
$4.1 Hospital-Based Pharmacy Sales Hospital Care Prescription Drugs
$1.3 Hospital-Based Personal Care Hospital Care Other Personal Care
$32.4 Outpatient Care Centers
Outpatient Mental Health ($9.9) Kidney Dialysis Providers ($8.5) Other Providers ($13.9)
Physician and Clinical Services Other Professional Services
$4.2 Prescription Drugs Physician and Clinical Services Prescription Drugs
$5.3 Durable Medical Equipment Physician and Clinical Services Other Medical Equipment
$35.2 Independently Billed Laboratory Physician and Clinical Services Other Professional Services
1In billions of 2012 U.S. dollars. SOURCES: Calculations based on the Medical Expenditure Panel Survey (2012), NHEA (2017), and other data sources, 2018.
29
Table 4 Subtractions from the National Health Expenditure Accounts (NHEA) for Consistency with the Medical Expenditure Panel Survey
Amount Subtracted1 Health Care Service or Type of Expenditure
Adjusting the Scope of Included Populations
Long-Term Care Facility Expenditures
$27.2 Hospital (Non-Community) $164.7 Nursing Home
$7.5 Hospital (Veterans Administration) $1.4 Physician (Veterans Administration) $4.4 Physicians in Long-Term Care Hospitals
Acute Care Expenditures of Institutionalized
$99.2 Acute Care Services for People in Institutions Expenditures for Active Duty Military and Foreign Visitors
$18.1 Active Duty Military Expenditures $3.1 Services for Foreign Visitors to U.S.
Adjusting for Patient Care Services Not Included in MEPS
$53.7 Non-Durable Medical products (e.g., Aspirin and Bandages) $121.4 Other Personal Health Care (e.g., Housekeeping Services)
$9.4 Outpatient Care Centers not in MEPS $3.6 Personal Care Expenditures in Medicaid Home Health
Adjusting for Expenditures not Tied to Specific Patient Events Non-Patient Care Revenues not included in MEPS
$95.3 Private Non-Patient Services (e.g., Gift Shop Revenue) $29.4 Disproportionate Share Hospital (DSH) and Graduate Medical Education $12.7 Public Grants $20.9 Medicaid Non-DSH Supplemental payments
$6.6 Non-Patient Revenues for Physician Services Paid by Other Federal and Other State
Previously Paid Expenditures
$7.9 Lab Services and Tests Paid by Other Providers
30
Total $686.6 Total Subtractions
Amounts Added
$33.0 Prescription Drug Rebates
$4.5 Replace NHEA Other Public Expenditures with MEPS Other Public Expenditures
$649.0 Net Subtraction
1In billions of 2012 U.S. dollars. SOURCES: Available on request from Didem Bernard, Ph.D., Agency for Healthcare Research and Quality, 5600 Fishers Lane, Rockville, MD 20857. Email: [email protected]
31
Table 5 National Health Expenditure Accounts (NHEA) Adjusted to be Consistent with the Medical Expenditure Panel Survey: 20121
Type of Service Out of Pocket
Private Health
Insurance Medicare Medicaid Defense Veterans’
Affairs Workers’
Compensation Other Public
Other Sources
Type of Service Totals
Hospital $24.0 $302.8 $180.3 $96.1 $4.1 $24.4 $14.6 $3.6 $8.7 $658.7
Physician 27.4 193.6 95.6 36.3 8.1 3.7 11.0 2.2 4.5 382.3
Other Providers 29.8 52.1 28.1 10.1 1.0 0.5 3.2 0.8 2.9 128.6
Dental 45.2 50.5 0.4 9.8 0.5 0.1 0.0 0.6 0.5 107.5
Home Health 9.2 9.5 33.0 25.3 0.1 0.6 0.1 0.9 0.0 78.8
Prescription Drugs 44.6 116.3 71.9 38.5 6.3 2.7 0.8 6.5 0.5 288.0
Other Medical Equipment 29.9 17.9 15.0 10.0 0.0 0.0 0.8 0.3 0.1 74.0
Source of Payment Totals 210.0 742.8 424.2 226.2 20.1 32.0 30.5 14.9 17.3 1,717.9
1In billions of 2012 U.S. dollars. SOURCE: Calculations based on the Medical Expenditure Panel Survey (2012), NHEA (2017), and other data sources, 2018.

32
Table 6 Differences Between Adjusted Medical Expenditure Panel Survey and Adjusted National Health Expenditure Accounts (NHEA): 20121
Type of Service Out of Pocket
Private Health
Insurance Medicare Medicaid Defense Veterans’
Affairs
Workers’ Compens
ation
Type of Service Totals
Differences as Percentage of
Adjusted NHEA
Hospital $1.3 -$78.2 -$37.2 -$40.9 -$1.0 -$1.0 -$9.3 -$166.2 -25.2
Physician 7.0 -34.7 -25.7 -10.6 -5.4 2.5 -7.0 -73.9 -19.3
Other Providers -14.2 -10.7 -11.3 -1.6 0.3 1.8 -1.2 -36.8 -28.7
Dental -4.0 -14.0 0.4 -5.0 -0.3 0.2 0.0 -22.7 -21.1
Home Health -4.4 -5.7 -9.1 -4.2 -0.1 -0.3 -0.1 -23.9 0.0
Prescription Drugs 11.5 -1.1 2.9 -9.0 -0.9 1.3 0.1 4.9 1.7
Other Medical Equipment -16.3 -10.7 -13.0 -8.2 0.1 0.3 -0.8 -48.6 -65.8
Source of Payment Totals -18.9 -155.1 -92.9 -79.5 -7.3 4.9 -18.2 -367.2 -21.4
Differences as Percentage of Adjusted NHEA
-9.0 -20.9 -21.9 -35.2 -36.4 15.3 -59.8 -21.4 -
1In billions of 2012 U.S. dollars. SOURCE: Calculations based on the Medical Expenditure Panel Survey (2012), NHEA (2017), and other data sources, 2018.