reconstruction of burial history, temperature, source...
TRANSCRIPT

Introduction
This paper presents results of 3D basin modelling of the burialhistory and the history of temperature, source rock maturity andtiming of hydrocarbon generation in the offshore Netherlandsfrom 320 Ma to present day. The study area is predominantly aplatform area which includes the Cleaverbank and Elbow Spitplatforms (CP and ESP respectively; Fig. 1). The platforms forman important gas producing area in the Dutch offshore. Gas isproduced from both Westphalian and Upper Rotliegendsandstones. Not much is known about the gas source and charge.It is anticipated that the reservoirs are charged from Westphaliancoal seams and possibly also from pre-Westphalian source rocks(Gerling et al., 1999; De Jager & Geluk, 2007).
As a result of the declining production from Rotliegend fields,Carboniferous reservoirs are gaining more attention. This isespecially the case towards the north of the study area whereRotliegend sandstones are pinching out. Understanding thematurity evolution of the Westphalian and pre-Westphaliansource rocks is thus essential for evaluating Carboniferous playsin the area. This might also shed more light on the occurrenceof locally high nitrogen contents in gas fields in the area. Thenitrogen content of natural gas accumulations in the studyarea varies from <10 Mol % to very high values in Carboniferousreservoirs (>80 Mol % in the D blocks). In this study, basinmodelling is used to reconstruct key elements and processesimportant for evaluating the petroleum systems. This includesburial history (sedimentation and erosion history), basal heatflow history as well as history of temperature and source rock
535Netherlands Journal of Geosciences — Geologie en Mijnbouw | 91 – 4 | 2012
Netherlands Journal of Geosciences — Geologie en Mijnbouw | 91 – 4 | 535 - 554 | 2012
Reconstruction of burial history, temperature, source rock maturity and hydrocarbon generation in the northwestern Dutch offshore
R. Abdul Fattah*, J.M. Verweij, N. Witmans & J.H. ten Veen
TNO - Geological Survey of the Netherlands, P.O. Box 80015, 3508 TA Utrecht, the Netherlands.
* Corresponding author. Email: [email protected]
Manuscript received: August 2011, accepted: January 2012
Abstract
3D basin modelling is used to investigate the history of maturation and hydrocarbon generation on the main platforms in the northwestern part
of the offshore area of the Netherlands. The study area covers the Cleaverbank and Elbow Spit Platforms. Recently compiled maps and data are used
to build the input geological model. An updated and refined palaeo water depth curve and newly refined sediment water interface temperatures
(SWIT) are used in the simulation. Basal heat flow is calculated using tectonic models. Two main source rock intervals are defined in the model,
Westphalian coal seams and pre-Westphalian shales, which include Namurian and Dinantian successions. The modelling shows that the pre-
Westphalian source rocks entered the hydrocarbon generation window in the Late Carboniferous. In the southern and central parts of the study
area, the Namurian started producing gas in the Permian. In the north, the Dinantian source rocks appear to be immature. Lower Westphalian
sediments started generating gas during the Upper Triassic. Gas generation from Westphalian coal seams increased during the Paleogene and
continues in present-day. This late generation of gas from Westphalian coal seams is a likely source for gas accumulations in the area.
Westphalian coals might have produced early nitrogen prior to or during the main gas generation occurrence in the Paleogene. Namurian shales
may be a source of late nitrogen after reaching maximum gas generating phase in the Triassic. Temperatures reached during the Mid Jurassic were
sufficiently high to allow the release of non-organic nitrogen from Namurian shales.
Keywords: Hydrocarbon generation modelling, Cleaverbank Platform, Elbow Spit Platform, Westphalian source rocks, Namurian shales, Heat flow
modelling, Gas generation, Dutch Offshore.

maturity. The focus is on Westphalian and pre-Westphalian(Namurian and Dinantian) source rocks. We used the results of the TNO mapping program (see Kombrink et al., this issue)including a new 3D stratigraphic model and petrophysicalproperties. New boundary conditions are applied such as newly
constructed basal heat flow models and updated and refinedpalaeo sediment water interface temperatures and palaeo waterdepths. Model calibration data, such as temperature and vitrinitereflectance are derived from an updated in-house database.
Netherlands Journal of Geosciences — Geologie en Mijnbouw | 91 – 4 | 2012536
Highs
Cretaceous or Paleogene on top of Triassic
Cretaceous or Paleogene on top of Zechstein
Platforms
Basins Strongly inverted
Mildly or not inverted
Boundary of structural element
Abbreviations
DHESHLBMLHTIJHWH
ADBAPCOPCPFPGPIPLTMNSHNHPOPPMCRFHSGPIJP
BFBDCGCNBLSBORBRVGSGTEGTBVBWNB
Dalfsen HighElbow Spit HighLondon-Brabant MassifLimburg HighTexel-IJsselmeer HighWinterton High
ZH Zeeland High
Anglo-Dutch BasinAmeland PlatformCentral Offshore PlatformCleaverbank PlatformFriesland PlatformGroningen PlatformIndefatigable PlatformLauwerszee TroughMid-North Sea HighNoord-Holland PlatformOosterhout PlatformPeel-Maasbommel ComplexRingkØbing Fyn HighSchill Grund PlatformIJmuiden Platform
Broad Fourteens BasinDutch Central GrabenCentral Netherlands BasinLower Saxony BasinOuter Rough BasinRoer Valley GrabenStep GrabenTail End GrabenTerschelling BasinVlieland BasinWest Netherlands Basin
Legend
Study areaFault
BFB
DCG
TEG
ORB
MNSH
ESH
ESP
CNB
LSB
RVG
SG
TB
VB
WNB
AP
CP
COP
FP
GP
LT
NHP
OP
SGP
RFH
IP
IP
ADB
IJP
DH
LBM
ZH
LH
PMC
TIJH
WH
?
Projection: ED 1950UTM Zone 31N
60 km
55°N
54°N
53°N
52°N
51°N
7°E6°E5°E4°E3°E
Fig. 1. Major structural elements in the Netherlands with the location of the study area. The outline of the study area is nearly the same as the outline of
the NCP-2D subarea (not shown).
Geological setting
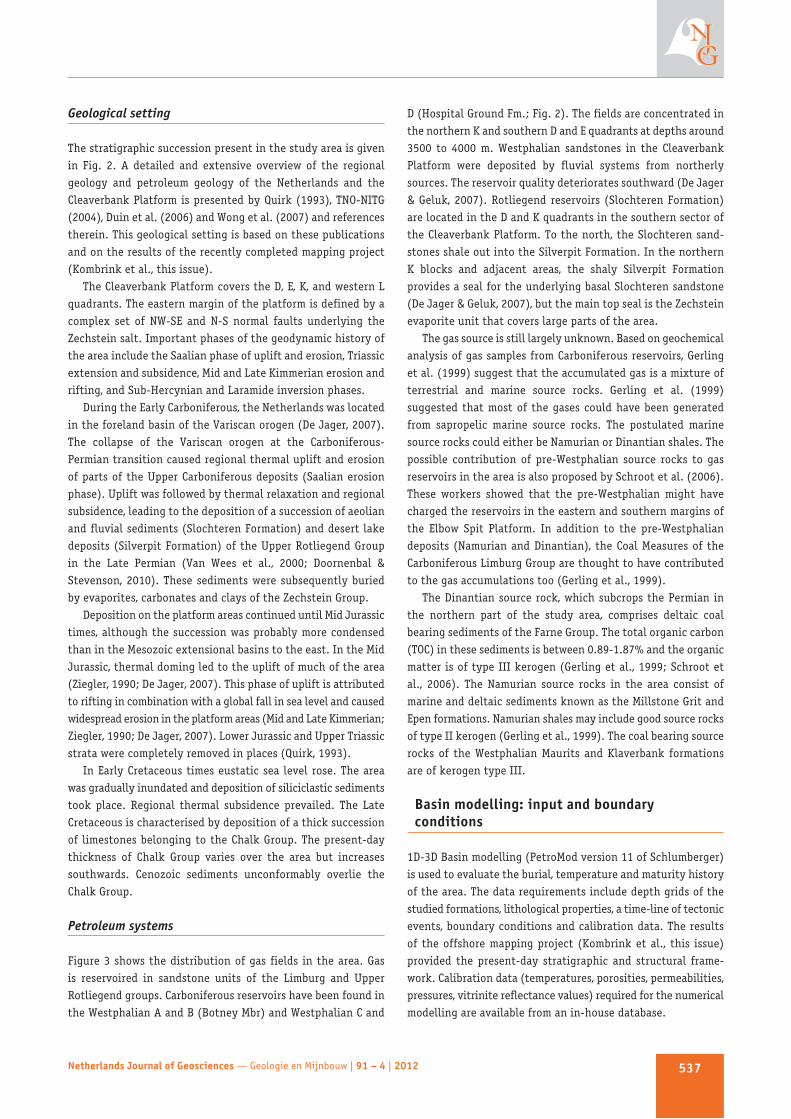
The stratigraphic succession present in the study area is givenin Fig. 2. A detailed and extensive overview of the regionalgeology and petroleum geology of the Netherlands and theCleaverbank Platform is presented by Quirk (1993), TNO-NITG(2004), Duin et al. (2006) and Wong et al. (2007) and referencestherein. This geological setting is based on these publicationsand on the results of the recently completed mapping project(Kombrink et al., this issue).
The Cleaverbank Platform covers the D, E, K, and western Lquadrants. The eastern margin of the platform is defined by acomplex set of NW-SE and N-S normal faults underlying theZechstein salt. Important phases of the geodynamic history ofthe area include the Saalian phase of uplift and erosion, Triassicextension and subsidence, Mid and Late Kimmerian erosion andrifting, and Sub-Hercynian and Laramide inversion phases.
During the Early Carboniferous, the Netherlands was locatedin the foreland basin of the Variscan orogen (De Jager, 2007).The collapse of the Variscan orogen at the Carboniferous-Permian transition caused regional thermal uplift and erosionof parts of the Upper Carboniferous deposits (Saalian erosionphase). Uplift was followed by thermal relaxation and regionalsubsidence, leading to the deposition of a succession of aeolianand fluvial sediments (Slochteren Formation) and desert lakedeposits (Silverpit Formation) of the Upper Rotliegend Groupin the Late Permian (Van Wees et al., 2000; Doornenbal &Stevenson, 2010). These sediments were subsequently buriedby evaporites, carbonates and clays of the Zechstein Group.
Deposition on the platform areas continued until Mid Jurassictimes, although the succession was probably more condensedthan in the Mesozoic extensional basins to the east. In the MidJurassic, thermal doming led to the uplift of much of the area(Ziegler, 1990; De Jager, 2007). This phase of uplift is attributedto rifting in combination with a global fall in sea level and causedwidespread erosion in the platform areas (Mid and Late Kimmerian;Ziegler, 1990; De Jager, 2007). Lower Jurassic and Upper Triassicstrata were completely removed in places (Quirk, 1993).
In Early Cretaceous times eustatic sea level rose. The areawas gradually inundated and deposition of siliciclastic sedimentstook place. Regional thermal subsidence prevailed. The LateCretaceous is characterised by deposition of a thick successionof limestones belonging to the Chalk Group. The present-daythickness of Chalk Group varies over the area but increasessouthwards. Cenozoic sediments unconformably overlie theChalk Group.
Petroleum systems
Figure 3 shows the distribution of gas fields in the area. Gas is reservoired in sandstone units of the Limburg and UpperRotliegend groups. Carboniferous reservoirs have been found inthe Westphalian A and B (Botney Mbr) and Westphalian C and
D (Hospital Ground Fm.; Fig. 2). The fields are concentrated inthe northern K and southern D and E quadrants at depths around3500 to 4000 m. Westphalian sandstones in the CleaverbankPlatform were deposited by fluvial systems from northerlysources. The reservoir quality deteriorates southward (De Jager& Geluk, 2007). Rotliegend reservoirs (Slochteren Formation)are located in the D and K quadrants in the southern sector ofthe Cleaverbank Platform. To the north, the Slochteren sand -stones shale out into the Silverpit Formation. In the northernK blocks and adjacent areas, the shaly Silverpit Formationprovides a seal for the underlying basal Slochteren sandstone(De Jager & Geluk, 2007), but the main top seal is the Zechsteinevaporite unit that covers large parts of the area.
The gas source is still largely unknown. Based on geochemicalanalysis of gas samples from Carboniferous reservoirs, Gerlinget al. (1999) suggest that the accumulated gas is a mixture ofterrestrial and marine source rocks. Gerling et al. (1999)suggested that most of the gases could have been generatedfrom sapropelic marine source rocks. The postulated marinesource rocks could either be Namurian or Dinantian shales. Thepossible contribution of pre-Westphalian source rocks to gasreservoirs in the area is also proposed by Schroot et al. (2006).These workers showed that the pre-Westphalian might havecharged the reservoirs in the eastern and southern margins ofthe Elbow Spit Platform. In addition to the pre-Westphaliandeposits (Namurian and Dinantian), the Coal Measures of theCarboniferous Limburg Group are thought to have contributedto the gas accumulations too (Gerling et al., 1999).
The Dinantian source rock, which subcrops the Permian inthe northern part of the study area, comprises deltaic coalbearing sediments of the Farne Group. The total organic carbon(TOC) in these sediments is between 0.89-1.87% and the organicmatter is of type III kerogen (Gerling et al., 1999; Schroot etal., 2006). The Namurian source rocks in the area consist ofmarine and deltaic sediments known as the Millstone Grit andEpen formations. Namurian shales may include good source rocksof type II kerogen (Gerling et al., 1999). The coal bearing sourcerocks of the Westphalian Maurits and Klaverbank formationsare of kerogen type III.
Basin modelling: input and boundary conditions
1D-3D Basin modelling (PetroMod version 11 of Schlumberger)is used to evaluate the burial, temperature and maturity historyof the area. The data requirements include depth grids of thestudied formations, lithological properties, a time-line of tectonicevents, boundary conditions and calibration data. The resultsof the offshore mapping project (Kombrink et al., this issue)provided the present-day stratigraphic and structural frame -work. Calibration data (temperatures, porosities, permeabilities,pressures, vitrinite reflectance values) required for the numericalmodelling are available from an in-house database.
Netherlands Journal of Geosciences — Geologie en Mijnbouw | 91 – 4 | 2012 537
Netherlands Journal of Geosciences — Geologie en Mijnbouw | 91 – 4 | 2012538
VariousNUNUOTNUBA
NMNMRF
NLNLFFNLLF
CKCKEKCKGRCKTX
KNKNGLKNNCKNNS
SGSL
AT
RNRNRORNSO
RBRBMRBSH
ZE
ROROCLROSL
DCDCHPDCDGDCCUDCCKBDCCKDCGM
CFCFYDCFEBCFCE
ORORTP
Quaternary formationsUpper North Sea GroupOosterhout FormationBreda Formation
Middle North Sea Grou pRupel Formation
Lower North Sea GroupDongen FormationLanden Formation
Chalk GroupEkofisk FormationOmmelanden FormationTexel Formation
Rijnland GroupHolland FormationVlieland Claystone FormationVlieland Sandstone Formation
Scruff GroupSchieland Group
Altena Group
Upper Germanic Trias Grou pRöt FormationSolling Formation
Lower Germanic Trias Grou pMain Buntsandstein SubgroupLower Buntsandstein Formation
Zechstein Group
Upper Rotliegend GroupSilverpit FormationSlochteren Formation
Limburg GroupStep Graben FormationHospital Ground FormationMaurits FormationBotney MemberKlaverbank FormationMillstone Grit Formation
Farne GroupYoredale FormationElleboog FormationCementstone Formation
Old Red GroupTayport Formation
Hydrocarbon source rock
Gas reservoir
Oil rese rvoir
Aquifer
Aquitard
Aquiclude
Aquifer/ aquitard
S and, s andstone
Shal e, cl aystone
Carbonate
Salt
Glauconite
Marl
Organic
Flint
Anhydrite
Chalk
Coal
Hiatus
Age-range of well basedon biostratigraphic analyses
K10-03
Legend
NUB A
NUOT
NUB A
NUOT
NUB A
NUOT
DCHPDCDGDCCU
DCCK
ROCL
ZEZE
KNN C
KNG L
CKG R
CKEK
KNN C
RB MRNSO+RNR O
Various
CFYD
CFEB
CFCE
ORTP
CFYD
CFEB
CFCE
ORTP
CFYD
CFEB
CFCE
ORTP
DCGM DCGM DCGM
ROSL + ROC LROSL + ROC L
ZE
CK TX CK TX CK TX
KNG L
KNN C
CKG R
CKEK CKEK
CKG R
NLLF
NLFFNLFF
NLLF
NLFF
NLLF
NMR F NMR F NMR F
Various Various
KNG L
DCCKB
KNN S
ROSL + ROCL
RBS H RBS H
SL
AT
SG
ZE-salt ZE-saltZE-salt
HolocenePleistocenePliocene
Miocene
GelasianPiacenzianZancleanMes sinian
Tortonian
SerravallianLanghian
Burdigalian
Aquitanian
Chattian
Neogene
Quaternary
Paleogene
Oligocene
Eocene
Paleocene
Cretace ous
Upper
Lower
Upper
Middle
Lower
Jurassi c
Triassi c
Permian
Carboni-ferous
Lower
Middle
Upper
Lopingian
Guadalupian
Cisuralian
Siles ian
Dinantian
Rupelian
Priabonian
Bar tonian
Lutetian
Ypresian
ThanetianSelandian
Danian
Maas trichtian
Campanian
Santonian
Coniacian
Turonian
Cenomanian
Albian
Aptian
Bar remian
Hauterivian
Valanginian
Ryazanian
Portlandian
K immeridgian
Oxfordian
CallovianBat honian
Ba jocian
Aalenian
Toarcian
Pliens bachian
Sinemurian
Hettangian
Rhaetian
Norian
Carnian
Ladinian
Anis ian
OlenekianInduanChanghsian
Wuchiapingian
Capitanian
WordianRoadian
Kungurian
Artinskian
Sakmarian
Asselian
Stephanian
Wes tphalian
Namurian
Visean
Tournais ian
System Seri es Sta gesAge
(Ma)0
5
10
15
20
25
30
35
40
45
50
55
60
65
70
75
80
85
90
95
10 0
10 5
11 0
11 5
12 0
12 5
13 0
13 5
14 0
14 5
15 0
15 5
16 0
16 5
17 0
17 5
18 0
18 5
19 0
19 5
20 0
20 5
21 0
21 5
22 0
22 5
23 0
23 5
24 0
24 5
25 0
25 5
26 0
26 5
27 0
27 5
28 0
28 5
29 0
29 5
30 0
30 5
31 0
31 5
32 0
32 5
33 0
33 5
34 0
34 5
35 0
35 5
Pyrenea n
S avian
Su bhercynian
L ara mide
Austr ian
L ate Kimm erian
Mid Kimm erian
Ear ly K immerian
Hardegse n
S aa lian
Asturian
Su detian
ENI
PLA
NA
CSI
RA
V
0
5
10
15
20
25
30
35
40
45
50
55
60
65
70
75
80
85
90
95
10 0
10 5
11 0
11 5
12 0
12 5
13 0
13 5
14 0
14 5
15 0
15 5
16 0
16 5
17 0
17 5
18 0
18 5
19 0
19 5
20 0
20 5
21 0
21 5
22 0
22 5
23 0
23 5
24 0
24 5
25 0
25 5
26 0
26 5
27 0
27 5
28 0
28 5
29 0
29 5
30 0
30 5
31 0
31 5
32 0
32 5
33 0
33 5
34 0
34 5
35 0
35 5
D
Cleaverbank PlatformSilverpit PlatformNorth South
western marginDutch Central Graben
and Step GrabenHydrostratigraphy
LithologyTectonic
phase Oro
geny
E18-02
K10-03
D15-03
K10-03
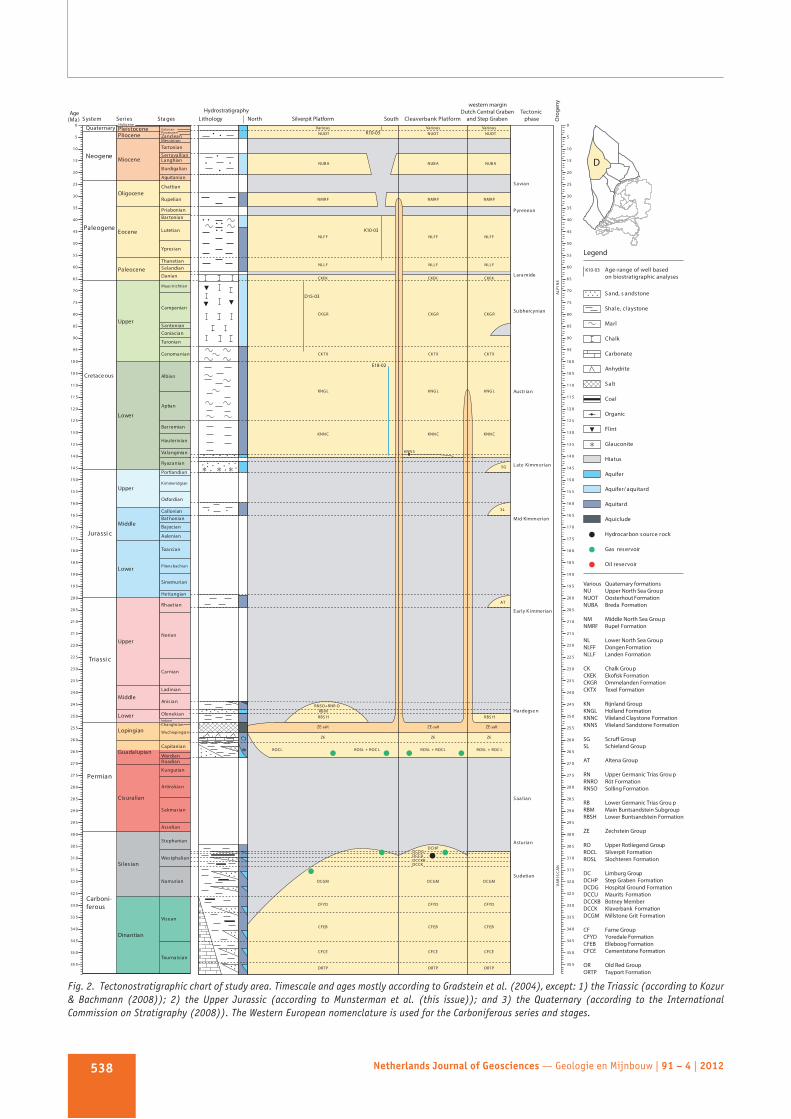
Fig. 2. Tectonostratigraphic chart of study area. Timescale and ages mostly according to Gradstein et al. (2004), except: 1) the Triassic (according to Kozur& Bachmann (2008)); 2) the Upper Jurassic (according to Munsterman et al. (this issue)); and 3) the Quaternary (according to the InternationalCommission on Stratigraphy (2008)). The Western European nomenclature is used for the Carboniferous series and stages.

Geological model
The initial 3D stratigraphic model consists of 9 stratigraphicgroups. These include the Upper North Sea, Lower & MiddleNorth Sea, Chalk, Rijnland, Schieland and Scruff, Altena, Upper
Germanic Trias, Lower Germanic Trias and Zechstein groups.New maps are created and included in the model to achieve therequired level of detail. A Rotliegend thickness map is createdand added to the model by interpolating between present-daythicknesses from wells over the whole area. The model isextended below the Rotliegend Group by adding Carboniferouslayers. The Carboniferous section comprises five layers, theStep Graben, Hospital Ground, Maurits, Klaverbank and Pre-Westphalian. The Pre-Westphalian layer in the model consistsof both the Namurian and Dinantian. A basement of 2000 mthickness is added at the base of the succession. The model isrefined with additional maps for the Upper North Sea Groupwhich is subdivided into 3 new layers; Quaternary, Pliocene andMiocene. The final refined and extended 3D model includes 17layers plus basement (Table 1). The assigned lithology for each ofthe layers is based on the generalised description of the lithologyas described by Van Adrichem Boogaert & Kouwe (1993). Faciesvariations are taken into account for three layers; theRotliegend, Klaverbank and Namurian formations. Facies mapsfor these formations are based on well observations (Table 1).
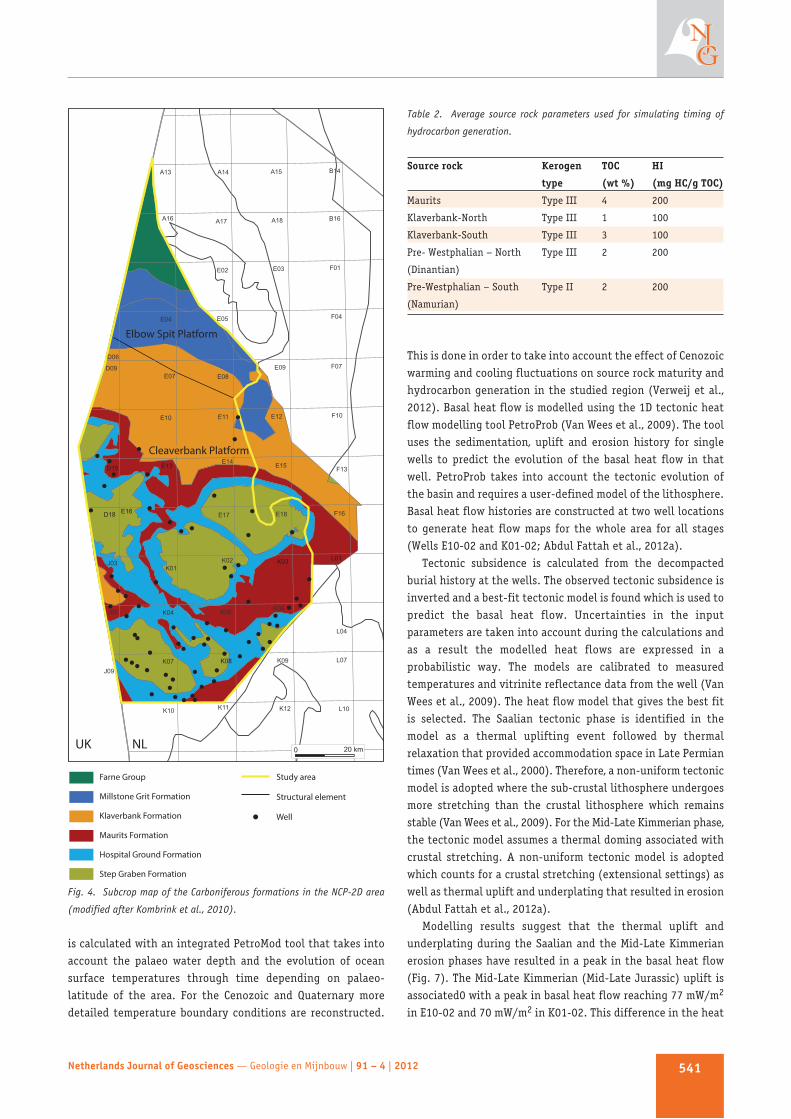
The Carboniferous section in the model is constructed basedon a subcrop map of the Carboniferous formations (Fig. 4;Kombrink et al., 2010). The subcrop map is based on well andbiostratigraphic data (Kombrink et al., 2010). In addition, welldata and stratigraphical and palaeogeographical concepts havebeen used to reconstruct the depositional thicknesses of theformations. Depositional thicknesses of 300, 200 and 200 m are given to the Step Graben, Hospital Ground and Mauritsformations respectively. The Klaverbank Formation is given adepositional thickness that varies between 1500 m in the southto 1000 m in the north of the area.
The subcrop map shows that in the northern part of the studyarea the Namurian (Millstone Grit Formation) and Westphaliansuccessions are absent. The Dinantian Farne Group subcropsdirectly below the Upper Rotliegend Group (Fig. 4). The Namurianand the Dinantian are given depositional thicknesses of 500 mand 1000 m, respectively. The thicknesses are speculative andare mainly based on regional data and palaeogeographicalconcepts (for example Gerling et al., 1999; Kombrink, 2008). Bothlayers are combined in the model in a single layer named thePre-Westphalian with a total depositional thickness of 1500 m.Two lithofacies are assigned to the Pre-Westphalian layer inthe model. The Pre-Westphalian layer is assigned a deep marinefacies in the south which reflects the Namurian facies. In thenorthern part of the study area, the Pre-Westphalian is assigneda fluvial and deltaic facies (cf. Gerling et al., 1999; Schroot etal., 2006; Kombrink, 2008).
Two source rock types are assigned to reflect the two facies.The northern part of the layer, where the Namurian is eroded,is defined as source rock of type III (Gerling et al., 1999; Schrootet al., 2006). The rest of the layer further south is defined assource rock type II which represents the deep-water Namurianfacies (Gerling et al., 1999; Schroot et al., 2006). No information
Netherlands Journal of Geosciences — Geologie en Mijnbouw | 91 – 4 | 2012 539
Study areaGas field
Gas & Oil field
Oil field
High
Platform
Basin
Salt dome
Model cross section
Well used in this study
Well used for model extraction
E02-02
E10-02D15-03
D12 4-0
K04-03
K03 2K01 2 -0-0
L10
L07
L04
L01
K12K11K10
K09K08K07
K06K05K04
K03K02K01
J09
J06
J03
F16
F13
F10
F07
F04
F01
E18E17E16
E15E14E13
E12E11E10
E09E08E07
E05E04
E03E02
D18
D15
D09
D06
B16
B14
A18A17A16
A15A14A13
UK NL 0 20 km
Fig. 3. Map of the study area showing the distribution of major gas fields
and the major structural units. The wells used in the study are indicated.
Wells used for 1D extractions used for burial history, temperature and
maturity analysis are given the red colour.
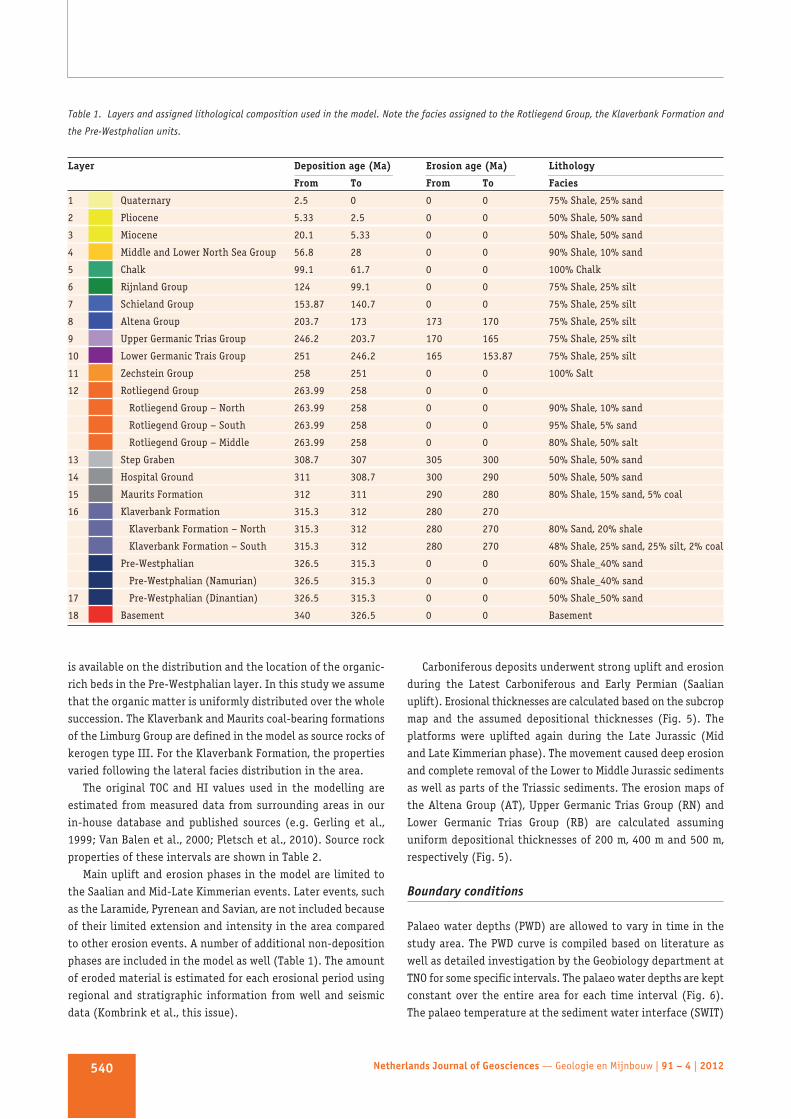
is available on the distribution and the location of the organic-rich beds in the Pre-Westphalian layer. In this study we assumethat the organic matter is uniformly distributed over the wholesuccession. The Klaverbank and Maurits coal-bearing formationsof the Limburg Group are defined in the model as source rocks ofkerogen type III. For the Klaverbank Formation, the propertiesvaried following the lateral facies distribution in the area.
The original TOC and HI values used in the modelling areestimated from measured data from surrounding areas in ourin-house database and published sources (e.g. Gerling et al.,1999; Van Balen et al., 2000; Pletsch et al., 2010). Source rockproperties of these intervals are shown in Table 2.
Main uplift and erosion phases in the model are limited tothe Saalian and Mid-Late Kimmerian events. Later events, suchas the Laramide, Pyrenean and Savian, are not included becauseof their limited extension and intensity in the area comparedto other erosion events. A number of additional non-depositionphases are included in the model as well (Table 1). The amountof eroded material is estimated for each erosional period usingregional and stratigraphic information from well and seismicdata (Kombrink et al., this issue).
Carboniferous deposits underwent strong uplift and erosionduring the Latest Carboniferous and Early Permian (Saalianuplift). Erosional thicknesses are calculated based on the subcropmap and the assumed depositional thicknesses (Fig. 5). Theplatforms were uplifted again during the Late Jurassic (Midand Late Kimmerian phase). The movement caused deep erosionand complete removal of the Lower to Middle Jurassic sedimentsas well as parts of the Triassic sediments. The erosion maps ofthe Altena Group (AT), Upper Germanic Trias Group (RN) andLower Germanic Trias Group (RB) are calculated assuminguniform depositional thicknesses of 200 m, 400 m and 500 m,respectively (Fig. 5).
Boundary conditions
Palaeo water depths (PWD) are allowed to vary in time in thestudy area. The PWD curve is compiled based on literature aswell as detailed investigation by the Geobiology department atTNO for some specific intervals. The palaeo water depths are keptconstant over the entire area for each time interval (Fig. 6).The palaeo temperature at the sediment water interface (SWIT)
Netherlands Journal of Geosciences — Geologie en Mijnbouw | 91 – 4 | 2012540
Table 1. Layers and assigned lithological composition used in the model. Note the facies assigned to the Rotliegend Group, the Klaverbank Formation and
the Pre-Westphalian units.
Layer Deposition age (Ma) Erosion age (Ma) Lithology
From To From To Facies
1 Quaternary 2.5 0 0 0 75% Shale, 25% sand
2 Pliocene 5.33 2.5 0 0 50% Shale, 50% sand
3 Miocene 20.1 5.33 0 0 50% Shale, 50% sand
4 Middle and Lower North Sea Group 56.8 28 0 0 90% Shale, 10% sand
5 Chalk 99.1 61.7 0 0 100% Chalk
6 Rijnland Group 124 99.1 0 0 75% Shale, 25% silt
7 Schieland Group 153.87 140.7 0 0 75% Shale, 25% silt
8 Altena Group 203.7 173 173 170 75% Shale, 25% silt
9 Upper Germanic Trias Group 246.2 203.7 170 165 75% Shale, 25% silt
10 Lower Germanic Trais Group 251 246.2 165 153.87 75% Shale, 25% silt
11 Zechstein Group 258 251 0 0 100% Salt
12 Rotliegend Group 263.99 258 0 0
Rotliegend Group – North 263.99 258 0 0 90% Shale, 10% sand
Rotliegend Group – South 263.99 258 0 0 95% Shale, 5% sand
Rotliegend Group – Middle 263.99 258 0 0 80% Shale, 50% salt
13 Step Graben 308.7 307 305 300 50% Shale, 50% sand
14 Hospital Ground 311 308.7 300 290 50% Shale, 50% sand
15 Maurits Formation 312 311 290 280 80% Shale, 15% sand, 5% coal
16 Klaverbank Formation 315.3 312 280 270
Klaverbank Formation – North 315.3 312 280 270 80% Sand, 20% shale
Klaverbank Formation – South 315.3 312 280 270 48% Shale, 25% sand, 25% silt, 2% coal
Pre-Westphalian 326.5 315.3 0 0 60% Shale_40% sand
Pre-Westphalian (Namurian) 326.5 315.3 0 0 60% Shale_40% sand
17 Pre-Westphalian (Dinantian) 326.5 315.3 0 0 50% Shale_50% sand
18 Basement 340 326.5 0 0 Basement
is calculated with an integrated PetroMod tool that takes intoaccount the palaeo water depth and the evolution of oceansurface temperatures through time depending on palaeo -latitude of the area. For the Cenozoic and Quaternary moredetailed temperature boundary conditions are reconstructed.
This is done in order to take into account the effect of Cenozoicwarming and cooling fluctuations on source rock maturity andhydrocarbon generation in the studied region (Verweij et al.,2012). Basal heat flow is modelled using the 1D tectonic heatflow modelling tool PetroProb (Van Wees et al., 2009). The tooluses the sedimentation, uplift and erosion history for singlewells to predict the evolution of the basal heat flow in thatwell. PetroProb takes into account the tectonic evolution ofthe basin and requires a user-defined model of the lithosphere.Basal heat flow histories are constructed at two well locationsto generate heat flow maps for the whole area for all stages(Wells E10-02 and K01-02; Abdul Fattah et al., 2012a).
Tectonic subsidence is calculated from the decompactedburial history at the wells. The observed tectonic subsidence isinverted and a best-fit tectonic model is found which is used topredict the basal heat flow. Uncertainties in the inputparameters are taken into account during the calculations andas a result the modelled heat flows are expressed in aprobabilistic way. The models are calibrated to measuredtemperatures and vitrinite reflectance data from the well (VanWees et al., 2009). The heat flow model that gives the best fitis selected. The Saalian tectonic phase is identified in themodel as a thermal uplifting event followed by thermalrelaxation that provided accommodation space in Late Permiantimes (Van Wees et al., 2000). Therefore, a non-uniform tectonicmodel is adopted where the sub-crustal lithosphere undergoesmore stretching than the crustal lithosphere which remainsstable (Van Wees et al., 2009). For the Mid-Late Kimmerian phase,the tectonic model assumes a thermal doming associated withcrustal stretching. A non-uniform tectonic model is adoptedwhich counts for a crustal stretching (extensional settings) aswell as thermal uplift and underplating that resulted in erosion(Abdul Fattah et al., 2012a).
Modelling results suggest that the thermal uplift andunderplating during the Saalian and the Mid-Late Kimmerianerosion phases have resulted in a peak in the basal heat flow(Fig. 7). The Mid-Late Kimmerian (Mid-Late Jurassic) uplift isassociated0 with a peak in basal heat flow reaching 77 mW/m2
in E10-02 and 70 mW/m2 in K01-02. This difference in the heat
Netherlands Journal of Geosciences — Geologie en Mijnbouw | 91 – 4 | 2012 541
Study area
Hospital Ground Formation
Step Graben Formation
Farne Group
Millstone Grit Formation
Klaverbank Formation
Maurits Formation
Structural element
Well
L10
L07
L04
L01
K12K11K10
K09K08K07
K06K05K04
K03K02K01
J09
J06
J03
F16
F13
F10
F07
F04
F01
E18E17E16
E15E14
E13
E12E11E10
E09
E08E07
E05E04
E03E02
D18
D15
D09
D06
B16
B14
A18A17A16
A15A14A13
UK NL 0 20 km
Elbow Spit Platform
Cleaverbank Platform
Fig. 4. Subcrop map of the Carboniferous formations in the NCP-2D area
(modified after Kombrink et al., 2010).
Table 2. Average source rock parameters used for simulating timing of
hydrocarbon generation.
Source rock Kerogen TOC HI
type (wt %) (mg HC/g TOC)
Maurits Type III 4 200
Klaverbank-North Type III 1 100
Klaverbank-South Type III 3 100
Pre- Westphalian – North Type III 2 200
(Dinantian)
Pre-Westphalian – South Type II 2 200
(Namurian)

flow can be attributed to differences in tectonic history, burialevolution and stratigraphic succession in both wells (AbdulFattah et al., 2012a). The present-day basal heat flow is at itsminimum, reaching values of 55-60 mW/m2 with slightlyhigher values in the Cleaverbank Platform (well E10-02).
Default set-ups, assumptions and calibration
Default simulation set-ups concern the lithologies of the differ -ent formations and their associated properties. These proper -ties include thermal conductivity, radiogenic heat production,heat capacity as well as mechanical compaction equations andporosity-permeability relations. Thermal conductivity values
are defined based on a pre-defined thermal conductivity model(the Sekiguchi Model; PetroMod 11). The radiogenic heatproduction is calculated for the rock matrices for each of thelithologies. The compaction model is based on the HydrostaticAthy’s law Model where the porosity versus depth curve is atheo retical curve that assumes a hydrostatic pressure and auni form lithological column. Measured porosities and permeabili -ties provided the basis for selecting the proper compaction andporosity-permeability relations.
Temperature and vitrinite reflectance data are used tocalibrate the 1D and later the 3D input model. The maturity modelling is based on the Sweeney & Burnham (1990) kineticmodel. The calculations of the transformation ratios for the
Netherlands Journal of Geosciences — Geologie en Mijnbouw | 91 – 4 | 2012542
UK NL 0 20 km
Elbow Spit Platform
Cleaverbank Platform
0-50 m
1000
-115
0 m
Klaverbank Fm
UK NL 0 20 km
Elbow Spit Platform
Cleaverbank Platform
0-25 m
150-200 m
Maurits Fm
UK NL 0 20 km
Elbow Spit Platform
Cleaverbank Platform
250-300 m
0-50 m
Hospital Ground Fm
UK NL 0 20 km
Elbow Spit Platform
Cleaverbank Platform
450-500 m
0-50 m
Lower Germanic Trias Gp
UK NL 0 20 km
Elbow Spit Platform
Cleaverbank Platform
350-400 m
0-50 m
Upper Germanic Trias Gp
UK NL 0 20 km
Elbow Spit Platform
Cleaverbank Platform
0 m150-200 m
Altena Gp
UK NL 0 20 km
Elbow Spit Platform
Cleaverbank Platform
0-50 m
450-
500
m
Pre-Westphalian
Dinantian facies
Namurian facies
UK NL 0 20 km
Elbow Spit Platform
Cleaverbank Platform
250-300 m
0-50 m
Step Graben Fm
Fig. 5. Erosion maps of the main eroded units in the study area as introduced to the model.

assigned source rock intervals are based on the Pepper & Corvi(1995) TII and TIII hydrocarbon generation kinetics. The imple -mented generation kinetics depend on the facies assigned. ThePepper & Corvi (1995) TII kinetic model is used for the southernand central part of the Pre-Westphalian layer (the Namurianfacies). The Pepper & Corvi (1995) TIII is used for the Westphalianformations (Maurits and Klaverbank) and the northern part ofthe Pre-Westphalian layer (Dinantian).
The initial geological model does not include faults andassumes open fluid flow boundaries. The 3D simulations oftemperature and maturity are run assuming hydrostatic condi -tions and only conductive heat flow is assumed in the model.Salt movement and, as a consequence, the thermal effectrelated to it are not considered in the modelling. The present-day thickness distribution of the Zechstein Formation in theplatform area does not indicate strong salt tectonics.
Results
Burial history
The burial history as well as temperature and maturity historyare discussed using representative 1D extractions of the 3Dmodel at the location of three wells; E10-02 and K01-02 locatedon the Cleaverbank Platform, and well E02-02 located on theElbow Spit Platform (Fig. 3).
The burial history (Fig. 8) shows two phases of rapid subsi -dence and sedimentation in the two platforms; during the LateCarboniferous and Late Permian-Early Triassic (~270-245 Ma).Two uplift phases include the Early Permian and Mid-Late Jurassic
Netherlands Journal of Geosciences — Geologie en Mijnbouw | 91 – 4 | 2012 543
0
100
200
300 200 100 0
Dep
th (m
)
Time (Ma)
300 200 100 0
0
20
10
0
Tem
pera
ture
(ºC)
Time (Ma)
CARBONIFEROUS PERMIAN TRIASSIC JURASSIC CRETACEOUS PALEOGENE NEOGENEMIOCENEOLI.PAL.UPPER CRETACEOUSLOWER CRETACEOUSU. JUR.M. JUR.L. JURASSICUPPER TRAISSICM. TRIAS.LLOP.GUA.CISURALIANPENN.MISSISSIPPIAN EOCENE
CARBONIFEROUS PERMIAN TRIASSIC JURASSIC CRETACEOUS PALEOGENE NEOGENEMIOCENEOLI.PAL.UPPER CRETACEOUSLOWER CRETACEOUSU. JUR.M. JUR.L. JURASSICUPPER TRAISSICM. TRIAS.LLOP.GUA.CISURALIANPENN.MISSISSIPPIAN EOCENE
Fig. 6. Detailed Palaeo Water Depth (PWD) curve (top) and detailed Palaeo Sediment Water Interface Temperature (SWIT) curve (bottom).
330 280 230 180 130 80 30
100
80
75
70
65
60
55
300
500
700
900
1100
1300
Age (Ma)
Heat flowTectonic modelTectonic subsidenceUplift and erosion phase
Dep
th (m
)
Hea
t flow
(mW
/m2 )
330 280 230 180 130 80 30
100
75
70
65
60
55
50
300
500
700
900
1100
1300
Age (Ma)
Dep
th (m
)
Hea
t flow
(mW
/m2 )
Fig. 7. Basement heat flow modelled in PetroProb and calibrated with
measured data at well E10-02 (top) and well K01-02 (bottom). Both observed
and modelled tectonic subsidence are also shown together with the main
two uplift and erosion phases. For the location of the wells see Fig. 3.
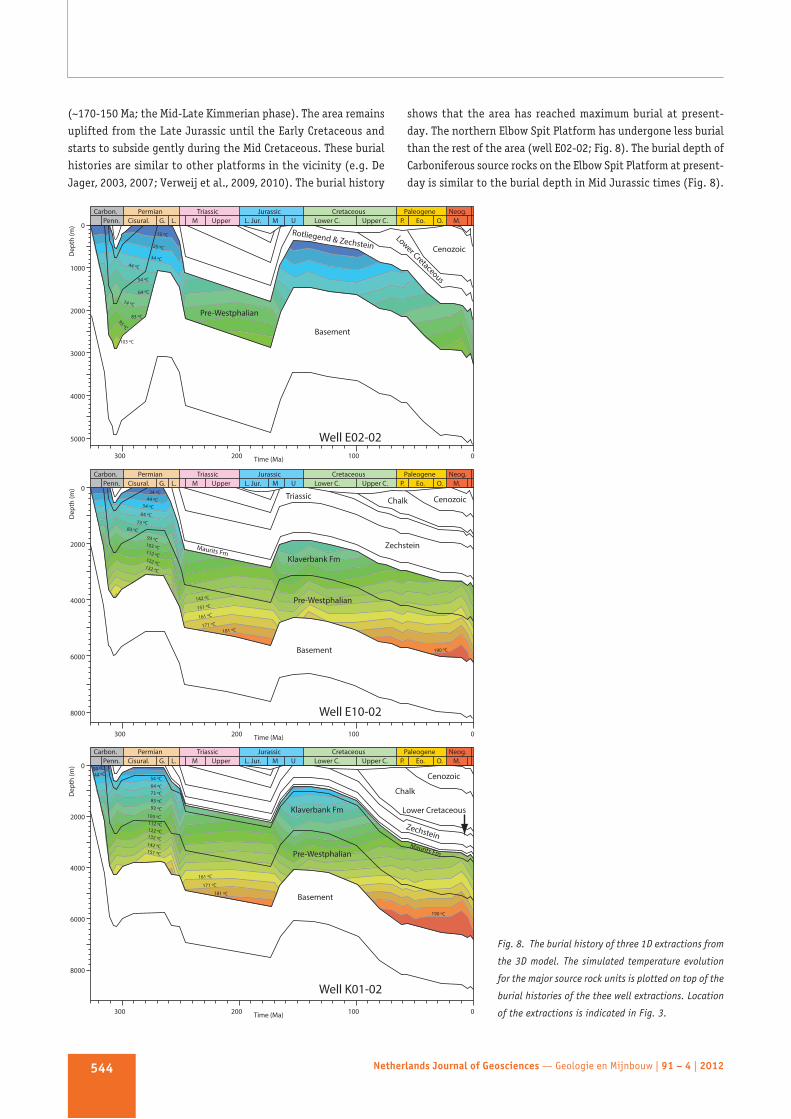
(~170-150 Ma; the Mid-Late Kimmerian phase). The area remainsuplifted from the Late Jurassic until the Early Cretaceous andstarts to subside gently during the Mid Cretaceous. These burialhistories are similar to other platforms in the vicinity (e.g. DeJager, 2003, 2007; Verweij et al., 2009, 2010). The burial history
shows that the area has reached maximum burial at present-day. The northern Elbow Spit Platform has under gone less burialthan the rest of the area (well E02-02; Fig. 8). The burial depth ofCarboniferous source rocks on the Elbow Spit Platform at present-day is similar to the burial depth in Mid Jurassic times (Fig. 8).
Netherlands Journal of Geosciences — Geologie en Mijnbouw | 91 – 4 | 2012544
300
0
1000
2000
3000
4000
5000
200 100 0
Dep
th (m
)
Time (Ma)
15 ºC
25 ºC
34 ºC44 ºC
54 ºC
64 ºC
74 ºC
83 ºC
93 ºC
103 ºC
Well E02-02
Basement
Pre-Westphalian
Rotliegend & ZechsteinLower Cretaceous
Lower Cretaceous
Cenozoic
300
0
2000
4000
6000
8000
200 100 0
Dep
th (m
)
Time (Ma)
34 ºC44 ºC
54 ºC64 ºC
73 ºC83 ºC
93 ºC103 ºC112 ºC122 ºC132 ºC
142 ºC
151 ºC
161 ºC
171 ºC181 ºC
34 ºC44 ºC
54 ºC64 ºC73 ºC83 ºC93 ºC
103 ºC112 ºC122 ºC132 ºC142 ºC151 ºC
161 ºC
171 ºC
181 ºC
190 ºC
190 ºC
Well E10-02
Basement
Pre-Westphalian
Klaverbank Fm
Zechstein
Triassic
Maurits Fm
CenozoicChalk
Basement
Pre-Westphalian
Klaverbank Fm
ZechsteinMaurits Fm
Cenozoic
Chalk
300
0
2000
4000
6000
8000
200 100 0
Dep
th (m
)
Time (Ma)
Well K01-02
Carbon. Permian Triassic Jurassic Cretaceous Paleogene Neog.M.O.P.Upper C.Lower C.UML. Jur.UpperM L.G.Cisural.Penn. Eo.
Carbon. Permian Triassic Jurassic Cretaceous Paleogene Neog.M.O.P.Upper C.Lower C.UML. Jur.UpperM L.G.Cisural.Penn. Eo.
Carbon. Permian Triassic Jurassic Cretaceous Paleogene Neog.M.O.P.Upper C.Lower C.UML. Jur.UpperM L.G.Cisural.Penn. Eo.
Fig. 8. The burial history of three 1D extractions from
the 3D model. The simulated temperature evolution
for the major source rock units is plotted on top of the
burial histories of the thee well extractions. Location
of the extractions is indicated in Fig. 3.

Thermal history
Modelled present-day temperatures in wells E10-02 and K01-02show a good fit with measured temperatures (Fig. 9a). Figure 8shows the modelled temperature evolution of the source rockintervals for the selected wells. The simulation results showlower temperatures in the northern part of the study area (wellE02-02) compared to wells K01-02 and E10-02 (Fig. 8). Thesimulated temperature history shows two major heating peaksat wells E10-02 and K01-02. The first maximum temperature inthe Carboniferous units was reached during the Early Jurassic(prior to the Kimmerian uplift phase). The Pre-Westphaliansuccession reached a temperature up to 200 °C in deeper partsand the temperature of the overlying Carboniferous Klaverbankand Maurits Formations ranged between 120 °C to 160 °C. Duringthe Late Jurassic and Early Cretaceous, the temperatures of theformations decreased as a result of Kimmerian uplift. The secondhigh temperature phase is reached at present-day in the entireplatform area. The present-day temperatures in the Namurianpeak around 200 °C while they vary between 130 °C to 170 °C inthe Klaverbank and Maurits Formations (Fig. 8). In well E02-02,the temperature of the Pre-Westphalian layer varied between110 °C to 130 °C during the Late Jurassic-Early Cretaceous andhas similar values at present-day. The simulation results indicatean additional temperature peak during the Late Carboniferous.The layer reached a temperature of around 130 °C prior toSaalian uplift and erosion (Fig. 8).
Maturation history
Modelled present-day maturity (vitrinite reflectance) at thelocation of the wells is presented in Fig. 9b. The modelled maturityis in a good agreement with measured values. Modelled maturity
history (vitrinite reflectance) and the hydrocarbon zones ofCarboniferous source rocks at the location of the three 1Dextractions are shown in Fig. 10. The maturity history indicatesthat the deepest parts of the assigned source rock units enteredthe hydrocarbon generation ranges already in the Carboniferous.The maturity increased during the Triassic and reached a peak inEarly Jurassic and prior to the Late Kimmerian uplift (~170 Ma).The central part of the Cleaverbank Platform (wells K01-02 andE10-02) reached its maximum maturity at present-day. ThePre-Westphalian in this part of the study area reached theovermature state already in the Late Triassic (Fig. 10).
Hydrocarbon generation history
The modelled hydrocarbon zones are shown in Fig. 10. Despitethe increase in maturity, the Pre-Westphalian layer did notenter the hydrocarbon generation zone in the northern part ofthe Elbow Spit Platform (well E02-02). In other parts of thestudy area, the Pre-Westphalian started hydrocarbon generationduring the Late Carboniferous. While upper parts of the layerwere generating oil, the lower parts were generating gas. In thePermian, the deepest parts of the Pre-Westphalian were alreadyovermature. By the Triassic, only the upper parts of the Pre-Westphalian in the majority of the platform area were able toproduce gas. The Pre-Westphalian reached the overmature statein the end of the Triassic (Fig. 10). Maturity history shows thatthe deeper parts of the Klaverbank Formation started oilgeneration in the Triassic. Most of the layer entered the gaswindow at the onset of the Paleogene (Fig. 10). The modelindicates that the Maurits Formation started hydrocarbongeneration in the Paleogene (Fig. 10).
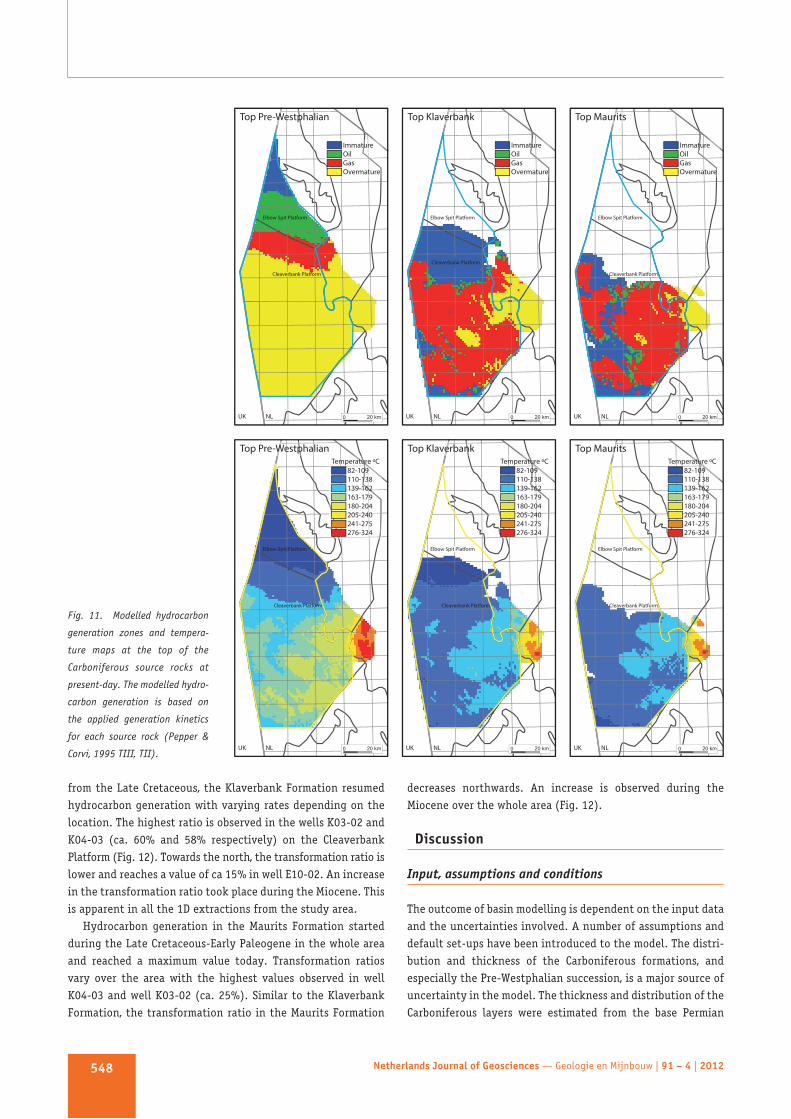
A number of variations in the degree of present-daymaturity are observed over the study area (Fig. 11). While the
Netherlands Journal of Geosciences — Geologie en Mijnbouw | 91 – 4 | 2012 545
a.
Fig. 9a. Modelled present-day temperatures.
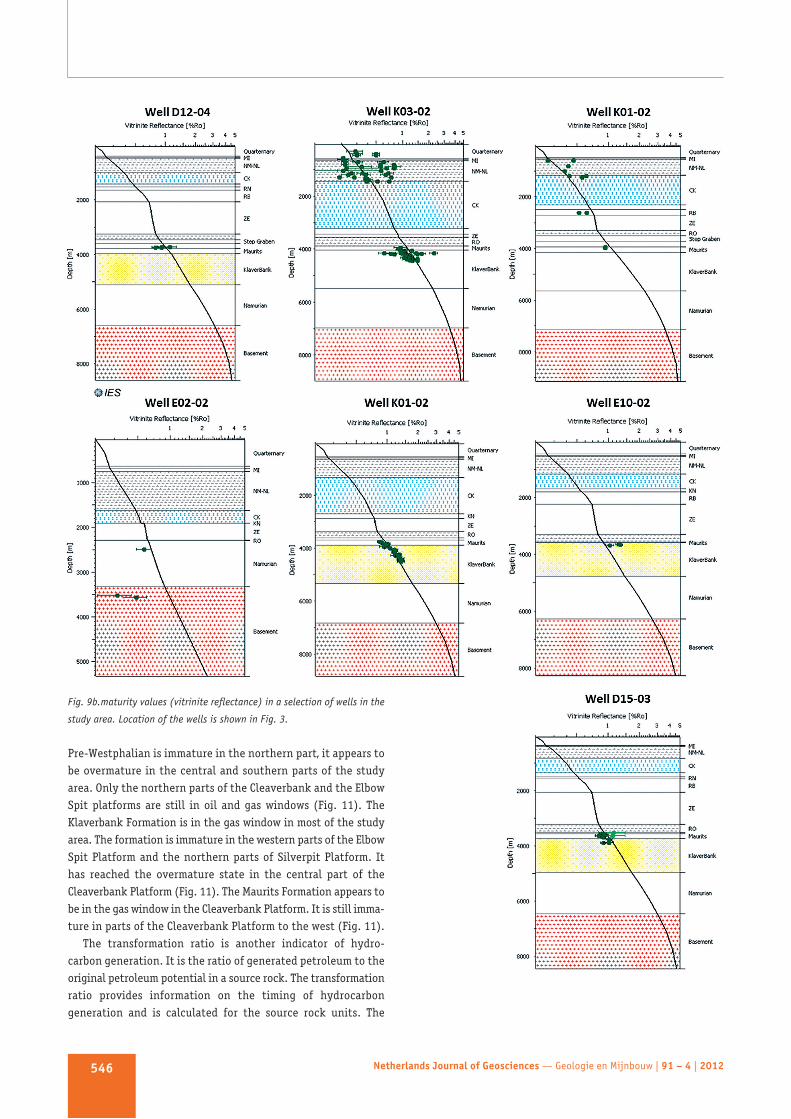
Pre-Westphalian is immature in the northern part, it appears tobe overmature in the central and southern parts of the studyarea. Only the northern parts of the Cleaverbank and the ElbowSpit platforms are still in oil and gas windows (Fig. 11). TheKlaverbank Formation is in the gas window in most of the studyarea. The formation is immature in the western parts of the ElbowSpit Platform and the northern parts of Silverpit Platform. Ithas reached the overmature state in the central part of theCleaverbank Platform (Fig. 11). The Maurits Formation appears tobe in the gas window in the Cleaverbank Platform. It is still imma -ture in parts of the Cleaverbank Platform to the west (Fig. 11).
The transformation ratio is another indicator of hydro -carbon generation. It is the ratio of generated petroleum to theoriginal petroleum potential in a source rock. The transformationratio provides information on the timing of hydrocarbongeneration and is calculated for the source rock units. The
Netherlands Journal of Geosciences — Geologie en Mijnbouw | 91 – 4 | 2012546
Fig. 9b.maturity values (vitrinite reflectance) in a selection of wells in the
study area. Location of the wells is shown in Fig. 3.
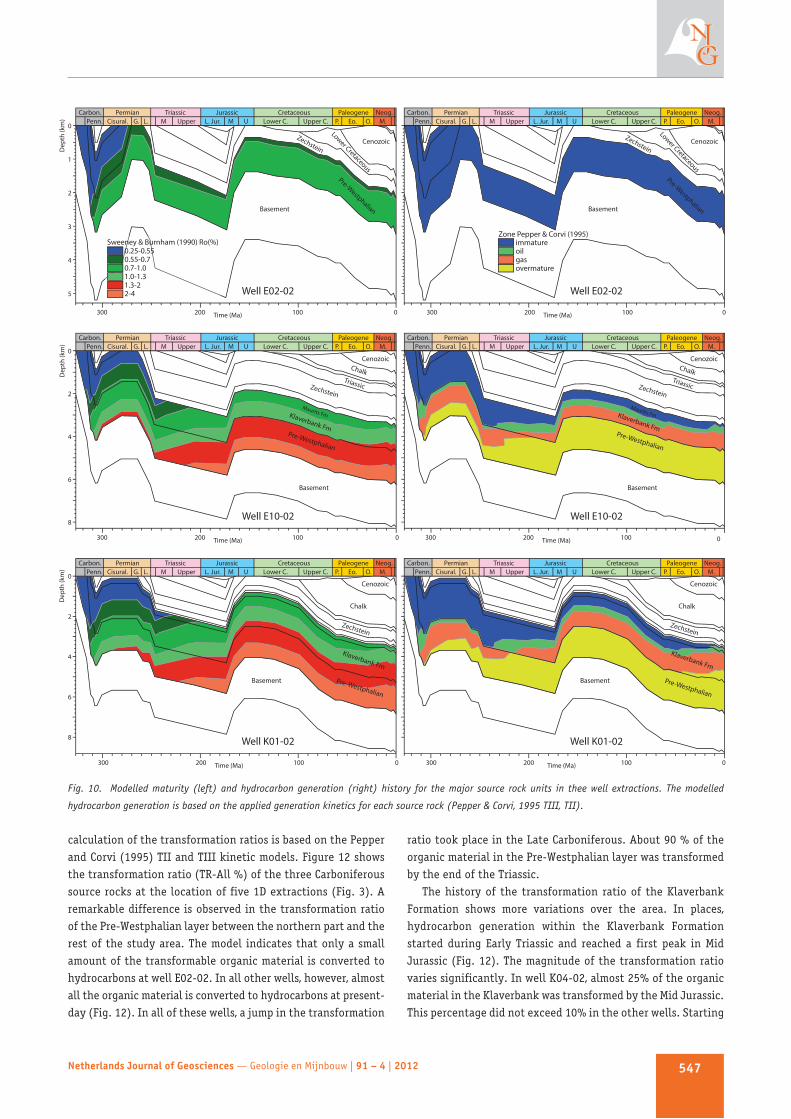
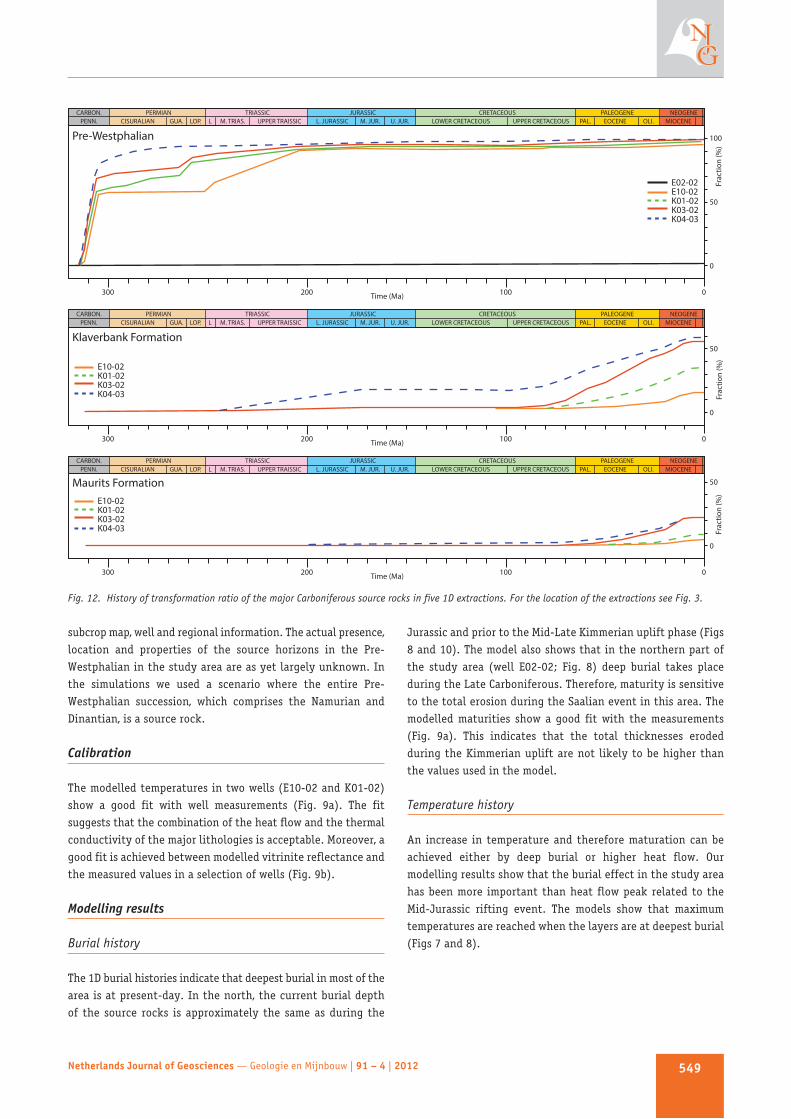
calculation of the transformation ratios is based on the Pepperand Corvi (1995) TII and TIII kinetic models. Figure 12 showsthe transformation ratio (TR-All %) of the three Carboniferoussource rocks at the location of five 1D extractions (Fig. 3). Aremarkable difference is observed in the transformation ratioof the Pre-Westphalian layer between the northern part and therest of the study area. The model indicates that only a smallamount of the transformable organic material is converted tohydrocarbons at well E02-02. In all other wells, however, almostall the organic material is converted to hydrocarbons at present-day (Fig. 12). In all of these wells, a jump in the transformation
ratio took place in the Late Carboniferous. About 90 % of theorganic material in the Pre-Westphalian layer was transformedby the end of the Triassic.
The history of the transformation ratio of the KlaverbankFormation shows more variations over the area. In places,hydrocarbon generation within the Klaverbank Formationstarted during Early Triassic and reached a first peak in MidJurassic (Fig. 12). The magnitude of the transformation ratiovaries significantly. In well K04-02, almost 25% of the organicmaterial in the Klaverbank was transformed by the Mid Jurassic.This percentage did not exceed 10% in the other wells. Starting
Netherlands Journal of Geosciences — Geologie en Mijnbouw | 91 – 4 | 2012 547
0.25-0.55Sweeney & Burnham (1990) Ro(%)
0.55-0.70.7-1.01.0-1.31.3-22-4
oil
overmature
immatureZone Pepper & Corvi (1995)
gas
Triassic
Lower Cretaceous
Basement
Basement
Pre-Westphalian
Pre-Westphalian
Klaverbank Fm
Zechstein
Zechstein
Maurits Fm
Cenozoic
Cenozoic
Chalk
300
0
2
4
6
8
200 100 0
Dep
th (k
m)
Time (Ma)
Well E10-02
Carbon. Permian Triassic Jurassic Cretaceous Paleogene Neog.M.O.P.Upper C.Lower C.UML. Jur.UpperM L.G.Cisural.Penn. Eo.
Carbon. Permian Triassic Jurassic Cretaceous Paleogene Neog.M.O.P.Upper C.Lower C.UML. Jur.UpperM L.G.Cisural.Penn. Eo.
Carbon. Permian Triassic Jurassic Cretaceous Paleogene Neog.M.O.P.Upper C.Lower C.UML. Jur.UpperM L.G.Cisural.Penn. Eo.
Carbon. Permian Triassic Jurassic Cretaceous Paleogene Neog.M.O.P.Upper C.Lower C.UML. Jur.UpperM L.G.Cisural.Penn. Eo.
Carbon. Permian Triassic Jurassic Cretaceous Paleogene Neog.M.O.P.Upper C.Lower C.UML. Jur.UpperM L.G.Cisural.Penn. Eo.
Carbon. Permian Triassic Jurassic Cretaceous Paleogene Neog.M.O.P.Upper C.Lower C.UML. Jur.UpperM L.G.Cisural.Penn. Eo.
300
0
2
1
3
4
5
200 100 0
Dep
th (k
m)
Time (Ma)
Well E02-02
Lower Cretaceous
Basement
Pre-Westphalian
ZechsteinCenozoic
300 200 100 0Time (Ma)
Well E02-02
Basement Pre-Westphalian
Klaverbank Fm
Zechstein
Cenozoic
Chalk
300
0
2
4
6
8
200 100 0
Dep
th (k
m)
Time (Ma)
Well K01-02
Basement Pre-Westphalian
Klaverbank Fm
Zechstein
Cenozoic
Chalk
300 200 100 0Time (Ma)
Well K01-02
Triassic
Basement
Pre-Westphalian
Klaverbank Fm
Zechstein
Maurits Fm
CenozoicChalk
300 200 100 0Time (Ma)
Well E10-02
Fig. 10. Modelled maturity (left) and hydrocarbon generation (right) history for the major source rock units in thee well extractions. The modelled
hydrocarbon generation is based on the applied generation kinetics for each source rock (Pepper & Corvi, 1995 TIII, TII).
from the Late Cretaceous, the Klaverbank Formation resumedhydrocarbon generation with varying rates depending on thelocation. The highest ratio is observed in the wells K03-02 andK04-03 (ca. 60% and 58% respectively) on the CleaverbankPlatform (Fig. 12). Towards the north, the transformation ratio islower and reaches a value of ca 15% in well E10-02. An increasein the transformation ratio took place during the Miocene. Thisis apparent in all the 1D extractions from the study area.
Hydrocarbon generation in the Maurits Formation startedduring the Late Cretaceous-Early Paleogene in the whole areaand reached a maximum value today. Transformation ratiosvary over the area with the highest values observed in wellK04-03 and well K03-02 (ca. 25%). Similar to the KlaverbankFormation, the transformation ratio in the Maurits Formation
decreases northwards. An increase is observed during theMiocene over the whole area (Fig. 12).
Discussion
Input, assumptions and conditions
The outcome of basin modelling is dependent on the input dataand the uncertainties involved. A number of assumptions anddefault set-ups have been introduced to the model. The distri -bution and thickness of the Carboniferous formations, andespecially the Pre-Westphalian succession, is a major source ofuncertainty in the model. The thickness and distribution of theCarboniferous layers were estimated from the base Permian
Netherlands Journal of Geosciences — Geologie en Mijnbouw | 91 – 4 | 2012548
ImmatureOilGasOvermature
ImmatureOilGasOvermature
ImmatureOilGasOvermature
82-109Temperature ºC
110-138139-162163-179180-204205-240241-275276-324
82-109Temperature ºC
110-138139-162163-179180-204205-240241-275276-324
82-109Temperature ºC
110-138139-162163-179180-204205-240241-275276-324
UK NL 0 20 km
Elbow Spit Platform
Cleaverbank Platform
UK NL 0 20 km
Elbow Spit Platform
Cleaverbank Platform
UK NL 0 20 km
Elbow Spit Platform
Cleaverbank Platform
UK NL 0 20 km
Elbow Spit Platform
Cleaverbank Platform
UK NL 0 20 km
Elbow Spit Platform
Cleaverbank Platform
UK NL 0 20 km
Elbow Spit Platform
Cleaverbank Platform
Top Pre-Westphalian
Top Pre-Westphalian Top Klaverbank Top Maurits
Top Klaverbank Top Maurits
Fig. 11. Modelled hydrocarbon
generation zones and tempera -
ture maps at the top of the
Carboniferous source rocks at
present-day. The modelled hydro -
carbon generation is based on
the applied generation kinetics
for each source rock (Pepper &
Corvi, 1995 TIII, TII).
subcrop map, well and regional information. The actual presence,location and properties of the source horizons in the Pre-Westphalian in the study area are as yet largely unknown. Inthe simulations we used a scenario where the entire Pre-Westphalian succession, which comprises the Namurian andDinantian, is a source rock.
Calibration
The modelled temperatures in two wells (E10-02 and K01-02)show a good fit with well measurements (Fig. 9a). The fitsuggests that the combination of the heat flow and the thermalconduc tivity of the major lithologies is acceptable. Moreover, agood fit is achieved between modelled vitrinite reflectance andthe measured values in a selection of wells (Fig. 9b).
Modelling results
Burial history
The 1D burial histories indicate that deepest burial in most of thearea is at present-day. In the north, the current burial depth of the source rocks is approximately the same as during the
Jurassic and prior to the Mid-Late Kimmerian uplift phase (Figs8 and 10). The model also shows that in the northern part ofthe study area (well E02-02; Fig. 8) deep burial takes placeduring the Late Carboniferous. Therefore, maturity is sensitiveto the total erosion during the Saalian event in this area. Themodelled maturities show a good fit with the measurements(Fig. 9a). This indicates that the total thicknesses erodedduring the Kimmerian uplift are not likely to be higher thanthe values used in the model.
Temperature history
An increase in temperature and therefore maturation can beachieved either by deep burial or higher heat flow. Ourmodelling results show that the burial effect in the study areahas been more important than heat flow peak related to theMid-Jurassic rifting event. The models show that maximumtemperatures are reached when the layers are at deepest burial(Figs 7 and 8).
Netherlands Journal of Geosciences — Geologie en Mijnbouw | 91 – 4 | 2012 549
300 200 100 0
100
50
0
Frac
tion
(%)
Time (Ma)
300 200 100 0
50
0
Frac
tion
(%)
Time (Ma)
CARBON. PERMIAN TRIASSIC JURASSIC CRETACEOUS PALEOGENE NEOGENEMIOCENEOLI.PAL.UPPER CRETACEOUSLOWER CRETACEOUSU. JUR.M. JUR.L. JURASSICUPPER TRAISSICM. TRIAS.LLOP.GUA.CISURALIANPENN. EOCENE
CARBON. PERMIAN TRIASSIC JURASSIC CRETACEOUS PALEOGENE NEOGENEMIOCENEOLI.PAL.UPPER CRETACEOUSLOWER CRETACEOUSU. JUR.M. JUR.L. JURASSICUPPER TRAISSICM. TRIAS.LLOP.GUA.CISURALIANPENN. EOCENE
CARBON. PERMIAN TRIASSIC JURASSIC CRETACEOUS PALEOGENE NEOGENEMIOCENEOLI.PAL.UPPER CRETACEOUSLOWER CRETACEOUSU. JUR.M. JUR.L. JURASSICUPPER TRAISSICM. TRIAS.LLOP.GUA.CISURALIANPENN. EOCENE
300 200 100 0
50
0
Frac
tion
(%)
Time (Ma)
Pre-Westphalian
E10-02K01-02K03-02K04-03
E10-02K01-02K03-02K04-03
E02-02E10-02K01-02K03-02K04-03
Klaverbank Formation
Maurits Formation
Fig. 12. History of transformation ratio of the major Carboniferous source rocks in five 1D extractions. For the location of the extractions see Fig. 3.
History of maturity and HC generation
Source rocks in the Pre-Westphalian succession in the centreand the south of the study area were almost completely trans -formed into hydrocarbons by the Early Jurassic (Figs 10, 11 and
12). This is because the Upper Carboniferous succession has notcompletely been eroded during Saalian uplift. Maturity modelsfor the Namurian in adjacent areas show similar patterns(Schroot et al., 2006). Abdul Fattah et al. (2012b) have shownthat the Namurian in the inverted Broad Fourteens and the
Netherlands Journal of Geosciences — Geologie en Mijnbouw | 91 – 4 | 2012550
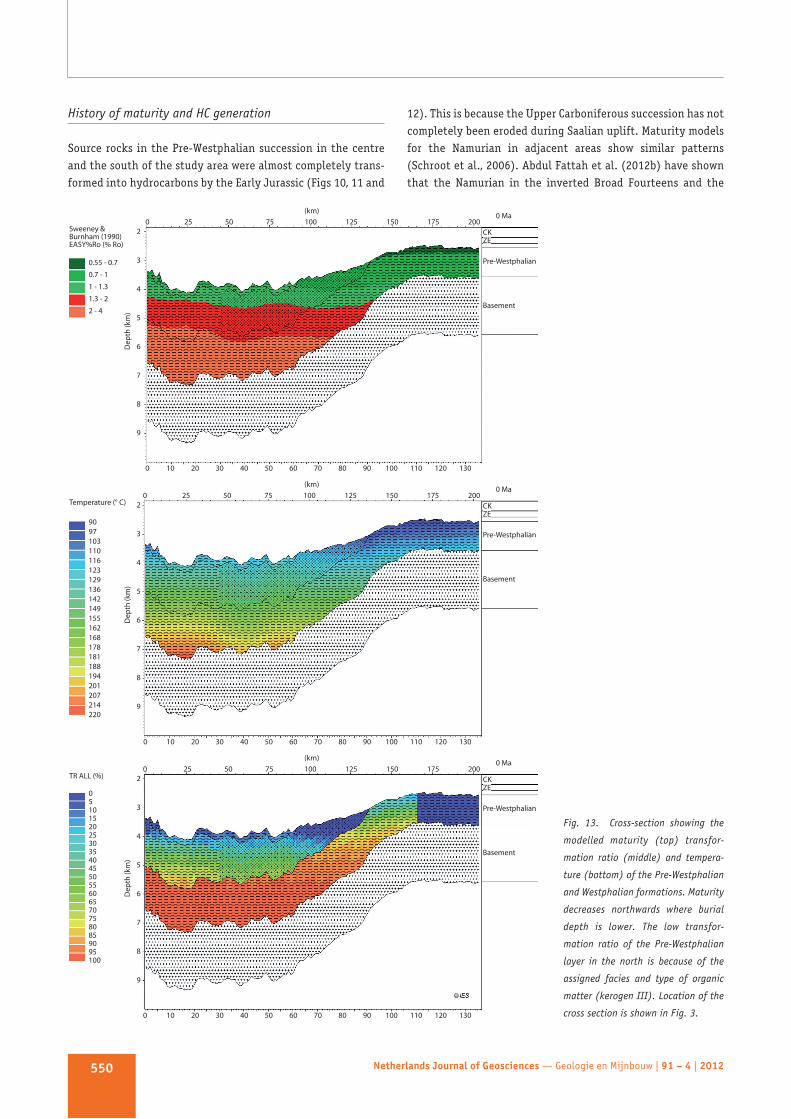
Fig. 13. Cross-section showing the
modelled maturity (top) trans for -
mation ratio (middle) and tempera -
ture (bottom) of the Pre-Westphalian
and Westphalian formations. Maturity
decreases northwards where burial
depth is lower. The low transfor -
mation ratio of the Pre-Westphalian
layer in the north is because of the
assigned facies and type of organic
matter (kerogen III). Location of the
cross section is shown in Fig. 3.
West Netherlands basins are overmature. The Namurian in thesebasins started to produce hydrocarbons already in the LateCarboniferous and reached an overmature state in the Jurassic.
In the northern part of the study area the original thicknessof the overlying formations is less and the degree of uplift anderosion was more pronounced. Therefore, the Pre-Westphaliansuccession shows a low maturity in the range of 0.5 to 0.7% Rowhich implies an immature to early mature gas prone sourcerock (Fig. 11). The calculated transformation ratio from the area(well E02-02) indicates very low hydrocarbon generation rates (Figs 11 and 12). Comparable maturity ranges have beenreported by Schroot et al. (2006) for the Top Dinantian in thesouth-western parts of the Elbow Spit Platform.
In addition to the burial history, the differences in maturityof the Pre-Westphalian can be explained by differences in thetype of organic material and the applied hydrocarbon generationkinetic model. In the centre and south of the study area, thePre-Westphalian succession is assigned a Namurian marine facieswith organic matter of kerogen type II. In the north, where theNamurian is eroded, the Pre-Westphalian (Dinantian) successionshows a fluvial and deltaic facies with organic matter ofkerogen type III. The applied generation kinetics for kerogentype III results in relatively low transfor mation of the organicmatter and hydrocarbon generation even when relatively hightemperatures values are reached (Figs 8, 10, 12 and 13).
Maturity and transformation ratio simulation results showthat the Westphalian formations are generally in the gasgenerating phase and even overmature in places (Figs 11 and12). The maturity variations over the area can be attributed todifferences in the burial of the Westphalian formations ratherthan to thermal anomalies or increased geothermal gradients.
The simulated transformation ratio of the Namurian showsthat almost all of the organic matter was transformed to hydro -carbons by the end of Triassic-Early Jurassic. Although deeperburial and higher temperatures were reached later, limitedamount of organic matter was left to produce gas in theNamurian after the Triassic. This implies that if the gas in thecurrent fields was charged from Namurian source rocks, it musthave been preserved for 200 million years and was not affectedby (mainly) inversion events. Further research including simu -lation of hydrocarbon migration, charging and preservation isneeded to assess the likelihood of preservation of Namurian-sourced gas accumulations in Carboniferous and UpperRotliegend reservoirs in the area.
The modelled transformation ratios of the Klaverbank andMaurits formations suggest that the main phase of hydro carbongeneration took place during the Cenozoic (Fig. 12). BothWestphalian formations are expected to produce hydrocarbonsuntil today. These Westphalian-derived gases are therefore alikely source for the gas fields in the area.
Based on gas sample analyses, Gerling et al. (1999) arguethat the accumulated gas is a mixture of terrestrial and marinesource rocks that can either be Namurian or Dinantian shales.
Considering the outcome of this study, the conclusion of Gerlinget al. (1999) can be explained be one of the following scenarios.Firstly, an early trapping of hydrocarbons occurred already inLate Triassic - Early Jurassic. This would also imply the preser -va tion of the traps since the trapping time. Secondly, recentgeneration of some hydrocarbons from the pre-Westphalianhas taken place. Finally, a mixed source of gas could beexplained by the presence of some marine organic matter inthe Westphalian source rocks. Assessing these possibilitieswould require a detailed basin modelling study that coverhydrocarbon migration and charging as well as quantitativeanalyses of hydrocarbon generation.
Nitrogen
Nitrogen (N2) is the most abundant non-hydrocarbon gas com -ponent encountered in the accumulations of natural gas in theNetherlands. In the offshore area, gas analyses from Rotliegendas well as Carboniferous fields in the K, J, D and E blocks showrelatively high concentrations of nitrogen (Fig. 14; NLOG data -base www.nlog.nl). The possible origin of the nitrogen in thegas accumulations in North Western Europe has been subject ofmany studies (Littke et al. 1995; Gerling et al. 1997; Krooss etal. 1995, 2005, 2006; Mingram et al., 2003, 2005; Verweij, 2008).Although the source of nitrogen is still not very well under -stood, the organic material in the Westphalian coals can be animportant contributor. Ammonium fixed in Namurian shales isanother possible source of nitrogen.
Organic nitrogen is liberated from coal during maturation ofthe kerogen (early nitrogen phase) prior to the main gasgenerating phase (De Jager & Geluk, 2007). Considering thematurity, the Klaverbank and Maurits formations may locallystill be in the early nitrogen phase. Early nitrogen mighttherefore have been generated during the Cenozoic where theWestphalian started to generate gas (Fig. 12). It is also possiblethat some early nitrogen is generated prior to the Cenozoic gasgeneration. Pre-Westphalian strata and the deepest parts ofthe Westphalian formations are thought to be a possible sourceof (late) nitrogen. Late nitrogen is formed in the final stage ofgas generation after methane generation has practically ceased(e.g. Krooss, 1995). Krooss et al. (2005) suggest that the organicmatter can act as a nitrogen source up to a maturity level of 4%Vr. Depending on the temperatures and timing of late nitrogengeneration, this might have contributed to nitrogen accumu -lation in the gas reservoirs (Gerling et al., 1999; De Jager &Geluk, 2007).
The release of non-organic nitrogen from shales requiresrelatively high temperatures (200-250 °C; Mingram et al., 2003;Krooss et al., 2006; Verweij, 2006). Our model indicates that thePre-Westphalian succession has reached temperatures between150-220 °C (Figs 8, 11 and 13). These temperatures might haveled to the release of nitrogen from Namurian or Dinantianstrata. Volcanism might have contributed to the liberation of
Netherlands Journal of Geosciences — Geologie en Mijnbouw | 91 – 4 | 2012 551

nitrogen due to local temperature anomalies. Igneous rockswere found in a number of wells in the E block in the study area(Sissingh, 2004; Van Bergen & Sissingh, 2007).
After all, it is difficult to attribute the nitrogen concentra -tions in the gas fields to a specific source. The contribution ofWestphalian coal seams (early nitrogen phase) is likely to bepresent, but not easy to distinguish from late nitrogen whetherorganic or non-organic. More studies are needed in order tospecify different sources of nitrogen in the gas fields. For thispurpose, isotope analysis of nitrogen can help segregatingdifferent nitrogen groups and identifying their sources (Littkeet al., 1995, 2005; Gerling et al., 1997; Krooss et al., 1995, 2005,2006; Verweij, 2006, 2008).
Conclusions
In this study, recently compiled data from the main platformsin the northwestern part of the Dutch offshore (Cleaverbankand Elbow Spit Platforms) are used for a full 3D reconstructionof the burial and temperature history, source rock maturityand timing of hydrocarbon generation. The study focused onCarboniferous source rocks.
New boundary condition parameters are used in themodelling workflow. Basal heat flow is calculated in two wells
in the area based on tectonic models. Newly refined sedimentwater interface temperatures (SWIT) are used for maturity andtemperature modelling. A recently updated and refined palaeowater depth (PWD) curve is implemented in the simulation. Newerosion thicknesses are reconstructed for the main erosionphases based on recently compiled data.
The 3D modelling results reveal remarkable variations in matu rity and hydrocarbon generation history betweenWestphalian and Pre-Westphalian source rocks. The Pre-Westphalian source rocks started hydrocarbon generation inLate Carboniferous times. In the southern and central parts ofthe study area, gas was generated from the Namurian until theEarly Jurassic. In the major part of the study area, the Pre-Westphalian was overmature by Late Triassic times. Thematurity of the Pre-Westphalian decreases toward the north.The Pre-Westphalian (Dinantian) source rock in the north isstill immature.
The Westphalian source rocks entered the hydrocarbongenerating window during the Late Triassic and Early Jurassic.Maturity and hydrocarbon generation increased during thePalaeogene because of continuous burial. Most of the Mauritsand Klaverbank formations are in the gas generation window.Westphalian formations are still capable of hydrocarbon genera - tion today. Because of the late and continuous generation,
Netherlands Journal of Geosciences — Geologie en Mijnbouw | 91 – 4 | 2012552
Fig. 14. Variation in nitrogen content in gas accumulations
in Carboniferous rocks (from Kombrink et al., 2009).
Westphalian coal seams are likely to have had the mostsignificant contribution to the known gas fields, rather thanNamurian or Dinantian source rocks.
The simulation of temperature, maturity and hydrocarbongeneration for the Carboniferous indicate that there may bedifferent sources explaining the occurrence of nitrogen in thegas accumulations in the area. Early nitrogen may have beenco-generated prior or during the Cenozoic phase of gasgeneration in the Westphalian source rocks. In addition, theassumed Namurian source rock reached high temperatures andmaturities corresponding to a late stage of nitrogen generationbefore the Kimmerian tectonic uplift phase. The temperaturesreached during that time and later were also high enough toallow the release of non-organic nitrogen from Namurian shales.The effect of volcanic activity is probably local.
Acknowledgements
We thank Schlumberger-IES for making it possible to use thebasin modelling package (PetroMod Vr.11) for this study. Thevaluable comments of the Petra David (Wintershall) and HenkKombrink (Total) on the manuscript are very much appreciated.
References
Abdul Fattah, R., Verweij, J.M., Witmans, N. & Ten Veen, J.H., 2012a. Recon -
struction of burial history, temperature, source rock maturity and hydro -
carbon generation for the NCP-2D area, Dutch Offshore. TNO – Geological
Survey of the Netherlands (Utrecht). Report number TNO-034-UT-2010-0223.
Abdul Fattah, R., Verweij, J.M. & Ten Veen, J.H., 2012b. 4D Basin modelling of
the Broad Fourteens Basin and offshore West Netherlands Basin; Erosion and
heat flow reconstruction and its influence on temperature, maturity and
hydrocarbon generation. TNO – Geological Survey of the Netherlands (Utrecht).
Report number TNO 2012 R10670.
De Jager, J., 2003. Inverted basins in the Netherlands, similarities and differences.
Netherlands Journal of Geosciences 82: 355-366.
De Jager, J., 2007. Geological development. In: Wong, T.E., Batjes, D.A.J. & De
Jager, J. (eds): Geology of the Netherlands. Royal Netherlands Academy of
Arts and Sciences (KNAW) (Amsterdam): 5-26.
De Jager, J. & Geluk, M.C., 2007. Petroleum geology. In: Wong, T.E., Batjes, D.A.J.
& De Jager, J. (eds): Geology of the Netherlands. Royal Netherlands Academy
of Arts and Sciences (KNAW) (Amsterdam): 241-264.
Doornenbal, J.C. & Stevenson, A.G. (eds), 2010. Petroleum Geological Atlas of the
Southern Permian Basin Area. EAGE Publications b.v. (Houten), 342 pp.
Duin, E.J.T., Doornenbal, J.C., Rijkers, R.H.B., Verbeek, J.W. & Wong, T.E., 2006.
Subsurface structure of the Netherlands; results of recent onshore and
offshore mapping. Netherlands Journal of Geosciences 85: 245-276.
Gerling, P., Geluk, M.C., Kockel, F., Lokhorst, A., Lott, G.K. & Nicholson, R.A.,
1999. NW European Gas Atlas – new implications for the Carboniferous gas
plays in the western part of the Southern Permian Basin. In: Fleet, A.J. &
Boldy, S.A.R. (eds): Petroleum Geology of North-West Europe: Proceedings of
the 5th Conference. The Geological Society (London): 799-808.
Gerling, P., Idiz, E., Everlien, G. & Sohns, E., 1997. New aspects on the origin of
nitrogen in natural gas in northern Germany. Geologisches Jahrbuch D103:
65-84.
Gradstein, F.M., Ogg, J.G. & Smith, A.G., 2004. A Geologic Time Scale 2004.
Cambridge University Press (Cambridge), 589 pp.
International Commission on Stratigraphy (ICS), 2008. International
Stratigraphic Chart. Cambridge University Press, 184 pp.
Kombrink, H., 2008. The Carboniferous of the Netherlands and surrounding areas;
a basin analysis. PhD thesis, Utrecht University (Utrecht), 184 pp.
Kombrink, H., Besly, B., Collinson, J.D., Den Hartog Jager, D.G., Drozdzewski,
G., Dusar, M., Hoth, P., Pagnier, H.J.M., Stemmerik, L., Waksmundzka, M.I.
& Wrede, V., 2010. Carboniferous. In: Doornenbal, J.C. & Stevenson, A.G. (eds):
Petroleum Geological Atlas of the Southern Permian Basin Area. EAGE
Publications b.v. (Houten): 81-99.
Kombrink, H., Della Lunga, D., Mijnlieff, H. & Kroon, I., 2009. Nitrogen contents
in the northwest Netherlands offshore. TNO-NITG (Utrecht; www.nlog.nl).
Kombrink, H., Doornenbal, J.C., Duin, E.J.T., Den Dulk, M., Van Gessel, S.F., Ten
Veen, J.H. & Witmans, N., 2012. New insights into the geological structure
of the Netherlands; results of a detailed mapping project. Netherlands
Journal of Geosciences 91-4: 419-446, this issue.
Kozur, H.W. & Bachmann, G.H., 2008. Updated correlation of the Germanic Triassic
with the Tethyan scale and assigned numeric ages. Berichte der Geologischen
Bundesanstalt 76: 53-58.
Krooss, B., Jurisch, A. & Plessen, B., 2006. Investigation of the fate of nitrogen
in Palaeozoic shales of the Central European Basin. Journal of Geochemical
Exploration 89: 191-194.
Krooss, B.M., Friberg, L., Gensterblum, Y., Hollenstein, J., Prinz, D. & Littke, R.,
2005. Investigation of the pyrolytic liberation of molecular nitrogen from
Palaeozoic sedimentary rocks. International Journal of Earth Sciences 94:
1023-1038.
Krooss, B.M., Littke, R., Müller, B., Frielingsdorf, J., Schwochau, K. & Idiz, E.F.,
1995. Generation of nitrogen and methane from sedimentary organic matter:
implications on the dynamics of natural gas accumulations. Chemical Geology
126: 291-318.
Littke, R., Krooss, B., Idiz, E. & Frielingsdorf, J., 1995. Molecular nitrogen in
natural gas accumulations: Generation from sedimentary organic matter at
high temperatures. American Association of Petroleum Geologists Bulletin
79: 410-430.
Mingram, B., Hoth, P. & Harlov, D.E., 2003. Nitrogen potential of Namurian
shales in the North German Basin. Journal of Geochemical Exploration 78-79:
405-408.
Mingram, B., Hoth, P., Lüders, V. & Harlov, D., 2005. The significance of fixed
ammonium in Palaeozoic sediments for the generation of nitrogen-rich natural
gases in the North German Basin. International Journal of Earth Sciences 94:
1010-1022.
Munsterman, D.K., Verreussel, R.M.C.H., Mijnlieff, H.F., Witmans, N., Kerstholt-
Boegehold, S. & Abbink, O.A., 2012. Revision and update of the Callovian-
Ryazanian Stratigraphic Nomenclature in the northern Dutch offshore, i.e.
Central Graben Subgroup and Scruff Group. Netherlands Journal of Geosciences
91-4: 555-590, this issue.
Pepper, A.S. & Corvi, P.J., 1995. Simple kinetic models of petroleum formation.
Part III: modelling an open system. Marine and Petroleum Geology 12: 417-452.
Netherlands Journal of Geosciences — Geologie en Mijnbouw | 91 – 4 | 2012 553
Pletsch, T., Appel, J., Botor, D., Clayton, C.J., Duin, E.J.T., Faber, E., Górecki, W.,
Kombrink, H., Kosakowski, P., Kuper, G., Kus, J., Lutz, R., Mathiesen, A.,
Ostertag-Henning, C., Papiernek, B. & Van Bergen, F., 2010. Petroleum
Generation and Migration. In: Doornenbal, J.C. & Stevenson, A.G. (eds):
Petroleum Geological Atlas of the Southern Permian Basin Area. EAGE
Publications b.v. (Houten): 225-253.
Quirk, D.G., 1993. Interpreting the Upper Carboniferous of the Dutch Cleaver
Bank High. In: Parker, J.R. (ed.): Petroleum Geology of North-West Europe:
Proceedings of the 4th Conference. The Geological Society (London): 697-706.
Schroot, B.M., Van Bergen, F., Abbink, O.A., David, P., Van Eijs, R. & Veld, H.,
2006. Hydrocarbon potential of the Pre-Westphalian in the Netherlands on-
and offshore – report of the PetroPlay project. TNO Built Environment and
Geosciences (Utrecht). Report number NITG-05-155-C, 436 pp.
Sekiguchi, K., 1984. A method for determining terrestrial heat flow in oil basinal
areas. Tectonophysics 103: 67-79.
Sissingh, W., 2004. Palaeozoic and Mesozoic igneous activity in the Netherlands;
a tectonomagmatic review. Netherlands Journal of Geosciences 83: 113-134.
Sweeney, J.J. & Burnham, A.K., 1990. Evaluation of a simple model of vitrinite
reflectance based on chemical kinetics. American Association of Petroleum
Geologists Bulletin 74: 1559-1570.
TNO-NITG, 2004. Geological Atlas of the Subsurface of the Netherlands - onshore.
Netherlands Institute of Applied Geoscience TNO (Utrecht), 104 pp.
Van Adrichem Boogaert, H.A. & Kouwe, W.F.P., 1993. Stratigraphic nomen -
clature of the Netherlands, revision and update by RGD and NOGEPA, Section
A, General. Mededelingen Rijks Geologische Dienst 50: 1-40.
Van Balen, R.T., Van Bergen, F., De Leeuw, C., Pagnier, H., Simmelink, H., Van
Wees, J.D. & Verweij, H., 2000. Modelling the hydrocarbon generation and
migration in the West Netherlands Basin, the Netherlands. Netherlands Journal
of Geosciences 79: 29-44.
Van Bergen, M.J. & Sissingh, W., 2007. Magmatism in the Netherlands: expression
of the north-west European rifting history. In: Wong, T.E., Batjes, D.A.J. & De
Jager, J. (eds): Geology of the Netherlands. Royal Netherlands Academy of
Arts and Sciences (KNAW) (Amsterdam): 197-222.
Van Wees, J.D., Stephenson, R.A., Ziegler, P.A., Bayer, U., McCann, T., Dadlez, R.,
Gaupp, R., Narkiewicz, M., Bitzer, F. & Scheck, M., 2000. On the origin of the
Southern Permian Basin, Central Europe. Marine and Petroleum Geology 17:
43-59.
Van Wees, J.D., Van Bergen, F., David, P., Nepveu, M., Beekman, F., Cloetingh,
S.A.P.L. & Bonté, D., 2009. Probabilistic tectonic heat flow modeling for basin
maturation: Assessment method and applications. Marine and Petroleum
Geology 26: 536-551.
Verweij, H., 2006, Nitrogen in natural gas accumulations in onshore and offshore
Netherlands. Report TNO Built Environment and Geosciences (Utrecht), 25 pp.
Verweij, J.M., 2008. Isotopic signature of nitrogen: an indicator for timing N2
generation and N2 charging of Dutch natural gas accumulations. 70th EAGE
Conference & Exhibition (Rome).
Verweij, J.M., Souto Carneiro Echternach, M. & Witmans, N., 2009. Terschelling
Basin and southern Dutch Central Graben. Burial history, temperature, source
rock maturity and hydrocarbon generation – Area 2A. TNO (Utrecht), Report
number 034-UT-2009-02065.
Verweij, J.M., Souto Carneiro Echternach, M. & Witmans, N., 2010. Central
Offshore Platform – Area NCP2E. Burial history, temperature, source rock
maturity and hydrocarbon generation. TNO Built Environment and Geosciences
– National Geological Survey (Utrecht, the Netherlands). Report number TNO-
034-UT-2010-01298/A.
Verweij, J.M., Souto Carneiro Echternach, M., Witmans, N. & Abdul Fattah, R.,
2012. Reconstruction of basal heat flow, surface temperature, source rock
maturity and hydrocarbon generation in salt-dominated Dutch Basins. In:
Peters, K., Curry, D. & Kacewicz, M. (eds): Basin Modeling: New horizons in
research and applications. AAPG Hedberg Series: 1-22.
Wong, T.E., Batjes, D.A.J. & De Jager, J. (eds), 2007. Geology of the Netherlands.
Royal Netherlands Academy of Arts and Sciences (KNAW) (Amsterdam), 354 pp.
Ziegler, P.A., 1990. Geological Atlas of Western and Central Europe (2nd edition).
Shell Internationale Petroleum Maatschappij B.V., Geological Society Publishing
House (Bath), 239 pp.
Netherlands Journal of Geosciences — Geologie en Mijnbouw | 91 – 4 | 2012554