record statutory profit before tax of $141.4 million …...traditional fuel vehicles made up 99% of...
TRANSCRIPT

A.P. EAGERS LIMITED ABN 87 009 680 013 Registered Office 5 Edmund Street, Newstead QLD 4006 P.O. Box 199, Fortitude Valley QLD 4006 T (07) 3608 7100 F (07) 3608 7111 E [email protected]
22 February 2017 Company Announcements Office ASX Limited
Full Year Accounts
• Record Statutory Profit Before Tax of $141.4 million (2015: $121.0 million) • Record underlying Profit Before Tax of $137.5 million (2015: $126.4 million) • Record Statutory Profit After Tax of $105.5 million (2015: $87.0 million) • Record Earnings per Share (basic) of 55.4 cents (2015: 47.6 cents) • Record Final Dividend of 22 cents per share (2015: 20 cents per share) • Record Total Dividend of 35 cents per share (2015: 32 cents per share)
Up 17% Up 9% Up 21% Up 16% Up 10% Up 9%
Attached are the following documents for the year ended 31 December 2016:
1. Appendix 4E Preliminary Final Report 2. Directors’ Report 3. Auditor’s Declaration of Independence 4. Financial Report 5. Independent Auditor’s Report
These documents are given to the ASX under listing rules 4.3A and 4.5. ENDS For more information: Martin Ward Chief Executive Officer (07) 3608 7100 www.apeagers.com.au

A. P. EAGERS LIMITED ABN 87 009 680 013
Registered Office 5 Edmund Street, Newstead QLD 4006 P.O. Box 199, Fortitude Valley QLD 4006 Telephone (07) 3608 7100 Fax (07) 3608 7111 Email [email protected]
Appendix 4E
Preliminary Final Report year ended 31 December 2016
(ASX listing rule 4.3A)
Results for Announcement to the Market
• Record Statutory Profit Before Tax of $141.4 million (2015: $121.0 million)
• Record underlying Profit Before Tax of $137.5 million (2015: $126.4 million)
• Record Statutory Profit After Tax of $105.5 million (2015: $87.0 million)
• Record Earnings per Share (basic) of 55.4 cents (2015: 47.6 cents)
• Record Final Dividend of 22 cents per share (2015: 20 cents per share)
• Record Total Dividend of 35 cents per share (2015: 32 cents per share)
Up 17% Up 9% Up 21% Up 16% Up 10% Up 9%
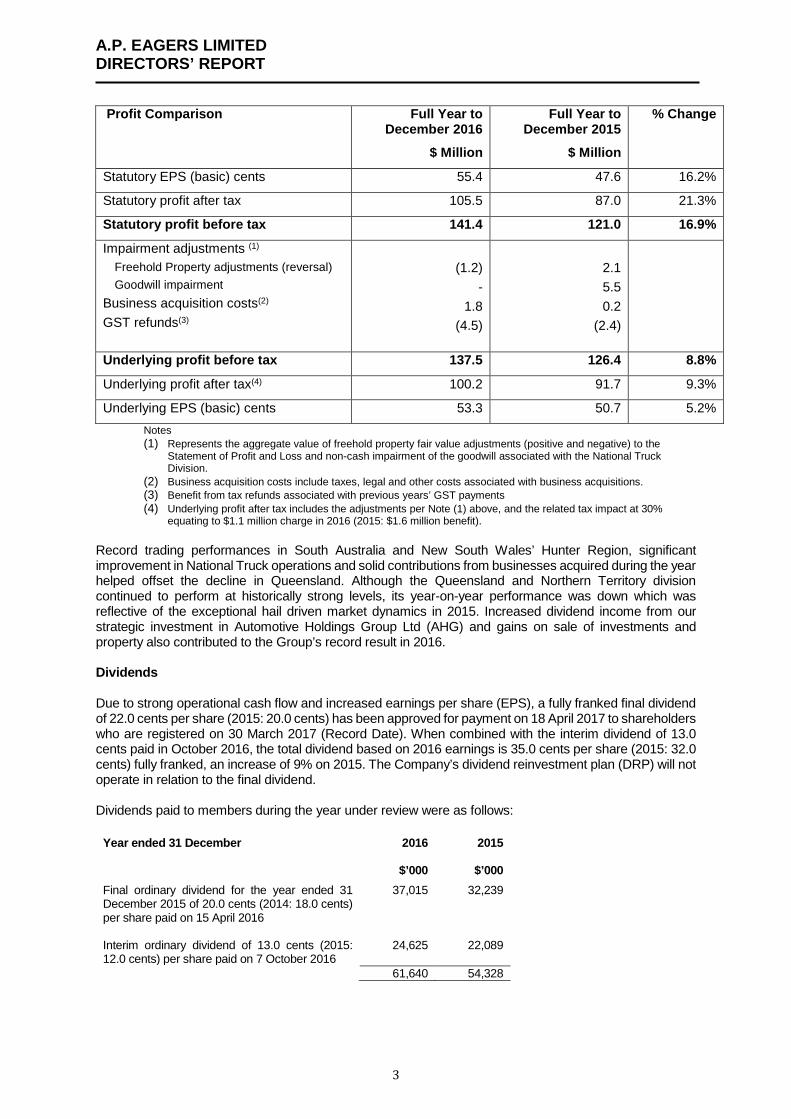
The Directors of A.P. Eagers Limited (ASX: APE) (the Company) are pleased to report a record 2016 statutory Net Profit Before Tax (NPBT) of $141.4 million. This compares to a Net Profit Before Tax of $121.0 million in 2015, an increase of 16.9% on the previous corresponding period (pcp). Net Profit After Tax was $105.5 million in 2016 compared to $87.0 million in 2015, an increase of 21.3% on the pcp. Earnings per share (basic) for 2016 were 55.4 cents compared to 47.6 cents on the pcp, an increase of 16.2%.
Profit Comparison Full Year to December 2016
$ Million
Full Year to December 2015
$ Million
% Change
Statutory EPS (basic) cents 55.4 47.6 16.2%
Statutory profit after tax 105.5 87.0 21.3%
Statutory profit before tax 141.4 121.0 16.9%
Impairment adjustments (1)
Freehold Property adjustments (reversal) Goodwill impairment
Business acquisition costs(2)
GST refunds(3)
(1.2)
- 1.8
(4.5)
2.1 5.5 0.2
(2.4)
Underlying profit before tax 137.5 126.4 8.8%
Underlying profit after tax(4) 100.2 91.7 9.3%
Underlying EPS (basic) cents 53.3 50.7 5.2% Notes (1) Represents the aggregate value of freehold property fair value adjustments (positive and negative) to the Statement of Profit and
Loss and non-cash impairment of the goodwill associated with the National Truck Division. (2) Business acquisition costs include taxes, legal and other costs associated with business acquisitions. (3) Benefit from tax refunds associated with previous years’ GST payments (4) Underlying profit after tax includes the adjustments per Note (1) above, and the related tax impact at 30% equating to $1.1
million charge in 2016 (2015: $1.6 million benefit).

Page 2 of 6
Record trading performances in South Australia and New South Wales’ Hunter Region, significant improvement in National Truck operations and solid contributions from businesses acquired during the year helped offset the decline in Queensland. Although the Queensland and Northern Territory division continued to perform at historically strong levels, its year-on-year performance was down which was reflective of the exceptional hail driven market dynamics in 2015. Increased dividend income from our strategic investment in Automotive Holdings Group Ltd (AHG) and gains on sale of investments and property also contributed to the Group’s record result in 2016.
Dividend
Due to strong operational cash flow and increased earnings per share (EPS), a fully franked final dividend of 22.0 cents per share (2015: 20.0 cents) has been approved for payment on 18 April 2017 to shareholders who are registered on 30 March 2017 (Record Date). When combined with the interim dividend of 13.0 cents paid in October 2016, the total dividend based on 2016 earnings is 35.0 cents per share (2015: 32.0 cents) fully franked, an increase of 9% on 2015. The Company’s dividend reinvestment plan (DRP) will not operate in relation to the final dividend. External Environment
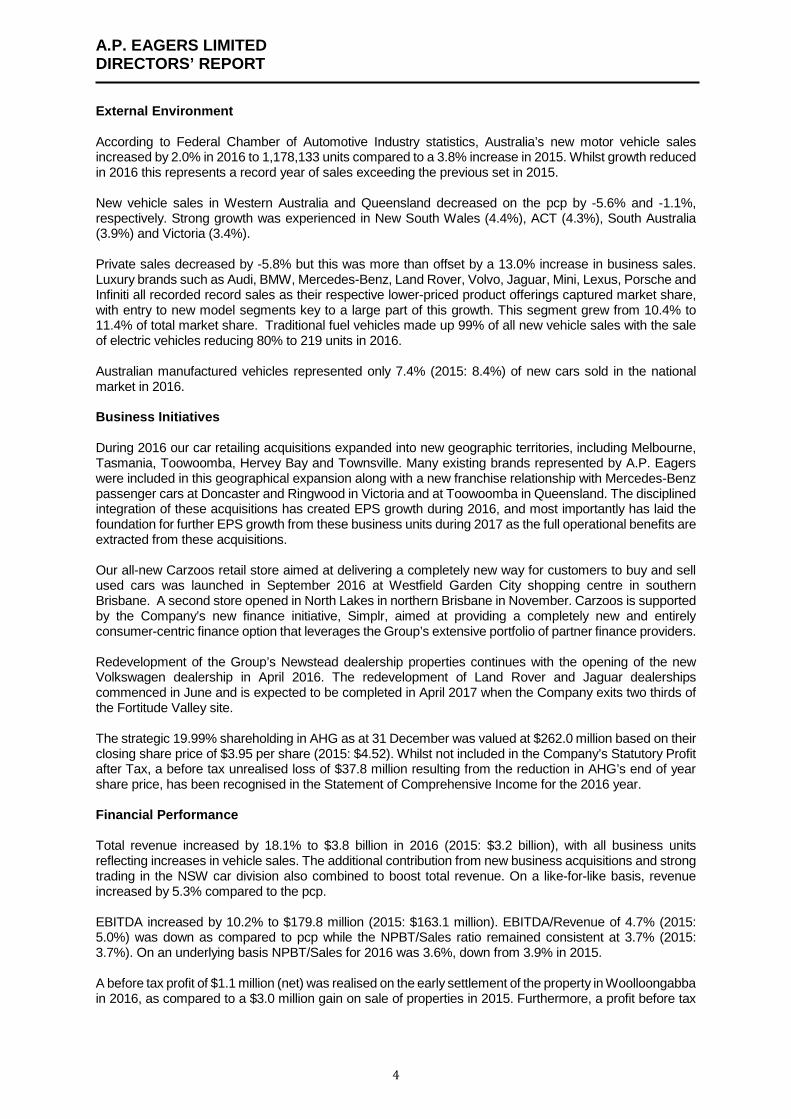
According to Federal Chamber of Automotive Industry statistics, Australia’s new motor vehicle sales increased by 2.0% in 2016 to 1,178,133 units compared to a 3.8% increase in 2015. Whilst growth reduced in 2016 this represents a record year of sales exceeding the previous set in 2015. New vehicle sales in Western Australia and Queensland decreased on the pcp by -5.6% and -1.1%, respectively. Strong growth was experienced in New South Wales (4.4%), ACT (4.3%), South Australia (3.9%) and Victoria (3.4%). Private sales decreased by -5.8% but this was more than offset by a 13.0% increase in business sales. Luxury brands such as Audi, BMW, Mercedes-Benz, Land Rover, Volvo, Jaguar, Mini, Lexus, Porsche and Infiniti all recorded record sales as their respective lower-priced product offerings captured market share, with entry to new model segments key to a large part of this growth. This segment grew from 10.4% to 11.4% of total market share. Traditional fuel vehicles made up 99% of all new vehicle sales with the sale of electric vehicles reducing 80% to 219 units in 2016. Australian manufactured vehicles represented only 7.4% (2015: 8.4%) of new cars sold in the national market in 2016. Business Initiatives
During 2016 our car retailing acquisitions expanded into new geographic territories, including Melbourne, Tasmania, Toowoomba, Hervey Bay and Townsville. Many existing brands represented by A.P. Eagers were included in this geographical expansion along with a new franchise relationship with Mercedes-Benz passenger cars at Doncaster and Ringwood in Victoria and at Toowoomba in Queensland. The disciplined integration of these acquisitions has created EPS growth during 2016, and most importantly has laid the foundation for further EPS growth from these business units during 2017 as the full operational benefits are extracted from these acquisitions. Our all-new Carzoos retail store aimed at delivering a completely new way for customers to buy and sell used cars was launched in September 2016 at Westfield Garden City shopping centre in southern Brisbane. A second store opened in North Lakes in northern Brisbane in November. Carzoos is supported by the Company’s new finance initiative, Simplr, aimed at providing a completely new and entirely consumer-centric finance option that leverages the Group’s extensive portfolio of partner finance providers. Redevelopment of the Group’s Newstead dealership properties continues with the opening of the new Volkswagen dealership in April 2016. The redevelopment of Land Rover and Jaguar dealerships commenced in

Page 3 of 6
June and is expected to be completed in April 2017 when the Company exits two thirds of the Fortitude Valley site. The strategic 19.99% shareholding in AHG as at 31 December was valued at $262.0 million based on their closing share price of $3.95 per share (2015: $4.52). Whilst not included in the Company’s Statutory Profit after Tax, a before tax unrealised loss of $37.8 million resulting from the reduction in AHG’s end of year share price, has been recognised in the Statement of Comprehensive Income for the 2016 year. Financial Performance
Total revenue increased by 18.1% to $3.8 billion in 2016 (2015: $3.2 billion), with all business units reflecting increases in vehicle sales. The additional contribution from new business acquisitions and strong trading in the NSW car division also combined to boost total revenue. On a like-for-like basis, revenue increased by 5.3% compared to the pcp.
EBITDA increased by 10.2% to $179.8 million (2015: $163.1 million). EBITDA/Revenue of 4.7% (2015: 5.0%) was down as compared to pcp while the NPBT/Sales ratio remained consistent at 3.7% (2015: 3.7%). On an underlying basis NPBT/Sales for 2016 was 3.6%, down from 3.9% in 2015. A before tax profit of $1.1 million (net) was realised on the early settlement of the property in Woolloongabba in 2016, as compared to a $3.0 million gain on sale of properties in 2015. Furthermore, a profit before tax of $1.2 million was realised on the revaluation of a property at Brookvale, offsetting a revaluation decrement recorded against the same property in 2010. This $1.2 million positive compared to a $2.1 million loss before tax realised on the revaluation of a property in 2015. Borrowing costs increased by 14.5% to $24.4 million (2015: $21.3 million), reflecting higher average debt (including additional bailment finance for the businesses acquired in 2016) being partially offset by lower margins and interest rates. The increase in depreciation and amortisation costs by 5.9% to $14.0 million (2015: $13.2 million) reflects the additional depreciation on businesses and associated property acquired in 2016 and higher development and refurbishment capital expenditure in 2016 which increased to $19.3 million from $18.9 million in 2015. Business acquisition costs of $1.8 million were expensed in the financial year relating to the Birrell, Crampton Automotive and Tony Ireland Group acquisitions, compared to $0.2 million in 2015. The Company’s net cash provided by operating activities was $110.7 million in 2016 (2015: $84.6 million). This increase was due to contributions from acquisitions made in 2016, improved profitability together with lower tax payments compared to 2015 which included capital gains tax paid on the properties sold in 2014.

Page 4 of 6
Results Summary Consolidated results
Year Ended 31 December
2016 $’000
2015 $’000
Increase/(Decrease)
Revenue from operations 3,779,738 3,201,755 18.1%
Other revenue 53,484 44,621 19.9%
Total revenue 3,833,222 3,246,376 18.1%
Earnings before interest, tax, depreciation and amortisation and impairment (EBITDA)
179,776 163,077 10.2%
Depreciation and Amortisation (13,993) (13,216) 5.9%
Impairment charge/net reversal - (7,610) (100.0%)
Earnings before interest and tax (EBIT)
165,783 142,251 16.5%
Borrowing costs (24,378) (21,293) 14.5%
Profit before tax 141,405 120,958 16.9% Income tax expense (35,879) (33,943) 5.7%
Profit after tax Non-controlling interest in subsidiaries
Attributable profit after tax
105,526 (1,542)
103,984
87,015 (798)
86,217
21.3% X93.2%
20.6%
Earnings per share - basic 55.4 cents 47.6 cents 16.4%
This report is based on accounts which have been audited.
Segments (1)
The Profit contribution from the Company’s Car Retail segment was 6.8% higher at $104.6 million compared to $98.0 million in 2015. Revenue increased by 19.5%, with the increase primarily attributable to the strong trading in NSW and contribution from the acquired Birrell, Crampton Automotive and Tony Ireland Group’s. The strong trading was also reflected in the service departments with the focus on service retention, transactional margins and workshop efficiency all driving a record service result.
The National Truck Division (Truck Retail segment) delivered a significantly improved profit performance of $6.3 million compared to a $3.2 million loss in 2015 which included the goodwill impairment write down of $5.5 million. Revenue increased by 5.4% reflecting strong performance in all departments including significantly improved profits from the used truck and service divisions. The value of the property portfolio increased to $299 million as at 31 December 2016 compared to $249 million as at 31 December 2015 due primarily to the acquisition of five properties during the year including three dealership sites for the Mercedes-Benz business in Victoria and favourable adjustments to property fair values. The Property segment profit contribution of $28.2 million was higher than the previous year of $16.3 million, due to the $1.1 million gain realised on settlement of a Woolloongabba property together with property valuation increases of $12.1 million primarily in the Queensland portfolio, of which $1.2 million was recognised as profit before tax.
Page 5 of 6
The Investment segment registered a pre-tax loss of $24.0 million for 2016 as compared to a gain of $61.1 million for the pcp, due primarily to an unrealised revaluation loss on the AHG investment of $37.8 million. This reflected a 31 December 2016 AHG closing share price of $3.95 per share compared to $4.52 as at 31 December 2015.
(1) Note: changes in fair value of property and investments are recognised as profit and loss adjustments for segment reporting purposes but are not recorded in the Group’s Statutory Net Profit After Tax
Financial Position
Our financial position and interest coverage remained strong, although total debt and gearing ratios increased during 2016 as a result of additional debt to fund the acquisition of new businesses, property and AHG shares. $50 million in cash received from property sales during the year was also used to fund these acquisitions. EBITDA Interest Cover (EBITDA/Borrowing costs) was 7.4 times as at 31 December 2016 compared to 7.0 times as at June 2016 and 7.6 times as at 31 December 2015. Corporate debt (Term and Capital Loan Facility) net of cash on hand as at 31 December 2016 was higher at $266.0 million (2015: $171.5 million) and total debt including vehicle bailment net of cash on hand was higher at $751.9 million as compared to $576.7 million at 31 December 2015. The increase was primarily due to additional debt drawn down to fund the Birrell and Crampton Automotive Group acquisitions and additional bailment finance consistent with seasonal inventory movements and related to businesses acquired during the year. Total gearing (Debt /Debt + Equity), including bailment inventory financing and finance leases, was 50.2% as at 31 December 2016, as compared to 46.6% as at 31 December 2015. Bailment finance is cost effective short-term finance secured against vehicle inventory on a vehicle by vehicle basis. Gearing excluding bailment and finance leases and including cash on hand, was 25.8% as at 31 December 2016 compared to 19.6% at the end of 2015. During the year, additional debt of $73.4 million was drawn down to fund the business and property acquisitions and additional shares acquired in AHG. Total inventory levels increased to $625.0 million at 31 December 2016 from $530.2 million at 31 December 2015 primarily due to additional new and used car/truck inventory from the Birrell, Crampton Automotive and Tony Ireland Group acquisitions. Net tangible assets reduced to $2.44 per share as at 31 December 2016, compared to $2.95 per share as at 31 December 2015, due to increased intangibles acquired as part of Birrell, Crampton Automotive and Tony Ireland Group acquisitions and lower value of AHG investment.
Outlook and Strategy Update The national new vehicle market continues to grow with low interest rates supporting customer affordability and exceptional product offerings driving customer demand. Strategically, the Company remains focussed on automotive retail and a two-pronged approach of driving value from existing business through process improvement, operating synergies, portfolio management and organic growth, whilst taking advantage of value adding acquisition opportunities as they present themselves.
Page 6 of 6
Key focus areas for 2017 are: Delivering further EPS growth from the Birrell Group, Crampton Automotive Group and Tony Ireland Group
acquisitions; Implementing appropriate operational changes in response to any announcement by ASIC regarding
regulatory rule changes for Finance & Insurance (18 month lead time expected); The ongoing development and optimisation of our existing used car business model now re-launched and
branded Zooper; The further expansion of the all-new Carzoos and Simplr business model following the opening of two
shopping centre stores in 2016; Continued redevelopment and reorganisation of inner city Brisbane facilities (Newstead, Woolloongabba
and Windsor) to provide improved long-term solutions for all stakeholders; Further rationalisation of our Parts business to reduce the cost base, improve efficiency and eliminate sub-
economic business trading terms; A renewed focus on all business processes to deliver the optimal operating cost; and Earnings accretive dealership and ancillary market acquisitions.
Martin Ward Managing Director 22 February 2017 For more information, contact: Martin Ward Managing Director (07) 3248 9455 or visit: www.apeagers.com.au Note: All national sales figures are based on Federal Chamber of Automotive Industry statistics sourced through VFACTS.

A.P. EAGERS LIMITED DIRECTORS’ REPORT
1
The Directors of A.P. Eagers Limited ABN 87 009 680 013 (the Company) present their report together with the consolidated financial report of the Company and its controlled entities (the Group), for the year ended 31 December 2016 and the auditor’s report thereon. Directors The Directors of the Company at any time during or since the end of the year were: Timothy Boyd Crommelin BCom, FSIA, FSLE Chairman of Board, Member of Audit, Risk & Remuneration Committee
Independent, non-executive Director since February 2011. Executive Chairman of Morgans Financial Ltd. Director of Senex Energy Ltd (appointed October 2010) and Australian Cancer Research Foundation. Member of the University of Queensland Senate. Broad knowledge of corporate finance, risk management and acquisitions and over 40 years' experience in the stockbroking and property industry. Martin Andrew Ward BSc (Hons), FAICD Managing Director, Chief Executive Officer
Joined the Company in July 2005. Appointed Chief Executive Officer in January 2006. Appointed Managing Director in March 2006. Motor vehicle dealer. Director of Australian Automotive Dealer Association Limited (appointed January 2014). Former Chief Executive Officer of Ford Motor Company’s Sydney Retail Joint Venture. Nicholas George Politis BCom Director
Non-executive Director since May 2000. Motor vehicle dealer. Executive Chairman of WFM Motors Pty Ltd, A.P. Eagers Limited’s largest shareholder. Vast automotive retail industry experience and Director of a substantial number of proprietary limited companies. Peter William Henley FAIM, MAICD Director, Member of Audit, Risk & Remuneration Committee
Independent, non–executive Director since December 2006. Director of Thorn Group Ltd (appointed May 2007, retired August 2016). Former Deputy Chairman of MTQ Insurance Services Ltd. Former Chairman and Chief Executive Officer of GE Money Motor Solutions. Over 30 years’ local and international experience in the financial services industry. Daniel Thomas Ryan BEc, MBus, FAICD Director
Non-executive Director since January 2010. Director and Chief Executive Officer of WFM Motors Pty Ltd, A.P. Eagers Limited’s largest shareholder. Director of a substantial number of proprietary limited companies. Significant management experience in automotive, transport, manufacturing and retail industries. David Arthur Cowper BCom, FCA Director, Chairman of Audit, Risk & Remuneration Committee
Independent, non-executive Director since July 2012. Chartered accountant, with more than 35 years in the profession. Former partner of Horwath Chartered Accountants and Deloitte Touche Tohmatsu. Former Chairman of Horwath’s motor industry specialisation unit for six years. Area of professional specialisation while at Horwath and Deloitte was in providing audit, financial and taxation services to public and large private companies in the motor industry. Marcus John Birrell Director
Non-executive Director since July 2016. Director of Australian Automotive Dealer Association Limited (appointed January 2014). A distinguished career in the automotive industry, including 38 years at manufacturer, financier and retail level and 21 years as Executive Chairman of Birrell Motors Group.

A.P. EAGERS LIMITED DIRECTORS’ REPORT
2
Company Secretary Denis Gerard Stark LLB, BEc General Counsel & Company Secretary
Commenced in January 2008. Responsible for overseeing the company secretarial, legal, work health & safety, insurance and investor relations functions and property portfolio. Previous company secretarial and senior executive experience with public companies. Admitted as a solicitor in Queensland in 1994 and Victoria in 1997. Directors’ Meetings The number of Directors’ meetings (including meetings of committees of Directors) and number of meetings attended by each Director during the year were:
Board Meetings Audit, Risk & Remuneration Committee Meetings
Held Attended Held Attended
T B Crommelin(1) 8 8 4 3
N G Politis 8 8 - -
M A Ward 8 8 - -
P W Henley(1) 8 8 4 3
D T Ryan 8 8 - -
D A Cowper(1) 8 8 4 4
M J Birrell(2) 4 4 - - (1) Audit, Risk & Remuneration Committee members. (2) Mr Birrell was appointed as a Director on 27 July 2016. Principal Activities The Group’s principal activities during the year consisted of the selling of new and used motor vehicles, distribution and sale of parts, accessories and car care products, repair and servicing of vehicles, provision of extended warranties, facilitation of finance and leasing in respect of motor vehicles, and the ownership of property and investments. The products and services supplied by the Group were associated with, and integral to, the Group’s motor vehicle dealership operations. There were no significant changes in the nature of the Group’s activities during the year. Financial & Operational Review The Directors of A.P. Eagers Limited (ASX: APE) (the Company) are pleased to report a record 2016 statutory Net Profit Before Tax (NPBT) of $141.4 million. This compares to a Net Profit Before Tax of $121.0 million in 2015, an increase of 16.9% on the previous corresponding period (pcp). Net Profit After Tax was $105.5 million in 2016 compared to $87.0 million in 2015, an increase of 21.3% on the pcp. Earnings per share (basic) for 2016 were 55.4 cents compared to 47.6 cents on the pcp, an increase of 16.2%.
A.P. EAGERS LIMITED DIRECTORS’ REPORT
3
Profit Comparison Full Year to
December 2016 $ Million
Full Year to December 2015
$ Million
% Change
Statutory EPS (basic) cents 55.4 47.6 16.2%
Statutory profit after tax 105.5 87.0 21.3%
Statutory profit before tax 141.4 121.0 16.9%
Impairment adjustments (1)
Freehold Property adjustments (reversal) Goodwill impairment
Business acquisition costs(2)
GST refunds(3)
(1.2)
- 1.8
(4.5)
2.1 5.5 0.2
(2.4)
Underlying profit before tax 137.5 126.4 8.8%
Underlying profit after tax(4) 100.2 91.7 9.3%
Underlying EPS (basic) cents 53.3 50.7 5.2% Notes (1) Represents the aggregate value of freehold property fair value adjustments (positive and negative) to the
Statement of Profit and Loss and non-cash impairment of the goodwill associated with the National Truck Division.
(2) Business acquisition costs include taxes, legal and other costs associated with business acquisitions. (3) Benefit from tax refunds associated with previous years’ GST payments (4) Underlying profit after tax includes the adjustments per Note (1) above, and the related tax impact at 30%
equating to $1.1 million charge in 2016 (2015: $1.6 million benefit). Record trading performances in South Australia and New South Wales’ Hunter Region, significant improvement in National Truck operations and solid contributions from businesses acquired during the year helped offset the decline in Queensland. Although the Queensland and Northern Territory division continued to perform at historically strong levels, its year-on-year performance was down which was reflective of the exceptional hail driven market dynamics in 2015. Increased dividend income from our strategic investment in Automotive Holdings Group Ltd (AHG) and gains on sale of investments and property also contributed to the Group’s record result in 2016. Dividends Due to strong operational cash flow and increased earnings per share (EPS), a fully franked final dividend of 22.0 cents per share (2015: 20.0 cents) has been approved for payment on 18 April 2017 to shareholders who are registered on 30 March 2017 (Record Date). When combined with the interim dividend of 13.0 cents paid in October 2016, the total dividend based on 2016 earnings is 35.0 cents per share (2015: 32.0 cents) fully franked, an increase of 9% on 2015. The Company’s dividend reinvestment plan (DRP) will not operate in relation to the final dividend. Dividends paid to members during the year under review were as follows:
Year ended 31 December 2016
2015
$’000 $’000 Final ordinary dividend for the year ended 31 December 2015 of 20.0 cents (2014: 18.0 cents) per share paid on 15 April 2016
37,015 32,239
Interim ordinary dividend of 13.0 cents (2015: 12.0 cents) per share paid on 7 October 2016
24,625 22,089
61,640 54,328
A.P. EAGERS LIMITED DIRECTORS’ REPORT
4
External Environment According to Federal Chamber of Automotive Industry statistics, Australia’s new motor vehicle sales increased by 2.0% in 2016 to 1,178,133 units compared to a 3.8% increase in 2015. Whilst growth reduced in 2016 this represents a record year of sales exceeding the previous set in 2015. New vehicle sales in Western Australia and Queensland decreased on the pcp by -5.6% and -1.1%, respectively. Strong growth was experienced in New South Wales (4.4%), ACT (4.3%), South Australia (3.9%) and Victoria (3.4%). Private sales decreased by -5.8% but this was more than offset by a 13.0% increase in business sales. Luxury brands such as Audi, BMW, Mercedes-Benz, Land Rover, Volvo, Jaguar, Mini, Lexus, Porsche and Infiniti all recorded record sales as their respective lower-priced product offerings captured market share, with entry to new model segments key to a large part of this growth. This segment grew from 10.4% to 11.4% of total market share. Traditional fuel vehicles made up 99% of all new vehicle sales with the sale of electric vehicles reducing 80% to 219 units in 2016. Australian manufactured vehicles represented only 7.4% (2015: 8.4%) of new cars sold in the national market in 2016. Business Initiatives During 2016 our car retailing acquisitions expanded into new geographic territories, including Melbourne, Tasmania, Toowoomba, Hervey Bay and Townsville. Many existing brands represented by A.P. Eagers were included in this geographical expansion along with a new franchise relationship with Mercedes-Benz passenger cars at Doncaster and Ringwood in Victoria and at Toowoomba in Queensland. The disciplined integration of these acquisitions has created EPS growth during 2016, and most importantly has laid the foundation for further EPS growth from these business units during 2017 as the full operational benefits are extracted from these acquisitions. Our all-new Carzoos retail store aimed at delivering a completely new way for customers to buy and sell used cars was launched in September 2016 at Westfield Garden City shopping centre in southern Brisbane. A second store opened in North Lakes in northern Brisbane in November. Carzoos is supported by the Company’s new finance initiative, Simplr, aimed at providing a completely new and entirely consumer-centric finance option that leverages the Group’s extensive portfolio of partner finance providers. Redevelopment of the Group’s Newstead dealership properties continues with the opening of the new Volkswagen dealership in April 2016. The redevelopment of Land Rover and Jaguar dealerships commenced in June and is expected to be completed in April 2017 when the Company exits two thirds of the Fortitude Valley site. The strategic 19.99% shareholding in AHG as at 31 December was valued at $262.0 million based on their closing share price of $3.95 per share (2015: $4.52). Whilst not included in the Company’s Statutory Profit after Tax, a before tax unrealised loss of $37.8 million resulting from the reduction in AHG’s end of year share price, has been recognised in the Statement of Comprehensive Income for the 2016 year. Financial Performance Total revenue increased by 18.1% to $3.8 billion in 2016 (2015: $3.2 billion), with all business units reflecting increases in vehicle sales. The additional contribution from new business acquisitions and strong trading in the NSW car division also combined to boost total revenue. On a like-for-like basis, revenue increased by 5.3% compared to the pcp. EBITDA increased by 10.2% to $179.8 million (2015: $163.1 million). EBITDA/Revenue of 4.7% (2015: 5.0%) was down as compared to pcp while the NPBT/Sales ratio remained consistent at 3.7% (2015: 3.7%). On an underlying basis NPBT/Sales for 2016 was 3.6%, down from 3.9% in 2015. A before tax profit of $1.1 million (net) was realised on the early settlement of the property in Woolloongabba in 2016, as compared to a $3.0 million gain on sale of properties in 2015. Furthermore, a profit before tax

A.P. EAGERS LIMITED DIRECTORS’ REPORT
5
of $1.2 million was realised on the revaluation of a property at Brookvale, offsetting a revaluation decrement recorded against the same property in 2010. This $1.2 million positive compared to a $2.1 million loss before tax realised on the revaluation of a property in 2015. Borrowing costs increased by 14.5% to $24.4 million (2015: $21.3 million), reflecting higher average debt (including additional bailment finance for the businesses acquired in 2016) being partially offset by lower margins and interest rates. The increase in depreciation and amortisation costs by 5.9% to $14.0 million (2015: $13.2 million) reflects the additional depreciation on businesses and associated property acquired in 2016 and higher development and refurbishment capital expenditure in 2016 which increased to $19.3 million from $18.9 million in 2015. Business acquisition costs of $1.8 million were expensed in the financial year relating to the Birrell, Crampton Automotive and Tony Ireland Group acquisitions, compared to $0.2 million in 2015. The Company’s net cash provided by operating activities was $110.7 million in 2016 (2015: $84.6 million). This increase was due to contributions from acquisitions made in 2016, improved profitability together with lower tax payments compared to 2015 which included capital gains tax paid on the properties sold in 2014. Results Summary Consolidated results
Year Ended 31 December
2016 $’000
2015 $’000
Increase/ (Decrease)
Revenue from operations 3,779,738 3,201,755 18.1%
Other revenue 53,484 44,621 19.9%
Total revenue 3,833,222 3,246,376 18.1%
Earnings before interest, tax, depreciation and amortisation and impairment (EBITDA)
179,776 163,077 10.2%
Depreciation and Amortisation (13,993) (13,216) 5.9%
Impairment charge/net reversal - (7,610) (100.0%)
Earnings before interest and tax (EBIT)
165,783 142,251 16.5%
Borrowing costs (24,378) (21,293) 14.5%
Profit before tax 141,405 120,958 16.9% Income tax expense (35,879) (33,943) 5.7%
Profit after tax Non-controlling interest in subsidiaries
Attributable profit after tax
105,526 (1,542)
103,984
87,015 (798)
86,217
21.3% X93.2%
20.6%
Earnings per share - basic 55.4 cents 47.6 cents 16.4%
This report is based on accounts which have been audited.
Segments (1)
The Profit contribution from the Company’s Car Retail segment was 6.8% higher at $104.6 million compared to $98.0 million in 2015. Revenue increased by 19.5%, with the increase primarily attributable to the strong trading in NSW and contribution from the acquired Birrell, Crampton Automotive and Tony

A.P. EAGERS LIMITED DIRECTORS’ REPORT
6
Ireland Group’s. The strong trading was also reflected in the service departments with the focus on service retention, transactional margins and workshop efficiency all driving a record service result. The National Truck Division (Truck Retail segment) delivered a significantly improved profit performance of $6.3 million compared to a $3.2 million loss in 2015 which included the goodwill impairment write down of $5.5 million. Revenue increased by 5.4% reflecting strong performance in all departments including significantly improved profits from the used truck and service divisions. The value of the property portfolio increased to $299 million as at 31 December 2016 compared to $249 million as at 31 December 2015 due primarily to the acquisition of five properties during the year including three dealership sites for the Mercedes-Benz business in Victoria and favourable adjustments to property fair values. The Property segment profit contribution of $28.2 million was higher than the previous year of $16.3 million, due to the $1.1 million gain realised on settlement of a Woolloongabba property together with property valuation increases of $12.1 million primarily in the Queensland portfolio, of which $1.2 million was recognised as profit before tax. The Investment segment registered a pre-tax loss of $24.0 million for 2016 as compared to a gain of $61.1 million for the pcp, due primarily to an unrealised revaluation loss on the AHG investment of $37.8 million. This reflected a 31 December 2016 AHG closing share price of $3.95 per share compared to $4.52 as at 31 December 2015.
(1) Note: changes in fair value of property and investments are recognised as profit and loss adjustments for segment reporting purposes but are not recorded in the Group’s Statutory Net Profit After Tax
Financial Position Our financial position and interest coverage remained strong, although total debt and gearing ratios increased during 2016 as a result of additional debt to fund the acquisition of new businesses, property and AHG shares. $50 million in cash received from property sales during the year was also used to fund these acquisitions. EBITDA Interest Cover (EBITDA/Borrowing costs) was 7.4 times as at 31 December 2016 compared to 7.0 times as at June 2016 and 7.6 times as at 31 December 2015. Corporate debt (Term and Capital Loan Facility) net of cash on hand as at 31 December 2016 was higher at $266.0 million (2015: $171.5 million) and total debt including vehicle bailment net of cash on hand was higher at $751.9 million as compared to $576.7 million at 31 December 2015. The increase was primarily due to additional debt drawn down to fund the Birrell and Crampton Automotive Group acquisitions and additional bailment finance consistent with seasonal inventory movements and related to businesses acquired during the year. Total gearing (Debt /Debt + Equity), including bailment inventory financing and finance leases, was 50.2% as at 31 December 2016, as compared to 46.6% as at 31 December 2015. Bailment finance is cost effective short-term finance secured against vehicle inventory on a vehicle by vehicle basis. Gearing excluding bailment and finance leases and including cash on hand, was 25.8% as at 31 December 2016 compared to 19.6% at the end of 2015. During the year, additional debt of $73.4 million was drawn down to fund the business and property acquisitions and additional shares acquired in AHG. Total inventory levels increased to $625.0 million at 31 December 2016 from $530.2 million at 31 December 2015 primarily due to additional new and used car/truck inventory from the Birrell, Crampton Automotive and Tony Ireland Group acquisitions. Net tangible assets reduced to $2.44 per share as at 31 December 2016, compared to $2.95 per share as at 31 December 2015, due to increased intangibles acquired as part of Birrell, Crampton Automotive and Tony Ireland Group acquisitions and lower value of AHG investment. Outlook and Strategy Update The national new vehicle market continues to grow with low interest rates supporting customer affordability and exceptional product offerings driving customer demand.

A.P. EAGERS LIMITED DIRECTORS’ REPORT
7
Strategically, the Company remains focussed on automotive retail and a two-pronged approach of driving value from existing business through process improvement, operating synergies, portfolio management and organic growth, whilst taking advantage of value adding acquisition opportunities as they present themselves. Key focus areas for 2017 are:
Delivering further EPS growth from the Birrell Group, Crampton Automotive Group and Tony Ireland Group acquisitions;
Implementing appropriate operational changes in response to any announcement by ASIC regarding regulatory rule changes for Finance & Insurance (18 month lead time expected);
The ongoing development and optimisation of our existing used car business model now re-launched and branded Zooper;
The further expansion of the all-new Carzoos and Simplr business model following the opening of two shopping centre stores in 2016;
Continued redevelopment and reorganisation of inner city Brisbane facilities (Newstead, Woolloongabba and Windsor) to provide improved long-term solutions for all stakeholders;
Further rationalisation of our Parts business to reduce the cost base, improve efficiency and eliminate sub-economic business trading terms;
A renewed focus on all business processes to deliver the optimal operating cost; and Earnings accretive dealership and ancillary market acquisitions.
Significant Changes in the State of Affairs In the Directors’ opinion there was no significant change in the state of affairs of the Group during the financial year that is not disclosed in this report or the consolidated financial report. Matters Subsequent to the End of the Financial Year The Directors are not aware of any matter or circumstance not dealt with in this report or the consolidated financial report that has arisen since the end of the year under review and has significantly affected or may significantly affect the Group’s operations, the results of those operations or the state of affairs of the Group in future financial years. Environmental Regulation The Group’s property development and service centre operations are subject to various environmental regulations. Environmental licences are held for particular underground petroleum storage tanks. Planning approvals are required for property developments undertaken by the Group in relevant circumstances. Authorities are provided with appropriate details and to the Directors’ knowledge developments during the year were undertaken in compliance with planning requirements in all material respects. Management works with regulatory authorities, where appropriate, to assist compliance with regulatory requirements. There were no material adverse environmental issues during the year to the Directors’ knowledge.

A.P. EAGERS LIMITED DIRECTORS’ REPORT
8
Remuneration Report
1. Principles Used to Determine Remuneration The board as a whole is responsible for recommending and reviewing the remuneration arrangements of non-executive Directors, whilst the board (excluding the Chief Executive Officer) reviews the performance of the Chief Executive Officer on a continual basis and ensures the reward framework is appropriate. To assist the board, the Audit, Risk & Remuneration Committee reviews and makes recommendations regarding these remuneration arrangements. The Chief Executive Officer in consultation with the Chairman reviews the performance of the Group’s senior executives on an ongoing basis and ensures the appropriateness of their reward framework. Remuneration packages are intended to properly reflect the individual’s duties and responsibilities, be competitive in attracting, retaining and motivating staff of the highest quality and be aligned to shareholder interests. The remuneration framework for executives has been developed to provide, where appropriate, a high proportion of “at risk” remuneration. This is designed to reflect competitive reward for contribution to growth in Group profits and shareholder wealth. In considering the impact of the Group’s performance on shareholder wealth, the Directors have regard to various factors including the following metrics:
2016 2015 2014 2013 2012
Statutory NPAT ($ million) 105.5 87.0 76.7 64.0 55.6
Statutory Earnings per share - basic (c) 55.4 47.6 43.0 36.4 34.0
Dividend per share (c) 35 32 27 23 20
Share Price at year end ($) 9.22 12.70 5.98 4.96 4.38
2. Non-executive Directors’ Remuneration Framework
Non-executive Directors are remunerated for their services by way of fees (and where applicable, superannuation) from the maximum amount approved for that purpose by shareholders in general meeting, currently $750,000 per annum, which was fixed at the annual general meeting in 2015. For the year under review, non-executive Director fees were $85,000 per annum plus superannuation, and the Chairman’s fee was $100,000 per annum plus superannuation. The board, with the assistance of the Audit, Risk & Remuneration Committee, annually reviews non-executive Director fees, taking into account relevant market conditions. Non-executive Directors do not participate in schemes designed for the remuneration of executives, equity schemes or retirement allowance programmes, nor do they receive performance-based bonuses.
3. Executives’ Remuneration Framework
a) Base Pay Each executive is offered a competitive base pay to reflect the market for a comparable role. Base pay is reviewed annually and on promotion to ensure it remains competitive with the market. It may be delivered as a combination of cash and superannuation that the executive elects to salary sacrifice.

A.P. EAGERS LIMITED DIRECTORS’ REPORT
9
b) Benefits
Executives receive benefits including the provision of fully maintained motor vehicles, personal health and fitness programs and, in the case of the Chief Executive Officer, personal insurance. Retirement benefits are delivered under superannuation funds providing accumulation benefits. No lump sum defined benefits are provided.
c) Short-term Performance Incentives
(i) Incentive / Bonus Non-commission based key management personnel are eligible to receive short-term incentive payments of up to 30% of their base salary in accordance with contractual arrangements. This is not available to commission based key management personnel, the Chief Executive Officer or non-executive Directors. The allocations are determined on a discretionary basis during annual review by the Chief Executive Officer in consultation with the Chairman after considering individual and Company achievements and performances.
(ii) Commission Structure A commission structure is included in the remuneration for the General Manager Queensland and Northern Territory. The commission is set at a percentage of net profit before tax of relevant business units and is therefore based on measurable business performance and designed to improve shareholder value.
d) Executive Incentive Plan (EIP) The EIP was approved by shareholders at the annual general meeting in 2013. It is intended as both a long-term and short-term incentive for key management personnel, focussing on corporate performance and the creation of shareholder value over multi-year periods. The EIP is not available to non-executive Directors. Through the EIP, executives are driven to improve the Company’s performance and shareholder return. This is accomplished through the grant of performance rights and options which reward the achievement of pre-determined Group performance hurdles and allow executives to share in the Company’s growth. The performance hurdles are explained in further detail below. A performance right is a right to be given a fully paid ordinary share in the Company at a nil exercise price upon the achievement of performance hurdles. An option is a right to be given a fully paid ordinary share upon payment of an exercise price and achievement of performance hurdles. The exercise price is the market share price on or about the grant date or when the executive agreed in principle to participate in the plan. The performance rights and options are divided into separate tranches for each annual performance period. Each tranche of options may be further divided into sub-tranches. The tranches and sub-tranches are tested against the performance hurdles for the relevant performance period.
(i) Performance Hurdles Pre-determined performance hurdles for the relevant performance period must be achieved for performance rights and options to vest. Performance hurdles include:
• the Company must meet the applicable EPS hurdle (as described below). • the Company must meet any prescribed interest cover ratio, being at least 2.5 times. • the executive must remain permanently employed by the Group.
All performance hurdles for a performance period must be met for the relevant rights and options to vest. The board does, however, retain discretion to waive hurdles in exceptional circumstances where it is believed to be in the Company’s best interests to do so.

A.P. EAGERS LIMITED DIRECTORS’ REPORT
10
(ii) EPS Hurdles A separate EPS performance hurdle applies for each tranche or sub-tranche of performance rights and options. These EPS hurdles are pre-determined using a base-line EPS when the participant agreed to join the plan. The Company must achieve a minimum of 7% annual compound growth in diluted EPS above the base-line before any performance rights or options will vest for the performance period, with 10% annual compound growth required for all performance rights and options to vest for the period. As these “at risk” earnings are demonstrably linked to the creation of shareholder value, it is considered that if an EPS hurdle is not achieved at the end of a 12 month performance period, re-testing would be appropriate to allow for market reaction to the Company’s longer term strategic initiatives. In these circumstances, re-testing would take place 12 months later. If the EPS hurdle is not achieved on the re-test, it may be re-tested a second time a further 12 months later. However, there cannot be more than two re-tests. Performance rights and options immediately lapse if they do not vest on the second re-test.
(iii) CEO’s Participation in EIP At the Company’s annual general meeting in 2014, shareholders approved the Chief Executive Officer, Mr Ward, participating in the EIP for the five years from 2015 to 2019. With 96.6% of proxy votes in favour or at the Chairman’s discretion, shareholders approved the following:
• Mr Ward’s performance hurdles are measured over the five year period 2015 to 2019.
• Before any of Mr Ward’s performance rights or options will vest for an individual year, the Company must achieve at least 7% annual compound growth in diluted EPS above the base-line EPS. The base-line was set at the diluted EPS for 2013. This base-line was used in order to give shareholders visibility of the base-line before they approved Mr Ward’s rights and options at the annual general meeting in 2014.
• For 100% of Mr Ward’s performance rights and options to vest for the five years, the Company must achieve at least 10% annual compound growth in diluted EPS above the base-line.
The cost to the Company of Mr Ward’s participation in the EIP is determined as follows:
• There has been no increase to the average annual cost to the Company of Mr Ward’s participation in the EIP since 2010.
• If 100% of the performance rights and options are to vest over the five year period 2015 to 2019 (requiring at least 10% annual compound growth in diluted EPS for five years), the recognised cost of the plan will average $850,000 per annum being the fair value at grant date. However, accounting standards require that the cost be recognised based on the progressive recognition of each share option grant over its expected vesting period, as shown in the remuneration table on page 14, which results in a higher overall cost of the EIP in the earlier years and a lower cost in later years. On the assumption that all performance hurdles will be achieved over the five year period, the total cost recognised in each year will be as shown in the following graphs.
• If no performance hurdles at all were to be achieved over the five year period, then no performance
rights or options would vest and the plan would cost the Company zero dollars.
• By way of comparison, if only 50% of the performance rights and options by value were to vest each year over the five year period (requiring 7% annual compound growth in diluted EPS for five years), the cost of the plan would be on average $425,000 per annum for 5 years.

A.P. EAGERS LIMITED DIRECTORS’ REPORT
11
Accounting accrual cost of CEO’s participation in EIP – progressive recognition based, assuming all performance hurdles are achieved.
Average annual cost of CEO’s participation in EIP, assuming all performance hurdles are achieved.
(iv) Grants to Key Management Personnel
The following tables show details of current grants of performance rights and options over unissued ordinary shares, which were granted to key management personnel in or before the year under review. No rights or options were granted to, lapsed or were exercised by, key management personnel during or after the year under review, except as shown in these tables. Chief Executive Officer
Tranche No. Grant Date
Performance Rights Options End of 1st performance
period Status No.
granted No.
lapsed No.
exercised(1) Fair
value No.
granted No.
lapsed No.
exercised(1) Fair
value
1 4 July 2014 83,661 - 83,661 $5.08 467,032 - 50,000 $0.91 31 Dec 2015 Vested without re-testing
2 4 July 2014 87,268 - - $4.87 452,127 - - $0.94 31 Dec 2016 Vested without re-testing
3 4 July 2014 91,006 - - $4.67 447,368 - - $0.95 31 Dec 2017 Unvested
4 4 July 2014 94,866 - - $4.48 420,792 - - $1.01 31 Dec 2018 Unvested
5 4 July 2014 99,067 - - $4.29 416,666 - - $1.02 31 Dec 2019 Unvested
(1) Performance rights are automatically exercised upon vesting. 50,000 options that vested for 2015 were exercised during the year under review. Options and rights that were exercised during the year under review were valued at $1,275,714 on the day of exercise.

A.P. EAGERS LIMITED DIRECTORS’ REPORT
12
General Manager Queensland and Northern Territory
Tranche No. Grant Date
Performance Rights Options End of 1st performance
period Status No.
granted No.
lapsed No.
exercised(1) Fair value
No. granted
No. lapsed
No. exercised(1)
Fair value
1 29 Oct 2009 - - - - 104,165 - 104,165 $0.36 31 Dec 2010 Vested without re-testing
2 29 Oct 2009 - - - - 203,805 - 203,805 $0.368 31 Dec 2011 Vested without re-testing
3 29 Oct 2009 - - - - 202,705 - 202,705 $0.37 31 Dec 2012 Vested without re-testing
4 29 Oct 2009 - - - - 203,805 - 203,805 $0.368 31 Dec 2013 Vested without re-testing
5 29 Oct 2009 - - - - 199,470 - 199,470 $0.376 31 Dec 2014 Vested without
re-testing
6 4 July 2014 19,685 - 19,685 $5.08 109,.890 - - $0.91 31 Dec 2015 Vested without
re-testing
7 4 July 2014 20,533 - - $4.87 106,382 - - $0.94 31 Dec 2016 Vested without
re-testing
8 4 July 2014 21,413 - - $4.67 105,263 - - $0.95 31 Dec 2017 Unvested
9 4 July 2014 22,321 - - $4.48 99,009 - - $1.01 31 Dec 2018 Unvested
10 4 July 2014 23,310 - - $4.29 98,039 - - $1.02 31 Dec 2019 Unvested
(1) Performance rights are automatically exercised upon vesting. 913,950 options that had vested for the years 2010 to 2014 were exercised during the year under review. Options and rights that were exercised during the year were valued at $9,391,103 on the day of exercise.
General Counsel & Company Secretary
Tranche No. Grant Date
Performance Rights Options End of 1st performance
period Status No.
granted No.
lapsed No.
exercised(1) Fair value
No. granted
No. lapsed
No. exercised(1)
Fair value
1 1 June 2010 - - - - 52,640 - 52,640 $0.518 31 Dec 2011 Vested without re-testing
2 1 June 2010 - - - - 60,850 - 60,850 $0.53 31 Dec 2012 Vested without re-testing
3 27 Mar 2013 - - - - 26,880 - - $0.93 31 Dec 2013 Vested without re-testing
4 27 Mar 2013 - - - - 26,880 - - $0.93 31 Dec 2014 Vested without re-testing
5 27 Mar 2013 - - - - 26,040 - - $0.96 31 Dec 2015 Vested without re-testing
6 27 Mar 2013 - - - - 25,510 - - $0.98 31 Dec 2016 Vested without re-testing
7 27 Mar 2013 - - - - 25,250 - - $0.99 31 Dec 2017 Unvested
8 4 July 2014 2,460 - 2,460 $5.08 13,736 - - $0.91 31 Dec 2015 Vested without re-testing
9 4 July 2014 2,566 - - $4.87 13,297 - - $0.94 31 Dec 2016 Vested without re-testing
10 4 July 2014 2,676 - - $4.67 13,157 - - $0.95 31 Dec 2017 Unvested
11 4 July 2014 2,790 - - $4.48 12,376 - - $1.01 31 Dec 2018 Unvested
12 4 July 2014 2,913 - - $4.29 12,254 - - $1.02 31 Dec 2019 Unvested
(1) Performance rights are automatically exercised upon vesting. 113,490 options that had vested for the years 2011 and 2012 were exercised during the year under review. Options and rights that were exercised during the year were valued at $917,092 on the day of exercise.

A.P. EAGERS LIMITED DIRECTORS’ REPORT
13
Chief Financial Officer
Tranche No. Grant Date
Performance Rights Options End of 1st performance
period Status No.
granted No.
lapsed No.
exercised(1) Fair value
No. granted
No. lapsed
No. exercised(1)
Fair value
1 12 June 2015 2,227 - 2,227 $8.98 14,084 - - $1.42 31 Dec 2015 Vested without re-testing
2 12 June 2015 4,624 - - $8.65 27,027 - - $1.48 31 Dec 2016 Vested without re-testing
3 12 June 2015 4,796 - - $8.34 26,143 - - $1.53 31 Dec 2017 Unvested
4 12 June 2015 4,975 - - $8.04 25,316 - - $1.58 31 Dec 2018 Unvested
5 12 June 2015 5,167 - - $7.74 25,000 - - $1.60 31 Dec 2019 Unvested
(1) Performance rights are automatically exercised upon vesting. No options were exercised during the year under review. Rights that were exercised during the year were valued at $24,742 on the day of exercise.
Further details of the performance rights and options granted under the EIP are specified in notes 36 and 37 to the consolidated financial report. 4. Hedging The board has adopted a policy which prohibits any Director or employee who participates in an equity plan from using derivatives, hedging or similar arrangements to reduce or eliminate the risk associated with the plan in relation to unvested securities or securities that are subject to trading restrictions, without the Chairman’s approval. Any breach will result in forfeiture or lapsing of the unvested securities or additional performance hurdles or trading restrictions being imposed, at the board’s discretion. 5. Executive Employment Agreements Executives who are key management personnel are employed under common employment agreements. The agreements do not have a finite term, can be terminated by either employer or employee giving three months’ notice and do not contain any termination payment arrangements. The board has discretion to extend the termination notice period that may be given to an executive and to make payments upon termination, as appropriate. The Chief Executive Officer’s employment agreement differs from that of other executives as follows:
a) The Company may terminate the Chief Executive Officer’s employment if he is unable to satisfactorily perform his duties due to illness, injury or accident for a period of six months or for cause. Termination for any other reason may entitle the Chief Executive Officer to a termination benefit equivalent to two times annual remuneration at the time of termination, subject to any limit imposed by law.
b) The Chief Executive Officer may terminate his employment agreement on six months’ notice unless otherwise agreed with the Company.
6. Details of Remuneration Key management personnel include Directors and executives who have authority and responsibility for planning, directing and controlling the activities of the Group. Remuneration details of key management personnel are set out in the following tables.

A.P. EAGERS LIMITED DIRECTORS’ REPORT
14
Post-employment
benefits
Share-based payments
2016
Salary & fees
Bonus & commission(4)
Non-monetary & other
benefits(1)Superannuation
benefits
Performance Rights &
Options(2) (3) Total
Performance-related
percentage$ $ $ $ $ $ %
DirectorsT B Crommelin Chairman 100,000 - 635 9,500 - 110,135 -M A Ward Managing Director 1,200,000 - 136,556 35,000 948,336 2,319,892 41N G Politis Non-executive Director 85,000 - 635 8,075 - 93,710 -P W Henley Non-executive Director 85,000 - 635 8,075 - 93,710 -D T Ryan Non-executive Director 85,000 - 635 8,075 - 93,710 -D A Cowper Non-executive Director 85,000 - 635 8,075 - 93,710 -M J Birrell Non-executive Director(5) 42,500 - 275 4,038 - 46,813 -
1,682,500 - 140,006 80,838 948,336 2,851,680
ExecutivesK T Thornton General Manager Qld & NT 200,004 819,230 62,663 19,616 223,138 1,324,651 79D G Stark General Counsel & Company Secretary 286,677 73,000 46,554 27,234 55,218 488,683 26S A Moore Chief Financial Officer 306,006 62,400 30,116 22,253 101,330 522,105 31
792,687 954,630 139,333 69,103 379,686 2,335,439
(4) For Mr Thornton, this is a commission representing a percentage of net profit before tax of relevant business units and is therefore based on measurable business performance and designed to improve shareholder value. No commission is included for any other key management personnel.
Short-term benefits
(1) Includes benefits such as the provision of motor vehicles, insurance policy costs and the movement in the provision for the individual’s employee entitlements.
(2) Performance rights and options granted under the EIP are valued using a binomial tree methodology. A pre-determined value of the portion of the rights and options attributable to the year under review has been expensed in the income statement in conformity with AASB 2 and reflected in each recipient’s remuneration. In each year, performance rights and options vested under the EIP for the previous year. Vesting is subject to the achievement of performance hurdles as previously detailed in this Remuneration Report.(3) The share-based payment is based on progressive recognition of each award grant over its expected vesting period, which results in an increased cost in the earlier years of the EIP and a reduced cost in later years on the assumption that all performance hurdles will be achieved over the five year period. For further details, refer to commentary on page 10 under the heading “CEO’s Participation in EIP” of which the treatment of share plan expense is applicable to all key management personnel.
(5) Mr Birrell was appointed as a Director on 27 July 2016.

A.P. EAGERS LIMITED DIRECTORS’ REPORT
15
Post-employment
benefits
Share-based payments
2015
Salary & fees
Bonus & commission(5)
Non-monetary & other
benefits(1)Superannuation
benefits
Performance Rights &
Options(2) (3) Total
Performance-related
percentage$ $ $ $ $ $ %
DirectorsT B Crommelin Chairman 100,000 - 742 9,500 - 110,242 -M A Ward Managing Director 1,200,000 - 177,416 35,000 1,122,362 2,534,778 44N G Politis Non-executive Director 85,000 - 742 8,075 - 93,817 -P W Henley Non-executive Director 85,000 - 742 8,075 - 93,817 -D T Ryan Non-executive Director 85,000 - 742 8,075 - 93,817 -D A Cowper Non-executive Director 85,000 - 742 8,075 - 93,817 -
1,640,000 - 181,128 76,800 1,122,362 3,020,290
ExecutivesK T Thornton General Manager Qld & NT 200,000 931,645 131,025 19,307 264,085 1,546,062 77S G Best Chief Financial Officer (4) 192,500 52,500 68,794 18,288 105,790 437,872 36D G Stark General Counsel & Company Secretary 265,000 97,000 73,386 25,175 75,438 535,999 32S A Moore Chief Financial Officer (4) 125,000 25,000 16,858 6,923 66,664 240,445 38
782,500 1,106,145 290,063 69,693 511,977 2,760,378
Short-term benefits
(1) Includes benefits such as the provision of motor vehicles, insurance policy costs and the movement in the provision for the individual’s employee entitlements. This includes $67,300 as a provision for long service leave for Mr Ward, $81,019 for Mr Thornton, $37,731 for Mr Best and $46,213 for Mr Stark.(2) Performance rights and options granted under the EIP are valued using a binomial tree methodology. A pre-determined value of the portion of the rights and options attributable to the year under review has been expensed in the income statement in conformity with AASB 2 and reflected in each recipient’s remuneration. In each year, performance rights and options vested under the EIP for the previous year. Vesting is subject to the achievement of performance hurdles as previously detailed in this Remuneration Report.(3) The share-based payment is based on progressive recognition of each award grant over its expected vesting period, which results in an increased cost in the earlier years of the EIP and a reduced cost in later years on the assumption that all performance hurdles will be achieved over the five year period. For further details, refer to commentary on page 10 under the heading “CEO’s Participation in EIP” of which the treatment of share plan expense is applicable to all key management personnel.
(5) For Mr Thornton, this includes a commission of $846,645, which is set at a percentage of net profit before tax of relevant business units and is therefore based on measurable business performance and designed to improve shareholder value. No commission is included for any other key management personnel.
(4) With the appointment of Ms Moore as Chief Financial Officer on 3 August 2015, Mr Best ceased in his capacity as Chief Financial Officer and a member of key management personnel. This table therefore includes Mr Best's remuneration for the period ending 3 August 2015.

A.P. EAGERS LIMITED DIRECTORS’ REPORT
16
7. Relevant Interest in the Company’s Shares Held by Key Management Personnel
Directors’ Interests The relevant interest of each Director in the shares, rights and options issued by the Company as at the date of this report are as follows:
Ordinary Shares (fully paid) Share Options Performance Rights
T B Crommelin 383,286 - -
N G Politis 68,521,091 - -
M A Ward 4,211,387 2,153,985(1) 372,207(1)
P W Henley 113,092 - -
D T Ryan - - -
D A Cowper 15,053 - -
M J Birrell 2,000,000 - - (1) Share options and performance rights vest only if performance hurdles are met in accordance with the Executive
Incentive Plan, as described in the Remuneration Report.
2016 Dividend ExecutiveAt Reinvestment Incentive At
01-Jan-16 Plan Plan Purchases Sales 31-Dec-16
Directors M A Ward 4,115,085 0 133,661 12,641 50,000 4,211,387N G Politis 68,079,091 0 0 340,048 0 68,419,139P W Henley 111,825 0 0 4,000 2,733 113,092D T Ryan 0 0 0 0 0 0T B Crommelin 357,229 0 0 21,057 0 378,286D A Cowper 8,248 0 0 3,805 0 12,053M J Birrell 0 0 0 2,000,000 0 2,000,000
Executives K T Thornton 448,135 0 933,635 0 953,185 428,585D G Stark 145,624 0 115,950 0 121,000 140,574S A Moore 0 0 2,227 0 0 2,227
73,265,237 - 1,185,473 2,381,551 - 75,705,343
2015 Dividend ExecutiveAt Reinvestment Incentive At
01-Jan-15 Plan Plan Purchases Sales 31-Dec-15
Directors M A Ward 2,854,170 0 3,760,915 0 2,500,000 4,115,085N G Politis 66,085,596 0 0 1,993,495 0 68,079,091P W Henley 107,215 0 0 4,610 0 111,825D T Ryan 0 0 0 0 0 0T B Crommelin 339,229 0 0 18,000 0 357,229D A Cowper 8,248 0 0 0 0 8,248
Executives K T Thornton 390,620 0 57,515 0 0 448,135S G Best 174,785 0 258,345 0 0 433,130D G Stark 71,244 0 74,380 0 0 145,624S A Moore 0 0 0 0 0 0
70,031,107 - 4,151,155 2,016,105 - 73,698,367

A.P. EAGERS LIMITED DIRECTORS’ REPORT
17
Shares Under Option 182,857 options and 33,863 performance rights were granted by the Company over unissued fully paid ordinary shares during the year under review. No options or performance rights have been granted since the end of the year. 3,167,690 shares were issued as a result of the exercise of options and 164,031 shares were issued on the vesting of performance rights during or since the year under review. At the date of this report, there are 8,505,216 unissued shares under option and 752,108 unvested performance rights. Indemnification and Insurance The Company’s constitution provides that, to the extent permitted by law, the Company must indemnify each person who is or has been a Director or Secretary against liability incurred in or arising out of the discharge of duties as an officer of the Company or out of the conduct of the business of the Company and specified legal costs. The indemnity is enforceable without the person having to incur any expense or make any payment, is a continuing obligation and is enforceable even though the person may have ceased to be an officer of the Company. At the start of the financial year under review and at the start of the following financial year, the Company paid insurance premiums in respect of Directors and Officers liability insurance contracts. The contracts insure each person who is or has been a Director or executive officer of the Company against certain liabilities arising in the course of their duties to the Company and its controlled entities. The Directors have not disclosed details of the nature of the liabilities covered or the amount of the premiums paid in respect of the insurance contracts as such disclosure is prohibited under the terms of the contracts. Auditor Deloitte Touche Tohmatsu continues in office as auditor of the Group in accordance with section 327 of the Corporations Act 2001. Non-Audit Services A copy of the auditor’s Independence Declaration as required under section 307C of the Corporations Act 2001 is attached and forms part of this report. The Company may decide to employ its auditor on assignments additional to their statutory audit duties where the auditor’s expertise or experience with the Group is important. Details of the amounts paid or payable to the auditor for audit and non-audit services provided to the Group during the year are set out in note 34 to the consolidated financial report. In accordance with advice received from the Audit, Risk & Remuneration Committee, the Directors are satisfied that the provision of the non-audit services was compatible with the general standard of independence for auditors imposed by the Corporations Act 2001 and did not compromise the auditor independence requirements of the Act because all non-audit services were reviewed by the Committee to ensure they did not impact the partiality and objectivity of the auditor.

A.P. EAGERS LIMITED DIRECTORS’ REPORT
18
Rounding of Amounts to Nearest Thousand Dollars The Company is of a kind referred to in Class Order 98/100 issued by the Australian Securities & Investments Commission, relating to the “rounding off” of amounts in the Directors’ report and financial report. Amounts in the Directors’ report and financial report have been rounded off to the nearest thousand dollars in accordance with that Class Order. This report is made in accordance with a resolution of the Directors.
Martin Ward Director Brisbane, 22 February 2017

Liability limited by a scheme approved under Professional Standards Legislation.
Member of Deloitte Touche Tohmatsu Limited
Deloitte Touche TohmatsuABN 74 490 121 060Level 25 and 26, Riverside Centre123 Eagle StreetBrisbane, QLD, 4000Australia
Phone: +61 7 3308 7000www.deloitte.com.au
22 February 2017
Dear Board MembersA.P. Eagers Limited
In accordance with section 307C of the Corporations Act 2001, I am pleased to provide the followingdeclaration of independence to the directors of A.P. Eagers Limited.
As lead audit partner for the audit of the financial statements of A.P. Eagers Limited for the financialyear ended 31 December 2016, I declare that to the best of my knowledge and belief, there havebeen no contraventions of:
(i) the auditor independence requirements of the Corporations Act 2001 in relation to theaudit; and
(ii) any applicable code of professional conduct in relation to the audit.
Yours sincerely,
DELOITTE TOUCHE TOHMATSU
Stephen TarlingPartnerChartered Accountants
The Board of DirectorsA.P. Eagers Limited5 Edmund StreetNewstead, QLD 4006

A.P. Eagers LimitedABN 87 009 680 013
FINANCIAL STATEMENTSFOR THE YEAR ENDED31 DECEMBER 2016

STATEMENT OF PROFIT OR LOSSFOR THE YEAR ENDED 31 December 2016
CONSOLIDATED
Notes2016$'000
2015$'000
Revenue 3 3,833,222 3,246,376
Other gains and losses excluding impairment 4 4,326 6,426
Share of net profits of associate 42(d) 191 164
Changes in inventories of finished goods and work in progress 94,844 60,957Raw materials and consumables purchased (3,230,501) (2,700,387)Employee benefits expense (311,423) (278,922)Finance costs - net 5(a) (24,378) (21,293)Depreciation and amortisation expense 5(a) (13,993) (13,216)Impairment of non-current assets 5(b) - (7,610)Other expenses (210,883) (171,537)Profit before tax 141,405 120,958
Income tax expense 6 (35,879) (33,943)
Profit for the year 105,526 87,015
Attributable to:Owners of A.P. Eagers Limited 29(b) 103,984 86,217Non-controlling interests 31(c) 1,542 798
105,526 87,015
Cents Cents
Earnings per share:Basic earnings per share 39(a) 55.4 47.6Diluted earnings per share 39(b) 54.0 46.1
The above Statement of Profit or Loss should be read in conjunction with the accompanying notes.
1A.P. Eagers Limited31 December 2016

STATEMENT OF PROFIT OR LOSS AND OTHER COMPREHENSIVE INCOMEFOR THE YEAR ENDED 31 December 2016
CONSOLIDATED
Notes2016$'000
2015$'000
Profit for the year 105,526 87,015
Other comprehensive incomeBlankItems that will not be reclassified subsequently to profit or loss
Gain/(loss) on revaluation of property 29(a) 10,842 2,187Income tax (expense)/benefit relating to items that will not be reclassifiedsubsequently 29(a) (3,253) (656)
7,589 1,531
Items that may be reclassified subsequently to profit or lossGain/(loss) on revaluation of available for sale investment 29(a) (36,819) 49,689Income tax (expense)/benefit 29(a) 11,046 (14,907)Reclassification adjustments relating to available-for-sale financial assets disposed ofin the year 29(a) (1,369) (2,443)
(27,142) 32,339
Fair value gain arising from cash flow hedges during the year 29(a) 405 300Income tax (expense)/benefit 29(a) (121) (89)
284 211
Total other comprehensive income/(loss) for the year (19,269) 34,081
Total comprehensive income for the year 86,257 121,096
Total comprehensive income attributable to:Owners of the parent 84,715 120,298Non-controlling interests 1,542 798
86,257 121,096
The above Statement of Profit or Loss and Other Comprehensive Income should be read in conjunction with the accompanyingnotes.
2A.P. Eagers Limited31 December 2016

STATEMENT OF FINANCIAL POSITIONFOR THE YEAR ENDED 31 December 2016
CONSOLIDATED
Notes2016$'000
2015$'000
Current assetsCash and cash equivalents 8 17,615 37,535Trade and other receivables 9 148,746 109,116Inventories 10 625,007 530,163Current tax receivables 11 3,817 -Prepayments and deposits 12(a) 8,843 8,256Assets classified as held for sale 12(b) - 3,010Property sale receivable 12(c) 9,466 32,013
Total current assets 813,494 720,093
Non-current assetsProperty sale receivable 13(a) - 23,503Other loans receivable 13(b) 10,612 10,317Available-for-sale financial assets 14 264,817 281,817Investments in associates 15 11,893 1,620Property, plant and equipment 16 354,710 291,298Intangible assets 17 298,908 160,762
Total non-current assets 940,940 769,317
Total assets 1,754,434 1,489,410
Current liabilitiesTrade and other payables 18 158,305 133,563Derivative financial instruments 19 210 227Borrowings - bailment and finance lease payable 20(a) 485,875 404,488Current tax liabilities 21 - 124Provisions 22 26,406 19,520
Total current liabilities 670,796 557,922
Non-current liabilitiesBorrowings 23(a) 283,650 209,792Derivative financial instruments 19 206 595Deferred tax liabilities 24 7,447 7,718Provisions 25 9,226 10,374Other 26 19,317 -
Total non-current liabilities 319,846 228,479
Total liabilities 990,642 786,401
Net assets 763,792 703,009
EquityContributed equity 28 364,449 296,060Reserves 29(a) 55,398 105,375Retained earnings 29(b) 335,779 293,435
755,626 694,870
Non-controlling interests 31(c) 8,166 8,139
Total equity 763,792 703,009
The above Statement of Financial Position should be read in conjunction with the accompanying notes.
3A.P. Eagers Limited31 December 2016

STATEMENT OF CHANGES IN EQUITYFOR THE YEAR ENDED 31 December 2016
Consolidated entity Notes
Issuedcapital
$'000
Assetrevaluation
reserve$'000
Hedgingreserve
$'000
Share-based
paymentsreserve
$'000
Investmentrevaluation
reserve$'000
Retainedearnings
$'000
Attributableto owners
of theparent
$'000
Non-controlling
interests$'000
Total$'000
Balance at 1 January2016 296,060 45,192 (575) (3,778) 64,536 293,435 694,870 8,139 703,009Profit for the year - - - - - 103,984 103,984 1,542 105,526Other comprehensiveincome - 7,589 284 - (27,142) - (19,269) - (19,269)Total comprehensiveincome for the year - 7,589 284 - (27,142) 103,984 84,715 1,542 86,257
Transactions withowners in theircapacity as owners:Shares issued asconsideration forbusiness acquisitions 32,450 - - - - - 32,450 - 32,450NCI arising onbusiness acquisition - - - - - - - (368) (368)Share based paymentexpense - - - 2,966 - - 2,966 - 2,966Dividends provided foror paid - - - - - (61,640) (61,640) (1,147) (62,787)Shares issuedpursuant to Staff shareplan 35,939 - - (35,939) - - - - -Payments receivedfrom employees forexercised shares - - - 6,948 - - 6,948 - 6,948Current tax on shareplan - - - (28) - - (28) - (28)Income tax on itemstaken to or transferreddirectly from equity - - - (4,655) - - (4,655) - (4,655)
68,389 - - (30,708) - (61,640) (23,959) (1,515) (25,474)
Balance at 31December 2016 364,449 52,781 (291) (34,486) 37,394 335,779 755,626 8,166 763,792
Balance at 1 January 2015 242,070 61,668 (786) 5,941 32,197 242,480 583,570 7,486 591,056Profit for the year - - - - - 86,217 86,217 798 87,015Other comprehensive income - 1,531 211 - 32,339 - 34,081 - 34,081Total comprehensive incomefor the year - 1,531 211 - 32,339 86,217 120,298 798 121,096
Transactions with owners intheir capacity as owners:Transfer to retained earnings - (18,007) - - - 18,007 - - -Share based payments - - - 3,019 - - 3,019 - 3,019Payment of dividend - - - - - (54,328) (54,328) (145) (54,473)Shares issued pursuant toStaff share plan 53,990 - - (53,990) - - - - -Payments received fromemployees for exercisedshares - - - 10,740 - - 10,740 - 10,740Current tax on share plan - - - 12,352 - - 12,352 - 12,352Income tax on items taken toor transferred directly fromequity - - - 18,160 - 1,059 19,219 - 19,219
53,990 (18,007) - (9,719) - (35,262) (8,998) (145) (9,143)
Balance at 31 December2015 296,060 45,192 (575) (3,778) 64,536 293,435 694,870 8,139 703,009
The above Statement of Changes in Equity should be read in conjunction with the accompanying notes.
4A.P. Eagers Limited31 December 2016

STATEMENT OF CASH FLOWSFOR THE YEAR ENDED 31 December 2016
CONSOLIDATED
Notes2016$'000
2015$'000
Cash flows from operating activitiesReceipts from customers (inclusive of GST) 4,155,091 3,516,726Payments to suppliers and employees (inclusive of GST) (4,012,246) (3,393,453)Receipts from insurance claims 8,737 7,003Interest and other costs of finance paid (24,151) (21,365)Income taxes paid (34,028) (39,870)Dividends received 14,633 13,916Interest received 2,678 1,596
Net cash provided by operating activities 40 110,714 84,553
Cash flows from investing activitiesPayment for acquisition of businesses - net of cash acquired 31(a) (118,333) (669)Payments for property, plant and equipment 16 (52,707) (18,854)Payments for intangible assets (500) (2,510)Proceeds from sale of businesses - 441Proceeds from sale of property, plant and equipment 50,077 4,255Proceeds from sale of available-for-sale financial assets 2,633 9,636Payments for shares in other corporations (29,469) (7,345)
Net cash used in investing activities (148,299) (15,046)
Cash flows from financing activitiesProceeds from issues of shares and other equity securities 29 6,948 10,740Proceeds from borrowings 114,650 45,000Repayment of borrowings (41,146) (57,098)Dividends paid to members of A.P. Eagers Limited 7 (61,640) (54,328)Dividends paid to minority shareholders of a subsidiary (1,147) (63)
Net cash provided by/(used in) financing activities 17,665 (55,749)
Net (decrease)/increase in cash and cash equivalents (19,920) 13,758Cash and cash equivalents at the beginning of the financial year 37,535 23,777
Cash and cash equivalents at the end of the financial year 8 17,615 37,535
The above Statement of Cash Flows should be read in conjunction with the accompanying notes.
5A.P. Eagers Limited31 December 2016

NOTES TO AND FORMING PART OF THE FINANCIAL STATEMENTS31 DECEMBER 2016
1 SUMMARY OF SIGNIFICANT ACCOUNTING POLICIES
(a) General information and basis of preparation
The financial report covers the Group (consolidated entity) of A.P. Eagers Limited and its subsidiaries (consolidated financialstatements). A.P. Eagers Limited is a publicly listed company incorporated and domiciled in Australia.
Compliance with IFRS
These financial statements are general purpose financial statements which have been prepared in accordance with theCorporations Act 2001, Accounting Standards and Interpretations, and comply with other requirements of the law.
The financial statements comprise the consolidated financial statements of the Group. For the purposes of preparing theconsolidated financial statements, the Company is a for-profit entity. Accounting Standards include Australian AccountingStandards. Compliance with Australian Accounting Standards ensures that the financial statements and notes of the companyand the Group comply with International Financial Reporting Standards (IFRS).
Historical cost convention
These financial statements have been prepared under the historical cost convention, as modified by the revaluation of financialassets, derivatives and certain classes of property, plant and equipment to fair value.
Fair Value is the price received to sell an asset or paid to transfer a liability in an orderly transaction between market participantsat the measurement date, regardless of whether that price is directly observable or estimated using another valuation technique.In estimating the fair value of an asset or a liability, the Group takes into account the characteristics of the asset or liability ifmarket participants would take those characteristics into account when pricing the asset or liability at the measurement date. Fairvalue for measurement and/or disclosure purposes in these consolidated financial statements is determined on such a basis,except for share-based payment transactions that are within the scope of IFRS 2, leasing transactions that are within the scopeof IAS 17, and measurements that have some similarities to fair value but are not fair value, such as net realisable value in IAS 2or value in use in IAS 36.
In addition, for financial reporting purposes, fair value measurements are categorised into Level 1, 2 or 3 based on the degree towhich the inputs to the fair value measurements are observable and the significance of the inputs to the fair value measurementsin its entirety, which are described as follows:
• Level 1 inputs are quoted prices (unadjusted) in active markets for identical assets or liabilities that the entity can access atthe measurement date;
• Level 2 inputs are inputs, other than quoted prices included within Level 1, that are observable for the asset or liability, eitherdirectly or indirectly; and
• Level 3 inputs are unobservable inputs for the asset or liability.
Functional and presentation currency
The functional and presentation currency of the Group is the Australian Dollar.
The financial statements were authorised for issue by the directors on the 22nd of February 2017.
Accounting Policies
The following is a summary of the material accounting policies adopted in the preparation of the financial report. The accountingpolicies have been consistently applied, unless otherwise stated.
(b) Basis of consolidation
The consolidated financial statements incorporate the financial statements of A.P. Eagers Limited (the Company or Group) andentities (including structured entities) controlled by the Company and its subsidiaries. Control is achieved when the Company:
• has power over the investee;
• is exposed, or has rights, to variable returns from its involvement with the investee; and
• has the ability to use its power to affect its returns.
The Company reassesses whether or not it controls an investee if facts and circumstances indicate that there are changes to oneor more of the three elements of control listed above.
6A.P. Eagers Limited31 December 2016
NOTES TO AND FORMING PART OF THE FINANCIAL STATEMENTS31 DECEMBER 2016 (continued)
1 SUMMARY OF SIGNIFICANT ACCOUNTING POLICIES (continued)
(b) Basis of consolidation (continued)
When the company has less than a majority of the voting rights of an investee, it has power over the investee when the votingrights are sufficient to give it the practical ability to direct the relevant activities of the investee unilaterally.
The Company considers all relevant facts and circumstances in assessing whether or not the Company’s voting rights in aninvestee are sufficient to give it power, including:
• the size of the Company’s holding of voting rights relative to the size and dispersion of holdings of the other vote holders;
• potential voting rights held by the Company, other vote holders or other parties;
• rights arising from other contractual arrangements; and
• any additional facts and circumstances that indicate that the Company has, or does not have, the current ability to direct therelevant activities at the time that decisions need to be made, including voting patterns at previous shareholders’ meetings.
Consolidation of a subsidiary begins when the Company obtains control over the subsidiary and ceases when the Companyloses control of the subsidiary. Specifically, income and expenses of a subsidiary acquired or disposed of during the year areincluded in the consolidated statement of profit or loss and other comprehensive income from the date the company gains controluntil the date when the Company ceases to control the subsidiary.
Profit or loss and each component of other comprehensive income are attributed to the owners of the Company and to thenon-controlling interests. Total comprehensive income of subsidiaries is attributed to the owners of the Company and to thenon-controlling interests even if this results in the non-controlling interests having a deficit balance. When necessary,adjustments are made to the financial statements of subsidiaries to bring their accounting policies into line with the Group’saccounting policies.
All intragroup assets and liabilities, equity, income, expenses and cash flows relating to transactions between members of theGroup are eliminated in full on consolidation.
(i) Changes in the Groups ownership interests in existing subsidiaries
Changes in the Group’s ownership interests in subsidiaries that do not result in the Group losing control over the subsidiaries areaccounted for as equity transactions. The carrying amounts of the Group’s interests and the non-controlling interests areadjusted to reflect the changes in their relative interests in the subsidiaries. Any difference between the amount by which thenon- controlling interests are adjusted and the fair value of the consideration paid or received is recognised directly in equity andattributed to owners of the Company.
When the Group loses control of a subsidiary, a gain or loss is recognised in profit or loss and is calculated as the differencebetween (i) the aggregate of the fair value of the consideration received and the fair value of any retained interest and (ii) theprevious carrying amount of the assets (including goodwill), and liabilities of the subsidiary and any non-controlling interests. Allamounts previously recognised in other comprehensive income in relation to that subsidiary are accounted for as if the Grouphad directly disposed of the related assets or liabilities of the subsidiary (i.e. reclassified to profit or loss or transferred to anothercategory of equity as specified/permitted by applicable AASBs). The fair value of any investment retained in the former subsidiaryat the date when control is lost is regarded as the fair value on initial recognition for subsequent accounting under AASB 9, whenapplicable, the cost on initial recognition of an investment in an associate or a joint venture.
(ii) Investments in associates
An associate is an entity over which the Group has significant influence. Significant influence is the power to participate in thefinancial and operating policy decisions of the investee but is not control over those policies. If the Group holds, directly orindirectly, 20% or more of the voting power of the investee, it is presumed the Group has significant influence, unless it can beclearly demonstrated that this is not the case.
The results and assets and liabilities of associates are incorporated in these consolidated financial statements using the equitymethod of accounting, except when the investment, or a portion thereof, is classified as held for sale, in which case it isaccounted for in accordance with AASB 5. Under the equity method, an investment in an associate is initially recognised in theconsolidated statement of financial position at cost and adjusted thereafter to recognise the Group’s share of the profit or lossand other comprehensive income of the associate. When the Group’s share of losses of an associate exceeds the Group’sinterest in that associate (which includes any long-term interests that, in substance, form part of the Group’s net investment in theassociate), the Group discontinues recognising its share of further losses. Additional losses are recognised only to the extent thatthe Group has incurred legal or constructive obligations or made payments on behalf of the associate.
7A.P. Eagers Limited31 December 2016

NOTES TO AND FORMING PART OF THE FINANCIAL STATEMENTS31 DECEMBER 2016 (continued)
1 SUMMARY OF SIGNIFICANT ACCOUNTING POLICIES (continued)
(b) Basis of consolidation (continued)
(ii) Investments in associates (continued)
An investment in an associate is accounted for using the equity method from the date on which the investee becomes anassociate. On acquisition of the investment in an associate, any excess of the cost of the investment over the Group’s share ofthe net fair value of the identifiable assets and liabilities of the investee is recognised as goodwill, which is included within thecarrying amount of the investment. Any excess of the Group’s share of the net fair value of the identifiable assets and liabilitiesover the cost of the investment, after reassessment, is recognised immediately in profit or loss in the period in which theinvestment is acquired.
The requirements of AASB 139 are applied to determine whether it is necessary to recognise any impairment loss with respect tothe Group’s investment in an associate. When necessary, the entire carrying amount of the investment (including goodwill) istested for impairment of assets as a single asset by comparing its recoverable amount (higher of value in use and fair value lesscosts of disposal) with its carrying amount. Any impairment loss recognised forms part of the carrying amount of the investment.Any reversal of that impairment loss is recognised in accordance with AASB 136 to the extent that the recoverable amount of theinvestment subsequently increases.
The Group discontinues the use of the equity method from the date when the investment ceases to be an associate, or when theinvestment is classified as held for sale. When the Group retains an interest in the former associate and the retained interest is afinancial asset, the Group measures the retained interest at fair value at that date and the fair value is regarded as its fair valueon initial recognition in accordance with AASB 139. The difference between the carrying amount of the associate at the date theequity method was discontinued, and the fair value of any retained interest and any proceeds from disposing of a part interest inthe associate is included in the determination of the gain or loss on disposal of the associate. In addition, the Group accounts forall amounts previously recognised in other comprehensive income in relation to that associate on the same basis as would berequired if that associate had directly disposed of the related assets or liabilities. Therefore, if a gain or loss previouslyrecognised in other comprehensive income by that associate would be reclassified to profit or loss on the disposal of the relatedassets or liabilities, the Group reclassifies the gain or loss from equity to profit or loss (as a reclassification adjustment) when theequity method is discontinued.
The Group continues to use the equity method when an investment in an associate becomes an investment in a joint venture oran investment in a joint venture becomes an investment in an associate. There is no remeasurement to fair value upon suchchanges in ownership interests.
When the Group reduces its ownership interest in an associate but the Group continues to use the equity method, the Groupreclassifies to profit or loss the proportion of the gain or loss that had previously been recognised in other comprehensive incomerelating to that reduction in ownership interest if that gain or loss would be classified to profit or loss on the disposal of the relatedassets or liabilities.
When a Group entity transacts with an associate of the Group, profits and losses resulting from the transactions with theassociate are recognised in the Group’s consolidated financial statements only to the extent of interests in the associate that arenot related to the Group.
(c) Operating segments
Operating segments are identified based on internal reports that are regularly reviewed by the entity’s chief operating decisionmaker in order to allocate resources to the segment and assess its performance.
The Group has four operating segments being (i) Car Retail (ii) Truck Retail (iii) Property (iv) Investments. Currently the segmentof “Other” is not required.
(d) Revenue
(i) Sales revenue
Revenue from the sales of motor vehicles and parts is recognised when the buyer has accepted the risks and rewards ofownership, generally by taking delivery of the goods.
(ii) Service revenue
Service work on customers’ vehicles is carried out under instruction from the customer. Service revenue is recognised basedupon when services are rendered. Revenue arising from the sale of parts fitted to customers’ vehicles during service isrecognised upon delivery of the fitted parts to the customer upon completion of the service.
(iii) Rental income
Rental income from operating leases is recognised in income on a straightline basis over the lease term.
8A.P. Eagers Limited31 December 2016
NOTES TO AND FORMING PART OF THE FINANCIAL STATEMENTS31 DECEMBER 2016 (continued)
1 SUMMARY OF SIGNIFICANT ACCOUNTING POLICIES (continued)
(d) Revenue (continued)
(iv) Interest revenue
Interest revenue is recognised on a time proportional basis, taking into account the effective interest rates applicable to thefinancial assets.
(v) Dividend revenue
Dividend revenue is recognised when the right to receive a dividend has been established.
Dividends received from associates are accounted for in accordance with the equity method of accounting in the consolidatedfinancial statements.
(vi) Goods and Services Tax (GST)
All revenue is stated net of the amount of Goods and Services Tax (GST).
(e) Finance costs
Borrowing costs are recognised as expenses in the period in which they are incurred. Borrowing costs include:
• interest on bank overdrafts, short and long-term borrowings
• interest on vehicle bailment arrangements
• interest on finance lease liabilities
• amortisation of ancillary costs incurred in connection with the arrangement of borrowings
(f) Taxes
(i) Income tax
The income tax expense or revenue for the period is the tax payable on the current period's taxable income based on thenotional income tax rate for each jurisdiction, adjusted by changes in deferred tax assets and liabilities attributable to temporarydifferences between the tax bases of assets and liabilities and their carrying amounts in the financial statements, and to unusedtax losses.
Deferred tax assets and liabilities are recognised for temporary differences at the tax rates expected to apply when the assetsare recovered or liabilities are settled, based on those tax rates which are enacted or substantively enacted for each jurisdiction.The relevant tax rates are applied to the cumulative amounts of deductible and taxable temporary differences to measure thedeferred tax asset or liability. An exception is made for certain temporary differences arising from the initial recognition of anasset or a liability. No deferred tax asset or liability is recognised in relation to these temporary differences if they arose in atransaction, other than a business combination, that at the time of the transaction did not affect either accounting profit or taxableprofit or loss.
Deferred tax assets are recognised for deductible temporary differences and unused tax losses only if it is probable that futuretaxable amounts will be available to utilise those temporary differences and losses.
Current and deferred tax balances attributable to amounts recognised directly in equity are also recognised directly in equity.
(ii) Goods and services tax (“GST”)
Revenues, expenses, assets and liabilities are recognised net of the amount of GST except:
• where the GST incurred on a purchase of goods and services is not recoverable from the taxation authority, in which casethe GST is recognised as part of the cost of acquisition of the asset or is part of the expense item as applicable; and
• receivables and payables are stated with the amount of GST included.
The net amount of GST recoverable from, or payable to, the taxation authority is included as part of receivables or payables inthe statement of financial position.
Cash flows are included in the Statement of Cash Flows on a gross basis and the GST component of cash flows arising frominvesting and financing activities, which is recoverable from or payable to the taxation authority, are classified as operating cashflows.
9A.P. Eagers Limited31 December 2016

NOTES TO AND FORMING PART OF THE FINANCIAL STATEMENTS31 DECEMBER 2016 (continued)
1 SUMMARY OF SIGNIFICANT ACCOUNTING POLICIES (continued)
(f) Taxes (continued)
(ii) Goods and services tax (“GST”) (continued)
Commitments and contingencies are disclosed net of the amount of GST recoverable from, or payable to, the taxation authority.
(g) Leases
Leases in which a significant portion of the risks and rewards of ownership are retained by the lessor are classified as operatingleases. Payments made under operating leases (net of any incentives received from the lessor) are charged to profit or loss on astraightline basis over the period of the lease.
(h) Business combinations
The purchase method of accounting is used for all business combinations regardless of whether equity instruments or otherassets are acquired. Cost is measured as the fair value of the assets given, shares issued or liabilities incurred or assumed atthe date of exchange. Acquisition related costs are recognised in profit or loss as incurred. Where equity instruments are issuedin an acquisition, the value of the instruments is their published market price as at the date of exchange unless, in rarecircumstances, it can be demonstrated that the published price at the date of exchange is an unreliable indicator of fair value andthat other evidence and valuation methods provide a more reliable measure of fair value. Transaction costs arising on the issueof equity instruments are recognised directly in equity.
Identifiable assets acquired and liabilities and contingent liabilities assumed in a business combination are measured initially attheir fair values at the acquisition date, irrespective of the extent of any non-controlling interest. The excess of the cost ofacquisition over the fair value of the Group’s share of the identifiable net assets acquired is recorded as goodwill (refer to Note1(r)). If the cost of acquisition is less than the fair value of the net assets of the subsidiary acquired, the difference is recogniseddirectly in profit or loss but only after assessment of the identification and measurement of the net assets acquired.
Where settlement of any part of cash consideration is deferred, the amounts payable in the future are discounted to their presentvalues as at the date of acquisition. The discount rate used is the Australian government bond rate that matches the futurematurity period.
If the initial accounting for a business acquisition is incomplete by the end of the reporting period in which the combinationoccurs, the consolidated entity reports provisional amounts for the items for which accounting is incomplete. The provisionalamounts are adjusted during the measurement period (no longer than 12 months from the initial acquisition) on a retrospectivebasis by restating the comparative information presented in the financial statements.
(i) Impairment of long lived assets (excluding goodwill)
Assets that have an indefinite useful life are not subject to amortisation and are tested annually for impairment. Assets that aresubject to amortisation are reviewed for impairment whenever events or changes in circumstances indicate that the carryingamount may not be recoverable. An impairment loss is recognised for the amount by which the asset’s carrying amount exceedsits recoverable amount. The recoverable amount is the higher of an asset’s fair value less costs of disposal and its value in use.For the purposes of assessing impairment, assets are grouped at the lowest levels for which there are separately identifiablecash flows (cash-generating units “CGU”) and these cash flows are discounted using the estimated weighted average cost ofcapital of the asset/CGU. An impairment loss is recognised in profit or loss immediately, unless the relevant asset is carried atfair value, in which case the impairment loss is treated as a revaluation decrease (refer Note 1(p)). Where an impairment losssubsequently reverses, the carrying amount of the asset (CGU) is increased to the revised estimate of its recoverable amount,but only to the extent that the increased carrying amount does not exceed the carrying amount that would have been determinedhad no impairment losses been recognised for the asset (CGU) in prior years. A reversal of an impairment loss is recognised inprofit or loss immediately, unless the relevant asset is carried at fair value,in which case, the reversal of the impairment loss istreated as a revaluation increase (refer Note1(p)).
(j) Cash and cash equivalents
Cash and cash equivalents include cash on hand, deposits held at call with financial institutions, other short term, highly liquidinvestments with original maturities of three months or less that are readily convertible to known amounts of cash and which aresubject to an insignificant risk of changes in value, and bank overdrafts. Bank overdrafts are shown within borrowings in currentliabilities on the statement of financial position.
10A.P. Eagers Limited31 December 2016
NOTES TO AND FORMING PART OF THE FINANCIAL STATEMENTS31 DECEMBER 2016 (continued)
1 SUMMARY OF SIGNIFICANT ACCOUNTING POLICIES (continued)
(k) Receivables
Trade receivables
Trade receivables are recognised initially at fair value and subsequently measured at amortised cost, less provision for doubtfuldebts. Trade receivables are due for settlement no more than 60 days from the date of recognition.
In respect of trade and lease book receivables, collectability is reviewed on an ongoing basis. Debts which are known to beuncollectible are written off. A provision for doubtful debts is raised where some doubt as to collectability exists. The amount ofthe provision is the difference between the asset’s carrying amount and the present value of estimated future cash flows,discounted at the effective interest rate. The amount of the provision is recognised in profit or loss.
(l) Inventories
New motor vehicles are stated at the lower of cost and net realisable value. Demonstrator vehicles are stated at the lower of costand net realisable value. Costs are assigned on the basis of specific identification.
Used motor vehicles are stated at the lower of cost and net realisable value on a unit by unit basis. Net realisable value has beendetermined by reference to the likely net realisable value given the age of the vehicles at year end. This is effected through theapplication of a specific provision percentage against cost of vehicles based on age. Costs are assigned on the basis of specificidentification.
Spare parts and accessories are stated at the lower of cost and net realisable value. Costs are assigned to individual items onthe basis of weighted average cost.
Work in progress is stated at cost. Cost includes labour incurred to date and consumables utilised during the service. Costs areassigned to individual customers on the basis of specific identification.
(m) Investments and other financial assets
Investments are recognised and derecognised on settlement date where the purchase or sale of an investment is under acontract whose terms require delivery of the investment within the time-frame established by the market concerned. They areinitially measured at fair value, net of transaction costs except for those financial assets classified as at fair value through profit orloss which are initially measured at fair value.
Subsequent to initial recognition, investments in associates are accounted for under the equity method in the consolidatedfinancial statements.
The Group classifies its other financial assets in the following categories; (i) available-for-sale financial assets and (ii) loans andreceivables. The classification depends on the purpose for which the financial assets were acquired. Management determinesthe classification of its investments at initial recognition and re-evaluates this designation at each reporting date.
(i) Available-for-sale financial assets
Available-for-sale financial assets are initially measured at cost at date of acquisition, which include transaction costs, andsubsequent to initial recognition, they are carried at fair value. Unrealised gains and losses arising from changes in the fair valueof non-monetary securities classified as available-for- sale are recognised in equity in the available-for-sale investmentsrevaluation reserve. When securities classified as available-for-sale are sold or impaired, the accumulated fair value adjustmentsare included in profit or loss as gains and losses from the sale or impairment of investment securities.
The fair values of quoted investments are based on current bid prices. If the market for a financial asset is not active (and forunlisted securities), the Group establishes fair value by using valuation techniques. These include reference to the fair values ofrecent arm’s length transactions, involving the same instruments or other instruments that are substantially the same, discountedcash flow analysis, and pricing models to reflect the issuer’s specific circumstances.
The Group assesses at each balance date whether there is objective evidence that a financial asset or group of financial assetsis impaired. In the case of equity securities classified as available-for-sale, a significant or prolonged decline in fair value of asecurity below its cost is considered in determining whether the security is impaired. If any such evidence exists foravailable-for-sale financial assets, the cumulative loss measured as the difference between the acquisition cost and the currentfair value, less any impairment loss on that financial asset previously recognised in profit or loss is removed from equity andrecognised in profit or loss.
11A.P. Eagers Limited31 December 2016

NOTES TO AND FORMING PART OF THE FINANCIAL STATEMENTS31 DECEMBER 2016 (continued)
1 SUMMARY OF SIGNIFICANT ACCOUNTING POLICIES (continued)
(m) Investments and other financial assets (continued)
(ii) Loans and receivables
Loans and receivables are non derivative financial assets with fixed or determinable payments that are not quoted in an activemarket. They arise when the Group provides money, goods or services directly to a debtor with no intention of selling thereceivable. They are included in current assets, except for those with maturities greater than 12 months after the balance datewhich are classified as non-current assets. Loans and receivables are included in receivables in the statement of financialposition (Notes 9, 12 and 13).
Loans and receivables are measured at amortised cost using the effective interest method less impairment. Interest isrecognised by applying the effective interest rate classification of its investments at initial recognition and re-evaluates thisdesignation at each reporting date.
(n) Fair value estimation
The fair value of financial assets and financial liabilities must be estimated for recognition and measurement or for disclosurepurposes.
The fair value of financial instruments traded in active markets (such as publicly traded derivatives and available-for-salesecurities) is based on quoted market prices at the balance date. The quoted market price used for financial assets held by theGroup is the current bid price.
The fair value of financial instruments that are not traded in an active market is determined using valuation techniques. TheGroup uses a variety of methods and makes assumptions that are based on market conditions existing at each balance date.Quoted market prices or dealer quotes for similar instruments are used for long-term debt instruments held. Other techniques,such as estimated discounted cash flows, are used to determine fair value for the remaining financial instruments. The fair valueof interest rate swaps is determined based on market expectations of future interest rates.
The nominal value less estimated credit adjustments of trade receivables and payables are assumed to approximate their fairvalues. The fair value of financial liabilities for disclosure purposes is estimated by discounting the future contractual cash flowsat the current market interest rate that is available to the Group for similar financial instruments.
(o) Derivatives
Derivatives are recognised at their fair value at each reporting date. The method of recognising the resulting gain or lossdepends on whether the derivative is designated as a hedging instrument, and if so, the nature of the item being hedged. TheGroup designates certain derivatives as hedges of exposure to variability in cash flows, which includes hedges for highlyprobable forecast transactions (cash flow hedges).
The Group documents at the inception of the transaction the relationship between hedging instruments and hedged items, aswell as its risk management objective and strategy for undertaking various hedge transactions. The Group also documents itsassessments, both at hedge inception and on an ongoing basis, of whether the derivatives that are used in hedging transactionshave been and will continue to be highly effective in offsetting changes in fair values or cash flows of hedged items. Refer furtherdetails in Note 19.
(i) Cash flow hedges
The change in the fair value from remeasuring derivatives that are designated and qualify as cash flow hedges is deferred inequity as a hedging reserve, to the extent that the hedge is effective. The ineffective portion is recognised in profit or lossimmediately.
Amounts deferred in the hedging reserve are recycled in profit or loss in the periods when the hedged item is recognised in profitor loss.
However, when the forecast transaction that is hedged results in the recognition of a non-financial asset or non-financial liability,the gains or losses previously deferred in the hedging reserve are transferred from equity and included in the initial measurementof the cost of the asset or liability.
Hedge accounting is discontinued when the Group revokes the hedging relationship, the hedging instrument expires or is sold,terminated or exercised, or no longer qualifies for hedge accounting. Any cumulative gain or loss deferred in the hedging reserveat that time remains in equity and is recognised when the forecast transaction is ultimately recognised in profit or loss. When aforecast transaction is no longer expected to occur, the cumulative gain or loss that was deferred in equity is recognisedimmediately in profit or loss.
12A.P. Eagers Limited31 December 2016

NOTES TO AND FORMING PART OF THE FINANCIAL STATEMENTS31 DECEMBER 2016 (continued)
1 SUMMARY OF SIGNIFICANT ACCOUNTING POLICIES (continued)
(p) Property, plant and equipment
Land and buildings are shown at fair value, based on annual assessment by the directors supported by periodic valuations byexternal independent valuers, less subsequent depreciation for buildings. Any accumulated depreciation at the date ofrevaluation is eliminated against the gross carrying amount of the asset and the net amount is restated to the revalued amount ofthe asset. All other property, plant and equipment are stated at historical cost less accumulated depreciation and impairmentlosses. Historical cost includes expenditure that is directly attributable to the acquisition of the items.
Subsequent costs are included in the asset’s carrying amount or recognised as a separate asset, as appropriate, only when it isprobable that future economic benefits associated with the item will flow to the Group and the cost of the item can be measuredreliably. All other repairs and maintenance are charged to profit or loss during the financial period in which they are incurred.
Increases in the carrying amounts arising on revaluation of land and buildings are credited to property, plant and equipmentrevaluation reserve in shareholders’ equity. To the extent that the increase reverses a decrease previously recognised in profit orloss, the increase is first recognised in profit or loss. Decreases that reverse previous increases of the same asset are firstcharged against revaluation reserves directly in equity to the extent of the remaining reserve attributable to the asset, all otherdecreases are charged to profit or loss.
Land is not depreciated. Depreciation on other assets is calculated using the straight line method to allocate their cost orrevalued amounts,net of their residual values, over their estimated useful lives, as follows:
- Buildings 40 years- Plant & equipment 3 - 10 years- Leasehold improvements 5 - 30 years
The asset’s residual values and useful lives are reviewed, and adjusted if appropriate, at each balance date.
An asset’s carrying amount is written down immediately to its recoverable amount if the asset’s carrying amount is greater thanits estimated recoverable amount (Note 1(i)).
Gains and losses on disposals are determined by comparing proceeds with carrying amounts. These are included in profit orloss. When revalued assets are sold, it is Group policy to transfer the amounts included in the asset revaluation reserve inrespect of those assets to retained earnings.
The cost of improvements to or on leasehold properties is amortised over the unexpired period of the lease or the estimateduseful life of the improvement, whichever is the shorter.
The make good provision is capitalised as leasehold improvements and amortised over the term of the lease.
(q) Trademarks / brand names
Trademarks / brand names are valued on acquisition where management believe there is evidence of any of the followingfactors: an established brand name with longevity, a reputation that may positively influence a consumers decision to purchaseor service a vehicle, and strong customer awareness within a particular geographic location. Trademarks are valued using adiscounted cash flow methodology. Trademarks are considered to have an indefinite life as the Group expects to hold andsupport such trademarks through marketing and promotional support for an indefinite period. They are recorded at cost less anyimpairment.
(r) Goodwill
Goodwill represents the excess of the cost of an acquisition over the fair value of the Group’s share of the net identifiable assetsof the acquired subsidiary, associate or business at the date of acquisition. Goodwill on acquisition of subsidiaries andbusinesses is included in intangible assets. Goodwill on acquisition of associates is included in investment in associates.Goodwill acquired in business combinations is not amortised. Instead, goodwill is tested for impairment annually, or morefrequently if events or changes in circumstances indicate that it might be impaired, and is carried at cost less accumulatedimpairment losses. An impairment loss for goodwill is recognised immediately in profit or loss and is not reversed in asubsequent period. Gains and losses on the disposal of an entity include the carrying amount of goodwill relating to the entitysold.
Goodwill is allocated to cash-generating units for the purpose of impairment testing (refer Note 17).
13A.P. Eagers Limited31 December 2016

NOTES TO AND FORMING PART OF THE FINANCIAL STATEMENTS31 DECEMBER 2016 (continued)
1 SUMMARY OF SIGNIFICANT ACCOUNTING POLICIES (continued)
(s) Trade and other payables
These amounts represent liabilities for goods and services provided to the Group prior to the end of the financial year which areunpaid. The amounts are unsecured and are usually paid within 30 days of recognition. They are recognised initially at the fairvalue of what is expected to be paid, and subsequently at amortised cost, using the effective interest rate method.
(t) Borrowings
Borrowings are initially recognised at fair value net of transaction costs incurred. Borrowings are subsequently measured atamortised cost. Any difference between the proceeds (net of transaction costs) and the redemption amount is recognised in profitor loss over the period of the borrowings using the effective interest rate method.
Borrowings are classified as current liabilities unless the Group has an unconditional right to defer settlement of the liability for atleast 12 months after the balance date.
(u) New motor vehicle stock and related bailment
Motor vehicles secured under bailment plans are provided to the Group under bailment agreements between the floor plan loanproviders and entities within the Group. The Group obtains title to the vehicles immediately prior to sale. Motor vehicles financedunder bailment plans held by the Group are recognised as trading stock with the corresponding liability shown as owing to thefinance provider.
(v) Provisions
Provisions are recognised when the Group has a present obligation (legal or constructive) as a result of a past event, it isprobable that the Group will be required to settle the obligation, and a reliable estimate can be made of the amount of theobligation. The amount recognised as a provision is the best estimate taking into account the risks and uncertainties surroundingthe obligation.
Provision for Warranties
Provision is made for the estimated claims in respect of extended warranties provided on the majority of the Group’s retail newand used vehicle sales. These claims are generally expected to settle in the next financial year but some may be extended intothe following year if claims are made late in the warranty period.
(w) Employee benefits
A liability is recognised for benefits accruing to employees in respect of wages and salaries, annual leave and long service leave,when it is probable that settlement will be required and they are capable of being measured reliably.
Liabilities recognised in respect of short-term employee benefits, are measured at their nominal values using the remunerationrate expected to apply at the time of settlement.
Liabilities recognised in respect of long-term employee benefits are measured as the present value of the estimated future cashoutflows to be made by the Group in respect of services provided by employees up to reporting date.
The fair value determined at the grant date of the equity-settled share-based payments is expensed on a straight-line basis overthe vesting period, based on the Group’s estimate of equity instruments that will eventually vest, with a corresponding increase inequity. At the end of each reporting period, the Group revises its estimate of the number of equity instruments expected to vest.The impact of the revision of the original estimates, if any, is recognised in profit or loss such that the cumulative expense reflectsthe revised estimate, with a corresponding adjustment to the share-based payments reserve.
Contributions are made by the Group to defined contribution employee superannuation funds and are charged as expenseswhen incurred.
(x) Dividends
Provision is made for the amount of any dividend declared on or before the end of the year but not distributed at balance date.
(y) Earnings per share
(i) Basic earnings per share
Basic earnings per share is calculated as net profit attributable to members of the parent, adjusted to exclude any costs ofservicing equity (other than dividends), divided by the weighted average number of ordinary shares, adjusted for any bonuselement.
14A.P. Eagers Limited31 December 2016

NOTES TO AND FORMING PART OF THE FINANCIAL STATEMENTS31 DECEMBER 2016 (continued)
1 SUMMARY OF SIGNIFICANT ACCOUNTING POLICIES (continued)
(y) Earnings per share (continued)
(ii) Diluted earnings per share
Diluted earnings per share is calculated as net profit attributable to members of the parent, adjusted for:
• Costs of servicing equity (other than dividends)• The after tax effect of dividends and interest associated with dilutive potential ordinary shares that have been recognised as
expenses• Other non-discretionary changes in revenues or expenses during the period that would result from the dilution of potential
ordinary shares, divided by the weighted average number of ordinary shares and dilutive potential ordinary shares, adjustedfor any bonus element.
(z) Non-Current assets held for sale
Non-current assets and disposal groups are classified as held for sale if their carrying amount will be recovered principallythrough a sale transaction rather than through continuing use. This condition is regarded as met only when the sale is highlyprobable and the asset (or disposal group) is available for immediate sale in its present condition. Management must becommitted to the sale, which should be expected to qualify for recognition as a completed sale within one year from the date ofclassification.
Non-current assets (and disposal groups) classified as held for sale are measured at the lower of their previous carrying amountand fair value less costs to sell.
(aa)Rounding of amounts
The Company is of a kind referred to in Class Order 98/100, issued by the Australian Securities and Investments Commission,relating to the “rounding off” of amounts in the financial report. Amounts in the financial report have been rounded off inaccordance with that Class Order to the nearest thousand dollars, or in certain cases, to the nearest dollar.
(ab)New or revised standards and interpretations that are first effective in the current reporting period
The group has applied the following standards and amendments for the first time for their annual reporting period commencing 1January 2016:
• AASB 2014-4 Amendments to Australian Accounting Standards - Clarification of Acceptable Methods of Depreciation andAmortisation
• AASB 2015-1 Amendments to Australian Accounting Standards - Annual improvements to Australian Accounting Standards2012 - 2014 cycle, and
• AASB 2015-2 Amendments to Australian Accounting Standards - Disclosure initiative: Amendments to AASB 101.
The application of these amendments has not had any material impact on the disclosures or the amounts recognised in theGroup's consolidated financial statements.
15A.P. Eagers Limited31 December 2016

NOTES TO AND FORMING PART OF THE FINANCIAL STATEMENTS31 DECEMBER 2016 (continued)
1 SUMMARY OF SIGNIFICANT ACCOUNTING POLICIES (continued)
(ab)New or revised standards and interpretations that are first effective in the current reporting period (continued)
Certain new accounting standards and interpretations have been published that are not mandatory for 31 December 2016reporting periods and have not been early adopted by the Group.
The potential impact of the new or revised Standards and Interpretations has not yet been determined.
List of Standards and Interpretations in issue not yet effective
At the date of authorisation of the financial statements, the Standards and Interpretations listed below were in issue but not yeteffective.
Standard/Interpretation Effective forannual reporting
periods beginningon or after
Expected to beinitially applied inthe financial year
endingAASB 9 ‘Financial Instruments’, and the relevant amending standards 1 January 2018 31 December 2018AASB 15 ‘Revenue from Contracts with Customers’, AASB 2014-5 ‘Amendments toAustralian Accounting Standards arising from AASB 15’, AASB 2015-8 ‘Amendments toAustralian Accounting Standards – Effective date of AASB 15’ 1 January 2018 31 December 2018AASB 16 ‘Leases’ 1 January 2019 31 December 2019AASB 2016-1 ‘Amendments to Australian Accounting Standards – Recognition ofDeferred Tax Assets for Unrealised Losses 1 January 2017 31 December 2017AASB 2016-2 ‘Amendments to Australian Accounting Standards – Disclosure Initiative:Amendments to AASB 107’ 1 January 2017 31 December 2017AASB 2016-5 Amendments to Australian Accounting Standards – Classification andMeasurement of Share-based Payment Transactions 1 January 2018 31 December 2018AASB 2016-6 Amendments to Australian Accounting Standards - Applying AASB 9Financial Instruments with AASB 4 Insurance Contracts 1 January 2018 31 December 2018
At the date of authorisation of the financial statements, the following IASB Standards and IFRIC interpretations (for whichAustralian equivalent Standards and Interpretations have not yet been issued) were in issue but not yet effective:
Standard/Interpretation Effective forannual reporting
periods beginningon or after
Expected to beinitially applied inthe financial year
endingAnnual Improvements to IFRS Standards 2014–2016 Cycle: IFRS 12 Disclosure ofInterests in Other Entities 1 January 2017 31 December 2017Annual Improvements to IFRS Standards 2014–2016 Cycle: IFRS 1 First-time Adoptionof International Financial Reporting Standards, and IAS 28 Investments in Associatesand Joint Ventures 1 January 2018 31 December 2018Transfers of Investment Property (Amendments to IAS 40) 1 January 2018 31 December 2018
16A.P. Eagers Limited31 December 2016
NOTES TO AND FORMING PART OF THE FINANCIAL STATEMENTS31 DECEMBER 2016 (continued)
2 CRITICAL ACCOUNTING ESTIMATES AND JUDGEMENTS
(a) Critical accounting estimates, assumptions and judgements
Estimates, assumptions and judgements are continually evaluated and are based on historical experience and other factors,including expectations of future events that may have a financial impact on the Group and that are believed to be reasonableunder the circumstances.
The Group makes estimates, assumptions and judgements concerning the future. The resulting accounting estimates will, bydefinition, seldom equal the related actual results. The estimates, assumptions and judgements that have a significant risk ofcausing a material adjustment to the carrying amounts of assets and liabilities are discussed below:
(i) Recoverability of goodwill and other intangibles with indefinite useful lives
Goodwill and other intangibles with indefinite useful lives with a carrying value of $298,908,000 (2015: $160,762,000) are testedannually for impairment, based on estimates made by directors. The recoverable amount of the intangibles is based on thegreater of ‘Value in use’ or ‘Fair value less costs to dispose’. Value in use is assessed by the directors through a discounted cashflow analysis which includes significant estimates and assumptions related to growth rates, margins, working capitalrequirements and cost of capital. Fair value less costs to dispose is assessed by the directors based on their knowledge of theindustry and recent market transactions. Further information on the intangibles impairment test can be found in Note 17.
(ii) Fair value estimation of land and buildings
Land and buildings with a carrying value of $298,507,000 (2015: $249,246,000) are carried at fair value. This fair value isdetermined by the directors and is supported by formal independent valuations conducted periodically but at least every threeyears. Further information on the fair value estimation of land and buildings can be found in Note 16.
(iii) Provisions for warranties
A provision for warranties of $4,870,000 (2015: $4,183,000) has been recognised for extended warranties provided for theGroup’s retail new and used vehicle sales. This provision has been estimated based on past experience and confirmation offuture costs by the administrators of the warranty programmes. Further information on the provision for warranties can be foundin Note 22.
(iv) Estimation of make good provisions
An amount of $1,970,000 (2015: $2,122,000) has been estimated in respect of anticipated costs of future restoration of leasedproperties. A bank guarantee has been given for the entire balance, which has approximately 13 years to run at balance date. Interms of the lease, this amount will be indexed and will increase in the future, therefore it is the maximum estimate of what wouldbe payable. Further information on the estimate of make good provisions can be found in Note 25.
(v) Demonstrator vehicle write down to net realisable value
In determining the amount of write-downs for demonstrator vehicle inventory, management has made judgements based on theexpected net realisable value of inventory. Historic experience and current knowledge of the products has been used indetermining any write-downs to net realisable value. Refer to Note 10.
(vi) Used vehicle write down to net realisable value
In determining the amount of write-downs required for used vehicle inventory, management has, in consultation with publishedused vehicle valuations, made judgements based on the expected net realisable value of that inventory. Historic experience,current knowledge of the products and the valuations from an independent used car publication has been used in determiningany write-downs to net realisable value. Refer to Note 10.
(vii) Fair value of assets and liabilities acquired in a business combination
The acquisitions made by the Group have required a number of judgements and estimates to be made. The directors havejudged that no significant intangible assets have been acquired in the business combinations other than Goodwill (see also (i)above). Additionally as part of the acquisition and negotiation process judgements have been made as to the fair value of vehicleand parts inventory, warranties and other assets and liabilities acquired. Further judgements and estimates have been made inrelation to the probability of achieving future milestones of certain acquired businesses as disclosed in Note 31(a).
17A.P. Eagers Limited31 December 2016

NOTES TO AND FORMING PART OF THE FINANCIAL STATEMENTS31 DECEMBER 2016 (continued)
3 REVENUE
CONSOLIDATED2016$'000
2015$'000
Sales revenueNew vehicles 2,393,429 1,976,916Used vehicles 728,236 652,080Parts 433,475 384,789Service 224,360 186,047Other 238 1,923
3,779,738 3,201,755
Other revenueDividend received 14,442 13,752Rents 440 96Interest 6,103 3,182Proceeds of insurance claims 6,104 7,003Commissions 16,961 14,833Other 9,434 5,755
53,484 44,621
Total revenue 3,833,222 3,246,376
4 OTHER GAINS
Gains on disposal of other assets 1,136 2,936Fair value gains/(losses) on financial assets at fair value through profit or loss 1,235 -Net gain/(loss) on sale of available-for-sale financial assets 1,955 3,490
4,326 6,426
18A.P. Eagers Limited31 December 2016

NOTES TO AND FORMING PART OF THE FINANCIAL STATEMENTS31 DECEMBER 2016 (continued)
5 EXPENSES
(a) Profit before income tax includes the following specific expenses:
CONSOLIDATED
Notes
2016$'000
2015$'000
DepreciationBuildings 3,637 3,195Plant and equipment 8,399 6,854Leased motor vehicles - 1,149
Total depreciation 16 12,036 11,198
AmortisationLeasehold improvements 16 1,863 1,891Brand names 94 127
Total amortisation 1,957 2,018
Total Amortisation and Depreciation 13,993 13,216
Finance costsVehicle bailment & related hedge 12,537 10,493Other 11,841 10,800
Total finance expense 24,378 21,293
Rental expense relating to operating leasesMinimum lease payments 37,221 27,414
Superannuation 27,942 24,119
Provision expensesInventory 6,275 3,174Warranties 6,879 5,390Bad debts 580 307
13,734 8,871
Share-based payments 2,966 3,019
Business acquisition costs 1,758 201
19A.P. Eagers Limited31 December 2016

NOTES TO AND FORMING PART OF THE FINANCIAL STATEMENTS31 DECEMBER 2016 (continued)
5 EXPENSES (continued)
(b) Impairment of non-current assets
CONSOLIDATED2016$'000
2015$'000
Revaluation loss of land and buildings - 2,083Impairment of intangibles - 5,527
- 7,610
6 INCOME TAX
(a) Income tax expense
Current income tax expense 26,885 38,972Deferred income tax expense/(benefit) 8,994 (5,029)
35,879 33,943
Deferred income tax expense/(benefit) included in income tax expense comprises:In respect of the current year 8,407 (6,076)Deferred tax reclassified from equity to profit or loss 587 1,047
Closing balance 8,994 (5,029)
(b) Numerical reconciliation of income tax expense to prima facie tax payable
Profit before income tax expense 141,405 120,958
Tax at the Australian tax rate of 30.0% (2015 - 30.0%) 42,422 36,287Tax effect of amounts which are not deductible (taxable) in calculating taxable income:
Goodwill impairment - 1,658Non deductible capital expenditure 304 220Non-taxable dividends (4,390) (4,175)Non allowable expenses 355 377Property (revaluation) / impairment (371) 625Tax offsets (306) -Sundry items (2,135) (1,049)
Income tax expense 35,879 33,943
(c) Tax expense (income) relating to items of other comprehensive income
Aggregate deferred tax arising in the reporting period and directly debited to othercomprehensive income 7,671 (15,652)
20A.P. Eagers Limited31 December 2016

NOTES TO AND FORMING PART OF THE FINANCIAL STATEMENTS31 DECEMBER 2016 (continued)
7 DIVIDENDS
(i) Ordinary dividends fully franked based on tax paid @ 30%
CONSOLIDATED2016$'000
2015$'000
Final dividend for the year ended 31 December 2015 of 20.0 cents per share (2014 - 18.0 cents)paid on 15 April 2016 37,015 32,239Interim dividend of 13.0 cents (2015 - 12.0 cents) per share paid on 7 October 2016 24,625 22,089
Total dividends paid 61,640 54,328
Dividends paid in cash or satisfied by the issue of shares under thedividend reinvestment plan during the years ended 31 December 2016and 2015 were as follows:
Paid in cash 61,640 54,32861,640 54,328
(ii) Dividends not recognised at year end
In addition to the above dividends, since year end the directors have recommended the paymentof a final dividend of 22 cents per share, fully franked based on tax paid at 30%. The aggregateamount of the proposed dividend expected to be paid on 18 April 2017 out of the retained profitsat 31 December 2016, but not recognised as a liability at year-end is: 41,923 36,940
(iii) Franked dividends
The final dividend recommended after 31 December 2016 will be franked out of existing franking credits or out of franking creditsarising from the payment of income tax in the year ending 31 December 2016.
Franking credits available for subsequent reporting periods based on a tax rate of 30.0% (2015 -30.0%) 169,770 159,089
The above amounts represent the balances of the franking account as at the end of the financial year, adjusted for:
(a) franking credits that will arise from the payment of the current tax liability(b) franking debits that will arise from the payment of dividends recognised as a liability at the reporting date, and(c) franking credits that will arise from the receipt of dividends recognised as receivables at the reporting date.
Impact on franking credits of dividends not recognised (17,967) (15,831)
8 CURRENT ASSETS – Cash and cash equivalents
Current assetsCash at bank and on hand 12,615 3,535Short term deposits 5,000 34,000
17,615 37,535
21A.P. Eagers Limited31 December 2016
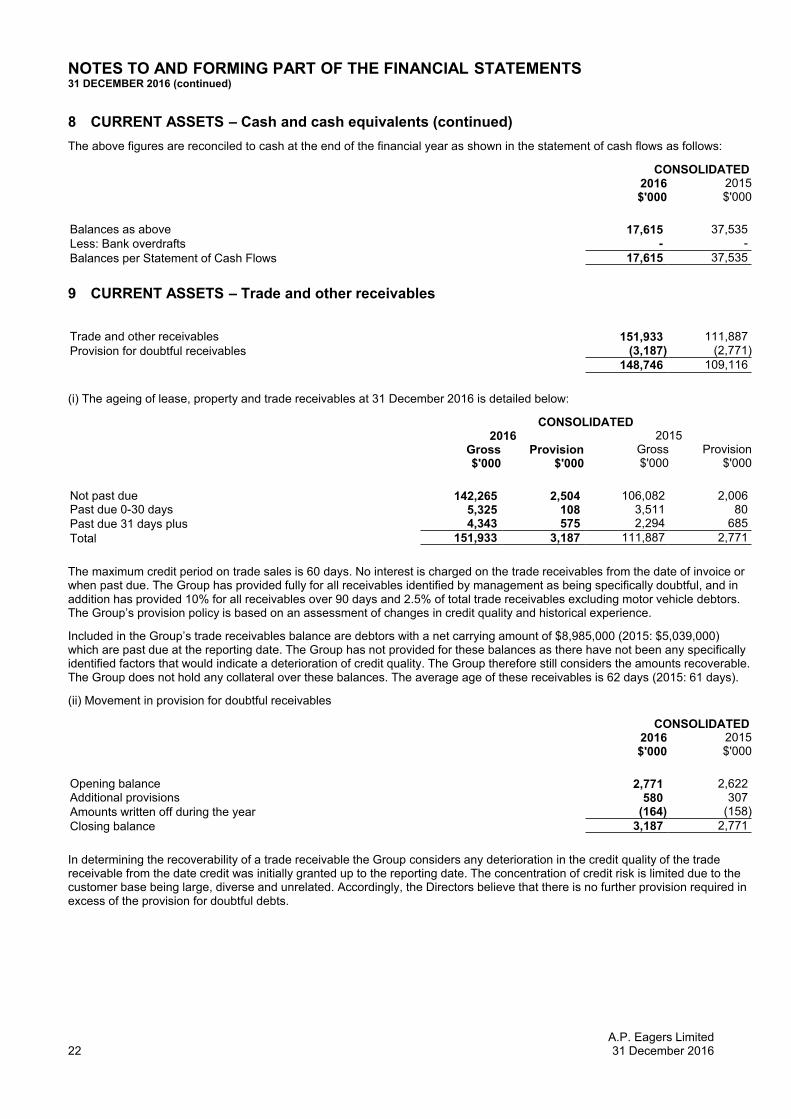
NOTES TO AND FORMING PART OF THE FINANCIAL STATEMENTS31 DECEMBER 2016 (continued)
8 CURRENT ASSETS – Cash and cash equivalents (continued)
The above figures are reconciled to cash at the end of the financial year as shown in the statement of cash flows as follows:
CONSOLIDATED2016$'000
2015$'000
Balances as above 17,615 37,535Less: Bank overdrafts - -
Balances per Statement of Cash Flows 17,615 37,535
9 CURRENT ASSETS – Trade and other receivables
Trade and other receivables 151,933 111,887Provision for doubtful receivables (3,187) (2,771)
148,746 109,116
(i) The ageing of lease, property and trade receivables at 31 December 2016 is detailed below:
CONSOLIDATED2016 2015
Gross$'000
Provision$'000
Gross$'000
Provision$'000
Not past due 142,265 2,504 106,082 2,006Past due 0-30 days 5,325 108 3,511 80Past due 31 days plus 4,343 575 2,294 685
Total 151,933 3,187 111,887 2,771
The maximum credit period on trade sales is 60 days. No interest is charged on the trade receivables from the date of invoice orwhen past due. The Group has provided fully for all receivables identified by management as being specifically doubtful, and inaddition has provided 10% for all receivables over 90 days and 2.5% of total trade receivables excluding motor vehicle debtors.The Group’s provision policy is based on an assessment of changes in credit quality and historical experience.
Included in the Group’s trade receivables balance are debtors with a net carrying amount of $8,985,000 (2015: $5,039,000)which are past due at the reporting date. The Group has not provided for these balances as there have not been any specificallyidentified factors that would indicate a deterioration of credit quality. The Group therefore still considers the amounts recoverable.The Group does not hold any collateral over these balances. The average age of these receivables is 62 days (2015: 61 days).
(ii) Movement in provision for doubtful receivables
CONSOLIDATED2016$'000
2015$'000
Opening balance 2,771 2,622Additional provisions 580 307Amounts written off during the year (164) (158)
Closing balance 3,187 2,771
In determining the recoverability of a trade receivable the Group considers any deterioration in the credit quality of the tradereceivable from the date credit was initially granted up to the reporting date. The concentration of credit risk is limited due to thecustomer base being large, diverse and unrelated. Accordingly, the Directors believe that there is no further provision required inexcess of the provision for doubtful debts.
22A.P. Eagers Limited31 December 2016

NOTES TO AND FORMING PART OF THE FINANCIAL STATEMENTS31 DECEMBER 2016 (continued)
10 CURRENT ASSETS – Inventories
CONSOLIDATED2016$'000
2015$'000
New and demonstrator motor vehicles & trucks - bailment stock - at cost 473,127 400,900Less: Write-down to net realisable value (8,900) (6,258)
464,227 394,642
Used vehicles & trucks - at cost 103,594 87,369Less: Write-down to net realisable value (5,664) (5,358)
97,930 82,011
Parts and other consumables - at cost 64,678 55,344Less: Write-down to net realisable value (1,828) (1,834)
62,850 53,510
Total inventories 625,007 530,163
11 CURRENT ASSETS - Current tax receivables
Current tax receivables 3,817 -
12 CURRENT ASSETS – Other current assets
(a) Prepayments and deposits
Prepayments and deposits 8,843 8,256
(b) Assets classified as held for sale
Intangible asset held for sale - 3,010- 3,010
In 2016, AP Eagers transferred its shares in Auto Trader Australia Pty Ltd (Auto Trader) to DealerMotive under a scheme ofarrangement, in return for an equal dollar value of shares in DealerMotive. The investment in DealerMotive is equity accounted.Refer to Note 42(a).
(c) Property sale receivables
Property sale receivables 9,466 32,013
Sale of property where proceeds are expected to be received within 12 months of balance date.
23A.P. Eagers Limited31 December 2016

NOTES TO AND FORMING PART OF THE FINANCIAL STATEMENTS31 DECEMBER 2016 (continued)
13 NON-CURRENT ASSETS – Receivables
(a) Property sale receivable
CONSOLIDATED2016$'000
2015$'000
Property sale receivable - 23,503
(b) Other loans receivable
Other loans receivable 10,612 10,317
14 NON-CURRENT ASSETS – Available-for-sale investments carried at fair value
Shares in a listed company - Automotive Holdings Group Limited (1) 261,989 275,288Shares in a listed company - Smartgroup Corporation Ltd (1) 2,828 4,184Shares in an unlisted company - One Way Traffic Pty Ltd (Carsguide) (2) - 2,345
264,817 281,817
(1) The Directors have assessed the fair value of the investment as at 31 December 2016 based on the market price of theshares on the last trading day of the reporting period. This is a level 1 fair value measurement asset being derived frominputs based on quoted prices that are observable.
(2) In 2016, AP Eagers transferred its shares in One Way Traffic Pty Ltd (Carsguide) to DealerMotive under a scheme ofarrangement, in return for an equal dollar value of shares in DealerMotive. The investment in DealerMotive is equityaccounted. Refer to Note 42(a).
Valuation of Available for sale investments
Details of the Group’s available for sale investments and information about the fair value hierarchy as at 31 December 2016 areas follows:
Unobservable inputs used in determination of fair values
Class of FinancialAssets andLiabilities
CarryingAmount31/12/16$000’s
CarryingAmount31/12/15$000’s
Valuation Technique Key Input
Level 1 Availablefor saleinvestments - listedentities 264,817 279,472
Quoted bid prices in anactive market. Quoted bid prices in an active market.
Level 3 Availablefor saleinvestments -unlisted entities - 2,345
Net asset assessmentand available bid pricesfrom equity participants
Pre tax operating margin taking into accountmanagements' experience and knowledge ofmarket conditions and financial positionMarket information based on available bid prices
There were no transfers between levels in the year.
24A.P. Eagers Limited31 December 2016

NOTES TO AND FORMING PART OF THE FINANCIAL STATEMENTS31 DECEMBER 2016 (continued)
15 NON-CURRENT ASSETS – Investments in associates
CONSOLIDATED2016$'000
2015$'000
Shares in associate - Norna Limited 1,620 1,620Shares in associate - DealerMotive Ltd 9,973 -Shares in associate - Carzapp Pty Ltd 300 -
11,893 1,620
Investment in associates is accounted for in the consolidated financial statements using the equity method of accounting (referNote 42).
Reconciliation of the carrying amount of investment in associate is set out in Note 42(b).
16 NON-CURRENT ASSETS - Property, plant and equipment
Freehold land and buildings - at fair valueDirectors' valuation
Land 188,108 149,592Buildings 106,693 99,377Construction in progress 3,706 277
Total land and buildings 298,507 249,246
Leasehold improvementsAt cost 32,469 27,098Accumulated depreciation (14,328) (12,589)
Total leasehold improvements 18,141 14,509
Plant and equipmentAt cost 78,032 60,025Accumulated depreciation (39,970) (33,622)
Total plant and equipment 38,062 26,403
Motor vehicles under leaseAt cost - 1,733Accumulated depreciation - (593)
Total motor vehicles under lease - 1,140
Total property, plant and equipment 354,710 291,298
Valuation of land and buildings
The basis of the Directors’ valuation of land and buildings is the assessed fair value, being the amounts for which the assetscould be exchanged between willing parties in an arm’s length transaction at balance date, based on current prices in an activemarket for similar properties in the same location and condition. The assessed fair value is supported by periodic, but at leasttriennial valuations, by external third party valuers. The 2016 valuations were made by the Directors based on their assessmentof prevailing market conditions and supported by fair value information received from independent expert property valuers oncertain properties and the Group’s own market activities and market knowledge.
Details of the Group’s freehold land and buildings and information about the fair value hierarchy as at 31 December 2016 are asfollows:
25A.P. Eagers Limited31 December 2016

NOTES TO AND FORMING PART OF THE FINANCIAL STATEMENTS31 DECEMBER 2016 (continued)
16 NON-CURRENTS ASSETS - Property, plant & equipment (continued)Valuation of land and buildings (continued)
Unobservable inputs used in determination of fair values
Class ofFinancialAssets &Liabilities
CarryingAmount31/12/16$000
CarryingAmount31/12/15$000
ValuationTechnique
Key Input InputAverage /Range2016
Average /Range2015
Other KeyInformation
Range(weightedavg) 2016
Range(weightedavg) 2015
Level 3Car – HBUAlternateUse
49,747 42,911 Directcomparison
Externalvaluations
Price/sqmland
Average$1,563/sqm
Average$1,440/sqm
Land size Average7,952 sqm
Average7,199 sqm
Range$1,262 -$3,584/sqm
Range$1,278 -$2,622/sqm
Range 779- 24,160sqm
Range 779to 24,160sqm
Level 3CarDealership
205,157 170,294 Summationmethod,incomecapitalisationand directcomparison
Externalvaluationsindustrybenchmarks
Capitalisationrate
Average7.3%
Average8.0%
Net rent/sqm land
Average$102/sqm
Average $94sqm
Range3.1% -9.9%
Range2.5% -9.7%
Range $25- $297/sqm
Range $14to $297 sqm
Net rent/sqm GBA
Average$212/sqm
Average$194 sqm
Range $73- $806/sqm
Range $62to $747 sqm
Level 3Development- CarDealership
9,328 9,350 Directcomparison
Externalvaluations
Price /sqmland
Average$458/sqm
Average$459/sqm
Range$330 -$817/sqm
Range$330 -$821/sqm
Level 3TruckDealership
18,319 18,436 Directcomparison
Externalvaluations
Price/sqmlandprice/sqmGBA
Average$328/sqm
Average$330/sqm
Land size Average18,641sqm
Average18,641 sqm
Range$203 -$434/sqm
Range$206 -$440 /sqm
Range7,218 -25,700sqm
Range7,218 to25,700 sqm
Netrent/landsqm
Average$30/sqm
Average $30sqm
Range $17- $43/sqm
Range $17to $43 sqm
Capitalisationrate
Average9.2%
Average9.2%
Range7.9% -9.8%
Range 8.2%to 9.7%
Level 3OtherLogisitics
12,250 7,978 Incomecapitalisationmethodsupported bymarketcomparison
Externalvaluations
CapitalisationRate
Average7.8%
Average8.2%
Net rent/sqm GBA
Average$109/sqm
Average $90sqm
Range6.9% -8.4%
Range8.1% to8.3%
Range $79- $179/sqm
Range $79to $143 sqm
Sub Total 294,801 248,969ConstructioninProgress 3,706 277
Total 298,507 249,246
26A.P. Eagers Limited31 December 2016

NOTES TO AND FORMING PART OF THE FINANCIAL STATEMENTS31 DECEMBER 2016 (continued)
16 NON-CURRENTS ASSETS - Property, plant & equipment (continued)Valuation of land and buildings (continued)
There were no transfers between levels in the year.
Explanation of asset classes: Car - Higher and Best Use (HBU). Alternate Use refers to properties currently operated as cardealerships which have a higher and best use HBU greater than that of a car dealership; Car Dealership refers to propertiesoperating as car dealership with a consistent HBU; Development Car Dealership refers to properties which are in progress of, orbeing held for future development as a car dealership; Truck Dealership refers to properties being operated as a truck dealershipwith a HBU consistent with that use; Other Logistics are industrial properties used for parts warehousing and vehicle logistics.
Carrying amounts that would have been recognised if land and buildings were stated at cost
If freehold land was carried at historical cost, its current carrying value would be $130,861,000 (2015: $98,791,000). If freeholdbuildings (including construction in progress) were carried at historical cost, its current carrying value (after depreciation) wouldbe $106,693,000 (2015: $99,654,000).
Non-current assets pledged as security
Refer to Note 23 for information on non-current assets pledged as security by the Group.
Reconciliations
Reconciliation of the carrying amounts of each class of property, plant and equipment at the beginning and end of the year is setout below:
Consolidated 2016
Freeholdland
$'000
Freeholdbuildings
$'000
Constructionin progress
$'000
Leaseholdimprovements
$'000
Motorvehicles
under lease$'000
Plant andequipment
$'000Total$'000
Carrying amount at the start of theyear 149,592 99,377 277 14,509 1,140 26,403 291,298Additions 26,461 10,999 3,429 5,121 - 22,583 68,593Disposals/transfers (22) (46) - 374 (1,140) (2,525) (3,359)Revaluation gain credited to assetrevaluation reserve 10,842 - - - - - 10,842Revaluation charged to profit andloss 1,235 - - - - - 1,235Depreciation/amortisationexpense - (3,637) - (1,863) - (8,399) (13,899)
Carrying amount at end of year 188,108 106,693 3,706 18,141 - 38,062 354,710
Consolidated 2015
Freeholdland
$'000
Freeholdbuildings
$'000
Constructionin progress
$'000
Leaseholdimprovements
$'000
Motorvehicles
under lease$'000
Plant andequipment
$'000Total$'000
Carrying amount at the start of theyear 152,879 97,251 187 14,446 5,920 21,802 292,485Additions - 5,208 237 1,954 - 11,455 18,854Disposals/transfers (3,391) 113 (147) - (3,631) - (7,056)Revaluation gain credited to assetrevaluation reserve 2,187 - - - - - 2,187Revaluation charged to profit andloss (2,083) - - - - - (2,083)Depreciation/amortisationexpense - (3,195) - (1,891) (1,149) (6,854) (13,089)
Carrying amount at end of year 149,592 99,377 277 14,509 1,140 26,403 291,298
27A.P. Eagers Limited31 December 2016

NOTES TO AND FORMING PART OF THE FINANCIAL STATEMENTS31 DECEMBER 2016 (continued)
17 NON-CURRENT ASSETS – Intangibles
CONSOLIDATED2016$'000
2015$'000
Goodwill 292,233 153,993Trade marks/brand names 6,675 6,769
298,908 160,762
Movement - GoodwillBalance at the beginning of the financial year 153,993 158,837Additional amounts recognised:- from business combinations during the year (Note 31(a)) 138,240 1,033Less: Impairment during the year - (5,527)Less: Disposal of businesses - (350)
Balance at the end of the financial year 292,233 153,993
Movement - Trade marks/brand namesBalance at the beginning of the financial year 6,769 6,896Less: Amortisation of brand names (94) (127)
Balance at the end of the financial year 6,675 6,769
(a) Impairment tests for goodwill
For the purpose of impairment testing, goodwill is allocated to each of the consolidated entity’s cash generating units (CGU), orgroups of CGUs, that are expected to benefit from the synergies of the combinations. Each unit or groups of units to whichgoodwill is allocated represents the lowest level at which assets are monitored for internal management purposes. Previously,the Group had determined that each dealership network represented a CGU for the purposes of testing assets for impairment. Asa result of changes in the business operating model and realignment of internal reporting, the Group has reassessed the numberof CGUs to five, with four CGUs in the Car Automotive segment grouped by state(s) (QLD & NT, NSW, VIC & TAS, SA) and onenational CGU for the Truck segment.
A segment-level summary of the goodwill allocation is presented as follows:
CONSOLIDATED2016$'000
2015$'000
Automotive dealership operations:Goodwill 284,283 146,043Trade marks/brand names 5,625 5,719
289,908 151,762
Truck dealership operations:Goodwill 7,950 7,950Trade marks/brand names 1,050 1,050
9,000 9,000
The recoverable amount of a CGU or group of CGU’s to which goodwill and other indefinite life intangible assets is allocated isdetermined based on the greater of its value in use and its fair value less costs of disposal. Fair value is determined as being theamount obtainable from the sale of a CGU in an arms length transaction between knowledgeable and willing parties at balancedate. This fair value assessment less costs of disposal is conducted by the Directors based on their extensive knowledge of theautomotive and truck retailing industry including the current market conditions prevailing in the industry. The value in useassessment is conducted using a discounted cash flow (DCF) methodology requiring the Directors to estimate the future cashflows expected to arise from the cash generating units and then applying a discount rate to calculate the present value.
28A.P. Eagers Limited31 December 2016

NOTES TO AND FORMING PART OF THE FINANCIAL STATEMENTS31 DECEMBER 2016 (continued)
17 NON-CURRENT ASSETS – Intangibles (continued)(a) Impairment tests for goodwill (continued)
The DCF model adopted by Directors was based on the 2017 financial budgets approved by the Board, a 3% (2015: 3%)perpetual growth rate and a pre-tax discount rate of 11% (2015: 11%). This growth rate does not exceed the long term averagegrowth rate for the industry.
For the automotive dealership operations, the Directors believe that any reasonable change in the key assumptions on which therecoverable amount is based is not expected to cause the carrying amount to exceed the recoverable amount of the CGUs,however see Note 31(a) for considerations surrounding contingent consideration.
For the truck dealership operations, the Directors believe that any reasonable change in the key assumptions on which therecoverable amount is based is not expected to cause the carrying amount to exceed the recoverable amount of the CGUs.
(b) Impairment charge
The Directors’ assessment in 2016 determined that goodwill and other intangible assets with indefinite useful lives were notimpaired in 2016 (2015: $5,527,000 impairment recorded). In 2015 the impairment related to the Truck Dealership Division andwas the result of challenging new and used heavy truck trading conditions consistent with a weak market environment.
18 CURRENT LIABILITIES – Trade and other payables
CONSOLIDATED2016$'000
2015$'000
Trade and other payablesTrade payables (1) 81,924 68,249Other payables 51,676 45,475Annual Leave 24,705 19,839
158,305 133,563
(1) The average credit period on purchases of goods is 30 days.No interest is charged on trade payables from the date of invoice.The Group has financial risk management policies in place to ensure that all payables are paid within the credittimeframe.
19 CURRENT LIABILITIES - Derivative financial instruments
Current liabilitiesInterest rate swap contracts - cash flow hedges 210 227
Total current derivative financial instrument liabilities 210 227
Non-current liabilitiesInterest rate swap contracts - cash flow hedges 206 595
Total non-current derivative financial instrument liabilities 206 595
The Group is party to derivative financial instruments in the normal course of business in order to hedge exposure to fluctuationsin interest rates in accordance with the Group’s financial risk management policies (refer to Note 30).
Bailment finance of the Group currently bears an average variable interest rate at 31 December 2016 of 4.12% (2015: 4.25%).As per Group policy bailment finance is not hedged.
The interest rate swaps currently in place are providing a fixed rate of interest on the variable cash advances drawn down underthe term facility. The swap contracts in place cover approximately 34% (2015: 67%) of the term facility outstanding at the yearend. The contracts require settlement of net interest receivable or payable each 30 days.
The gain or loss from remeasuring the hedging instruments at fair value is deferred in equity in the hedging reserve to the extentthat the hedge is effective and re-classified into profit or loss when the hedged interest expense is recognised. The ineffectiveportion is recognised in profit or loss immediately.
29A.P. Eagers Limited31 December 2016
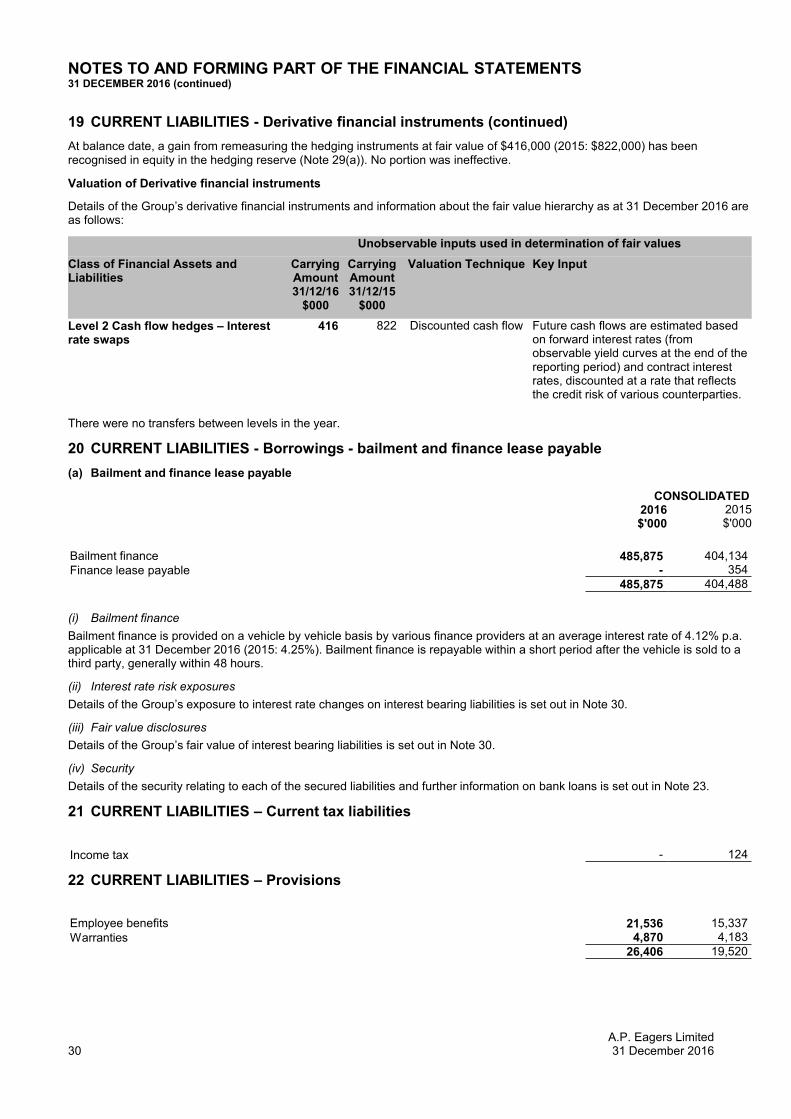
NOTES TO AND FORMING PART OF THE FINANCIAL STATEMENTS31 DECEMBER 2016 (continued)
19 CURRENT LIABILITIES - Derivative financial instruments (continued)
At balance date, a gain from remeasuring the hedging instruments at fair value of $416,000 (2015: $822,000) has beenrecognised in equity in the hedging reserve (Note 29(a)). No portion was ineffective.
Valuation of Derivative financial instruments
Details of the Group’s derivative financial instruments and information about the fair value hierarchy as at 31 December 2016 areas follows:
Unobservable inputs used in determination of fair values
Class of Financial Assets andLiabilities
CarryingAmount31/12/16
$000
CarryingAmount31/12/15
$000
Valuation Technique Key Input
Level 2 Cash flow hedges – Interestrate swaps
416 822 Discounted cash flow Future cash flows are estimated basedon forward interest rates (fromobservable yield curves at the end of thereporting period) and contract interestrates, discounted at a rate that reflectsthe credit risk of various counterparties.
There were no transfers between levels in the year.
20 CURRENT LIABILITIES - Borrowings - bailment and finance lease payable
(a) Bailment and finance lease payable
CONSOLIDATED2016$'000
2015$'000
Bailment finance 485,875 404,134Finance lease payable - 354
485,875 404,488
(i) Bailment finance
Bailment finance is provided on a vehicle by vehicle basis by various finance providers at an average interest rate of 4.12% p.a.applicable at 31 December 2016 (2015: 4.25%). Bailment finance is repayable within a short period after the vehicle is sold to athird party, generally within 48 hours.
(ii) Interest rate risk exposures
Details of the Group’s exposure to interest rate changes on interest bearing liabilities is set out in Note 30.
(iii) Fair value disclosures
Details of the Group’s fair value of interest bearing liabilities is set out in Note 30.
(iv) Security
Details of the security relating to each of the secured liabilities and further information on bank loans is set out in Note 23.
21 CURRENT LIABILITIES – Current tax liabilities
Income tax - 124
22 CURRENT LIABILITIES – Provisions
Employee benefits 21,536 15,337Warranties 4,870 4,183
26,406 19,520
30A.P. Eagers Limited31 December 2016

NOTES TO AND FORMING PART OF THE FINANCIAL STATEMENTS31 DECEMBER 2016 (continued)
22 CURRENT LIABILITIES – Provisions (continued)
(a) Movements in provisions
Movements in each class of provision during the financial year, other than employee benefits, are set out below:
CONSOLIDATED
Warranties2016$'000
2015$'000
Carrying amount at the start of the year 4,183 3,863Additional provisions recognised 6,879 5,390Payments charged against provisions (6,789) (5,070)Acquired through business combination 597 -
4,870 4,183
(b) Warranty Provision
An estimate is made based on past experience, and confirmation of future costs by the administrator of the warranty program, ofthe expected expenditure on new and used motor vehicles in terms of warranties on these vehicles.
23 NON-CURRENT LIABILITIES – Borrowings (secured)
(a) Borrowings – others
Term facility 204,500 154,000Capital loan 79,150 55,000Finance lease payables - 792
283,650 209,792
SECURED LIABILITIESTotal secured liabilities (current and non-current) are:Term facility (i) 204,500 154,000
Capital loan (ii) 79,150 55,000
Finance lease payable (iii) - 1,146
Bailment finance (iv) 485,875 404,134769,525 614,280
(i) The term facility is secured by a general security agreement which includes registered first mortgages held by a securitytrustee over specific freehold land and buildings and a general charge over assets. This excludes new and usedinventory and related receivables, letter of set off given by and on account of the parent entity and its subsidiaries, and aCorporate Guarantee and Indemnity unlimited as to amount given by the parent entity and its subsidiaries.
(ii) The capital loan is secured by registered first mortgages given by subsidiaries over specific freehold land and buildings,letter of set off given by and on account of the parent entity and its subsidiaries, and a Corporate Guarantee andIndemnity unlimited as to amount given by the parent entity and its subsidiaries.
(iii) The finance lease liability is secured against associated leased assets.(iv) Vehicle bailment finance reflects a liability payable to the consolidated entity’s bailment financiers. This liability is
represented by and secured over debtors included in current assets receivables in respect of recent vehicle deliveries tocustomers, and by new vehicles, demonstrator vehicles and some used vehicles all included in inventories (bailmentstock). Refer to Note 10.
31A.P. Eagers Limited31 December 2016

NOTES TO AND FORMING PART OF THE FINANCIAL STATEMENTS31 DECEMBER 2016 (continued)
23 NON-CURRENT LIABILITIES – Borrowings (secured) (continued)
ASSETS PLEDGED AS SECURITY
The carrying amounts of assets pledged as security are:
CONSOLIDATED2016$'000
2015$'000
Non-current assets pledged as securityFreehold land and buildings - first mortgage 297,083 247,791Other non-current assets 651,999 520,070
Current assets pledged as securityInventories 485,875 404,134Other current assets 177,304 207,023
blankTotal assets pledged as security 1,612,261 1,379,018
FINANCING ARRANGEMENTS
The consolidated entity has access to the following lines of credit at balance date:
Total facilitiesTerm facility (i) 260,000 260,000Working capital facility (includes bank overdraft) (ii) 25,000 25,000Capital loan (iii) 79,150 55,000Bailment finance (iv) 671,534 567,734Bank guarantees 22,000 22,000Finance lease payables (v) - 3,000
1,057,684 932,734
Used at balance dateTerm facility 204,500 154,000Capital loan 79,150 55,000Bailment finance 485,875 404,134Bank guarantees 19,879 17,010Finance lease payables - 1,146
789,404 631,290
Unused at balance dateTerm facility 55,500 106,000Working capital facility (includes bank overdraft) 25,000 25,000Bailment finance 185,659 163,600Bank guarantees 2,121 4,990Finance lease payables - 1,854
268,280 301,444
(i) Term facility at balance date was provided on a non-amortisable (interest only) basis subject to compliance with specificcovenants for a fixed term.
(ii) Working capital facility at balance date was provided on a non-amortisable (interest only) basis subject to compliancewith specific covenants and an annual review.
(iii) Capital loan facility at balance date was provided on a non-amortisable (interest only) basis for a fixed term.(iv) Bailment facilities are used to finance the acquisition of new vehicle and some used vehicle trading stock. These
facilities include a combination of fixed term and open ended arrangements and are subject to review periods rangingfrom quarterly to annual. These facilities generally include short term termination notice periods and are disclosed ascurrent liabilities in the statement of financial position.
(v) The finance lease liability provides direct and specific funding to a portfolio of finance leases associated with rentalvehicles.
32A.P. Eagers Limited31 December 2016
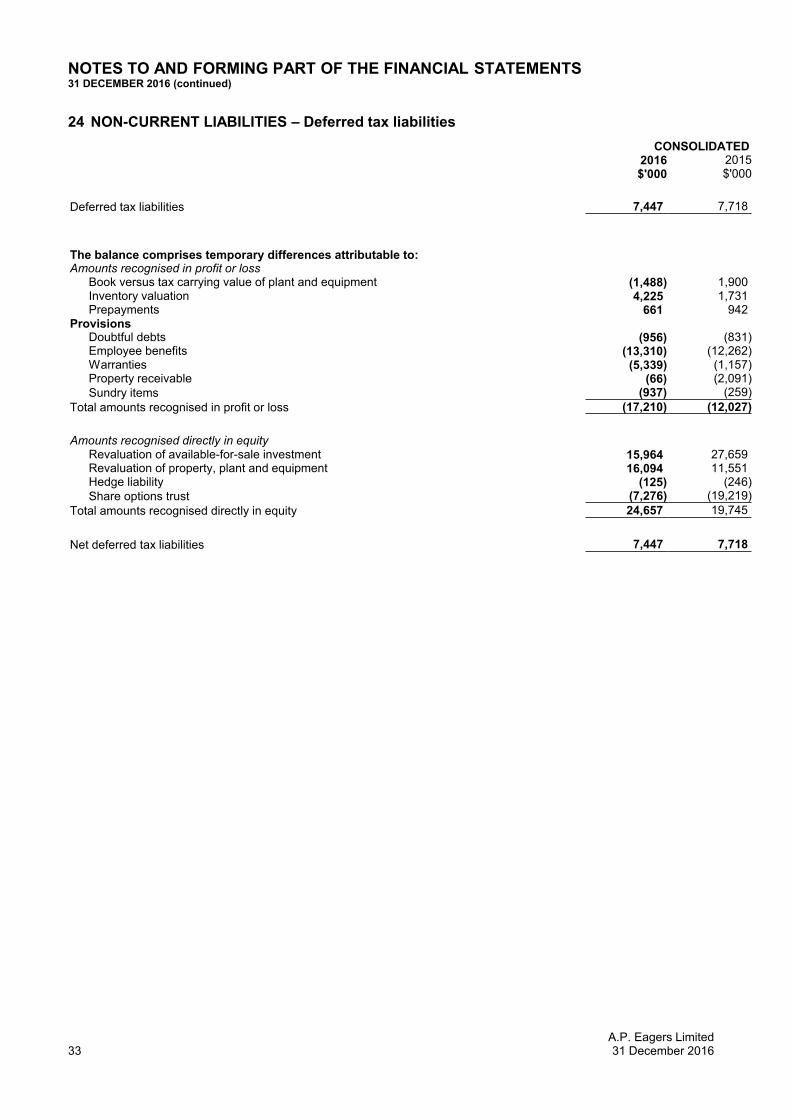
NOTES TO AND FORMING PART OF THE FINANCIAL STATEMENTS31 DECEMBER 2016 (continued)
24 NON-CURRENT LIABILITIES – Deferred tax liabilities
CONSOLIDATED2016$'000
2015$'000
Deferred tax liabilities 7,447 7,718
The balance comprises temporary differences attributable to:Amounts recognised in profit or loss
Book versus tax carrying value of plant and equipment (1,488) 1,900Inventory valuation 4,225 1,731Prepayments 661 942
ProvisionsDoubtful debts (956) (831)Employee benefits (13,310) (12,262)Warranties (5,339) (1,157)Property receivable (66) (2,091)Sundry items (937) (259)
Total amounts recognised in profit or loss (17,210) (12,027)
Amounts recognised directly in equityRevaluation of available-for-sale investment 15,964 27,659Revaluation of property, plant and equipment 16,094 11,551Hedge liability (125) (246)Share options trust (7,276) (19,219)
Total amounts recognised directly in equity 24,657 19,745
Net deferred tax liabilities 7,447 7,718
33A.P. Eagers Limited31 December 2016

NOTES TO AND FORMING PART OF THE FINANCIAL STATEMENTS31 DECEMBER 2016 (continued)
24 NON-CURRENT LIABILITIES – Deferred tax liabilities (continued)
CONSOLIDATED
Notes2016$'000
2015$'000
The deferred tax expense included in income tax expense in respect of the abovetemporary differences resulted from the following movements :Opening balance at 1 January 2016 7,718 17,350
Deferred tax assets relating to business combinations (2,343) (22)Deferred tax expense/(benefit) 6(a) 8,994 (5,029)
Current year adjustments related to prior year deferred tax (3,318) 32Deferred tax recognised directly in equity
Revaluation of available-for-sale investment 29(a) (11,046) 14,907Revaluation of property plant and equipment 29(a) 3,253 656Movement in fair value of cash flow hedge 29(a) 121 90Share options trust 29(a) 4,655 (19,219)Arising on income and expenses reclassified from equity to profit & loss - relating toavailable-for-sale financial assets (587) (1,047)
Closing balance at 31 December 2016 7,447 7,718
25 NON-CURRENT LIABILITIES - Provisions
Employee benefits - long service leave 7,256 8,252Make good provision (a) 1,970 2,122
9,226 10,374
(a) A provision for make good of leasehold improvements on a long term leased property has been recognised in thefinancial statements for the expected cost of restoring the premises to its original condition at the end of the lease. Thelessor of the property has been provided with a bank guarantee of $1,970,000 in respect of the estimated make goodcost and rental costs.
(b) Movement in the make good provision:
Balance at start of year 2,122 1,787Recognition of additional provision during the year - 353Payments against provision (152) (18)
Carrying amount at end of year 1,970 2,122
26 NON-CURRENT LIABILITIES - Other
Other (contingent consideration) 19,317 -
Other liabilities represent the estimated fair value of the contingent consideration relating to the acquisitions of Birrell MotorsGroup and Tony Ireland Group (see Note 31(a)). There has been no change in the fair value of the contingent considerationsince the acquisition date except for unwinding of the discounting.
27 SEGMENT INFORMATION
Segments are identified on the basis of internal reports about components of the consolidated entity that are regularly reviewedby the chief operating decision maker, being the board of directors, in order to allocate resources to the segment and to assessits performance.
The consolidated entity operates in four operating and reporting segments being (a) Car Retailing (b) Truck Retailing (c) Propertyand (d) Investments, these being identified on the basis of being the components of the consolidated entity that are regularlyreviewed by the chief decision maker for the purpose of resource allocation and assessment of segment performance.Information regarding the consolidated entity’s reporting segments is presented below.
34A.P. Eagers Limited31 December 2016
NOTES TO AND FORMING PART OF THE FINANCIAL STATEMENTS31 DECEMBER 2016 (continued)
27 SEGMENT INFORMATION (continued)
(a) Car Retailing
Within the Car Retail segment, the consolidated entity offers a diversified range of automotive products and services, includingnew vehicles, used vehicles, vehicle maintenance and repair services, vehicle parts, extended service contracts, vehiclebrokerage, vehicle protection products and other aftermarket products. They also facilitate financing for vehicle purchasesthrough third-party sources. New vehicles, vehicle parts, and maintenance services are predominantly supplied in accordancewith franchise agreements with manufacturers.
This segment also includes a motor auction and car rental business.
(b) Truck Retailing
Within the Truck Retail segment, the consolidated entity offers a diversified range of products and services, including new trucks,used trucks, truck maintenance and repair services, truck parts, extended service contracts, truck protection products and otheraftermarket products. They also facilitate financing for truck purchases through third-party sources. New trucks, truck parts, andmaintenance services are predominantly supplied in accordance with franchise agreements with manufacturers.
(c) Property
Within the Property segment, the consolidated entity acquires commercial properties principally for use as facility premises for itsmotor dealership operations. The Property segment charges the Car Retailing segment commercial rentals for owned propertiesoccupied by that segment. The Property segment reports property assets at fair value, based on annual assessments by thedirectors supported by periodic, but at least triennial valuations by external independent valuers. Revaluation increments arisingfrom fair value adjustments are reported internally and assessed by the chief operating decision maker as profit adjustments inassessing the overall returns generated by this segment to the consolidated entity.
(d) Investments
This segment includes the investments in DealerMotive Ltd, Automotive Holdings Group Limited, and Smartgroup CorporationLimited
(e) Other
Currently the segment “Other” is not required.
The accounting policies of the reportable segments are the same as the Group’s accounting policies as described in Note 1 withthe exception of all changes in fair value of property and investments being recognised as profit or loss adjustments for segmentreporting purposes. This compares to the Group policy of crediting increments to a property plant and equipment and investmentreserve in equity (refer Note 1(p)).
Segment profit represents the profit earned by each segment without allocation of unrecouped corporate / head office costs andincome tax. External bailment is allocated to the Car Retailing and Truck Retailing segments. Bills payable funding costs areallocated to the Car Retailing, Truck Retailing, Property, and Investment segments based on notional market based covenantlevels.
This is the measure reported to the chief operating decision maker for the purposes of resource allocation and assessment ofsegment performance. For the purpose of monitoring segment performance and allocating resources between segments, thechief operating decision maker monitors the tangible, intangible, and financial assets attributable to each segment. All assets areallocated to reportable segments.
Geographic Information
The Group operates in one principal geographic location, being Australia.
35A.P. Eagers Limited31 December 2016

NOTES TO AND FORMING PART OF THE FINANCIAL STATEMENTS31 DECEMBER 2016 (continued)
27 SEGMENT INFORMATION (continued)
(f) Segment results
Segment reporting2016
CarRetailing
TruckRetailing Property Investments Eliminations Consolidated
$'000 $'000 $'000 $'000 $'000 $'000
Sales to external customers 3,449,738 363,802 5,240 14,442 - 3,833,222Inter-segment sales - - 25,071 - (25,071) -Total sales revenue 3,449,738 363,802 30,311 14,442 (25,071) 3,833,222
TOTAL REVENUE 3,449,738 363,802 30,311 14,442 (25,071) 3,833,222
SEGMENT RESULTOperating profit before interest 114,777 8,090 23,013 14,392 - 160,272External interest expense allocation (13,005) (1,826) (7,994) (1,553) - (24,378)OPERATING CONTRIBUTION 101,772 6,264 15,019 12,839 - 135,894
Share of net profit of equity accounted investments 191 - - - - 191Business acquisition costs (1,758) - - - - (1,758)GST refunds 4,418 - - - - 4,418Investment revaluation - - - (38,774) 38,774 -Property revaluation - - 12,077 - (10,842) 1,235Profit on sale of property/businesses - - 1,136 1,955 - 3,091
SEGMENT PROFIT 104,623 6,264 28,232 (23,980) 27,932 143,071
Unallocated corporate expenses - - - - - (1,666)
PROFIT BEFORE TAX 104,623 6,264 28,232 (23,980) 27,932 141,405
Income tax expense - - - - - (35,879)NET PROFIT 104,623 6,264 28,232 (23,980) 27,932 105,526
Depreciation and amortisation (9,192) (980) (3,821) - - (13,993)Non cash expenses (reversal of expenses) other thandepreciation and amortisation (3,293) 358 152 - - (2,783)Impairment of trade receivables (448) 44 - - - (404)Write down (back) of inventories to net realisable value (1,676) 194 - - - (1,482)ASSETSSegment assets 1,067,473 91,488 320,813 274,660 - 1,754,434LIABILITIESSegment liabilities 661,164 69,100 197,173 63,205 - 990,642NET ASSETS 406,309 22,388 123,640 211,455 - 763,792
Acquisitions of non-current assets 155,135 104 52,852 35,039 - 243,130
(4,112,954) (392,558) (221,822) (273,775) 25,071 (4,976,038)
36A.P. Eagers Limited31 December 2016
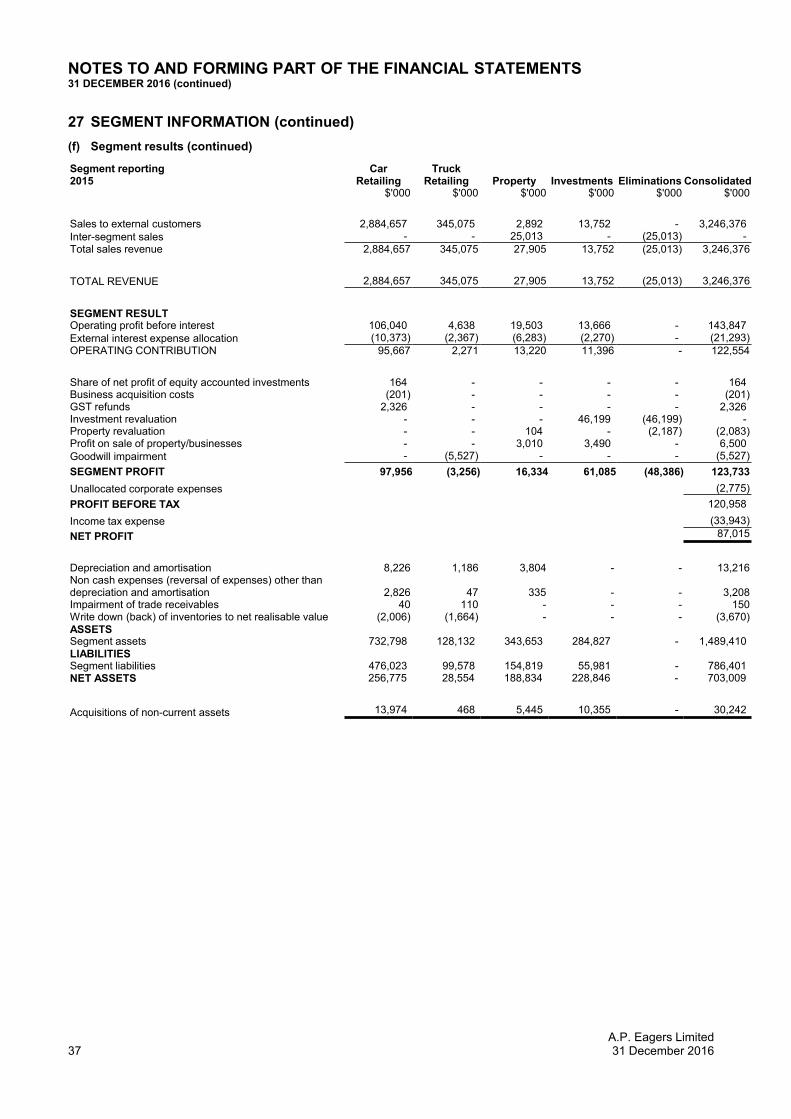
NOTES TO AND FORMING PART OF THE FINANCIAL STATEMENTS31 DECEMBER 2016 (continued)
27 SEGMENT INFORMATION (continued)
(f) Segment results (continued)
Segment reporting2015
CarRetailing
TruckRetailing Property Investments Eliminations Consolidated
$'000 $'000 $'000 $'000 $'000 $'000
Sales to external customers 2,884,657 345,075 2,892 13,752 - 3,246,376Inter-segment sales - - 25,013 - (25,013) -Total sales revenue 2,884,657 345,075 27,905 13,752 (25,013) 3,246,376
TOTAL REVENUE 2,884,657 345,075 27,905 13,752 (25,013) 3,246,376
SEGMENT RESULTOperating profit before interest 106,040 4,638 19,503 13,666 - 143,847External interest expense allocation (10,373) (2,367) (6,283) (2,270) - (21,293)OPERATING CONTRIBUTION 95,667 2,271 13,220 11,396 - 122,554
Share of net profit of equity accounted investments 164 - - - - 164Business acquisition costs (201) - - - - (201)GST refunds 2,326 - - - - 2,326Investment revaluation - - - 46,199 (46,199) -Property revaluation - - 104 - (2,187) (2,083)Profit on sale of property/businesses - - 3,010 3,490 - 6,500Goodwill impairment - (5,527) - - - (5,527)
SEGMENT PROFIT 97,956 (3,256) 16,334 61,085 (48,386) 123,733
Unallocated corporate expenses - - - - - (2,775)
PROFIT BEFORE TAX 97,956 (3,256) 16,334 61,085 (48,386) 120,958
Income tax expense - - - - - (33,943)
NET PROFIT 97,956 (3,256) 16,334 61,085 (48,386) 87,015
Depreciation and amortisation 8,226 1,186 3,804 - - 13,216Non cash expenses (reversal of expenses) other thandepreciation and amortisation 2,826 47 335 - - 3,208Impairment of trade receivables 40 110 - - - 150Write down (back) of inventories to net realisable value (2,006) (1,664) - - - (3,670)ASSETSSegment assets 732,798 128,132 343,653 284,827 - 1,489,410LIABILITIESSegment liabilities 476,023 99,578 154,819 55,981 - 786,401NET ASSETS 256,775 28,554 188,834 228,846 - 703,009
Acquisitions of non-current assets 13,974 468 5,445 10,355 - 30,242
(3,251,073) (376,368) (235,404) (264,349) 25,013 (4,102,181)
37A.P. Eagers Limited31 December 2016
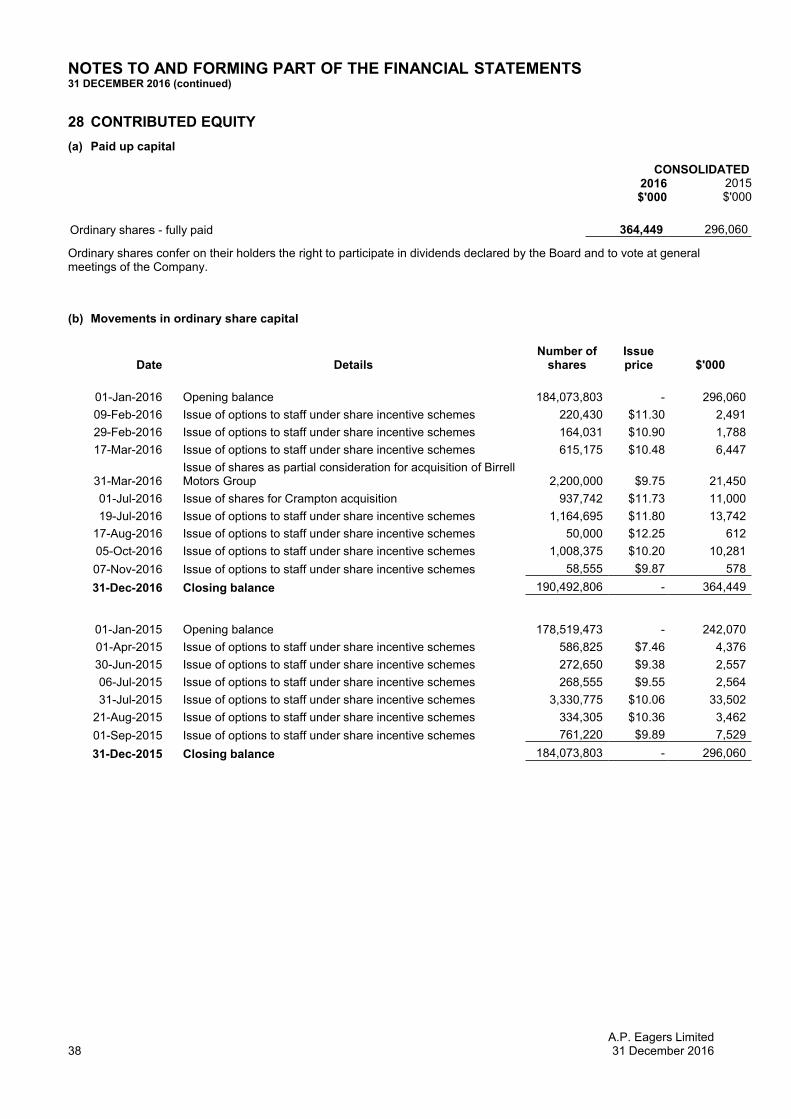
NOTES TO AND FORMING PART OF THE FINANCIAL STATEMENTS31 DECEMBER 2016 (continued)
28 CONTRIBUTED EQUITY
(a) Paid up capital
CONSOLIDATED2016$'000
2015$'000
Ordinary shares - fully paid 364,449 296,060
Ordinary shares confer on their holders the right to participate in dividends declared by the Board and to vote at generalmeetings of the Company.
(b) Movements in ordinary share capital
Date DetailsNumber of
sharesIssueprice $'000
01-Jan-2016 Opening balance 184,073,803 - 296,060
09-Feb-2016 Issue of options to staff under share incentive schemes 220,430 $11.30 2,491
29-Feb-2016 Issue of options to staff under share incentive schemes 164,031 $10.90 1,788
17-Mar-2016 Issue of options to staff under share incentive schemes 615,175 $10.48 6,447
31-Mar-2016Issue of shares as partial consideration for acquisition of BirrellMotors Group 2,200,000 $9.75 21,450
01-Jul-2016 Issue of shares for Crampton acquisition 937,742 $11.73 11,000
19-Jul-2016 Issue of options to staff under share incentive schemes 1,164,695 $11.80 13,742
17-Aug-2016 Issue of options to staff under share incentive schemes 50,000 $12.25 612
05-Oct-2016 Issue of options to staff under share incentive schemes 1,008,375 $10.20 10,281
07-Nov-2016 Issue of options to staff under share incentive schemes 58,555 $9.87 578
31-Dec-2016 Closing balance 190,492,806 - 364,449
01-Jan-2015 Opening balance 178,519,473 - 242,070
01-Apr-2015 Issue of options to staff under share incentive schemes 586,825 $7.46 4,376
30-Jun-2015 Issue of options to staff under share incentive schemes 272,650 $9.38 2,557
06-Jul-2015 Issue of options to staff under share incentive schemes 268,555 $9.55 2,564
31-Jul-2015 Issue of options to staff under share incentive schemes 3,330,775 $10.06 33,502
21-Aug-2015 Issue of options to staff under share incentive schemes 334,305 $10.36 3,462
01-Sep-2015 Issue of options to staff under share incentive schemes 761,220 $9.89 7,529
31-Dec-2015 Closing balance 184,073,803 - 296,060
38A.P. Eagers Limited31 December 2016

NOTES TO AND FORMING PART OF THE FINANCIAL STATEMENTS31 DECEMBER 2016 (continued)
29 RESERVES AND RETAINED EARNINGS
(a) Reserves:
CONSOLIDATED
Note2016$'000
2015$'000
Property, plant and equipment revaluation reserve 52,781 45,192Hedging reserve - cash flow hedge (291) (575)Share-based payments reserve (34,486) (3,778)Investment revaluation reserve 37,394 64,536
55,398 105,375
Movements:
Property, plant and equipment revaluation reserve :Balance at beginning of the financial year 45,192 61,668Revaluation surplus/(deficit) during the year - gross 16 10,842 2,187Transfer to retained earnings relating to properties sold 29(b) - (18,007)Deferred tax 24 (3,253) (656)
Balance at the end of the financial year 52,781 45,192
Hedging reserve - cash flow hedge:Balance at beginning of the financial year (575) (786)Movement during the year 405 300Deferred tax 24 (121) (89)
Balance at the end of the financial year (291) (575)
Share-based payments reserve:Balance at beginning of the financial year (3,778) 5,941Deferred tax 24 (4,655) 18,160Payments received from employees for exercised options 6,948 10,740Employee share schemes - value of employee services 2,966 3,019Transfer to share capital (shares issued) (35,939) (53,990)Current tax on share plans (28) 12,352
Balance at the end of the financial year (34,486) (3,778)
Investment revaluation reserve:Balance at beginning of the financial year 64,536 32,197Gain/(loss) on revaluation of available-for-sale investment (36,819) 49,689Deferred tax 24 11,046 (14,907)Cumulative gain reclassed to profit or loss on disposal of available for sale financial assets (1,369) (2,443)
Balance at the end of the financial year 37,394 64,536
39A.P. Eagers Limited31 December 2016

NOTES TO AND FORMING PART OF THE FINANCIAL STATEMENTS31 DECEMBER 2016 (continued)
29 RESERVES AND RETAINED EARNINGS (continued)
(b) Retained earnings
CONSOLIDATED
Notes2016$'000
2015$'000
Retained profits at the beginning of the financial year 293,435 242,480Net profit for the year 103,984 86,217Transfer from asset revaluation reserve re properties sold - 18,007Transfer from share based payment reserve - 1,059Dividends provided for or paid 7 (61,640) (54,328)
Retained profits at the end of the financial year 335,779 293,435
(c) Nature and purpose of other reserves
(I) Property, plant and equipment revaluation reserve
The property, plant and equipment revaluation reserve is used to record increments and decrements on the revaluation ofnon-current assets as described in Note 1(p).
(II) Hedging reserve
The hedging reserve contains the effective portion of interest rate hedge arrangements incurred as at the reporting date.
(III) Share-based payments reserve
The share-based payment reserve is used to recognise the fair value of performance rights expected to vest and the fair value ofequity expected to be issued under various share incentive schemes referred to in Notes 36 and 37.
(iv) Investment revaluation reserve
The investments revaluation reserve represents the cumulative gains and losses arising on the revaluation of available-for-salefinancial assets that have been recognised in other comprehensive income, net of amounts reclassified to profit or loss whenthose assets have been disposed of or are determined to be impaired.
30 FINANCIAL INSTRUMENTS
Overview
The consolidated entity has exposure to the following key risks from its use of financial instruments:
• Credit risk• Liquidity risk• Market risk (interest rate risk)
This note presents information about the consolidated entity’s exposure to each of the above risks, the consolidated entity’sobjectives, policies and processes for measuring and managing risk, and the consolidated entity’s management of capital.Further quantitative disclosures are included throughout these consolidated financial statements.
The Directors have overall responsibility for the establishment and oversight of the consolidated entity’s risk managementframework.
The Directors have established an Audit, Risk and Remuneration Committee which is responsible for monitoring, assessing andreporting on the consolidated entity’s risk management system. The committee will provide regular reports to the Board ofDirectors on its activities.
The consolidated entity’s risk management policies are established to identify and analyse the risks faced by the consolidatedentity, to set appropriate risk limits and controls, and to monitor risks and adherence to limits. Risk management policies andsystems are reviewed regularly to reflect changes in market conditions and the consolidated entity’s activities.
The Audit, Risk and Remuneration Committee oversees how management monitors compliance with the risk managementpolicies and procedures and reviews the adequacy of the risk management framework in relation to the risks. The Committee isassisted in its oversight by Internal Audit. Internal Audit undertakes both regular and ad hoc reviews of risk management controlsand procedures, the results of which are reported to the Committee.
40A.P. Eagers Limited31 December 2016

NOTES TO AND FORMING PART OF THE FINANCIAL STATEMENTS31 DECEMBER 2016 (continued)
30 FINANCIAL INSTRUMENTS (continued)
Overview (continued)
The Group’s principal financial instruments comprise bank loans, bailment finance, cash, short-term deposits and interest rateswap contracts. The main purpose of these financial instruments is to raise finance for and fund the Group’s operations and tohedge the Group’s exposures to interest rate volatility. The Group has various other financial instruments such as trade debtorsand trade creditors which arise directly from its operations. It is, and has been throughout the period under review, the Group’spolicy that no speculative trading in financial instruments shall be undertaken.
The main risk arising from the Group’s financial instruments are interest rate risk, credit risk and liquidity risk. The Board reviewsand agrees policies for managing each of these risks and they are summarised below.
CREDIT RISK
Credit risk refers to the risk that a counterparty will default on its contractual obligations resulting in a financial loss to the Group.The Group has adopted a policy of only dealing with creditworthy counterparties and obtaining sufficient collateral whereappropriate, as a means of mitigating the risk of financial loss from defaults. Further, it is the Group’s policy that all customerswho wish to trade on credit terms are subject to credit verification procedures.
Trade receivables consist of a large number of customers, spread across geographical areas. Ongoing credit evaluation isperformed on the financial condition of debtors and other receivable balances are monitored on an ongoing basis, with the resultthat the Group’s exposure to bad debts is not significant.
The consolidated entity establishes an allowance for doubtful debts that represents its estimate of incurred losses in respect oftrade and other receivables and investments.
With respect to credit risk arising from financial assets of the Group comprised of cash, cash equivalents and receivables, theGroup’s maximum exposure to credit risk, excluding the value of any collateral or other security, at balance date is in the carryingamount as disclosed in the statement of financial position and notes to the financial statements.
The Group’s credit risk on liquid funds is limited as the counter parties are major Australian banks with favourable credit ratingsassigned by international credit rating agencies.
LIQUIDITY RISK
Liquidity risk is the risk that the consolidated entity will not be able to meet its financial obligations as they fall due. Theconsolidated entity’s approach to managing liquidity is to ensure, as far as possible, that it will always have sufficient liquidity tomeet its liabilities when due, under both normal and stressed conditions.
The Group’s overall objective is to maintain a balance between continuity of funding and flexibility through the use of bankoverdrafts and bank loans.
The Group also manages liquidity risk by maintaining adequate reserves, banking facilities and reserve borrowing facilities bycontinuously monitoring forecast and actual cash flows and matching the maturity profiles of financial assets and liabilities.Information on available facilities can be found in Note 23.
MARKET RISK
Market risk is the risk that changes in market prices, such as interest rates, will affect the consolidated entity’s income or thevalue of its holdings of financial instruments. The objective of market risk management is to manage and monitor market riskexposures within acceptable parameters, whilst optimising the return on risk.
(i) Interest rate risk
The Group is exposed to interest rate risk as a consequence of its financing facilities as set out in Notes 20 & 23. Funds areborrowed by the Group at both fixed and floating interest rates. The Group’s policy is to manage its interest cost using a mix offixed and variable rate debt.
The Group’s policy is to keep between 0% and 50% of its borrowings at fixed rates of interest. As at 31 December 2016,approximately 42% (2015: 62%) of the Group’s borrowings were at a fixed rate of interest. The Group hedges part of the interestrate risk (see Note 19) by swapping floating for fixed interest rates.
The consolidated entity classifies interest rate swaps as cash flow hedges.
The net fair value of the swaps at 31 December 2016 was $416,000 liability (2015: $822,000 liability), with the movement beingrecognised in equity for the consolidated entity.
41A.P. Eagers Limited31 December 2016
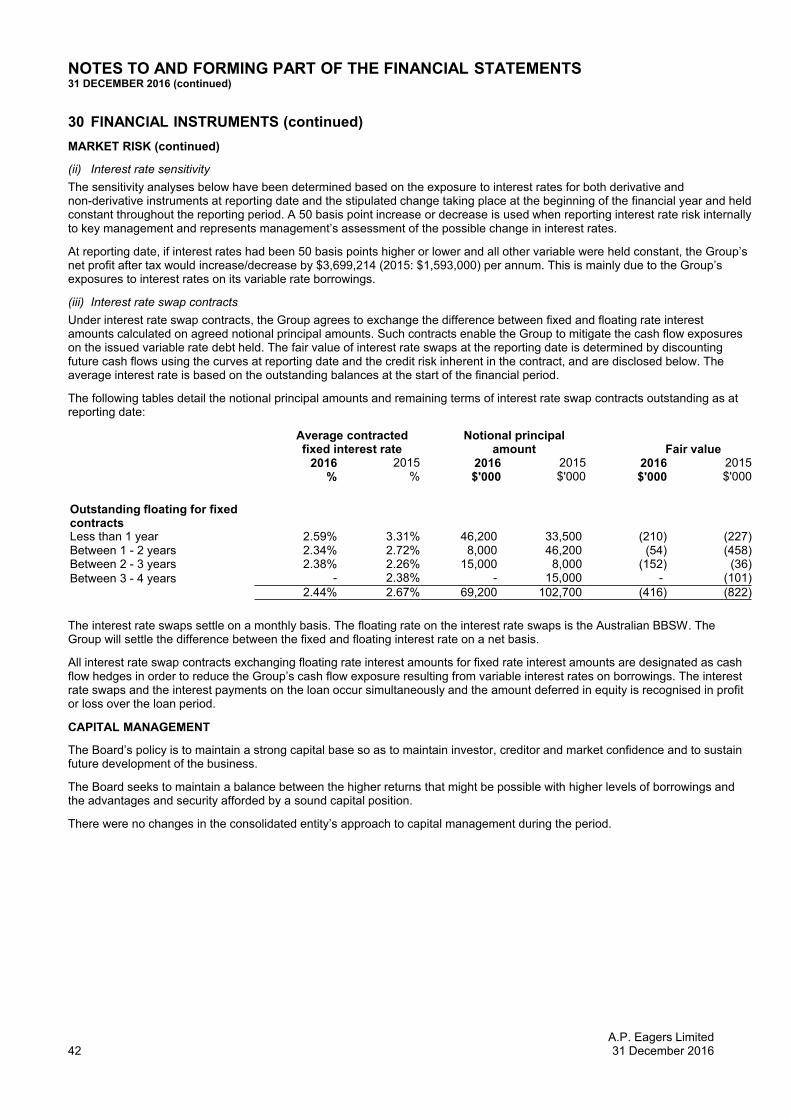
NOTES TO AND FORMING PART OF THE FINANCIAL STATEMENTS31 DECEMBER 2016 (continued)
30 FINANCIAL INSTRUMENTS (continued)
MARKET RISK (continued)
(ii) Interest rate sensitivity
The sensitivity analyses below have been determined based on the exposure to interest rates for both derivative andnon-derivative instruments at reporting date and the stipulated change taking place at the beginning of the financial year and heldconstant throughout the reporting period. A 50 basis point increase or decrease is used when reporting interest rate risk internallyto key management and represents management’s assessment of the possible change in interest rates.
At reporting date, if interest rates had been 50 basis points higher or lower and all other variable were held constant, the Group’snet profit after tax would increase/decrease by $3,699,214 (2015: $1,593,000) per annum. This is mainly due to the Group’sexposures to interest rates on its variable rate borrowings.
(iii) Interest rate swap contracts
Under interest rate swap contracts, the Group agrees to exchange the difference between fixed and floating rate interestamounts calculated on agreed notional principal amounts. Such contracts enable the Group to mitigate the cash flow exposureson the issued variable rate debt held. The fair value of interest rate swaps at the reporting date is determined by discountingfuture cash flows using the curves at reporting date and the credit risk inherent in the contract, and are disclosed below. Theaverage interest rate is based on the outstanding balances at the start of the financial period.
The following tables detail the notional principal amounts and remaining terms of interest rate swap contracts outstanding as atreporting date:
Average contractedfixed interest rate
Notional principalamount Fair value
2016%
2015%
2016$'000
2015$'000
2016$'000
2015$'000
Outstanding floating for fixedcontractsLess than 1 year 2.59% 3.31% 46,200 33,500 (210) (227)Between 1 - 2 years 2.34% 2.72% 8,000 46,200 (54) (458)Between 2 - 3 years 2.38% 2.26% 15,000 8,000 (152) (36)Between 3 - 4 years - 2.38% - 15,000 - (101)
2.44% 2.67% 69,200 102,700 (416) (822)
The interest rate swaps settle on a monthly basis. The floating rate on the interest rate swaps is the Australian BBSW. TheGroup will settle the difference between the fixed and floating interest rate on a net basis.
All interest rate swap contracts exchanging floating rate interest amounts for fixed rate interest amounts are designated as cashflow hedges in order to reduce the Group’s cash flow exposure resulting from variable interest rates on borrowings. The interestrate swaps and the interest payments on the loan occur simultaneously and the amount deferred in equity is recognised in profitor loss over the loan period.
CAPITAL MANAGEMENT
The Board’s policy is to maintain a strong capital base so as to maintain investor, creditor and market confidence and to sustainfuture development of the business.
The Board seeks to maintain a balance between the higher returns that might be possible with higher levels of borrowings andthe advantages and security afforded by a sound capital position.
There were no changes in the consolidated entity’s approach to capital management during the period.
42A.P. Eagers Limited31 December 2016

NOTES TO AND FORMING PART OF THE FINANCIAL STATEMENTS31 DECEMBER 2016 (continued)
30 FINANCIAL INSTRUMENTS (continued)
CREDIT RISK
(i) Exposure to Credit Risk
The carrying amount of financial assets (as per Notes 9, 12 and 13) represents the maximum credit exposure. The maximumexposure to credit risk as the reporting date was:
CONSOLIDATED2016$'000
2015$'000
- -
Trade and other receivables 172,011 177,720Less: Provision for doubtful receivables (3,187) (2,771)
168,824 174,949
(ii) Impairment Losses
The aging of trade receivables at reporting date is detailed in Note 9.
(iii) Fair values & Exposures to Credit & Liquidity Risk
Detailed in the following table, the Directors consider that the carrying amounts of financial assets and financial liabilitiesrecorded in the financial statements approximate their fair value.
Financial assetsTrade and other receivables net of doubtful debts 168,824 174,949Cash and cash equivalents 17,615 37,535
186,439 212,484
Financial liabilitiesBills payable and fully drawn advances 204,500 154,000Capital loan 79,150 55,000Vehicle bailment 485,875 404,134Finance lease payables - 1,146Trade and other payables 158,305 133,563Derivative financial instruments 416 822
928,246 748,665
The fair value of financial assets and financial liabilities are determined as follows:
• The fair value of financial assets and financial liabilities with standard terms and conditions and traded on active liquidmarkets are determined with reference to quoted market prices (includes listed redeemable notes, bills of exchange,debentures and perpetual notes).
• The fair values of derivative instruments are calculated using quoted prices. Where such prices are not available, discountedcash flow analysis is performed using the applicable yield curve for the duration of the instruments for non-optionalderivatives and option pricing models for optional derivatives. Interest rate swaps are measured at the present value of futurecash flows estimated and discounted based on the applicable yield curves derived from quoted interest rates.
Maturity profile
The below table provides a maturity profile for the Group’s financial instruments that are exposed to interest rate risk at balancedate. The amounts disclosed in the table are gross contractual undiscounted cash flows (principal and interest) required to settlethe respective liabilities. The interest rate is based on the rate applicable as at the end of the financial period.
43A.P. Eagers Limited31 December 2016

NOTES TO AND FORMING PART OF THE FINANCIAL STATEMENTS31 DECEMBER 2016 (continued)
30 FINANCIAL INSTRUMENTS (continued)
CREDIT RISK (continued)
(iii) Fair values & Exposures to Credit & Liquidity Risk (continued)
Maturity profile (continued)
Contractual maturities of financialliabilities Less than
1 year1 - 2
years2 - 3
years3 - 4
years4 - 5
years5+
years TotalAt 31 December 2016 $'000 $'000 $'000 $'000 $'000 $'000 $'000
INTEREST BEARINGFloating rateFinancial assets
Cash and cash equivalents 17,615 - - - - - 17,615
Average interest rate 2.39% - - - - - 2
Financial liabilitiesVehicle bailment (current) 506,322 - - - - - 506,322Fully drawn advances 8,596 112,197 3,677 3,677 3,677 99,951 231,775Fully drawn advances
(1)1,145 52,145 181 - - - 53,471
Capital loan (Non-current) 1,036 1,036 1,036 1,036 1,036 41,138 46,318517,099 165,378 4,894 4,713 4,713 141,089 837,886
Average interest rate 4.10% 3.35% 3.79% 3.51% 3.51% 3.51% 22
Fixed rateFinancial liabilitiesCapital loan (Non-current) 2,669 51,305 - - - - 53,974Average interest rate 5.20% 5.20% - - - - 10
NON INTEREST BEARINGFinancial assetsProperty sale receivables 9,466 - - - - - 9,466Trade debtors 159,358 - - - - - 159,358
168,824 - - - - - 168,824
Financial liabilitiesTrade and other payables 158,305 19,317 - - - - 177,622
(1) The amount included in fully drawn advances relate to variable rates that are hedged with interest rate swaps to fixed rates.
44A.P. Eagers Limited31 December 2016
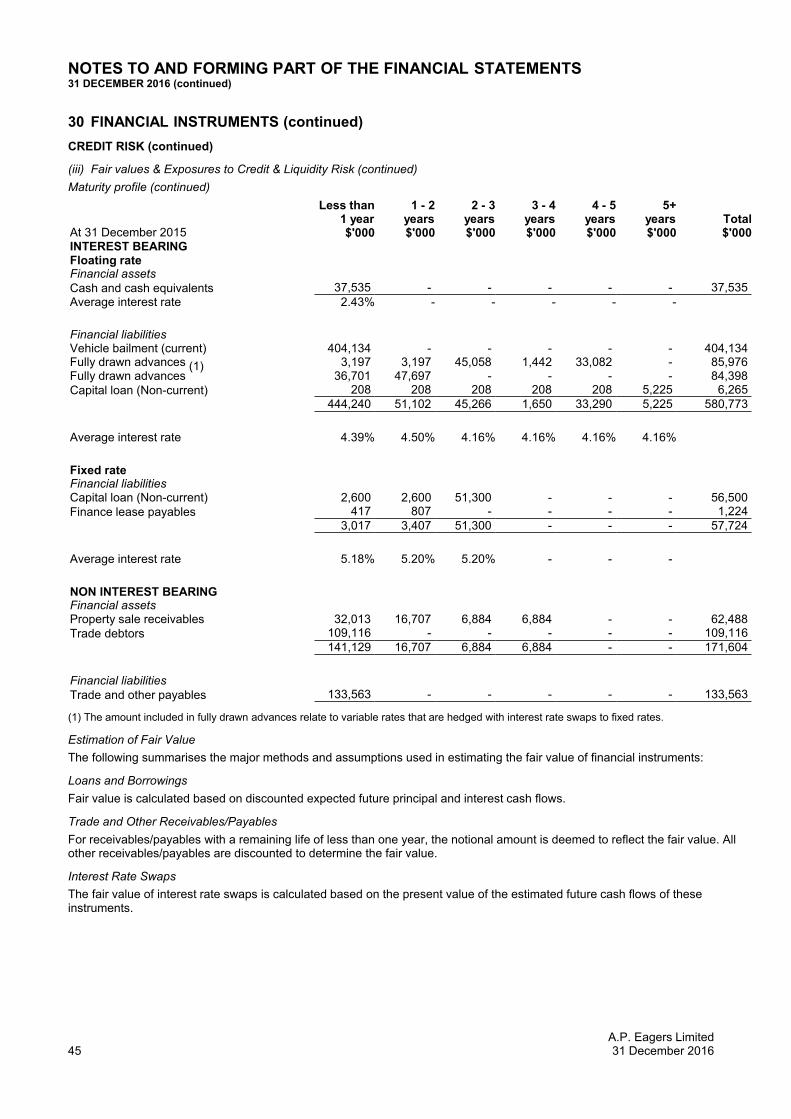
NOTES TO AND FORMING PART OF THE FINANCIAL STATEMENTS31 DECEMBER 2016 (continued)
30 FINANCIAL INSTRUMENTS (continued)
CREDIT RISK (continued)
(iii) Fair values & Exposures to Credit & Liquidity Risk (continued)
Maturity profile (continued)
At 31 December 2015
Less than1 year$'000
1 - 2years$'000
2 - 3years$'000
3 - 4years$'000
4 - 5years$'000
5+years$'000
Total$'000
INTEREST BEARINGFloating rateFinancial assetsCash and cash equivalents 37,535 - - - - - 37,535Average interest rate 2.43% - - - - - $2
Financial liabilitiesVehicle bailment (current) 404,134 - - - - - 404,134Fully drawn advances 3,197 3,197 45,058 1,442 33,082 - 85,976Fully drawn advances
(1)36,701 47,697 - - - - 84,398
Capital loan (Non-current) 208 208 208 208 208 5,225 6,265444,240 51,102 45,266 1,650 33,290 5,225 580,773
Average interest rate 4.39% 4.50% 4.16% 4.16% 4.16% 4.16% $26
Fixed rateFinancial liabilitiesCapital loan (Non-current) 2,600 2,600 51,300 - - - 56,500Finance lease payables 417 807 - - - - 1,224
3,017 3,407 51,300 - - - 57,724
Average interest rate 5.18% 5.20% 5.20% - - - $16
NON INTEREST BEARINGFinancial assetsProperty sale receivables 32,013 16,707 6,884 6,884 - - 62,488Trade debtors 109,116 - - - - - 109,116
141,129 16,707 6,884 6,884 - - 171,604
Financial liabilitiesTrade and other payables 133,563 - - - - - 133,563
(1) The amount included in fully drawn advances relate to variable rates that are hedged with interest rate swaps to fixed rates.
Estimation of Fair Value
The following summarises the major methods and assumptions used in estimating the fair value of financial instruments:
Loans and Borrowings
Fair value is calculated based on discounted expected future principal and interest cash flows.
Trade and Other Receivables/Payables
For receivables/payables with a remaining life of less than one year, the notional amount is deemed to reflect the fair value. Allother receivables/payables are discounted to determine the fair value.
Interest Rate Swaps
The fair value of interest rate swaps is calculated based on the present value of the estimated future cash flows of theseinstruments.
45A.P. Eagers Limited31 December 2016

NOTES TO AND FORMING PART OF THE FINANCIAL STATEMENTS31 DECEMBER 2016 (continued)
31 INVESTMENTS IN SUBSIDIARIES
Name of entity Equity holding2016
%2015
%
Eagers Retail Pty Ltd * 100 100Eagers MD Pty Ltd 80 80Eagers Finance Pty Ltd * 100 100Nundah Motors Pty Ltd * 100 100Eagers Nominees Pty Ltd * 100 100Austral Pty Ltd * 100 100E G Eager & Son Pty Ltd * 100 100A.P. Group Ltd * 100 100A.P. Ford Pty Ltd * 100 100A.P. Motors Pty Ltd * 100 100A.P. Motors (No.1) Pty Ltd * 100 100A.P. Motors (No.2) Pty Ltd * 100 100A.P. Motors (No.3) Pty Ltd * 100 100Associated Finance Pty Limited * 100 100Leaseline & General Finance Pty Ltd * 100 100City Automotive Group Pty Ltd * 100 100PPT Investments Pty Ltd * 100 100PPT Holdings No 1 Pty Ltd * 100 100PPT Holdings No 2 Pty Ltd * 100 100PPT Holdings No 3 Pty Ltd * 100 100Bill Buckle Holdings Pty Ltd * 100 100Bill Buckle Autos Pty Ltd * 100 100Bill Buckle Leasing Pty Ltd * 100 100Adtrans Group Limited * 100 100Adtrans Corporate Pty Ltd * 100 100Adtrans Automotive Group Pty Ltd * 100 100Stillwell Trucks Pty Ltd * 100 100Adtrans Trucks Pty Ltd * 100 100Graham Cornes Motors Pty Ltd 90 90Whitehorse Trucks Pty Ltd * 100 100Adtrans Used Pty Ltd * 100 100Adtrans Hino Pty Ltd * 100 100Adtrans Australia Pty Ltd * 100 100Melbourne Truck and Bus Centre Pty Ltd * 100 100Adtrans Truck Centre Pty Ltd * 100 100Adtrans Trucks Adelaide Pty Ltd * 100 100Precision Automotive Technology Pty Ltd * 100 100IB Motors Pty Ltd * 100 100IB MD Pty Ltd 80 80AP Townsville Pty Ltd * 100 100South West Queensland Motors Pty Ltd 80 80BASW Pty Ltd 80 80Western Equipment Rentals Pty Ltd 80 80Boonarga Welding Pty Ltd 80 80Black Auto CQ Pty Ltd * 100 100CH Auto Pty Ltd * 100 100Auto Ad Pty Ltd * 100 100Motors TAS Pty Ltd * 100 100WS Motors Pty Ltd * 100 100MB VIC Pty Ltd * 100 100Carzoos Pty Ltd * 100 100Crampton Automotive Pty Ltd * 100 -Motors Group (Glen Waverley) Pty Ltd 80 -Port City Autos Pty Ltd * 100 -Adverpro Pty Ltd * 100 -
46A.P. Eagers Limited31 December 2016

NOTES TO AND FORMING PART OF THE FINANCIAL STATEMENTS31 DECEMBER 2016 (continued)
31 INVESTMENTS IN SUBSIDIARIES (continued)
Name of entity Equity holding2016
%2015
%
AP Queensland (No. 1) Pty Ltd * 100 -
All subsidiaries are either directly controlled by A.P. Eagers Limited, or are wholly owned within the Group, have ordinary class ofshares and are incorporated in Australia.
Information relating to A.P. Eagers Limited (‘the parent entity’)
2016$'000
2015$'000
Financial positionAssetsCurrent assets - 13,120Non-current assets 510,553 488,298
510,553 501,418
LiabilitiesCurrent liabilities 5,836 -Non-current liabilities 16,005 28,380
21,841 28,380
EquityIssued capital 364,449 296,060Retained earnings 115,459 113,631Reserves
Asset revaluation reserve 1,683 1,683Investment revaluation reserve 37,394 64,536Share based payments reserve (30,274) (2,872)
488,711 473,038
Financial performanceProfit for the year 60,221 61,490Other comprehensive income 38,774 46,199
All subsidiaries were parties to a deed of cross guarantee with A.P. Eagers Limited pursuant to ASIC Class Order 98/1418 whichhas been lodged with and approved by Australian Securities and Investments Commission as at 31 December 2016. Under thedeed of cross guarantee each of these companies guarantee the debts of the other named companies. The aggregate assetsand liabilities of these companies at 31 December 2016 and their aggregate net profit after tax for the year ended 31 December2016 match the reported balances within the Statement of Financial Position and the Statement of Profit or Loss respectively.
As a party to the deed of cross guarantee, each of the wholly-owned subsidiaries (marked *) is relieved from the requirement toprepare and lodge an audited financial report.
Also refer Notes 32(a) and 32(b) in respect of guarantees entered into by the parent entity in relation to debts of its subsidiaries.
47A.P. Eagers Limited31 December 2016

NOTES TO AND FORMING PART OF THE FINANCIAL STATEMENTS31 DECEMBER 2016 (continued)
31 INVESTMENTS IN SUBSIDIARIES (continued)
(a) Acquisition of businesses
The Group acquired the following business during the 2016 year as detailed below:
Year Name of business Date ofacquisition
Principal activity Proportionacquired
2016 Birrell Motors Group 1-Apr-16 Motor Dealership 100% (1)2016 Jeep/Kia Ipswich 15-Apr-16 Motor Dealership 100%2016 Crampton Automotive Group 1-July-16 Motor Dealership 100%2016 Tony Ireland Motors 1-Oct-16 Motor Dealership 100%
(1) As part of the Birrell Motors Group acquisition 80% shares of Motors Group (Glen Waverley) Pty Ltd were acquired. Theremaining 20% interest is accounted for as a non controlling interest.
During 2016 the acquired businesses contributed revenue of $418,718,346 and profit before tax of $10,054,210 to theconsolidated result. If the acquisition had occurred on 1 January 2016, the consolidated revenue and the consolidated profitbefore tax of the Group would have been $4,069 million and $146 million respectively.
Allocation of purchase consideration
The purchase price of the businesses acquired has been allocated as follows:
CramptonAutomotive
Group$'000
Tony IrelandGroup$'000
Jeep/KiaIpswich
$'000
Birrell MotorsGroup$'000
2016Total
Consolidated$'000
Cash consideration 24,896 9,603 1,222 85,976 121,697Issue of ordinary shares 11,000 - - 21,450 32,450Contingent consideration (i) - 500 - 18,590 19,090
Total purchase consideration 35,896 10,103 1,222 126,016 173,237
Consolidated fair value at acquisition date2016$'000
Net assets acquiredCash 3,364Receivables, prepayments 6,276Other investments 250Inventory 62,547Property, plant and equipment 12,550Deferred tax assets 2,375Creditors, borrowings and provisions (52,700)Deferred tax liabilities (32)Net assets acquired 34,630
Acquisition cost 173,237Non-Controlling Interest (367)
Goodwill on acquisition (ii) 138,240
48A.P. Eagers Limited31 December 2016

NOTES TO AND FORMING PART OF THE FINANCIAL STATEMENTS31 DECEMBER 2016 (continued)
31 INVESTMENTS IN SUBSIDIARIES (continued)
(a) Acquisition of businesses (continued)
Allocation of purchase consideration (continued)
(i) The purchase consideration for the acquisition of Birrell Motors Group includes a contingent consideration amountpayable up to a maximum value of $19,800,000 (discounted value of $18,590,000 at date of acquisition), contingent onBirrell Motors Group achieving future earnings performance targets for 2018 and 2019. The directors have judged thatthe full contingent consideration will be payable in 2019 based on the track record of the acquired businesses, upside inthe business and outlook for luxury vehicles in particular. This necessarily requires an element of estimation. Should thebusinesses not achieve the expected future milestones, the associated goodwill balance will be reviewed for impairmentwithin the VIC & TAS CGU.
The purchase consideration for the acquisition of the Tony Ireland Group includes an earn out payable up to a maximumvalue of $500,000. The earn out is contingent on the Tony Ireland Group achieving future earnings performance targets.
(ii) Goodwill arose in the business combinations because as at the date of acquisition the consideration paid for thecombination included amounts in relation to the benefit of expected synergies and future revenue and profit growth fromthe businesses acquired. These benefits were not recognised separately from goodwill as the future economic benefitsarising from them could not be reliably measured in time for inclusion in this financial statements. Therefore, the amountallocated to goodwill on acquisition has been provisionally determined at the end of the reporting period.
2016$'000
Cash consideration on acquisition 121,697Cash acquired on acquisition (3,364)Net cash flow on acquisition of business 118,333
The Group acquired the following business during the 2015 year as detailed below:
Year Name of business Date ofacquisition
Principal activity Proportionacquired
2015 Auto Advantage 01-Aug-15 Motor Vehicle Broker100%
During 2015 the acquired business contributed revenues of $1,225,000 and profit before tax of $36,000. If the acquisition hadoccurred on 1 January 2015, the consolidated revenue and the consolidated profit before tax would have been $2,938,000 and$86,000 respectively.
Allocation of purchase consideration
The purchase price of business acquired has been allocated as follows:
2015Auto
Advantage$'000
Cash consideration 669Contingent consideration (i) 326
Total purchase consideration 995
Fair value of net identifiable assets (40)Goodwill 1,033
993
49A.P. Eagers Limited31 December 2016

NOTES TO AND FORMING PART OF THE FINANCIAL STATEMENTS31 DECEMBER 2016 (continued)
31 INVESTMENTS IN SUBSIDIARIES (continued)
(a) Acquisition of businesses (continued)
Allocation of purchase consideration (continued)
Consolidated fair value at acquisition date2015$'000
Net assets acquiredReceivables, prepayments 5Property, plant and equipment 8Deferred tax assets 22Creditors, borrowings and provisions (75)Net assets acquired (40)
Acquisition cost 993
Goodwill on acquisition (ii) 1,033
(i) Under the initial contingent consideration arrangement an additional $326,400 was required to be paid if AutoAdvantage's volume exceeded 765 units and 1530 units ending 365 and 730 days respectively. At the end of 365 daysthe volume exceeded 765 units and the first payment of $163,200 was made. Management consider that it is probablethat the second payment of $163,200 will be required.
(ii) Goodwill arose in the business combinations because as at the date of acquisition the consideration paid for thecombination included amounts in relation to the benefit of expected synergies and future revenue and profit growth fromthe businesses acquired. In the prior year, the amount allocated to goodwill on acquisition was provisionally determined,and no changes made in the current period.
Cash consideration on acquisition 669
(b) Disposal of businesses
There were no businesses sold by the Group during 2016.
The Group sold the following business during the 2015 year as detailed below:
Year Name of business Date ofsale
Principal activity Proportiondisposed
2015 Western Equipment Rentals 30-Nov-15 Retail Franchise 100%
CONSOLIDATED2015$'000
Net assets disposed ofProperty, plant and equipment 45Creditors, borrowings and provisions (4)Intangible assets 350Net assets disposed 391
Total consideration received (100% Cash) 441
Gain on sale 50
(c) Details of non-wholly owned subsidiaries
The table below shows details of non-wholly owned subsidiaries of the Group. The Group have reviewed its subsidiaries thathave non-controlling interests and note that they are not material to the reporting entity.
50A.P. Eagers Limited31 December 2016
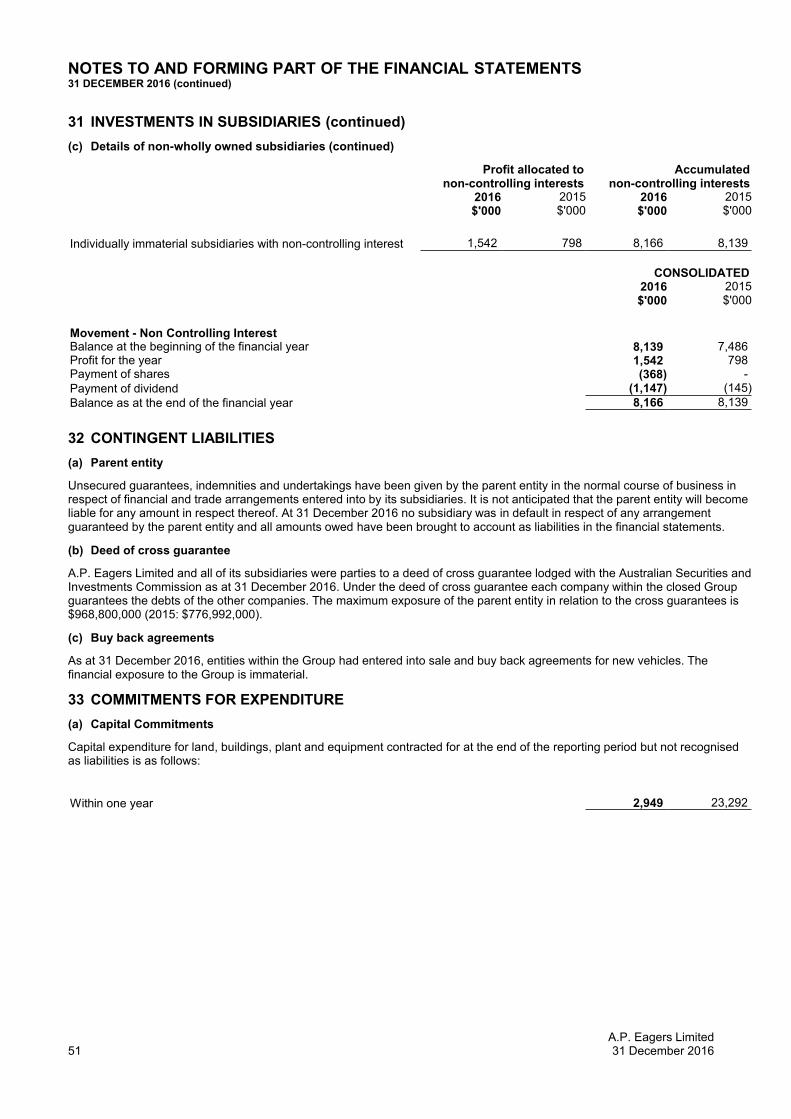
NOTES TO AND FORMING PART OF THE FINANCIAL STATEMENTS31 DECEMBER 2016 (continued)
31 INVESTMENTS IN SUBSIDIARIES (continued)
(c) Details of non-wholly owned subsidiaries (continued)
Profit allocated tonon-controlling interests
Accumulatednon-controlling interests
2016$'000
2015$'000
2016$'000
2015$'000
Individually immaterial subsidiaries with non-controlling interest 1,542 798 8,166 8,139
CONSOLIDATED2016$'000
2015$'000
Movement - Non Controlling InterestBalance at the beginning of the financial year 8,139 7,486Profit for the year 1,542 798Payment of shares (368) -Payment of dividend (1,147) (145)
Balance as at the end of the financial year 8,166 8,139
32 CONTINGENT LIABILITIES
(a) Parent entity
Unsecured guarantees, indemnities and undertakings have been given by the parent entity in the normal course of business inrespect of financial and trade arrangements entered into by its subsidiaries. It is not anticipated that the parent entity will becomeliable for any amount in respect thereof. At 31 December 2016 no subsidiary was in default in respect of any arrangementguaranteed by the parent entity and all amounts owed have been brought to account as liabilities in the financial statements.
(b) Deed of cross guarantee
A.P. Eagers Limited and all of its subsidiaries were parties to a deed of cross guarantee lodged with the Australian Securities andInvestments Commission as at 31 December 2016. Under the deed of cross guarantee each company within the closed Groupguarantees the debts of the other companies. The maximum exposure of the parent entity in relation to the cross guarantees is$968,800,000 (2015: $776,992,000).
(c) Buy back agreements
As at 31 December 2016, entities within the Group had entered into sale and buy back agreements for new vehicles. Thefinancial exposure to the Group is immaterial.
33 COMMITMENTS FOR EXPENDITURE
(a) Capital Commitments
Capital expenditure for land, buildings, plant and equipment contracted for at the end of the reporting period but not recognisedas liabilities is as follows:
Within one year 2,949 23,292
51A.P. Eagers Limited31 December 2016

NOTES TO AND FORMING PART OF THE FINANCIAL STATEMENTS31 DECEMBER 2016 (continued)
33 COMMITMENTS FOR EXPENDITURE (continued)
(b) Finance Lease Liabilities
Commitments for minimum lease payments in relation to finance lease liabilities are payable as follows:
CONSOLIDATED2016$'000
2015$'000
Within one year - 417Later than 1 year but not later than 5 years - 806
- 1,223
Less future finance charges - (78)
Present value of minimum lease payments - 1,145
(c) Operating Lease Commitments
Commitments for minimum lease payments in relation to non-cancellable operating leases for premises are payable as follows:
Within one year 38,758 25,118Later than 1 year but not later than 5 years 103,067 66,442Later than 5 years 83,450 41,990
225,275 133,550
The consolidated entity leases property under non-cancellable operating leases with expiry dates between 31 January 2017 and1 July 2035.
Leases generally provide for a right of renewal at which time the lease is renegotiated. Lease rental payments comprise a baseamount plus an incremental contingent rental based on movements in the consumer price index or a fixed percentage increase.
34 REMUNERATION OF AUDITOR
Amounts received or due and receivable by Deloitte Touche Tomatsu (“Deloitte”) for:- Audit or review of the financial report of the parent entity and any other entity in theconsolidated entity 762 600
Amounts received or due and receivable by related entities of Deloitte for:- Other services in relation to the parent entity and any other entity in the consolidated entity 438 250
1,200 850
35 SUBSEQUENT EVENTS
Commencing 4 January 2017, the Group acquired a further 9.3 million shares in Automotive Holdings Group Limited (‘AHG’) at atotal cost of $36.4 million through a series of on-market share purchases. As a result, the Group’s shareholding in AHGincreased from 19.99% as at 31 December 2016 to 22.82%.
36 KEY MANAGEMENT PERSONNEL
The remuneration report included in the Directors’ Report sets out the remuneration policies of the consolidated entity and therelationship between these policies and the consolidated entity’s performance.
The following have been identified as key management personnel (KMP) with authority and responsibility for planning, directingand controlling the activities of the Group, directly or indirectly during the financial year:
The specified Executives of A.P. Eagers Limited during the financial year were:
52A.P. Eagers Limited31 December 2016

NOTES TO AND FORMING PART OF THE FINANCIAL STATEMENTS31 DECEMBER 2016 (continued)
36 KEY MANAGEMENT PERSONNEL (continued)
(a) Details of key management personnel
(i) Directors T B Crommelin Chairman (non-executive)M A Ward Managing Director and Chief Executive OfficerD A Cowper Director (non-executive)P W Henley Director (non-executive)N G Politis Director (non-executive)D T Ryan Director (non-executive)M J Birrell Director (non-executive), appointed 27 July 2016
(ii) Executives S A Moore Chief Financial OfficerD G Stark General Counsel & Company SecretaryK T Thornton General Manager – Queensland and Northern Territory
(b) Compensation of key management personnel
The aggregate compensation made to key management personnel of the Company and the Group is set out below.
CONSOLIDATED2016$'000
2015$'000
Short term 3,709,156 3,999,836Post employment benefits 149,941 146,493Share based payments 1,328,022 1,634,339
5,187,119 5,780,668
(c) Option holdings of key management personnel
Details of options held by key management personnel can be found in Note 36(f).
(d) Loans to key management personnel
There are no loans to key management personnel.
(e) Other transactions with key management personnel
Other transactions with key management personnel are detailed in Note 38.
(f) Share Based Payments
Plan A: EPS Performance Rights and Options - Key Executives
The Group commenced an Earnings Per Share (EPS) based performance rights and option compensation scheme for specificexecutive officers in 2009. The fair value of these performance rights and options is calculated on grant date and recognised overthe period to vesting. The vesting of the performance rights and options granted is based on the achievement of specifiedearnings per share growth targets and interest cover thresholds. The fair value has been calculated using a binomial optionpricing model based on numerous variables including the following:
Performance Rights
Award date 29 October 2009Vesting date 27-Mar-11 27-Mar-12 27-Mar-13 27-Mar-14 27-Mar-15Expiry date 28-Aug-16 28-Aug-16 28-Aug-16 28-Aug-16 30-Sep-17Share price at grant date $ 1.82 $ 1.82 $ 1.82 $ 1.82 $ 1.82Expected life 1.6 years 2.6 years 3.6 years 4.6 years 5.6 yearsVolatility 30% 30% 30% 30% 30%Risk free interest rate 4.37% 4.89% 5.18% 5.31% 5.33%Dividend yield 6.0% 6.0% 6.0% 6.0% 6.0%
53A.P. Eagers Limited31 December 2016

NOTES TO AND FORMING PART OF THE FINANCIAL STATEMENTS31 DECEMBER 2016 (continued)
36 KEY MANAGEMENT PERSONNEL (continued)
(f) Share Based Payments (continued)
Plan A: EPS Performance Rights and Options - Key Executives (continued)
Performance Options
Award date 29 October 2009Vesting date 27-Mar-11 27-Mar-12 27-Mar-13 27-Mar-14 30-Mar-15Expiry date 28-Aug-16 28-Aug-16 28-Aug-16 28-Aug-16 30-Sep-17Share price at grant date $ 1.82 $ 1.82 $ 1.82 $ 1.82 $ 1.82Exercise price $ 1.82 $ 1.82 $ 1.82 $ 1.82 $ 1.82Expected life 4.3 years 4.8 years 5.3 years 5.8 years 6.8 yearsVolatility 30% 30% 30% 30% 30%Risk free interest rate 5.29% 5.32% 5.33% 5.33% 5.33%Dividend yield 6.0% 6.0% 6.0% 6.0% 6.0%
The General Manager, Queensland and Northern Territory, the previous General Manager of Kloster Motor Group and theprevious Chief Financial Officer have been granted rights and options under the EPS share incentive plan (Plan A). The modifiedgrant date method (AASB 2) is applied to this incentive plan whereby the cost of the plan is determined by the value of the rightsand options at grant date and the probability of the EPS and interest cover targets being achieved and vesting occurring. Thenumber of performance rights and options granted under the plan is as follows:
Performance Rights
Number Grant Date End PerformancePeriod
Expiry Date Fair Value at GrantDate
82,830 29-Oct-09 31-Dec-10 28-Aug-16 $ 1.66112,035 29-Oct-09 31-Dec-11 28-Aug-16 $ 1.56118,880 29-Oct-09 31-Dec-12 28-Aug-16 $ 1.47126,265 29-Oct-09 31-Dec-13 28-Aug-16 $ 1.39134,205 29-Oct-09 31-Dec-14 30-Sep-17 $ 1.30
Performance Options
Number Grant Date End PerformancePeriod
Expiry Date Fair Value at GrantDate
381,945 29-Oct-09 31-Dec-10 28-Aug-16 $ 0.36475,545 29-Oct-09 31-Dec-11 28-Aug-16 $ 0.36472,975 29-Oct-09 31-Dec-12 28-Aug-16 $ 0.37475,545 29-Oct-09 31-Dec-13 28-Aug-16 $ 0.37465,430 29-Oct-09 31-Dec-14 30-Sep-17 $ 0.38
No rights or options were forfeited during the year. All rights had been issued in prior periods and EPS and interest cover targetshad been achieved in prior periods resulting in vesting occurring. 1,372,695 of the remaining options were exercised during theyear. There are no rights or options remaining under this plan.
No costs of the share plan were expensed during 2016 (2015: $nil). The share plan was fully expensed by the end of 2014.
Plan C: EPS Performance Rights and Options – Key Executives 2014
The Group commenced an Earnings Per Share (EPS) based performance rights and option compensation scheme for specificexecutive officers in 2014. The fair value of these performance rights and options is calculated on grant date and recognised overthe period to vesting. The vesting of the performance rights and options granted is based on the achievement of specifiedearnings per share growth targets and interest cover thresholds. The fair value has been calculated using a binomial optionpricing model based on numerous variables including the following:
Performance Rights
Award date 4 July 2014Vesting date 31-Mar-16 31-Mar-17 31-Mar-18 31-Mar-19 31-Mar-20Expiry date 04-Jul-21 04-Jul-21 04-Jul-21 30-Sep-22 30-Sep-22Share price at grant date $ 5.47 $ 5.47 $ 5.47 $ 5.47 $ 5.47Expected life 1.7 years 2.7 years 3.7 years 4.7 years 5.7 yearsVolatility 25% 25% 25% 25% 25%Risk free interest rate 2.51% 2.63% 2.79% 2.96% 3.13%Dividend yield 4.2% 4.2% 4.2% 4.2% 4.2%
54A.P. Eagers Limited31 December 2016

NOTES TO AND FORMING PART OF THE FINANCIAL STATEMENTS31 DECEMBER 2016 (continued)
36 KEY MANAGEMENT PERSONNEL (continued)
(f) Share Based Payments (continued)
Plan C: EPS Performance Rights and Options – Key Executives 2014 (continued)
Performance Options
Award date 4 July 2014Vesting date 31-Mar-16 31-Mar-17 31-Mar-18 31-Mar-19 31-Mar-20Expiry date 04-Jul-21 04-Jul-21 04-Jul-21 30-Sep-22 30-Sep-22Share price at grant date $ 5.47 $ 5.47 $ 5.47 $ 5.47 $ 5.47Exercise price $ 5.47 $ 5.47 $ 5.47 $ 5.47 $ 5.47Expected life 4.4 years 4.9 years 5.4 years 5.9 years 7.0 yearsVolatility 25% 25% 25% 25% 25%Risk free interest rate 2.90% 2.98% 3.06% 3.24% 3.31%Dividend yield 4.2% 4.2% 4.2% 4.2% 4.2%
The Managing Director, General Manager Queensland and Northern Territory, previous Chief Financial Officer, General Counseland Company Secretary and four other senior executives have been granted rights and options under the EPS share incentiveplan (Plan C). The modified grant date method (AASB 2) is applied to this incentive plan whereby the cost of the plan isdetermined by the value of the rights and options at grant date and the probability of the EPS and interest cover targets beingachieved and vesting occurring. The number of performance rights and options granted under the plan is as follows:
Performance Rights
Number Grant Date End PerformancePeriod
Expiry Date Fair Value at GrantDate
137,791 04-Jul-14 31-Dec-15 04-Jul-21 $ 5.08137,571 04-Jul-14 31-Dec-16 04-Jul-21 $ 4.87143,464 04-Jul-14 31-Dec-17 04-Jul-21 $ 4.67149,551 04-Jul-14 31-Dec-18 30-Sep-22 $ 4.48156,173 04-Jul-14 31-Dec-19 30-Sep-22 $ 4.29
Performance Options
Number Grant Date End PerformancePeriod
Expiry Date Fair Value at GrantDate
769,228 04-Jul-14 31-Dec-15 04-Jul-21 $ 0.91712,760 04-Jul-14 31-Dec-16 04-Jul-21 $ 0.94705,258 04-Jul-14 31-Dec-17 04-Jul-21 $ 0.95663,363 04-Jul-14 31-Dec-18 30-Sep-22 $ 1.01656,857 04-Jul-14 31-Dec-19 30-Sep-22 $ 1.02
No rights or options were forfeited or expired during the year. As a result of the EPS target being achieved the performancerights and options relating to the 31 December 2016 performance period have vested.
A total of 137,791 rights were issued and 50,000 options exercised during the year. As a result of the EPS and interest covertargets being achieved the performance rights and options for each performance period have vested.
The value of the performance rights and options expensed during the year was $1,495,012, with a cumulative expense beingrecognised at 31 December 2016 of $3,696,614 (2015: $2,201,602).
37 OTHER SHARE BASED PAYMENTS
Recognised share-based payments expenses
Refer Note 29 for movements on share based payments reserve.
Plan D: EPS Performance Rights and Options – Senior Management (A)
The Group commenced an Earnings Per Share (EPS) based performance rights and option compensation scheme for nineteenspecific management personnel in 2010. The fair value of these performance rights and options is calculated on grant date andrecognised over the period to vesting. The vesting of the performance rights and options granted is based on the achievement ofspecified earnings per share growth targets and interest cover thresholds. The fair value has been calculated using a binomialoption pricing model based on numerous variables including the following:
55A.P. Eagers Limited31 December 2016

NOTES TO AND FORMING PART OF THE FINANCIAL STATEMENTS31 DECEMBER 2016 (continued)
37 OTHER SHARE BASED PAYMENTS (continued)
Plan D: EPS Performance Rights and Options – Senior Management (A) (continued)
Performance Rights
Award date 27 January 2010Vesting date 27-Mar-11 27-Mar-12 27-Mar-13Expiry date 27-Jan-17 27-Jan-17 27-Jan-17Share price at grant date $ 2.42 $ 2.42 $ 2.42Expected life 1.2 years 2.2 years 3.2 yearsVolatility 30% 30% 30%Risk free interest rate 5.06% 5.11% 5.17%Dividend yield 5.10% 5.10% 5.10%
Performance Options
Award date 27 January 2010Vesting date 27-Mar-11 27-Mar-12 27-Mar-13Expiry date 27-Jan-17 27-Jan-17 27-Jan-17Share price at grant date $ 2.42 $ 2.42 $ 2.42Exercise price $ 2.42 $ 2.42 $ 2.42Expected life 4.1 years 4.6 years 5.1 yearsVolatility 30% 30% 30%Risk free interest rate 5.06% 5.11% 5.17%Dividend yield 5.10% 5.10% 5.10%
Specific executives have been granted rights and options under the EPS share incentive plan (Plan D). This includes the GeneralCounsel & Company Secretary. The modified grant date method (AASB 2) is applied to this incentive plan whereby the cost ofthe plan is determined by the value of the rights and options at grant date and the probability of the EPS and interest covertargets being achieved and vesting occurring. The number of performance rights and options granted under the plan is asfollows:
Performance Rights
Number Grant Date End PerformancePeriod
Expiry Date Fair Value at GrantDate
162,310 27-Jan-10 31-Dec-10 27-Jan-17 $ 2.28219,265 27-Jan-10 31-Dec-11 27-Jan-17 $ 2.17230,750 27-Jan-10 31-Dec-12 27-Jan-17 $ 2.06
Performance Options
Number Grant Date End PerformancePeriod
Expiry Date Fair Value at GrantDate
547,705 27-Jan-10 31-Dec-10 27-Jan-17 $ 0.50731,250 27-Jan-10 31-Dec-11 27-Jan-17 $ 0.52714,690 27-Jan-10 31-Dec-12 27-Jan-17 $ 0.53
No rights or options were forfeited or expired during the year. As a result of the EPS and interest cover targets being achievedthe performance rights and options for each performance period have vested. A total of 1,536,710 options were exercised duringthe year.
No costs of the share plan were expensed during 2016 (2015: $nil). The share plan was fully expensed by the end of 2012.
Plan E: EPS Performance Rights and Options – Senior Management (B)
The Group commenced an Earnings Per Share (EPS) based performance rights and option compensation scheme for threespecific executive officers in 2010. The fair value of these performance rights and options is calculated on grant date andrecognised over the period to vesting. The vesting of the performance rights and options granted is based on the achievement ofspecified earnings per share growth targets and interest cover thresholds. The fair value has been calculated using a binomialoption pricing model based on numerous variables including the following:
56A.P. Eagers Limited31 December 2016

NOTES TO AND FORMING PART OF THE FINANCIAL STATEMENTS31 DECEMBER 2016 (continued)
37 OTHER SHARE BASED PAYMENTS (continued)
Plan E: EPS Performance Rights and Options – Senior Management (B) (continued)
Performance Rights
Award date 18 November 2010Vesting date 27-Mar-11 27-Mar-12 27-Mar-13Expiry date 27-Jan-17 27-Jan-17 27-Jan-17Share price at grant date $ 2.52 $ 2.52 $ 2.52Expected life 0.4 years 1.4 years 2.4 yearsVolatility 30% 30% 30%Risk free interest rate 4.91% 4.93% 4.95%Dividend yield 5.00% 5.00% 5.00%
Performance Options
Award date 18 November 2010Vesting date 27-Mar-11 27-Mar-12 27-Mar-13Expiry date 27-Jan-17 27-Jan-17 27-Jan-17Share price at grant date $ 2.52 $ 2.52 $ 2.52Exercise price $ 2.52 $ 2.52 $ 2.52Expected life 3.3 years 3.8 years 4.3 yearsVolatility 30% 30% 30%Risk free interest rate 4.91% 4.93% 4.95%Dividend yield 5.00% 5.00% 5.00%
Specific executives have been granted rights and options under the EPS share incentive plan (Plan E). The modified grant datemethod (AASB 2) is applied to this incentive plan whereby the cost of the plan is determined by the value of the rights andoptions at grant date and the probability of the EPS and interest cover targets being achieved and vesting occurring. The numberof performance rights and options granted under the plan is as follows:
Performance Rights
Number Grant Date End PerformancePeriod
Expiry Date Fair Value at GrantDate
7,785 18-Nov-10 31-Dec-10 27-Jan-17 $ 2.4740,650 18-Nov-10 31-Dec-11 27-Jan-17 $ 2.3542,735 18-Nov-10 31-Dec-12 27-Jan-17 $ 2.23
Performance Options
Number Grant Date End PerformancePeriod
Expiry Date Fair Value at GrantDate
39,925 18-Nov-10 31-Dec-10 27-Jan-17 $ 0.48189,785 18-Nov-10 31-Dec-11 27-Jan-17 $ 0.51181,365 18-Nov-10 31-Dec-12 27-Jan-17 $ 0.53
As a result of the EPS and interest cover targets being achieved the performance rights and options for each performance periodhave vested. No options were forfeited during the year. A total of 136,325 options were exercised during the year.
No costs of the share plan were expensed during 2016 (2015: $nil). The share plan was fully expensed by the end of 2012.
Plan F: EPS Performance Options – Senior Management 2013
The Group commenced an Earnings Per Share (EPS) based share option compensation scheme for 57 specific senior staff,including the Company Secretary/General Counsel. The fair value of these performance options is calculated on grant date andrecognised over the period to vesting. The vesting of the performance options granted is based on the achievement of specifiedearnings per share growth targets. The fair value has been calculated using a binomial option pricing model based on numerousvariables including the following:
57A.P. Eagers Limited31 December 2016

NOTES TO AND FORMING PART OF THE FINANCIAL STATEMENTS31 DECEMBER 2016 (continued)
37 OTHER SHARE BASED PAYMENTS (continued)
Plan F: EPS Performance Options – Senior Management 2013 (continued)
Performance Options
Award date 27 March 2013Vesting date 31-Mar-15 31-Mar-16 31-Mar-17 31-Mar-18 31-Mar-19Expiry date 31-Mar-20 31-Mar-20 31-Mar-20 31-Mar-20 31-Mar-20Share price at grant date $ 4.84 $ 4.84 $ 4.84 $ 4.84 $ 4.84Exercise price $ 5.04 $ 5.04 $ 5.04 $ 5.04 $ 5.04Expected life 4.5 years 4.5 years 5.0 years 5.5 years 6.0 yearsVolatility 30% 30% 30% 30% 30%Risk free interest rate 3.08% 3.08% 3.13% 3.17% 3.22%Dividend yield 4.20% 4.20% 4.20% 4.20% 4.20%
Specific executives have been granted options under the EPS share incentive plan (Plan F). The modified grant date method(AASB 2) is applied to this incentive plan whereby the cost of the plan is determined by the value of the options at grant date andthe probability of the EPS targets being achieved and vesting occurring. The number of options granted under the plan is asfollows:
Performance Options
Number Grant Date End PerformancePeriod
Expiry Date Fair Value at GrantDate
951,950 27-Mar-13 31-Dec-14 31-Mar-20 $ 0.93951,950 27-Mar-13 31-Dec-15 31-Mar-20 $ 0.93911,510 27-Mar-13 31-Dec-16 31-Mar-20 $ 0.96892,840 27-Mar-13 31-Dec-17 31-Mar-20 $ 0.98883,750 27-Mar-13 31-Dec-18 31-Mar-20 $ 0.99
A total of 30,720 options in 2016 were forfeited or expired during the year. A total of 21,500 options were exercised during theyear. As a result of the EPS target being achieved the performance options relating to the 31 December 2016 performanceperiod have vested.
The value of the performance options expensed during the year was $786,979, with a cumulative expense being recognised at31 December 2016 of $3,475,680 (2015: $2,705,492).
Plan H: EPS Performance Rights and Options – Key Executives
The Group commenced a new Earnings Per Share (EPS) based performance rights and option compensation scheme for twospecific executive officers in 2015. The fair value of these performance rights and options is calculated on grant date andrecognised over the period to vesting. The fair value has been calculated using a binomial option pricing model based onnumerous variables including the following:
Performance Rights
Award date 21 January 2015Vesting date 31-Mar-16 31-Mar-17 31-Mar-18 31-Mar-19 31-Mar-20Expiry date 21-Jan-22 21-Jan-22 21-Jan-22 30-Sep-22 30-Sep-22Share price at grant date $5.85 $5.85 $5.85 $5.85 $5.85Expected life 1.2 years 2.2 years 3.2 years 4.2 years 5.2 yearsVolatility 22% 22% 22% 22% 22%Risk free interest rate 2.20% 2.12% 2.11% 2.15% 2.22%Dividend yield 4.4% 4.4% 4.4% 4.4% 4.4%
Performance Options
Award date 21 January 2015Vesting date 31-Mar-16 31-Mar-17 31-Mar-18 31-Mar-19 31-Mar-20Expiry date 21-Jan-22 21-Jan-22 21-Jan-22 30-Sep-22 30-Sep-22Share price at grant date $5.85 $5.85 $5.85 $5.85 $5.85Exercise Price $5.65 $5.65 $5.65 $5.65 $5.65Expected life 4.1 years 4.6 years 5.1 years 5.9 years 6.4 yearsVolatility 22% 22% 22% 22% 22%Risk free interest rate 2.15% 2.18% 2.21% 2.28% 2.33%Dividend yield 4.4% 4.4% 4.4% 4.4% 4.4%
58A.P. Eagers Limited31 December 2016

NOTES TO AND FORMING PART OF THE FINANCIAL STATEMENTS31 DECEMBER 2016 (continued)
37 OTHER SHARE BASED PAYMENTS (continued)
Plan H: EPS Performance Rights and Options – Key Executives (continued)
Two specific executives have been granted options under the EPS share incentive plan (Plan H). The modified grant datemethod (AASB 2) is applied to this incentive plan whereby the cost of the plan is determined by the value of the options at grantdate and the probability of the EPS targets being achieved and vesting occurring. The number of options granted under the planis as follows:
Performance Rights
Number Grant Date End PerformancePeriod
Expiry Date Fair Value at GrantDate
14,412 21-Jan-15 31-Dec-15 21-Jan-22 $5.5515,065 21-Jan-15 31-Dec-16 12-Feb-22 $5.3115,746 21-Jan-15 31-Dec-17 12-Feb-22 $5.0816,459 21-Jan-15 31-Dec-18 12-Feb-22 $4.8617,202 21-Jan-15 31-Dec-19 30-Sep-22 $4.65
Performance Options
Number Grant Date End PerformancePeriod
Expiry Date Fair Value at GrantDate
95,235 21-Jan-15 31-Dec-15 21-Jan-22 $0.8493,020 21-Jan-15 31-Dec-16 12-Feb-22 $0.8693,020 21-Jan-15 31-Dec-17 12-Feb-22 $0.8691,953 21-Jan-15 31-Dec-18 12-Feb-22 $0.8793,020 21-Jan-15 31-Dec-19 30-Sep-22 $0.86
No performance rights or options were forfeited or expired during the year. As a result of the specific targets being achieved theperformance rights and options relating to the 31 December 2016 performance period have vested.
The value of the performance rights and options expensed during the year was $188,655, with a cumulative expense beingrecognised as at 31 December 2016 of $422,635 (2015: $233,980).
Plan I: EPS Performance Rights and Options – Key Executives
The Group commenced in 2015 a new performance rights and option compensation scheme for a specific senior staff member,based on achieving certain defined operating targets for a specific business entity. The fair value of these performance rights andoptions is calculated on grant date and recognised over the period to vesting. The fair value has been calculated using a binomialoption pricing model based on numerous variables including the following:
Performance Rights
Award date 12 February 2015Vesting date 31-Mar-16 31-Mar-17 31-Mar-18 31-Mar-19 31-Mar-20Expiry date 12-Feb-22 12-Feb-22 12-Feb-22 30-Sep-22 30-Sep-22Share price at grant date $6.26 $6.26 $6.26 $6.26 $6.26Expected life 1.1 years 2.1 years 3.1 years 4.1 years 5.1 yearsVolatility 22% 22% 22% 22% 22%Risk free interest rate 1.91% 1.85% 1.87% 1.95% 2.05%Dividend yield 4.2% 4.2% 4.2% 4.2% 4.2%
Performance Options
Award date 12 February 2015Vesting date 31-Mar-16 31-Mar-17 31-Mar-18 31-Mar-19 31-Mar-20Expiry date 12-Feb-22 12-Feb-22 12-Feb-22 30-Sep-22 30-Sep-22Share price at grant date $6.26 $6.26 $6.26 $6.26 $6.26Exercise price $6.26 $6.26 $6.26 $6.26 $6.26Expected life 4.1 years 4.6 years 5.1 years 5.9 years 6.4 yearsVolatility 22% 22% 22% 22% 22%Risk free interest rate 1.94% 1.99% 2.04% 2.14% 2.20%Dividend yield 4.2% 4.2% 4.2% 4.2% 4.2%
59A.P. Eagers Limited31 December 2016

NOTES TO AND FORMING PART OF THE FINANCIAL STATEMENTS31 DECEMBER 2016 (continued)
37 OTHER SHARE BASED PAYMENTS (continued)
Plan I: EPS Performance Rights and Options – Key Executives (continued)
A specific senior staff member have been granted performance rights and options under the Specific Target share plan (Plan I).The modified grant date method (AASB 2) is applied to this incentive plan whereby the cost of the plan is determined by thevalue of the rights and options at grant date and the probability of specific targets being achieved and vesting occurring. Thenumber of options granted under the plan is as follows:
Performance Rights
Number Grant Date End PerformancePeriod
Expiry Date Fair Value at GrantDate
9,045 12-Feb-15 31-Dec-15 12-Feb-22 $5.979,440 12-Feb-15 31-Dec-16 12-Feb-22 $5.729,836 12-Feb-15 31-Dec-17 12-Feb-22 $5.4911,406 12-Feb-15 31-Dec-18 30-Sep-22 $5.2611,881 12-Feb-15 31-Dec-19 30-Sep-22 $5.05
Performance Options
Number Grant Date End PerformancePeriod
Expiry Date Fair Value at GrantDate
97,590 12-Feb-15 31-Dec-15 12-Feb-22 $0.8395,294 12-Feb-15 31-Dec-16 12-Feb-22 $0.8594,186 12-Feb-15 31-Dec-17 12-Feb-22 $0.86102,272 12-Feb-15 31-Dec-18 30-Sep-22 $0.88102,272 12-Feb-15 31-Dec-19 30-Sep-22 $0.88
No performance rights or options were forfeited or expired during the year. As a result of the specific targets being achieved theperformance rights and options relating to the 31 December 2016 performance period have vested since balance date.
The value of the performance rights and options expensed during the year was $170,998, with a cumulative expense beingrecognised as at 31 December 2016 of $350,995 (2015: $179,997).
Plan J: EPS Performance Rights and Options – Key Executives
The Group commenced a new Earnings Per Share (EPS) based performance rights and option compensation scheme for twospecific executive officers in 2015. The fair value of these performance rights and options is calculated on grant date andrecognised over the period to vesting. The vesting of the performance rights and options granted is based on the achievement ofspecified earnings per share growth targets and interest cover thresholds. The fair value has been calculated using a binomialoption pricing model based on numerous variables including the following:
Performance Rights
Award date 12 June 2015Vesting date 31-Mar-16 31-Mar-17 31-Mar-18 31-Mar-19 31-Mar-20Expiry date 12-Jun-22 12-Jun-22 12-Jun-22 30-Sep-22 30-Sep-22Share price at grant date $9.25 $9.25 $9.25 $9.25 $9.25Expected life 0.8 years 1.8 years 2.8 years 3.8 years 4.8 yearsVolatility 24% 24% 24% 24% 24%Risk free interest rate 1.98% 1.99% 2.06% 2.18% 2.33%Dividend yield 3.7% 3.7% 3.7% 3.7% 3.7%
60A.P. Eagers Limited31 December 2016
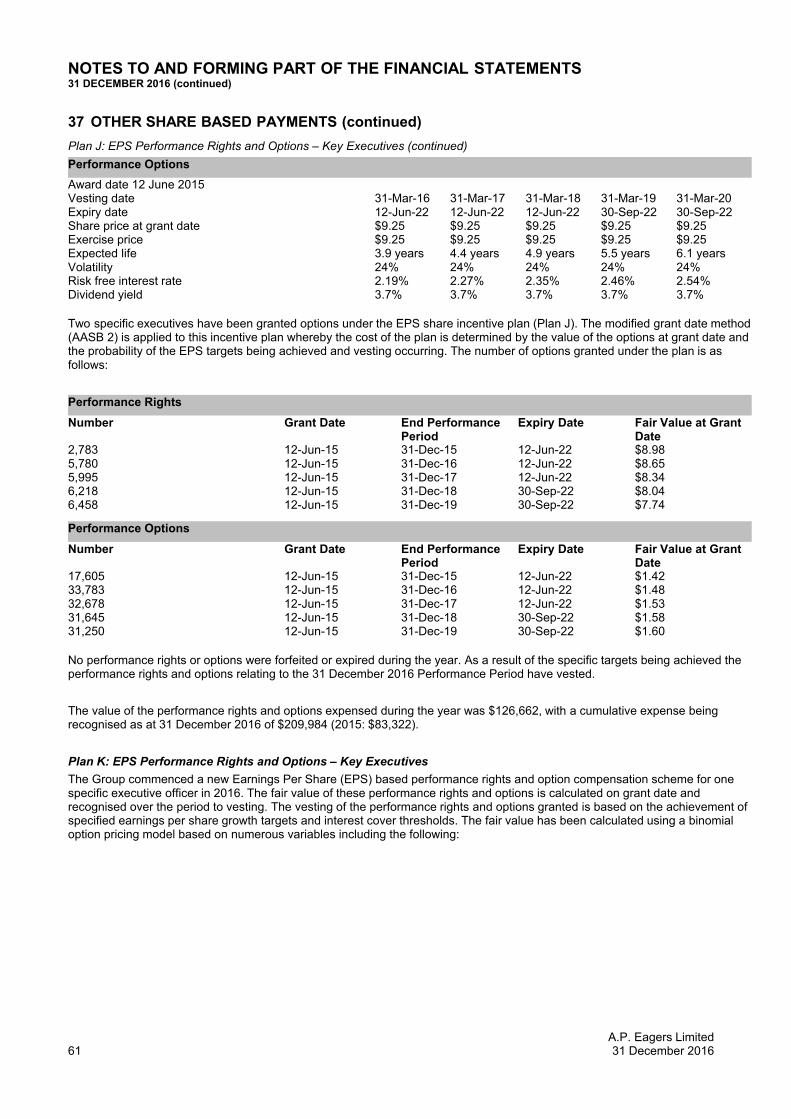
NOTES TO AND FORMING PART OF THE FINANCIAL STATEMENTS31 DECEMBER 2016 (continued)
37 OTHER SHARE BASED PAYMENTS (continued)
Plan J: EPS Performance Rights and Options – Key Executives (continued)
Performance Options
Award date 12 June 2015Vesting date 31-Mar-16 31-Mar-17 31-Mar-18 31-Mar-19 31-Mar-20Expiry date 12-Jun-22 12-Jun-22 12-Jun-22 30-Sep-22 30-Sep-22Share price at grant date $9.25 $9.25 $9.25 $9.25 $9.25Exercise price $9.25 $9.25 $9.25 $9.25 $9.25Expected life 3.9 years 4.4 years 4.9 years 5.5 years 6.1 yearsVolatility 24% 24% 24% 24% 24%Risk free interest rate 2.19% 2.27% 2.35% 2.46% 2.54%Dividend yield 3.7% 3.7% 3.7% 3.7% 3.7%
Two specific executives have been granted options under the EPS share incentive plan (Plan J). The modified grant date method(AASB 2) is applied to this incentive plan whereby the cost of the plan is determined by the value of the options at grant date andthe probability of the EPS targets being achieved and vesting occurring. The number of options granted under the plan is asfollows:
Performance Rights
Number Grant Date End PerformancePeriod
Expiry Date Fair Value at GrantDate
2,783 12-Jun-15 31-Dec-15 12-Jun-22 $8.985,780 12-Jun-15 31-Dec-16 12-Jun-22 $8.655,995 12-Jun-15 31-Dec-17 12-Jun-22 $8.346,218 12-Jun-15 31-Dec-18 30-Sep-22 $8.046,458 12-Jun-15 31-Dec-19 30-Sep-22 $7.74
Performance Options
Number Grant Date End PerformancePeriod
Expiry Date Fair Value at GrantDate
17,605 12-Jun-15 31-Dec-15 12-Jun-22 $1.4233,783 12-Jun-15 31-Dec-16 12-Jun-22 $1.4832,678 12-Jun-15 31-Dec-17 12-Jun-22 $1.5331,645 12-Jun-15 31-Dec-18 30-Sep-22 $1.5831,250 12-Jun-15 31-Dec-19 30-Sep-22 $1.60
No performance rights or options were forfeited or expired during the year. As a result of the specific targets being achieved theperformance rights and options relating to the 31 December 2016 Performance Period have vested.
The value of the performance rights and options expensed during the year was $126,662, with a cumulative expense beingrecognised as at 31 December 2016 of $209,984 (2015: $83,322).
Plan K: EPS Performance Rights and Options – Key Executives
The Group commenced a new Earnings Per Share (EPS) based performance rights and option compensation scheme for onespecific executive officer in 2016. The fair value of these performance rights and options is calculated on grant date andrecognised over the period to vesting. The vesting of the performance rights and options granted is based on the achievement ofspecified earnings per share growth targets and interest cover thresholds. The fair value has been calculated using a binomialoption pricing model based on numerous variables including the following:
61A.P. Eagers Limited31 December 2016

NOTES TO AND FORMING PART OF THE FINANCIAL STATEMENTS31 DECEMBER 2016 (continued)
37 OTHER SHARE BASED PAYMENTS (continued)
Plan K: EPS Performance Rights and Options – Key Executives (continued)
Performance Rights
Award date 31 March 2016Vesting date 31-Mar-17 31-Mar-18 31-Mar-19 31-Mar-20Expiry date 31-Mar-24 31-Mar-24 31-Mar-24 31-Mar-24Share price at grant date $9.75 $9.75 $9.75 $9.75Expected life 1.0 year 2.0 years 3.0 years 4.0 yearsVolatility 27% 27% 27% 27%Risk free interest rate 1.95% 1.88% 1.90% 1.98%Dividend yield 3.8% 3.8% 3.8% 3.8%
Performance Options
Award date 31 March 2016Vesting date 31-Mar-17 31-Mar-18 31-Mar-19 31-Mar-20Expiry date 31-Mar-24 31-Mar-24 31-Mar-24 31-Mar-24Share price at grant date $9.75 $9.75 $9.75 $9.75Exercise price $10.34 $10.34 $10.34 $10.34Expected life 4.5 years 5.0 years 5.5 years 6.0 yearsVolatility 27% 27% 27% 27%Risk free interest rate 2.03% 2.08% 2.13% 2.18%Dividend yield 3.8% 3.8% 3.8% 3.8%
One specific executive has been granted options under the EPS share incentive plan (Plan K). The modified grant date method(AASB 2) is applied to this incentive plan whereby the cost of the plan is determined by the value of the options at grant date andthe probability of the EPS targets being achieved and vesting occurring. The number of options granted under the plan is asfollows:
Performance Rights
Number Grant Date End PerformancePeriod
Expiry Date Fair Value at GrantDate
7,987 31-Mar-16 31-Dec-16 31-Mar-24 $9.398,296 31-Mar-16 31-Dec-17 31-Mar-24 $9.048,620 31-Mar-16 31-Dec-18 31-Mar-24 $8.708,960 31-Mar-16 31-Dec-19 31-Mar-24 $8.37
Performance Options
Number Grant Date End PerformancePeriod
Expiry Date Fair Value at GrantDate
48,076 31-Mar-16 31-Dec-16 31-Mar-24 $1.5646,012 31-Mar-16 31-Dec-17 31-Mar-24 $1.6344,910 31-Mar-16 31-Dec-18 31-Mar-24 $1.6743,859 31-Mar-16 31-Dec-19 31-Mar-24 $1.71
No performance rights or options were forfeited or expired during the year. As a result of the specific targets being achieved theperformance rights and options relating to the 31 December 2016 Performance Period have vested.
The value of the performance rights and options expensed during the year was $214,448, with a cumulative expense beingrecognised as at 31 December 2016 of $214,448 (2015: $Nil).
38 RELATED PARTIES
Key management personnel
Other information on key management personnel has been disclosed in the Directors’ Report.
62A.P. Eagers Limited31 December 2016

NOTES TO AND FORMING PART OF THE FINANCIAL STATEMENTS31 DECEMBER 2016 (continued)
38 RELATED PARTIES (continued)
Remuneration and retirement benefits
Information on the remuneration of key individual management personnel has been disclosed in the Remuneration Reportincluded in the Directors’ Report.
Other transactions of directors and director related entities
The aggregate amount of “Other transactions” with key management personnel are as follows:
(i) Mr N G Politis is a director and shareholder of a number of companies involved in the motor industry with whom theconsolidated entity transacts business. These transactions, sales of $462,274 (2015: $466,281) and purchases of$520,476 (2015: $341,762) during the last 12 months, are primarily the sale and purchase of spare parts andaccessories and are carried out under terms and conditions no more favourable than those which it is reasonable toexpect would have applied if the transactions were at arm’s length.
(ii) Mr M Birrell is a director and owner of a number of properties leased by subsidaries of A. P. Eagers. The leasetransactions of $1,956,301 during the last 6 months since his appointment to the board are carried out under terms andconditions no more favourable than those which it is reasonable to expect would have applied if the transactions were atarm’s length.
Mr M Birrell also has a consultancy arrangement with AP Eagers whereby he is paid a consultancy fee in considerationfor provision of professional services provided for AP Eagers' Victorian and Tasmanian businesses. There were niltransactions during the last 6 months since his appointment to the board.
Finally, Mr M Birrell was a party to the Birrell Motors Group business acquisition which is subject to a contingentconsideration arrangement whereby an additional amount is payable at 31 December 2019 if a specified performancetarget is met. The contingent consideration has been recognised as a financial liability as at 31 December 2016, refer toNote 26.
(iii) Controlled entities may, from time to time, sell motor vehicles, parts and servicing of motor vehicles for domestic use todirectors of entities in the consolidated entity or their director-related entities within a normal employee relationship onterms and conditions no more favourable than those which it is reasonable to expect would have been adopted if dealingwith the directors or their director-related entities at arm’s length in the same circumstances.
Wholly-owned group
The parent entity of the wholly-owned group is A.P. Eagers Limited. Information relating to the wholly-owned group is set out inNote 31.
39 EARNINGS PER SHARE
(a) Basic earnings per share
CONSOLIDATED2016
Cents2015
Cents
Earnings attributable to the ordinary equity holders of the Company 55.4 47.6
(b) Diluted earnings per share
CONSOLIDATED2016
Cents2015
Cents
Earnings attributable to the ordinary equity holders of the Company 54.0 46.1
63A.P. Eagers Limited31 December 2016

NOTES TO AND FORMING PART OF THE FINANCIAL STATEMENTS31 DECEMBER 2016 (continued)
39 EARNINGS PER SHARE (continued)
(c) Reconciliation of earnings used in calculating earnings per share
CONSOLIDATED2016$'000
2015$'000
Basic earnings per shareProfit attributable to the ordinary equity holders of the Company used in calculating basicearnings per share:
Profit for the year 105,526 87,015Less: attributable to non-controlling interest (1,542) (798)
Profit attributable to the ordinary equity holders of the company used in calculating basicearnings per share 103,984 86,217
Diluted earnings per shareProfit for the year less attributable to non-controlling interest 103,984 86,217
Profit attributable to the ordinary equity holders of the company used in calculating dilutedearnings per share 103,984 86,217
Weighted average number of ordinary shares outstanding during the year 187,811,094 180,997,843
Shares deemed to be issued for no consideration in respect of employee options (1) 4,747,506 6,214,054Weighted average number of ordinary shares outstanding during the year used in the calculationof diluted earnings per share 192,558,600 187,211,897
(1) 134,781 performance options representing potential ordinary shares are anti-dilutive and are therefore excluded from theweighted average number of ordinary shares for the purposes of diluted earnings per share.
64A.P. Eagers Limited31 December 2016

NOTES TO AND FORMING PART OF THE FINANCIAL STATEMENTS31 DECEMBER 2016 (continued)
40 RECONCILIATION OF NET PROFIT AFTER TAX TO THE NET CASH INFLOWS FROMOPERATIONS
CONSOLIDATED
Notes2016$'000
2015$'000
Net profit after tax 105,526 87,015
Depreciation and amortisation 5 13,993 13,216Impairment of goodwill - 5,527Net (gain)/loss on sale of available-for-sale financial assets 14 (1,955) (3,490)Share of profits of associate (191) (164)Dividends from investments 191 164Gain / (Loss) on sale of property,plant & equipment (1,136) (2,886)Employee share scheme expense 2,966 3,018Non controlling interest adjustments (535) (1,406)Profit on sale of business - (50)Property receivable and deposits 22,547 28,403(Gain) / Impairment to property revaluation (through P&L) (1,235) 2,083(Increase)/decrease in assets -
Receivables (39,630) (30,412)Inventories (94,844) (57,327)Prepayments (587) (5,883)
Increase/(decrease) in liabilities -Creditors (including bailment finance) 104,079 48,263Provisions 5,738 4,997Taxes payable (4,213) (6,515)
Net cash inflow from operating activities 110,714 84,553
41 NON-CASH TRANSACTIONS
In 2015, the Group entered into unconditional contracts for the sale of 80 McLachlan Street, Fortitude Valley and a parcel of landin Newstead. As a result a combined profit of $3.010 million was recognised in that year and was included within the amountdisclosed in Note 4. Consideration for the sales totalling $32.013 million was realised in full in 2016.
65A.P. Eagers Limited31 December 2016

NOTES TO AND FORMING PART OF THE FINANCIAL STATEMENTS31 DECEMBER 2016 (continued)
42 INVESTMENTS IN ASSOCIATES
(a) Carrying amounts
Investments in associate are accounted for in the consolidated financial statements using the equity method of accounting.Information relating to the associate is set out below:
OWNERSHIP INTEREST CONSOLIDATED
Name of company2016
%2015
%2016$'000
2015$'000
Unlisted securitiesNorna Limited (formerly MTQ Insurance Services Limited) 20.65 20.65 1,620 1,620DealerMotive Ltd 25.76 - 9,973 -Carzapp Pty Ltd 10.00 - 300 -
56.41 20.65 11,893 1,620
Norna Limited (formerly MTQ Insurance Servers Limited)
In 2014 MTQ Insurance Services Limited changed its name to Norna Limited. On 29 August 2014 MTA Insurance Limited (awholly owned subsidiary of Norna Limited) was sold to AAI Limited with settlement to take place in instalments, the final of whichis expected to be realised in 2017. Once the sale is completed Norna Limited will be liquidated.
AP Eagers Limited will remain a shareholder in Norna Limited with a 20.65% interest (2015: 20.65%) and will continue to equityaccount the investment in the associate which has been equity accounted from 1 January 2006 (refer Note 15), until the finaldistributions are received and Norna Limited is liquidated.
Norna Limited is incorporated in Australia. Its principal activities for the period up to the sale remained the sale of consumercredit and insurance products, as well as undertaking investment activities. Since the sale, the entity has ceased operations withthe only transactions being related to holding costs and interest until the final terms of the sale agreement are met and the entityis liquidated.
Dealermotive Limited
In 2016, AP Eagers transferred its shares in One Way Traffic Pty Ltd (Carsguide) and Auto Trader Australia Pty Ltd (Auto Trader)to DealerMotive Limited (DealerMotive) under a scheme of arrangement, in return for an equal dollar value of shares inDealerMotive. AP Eagers also subscribed to shares in DealerMotive during the year as part of a capital raising. AP Eagers holdsa 25.8% shareholding in DealerMotive as at 31 December 2016.
DealerMotive Limited is incorporated in Australia. Its principal activities for the period is holding a 30% investment in CoxAutomotive Australia, a subsidiary of Cox Automotive. Cox Automotive Australia controls and operates Manheim Australia,Dealer Solutions and One Way Traffic (Carsguide) businesses and owns the Auto Traders brand.
(b) Movement in the carrying amounts of investment in associate -
CONSOLIDATED2016$'000
2015$'000
Carrying amount at the beginning of the financial year 1,620 1,620Equity share of profit from ordinary activities after income tax 191 164Dividends received during the year (191) (164)Equity accounted investments acquired 10,273 -
Carrying amount at the end of the financial year 11,893 1,620
66A.P. Eagers Limited31 December 2016
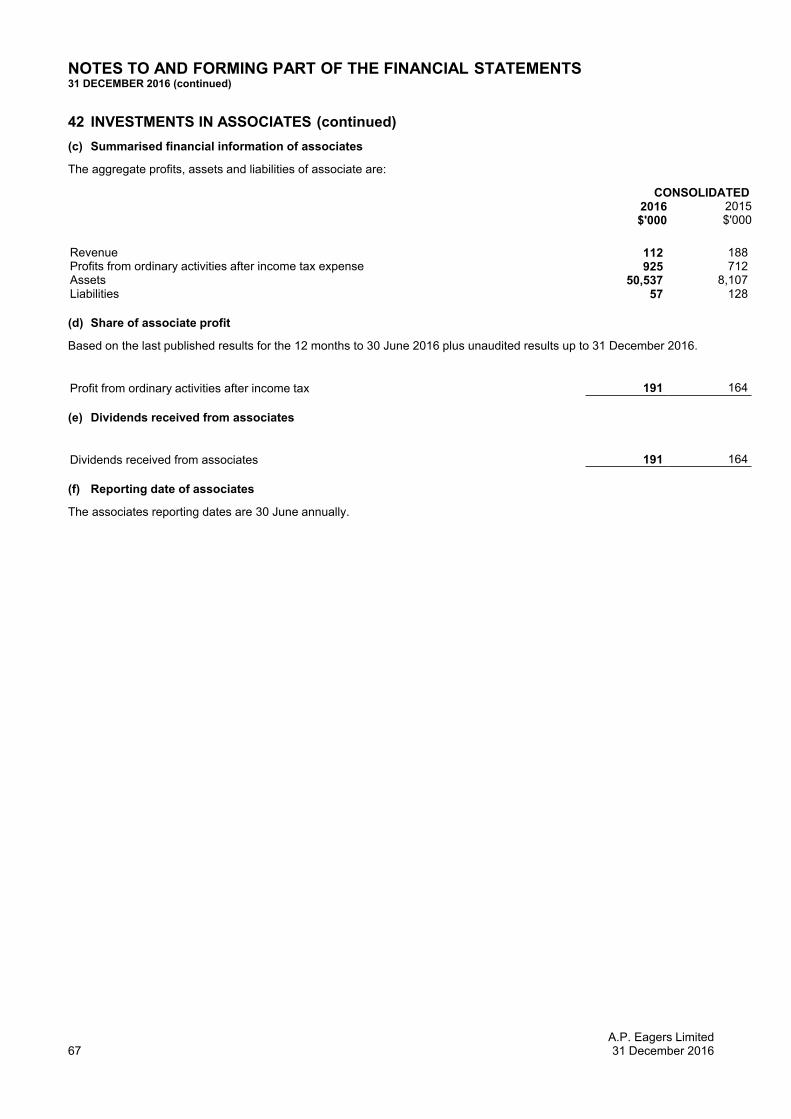
NOTES TO AND FORMING PART OF THE FINANCIAL STATEMENTS31 DECEMBER 2016 (continued)
42 INVESTMENTS IN ASSOCIATES (continued)
(c) Summarised financial information of associates
The aggregate profits, assets and liabilities of associate are:
CONSOLIDATED2016$'000
2015$'000
Revenue 112 188Profits from ordinary activities after income tax expense 925 712Assets 50,537 8,107Liabilities 57 128
(d) Share of associate profit
Based on the last published results for the 12 months to 30 June 2016 plus unaudited results up to 31 December 2016.
Profit from ordinary activities after income tax 191 164
(e) Dividends received from associates
Dividends received from associates 191 164
(f) Reporting date of associates
The associates reporting dates are 30 June annually.
67A.P. Eagers Limited31 December 2016

Directors' declaration
The Directors declare that :
(a) in the directors’ opinion, there are reasonable grounds to believe that the Company will be able to pay its debts as andwhen they become due and payable;
(b) in the directors’ opinion, the attached financial statements and notes thereto are in accordance with the Corporations Act2001, including compliance with accounting standards and giving a true and fair view of the financial position andperformance of the consolidated entity; and
(c) in the director’s opinion, the attached financial statements are in compliance with International Financial ReportingStandards as stated in Note 1(a) to the financial statements; and
(d) the directors have been given the declarations required by s.295A of the Corporations Act 2001
At the date of this declaration, the company is within the class of companies affected by ASIC Class Order 98/1418. The natureof the deed of cross guarantee is such that each company which is party to the deed guarantees to each creditor payment in fullof any debt in accordance with the deed of cross guarantee.
In the directors’ opinion, there are reasonable grounds to believe that the company and the companies to which the ASIC ClassOrder applies, as detailed in Note 31 to the financial statements will, as a group, be able to meet any obligations or liabilities towhich they are, or may become, subject by virtue of the deed of cross guarantee.
Signed in accordance with a resolution of the Directors made pursuant to s.295(5) of the Corporations Act 2001.
On behalf of the Directors
M A WardDirector
Brisbane,22 February 2017
68

Liability limited by a scheme approved under Professional Standards Legislation.
Member of Deloitte Touche Tohmatsu Limited
69
Deloitte Touche Tohmatsu ABN 74 490 121 060 Level 25 and 26, Riverside Centre
123 Eagle Street Brisbane, QLD, 4000
Australia
Phone: +61 7 3308 7000 www.deloitte.com.au
Independent Auditor’s Report to the Members of A.P. Eagers Limited
Report on the Audit of the Financial Report
Opinion
We have audited the financial report of A.P. Eagers Limited (the Company) and its subsidiaries (the Group),
which comprises the consolidated statement of financial position as at 31 December 2016, the consolidated
statement of profit or loss and other comprehensive income, the consolidated statement of changes in equity
and the consolidated statement of cash flows for the year then ended, and notes to the financial statements,
including a summary of significant accounting policies, and the directors’ declaration.
In our opinion, the accompanying financial report of the Group is in accordance with the Corporations Act
2001, including:
(i) giving a true and fair view of the Group’s financial position as at 31 December 2016 and of its financial
performance for the year then ended; and
(ii) complying with Australian Accounting Standards and the Corporations Regulations 2001.
Basis for Opinion
We conducted our audit in accordance with Australian Auditing Standards. Our responsibilities under those
standards are further described in the Auditor’s Responsibilities for the Audit of the Financial Report section
of our report. We are independent of the Group in accordance with the auditor independence requirements of
the Corporations Act 2001 and the ethical requirements of the Accounting Professional and Ethical Standards
Board’s APES 110 Code of Ethics for Professional Accountants (the Code) that are relevant to our audit of the
financial report in Australia. We have also fulfilled our other ethical responsibilities in accordance with the
Code.
We confirm that the independence declaration required by the Corporations Act 2001, which has been given
to the directors of the Company, would be in the same terms if given to the directors as at the time of this
auditor’s report.
We believe that the audit evidence we have obtained is sufficient and appropriate to provide a basis for our
opinion.
Key Audit Matters
Key audit matters are those matters that, in our professional judgement, were of most significance in our
audit of the financial report of the current period. These matters were addressed in the context of our audit
of the financial report as a whole, and in forming our opinion thereon, and we do not provide a separate
opinion on these matters.

70
Key Audit Matter How the scope of our audit responded to the Key
Audit Matter
Business Acquisitions
During the financial year ended 31 December 31
2016 the Group made a number of acquisitions
as disclosed in note 31. The most significant
acquisition during the period was the Birrell
Motor Group.
Accounting for acquisitions is complex and
involves a number of significant judgements and
estimates as disclosed in note 2a (vii). The key
areas of significant judgement and estimation in
relation to the Birrell transaction were the:
determination of the fair value of the
contingent consideration, and
accordingly the total consideration, for
the transaction; and
identification and measurement of the
fair value of assets and liabilities
acquired.
Our procedures included, but were not limited to the
following:
Reading the purchase and sale agreements to
understand the terms and conditions of the
acquisitions and evaluating management’s
application of the relevant accounting
standards;
Assessing the estimation of the contingent
consideration by challenging the key
assumptions including discount rate and
probability of achievement of future profit
targets. This included comparing the actual
performance since acquisition against the
forecast performance;
Challenging the methodology and assumptions
utilised to identify and determine the fair
value of the assets and liabilities acquired;
and
Assessing the adequacy of the Group’s
disclosures of the acquisitions.
Recoverability of goodwill
As detailed in note 17, the Group has
recognised goodwill of $292.2 million at 31
December 2016 as a result of historic
acquisitions over a number of years.
As set out in note 2a (i), the director’s
assessment of the recoverability of goodwill
requires the exercise of significant judgement,
in particular in estimating future growth rates,
discount rates and the expected cash flows of
businesses (cash generating units (CGUs)) to
which the goodwill has been allocated.
Estimating the cash flows requires the exercise
of judgement as to the likely impact of:
competitive pressures in specific
markets; and
potential changes resulting from the
regulatory review of finance and
insurance practices across the
automotive industry.
We have focused on CGUs that are most
sensitive to these factors relative to the carrying
value of goodwill.
Our procedures, performed in conjunction with our
valuation specialists included, but were not limited to
the following:
Critically evaluating the Group’s categorisation
of CGUs and the allocation of goodwill to the
carrying value of CGUs based on our
understanding of the Group’s business. This
evaluation included performing an analysis of
the Group’s internal reporting and consultation
with our accounting technical specialists;
Evaluating management’s ability to accurately
forecast cash flows by assessing the precision
of the prior year forecasts again actual
outcomes;
With the assistance of Deloitte valuation
specialists, challenging the following:
o Comparing the discount rate utilised
by management to an independently
calculated discount rate;
o Comparing growth rates with 3rd party
data for the motor industry
o Comparing the Group’s forecast cash
flows to the board approved budget;
and
o Performing sensitivity analysis on the
growth and discount rates.
Evaluating the adequacy of the related
disclosures in the financial report.

71
Key Audit Matter How the scope of our audit responded to the Key
Audit Matter
Recoverable amount of used and
demonstrator vehicles inventory
As disclosed in note 10 the Group has
recognised provisions against the cost of its new
and used motor vehicle and truck inventory of
$14.6 million.
As disclosed in note 2a (v) and (vi) the
estimation of net realisable value requires the
Directors to make certain judgements and
estimates based on the age, condition, brand of
the vehicle and historic sales outcomes.
Our procedures included, but were not limited to:
Developing an understanding of
management’s processes and judgements
applied in estimating the net realisable value
of demonstrator and used vehicles and trucks;
Validating the aging and cost, on a sample
basis, of used, demonstrator vehicle and truck
inventory at year-end as key inputs into
management’s calculation of the write down
provisions;
Evaluating management’s judgements in
estimating net realisable value by:
o comparing the carrying value of
vehicles and trucks to post year-end
sales; and/or
o comparing the carrying value of
vehicle and truck inventory to
external third party valuation data;
and/or
o comparison to historical sales data.
Evaluating the adequacy of the related
disclosures in the financial report.
Other Information
The Directors are responsible for the other information. The other information comprises the Directors’ Report
which we obtained prior to the date of this auditor’s report, the other information also includes the following
documents which will be included in the annual report (but does not include the financial report and our
auditor’s report thereon) the company profile and A.P. Eagers foundation report, which is expected to be made
available to us after that date.
Our opinion on the financial report does not cover the other information and accordingly we do not and will
not express any form of assurance conclusion thereon.
In connection with our audit of the financial report, our responsibility is to read the other information identified
above and, in doing so, consider whether the other information is materially inconsistent with the financial
report or our knowledge obtained in the audit, or otherwise appears to be materially misstated.
If, based on the work we have performed on the other information that we obtained prior to the date of this
auditor’s report, we conclude that there is a material misstatement of this other information, we are required
to report that fact. We have nothing to report in this regard.
When we read the company profile and A.P. Eagers foundation report if we conclude that there is a material
misstatement therein, we are required to communicate the matter to the directors and use our professional
judgement to determine the appropriate action.
Directors’ Responsibilities for the Financial Report
The directors of the Company are responsible for the preparation of the financial report that gives a true and
fair view in accordance with Australian Accounting Standards and the Corporations Act 2001 and for such
internal control as the directors determine is necessary to enable the preparation of the financial report that
gives a true and fair view and is free from material misstatement, whether due to fraud or error.

72
In preparing the financial report, the directors are responsible for assessing the ability of the Group to continue
as a going concern, disclosing, as applicable, matters related to going concern and using the going concern
basis of accounting unless the directors either intend to liquidate the Group or to cease operations, or has no
realistic alternative but to do so.
Auditor’s Responsibilities for the Audit of the Financial Report
Our objectives are to obtain reasonable assurance about whether the financial report as a whole is free from
material misstatement, whether due to fraud or error, and to issue an auditor’s report that includes our
opinion. Reasonable assurance is a high level of assurance, but is not a guarantee that an audit conducted in
accordance with the Australian Auditing Standards will always detect a material misstatement when it exists.
Misstatements can arise from fraud or error and are considered material if, individually or in the aggregate,
they could reasonably be expected to influence the economic decisions of users taken on the basis of this
financial report.
As part of an audit in accordance with the Australian Auditing Standards, we exercise professional judgement
and maintain professional scepticism throughout the audit. We also:
Identify and assess the risks of material misstatement of the financial report, whether due to fraud
or error, design and perform audit procedures responsive to those risks, and obtain audit evidence
that is sufficient and appropriate to provide a basis for our opinion. The risk of not detecting a material
misstatement resulting from fraud is higher than for one resulting from error, as fraud may involve
collusion, forgery, intentional omissions, misrepresentations, or the override of internal control.
Obtain an understanding of internal control relevant to the audit in order to design audit procedures
that are appropriate in the circumstances, but not for the purpose of expressing an opinion on the
effectiveness of the Group’s internal control.
Evaluate the appropriateness of accounting policies used and the reasonableness of accounting
estimates and related disclosures made by the directors.
Conclude on the appropriateness of the directors’ use of the going concern basis of accounting and,
based on the audit evidence obtained, whether a material uncertainty exists related to events or
conditions that may cast significant doubt on the Group’s ability to continue as a going concern. If we
conclude that a material uncertainty exists, we are required to draw attention in our auditor’s report
to the related disclosures in the financial report or, if such disclosures are inadequate, to modify our
opinion. Our conclusions are based on the audit evidence obtained up to the date of our auditor’s
report. However, future events or conditions may cause the Group to cease to continue as a going
concern.
Evaluate the overall presentation, structure and content of the financial report, including the
disclosures, and whether the financial report represents the underlying transactions and events in a
manner that achieves fair presentation.
Obtain sufficient appropriate audit evidence regarding the financial information of the entities or
business activities within the Group to express an opinion on the financial report. We are responsible
for the direction, supervision and performance of the Group audit. We remain solely responsible for
our audit opinion.
We communicate with the directors regarding, among other matters, the planned scope and timing of the
audit and significant audit findings, including any significant deficiencies in internal control that we identify
during our audit.
We also provide the directors with a statement that we have complied with relevant ethical requirements
regarding independence, and to communicate with them all relationships and other matters that may
reasonably be thought to bear on our independence, and where applicable, related safeguards.
From the matters communicated with the directors, we determine those matters that were of most significance
in the audit of the financial report of the current period and are therefore the key audit matters. We describe
these matters in our auditor’s report unless law or regulation precludes public disclosure about the matter or

73
when, in extremely rare circumstances, we determine that a matter should not be communicated in our report
because the adverse consequences of doing so would reasonably be expected to outweigh the public interest
benefits of such communication.
Report on the Remuneration Report
Opinion on the Remuneration Report
We have audited the Remuneration Report included in pages 8 to 16 of the directors’ report for the year ended
31 December 2016.
In our opinion, the Remuneration Report of A.P. Eagers Limited, for the year ended 31 December 2016
complies with section 300A of the Corporations Act 2001.
Responsibilities
The directors of the Company are responsible for the preparation and presentation of the Remuneration Report
in accordance with section 300A of the Corporations Act 2001. Our responsibility is to express an opinion on
the Remuneration Report, based on our audit conducted in accordance with Australian Auditing Standards.
DELOITTE TOUCHE TOHMATSU
Stephen Tarling
Partner
Chartered Accountants
Brisbane 22 February 2017