record, volume 29, no. 1
TRANSCRIPT
_________________________________ *Copyright © 2003, Society of Actuaries
RECORD, Volume 29, No. 1*
Washington, D.C. Spring Meeting May 29–30, 2003 Session 7PD Pricing Risk Management Track: Product Development/Investment Moderator: DAVID T. HENDERSON Panelists: KEITH A. DALL DOUGLAS L. ROBBINS
Summary: Product development actuaries encounter a variety of risks that need to be considered in pricing life and annuity products. This session demonstrates how some of these risks are reflected in pricing and how they are communicated to management. MR. DAVID T. HENDERSON: As product development actuaries, we encounter a variety of risks in the pricing process. Today, we'll first be taking a look at what people are currently doing in this area. I'm going to be running through a recent survey that has been sent out by the Society of Actuaries. We're also going to take a look at some of the newer products and product features that have been developed or are being developed in the marketplace and how you can ensure that you are capturing the risk associated with those products in your pricing work. I've been with the Western Southern Financial Group for 17 years. I’ve done many things in that timeframe, but I am currently working in the area of life pricing and do have some responsibilities related to asset/liability management. I am a past member of the ILA exam committee, which means that I've graded exams. I am currently a member of the Society of Actuaries' Risk Management Task Force, and I'm on the Life Office Management Association (LOMA) Research Council.
Pricing Risk Management 2 I am a graduate of Miami University, and, as I’ve said, I'll be going through the non-technical part of this presentation—the results of the recent survey. After that, you'll hear from Doug Robbins. Doug has been with Tillinghast-Towers Perrin for over eight years. He has a lot of experience in the area of annuity product development, specifically with variable annuities and equity-indexed annuities. Doug is particularly schooled in the newer guarantees that have been attached to those products. Doug is involved with Tillinghast's recent work on risk management and risk mitigation. He has an undergraduate degree from the University of Texas and a master's degree in statistics from Georgia Tech. Doug will be talking about variable annuities and how to capture the risks associated with those products in your pricing. And then our last speaker is going to be Keith Dall. Keith is in the Indianapolis office of Milliman USA. He's been with Milliman since 1998 and been in the actuarial profession for 15 years. His responsibilities at Milliman have included a lot of product development work in the areas of life insurance and annuities, asset/liability management, financial projections and company appraisals. He graduated from the University of Southern Indiana. Keith is going to be discussing universal life pricing, particularly those risks associated with secondary guarantees that everybody, at least in the marketing area, is asking for, in the current product development work. As I said, I'm going to be discussing briefly some of the results of the Risk Management Task Force survey that was specifically designed to address this topic. The survey was conducted in the early part of the fall of last year. It seems like a lot longer ago than that, but it is fairly recent. The goal of the survey was to try to determine what is currently going on in the area of pricing and risk management. What sort of profit measures are people using for various products? What kinds of mechanisms are they using for reflecting risk in their pric ing? What we wanted to determine as a subgroup of the Risk Management Task Force was the direction in which to channel some future research resources. We surveyed the Investment Section and the ILA Product Development Section. That first group may sound a bit odd, but we surveyed them because they paid for the survey. We were funded by the Investment Section. The Risk Management Task Force grew out of the Investment Section. And then the ILA Product Development Section seemed like a natural group to canvass. We're currently working on compiling the results both in terms of summary and detail, but that work is not yet completed. Let’s look at who responded to the survey. We received 275 responses, and if any of those who responded are here, thanks, we do appreciate it. The vast majority of the people were U.S.-based actuaries. Slightly fewer than 10 percent of our responses came from Canadian actuaries. We did receive responses from actuaries working in Australia, Asia and Europe, as well as South America. The respondents were fairly evenly distributed by size of company, and we used actuarial head count

Pricing Risk Management 3 as a metric for the size of the company. Thirty percent of the people worked at fairly small shops that employed 10 or fewer actuaries, while 20 percent of the respondents said that they worked for very large companies employing 150 or more actuaries. What I don't know is how people who work at Milliman would answer. Would they look at their office specifically or the entire organization? Not surprisingly, most of the people who answered the survey worked for life insurance companies or consulting firms. Seventy percent of the people were responsible for individual lines—life, health and annuity—with most of the remainder of the respondents coming from the group area. It's also no surprise that most of the respondents worked in the area of pricing, risk management or financial reporting. One of the first things we wanted to determine was how people were measuring profit in the work that they were doing. Were they using different profit measures for different product types or different risk exposures? And, as expected, we found that people are generally using more than one profit measure when they're pricing. Of those 275 responses, depending on which product we were asking about, we'd get between 400 and 500 answers. So people obviously were answering twice. When I talk about percentages, I'm referring to the percentage of responses as opposed to the percentage of the people who answered. What we found is that the most popular profit measures people are using, and this wasn't a big surprise, are of the "RO-something" variety—return on investment, return on capital, return on equity or return on assets (ROA). The next most popular was some sort of margin calculation, either a margin based on premium or some other depiction of revenue. Specifically, for life insurance we found that 35 percent of the responses indicated the use of an RO-something calculation, and 20 percent of the responses were using a margin, probably a margin on premium. Fifteen percent of the people indicated that they're using an internal rate of return (IRR) calculation, which is the third-most-popular response. For the annuity lines we saw a larger tendency to use an RO-something type of calculation, and that's probably attributed to using ROA much more frequently. For A&H, the third-most-popular profit measure was a value-added calculation, and this was also true for the lines that we stuck in the other category. Interestingly, we did find people are using an embedded value calculation in pricing, but this tended to be much more popular for larger companies. Then we wanted to look at how people were reflecting risk in their pricing. What we found is that folks are generally using one of five categories, and I'd like to define them for you consistent with how they were defined in the survey. Capital allocation simply refers to people increasing or decreasing the amount of capital they're building into their pricing formulas based on a perceived or measured increase or decrease in risk. Assumption stress testing is taking a key assumption, varying it
Pricing Risk Management 4 significantly, rerunning your profit tests or pricing runs, then trying to determine what impact the severe condition might have on your expected profits. Like capital allocation, risk adjusting the profit target is moving your profit target up or down based on the increase or decrease in risk associated with the exercise. Stochastic scenario analysis was defined as taking one or a number of key assumptions, varying them using a stochastic process, looking at a number of scenarios, not just focusing on the expected or mean result but the distribution of results. And then, finally, the provision for adverse deviation was basically adding a measurable amount of conservatism to key assumptions. We found that, of the folks that reflect risk through a capital allocation, over half used some multiple of a regulatory formula, which was not a surprise. We presumed it's risk-based capital (RBC). Another 25 percent are using an internally generated formula. Sixty percent of the people that are using assumption stress testing to reflect the risk are basing the parameters by which they stress the assumptions on actuarial judgment. Twenty percent are actually going through a process where they develop confidence limits to guide them as to how much to stress those assumptions, and another 20 percent are looking at a historical worst case as the means by which they determine how much they should stress those assumptions. Sixty-five percent, almost two-thirds, of people who are adjusting their profit target to reflect risk indicated that they're adjusting that profit target based on actuarial judgment. The remaining third indicated that they adjust that target based on some sort of formula. Fifty percent of the people who are providing for adverse deviation in their assumptions base this provision on recent historical experience. Twenty-five percent are using an industry standard. When we asked in the survey about stochastic scenario analysis, what we wanted specifically to understand was what people were doing to analyze results. And what we found was that 30 percent of the people using this process were looking at simple percentiles. They were trying to answer a question, for example, of what is the probability of a loss, and what does my profit look like in the 1-in-20 scenario, the fifth percentile? Fifteen percent of the people use some sort of mean-variance approach where they're trying to measure the risk and reward of various alternatives, where the reward would be measured probably in the mean of their profit results and the risk in the variation about that mean. Fifty percent of the people using stochastic scenario analysis are doing conditional tail expectation analysis where they're focusing on the distribution in the tail so that they can answer questions from management, such as: If I end up with one of those 1-in-20 or 1-in-10 scenarios, what is my expected impact on profit? And then, finally, 15 percent of the respondents said that they don't only look at the tail distribution, but they want to know specifically what about those scenarios is causing a problem. Is it a rapidly increasing environment? Is it high volatility? What

Pricing Risk Management 5 is it about those scenarios that is creating the poorer results? And, if I know that answer, what can I do to hedge that risk or mitigate it some other way? We then focused in the survey on specific risks and how people were modeling those risks. We started off with the asset-related risks and asset default risk specifically, and what we found was that 60 percent of the respondents said that they've used simply a charge to their earnings rate to reflect the asset default risk. Three-fourths of those actuaries get at least some guidance from their investment area to determine how big that assumption should be. Fifty percent indicated that they use an internal model to generate that number, and the remaining half use some sort of industry standard. When looking at how interest rate risk and equity volatility risk has been captured in the pricing process, not surprisingly 30 percent of the respondents said that they use a stochastic scenario analysis. That number might actually be a little low. The parameters for the stochastic analysis tend to be based on historical data, and there was a high propensity to use some reversion to a mean. Twenty-five percent of the respondents said that they stress test the assumptions, which would indicate a deterministic process. They're using maybe one or a number of the New York Seven scenarios and trying to see what expected profits look like in the pricing run under one of those severe conditions. We then turned our attention in the survey to the liability-related risks, and we started off with claim deviation. We found that the most popular method by which to reflect risk in the pricing process was to stress test the assumptions, again, varying a key assumption by a significant amount and seeing what impact that has on your profits. Twenty-five percent of the people indicated that they pad their key assumptions to reflect claim deviation risk, and only 10 percent of the people said that they use some sort of stochastic modeling process to try to capture the variability of claims. We also looked at customer and agent behavior, such as disintermediation. Again, stress testing was the most popular way to capture that risk with 40 percent of the responses. Twenty-five percent of the people indicated that they have a dynamic lapse formula. Those are probably the people that are doing stochastic analysis. We also looked at expense risk. Here, like the other liability risks, the results indicated a high propensity to use stress testing. Twenty-five percent of the people did indicate that they're padding their expense assumptions to reflect the risk. Twenty percent of the people indicated that they're modeling inflation, probably in a stochastic process where they're modeling inflation relative to some key interest rate or set of interest rates. We did ask about risk covariance, and we found that half of the respondents indicated that they do nothing additional in this area. In other words, they're treating all of the risks that they're modeling as independent. Fifteen percent of the people did point out that if they're using a capital formula, especially a multiple of a

Pricing Risk Management 6 regulatory capital formula, that they have a covariance component in that capital formula. Fifteen percent of the respondents cited that they use a multi-risk stochastic process in their pricing, and 15 percent of the people pointed out that when they look at interest rate risk and dynamic lapses together they're capturing the relationship of those risks at the same time. So, what have we learned from the survey? Well, we haven't drawn any firm conclusions at this point. We did find that people are doing a lot of different things in the area of risk management when it comes to pricing and individual actuaries using one of a number of currently generally accepted practices when trying to capture risk in the pricing process. We did see that there appears to be a higher propensity for the asset-related risks to be modeled, whereas the liability-related risks tend to have more of a reliance on actuarial judgment. This makes sense if you think about it. There's a ton of standardized data associated with the asset marketplace. Wall Street employs thousands and thousands of very smart people to evaluate that data, and it tends to make that market more efficient, which lends itself to modeling. Our models aren't always correct, obviously, but there's a ton of data upon which to base those models. By contrast, liability-related risks still tend to be company-specific. The data pools are smaller, and they're not standard from one company to the next. At this point, it does require much more actuarial judgment in the use of that data to develop assumptions and methods for capturing risk. Again, we haven't drawn any conclusions at this point, but replacing some of that judgment with a little more mathematics may be one area of future research. I realize that I've run through the survey results very quickly. I apologize if I’ve presented them too quickly. I just wanted to give folks an idea of what people are currently doing in this area, or at least what the survey revealed that people are currently doing in this area. At this point we're going to transition from that general view to a focus on specific products and features and what people are doing or should be doing to try to capture the risk associated with those newer products that are currently being offered in the marketplace. MR. DOUGLAS L. ROBBINS: As Todd pointed out, I'm going to be talking to you today about risk management while pricing annuity products. I think I'm going to focus a little bit more on variable than on the other kinds of annuities just because there's a lot going on with investment risk in the variable area right now. There is a lot in the news as far as guarantees and investment risks in general. Also, I'd point out that I focused in my examples mostly on IRR, partly because you all said that that's the most important measure to you when you responded to the survey as annuity pricing actuaries. I'm going to cover this in five sections, starting with the importance of negative correlation. Before I do, I'm going to tell you a brief story about something that happened to a friend of mine. I'm from Atlanta, Ga. We have Jeff Foxworthy and

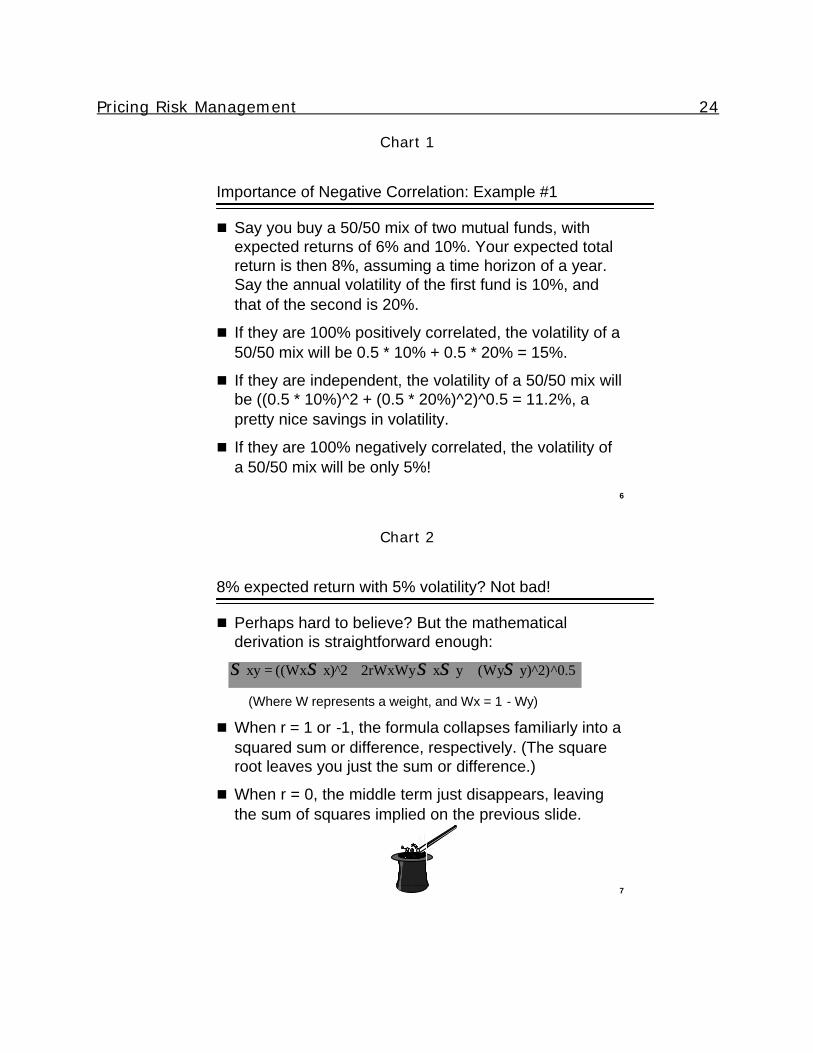
Pricing Risk Management 7 everything. A friend of mine down there sat in on a college psychology class. The professor wanted to find out what people already knew. So he said, okay, I'm going to call on a few of you. I'm going to give you a word. You tell me what you think the opposite is. He points to a young lady in the front row who wanted to go first. He says, okay, grief. And she says joy. Good, good. Okay. Is there anyone else? A guy in the third row raises his hand. The professor goes, okay, you, despair. And the guy goes elation. The professor goes, great, we're getting this. And my friend goes this is easy. So he raises his hand. The professor calls on him and says, okay, young man, woe. And he says giddy-up. We're talking about opposites, and that's why I brought that story up—the importance of negative correlation as far as managing investment risk or risks in general. Risk management typically involves attempting to control volatility. Pricing might imply that the volatility we're trying to control has to do with profit measures, but we're not going to start there. I'm going to do a brief example of negative correlation or things having opposite characteristics. And I'm going to do a pure investment example, not really an annuity example, just to let you know what I'm talking about. Let’s say you buy a 50/50 mix of two mutual funds, maybe a bond-like fund with 6 percent return and an equity-like fund with 10 percent (Charts 1 and 2). That gives you—if you have a 50/50 mix—a total expected return of 8 percent, but let's say the volatilities of those funds are 10 and 20, respectively. If those funds are 100 percent positively correlated, the volatility of your mix turns out to be 15 percent. In other words, half-and-half, if they're 100 percent positively correlated. If they're independent or at least uncorrelated, 0 percent correlation, the volatility goes down to 11.2, pretty nice savings. Wouldn't you agree? But if they're 100 percent negatively correlated, the volatility of a 50/50 mix will only be 5 percent. It'll be half of 20 minus half of 10, in other words. That's obviously a huge volatility savings, which isn’t bad. If I were investing, I'd take it—8 percent expected return with only 5 percent volatility. It's based on the formula that I have there, and it's purely mathematical (Chart 2). There's no argument against what I'm saying that's valid. The formula there is out of a textbook. I had it reviewed. It's correct. I'm not going to talk any more than that about it, but I will say when R equals one or negative one, the formula collapses in a way that you'll remember from algebra into simply A plus B quantity squared. So when you take the square root of that you have A plus B, which is the first example, where the standard deviation or the volatility of the sum was just the sum of the volatilities. R equals minus one is the difference of the volatilities. If R equals zero, the middle term obviously disappears because it has R in it, and you're left with summing the variances and taking the square root, which is how you get the partial volatility savings with zero correlation. The difficult part is finding those two funds. You go and find me two funds that are 100 percent negatively correlated and both have a risk premium, then I'm buying
Pricing Risk Management 8 dinner at least, maybe a new car, because obviously I can get really, really rich. A volatility of 5 percent is not even the best you can do given those two funds. If you invest two-thirds in the first fund and one-third in the second, you actually have a slightly lower expected return but a volatility of zero. So, in other words, you're getting an expected return of risky funds combined and a volatility of zero. You're actually risk-free. Again, it sounds weird, but it's clear if you consider that 100 percent negative correlation means that the two have to move exactly opposite directionally. They don't have to move the same distance, that has to do with the actual regression parameter that you would get if you did a regression, but they have to counteract exactly. So all you'd have to know is what the relative volatilities are, in this case two-to-one, and you can create a mix that, since they have to move oppositely, ends up counteracting each other in every time period you would measure. Therefore, you have the risk-free situation that I mentioned. Now, realistically, we're lucky to find risky funds with an R as negative .2 or more. Usually we don't, but if we combine mixes of independent and slightly negatively correlated funds, we do get great volatility savings, which is the basis for things like efficient frontier analysis. Now, my goal here has just been to illustrate in a setting you're all used to, because you all probably invest in your 401(k) and outside, the effect on volatility of negative correlation. How can we take that and apply it to pricing risk management for annuities? The question is to hedge or not to hedge. What's the dictionary definition of hedge? I looked it up in Webster. I actually got a bunch of funny definitions, including that clip-art-type definition, but definition number five or so was "to try to avoid or lessen loss by making counterbalancing bets, investments, et cetera." So that's what we're after—looking for ways to make counterbalancing bets that allow us to make money as insurers without being exposed. That sounds like an attempt at true, 100 percent negative correlation, but correlation of what? What do we want to hedge as pricing actuaries? Well, if you want to hedge for a single value or a cash flow, finding a true hedge can be straightforward. It might be available out in the market already. You determine the possible characteristics of your single cash flow or other item, determine what you want the outcome to be, and find the item that, when you put it together with what you already have, produces a nearly certain outcome equal to what you desire. Obtaining that hedge may carry substantial cost or, if what you're shooting for is really unambitious, it could have a zero or a negative cost. You've all seen examples where you can combine different options, and you're actually the one receiving the option premium. That's all I'm saying there when I say negative cost. However, as insurers, most attempts to eliminate tail risk carry a substantial cost.

Pricing Risk Management 9 Let's look at a 10-year guaranteed minimum accumulation benefit (GMAB), a first example for a variable annuity. This is typically something that says you're going to get your premium back after 10 years no matter what. Well, if you, the insurer, sell that, and you stipulate that the only fund you're allowed to invest in is a Standard & Poors (S&P) 500 large cap fund, it could be simple. You determine the required strike based on how far out you're going, 10 years, based on product loads that are going to occur between now and then, and any other reductions that are going to happen to the gross S&P return. That gives you your strike. You go out and buy the put option, and you're done. Are there any questions? Well, no, you're not done because there's a lot more out there to talk about. Another not-so-complicated example is fixed annuities and disintermediation. If you determine as the actuary that your worst case is a spike upward in interest rates during the surrender charge period causing disintermediation, what can you do? Well, you know what you're hedging against, interest rates during the surrender charge period, and there are quite a few instruments out there related to interest rate options or futures that you might use. You just want to figure out what timing you're dealing with, but at least you're still only talking about one parameter, interest rates or possibly the yield curve's worth of interest rates. What if you want to hedge losses under a variable annuities guaranteed minimum death benefit (GMDB) or, worse yet, a guaranteed minimum income benefit (GMIB)? Well, now you have a problem. Under a GMDB you could buy a series of put options matching what you think your expected deaths are going to be, but if you're wrong about mortality or, for that matter, withdrawals, so your decrements leave you with fewer or more lives than you were expecting, or if your mortality is off and fewer or more people die than you were expecting, then you haven't bought the right options. With a GMIB, again, you have a waiting period like the GMAB, but at the end of the waiting period the option is to annuitize. Now, instead of everyone getting the option at one time period, 10 years, you have an option where every policyholder makes his choice, if the fund has done poorly, whether to annuitize in year 7, 8, 9, 10, 11 or 12 or more. You have no idea for sure when they're going to do it. You can come up with an assumption, but your hedging strategy is only as good as your assumption. And both of these benefits, along with a lot of GMABs out there, unlike the example I gave you where you only allow investment in a large cap fund, have no restrictions on fund allocation. So, if your policyholders can be in bonds, cash, international equities, small caps or even crazier stuff than that maybe you have in your portfolio where there are not even hedges available, it's hard to know what asset class to hedge against or even whether it's conceivably possible to do it. So you're left with the tail risk. Could reinsurance be the answer to hedging these risks on variable annuities? Well, it could be if you can get it, and that's been a problem lately. Two reinsurance issues exist: (a) counterparty, in other words reinsurer or default risk aside, or availability at a price that works for the direct
Pricing Risk Management 10 writer, you, the product development actuary for a company; and (b) tail coverage, and that's the big one. You can think that you're eliminating the tails that are produced by some of these guarantees, and you find out once you stress test the reinsurance deal you work out that, since it only covers you up to, say, a few million, and then at that point the risk is back on you, you could find that most of your tail is still "on you," not on the reinsurer. In other words, if you're doing CTE-type testing, the problem hasn't gone away. It's only been mitigated somewhat partway out into the tail. If you can get low-cost full coverage reinsurance, it can certainly be a very effective hedge. Why is that? Well, what we're looking for when we want to do a hedge is 100 percent negative correlation. Full coverage reinsurance is exactly that. You get a cash flow that you have to pay your policyholder. You call on the reinsurer, and they pay the same cash flow to you. We could be talking about guarantee coverage for excess death benefits or living benefits, or we could be talking about pure coinsurance of the annuity cash flows itself, but either way whatever risk you had has been transferred to the reinsurer. So it's important to note that if you can work a deal where you have full coverage, that could well be the answer you're looking for as a pricing actuary. What if you can't get reinsurance and static hedging—in other words, buying options or futures in the market—isn't an option or is impractical because hedges don't even exist. Well, you could run your risks naked—accept the risk and hope for the best. And many insurers do that. Many direct writers do that. There's a lot of profit to be made on these things as long as you don't go into the tails. The profit on, say, a guaranteed living benefit in particular is quite substantial all the way down to maybe the 25th or 20th percentile of a normal stochastic set. It's only when you cross into the tails and start to hit the steep, slippery slope, so to speak, down into losing more and more money that you start to realize the monster you've created if you run naked. You can also opt for a dynamic hedging program. The way that works is you buy options, futures or other financial instruments on your own that you have analyzed and have determined that produce a portfolio that gives you the negative correlation you want in your tail. That often involves the trading of futures because they're relatively inexpensive to trade actively as opposed to options, which may carry a higher premium. The only thing is this strategy can be expensive or fail altogether if the market is, or becomes, after you've sold the product, highly volatile. The second one's probably the one that catches people. They think they have a program going then market volatility changes, and the cost of dynamically hedging just goes way, way up. However, in any static or dynamic format there's one more key thing to consider. Are we hedging the right thing? Let's look at a typical profit pattern for a B-share (back-end loaded) variable annuity over 100 realistic equity scenarios (Chart 3). I created what I considered a typical B-share annuity—surrender charge seven years, about 140 mortality and
Pricing Risk Management 11 expense (M&E), a little bit of a GMDB premium for the option, for the death benefit guarantee—and ran a level scenario, got about a 15 ROI, maybe a little higher with the GMDB attached actually. I think it was maybe 17 with the GMDB on a level scenario. But if I ran it over 100 scenarios, I got a pattern like this. Now, many of you might look at the tail, particularly the left tail, and say, okay, the GMDB's causing you a problem because if it goes into the money, your IRR goes down below zero. Well, here's what you get if you remove the GMDB (Chart 4). You don't actually see a ton of change from removing the GMDB and running the product by itself. Why is that? The reason is that, when we sell a back-end-loaded, or B-share, variable annuity, we effectively make a bet on the market. We say, okay, let's give our agent 6 or 7 or 8 percent, whatever our acquisition costs are for the product, and then we're going to make that back by charging M&Es on the asset base, but that asset base could in an equity market be much higher or much lower than what you priced for, and that's actually what's producing these tails in the IRR. Next I’ll address fixed annuities. True, you can reset the credited rate, but you don't get the wild swings you do with variable annuities. That was our prototype for pricing with a level scenario. A lot of people that price a variable annuity with a level scenario probably need to realize that when you run stochastic you end up with tails even if you don't have a guarantee on the product because of the investment risk. Of course the riders don't help. They make things worse, not better, with one exception. Interestingly, either A-share (front-end loaded) or C-share (no-load) annuities mitigate both bets. This is probably not even intentional, but a C-share annuity is probably one of the best risk management tools that annuity pricing actuaries for variable annuities (VAs) have come up with in a long time. What's happened when you sell a C-share annuity is that actually the agent has granted you an option. They haven't allowed you to purchase a put option, which is what you would normally think of doing to eliminate that tail. They've actually sold you a call. They've said, okay, I'm going to give you back my heaped commission in exchange for a share of your asset fees going forward. So what you've done is you've sold them a covered call where you used to have 140 of M&E, and now you only have 40, and you're giving them the other 100. So that's risk management in its best form. And if any of you have priced C-share annuities over a big set of stochastic scenarios, you'll notice that your range of IRRs is much, much tighter than it is for B-share. A-share would be the same way, but the form of the hedge that you've gotten from the agent is different. And then an L-share is kind of a mix between B and C. The key issue that I want you to grasp is one of holistic pricing. Before we decide on any kind of hedging strategy or at least decide that we understand what we're

Pricing Risk Management 12 doing by running naked, we have to look at the product as a whole, not just one guarantee at a time. You have to look at the variable annuity, GMDB, any living benefits you've sold, mixes between various products and versions. By doing so you'll find that some of your features may be self-hedging, and, in any case, you're going to get a better picture of your overall risk exposure before you make a hedging decision, and that's what you need. In one sense, you've all done holistic pricing at one time or another. You've sold MVA-driven annuities, some of you, on the fixed side, and you know you never price an MVA stand-alone, or at least I've never seen anyone do it. You price the entire annuity including the MVA, and you see how that reduces your risk overall. Similarly, with equity-indexed annuities (EIAs), I've never seen anyone cost out the minimum guarantee on a stand-alone basis. In fact, a lot of people ignore it altogether, which I don't think is quite right. But on the EIAs we typically do that because we're hedging the equity piece one year at a time or many years at a time by buying static call options, but we don't look at hedging the minimum guarantee. I think there could be, and I think with dynamic hedging you could work out a strategy that actually effectively manages both. In summary, again, only by looking at any of these product lines as a whole—EIAs, MVA annuities and variable annuities—do we get the picture of what our overall risk is. There is one more major topic on annuities. Beware the illusory hedge. This is really an interesting one. Looking at our VA with GMDB example again, this is what our IRR distribution looked like when we had the GMDB attached (Chart 5). What happens when we add an enhanced earnings death benefit (EEDB)? In case anyone doesn't know, this is the benefit where you've told the policyholder over the past few years: "we're going to sell you this, and what it does is if you die with gains in the product, we're going to pay you 40 percent or some other amount of those gains to cover your income taxes due on death." Sounds attractive, and in some ways when this hit the market it was seen as a golden bullet because it was like: "Wow! We’re going to have a death benefit, and we're going to actually pay people when the market is up. We're not going to pay them anymore when the market is down. And this is going to work just the opposite of all our other benefits. So this is going to be risk management in a nutshell." Well, does this work out in practice? Let's see. Here's what happens when we add an EEDB (Chart 5 again). In the tails it does almost nothing. In some of the middle scenarios it helps your profitability a little bit, but really you're in substantially exactly the same position you were. How can that possibly be? Well, let's think about the basic structure of most EEDBs, and I've worked out an example. The policyholder pays an additional asset fee, maybe 25 basis points. He gets nothing if the fund is below his premium when he dies because there are no gains. He might get something from the GMDBs that he also has, but he's not going to get anything from this thing he's paid for.

Pricing Risk Management 13 There's also a cap that's typically there, say, one times premium. If the policy gains go any higher than that, he doesn't get anything extra. That is just the way the product has mostly been designed. When we break this down, is this benefit really negatively correlated profit-wise with a GMDB or the base VA? I'm not going to walk through each step of the example, but the bottom line is as follows. If the fund goes up, it's true that you're paying out more and more for a while to the people who die, but if it goes up past a certain point, it hits the cap on benefits. All that happens from that point up is that your extra asset fees, 25 basis points, get more and more valuable. If the benefit never goes up and starts to go down, you're not paying anything when it's at premium. When it's dropped 10 percent, you're still not paying anything. When it's dropped 50 percent, like we've seen in the last three years in the NASDAQ, you're still not paying anything, but your asset fees are getting to be worth less and less and less. So basically the EEDB is negatively correlated with GMDBs and VA profitability only in a very narrow band, the band between premium and cap. Everywhere else it's positively correlated. In your moderate scenarios you've got some negative correlation, which is helping. Also, the benefit's probably not costing quite what we are charging for it, the 25 basis points. But in the tail scenarios where you're spending most of your time with the fund growing either above the cap or not growing at all, it's positively correlated, and we know that positive correlation is the worst thing you can possibly have as far as risk management. Are there any potential solutions to this for EEDB? Well, there could be. You could raise or eliminate the cap and raise your fees to cover the additional cost of that. Then on the high side, the good scenario side, you'd be paying more out and charging more. That would eliminate the right tail. The right tail may not be what you're worried about, though. You could also make the bonus be based on fund value, not gains. In that case, even if the person dies the day after he buys the product, and his fund is still equal to premium, you would pay a bonus on death. So that means that as the fund value goes down and down, not only are your asset fees shrinking, but your bonus on death is shrinking as well. That would help somewhat in your left tail. However, unfortunately, it would also eliminate the income tax play that the marketing is based on. But those are just partial solutions since every time we add a rider to the VA and charge for it as a percent of assets, it just makes our base VA and our GMDB situation worse in the tail scenarios. The bottom line is that probably the best way to attack VAs is somewhere outside the product—dynamic hedging where we buy different assets that are going to perform well in bad scenarios or possibly through other product lines, if you can come up with any other product lines that would work well in poor scenarios. The main message of the subsection, though, is that only by looking at your entire strategy, including new riders that you add over a broad enough range of scenarios, can you adequately test it to see if it works for you. So, the motto there is measure

Pricing Risk Management 14 first, then implement. In other words, don't implement your hedging strategy without having tested it to make sure it works. I have several quick miscellaneous issues in summary. The first miscellaneous issue is appropriateness of different types of scenario sets for hedging analysis. If you're attempting to put a market-based cost on a hedging strategy, you really need to use risk-neutral scenarios to analyze your option costs. Through all of my examples I've used what I would call realistic scenarios, in other words, equity growth of around 9 percent a year, equity volatility of around 17 or 18, something based on historical averages. Risk-neutral scenarios are scenarios that are specifically calibrated to reproduce option costs in the market, and that's what you need to know. That's what you need if you want to reproduce what your hedging costs are going to be. Once a hedging strategy is established, and you want to stress test it, as Todd talked about doing, you want a realistic set because tail results on risk-neutral scenarios don't make any sense. The scenarios aren't developed to produce realistic tail results; they're just developed to produce costs. I think hedging between product lines is a really valid subject to talk about, especially for VAs, to try to develop hedges that really work in the poor tails. A couple of strong possibilities for between product lines are fixed single premium deferred annuities (SPDAs) versus fixed single premium immediate annuities (SPIAs) on the interest-rate side, and VAs versus EIAs on the equity side, and even SPIAs versus life product vis-à-vis, mortality, which Keith might get into. These offer a lot of potential for good discussion, but they'd be a little bit off-topic here because we're really talking about pricing individual products. I have just a final note concerning the annuity product pricing. It often involves discussion of possible hedging strategies and associated costs. When you have this discussion with your corporate management, with your boss, with whomever, you need to cover holistic pricing, overall hedging position desired, and testing your hedge strategy before implementation to ensure that your objective is fulfilled. MR. KEITH A. DALL: While Doug touched on the annuity pricing risk, I am going to be covering some of the life pricing risk. In doing that, since Doug covered so much of the investment and equity risk, I'm going to try to steer away from those pieces, although I do have a couple of slides on the interest rate. I went through a case study, pricing a universal life (UL) secondary guarantee product. While I did use that as the base, I didn't want to go into too much detail on that. Pricing risk management includes several steps, and whether you're looking at enterprise risk management, equity risk management or pricing risk management, they all tend to cover these basic steps. They may use different terminologies, may add a step or delete a step, but for the most part they're going to be covering, first of all, identifying the risks, then measuring and analyzing the risk, trying to mitigate the risk, and, finally, continuing to monitor the risk. I think that, as actuaries, we tend to fall into the middle steps fairly easily. That's typically our
Pricing Risk Management 15 background. The first step of identifying and the last step of monitoring are more communication issues, I feel, especially when you're pricing products at the beginning and making sure that management is aware up front of all the risks that you've identified in this particular product. Whether you've been able to analyze them or not, at least you should be able to let management know the entire list of risks that you feel this product may have. The risks that I'm going to be covering briefly this morning are regulatory, expense, mortality, interest rate, lapse and internal replacement. This is not an exhaustive list. Obviously there are plenty of other risks out there—market risk, asset risk and the like. These are just the ones that I've chosen to briefly cover this morning. Pricing regulatory risk is difficult because it's somewhat of an unknown, so it's difficult to manage from that standpoint. Fortunately, regulation tends to take quite a long time, so we have a lot of lead time to be able to look at our product portfolio or individual products and analyze what impact each of these regulatory changes is going to have on our particular product. The XXX model regulation is a good example of this. I believe it was first introduced or discussed back in 1991. In 1995 they came out with a preliminary model regulation, and it wasn't until the year 2000 when they actually made the XXX effective. So, there was plenty of lead time to let management know what kind of impact you're going to see on your particular products that you have in the current portfolio and some of the design changes that you may need to go through to mitigate some of those risks down the road. Now with regulatory risk there's actually a timing risk that you need to be concerned about also. In 1991, when you first heard about the XXX model regulation, the last thing you wanted to do was to jump immediately into increasing your premiums for fear that the reserves were going to go up as soon as XXX became effective. You probably would have been long out of business before it actually became effective in the year 2000. So you do have to be careful of a timing risk, too, as far as jumping on the bandwagon. And the timing risk is when you jump to AXXX model regulation. There were plenty of people who came out with a shadow-fund-type design for the UL secondary guarantees after the XXX model regulation came into being. Now, I do want to make sure I say that there were several companies that had the design prior to XXX model regulation also, but the shadow-fund design allowed companies to have lower reserves after XXX. If they started with a stipulated premium design, then XXX came out, they may have moved to a shadow-fund account to sort of mitigate the risk of having the higher reserves. Now that AXXX model regulation has come out, you have to be concerned with the administrative problems that are encountered with a shadow-fund account, and you have to consider whether it is still worthwhile to have that shadow-fund account design or whether you should now take a step back and go to the stipulated premium design again. Part of regulatory risk is evaluating your products, and it's an ongoing process.

Pricing Risk Management 16 Again, with the UL secondary guarantees there are discussions of the standard nonforfeiture law changing. We have the 2001 CSO table that is coming up. Again, we have plenty of time. It's not going to become effective for a while. But, again, you need to be discussing with your management what kind of impact this is going to have on your particular products. And what's next? You need to always be monitoring the changes that are going on in the regulatory environment. How do you monitor those regulatory risks? You're doing it right now actually. So you have a purpose of coming to this Washington, D.C., meeting. It's not just a vacation out here. You're actually monitoring the regulatory risk by going to some of these meetings, discussing things with your peers, discussing things with regulators, and that's part of the process of making sure you're aware of all the new regulations that could be coming forth. There are NAIC meetings out there to be monitoring, as well as trade publications. When the National Underwriter finally comes past your desk it may be six months old, but there still may be some articles in there of value to make sure that you're monitoring the regulatory changes. And, of course, there is networking. To mitigate the regulatory risk, the first thing people tend to look at is product design changes or reinsurance. The reinsurers typically do a pretty good job of trying to make sure that they are out there in the forefront mitigating some of these risks that are encountered with regulatory changes. There are a variety of topics within the expense risk that can be discussed, and the first one is micro versus macro pricing. If I could just see a show of hands: how many out there—I assume that the room is full of product actuaries, I think that's a pretty good assumption—actually do macro pricing? Okay, there aren’t too many. As far as expenses go, another area is that of marginally versus fully allocated expenses. In managing that particular risk, if you're going the marginal route, you need to make sure again that management is aware that when you're saying that your products are priced at 12 percent or 15 percent, whatever the goals are of the company, that if you set marginal expenses, they need to be aware of the overrun that you have in expenses currently. So how many people do fully allocated expenses in their pricing? It's quite a few—the majority, I guess, that are in here. In addition to marginal and fully allocated expenses, there are unit expenses that create their own risk. As far as breaking down your total expenses into percentage of premium per thousand or per policy, there are risks involved in putting everything into one of those units. You have to be really careful when you're breaking down your overall risks as to what type of category you're going to put those factors in. There's inflation expense risk. I was surprised in Todd's slide that it didn't look like too many people were using that inflation in their particular pricing, but certainly that's another risk related to expenses. In mitigating the expense risk, companies have looked at third-party administrators or joint ventures. It seems like maybe five to 10 years ago that was a hotter topic than it is today, but certainly companies

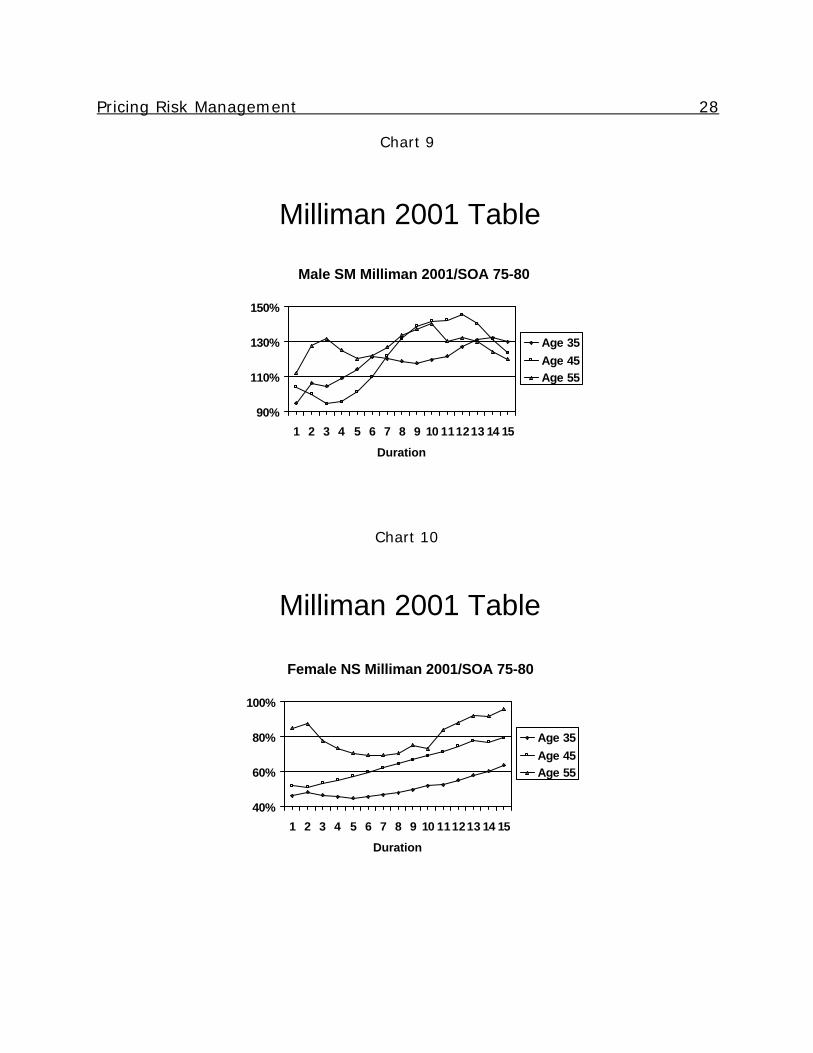
Pricing Risk Management 17 are still looking at reducing their expenses through those means. In monitoring the risk, especially if you're marginally pricing your products, you need to continue to monitor the total expense relative to how much you're actually including in pricing, and this is a part of the product actuary's job. Certainly larger companies might have it in the corporate area, but you need to make sure that you're letting management know how much the overrun is on a continuous basis. Chart 6 is just a simple example that I ran using a UL secondary guarantee product, and I just tried to change the maintenance-per-policy cost. You can see it didn't have too much of an impact if I increased or decreased the maintenance-per-policy expense. I did have a fairly large premium that was going into the product, but it did make some difference whether or not you were 20 to 40 percent higher or lower than what you had expected. Chart 7 shows the risk that's involved in placing your expenses on a per-policy basis. I changed the expense allocation a little bit. I put the majority of it in a per-policy basis. I had run the baseline at a $150,000 average size, and I simply changed the average size—this is the only change I made—to $100,000 and $200,000 just to see the impact. Again, this is just a way to communicate to management to show the risks that are involved in setting your average face amount in pricing the product. Next I will discuss mortality risk. Again, there are a lot of different areas that you need to look at when you're talking about mortality risk. The first one is the base table, and I would guess that the majority of people have been using the '75-80 SOA table for quite some time, and some of them are moving to a '90-95 SOA table. And, again, there are going to be some slides coming up that show the impact of using the '75-80 basic table versus the '90-95 basic table. It certainly is key because the slope has changed over the years in the mortality rates that are involved. Not only have the slopes changed, but the length of the select period has also changed quite a bit in those particular tables. Adding another underwriting class is always another risk that you need to be concerned about. How is it going to impact the classes that you already have in place? And mortality improvement is another factor. The SOA just came out with a study that they had done, I believe, with a number of different companies on mortality improvement. It has a great discussion on generational improvement versus durational improvement, compound improvement versus simple, and it talks about the different companies that use those particular methodologies. Chart 8 shows the relationship of the Milliman 2001 table to the SOA '75-80 table. This is for male non-smokers. The foundation of the Milliman 2001 is the SOA '90-95 table. So you can think in those terms. But you can see that the slope has changed from the '90-95 table to the '75-80 table. So, if you're still using the '75-80 table as your foundation, and you're using
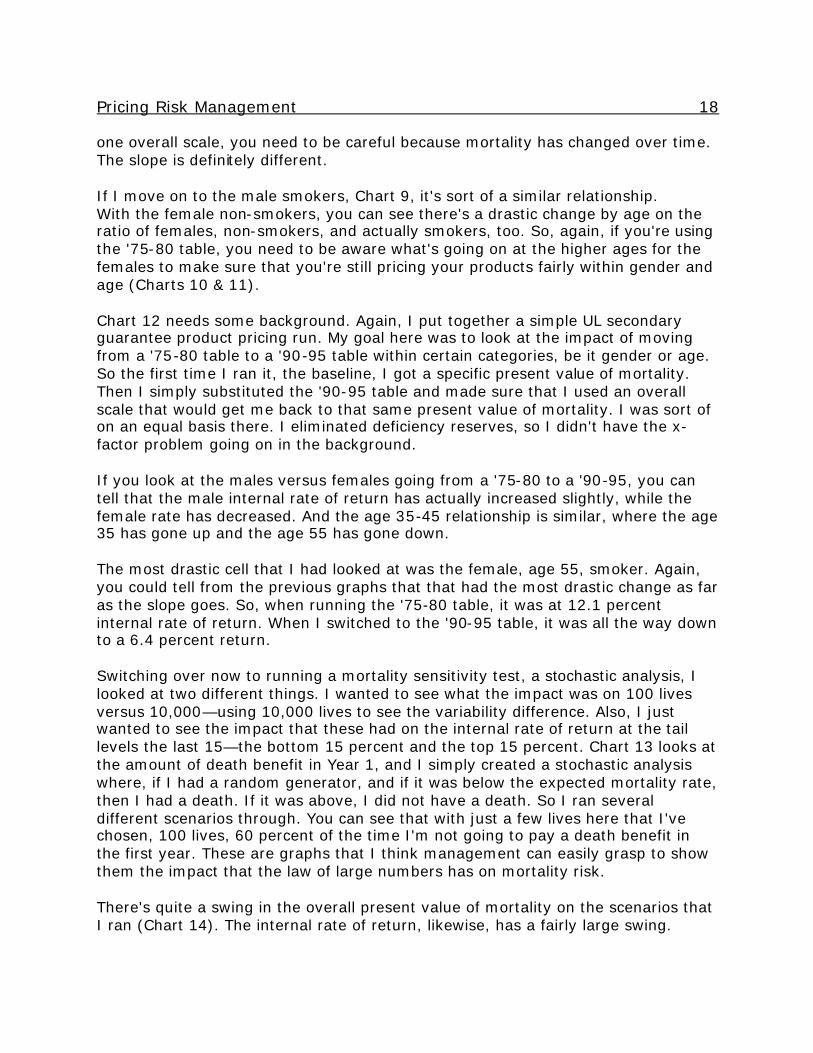
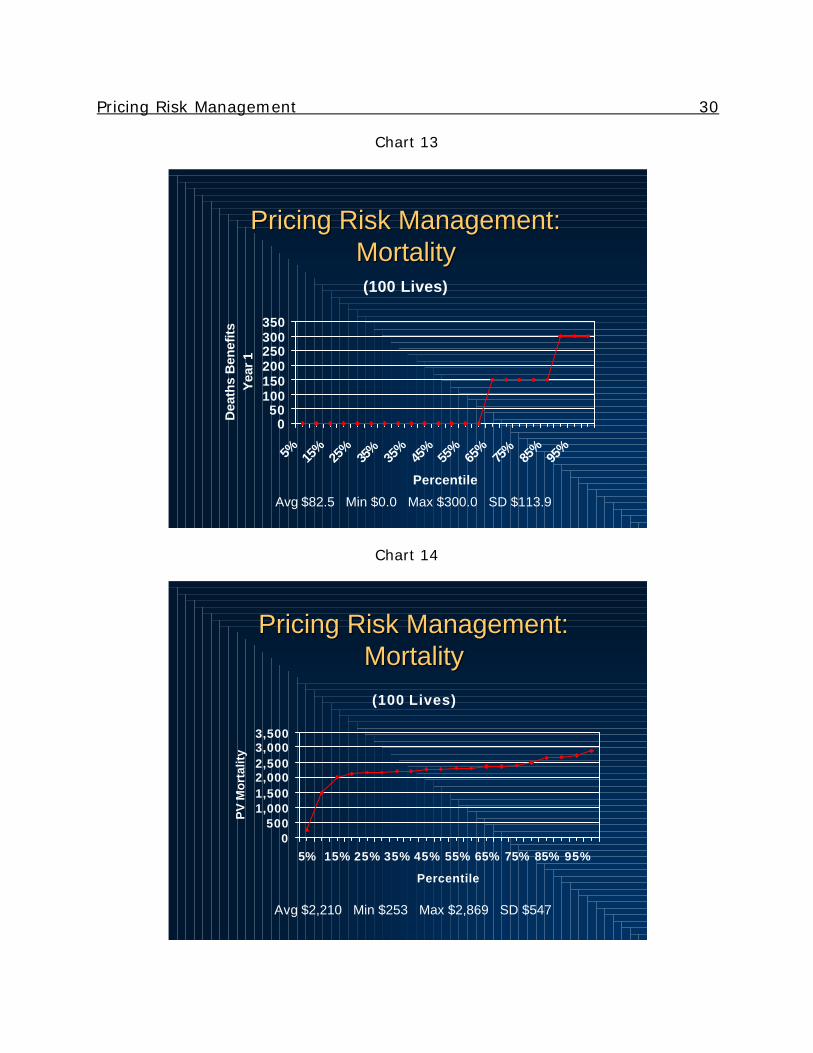
Pricing Risk Management 18 one overall scale, you need to be careful because mortality has changed over time. The slope is definitely different. If I move on to the male smokers, Chart 9, it's sort of a similar relationship. With the female non-smokers, you can see there's a drastic change by age on the ratio of females, non-smokers, and actually smokers, too. So, again, if you're using the '75-80 table, you need to be aware what's going on at the higher ages for the females to make sure that you're still pricing your products fairly within gender and age (Charts 10 & 11). Chart 12 needs some background. Again, I put together a simple UL secondary guarantee product pricing run. My goal here was to look at the impact of moving from a '75-80 table to a '90-95 table within certain categories, be it gender or age. So the first time I ran it, the baseline, I got a specific present value of mortality. Then I simply substituted the '90-95 table and made sure that I used an overall scale that would get me back to that same present value of mortality. I was sort of on an equal basis there. I eliminated deficiency reserves, so I didn't have the x-factor problem going on in the background. If you look at the males versus females going from a '75-80 to a '90-95, you can tell that the male internal rate of return has actually increased slightly, while the female rate has decreased. And the age 35-45 relationship is similar, where the age 35 has gone up and the age 55 has gone down. The most drastic cell that I had looked at was the female, age 55, smoker. Again, you could tell from the previous graphs that that had the most drastic change as far as the slope goes. So, when running the '75-80 table, it was at 12.1 percent internal rate of return. When I switched to the '90-95 table, it was all the way down to a 6.4 percent return. Switching over now to running a mortality sensitivity test, a stochastic analysis, I looked at two different things. I wanted to see what the impact was on 100 lives versus 10,000—using 10,000 lives to see the variability difference. Also, I just wanted to see the impact that these had on the internal rate of return at the tail levels the last 15—the bottom 15 percent and the top 15 percent. Chart 13 looks at the amount of death benefit in Year 1, and I simply created a stochastic analysis where, if I had a random generator, and if it was below the expected mortality rate, then I had a death. If it was above, I did not have a death. So I ran several different scenarios through. You can see that with just a few lives here that I've chosen, 100 lives, 60 percent of the time I'm not going to pay a death benefit in the first year. These are graphs that I think management can easily grasp to show them the impact that the law of large numbers has on mortality risk. There's quite a swing in the overall present value of mortality on the scenarios that I ran (Chart 14). The internal rate of return, likewise, has a fairly large swing.
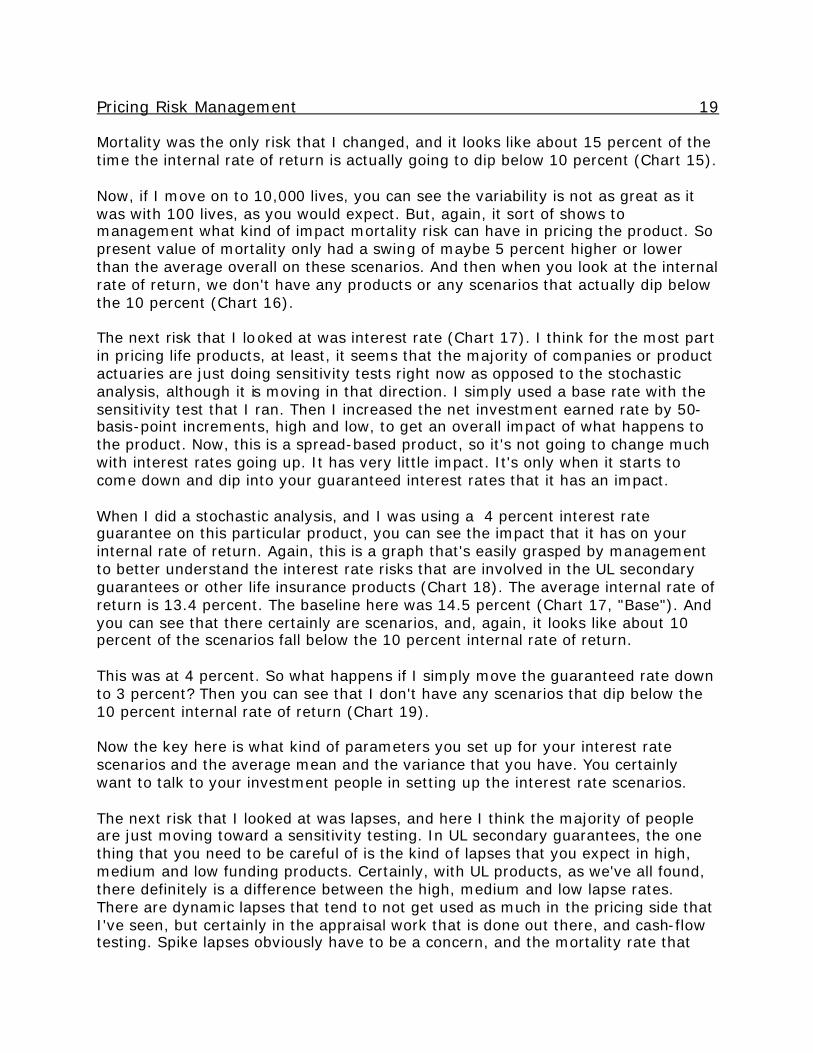
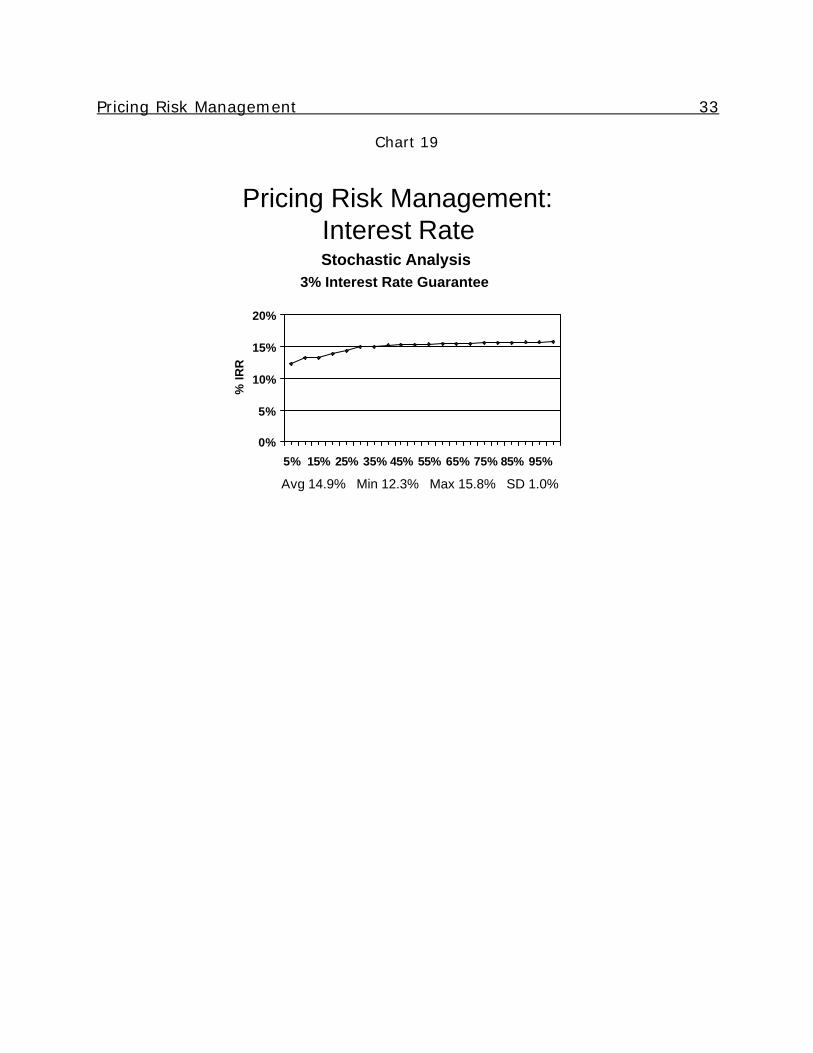
Pricing Risk Management 19 Mortality was the only risk that I changed, and it looks like about 15 percent of the time the internal rate of return is actually going to dip below 10 percent (Chart 15). Now, if I move on to 10,000 lives, you can see the variability is not as great as it was with 100 lives, as you would expect. But, again, it sort of shows to management what kind of impact mortality risk can have in pricing the product. So present value of mortality only had a swing of maybe 5 percent higher or lower than the average overall on these scenarios. And then when you look at the internal rate of return, we don't have any products or any scenarios that actually dip below the 10 percent (Chart 16). The next risk that I looked at was interest rate (Chart 17). I think for the most part in pricing life products, at least, it seems that the majority of companies or product actuaries are just doing sensitivity tests right now as opposed to the stochastic analysis, although it is moving in that direction. I simply used a base rate with the sensitivity test that I ran. Then I increased the net investment earned rate by 50-basis-point increments, high and low, to get an overall impact of what happens to the product. Now, this is a spread-based product, so it's not going to change much with interest rates going up. It has very little impact. It's only when it starts to come down and dip into your guaranteed interest rates that it has an impact. When I did a stochastic analysis, and I was using a 4 percent interest rate guarantee on this particular product, you can see the impact that it has on your internal rate of return. Again, this is a graph that's easily grasped by management to better understand the interest rate risks that are involved in the UL secondary guarantees or other life insurance products (Chart 18). The average internal rate of return is 13.4 percent. The baseline here was 14.5 percent (Chart 17, "Base"). And you can see that there certainly are scenarios, and, again, it looks like about 10 percent of the scenarios fall below the 10 percent internal rate of return. This was at 4 percent. So what happens if I simply move the guaranteed rate down to 3 percent? Then you can see that I don't have any scenarios that dip below the 10 percent internal rate of return (Chart 19). Now the key here is what kind of parameters you set up for your interest rate scenarios and the average mean and the variance that you have. You certainly want to talk to your investment people in setting up the interest rate scenarios. The next risk that I looked at was lapses, and here I think the majority of people are just moving toward a sensitivity testing. In UL secondary guarantees, the one thing that you need to be careful of is the kind of lapses that you expect in high, medium and low funding products. Certainly, with UL products, as we've all found, there definitely is a difference between the high, medium and low lapse rates. There are dynamic lapses that tend to not get used as much in the pricing side that I've seen, but certainly in the appraisal work that is done out there, and cash-flow testing. Spike lapses obviously have to be a concern, and the mortality rate that
Pricing Risk Management 20 you can expect after that particular spike lapse. To mitigate some of the lapse risks, you need to look at a new money rate versus portfolio rate. Commission charge-backs can certainly help, if you can get away with it, and higher renewal commissions. Internal replacements tend to be an issue that you don't think about until after the product has already been priced, unfortunately. But you need to always have this in the back of your mind, as to how the rates compare to your company’s similar products, because you may simply be replacing a product that you have in your portfolio as opposed to increasing new sales. You have to think of not only how the rates compare, but then you have to be concerned with the commissions and how the producers are going to look at your new product as it relates to the old product that they've been selling. They're going to be keying on commissions. Also comparing to other products within the company, you need to be careful of mortality arbitrage. I got that concept from an article by Douglas Doll in Product Development News that discussed the mortality arbitrage within a company and the SPIAs versus the low-term product and a preferred underwriting class. So you might want to look that up in the SOA's Product Development Section Product Development News. Again, you're going to be competing with your own products on a commission basis. So you need to have strict guidelines that come out before the product is actually put out in the marketplace, and you need to continue to monitor to make sure that there's not simply a shift again from one product to the other. Finally, I’d like to talk about a sign-off sheet, and I don't know if many companies are doing this. We've seen it in a couple of companies, and I think it's a great idea as far as making sure that overall the company is managing risks. The sheet has the pricing actuary sign that the product was priced to meet profit targets, that it had proper assumptions and that it met the illustration testing. It also makes the marketing director sign off on the sales projections and meet product strategies. This is one way to prevent a lot of crazy ideas from coming forth and spinning your wheels with new products. They actually have to sign off on what they think the sales projections would be and that they do meet the product strategies overall within the company. Then the appointed actuary signs off on the reserve methodology that you have been using within your pricing routine, not only statutory but GAAP. Again, it's just a way to make sure that everybody is responsible in setting their assumptions and thinking through all the risks within a product. How many people have a similar checklist or sign-off sheet within their company? I see maybe five to 10 hands of people that already have something like this in place to limit the risks. MR. WILLIAM C. CUTLIP: My practice focuses on working with litigators as an expert witness in calculations, and I work with both plaintiffs and defendants. One thing I would tag onto what Keith said in terms of identifying risk is to say to

Pricing Risk Management 21 actuaries: think about the business risks associated with what you're doing as well as the technical risks. There are three that come to mind. First of all is the sales risk, which goes back to the sign-off piece. Are the sales pieces or the training of the agents or brokers going to be in line with what you have designed as a product, what you have priced as a product, and what you think the changes can be in the future? Because if they're out selling something different than you really have as a product, then you can run into trouble later on. The second piece is identifying the legal risk, and, again, go back and look at the contract that's written. Is it written in such a way that changes can happen in a way that you, as an actuary, have expected and have priced that they can happen? I firmly believe there is only one universal life contract that's ever written, and everybody else copied it. For a lot of companies it worked, and for a lot of companies it didn't work. So go back and look at your contract and make sure it fits what you're doing. And the third piece is the customer knowledge. Think about your customers and consider what effect and impact this product will have, and how this product is going to help them, how changes might be detrimental to them, and how much they can understand. How complicated is your product? How sophisticated is your product? How much can your customer really and truly understand? And if you take these three identifying risks into account—the sales, the legal, and the customer knowledge—then you’ll end up with fewer lapses. You're going to have better retention because your customers are going to be happy. And you're going to cut down on your legal expenses. MR. ABRAHAM GOOTZEIT: I just wanted to continue what Bill was saying, that is, for actuaries to take a more active role. Keith, when you were mentioning the regulatory risk, I think I have one thing to mention, especially for all of us as actuaries. When regulations are proposed and go through a long discussion period, there still is a lot of opportunity for actuaries to have an impact. I just want to encourage people here to identify the discussion points and how they impact the industry, and companies can take an active role in those discussions because we really do have an opportunity to have a role in shaping what comes next. MR. DAVID Y. ROGERS: I actually have a question, although it may sound like a statement as well. It seems to me that where risk has really affected the industry is where insurance companies, or any company for that matter, have assumed risk without knowledge—really knowledge at the managerial level. The people who lead these companies are expected to know what kind of risks they're assuming and why, in collecting the fair price for those risks and managing them. I want to say the panel did an excellent job in identifying how to price for risk that you know you're assuming, but the question I have is how do you make sure that management is aware of all of the risks that you're assuming so that they can be prepared for developing risk scenarios? I mean, there was a little bit about communication, but the question I have is really what kind of controls are on the risk process in your experience that would help the company avoid assuming unintentional risks?

Pricing Risk Management 22 MR. DALL: I'll start and let Doug finish. First of all, just to have a sign-off sheet is, I think, is a good step. I think it's really important when you're initially putting together the product report for senior management, and I assume that's what everybody does, to start including a section on risk management. I mean, bring it up before the product actually goes out there to the salespeople. We went over a lot of different risks, and it seems to me that the major risks that get a lot of attention are the asset risks and the liquidity risks, because those can bring companies down immediately. The risks that don't get as much attention, but ones that I think are as important for the long-term viability of the company, are all these risks that were discussed today: the expense risk, lapse risk and mortality risk, because those bring down companies slowly, but they do bring down companies. You have to price them into your products initially, and you need to make sure that management is aware of it up front. MR. ROBBINS: My answer is similar. I'll look at it again from the annuity/investment risk standpoint. I think the clients that I work with that are best at this have a program in place, either a product development committee or some other name for it. A program exists where the actuaries get with management and present charts, like both the ones that I did and Keith as well, that illustrate what we think is the most likely outcome of either mortality, investment risk or whatever risk we're talking about, but here are where the tails are, and to keep management apprised. And, as we've done for the last couple or three years on the investment side and actually moved into the tails, that gives you some credibility to fall back on, like, okay, this isn't something we didn't think could happen, that now this benefit costs more than we're charging for it. It's something that was always possible. Either you developed a hedging strategy or you didn't, which is another management/actuarial call, but, either way, you can say, well, we understood this and planned for it this way or that way or chose not to for whatever reason. MS. RUI GUO: I have question for Doug. Could you elaborate on the risk-neutral scenarios versus those that are more realistic? MR. ROBBINS: I'll elaborate a little bit on that. By the way, my illustrations of different IRRs in the charts that you saw were 100 percent equity-oriented scenarios. I realize variable products are often—you know, the policyholder invests in bonds, cash, and other asset classes as well—but I did equity-oriented, roughly 9 percent return, 17 or 18 percent standard deviation of annual returns, so about what you've seen historically. That produces tails that have a historical meaning. I mean, in a set of 100 you might not see this. I did that many just to get the presentation done. If you did 1,000, you would certainly see great depression scenarios. You'd see what we've just been through in the last three years, and you would see the ’90s as well. You would see huge run-ups in certain scenarios. In a set of risk-neutral scenarios, the interest rates are laid out so that the average interest rate of all the scenarios over time is according to the forward yield curve starting today. They're arbitrage-free. And the equity portfolio return rates are such that you would reproduce today's option costs. What that means is that going

Pricing Risk Management 23 forward, the average after one year, after two years, after five years is based on the risk-free yield curve as well, which is much lower than the yields you would expect if you're actually getting a risk premium for investing in equities. But you remember Black-Scholes? The whole thing, for reasons that most actuaries still don't understand, is based on totally risk-free interest rates as far as your projected return. It's just the way it works out mathematically when you're actually pricing true option costs. And the volatility, just because of today's implied rates, is also usually much higher than 17 or 18. Now what you get when you project 100 or 1,000 of those scenarios, or 10,000, is a bunch of scenarios that do not look and feel realistic. You will look at your five-year accumulated return, and you'll see that half of the scenarios are underwater, and you're like no way, that's impossible, but it's not meant to be realistic. You can't look at it as though it were realistic. All it's doing is reproducing option costs. The other thing to be aware of is that they're supposed to be reproducing market-based option costs, but for many guarantees that we're providing as insurers nowadays that are seven or 10 years long, there is no market. So what is a market-based cost? We just kind of assumed that we're going to use the 10-year forward risk-free rates and accumulate 25 percent volatility a year, but if there were a market, and the market brought in mean reversion or something like that, which is quite plausible, then the returns after 10 years would look a lot different than they do, and options would be cheaper. So that's a tough one as far as what real risk neutrality, if you look way out, should be. MR. HENDERSON: I just want to make one comment that kind of relates to several of the questions we've had. Just because you build a stochastic set of scenarios doesn't mean that there's not a bet in the design of that set of scenarios. So, you'll definitely want to understand what bets you've made. Just because you have a thousand of them doesn't mean that you haven't tainted that in some fashion. Especially with a lot of discretion with what sort of scenarios you use.
Pricing Risk Management 24
Chart 1
6
Importance of Negative Correlation: Example #1
n Say you buy a 50/50 mix of two mutual funds, with expected returns of 6% and 10%. Your expected total return is then 8%, assuming a time horizon of a year. Say the annual volatility of the first fund is 10%, and that of the second is 20%.
n If they are 100% positively correlated, the volatility of a 50/50 mix will be 0.5 * 10% + 0.5 * 20% = 15%.
n If they are independent, the volatility of a 50/50 mix will be ((0.5 * 10%)^2 + (0.5 * 20%)^2)^0.5 = 11.2%, a pretty nice savings in volatility.
n If they are 100% negatively correlated, the volatility of a 50/50 mix will be only 5%!
Chart 2
7
8% expected return with 5% volatility? Not bad!
n Perhaps hard to believe? But the mathematical derivation is straightforward enough:
n When r = 1 or -1, the formula collapses familiarly into a squared sum or difference, respectively. (The square root leaves you just the sum or difference.)
n When r = 0, the middle term just disappears, leaving the sum of squares implied on the previous slide.
^0.5y)^2)(Wy y x2rWxWy x)^2((Wx xy σσσσσ ++=
(Where W represents a weight, and Wx = 1 - Wy)

Pricing Risk Management 25
Chart 3
20
Here is the profit pattern for a typical B-Share VA over 100 “realistic” equity scenarios.
n This VA has an annual ratchet GMDB included.
IRR by Scenario
-5.000.00
5.00
10.00
15.00
20.00
25.0030.00
35.0040.00
1
10 19 28 37 46 55 64 73 82 91 10
0
Scenarios
IRR VA w/ GMDB
Chart 4
21
Here is what you get if you remove the GMDB.
n Clearly, the lion’s share of the tail risk comes from something other than the GMDB.
IRR by Scenario
-5.00
0.005.00
10.00
15.00
20.0025.00
30.0035.00
40.00
1
10 19 28 37 46 55 64 73 82 91 100
Scenarios
IRR VA w/ GMDB
VA Alone

Pricing Risk Management 26
Chart 5
29
Here’s what happens when we add an EEDB.
n Pretty close to nothing, at least in the tails!
IRR by Scenario
-5.00
0.00
5.00
10.00
15.00
20.00
25.00
30.0035.00
40.00
1
10 19 28
37
46
55
64
73
82 91 10
0
Scenarios
IRR VA w/ GMDB
Adding EEDB
Chart 6
Pricing Risk Management:Pricing Risk Management:Expense Sensitivity TestingExpense Sensitivity Testing
14.0% 14.3% 14.5% 14.8% 15.0%
0%2%4%6%8%
10%12%14%16%18%20%
60% 80% Baseline 120% 140%

Pricing Risk Management 27
Chart 7
Pricing Risk Management:Expense
1 2 . 8 % 1 4 . 5 % 1 5 . 5 %
0 %
5 %
1 0 %
1 5 %
2 0 %
$ 1 0 0 K $ 1 5 0 K $ 2 0 0 K
A v e r a g e F a c e A m o u n t
Per Policy
Unit Expenses Introduce Additional Risk?
Chart 8
Milliman 2001 Table
Male NS Milliman 2001/SOA 75-80
40%
60%
80%
1 2 3 4 5 6 7 8 9 10 11 12 13 14 15
Duration
Age 35Age 45Age 55
Pricing Risk Management 28
Chart 9
Milliman 2001 Table
Male SM Milliman 2001/SOA 75-80
90%
110%
130%
150%
1 2 3 4 5 6 7 8 9 10 111213 14 15
Duration
Age 35Age 45Age 55
Chart 10
Milliman 2001 Table
Female NS Milliman 2001/SOA 75-80
40%
60%
80%
100%
1 2 3 4 5 6 7 8 9 10 111213 14 15
Duration
Age 35Age 45Age 55

Pricing Risk Management 29
Chart 11
Milliman 2001 Table
Female SM Milliman 2001/SOA 75-80
50%70%90%
110%130%150%170%190%210%230%
1 2 3 4 5 6 7 8 9 10 11 12 13 14 15
Duration
Age 35Age 45Age 55
Chart 12
Pricing Risk Management:Mortality
15.1%
14.5%
14.3%
15.0%
75-80 SOA
Age 55
Age 35
Female
Male
14.2%
14.9%
12.9%
15.3%
90-95 SOA
IRR Comparison
Pricing Risk Management 30
Chart 13
Pricing Risk Management:Pricing Risk Management:MortalityMortality(100 Lives)
050
100150200250300350
5% 15%
25%
35%
35%
45%
55%
65%
75%
85%
95%
Percentile
Dea
ths
Ben
efits
Y
ear
1
Avg $82.5 Min $0.0 Max $300.0 SD $113.9
Chart 14
Pricing Risk Management:Pricing Risk Management:MortalityMortality(100 Lives)
0500
1,0001,5002,0002,5003,0003,500
5% 15% 25% 35% 45% 55% 65% 75% 85% 95%
Percentile
PV
Mo
rtal
ity
Avg $2,210 Min $253 Max $2,869 SD $547

Pricing Risk Management 31
Chart 15
Pricing Risk Management:Mortality
Monte Carlo Analysis (100 Lives)
0%
5%
10%
15%
20%
5% 15% 25% 35% 45% 55%
65%
75%
85% 95%
Percentile
%IR
R
Avg 12.1% Min 7.1% Max 18.0% SD 2.6%
Chart 16
Pricing Risk Management:Mortality(10,000 Lives)
210,000215,000220,000225,000230,000235,000240,000
5% 20% 35% 50% 65% 80% 95%
Percentile
PV
Mo
rtal
ity
Avg $230,080 Min $221,720 Max $235,393 SD $3,477

Pricing Risk Management 32
Chart 17
Pricing Risk Management:Interest Rate
12.3%13.9% 14.5% 14.5% 14.5% 14.5% 14.5%
0%
5%
10%
15%
20%
-1.5% -1.0% -0.5% Base 0.5% 1.0% 1.5%
Sensitivity Tests
Change in NIER
Chart 18
Pricing Risk Management:Interest Rate
4% Interest Rate Guarantee
0%
5%
10%
15%
20%
5% 15% 25% 35% 45% 55% 65% 75% 85% 95%
% IR
R
Avg 13.4% Min 7.8% Max 15.5% SD 2.4%
Stochastic Analysis
Pricing Risk Management 33
Chart 19
Pricing Risk Management:Interest Rate
3% Interest Rate Guarantee
0%
5%
10%
15%
20%
5% 15% 25% 35% 45% 55% 65% 75% 85% 95%
% IR
R
Avg 14.9% Min 12.3% Max 15.8% SD 1.0%
Stochastic Analysis