recovery and power boiler optimization - tappi.org · dcs not available and extracting the...
TRANSCRIPT

1
Recovery and Power Boiler Recovery and Power Boiler Optimization Optimization
byVic Uloth, Ibrahim Karidio, and Ron van Heek
Paprican, Prince George, BCand
WenLI DuoPaprican, Vancouver, BC
for2006 Forum on Energy:
Immediate solutions, Emerging Technologies May 15, 2006.Appleton, WI

2
Value Delivery Value Delivery • In the last 7 years, we have tested 42 of the 55
operating recovery boilers in Canada, 8 more RBs in the U.S. and 21 power boilers at Cdn mills
• Operations in 31+ of the Cdn. recovery boilers, 16 of the power boilers and 6 of the U. S. recovery boilers have been optimized
• Recovery boiler throughput was increased by 3 –20%, while reducing the water wash frequency
• Hog steam generation in the optimized power boilers was increased by 6.7 – 31%, producing savings of $1.1 – 7.6 million U. S./yr in purchased fossil fuel for each boiler

3
Boiler Optimization TechnologyBoiler Optimization Technology
• Developed over a 9 year period, patented and used commercially for the last 7 years
• Deep fundamental understanding came from work on recovery boiler CFD model development and validation
• Unique tools and guidelines employed• Measurements (not subjective
assessments) guide optimization

4
Recovery Boiler Combustion Recovery Boiler Combustion Air DistributionAir Distribution
• Air is injected at multiple vertical levels and from all 4 boiler walls at one or more air level
• The interactions of these air jets create a high velocity chimney which promotes carryover
• The location and strength of the chimney (peak velocities) is determined by the air flow and the distribution between boiler walls

5
Recovery Boiler Combustion Recovery Boiler Combustion Air DistributionAir Distribution
• Unbalanced air distribution between the walls at a given level pushes the chimney closer to the boiler walls and associated liquor guns, increasing carryover and PM emissions
• Interlacing the secondary and tertiary air can reduce the size of the chimney and peak gas velocities and enhance mixing
• Optimization of the vertical air splits increases bed temperatures and reduction efficiency while decreasing TRS emissions

6
Poor Recovery Boiler Poor Recovery Boiler Air DistributionAir Distribution
• High carryover• Rapid boiler plugging• Low reduction efficiencies• Smelt spout plugging problems• High TRS and particulate emissions• Reduced boiler throughput
• Setting up your recovery boiler air system without the proper tools is akin to timing your car’s engine by ear.

7
Key Measurements• Combustion air flow and distribution
• Cold flow gas velocity profiles (now optional)
• Gas velocities with fossil fuel and black liquor firing (not often required any more)
• Char bed and furnace temperature profiles
• Carryover measurements at the bullnoze level

8
Mill C Cold Flow Velocity Profile Mill C Cold Flow Velocity Profile Before OptimizationBefore Optimization

9
Mill C Cold Flow Velocity ProfileMill C Cold Flow Velocity ProfileAfter OptimizationAfter Optimization

10
Recovery Boiler OptimizationRecovery Boiler Optimization
• Both the air system and the liquor firing system have to be optimized
• Balance and optimize air first• Optimize liquor firing parameters (gun
pressures & firing temperatures) according to proprietary guidelines
• Then adjust gun angles and air splits to maximize lower furnace temperatures & minimize carryover
11
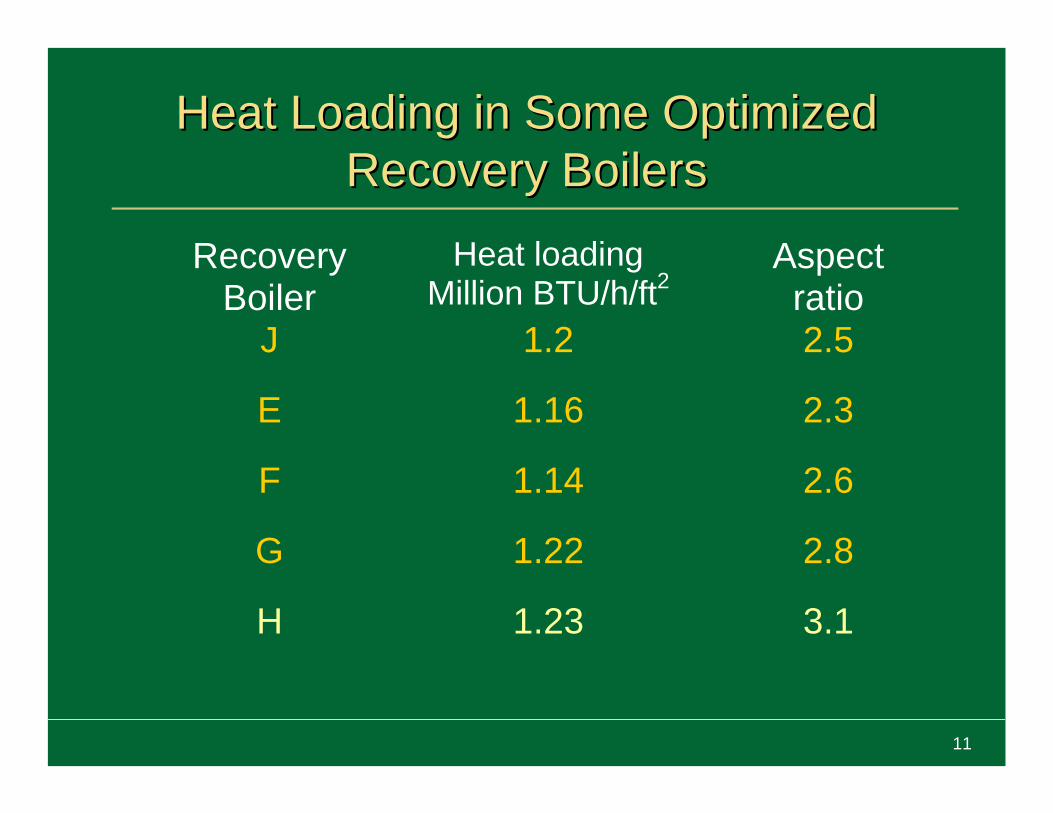
Heat Loading in Some Optimized Heat Loading in Some Optimized Recovery BoilersRecovery Boilers
Recovery Boiler
Heat loading Million BTU/h/ft2
Aspect ratio
J 1.2 2.5
E 1.16 2.3
F 1.14 2.6
G 1.22 2.8
H 1.23 3.1

12
Benefits of Recovery Boiler Benefits of Recovery Boiler Optimization TechnologyOptimization Technology
• 3 - 20% increases in recovery boiler throughput ($5.1 to $34 million US per year in incremental pulp production in a 1000 tpd kraft mill)
• Reduction of water washes to 1 or 2/year ($500,000 - $2.5 million US per year)
• Dramatic reductions in TRS emissions; 30-50% typical when they are initially high

13
Power Boiler Power Boiler OptimizationOptimization
• Modified the tools to extend application to hog fuel power boilers. Power boiler optimization can: – Minimize fossil fuel consumption
• Great savings due to the increasingly high energy prices• Additional benefits from biomass CO2 credits (under Kyoto)
– Reduce PM, NOx, SO2, dioxins and other emissions
• Dioxin emission research on 10 coastal hog fuel boilers
• Optimization tests on 11 interior hog fuel boilers

14
Power Boiler Evaluation TestsPower Boiler Evaluation Tests• Baseline hog combustion efficiency
– Assess and balance the air delivery systems– Assess the hog delivery and feeding systems– Check the boiler control logic and instrumentation– Observe fuel-air mixing behavior and measure
combustion temperatures– Sample and analyze fuel, flue gas and ash– Monitor boiler emissions
• Short term trials at higher than normal firing rates to identify the boiler limitations
• Measurements, modeling, and troubleshooting experience combined to give the lowest cost solution

15
Typical Problems IdentifiedTypical Problems Identified• Non optimal air splits
– Poorly designed OFA systems (layout /location)– Unnecessary gas firing or too much burner air– Inoperable dampers– Inadequate fan capacity– Non-uniform / mis-matched UGA and fuel distribution– Errors in control logic and inappropriate combustion control strategies
• Inadequate hog delivery– Variable fuel quality – Loading interruptions and surge bin/auger problems– Poorly designed or operated hog feeders– Distribution air pressure too low or too high
• Poor calibration of gas analyzers• Special restrictions
– Boiler either too short or too narrow– Boiler exit temperature requirements when burning sludges in some
jurisdictions

16
Examples of Trial ResultsExamples of Trial Results• Hog steam increased from 200 to 350 klb/h by
– solving air flow control and damper movement problems • Hog steam increased from 99 to 110 t/h by
– increasing the undergrate air flow– re-balancing and enhancing the HMZ over fire air system, and – installing a new NCG/methanol burner closer to the grate.
• Hog steam increased from 202 to 234 klb/h by– increasing the overfire air flow from 110 to 140 klb/h (OFA/UGA
ratio from 0.7 to 0.95), and– balancing the rear and front OFA (Rear/Front OFA to 1.15 from
1.6)• Hog steam increased from 25 to 32.5 t/h by
– shifting from auto to manual control– reducing gas firing to the minimum (4%), and– increasing the FD Fan outlet air pressure from 1.4 to 1.7 kPa

17
Estimated Savings in Short Term TrialsEstimated Savings in Short Term TrialsMill ID Boiler ID
Date Hog Steam Increase, t/h
Hog Steam Increase, %
CO2 Savings, t/yr
Fuel Cost Savings,
M$/yrBoiler A1 2003 22.7 25.0 37,316 3.09
Boiler A2 2003 37.2 36.1 61,199 5.06
Boiler B1 2004 9.7 35.8 15,960 1.32
Boiler B2 2004 11.5 55.0 18,921 1.57
Mill C Boiler C 2005 11 11.1 18,099 2.16
Mill D Boiler D 2004 21.5 20.5 35,375 2.93
Mill E Boiler E 2004 14.5 15.8 23,882 1.98
Mill F Boiler F 2004 21.7 31.2 35,749 2.96
Mill G Boiler G 2004 11.7 30.7 19,250 1.59
Mill H Boiler H 2005 13.7 16.7 22,614 2.09
Mill A
Mill B
Trial Results

18
Evaluation of Benefit Actually GeneratedEvaluation of Benefit Actually Generated
• Requested operating data from mills participating in the power boiler optimization project
• Received data on six boilers:– Boiler A1, A2, B1, B2, C: data for a full year before and after
optimization– Boiler E: pre- and post optimization data for 6 months
• Mill D did not send data; the project for boiler upgrading to implement Paprican’s recommendations, though budgeted, was postponed to 2006.
• Mill F indicated that manpower was not available to extract the requested data.
• The power boiler at Mill G is not on the DCS and operating data cannot be readily retrieved.

19
Summary of Actual BenefitsSummary of Actual BenefitsMill ID Boiler ID
Comparing PeriodsHog Steam Increase,
t/yr
Hog Steam Increase, %
Fossil Energy Savings, GJ/yr
CO2 Savings,
t/yr
Money Savings,
$/yr
Boiler A1 Mar02 - Feb03 & Year 2004 191,922 31.4 770,004 39,871 8,892,413
Boiler A2Mar02 - Feb03 &
Year 2004 176,425 28.0 707,829 36,651 8,174,392
Mill C Boiler C Sept03 - Aug04 & Sept04 - Aug05 50,013 7.5 200,657 10,390 1,264,659
Comparing PeriodsHog Steam Increase,
t/0.5yr
Hog Steam Increase, %
Fossil Energy Savings, GJ/0.5yr
CO2 Savings,
t/0.5yr
Money Savings, $/0.5yr
Mill E Boiler E 1 April-14 Sept 04 & 15 Sept 04-31 Mar 05 26,496 6.7 106,305 5,504 638,340
Boiler B1
Boiler B2
Mill D Boiler D
Mill F Boiler F
Mill G Boiler GMill H Boiler H
Responded to our request but no data has been provided.
DCS not available and extracting the operating data not possibleResponse to our request for data has not yet been received.
Expected improvement has not been achieved as the project of boiler upgrading, thought budgeted, has been postponed to 2006.
Actual Results
Mill A
Mill BPotential hog steam increase was not realized. Major reasons are: Aging boiler system; Planned boiler upgrading incomplete; Deteriorating hog quality, Hog loading and feeding issues

20
Stack EmissionsStack Emissions• Mill A: PM emissions for both #3 and #4 power boilers
and two recovery boiler• 159 mg/m3 for 2002 pre-optimization• 143 mg/m3 for 2004 post-optimization• Apparently, the higher hog firing rate in 2004 did not hike the overall
PM emissions (scrubber type changed in the 2nd quarter of 2004)
• Mill C: PM Emissions have been always low (< 15 mg/m3). The higher hog firing rate after optimization did not increase emissions
• Pre-optimization gas emissions not available• Paprican measured post-opt gas emissions using a portable CEM
NO (ppm) CO (ppm) SO2 (ppm) CO2 (%) O2 (%)103.8 62.8 5.3 9.8 10.0
• Mill E: Though hog firing rate was higher, PM emissions were lower after optimization

21
Particulate Emissions from Boiler EParticulate Emissions from Boiler E
Parameter Unit Pre Opt
Period CoveredApril 1 to
Sept 14 - 04Sept 15 to Nov 14 - 04
Nov 15 04 to Mar 31 - 05
Gas Flow GJ/h 17.7 25.4 32.1
Total Steam klb/h 208.4 218.4 232.8
Calculated Gas Steam klb/h 9.7 14.0 17.6
Hog Steam klb/h 198.6 204.4 215.2
PM Emissions mg/m3 36.2 35.1 28.7
Flue Gas Flow m3/min 1792 2135 2180
PM Emissions kg/t of o.d. hog 0.22 0.24 0.19
Post Opt

22
Summary Summary • 42 of the 55 operating recovery boilers in
Canada, 8 more RBs in the U.S. and 21 power boilers at Cdn mills tested in the last 7 years
• Operations in 75- 80% of these boilers have been optimized with little or no capital investment
• Recovery boiler throughput was increased by 3 –20%, while reducing the water wash frequency
• Hog steam generation in the optimized power boilers was increased by 6.7 – 31%, producing savings of $1.3 – 8.9 million Cdn./yr in purchased fossil fuel for each boiler

23
Boiler Optimization Services Boiler Optimization Services • Paprican’s boiler optimization services
were offered exclusively to member company mills until 2006
• These services are now being offered to North American mills through our Boiler Optimization and Emissions Control Business Unit
• We are also investigating licensing options that will increase our ability to meet the demand for both power and recovery boiler optimization services

24
Presented By Presented By
Vic UlothPrincipal Research Engineer
PapricanP. O. Box 21018,
Prince George, BC, Canada V2M 7A5Phone: 250-561-3991
Fax: 250-561-4412Email: [email protected]