recreational fishing in commonwealth waters
TRANSCRIPT
www.nespmarine.edu.au
Recreational fishing in Commonwealth waters Lynch T.P., Smallwood C., Ochwada-Doyle F., Williams J., Ryan K., Devine, C., Gibson B., Burton M., Hegarty A., Lyle J., Foster, S and Jordan, A.
Project E4 - Recreational fishing in Commonwealth waters
21 February 2019
Milestone 6 – Research Plan v4 (2018)
Enquiries should be addressed to: Dr Tim P. Lynch Senior Research Scientist, CSIRO Castray Esplanade HOBART TAS 7000 [email protected]
Distribution List Department of Agriculture and Water Resources Emma Lowe Parks Australia/ Department of the Environment and Energy
WA Department of Primary Industries and Regional Development (Fisheries)
Steve Taylor
AFMA Beth Gibson
FRDC Josh Fielding DAFF Tony Harman ABARES Andy Moore
Mandy Goodspeed NSW DPI (Fisheries) Luke Erskine CSIRO Russ Babcock NSW Office of Environment and Heritage Coastal and Marine Waters Wetlands and Coasts Science
Peter Davies
FRDC indigenous RAG Chris Calogeras CSIRO MRI Rich Little FRDC contact indigenous fishing Jo-Anne Ruscoe Break O day Council (East Coast Tas) John McGiveron
Preferred Citation Lynch T.P., Smallwood C., Ochwada-Doyle F., Williams J., Ryan K., Devine, C., Gibson B., Burton M., Hegarty A., Lyle J., S. Foster and A. Jordan (2019). Recreational fishing in Commonwealth waters. Report to the National Environmental Science Program, Marine Biodiversity Hub. (CSIRO).
Copyright This report is licensed by the University of Tasmania for use under a Creative Commons Attribution 4.0 Australia Licence. For licence conditions, see https://creativecommons.org/licenses/by/4.0/
Acknowledgement This work was undertaken for the Marine Biodiversity Hub, a collaborative partnership supported through funding from the Australian Government’s National Environmental Science Program (NESP). NESP Marine Biodiversity Hub partners include the University of Tasmania; CSIRO, Geoscience Australia, Australian Institute of Marine Science, Museums Victoria, Charles Darwin University, the University of Western Australia, Integrated Marine Observing System, NSW Office of Environment and Heritage, NSW Department of Primary Industries.
Important Disclaimer The NESP Marine Biodiversity Hub advises that the information contained in this publication comprises general statements based on scientific research. The reader is advised and needs to be aware that such information may be incomplete or unable to be used in any specific situation. No reliance or actions must therefore be made on that information without seeking prior expert professional, scientific and technical advice. To the extent permitted by law, the NESP Marine Biodiversity Hub (including its host organisation, employees, partners and consultants) excludes all liability to any person for any consequences, including but not limited to all losses, damages, costs, expenses and any other compensation, arising directly or indirectly from using this publication (in part or in whole) and any information or material contained in it.
Contents Executive Summary ................................................................................................... 1
1.1 Recommendations for managers .............................................................................. 1
2. PART A – INTRODUCTION ................................................................................ 3 A continental scale comparison of Australian offshore recreational fisheries research and its applications to Marine Park and fisheries management. .................. 3
3. Methods ............................................................................................................. 7 3.1 Western Australia ...................................................................................................... 8 3.2 New South Wales.................................................................................................... 12
4. Results ............................................................................................................. 14 4.1 Western Australia .................................................................................................... 14
4.1.1 AFMA .................................................................................................................. 14 4.1.2 Ningaloo Marine Park .......................................................................................... 15
4.2 New South Wales.................................................................................................... 18 4.2.1 AFMA .................................................................................................................. 18 4.2.2 Hunter Marine Park ............................................................................................. 19
5. Discussion ....................................................................................................... 21
REFERENCES ........................................................................................................... 27
6. PART B – INTRODUCTION .............................................................................. 32 A novel application of trail cameras combined with interviews on boat ramps of marine recreational trailer-boat fishers, investigates their behaviours, perceptions and distributions in relation to an offshore Marine Park. ........................................... 32
7. Methods ........................................................................................................... 35 7.1 Site description........................................................................................................ 35 7.2 Sampling ................................................................................................................. 36 7.3 Trail cameras .......................................................................................................... 36 7.4 Interviews ................................................................................................................ 37
8. RESULTS ......................................................................................................... 39 8.1 Trail Camera ........................................................................................................... 39 8.2 Interviews ................................................................................................................ 42
9. DISCUSSION .................................................................................................... 50
10. REFERENCES .................................................................................................. 55
Appendix A – Fact Sheet FOR Recreational offshore fishing survey ................... 60 What will I be asked to do? ....................................................................................... 60 How will the results of the study be used? ................................................................ 60 What if I have any questions about this study? ......................................................... 60
Appendix B – QUESTIONNAIRE .............................................................................. 61
List of Figures Figure 1 Australian Marine Parks in Commonwealth waters showing details of (A) Ningaloo
Marine Park in Western Australia and (B) Hunter Marine Park in New South Wales. ..................... 5
Figure 2 Estimated retained, released and total catch (by numbers and with associated standard errors) from boat-based recreational fishers for the Australian Fisheries Management Authority species of interest state-wide (Western Australia) in each survey year. Note: estimates were not reported for some survey years due to sample size <=30 and/or RSE>40%. .......................................................................................................................... 14
Figure 3 Estimated retained, released and total catch (by numbers, and with associated standard errors) from boat-based recreational fishers for all species in the Ningaloo Marine Park (Western Australia) in each survey year. Note: Sample size >30 and RSE <40% for all estimates. ....................................................................................................................................... 15
Figure 4 Estimated retained, released and total catch (by numbers and with associated standard errors) from boat-based recreational fishers for key species in the Ningaloo Marine Park (Western Australia) in each survey year. Note: estimates were not reported for some survey years due to sample size <=30 and/or RSE>40%.................................................... 16
Figure 5 Total estimated retained, released and total recreational state-wide (NSW/ACT) catch (by numbers) and associated standard errors for the Australian Fisheries Management Authority species of interest during 2013/14. Note that flathead scale is in 100,000s. ................. 18
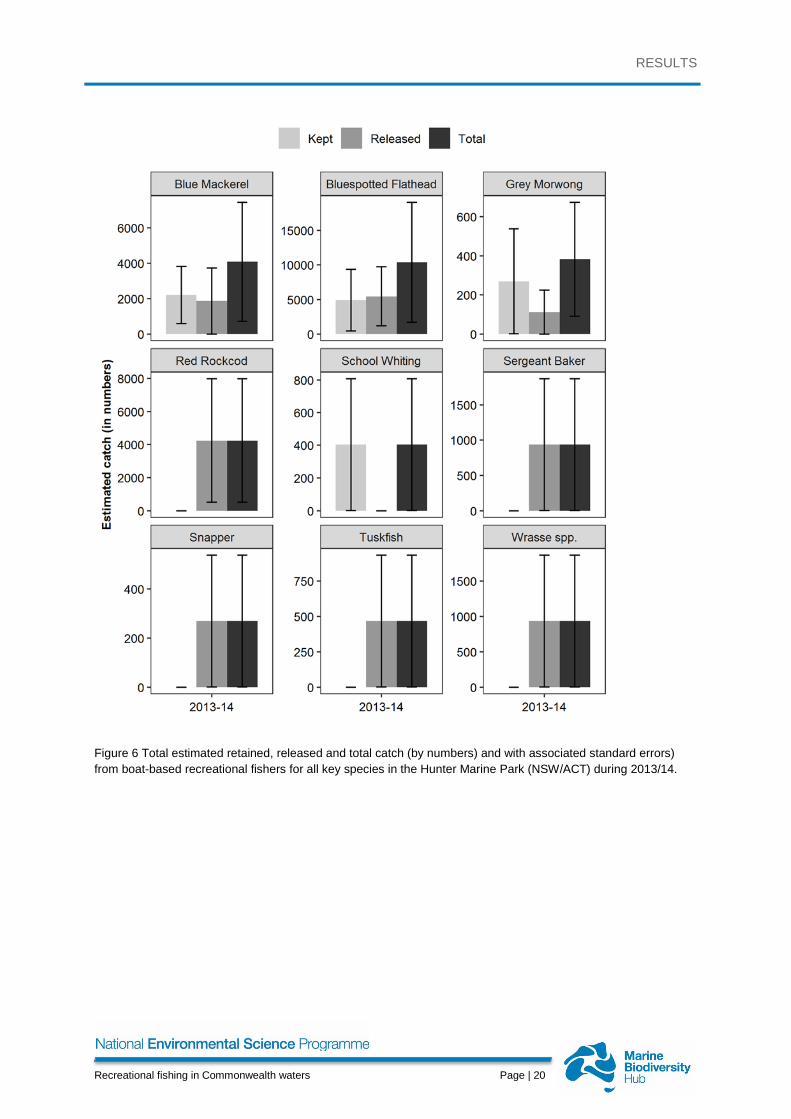
Figure 6 Total estimated retained, released and total catch (by numbers) and with associated standard errors) from boat-based recreational fishers for all key species in the Hunter Marine Park (NSW/ACT) during 2013/14. ...................................................................................... 20
Figure 7 A. Australia with state boundaries, the island state of Tasmania is enclosed in a red box, B. The South East Network of Australia Marine Parks including the Freycinet Marine Park (FMP), the East Coast of Tasmania study site is within the red box, C. The study site with location of study ramps and the zoning of the FMP. Green is zoned as ‘No-take’ or International Union for Conservation of Nature (IUCN) protected area category II, orange is 'Recreational Use' (IUCN IV) and blue is 'Multiple Use' (IUCN VI). ............................................... 35
Figure 8 Temporal distributions over 24 hours of cumulative launch (grey bars) and retrieval (black bars) operations of trailer boats observed via trail cameras, at four ramps during the Easter holiday survey period. ......................................................................................................... 40
Figure 9 Time of launch and retrieval as identified by ramp cameras. For matched boats (green squares), only launch time within the day is reported, and duration of trip (minutes) on the y axis. No data is available for Triabunna and St Helens for 3/4, as cameras were retrieved previous day. .................................................................................................................................. 41
Figure 10 Distribution of boat trip durations, derived from matched trail camera data, by boat ramp. .............................................................................................................................................. 42
Figure 11 Distribution of surveys completed across the 9 days ............................................................ 42
Figure 12 Cumulative counts of grids indicated as fished (fished/not fished) by all boat parties interviewed across the Easter holiday survey period. Counts are colour coded by ramp, the coast is light green and the Freycinet AMP (FMP) is dark green. Zones generally shallower than the 1000m depth contour in the FMP are open to recreational fishing. ................................. 47
Figure 13 Cumulative counts of 5nm grids indicated as fished (fished/not fished) across the last three months by all boat parties interviewed during this study. Counts are colour coded by ramp, the coast is light green and the Freycinet AMP (FMP) is dark green. Zones generally shallower than the 1000m depth contour in the FMP are open to recreational fishing. ................. 48
Figure 14 Cumulative counts by 5nm of grids indicated as fished (fished/not fished) by boat parties for all data collected (interview day + use of previous 3 months). Grids are colour coded with those grids used most often coloured red and those the least coloured dark green. The Freycinet AMP (FMP) is outlined in dark green. Zones generally shallower than the 1000m depth contour, in light green, in the FMP are open to recreational fishing. ................. 49
List of Tables Table 1. Simple tabulation of broad-scale research methods for Marine Recreational Fishery
(MRF) spatial and temporal criteria within the scope of our report. ................................................. 5
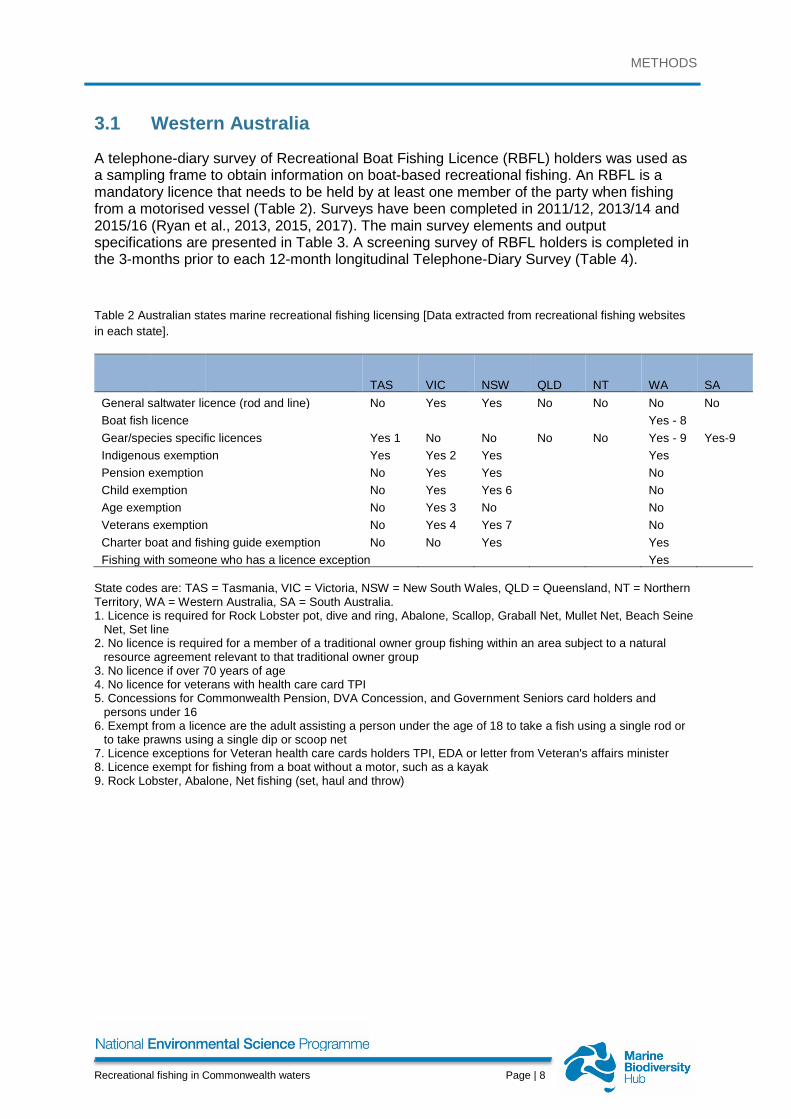
Table 2 Australian states marine recreational fishing licensing [Data extracted from recreational fishing websites in each state]. ........................................................................................................ 8
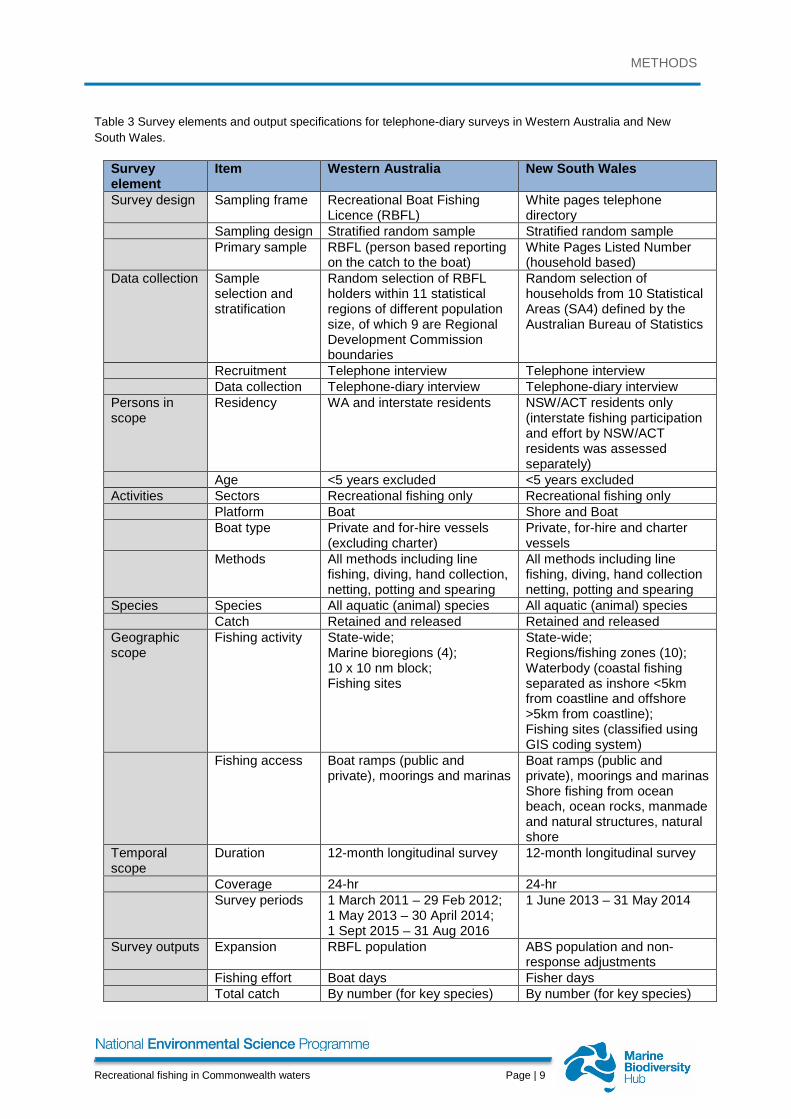
Table 3 Survey elements and output specifications for telephone-diary surveys in Western Australia and New South Wales. ...................................................................................................... 9
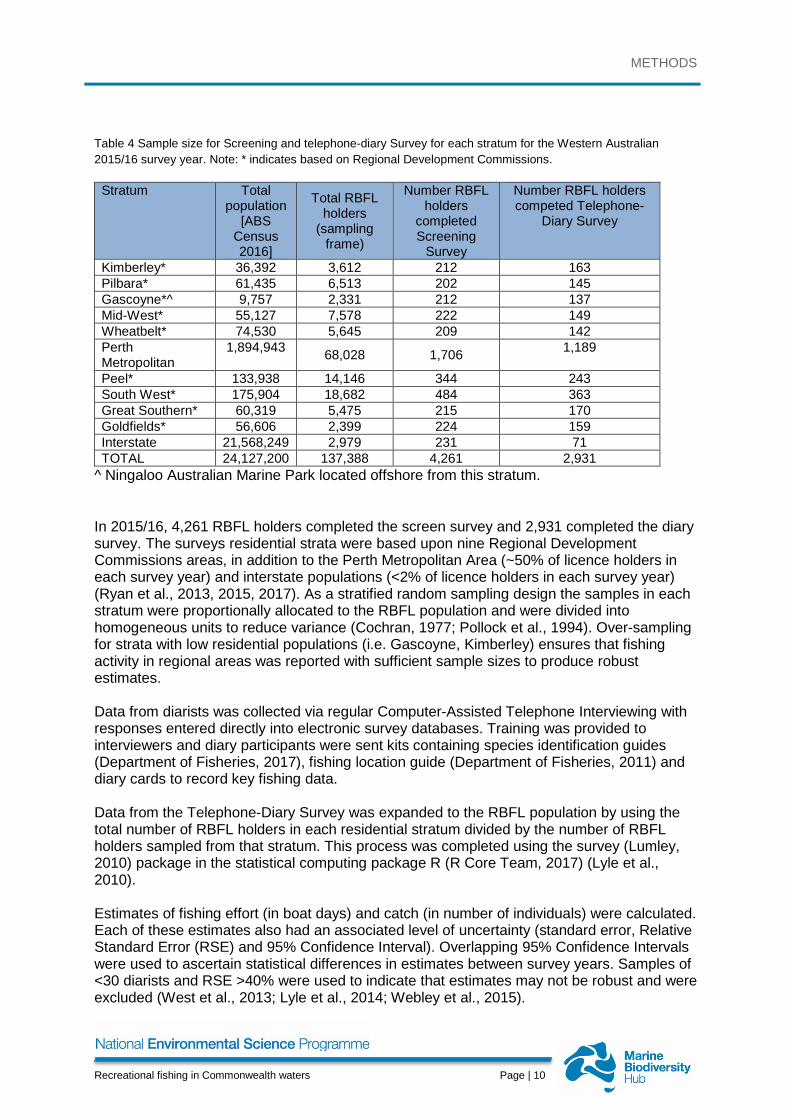
Table 4 Sample size for Screening and telephone-diary Survey for each stratum for the Western Australian 2015/16 survey year. Note: * indicates based on Regional Development Commissions. ................................................................................................................................. 10
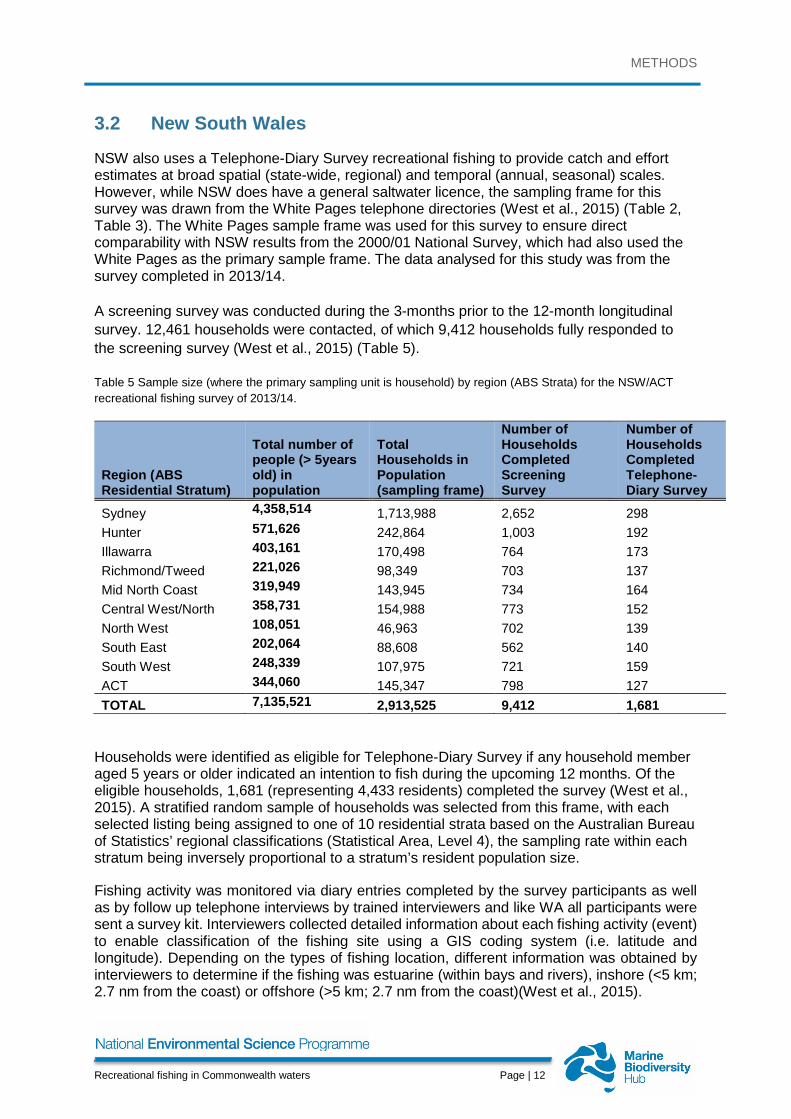
Table 5 Sample size (where the primary sampling unit is household) by region (ABS Strata) for the NSW/ACT recreational fishing survey of 2013/14.................................................................... 12
Table 6 Total estimated fishing effort (boat days) and standard error for Ningaloo Marine Park (Western Australia) in each survey year as well as number of species caught. Note: RSE <40% for all measures of fishing effort. .......................................................................................... 15
Table 7 Total estimated recreational fishing effort and standard error for Hunter Marine Park NSW/ACT (HMP) during 2013/14. The HMP is approximately located within offshore waters (> 5 km from coastline/mainland). The relative inshore (< 5 km from coastline/mainland) recreational fishing effort proximal to the HMP is also depicted. ................................................... 19
Table 8 Sample size and number of species caught by recreational fishers in the Hunter Marine Park in NSW/ACT (HMP) during 2013-14. The HMP is approximately located within offshore waters (> 5 km from coastline/mainland). The relative sample size and number of species caught within inshore waters proximal to the HMP (< 5 km from coastline/mainland) is also depicted............................................................................................................................... 19
Table 9 Completed and in progress state wide assessments for all States and territories - with the exception of Victoria which conducts bio-regional assessments – since the National survey in 2000/1 (Henry and Lyle, 2003). Months are all inclusive (1-30/1). The Australian Capital Territory is included in statistics reported for NSW and WA reports are only for boat based fishing. ................................................................................................................................. 25
Table 10 Number of boat launches, retrievals and matched launches and retrievals, by ramp, from trail camera data. ................................................................................................................... 39
Table 11 Top 4 species targeted by fishers, with numbers of fish kept and released. ......................... 43
Table 12 Fishers’ motivations for fishing on the day of the survey, as percentages of responses. ...... 43
Table 13 Motivations for fishing in general, as percentages of responses. .......................................... 44 Table 14 Attitudes towards the functions of AMPs, as percentages of responses. .............................. 46
EXECUTIVE SUMMARY
Recreational fishing in Commonwealth waters Page | 1
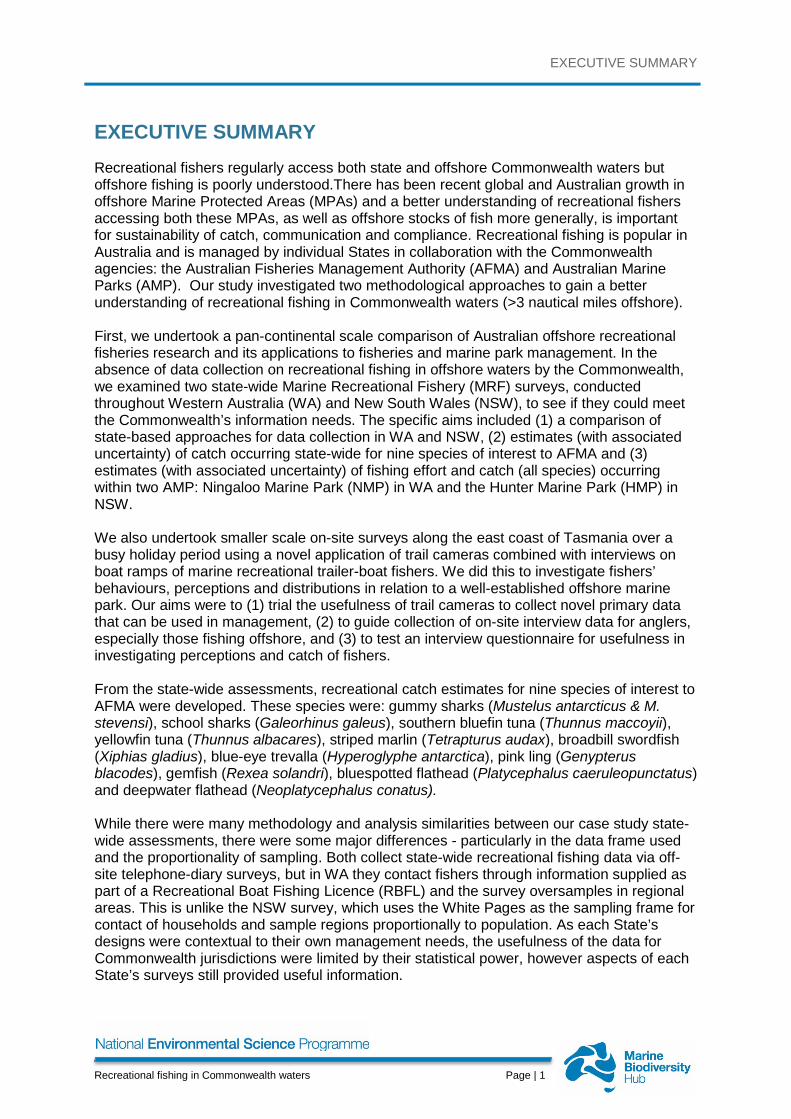
EXECUTIVE SUMMARY Recreational fishers regularly access both state and offshore Commonwealth waters but offshore fishing is poorly understood.There has been recent global and Australian growth in offshore Marine Protected Areas (MPAs) and a better understanding of recreational fishers accessing both these MPAs, as well as offshore stocks of fish more generally, is important for sustainability of catch, communication and compliance. Recreational fishing is popular in Australia and is managed by individual States in collaboration with the Commonwealth agencies: the Australian Fisheries Management Authority (AFMA) and Australian Marine Parks (AMP). Our study investigated two methodological approaches to gain a better understanding of recreational fishing in Commonwealth waters (>3 nautical miles offshore). First, we undertook a pan-continental scale comparison of Australian offshore recreational fisheries research and its applications to fisheries and marine park management. In the absence of data collection on recreational fishing in offshore waters by the Commonwealth, we examined two state-wide Marine Recreational Fishery (MRF) surveys, conducted throughout Western Australia (WA) and New South Wales (NSW), to see if they could meet the Commonwealth’s information needs. The specific aims included (1) a comparison of state-based approaches for data collection in WA and NSW, (2) estimates (with associated uncertainty) of catch occurring state-wide for nine species of interest to AFMA and (3) estimates (with associated uncertainty) of fishing effort and catch (all species) occurring within two AMP: Ningaloo Marine Park (NMP) in WA and the Hunter Marine Park (HMP) in NSW. We also undertook smaller scale on-site surveys along the east coast of Tasmania over a busy holiday period using a novel application of trail cameras combined with interviews on boat ramps of marine recreational trailer-boat fishers. We did this to investigate fishers’ behaviours, perceptions and distributions in relation to a well-established offshore marine park. Our aims were to (1) trial the usefulness of trail cameras to collect novel primary data that can be used in management, (2) to guide collection of on-site interview data for anglers, especially those fishing offshore, and (3) to test an interview questionnaire for usefulness in investigating perceptions and catch of fishers. From the state-wide assessments, recreational catch estimates for nine species of interest to AFMA were developed. These species were: gummy sharks (Mustelus antarcticus & M. stevensi), school sharks (Galeorhinus galeus), southern bluefin tuna (Thunnus maccoyii), yellowfin tuna (Thunnus albacares), striped marlin (Tetrapturus audax), broadbill swordfish (Xiphias gladius), blue-eye trevalla (Hyperoglyphe antarctica), pink ling (Genypterus blacodes), gemfish (Rexea solandri), bluespotted flathead (Platycephalus caeruleopunctatus) and deepwater flathead (Neoplatycephalus conatus). While there were many methodology and analysis similarities between our case study state-wide assessments, there were some major differences - particularly in the data frame used and the proportionality of sampling. Both collect state-wide recreational fishing data via off-site telephone-diary surveys, but in WA they contact fishers through information supplied as part of a Recreational Boat Fishing Licence (RBFL) and the survey oversamples in regional areas. This is unlike the NSW survey, which uses the White Pages as the sampling frame for contact of households and sample regions proportionally to population. As each State’s designs were contextual to their own management needs, the usefulness of the data for Commonwealth jurisdictions were limited by their statistical power, however aspects of each State’s surveys still provided useful information.
EXECUTIVE SUMMARY
Recreational fishing in Commonwealth waters Page | 2
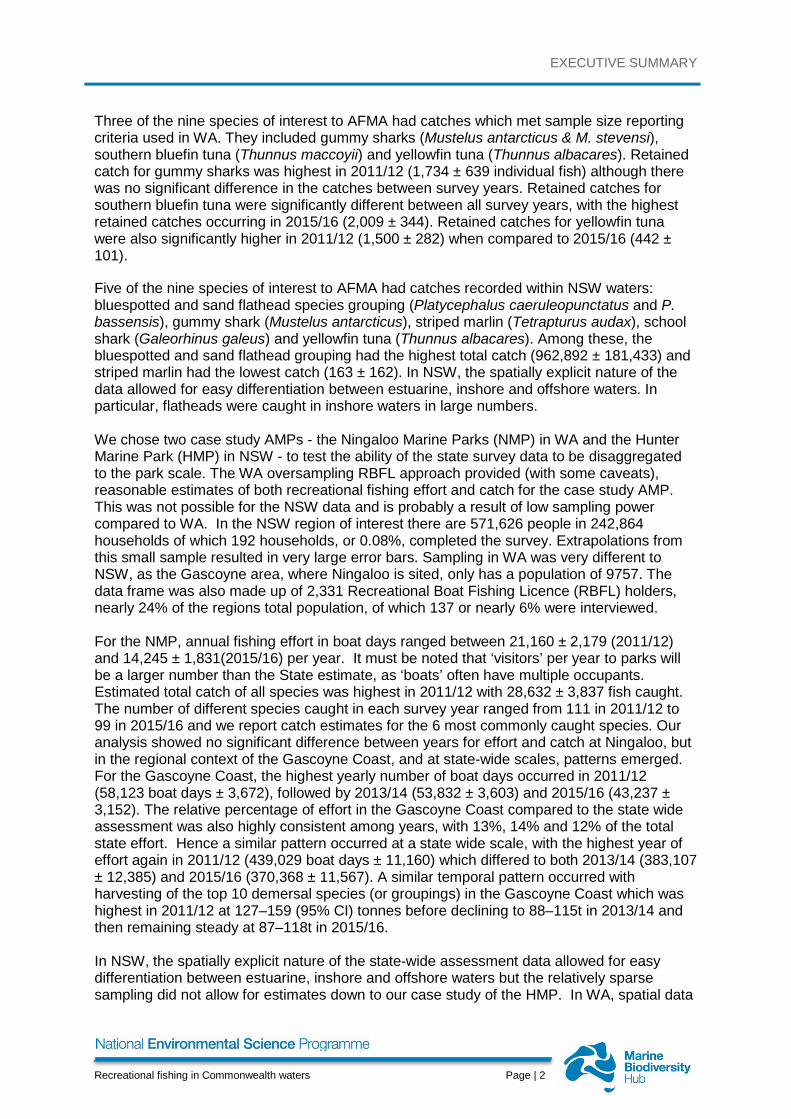
Three of the nine species of interest to AFMA had catches which met sample size reporting criteria used in WA. They included gummy sharks (Mustelus antarcticus & M. stevensi), southern bluefin tuna (Thunnus maccoyii) and yellowfin tuna (Thunnus albacares). Retained catch for gummy sharks was highest in 2011/12 (1,734 ± 639 individual fish) although there was no significant difference in the catches between survey years. Retained catches for southern bluefin tuna were significantly different between all survey years, with the highest retained catches occurring in 2015/16 (2,009 ± 344). Retained catches for yellowfin tuna were also significantly higher in 2011/12 (1,500 ± 282) when compared to 2015/16 (442 ± 101).
Five of the nine species of interest to AFMA had catches recorded within NSW waters: bluespotted and sand flathead species grouping (Platycephalus caeruleopunctatus and P. bassensis), gummy shark (Mustelus antarcticus), striped marlin (Tetrapturus audax), school shark (Galeorhinus galeus) and yellowfin tuna (Thunnus albacares). Among these, the bluespotted and sand flathead grouping had the highest total catch (962,892 ± 181,433) and striped marlin had the lowest catch (163 ± 162). In NSW, the spatially explicit nature of the data allowed for easy differentiation between estuarine, inshore and offshore waters. In particular, flatheads were caught in inshore waters in large numbers. We chose two case study AMPs - the Ningaloo Marine Parks (NMP) in WA and the Hunter Marine Park (HMP) in NSW - to test the ability of the state survey data to be disaggregated to the park scale. The WA oversampling RBFL approach provided (with some caveats), reasonable estimates of both recreational fishing effort and catch for the case study AMP. This was not possible for the NSW data and is probably a result of low sampling power compared to WA. In the NSW region of interest there are 571,626 people in 242,864 households of which 192 households, or 0.08%, completed the survey. Extrapolations from this small sample resulted in very large error bars. Sampling in WA was very different to NSW, as the Gascoyne area, where Ningaloo is sited, only has a population of 9757. The data frame was also made up of 2,331 Recreational Boat Fishing Licence (RBFL) holders, nearly 24% of the regions total population, of which 137 or nearly 6% were interviewed. For the NMP, annual fishing effort in boat days ranged between 21,160 ± 2,179 (2011/12) and 14,245 ± 1,831(2015/16) per year. It must be noted that ‘visitors’ per year to parks will be a larger number than the State estimate, as ‘boats’ often have multiple occupants. Estimated total catch of all species was highest in 2011/12 with 28,632 ± 3,837 fish caught. The number of different species caught in each survey year ranged from 111 in 2011/12 to 99 in 2015/16 and we report catch estimates for the 6 most commonly caught species. Our analysis showed no significant difference between years for effort and catch at Ningaloo, but in the regional context of the Gascoyne Coast, and at state-wide scales, patterns emerged. For the Gascoyne Coast, the highest yearly number of boat days occurred in 2011/12 (58,123 boat days ± 3,672), followed by 2013/14 (53,832 ± 3,603) and 2015/16 (43,237 ± 3,152). The relative percentage of effort in the Gascoyne Coast compared to the state wide assessment was also highly consistent among years, with 13%, 14% and 12% of the total state effort. Hence a similar pattern occurred at a state wide scale, with the highest year of effort again in 2011/12 (439,029 boat days ± 11,160) which differed to both 2013/14 (383,107 ± 12,385) and 2015/16 (370,368 ± 11,567). A similar temporal pattern occurred with harvesting of the top 10 demersal species (or groupings) in the Gascoyne Coast which was highest in 2011/12 at 127–159 (95% CI) tonnes before declining to 88–115t in 2013/14 and then remaining steady at 87–118t in 2015/16. In NSW, the spatially explicit nature of the state-wide assessment data allowed for easy differentiation between estuarine, inshore and offshore waters but the relatively sparse sampling did not allow for estimates down to our case study of the HMP. In WA, spatial data
EXECUTIVE SUMMARY
Recreational fishing in Commonwealth waters Page | 3
is reported as 10 x 10 nm blocks, which did not easily allow for separation between the State and the Commonwealth, as due to the shape and extent of the NMP, all the relevant 10 x 10 nm blocks partially intersected park boundaries, thus a proportional approach was used to adjust catch estimates based on the area (% coverage) of each block situated within its boundary. A limitation of this method to disaggregating data is that it assumes species distribution and fishing are evenly distributed, even though the heterogeneous distribution of species and recreational fishers are well-documented. Accurate mapping of effort and catch rates for defining spatial “hotspots” would be ideal for identifying high priority areas for fishery management, conservation and shifts in distribution of fishing effort and catch over space and time. Depth preferences for some species may allow some separation of catches by jurisdiction, although some AMPs also encompass large depth ranges which is likely to hinder this analysis (i.e. Ningaloo ranges from 30 – 500m in depth). The analysis undertaken in this report however has provided a pilot study for a larger WA state-wide application of disaggregation techniques to investigate small scale patterns of marine recreational fishing using several available methods. Other types of recreational fishing occurring from charter vessels and tournaments are also important to consider and are not always captured by state-wide assessments or on-site survey methods. Charter boat and/or tournament datasets based on log books and records are held by the States and should be investigated for a more complete understanding of fishing catch and effort for the recreational sector. Although estimates of fishing effort and catch at disaggregated spatial scales need to be viewed with caution due to the caveats explained above, implementation of state-wide assessments over the long term can provide an understanding of changes in fishing activity over time. As these changes are identified, this in turn may highlight a need for further targeted sampling. In addition, national coordination to temporally align state surveys would add value to the existing approaches. Continued evolution of state-wide survey methods, including collection of precise spatial data and regional over-sampling, would be beneficial, particularly where there are multiple stakeholder and jurisdictional interests. While methods from state-based surveys are not perfect in addressing the research needs of the Commonwealth, they still go a long way in providing the required information. In particular they demonstrate a well-established framework of expertise, data collection, sampling design, analysis and innovation across Australian states. National coordination to temporally align state surveys would add value to the existing approaches. Neither WA’s nor NSW’s database can determine distributions of recreational fishing effort or catch within AMPs - that is in relation to zoning within management plans. To achieve this level of detailed information, on-site surveys are required which we trialled in Tasmania adjacent to the well-established Freycinet Marine Park (FMP). Determining where, when and how to most cost effectively conduct surveys provided additional challenges. We examined these issues as a pilot for future applications of on-site surveys to the marine park network. We used cheap (<$250 each) trail cameras to observe launches, retrievals and durations of trips by trailer boats at four ramps that bracketed the FMP. This work was hence limited to trailer boats and did not include any vessels launching from marinas. In conjunction with our cameras, we also undertook interviews at these same ramps to: (1) ground truth the footage, (2) investigate motivations and knowledge of the park, and (3) to collect spatial data on both the fishers just completed trip and their fishing effort over the past season. Our pilot study with cheap, off-the-shelf trail cameras worked well. There were no technical failures or cases of vandalism and the information gained provided insights into fisher behaviour. Fisher launch times were generally between 0600-1000 hours and returns usually between 1000-1400 hours, but at one ramp returns were later between 1200-1600 hours.
EXECUTIVE SUMMARY
Recreational fishing in Commonwealth waters Page | 4
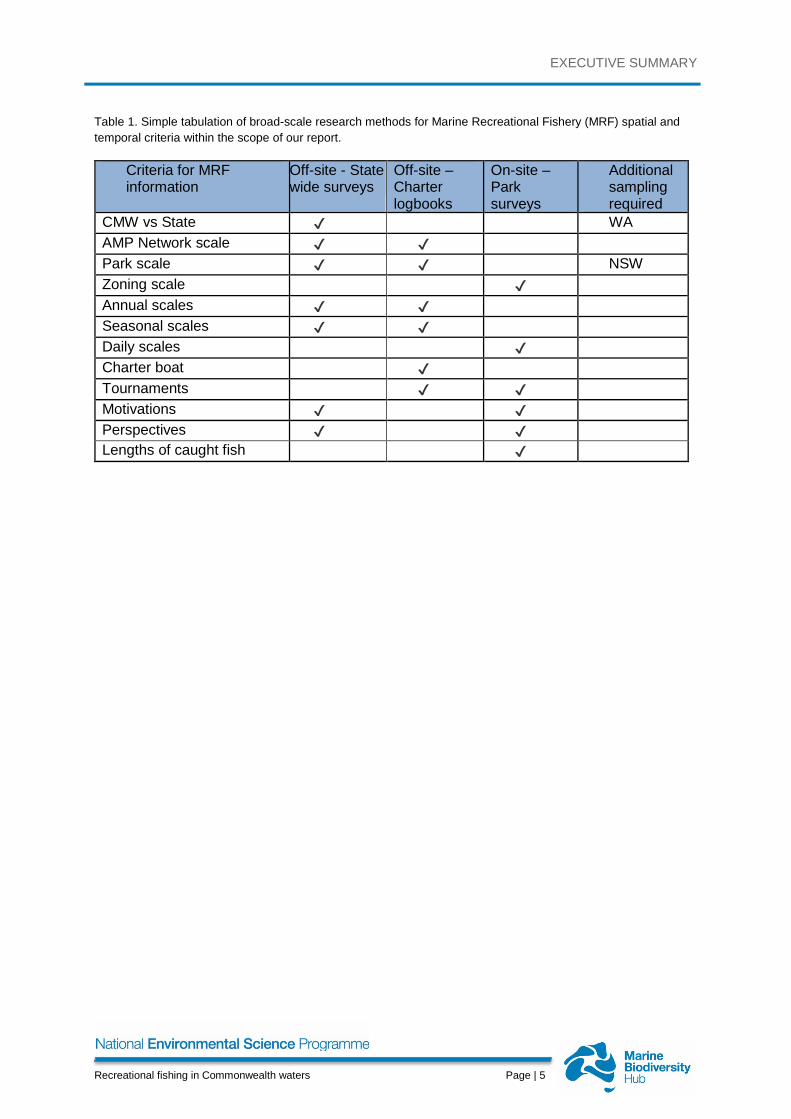
Launches, retrievals and trip duration all varied in response to weather, time and ramp. Both later return times, longer duration trips and greater sensitivity to good weather, when combined with the interview data, suggested ramps where fishers were targeting offshore areas. While we captured 748 boat launches with our trail cameras, we only interviewed 51 fishing parties (around 12 per ramp), so the interview information in particular should be seen as exploratory. Fisher’s knowledge about the FMP was poor, however generally they strongly supported various marine park biodiversity and sustainability objectives and their reported distribution of fishing effort showed no use of restricted zones. For the FMP, nearly all recollected park activity were by fishers who launched from Bicheno, which was the closest ramp to the park. Along the east coast of Tasmania fishers generally showed strong habituation to particular ramps. This choice of particular ‘home’ ramps may mean that park users are a distinct sub-subset of the recreational fisher community. Our ‘habituation’ observation, however, like all of our pilot study work, requires more investigation to see if it is generally applicable. In the foreword to their seminal book: “Angler survey methods and their applications in fisheries management (1994)”, K.H. Pollock, C.M. Jones and T.L Brown provide this quote from W. Edwards Deming: “I add a word here about the hazards of copying sample designs and field instructions. There are no simple rule books nor ready-made sample-designs, and there never will be.” In their updated work: Recreational Angler Survey Methods: Estimation of Effort, Harvest, and Release Catch (Chapter 19, Fisheries techniques 2012), the authors further state that a crucial aspect of designing surveys is deciding on appropriate spatial and temporal scales of interest to management. Providing a simple schema to recommend various type of surveys should be considered in the light of these words of wisdom but at an executive level, and based on the scope of our study, we provide Table 1 which gives a general overview of where off-site versus on-site surveys would be most appropriate for investigating different aspects of the recreational fishery. Generally, for monitoring, off-site surveys are of most use at high levels of assessment - for instance for division of catch between Commonwealth vs State waters or for network or park scales of interest. For more detailed information needs, say at the scale of zoning of a park or for species of interest which are targeted by a niche component of the recreational fishery, on-site methods are best. These on-site methods are probably best as a complementary mixture of targeted interviews with fishers and counts. Interviews can either be intercepts at exist points from the fishery or as a roving survey from boats. Counts can be from sensors looking at effort metrics past access points or via other methods such as from boats or planes. Besides recollections from fishers who mark locations onto maps, aerial surveys and potentially satellite surveys could also be used to investigate small scale distributions of fishing effort.
EXECUTIVE SUMMARY
Recreational fishing in Commonwealth waters Page | 5
Table 1. Simple tabulation of broad-scale research methods for Marine Recreational Fishery (MRF) spatial and temporal criteria within the scope of our report.
Criteria for MRF information
Off-site - State wide surveys
Off-site – Charter logbooks
On-site – Park surveys
Additional sampling required
CMW vs State ✔ WA AMP Network scale ✔ ✔ Park scale ✔ ✔ NSW Zoning scale ✔ Annual scales ✔ ✔ Seasonal scales ✔ ✔ Daily scales ✔ Charter boat ✔ Tournaments ✔ ✔ Motivations ✔ ✔ Perspectives ✔ ✔ Lengths of caught fish ✔
Recreational fishing in Commonwealth waters Page | 1
1.1 Recommendations for managers
• The WA state-wide assessment may be useful at a broad scale (network or park) to assist in evaluation of acceptable impacts, park conditions and trends in regards to visitor use of AMPs by recreational fishers. At the low end of the scale, presence/absence of fishers in marine parks could be determined. Though at more accessible parks estimates of total boat use per survey year, catch and even estimates of the most popular species can be achieved. A state-wide analysis of all AMPs in WA would allowing for a ranking of parks in terms of relative use by the recreational fishery.
• WA has a well-established, comprehensive and rigorous recreational fishing research program, which should be of keen interest to Australian Marine Park managers as 22 AMPs occur within the SW and NW Networks, making up nearly half of the total number of parks in the estate. For management, collaboration with WA State recreational fisheries researchers to further investigate recreational fishing in these 22 parks could provide an evidence-based way to allocate resources for: (1) education to inform the recreational fishing public and stakeholders of what is in a park, rules and regulations and increase public enjoyment, (2) for compliance and (3) for identifying those parks where more targeted studies of potential impacts on park conditions from the recreational fishery may need to occur. As the dataset is repeatedly captured, changes over time may also be detectable. While the data is not able to be interpreted in relation to zoning it can identify which parks would be most sensitive to any changes to zoning for the recreational fishery.
• The Commonwealth has an interest in at least four potential areas for reform of
current recreational fishery assessment methods used by the States. These included: (1) more extensive licensing of offshore fisheries (e.g. the WA Recreational Boat Fishing License), primarily to allow for a robust off-site data frame to be developed that will replace the white pages for broad scale estimates of catch and effort, (2) over-sampling in regional areas with AMPs that may be targeted by the recreational fishery, (3) the collection of more detailed spatial data, preferable to at least 3 nautical mile blocks and/or (4) application of a similar estuarine, inshore and offshore waters breakdown used in NSW to better assigning fishing effort and catch to different jurisdictions.
• Changes or additions to State data collection to incorporate aspects of interest to
AMP network managers is best done in a collaborative manner with State recreational fisheries research leaders. Provision of resources from the Commonwealth for this work through NESP’s nationally co-ordinated partnerships has proved to be useful in developing these relationships. In particular, WA Department of Primary Industries and Regional Development (WA DPIRD) may be a useful future collaborator.
• National investment in coordination and capability development and adoption of best practise innovations from across the states to conduct a national survey on a long cycle (i.e. 5 yearly cycle) may be a way forward to align state surveys, while allowing States to continue to innovate. The commencement of a revitalised national survey in 2020/21 would be appropriate, being exactly 20 years from original baseline.
Recreational fishing in Commonwealth waters Page | 2
• Trail cameras provided a novel method to gain insights into the trailer boat fishery. Unlike other similar video or traffic counter methods they are cheap, simple to set-up even for untrained staff, do not have any impacts on existing infrastructure and reduce post-processing as they are triggered. The amount of data generated by the trail cameras was also sufficient for statistical modelling. While we mainly focused on comparative testing between ramps and times to discover the best way to target interviews for fishers, there were many strong statistical effects and interactions with time, ramp and weather. This suggests that like other fisheries many aspects of the trailer-boat fisheries behaviour are predictable and a modelling approach could provide insights into fishers using trailer boats to access parks or offshore areas. The concentrations and predictability of trailer boat fisher behaviours means that those entering marine parks may be relatively easy to target with on-site methods at: (1) the very few ramps where they access parks, and (2) at small windows of time when they return from fishing trips.
• Our trail camera results showed that while fisher launch times were generally
between 0600-1000 for all ramps, returns varied by ramp, with peak returns ranging between 1000-1400 to 1200-1600 hours. Both trip frequency and duration also varied in response to weather, time and ramp. Long duration trips, high sensitivity to good weather and late returns occurring more often at the ramp where offshore fishing activity was reported by interviewees. In light of the concentrations and predictability of fisher behaviour, modification of interview schedules by weighting to target peak returns rates by ramp will allow for more efficient interview data collection.
PART A – INTRODUCTION
Recreational fishing in Commonwealth waters Page | 3
2. PART A – INTRODUCTION A continental scale comparison of Australian offshore recreational fisheries research and its applications to Marine Park and fisheries management.
Unlike commercial fisheries, which often have well-defined areas of operations and mandatory reporting, open-access marine recreational fisheries (MRF) can cross jurisdictional boundaries and require sampling to estimate metrics such as participation, catch and effort (McCluskey and Lewison, 2008). Surveys of MRF to understand their impact on fish stocks as well as their socio-economic characteristics have grown in importance globally over the past few decades (McPhee et al., 2002; Ihde et al., 2011; Venerus and Cedrola, 2017; Hyder et al., 2018). Many jurisdictions undertake coordinated and consistent national recreational fishing surveys to provide these data, and they are especially common in Europe, North America and Oceania, although survey design and data quality vary (Hyder et al., 2018). Since 1981, the National Oceans and Atmospheric Administration (NOAA) has run large scale phone and now mail offsite surveys (Coleman et al., 2004; Camp et al., 2018). Fisheries and Oceans Canada also use a mail recall design for national surveys of recreational fishing, which have been undertaken every five years since 1975 (Brownscombe et al., 2014). While New Zealand’s National Institute of Water and Atmospheric Research has undertaken a national survey that involved face-to-face recruitment and then telephone/fishing diary follow-up to determine fishing activity (Holdsworth et al., 2018). The French Research Institute for Exploitation of the Sea has also undertaken a hybrid off-site random dial telephone survey in combination with on-site interviews targeting fishers (Herfaut et al., 2013).
Recreational fishing is a very popular activity in Australia when compared to global norms, with an estimated national participation rate of 19.5% (in 2000/01) (McPhee et al., 2002; Henry and Lyle, 2003; Cooke and Cowx, 2004; Lewin et al., 2006; Arlinghaus et al., 2015; Hyder et al., 2018). Regardless of this popularity, Australia does not have a time-series of coordinated national recreational fisheries statistics, with only a single national survey conducted in 2000/01 (Henry and Lyle, 2003). Since this baseline was established most states have continued to undertake state-wide or regional surveys but with little coordination or consistency in methodologies between states (Lyle et al., 2014a; Giri and Hall, 2015; Moore et al., 2015; West et al., 2015). While licensing systems could provide an effective sample frame for off-site surveys (Productivity Commission, 2016; Teixeira et al., 2016), these systems are not consistent across Australian states, with some jurisdictions not requiring recreational licences or, where licences are present, many exemptions apply e.g. pensioners, children, veterans and indigenous people.
Regulatory responsibilities for Australian Fisheries are shared between the Australian Commonwealth Government (herein referred to as Commonwealth) and the state governments based on agreements made under the Offshore Constitutional Settlement (OCS). Generally the demarcation between state and Commonwealth waters occurs at 3 nautical miles (nm) out to sea, with Commonwealth waters then extending to 200 nm offshore. Commercial fisheries are managed by the Commonwealth government through the Australian Fisheries Management Authority (AFMA) under the Fisheries Management Act 1991, although some fisheries are managed by the relevant states under agreements with
PART A – INTRODUCTION
Recreational fishing in Commonwealth waters Page | 4
the Commonwealth, often out to 80 nm. All MRF are managed by the states, are open access and fishers regulated with a combination of input and output controls such as bag, gear and size limits and spatial closures (Kearney, 2001). Recent expansion of recreational fishers into offshore waters has been facilitated by the increased affordability of marine technology (i.e. GPS, echo sounders, electric reels, vessels) (West et al., 2015; Evans et al., 2016).
The Fisheries Management Act 1991 has been amended (2017) such that AFMA is now required to consider the interests of the recreational sector. AFMA is also required to consider all sources of mortality when setting sustainable catch rates (Agriculture and Water Resources, 2018). There is, however, a paucity of data on the offshore MRF and generally recreational catch is not incorporated into Commonwealth harvest strategies. One exception to this is southern bluefin tuna (Thunnus maccoyii), where 250 tonne of Australia’s 2017 national catch allocation was set aside for non-commercial mortality (AFMA, 2018). Recreational fisheries are a social activity that are not driven by the economics of the activity, and are therefore difficult to manage within objectives that are normal to commercial fisheries such as quotas, production and profit. Maximising social utility and non-market value of these public resources is an active but relatively new area of research (Brownscombe et al., 2014; Southwick et al., 2018; Brownscombe et al., 2019). Also, niche fisheries, such as those occurring offshore are difficult to assess using broad scale state-wide surveys due to lack of sufficient statistical power (Griffiths et al., 2010; Griffiths et al., 2017). All of these issues contribute the complexity of consideration of MRF for offshore fisheries.
As with fishing activity, marine parks are located and managed both by the states within their inshore waters and also by the Commonwealth in offshore waters, though there are some complications to this general rule around state-controlled islands (Figure 1).
PART A – INTRODUCTION
Recreational fishing in Commonwealth waters Page | 5
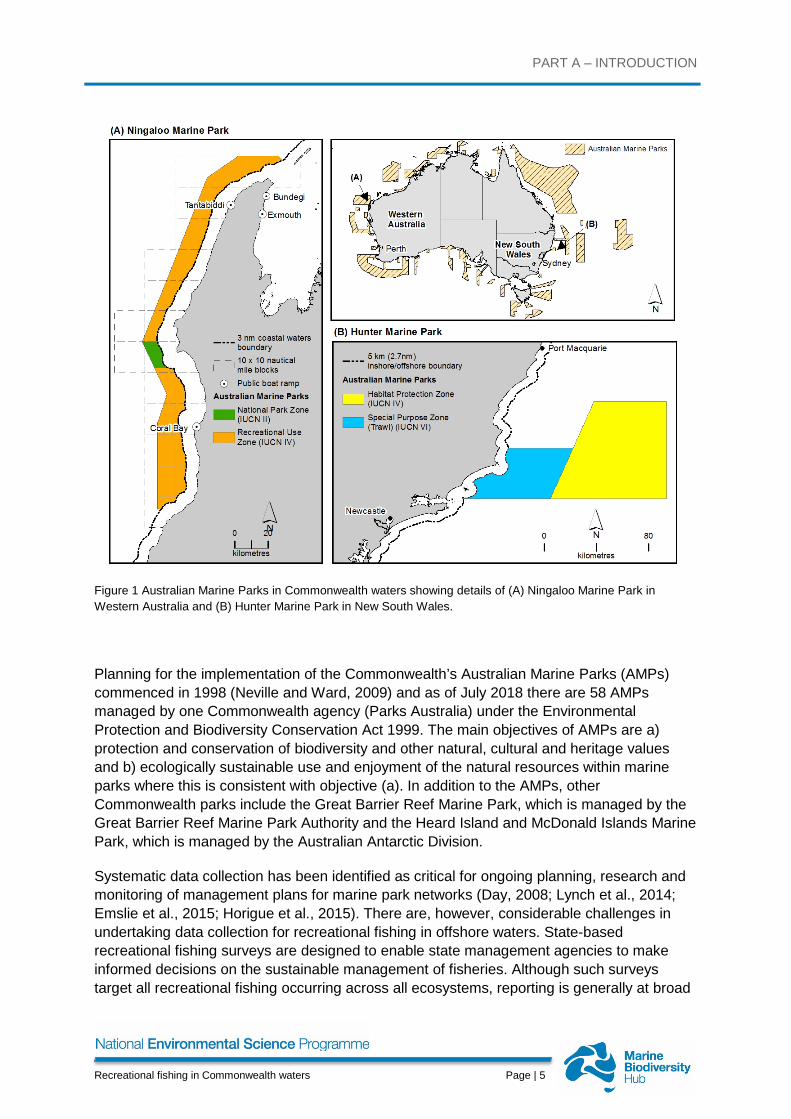
Figure 1 Australian Marine Parks in Commonwealth waters showing details of (A) Ningaloo Marine Park in Western Australia and (B) Hunter Marine Park in New South Wales.
Planning for the implementation of the Commonwealth’s Australian Marine Parks (AMPs) commenced in 1998 (Neville and Ward, 2009) and as of July 2018 there are 58 AMPs managed by one Commonwealth agency (Parks Australia) under the Environmental Protection and Biodiversity Conservation Act 1999. The main objectives of AMPs are a) protection and conservation of biodiversity and other natural, cultural and heritage values and b) ecologically sustainable use and enjoyment of the natural resources within marine parks where this is consistent with objective (a). In addition to the AMPs, other Commonwealth parks include the Great Barrier Reef Marine Park, which is managed by the Great Barrier Reef Marine Park Authority and the Heard Island and McDonald Islands Marine Park, which is managed by the Australian Antarctic Division.
Systematic data collection has been identified as critical for ongoing planning, research and monitoring of management plans for marine park networks (Day, 2008; Lynch et al., 2014; Emslie et al., 2015; Horigue et al., 2015). There are, however, considerable challenges in undertaking data collection for recreational fishing in offshore waters. State-based recreational fishing surveys are designed to enable state management agencies to make informed decisions on the sustainable management of fisheries. Although such surveys target all recreational fishing occurring across all ecosystems, reporting is generally at broad
PART A – INTRODUCTION
Recreational fishing in Commonwealth waters Page | 6
spatial (bioregional) and temporal (seasonal) scales due to the high cost of implementation (West et al., 2015; Ryan et al., 2017). Smaller-scale, targeted research may also be undertaken to meet legislated requirements for fishery performance and resource allocation, to develop new survey approaches or address specific research questions (Crowe et al., 2013; Newman et al., 2018) (Smallwood et al., 2012b; Wise et al., 2012; Lynch, 2014; Wood et al., 2016). AMP management is mainly concerned with the performance of zoning and management plans in achieving conservation of biodiversity and other natural, cultural, socio-economic and heritage values. At the coarsest level, there is a need for gross numbers and activity types of park users, which are important for targeting outreach, compliance and infrastructure for parks. At the other end of the scale is an understanding of detailed levels of usage and catch by park users within different park zones, which are needed to ensure bio-diversity is being conserved through the management plan.
In the absence of data collection on recreational fishing in offshore waters by the Commonwealth, this paper examines if two state-wide MRF surveys, conducted throughout Western Australia (WA) and New South Wales (NSW), could meet their information needs. The specific aims included; (i) a comparison of state-based approaches for data collection in WA and NSW, (ii) estimates (with associated uncertainty) of catch occurring state-wide for nine species of interest to AFMA and (iii) estimates (with associated uncertainty) of fishing effort and catch (all species) occurring within two AMP: Ningaloo Marine Park (NMP) in WA and the Hunter Marine Park (HMP) in NSW.
METHODS
Recreational fishing in Commonwealth waters Page | 7
3. METHODS Australia has a continental coastline of 35,877 km (Short and Woodroffe, 2009), and of which WA has the largest coastal extent (12,880 km or 35.9%) (Figure 1). The state is sparsely populated with 73% of the state’s population of 2.5 million living in the capital city, Perth (ABS, 2018). NSW has the smallest coastline of all the Australian states of 2,007 km, however, NSW has the largest population with 7.9 million residents, representing 32% of Australia’s population and of which 62% reside in the capital city of Sydney (ABS, 2018). In WA, the participation in recreational fishing has changed from 19% in 1989/90 (Lindner and McLeod 1991), to 31.1% in 2015/16 (Ryan et al 2017). Recreational fishing is less popular in heavily urbanised NSW, with 11.9% of the population participating in recreational fishing. However, due to the large overall state population NSW has more recreational fishers compared to WA (and potentially of all Australian states) with an estimated 849,249 people fishing annually (West et al., 2015) over the shortest state coastline (Short and Woodroffe, 2009). NMP is located 1,200 km north of Perth and, with the associated inshore state Marine Park, includes one of the largest fringing coral reef systems in the world (Parks, 2018a) (Figure 1). While the area is sparsely populated, with a residential population of ~10,000 people, there are ~250,000 visitors to the area annually (CALM, 2005; Smallwood et al., 2012a). NMP covers an area of ~2,435 km2, with depths ranging from 30–500 m, and has two zones; a National Park Zone (IUCN II) and Recreational Use Zone (IUCN IV) (Parks, 2018a). The HMP is located off the NSW coastline about 280 km north of Sydney. Similar to Ningaloo it adjoins the state’s Port Stephens-Great Lakes Marine Park and covers an area of ~6,257 km2, stretching from NSW state waters to approximately 100 km offshore (Buxton and Cochrane, 2015). Water depths within the HMP range from 15-6000 m and covers the area on the continental shelf outside state waters. It includes two zones; a Habitat Protection Zone (IUCN IV) and Special Purpose Zone (Trawl) (IUCN VI) (Parks, 2018b). The nine species of interest to AFMA (from a recreational fishing perspective) included in this paper are gummy sharks (Mustelus antarcticus & M. stevensi), school sharks (Galeorhinus galeus), southern bluefin tuna (Thunnus maccoyii), yellowfin tuna (Thunnus albacares), striped marlin (Tetrapturus audax), broadbill swordfish (Xiphias gladius), blue-eye trevalla (Hyperoglyphe antarctica), pink ling (Genypterus blacodes), gemfish (Rexea solandri), bluespotted flathead (Platycephalus caeruleopunctatus) and deepwater flathead (Neoplatycephalus conatus).
METHODS
Recreational fishing in Commonwealth waters Page | 8
3.1 Western Australia
A telephone-diary survey of Recreational Boat Fishing Licence (RBFL) holders was used as a sampling frame to obtain information on boat-based recreational fishing. An RBFL is a mandatory licence that needs to be held by at least one member of the party when fishing from a motorised vessel (Table 2). Surveys have been completed in 2011/12, 2013/14 and 2015/16 (Ryan et al., 2013, 2015, 2017). The main survey elements and output specifications are presented in Table 3. A screening survey of RBFL holders is completed in the 3-months prior to each 12-month longitudinal Telephone-Diary Survey (Table 4).
Table 2 Australian states marine recreational fishing licensing [Data extracted from recreational fishing websites in each state].
TAS VIC NSW QLD NT WA SA General saltwater licence (rod and line) No Yes Yes No No No No Boat fish licence Yes - 8 Gear/species specific licences Yes 1 No No No No Yes - 9 Yes-9 Indigenous exemption Yes Yes 2 Yes Yes Pension exemption No Yes Yes No Child exemption No Yes Yes 6 No Age exemption No Yes 3 No No Veterans exemption No Yes 4 Yes 7 No Charter boat and fishing guide exemption No No Yes Yes Fishing with someone who has a licence exception Yes
State codes are: TAS = Tasmania, VIC = Victoria, NSW = New South Wales, QLD = Queensland, NT = Northern Territory, WA = Western Australia, SA = South Australia. 1. Licence is required for Rock Lobster pot, dive and ring, Abalone, Scallop, Graball Net, Mullet Net, Beach Seine
Net, Set line 2. No licence is required for a member of a traditional owner group fishing within an area subject to a natural
resource agreement relevant to that traditional owner group 3. No licence if over 70 years of age 4. No licence for veterans with health care card TPI 5. Concessions for Commonwealth Pension, DVA Concession, and Government Seniors card holders and
persons under 16 6. Exempt from a licence are the adult assisting a person under the age of 18 to take a fish using a single rod or
to take prawns using a single dip or scoop net 7. Licence exceptions for Veteran health care cards holders TPI, EDA or letter from Veteran's affairs minister 8. Licence exempt for fishing from a boat without a motor, such as a kayak 9. Rock Lobster, Abalone, Net fishing (set, haul and throw)
METHODS
Recreational fishing in Commonwealth waters Page | 9
Table 3 Survey elements and output specifications for telephone-diary surveys in Western Australia and New South Wales.
Survey element
Item Western Australia New South Wales
Survey design Sampling frame Recreational Boat Fishing Licence (RBFL)
White pages telephone directory
Sampling design Stratified random sample Stratified random sample Primary sample RBFL (person based reporting
on the catch to the boat) White Pages Listed Number (household based)
Data collection Sample selection and stratification
Random selection of RBFL holders within 11 statistical regions of different population size, of which 9 are Regional Development Commission boundaries
Random selection of households from 10 Statistical Areas (SA4) defined by the Australian Bureau of Statistics
Recruitment Telephone interview Telephone interview Data collection Telephone-diary interview Telephone-diary interview Persons in scope
Residency WA and interstate residents NSW/ACT residents only (interstate fishing participation and effort by NSW/ACT residents was assessed separately)
Age <5 years excluded <5 years excluded Activities Sectors Recreational fishing only Recreational fishing only Platform Boat Shore and Boat Boat type Private and for-hire vessels
(excluding charter) Private, for-hire and charter vessels
Methods All methods including line fishing, diving, hand collection, netting, potting and spearing
All methods including line fishing, diving, hand collection netting, potting and spearing
Species Species All aquatic (animal) species All aquatic (animal) species Catch Retained and released Retained and released Geographic scope
Fishing activity State-wide; Marine bioregions (4); 10 x 10 nm block; Fishing sites
State-wide; Regions/fishing zones (10); Waterbody (coastal fishing separated as inshore <5km from coastline and offshore >5km from coastline); Fishing sites (classified using GIS coding system)
Fishing access Boat ramps (public and private), moorings and marinas
Boat ramps (public and private), moorings and marinas Shore fishing from ocean beach, ocean rocks, manmade and natural structures, natural shore
Temporal scope
Duration 12-month longitudinal survey 12-month longitudinal survey
Coverage 24-hr 24-hr Survey periods 1 March 2011 – 29 Feb 2012;
1 May 2013 – 30 April 2014; 1 Sept 2015 – 31 Aug 2016
1 June 2013 – 31 May 2014
Survey outputs Expansion RBFL population ABS population and non-response adjustments
Fishing effort Boat days Fisher days Total catch By number (for key species) By number (for key species)
METHODS
Recreational fishing in Commonwealth waters Page | 10
Table 4 Sample size for Screening and telephone-diary Survey for each stratum for the Western Australian 2015/16 survey year. Note: * indicates based on Regional Development Commissions.
Stratum Total population
[ABS Census 2016]
Total RBFL holders
(sampling frame)
Number RBFL holders
completed Screening
Survey
Number RBFL holders competed Telephone-
Diary Survey
Kimberley* 36,392 3,612 212 163 Pilbara* 61,435 6,513 202 145 Gascoyne*^ 9,757 2,331 212 137 Mid-West* 55,127 7,578 222 149 Wheatbelt* 74,530 5,645 209 142 Perth Metropolitan
1,894,943 68,028 1,706 1,189
Peel* 133,938 14,146 344 243 South West* 175,904 18,682 484 363 Great Southern* 60,319 5,475 215 170 Goldfields* 56,606 2,399 224 159 Interstate 21,568,249 2,979 231 71 TOTAL 24,127,200 137,388 4,261 2,931
^ Ningaloo Australian Marine Park located offshore from this stratum.
In 2015/16, 4,261 RBFL holders completed the screen survey and 2,931 completed the diary survey. The surveys residential strata were based upon nine Regional Development Commissions areas, in addition to the Perth Metropolitan Area (~50% of licence holders in each survey year) and interstate populations (<2% of licence holders in each survey year) (Ryan et al., 2013, 2015, 2017). As a stratified random sampling design the samples in each stratum were proportionally allocated to the RBFL population and were divided into homogeneous units to reduce variance (Cochran, 1977; Pollock et al., 1994). Over-sampling for strata with low residential populations (i.e. Gascoyne, Kimberley) ensures that fishing activity in regional areas was reported with sufficient sample sizes to produce robust estimates. Data from diarists was collected via regular Computer-Assisted Telephone Interviewing with responses entered directly into electronic survey databases. Training was provided to interviewers and diary participants were sent kits containing species identification guides (Department of Fisheries, 2017), fishing location guide (Department of Fisheries, 2011) and diary cards to record key fishing data. Data from the Telephone-Diary Survey was expanded to the RBFL population by using the total number of RBFL holders in each residential stratum divided by the number of RBFL holders sampled from that stratum. This process was completed using the survey (Lumley, 2010) package in the statistical computing package R (R Core Team, 2017) (Lyle et al., 2010). Estimates of fishing effort (in boat days) and catch (in number of individuals) were calculated. Each of these estimates also had an associated level of uncertainty (standard error, Relative Standard Error (RSE) and 95% Confidence Interval). Overlapping 95% Confidence Intervals were used to ascertain statistical differences in estimates between survey years. Samples of <30 diarists and RSE >40% were used to indicate that estimates may not be robust and were excluded (West et al., 2013; Lyle et al., 2014; Webley et al., 2015).
METHODS
Recreational fishing in Commonwealth waters Page | 11
The location of each fishing event was reported using a 10 x 10 nm block (Fig. 1). Expanding raw data to population estimates at finer, AMP scale followed the same process as for the broader, state-wide and bioregional scales. However, due to the shape and extent of the NMP, all 10 x 10 nm blocks only partially intersected park boundaries (Figure 1). A proportional approach was therefore used to adjust catch estimates based on the area (% coverage) of each block situated within its boundary. This was possible for species catches where individual fishing events could be proportioned for each block.
METHODS
Recreational fishing in Commonwealth waters Page | 12
3.2 New South Wales
NSW also uses a Telephone-Diary Survey recreational fishing to provide catch and effort estimates at broad spatial (state-wide, regional) and temporal (annual, seasonal) scales. However, while NSW does have a general saltwater licence, the sampling frame for this survey was drawn from the White Pages telephone directories (West et al., 2015) (Table 2, Table 3). The White Pages sample frame was used for this survey to ensure direct comparability with NSW results from the 2000/01 National Survey, which had also used the White Pages as the primary sample frame. The data analysed for this study was from the survey completed in 2013/14. A screening survey was conducted during the 3-months prior to the 12-month longitudinal survey. 12,461 households were contacted, of which 9,412 households fully responded to the screening survey (West et al., 2015) (Table 5).
Table 5 Sample size (where the primary sampling unit is household) by region (ABS Strata) for the NSW/ACT recreational fishing survey of 2013/14.
Region (ABS Residential Stratum)
Total number of people (> 5years old) in population
Total Households in Population (sampling frame)
Number of Households Completed Screening Survey
Number of Households Completed Telephone-Diary Survey
Sydney 4,358,514 1,713,988 2,652 298 Hunter 571,626 242,864 1,003 192 Illawarra 403,161 170,498 764 173 Richmond/Tweed 221,026 98,349 703 137 Mid North Coast 319,949 143,945 734 164 Central West/North 358,731 154,988 773 152 North West 108,051 46,963 702 139 South East 202,064 88,608 562 140 South West 248,339 107,975 721 159 ACT 344,060 145,347 798 127 TOTAL 7,135,521 2,913,525 9,412 1,681
Households were identified as eligible for Telephone-Diary Survey if any household member aged 5 years or older indicated an intention to fish during the upcoming 12 months. Of the eligible households, 1,681 (representing 4,433 residents) completed the survey (West et al., 2015). A stratified random sample of households was selected from this frame, with each selected listing being assigned to one of 10 residential strata based on the Australian Bureau of Statistics’ regional classifications (Statistical Area, Level 4), the sampling rate within each stratum being inversely proportional to a stratum’s resident population size.
Fishing activity was monitored via diary entries completed by the survey participants as well as by follow up telephone interviews by trained interviewers and like WA all participants were sent a survey kit. Interviewers collected detailed information about each fishing activity (event) to enable classification of the fishing site using a GIS coding system (i.e. latitude and longitude). Depending on the types of fishing location, different information was obtained by interviewers to determine if the fishing was estuarine (within bays and rivers), inshore (<5 km; 2.7 nm from the coast) or offshore (>5 km; 2.7 nm from the coast)(West et al., 2015).
METHODS
Recreational fishing in Commonwealth waters Page | 13
This inshore/offshore classification, along with GIS coding, enabled approximate identification of fishing events that occurred within the HMP and, more broadly, within Commonwealth waters. For HMP, fishing events were approximated to have occurred if they took place within the offshore waters west 153° 42’ E and within 32° 01’ S - 32° 41’ S. Expansion of samples to population estimates was undertaken by calibrating against ABS population bench marks and was implemented for residents in each residential stratum, taking account of household and person based-demographics and various biases such as avidity and ‘drop-in’ and ‘drop-outs’ to the fishery (West et al., 2015). Like WA this expansion process was completed using the statistical computing package R (R Core Team,2017) using the survey (Lumley, 2010) and recsurvey (Lyle et al., 2010) packages. Disaggregation of the NSW Telephone-Diary Survey to provide fine-scale estimates of fishing effort and catch at the scale of the HMP followed the same process of expanding the raw data to population estimates of fishing effort (in fisher days) and total catch (in number of individuals). Fisher days are defined as the total number of person days spent fishing. Each of these estimates also had an associated level of uncertainty (standard error).
RESULTS
Recreational fishing in Commonwealth waters Page | 14
4. RESULTS
4.1 Western Australia
4.1.1 AFMA
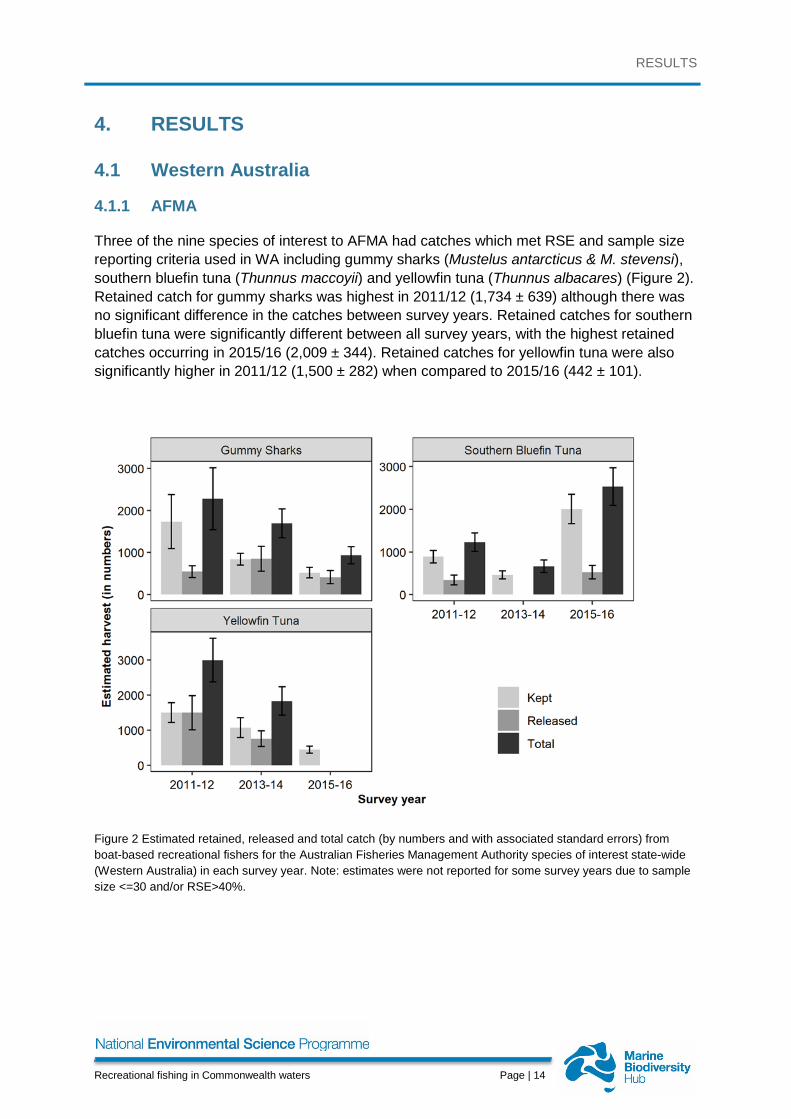
Three of the nine species of interest to AFMA had catches which met RSE and sample size reporting criteria used in WA including gummy sharks (Mustelus antarcticus & M. stevensi), southern bluefin tuna (Thunnus maccoyii) and yellowfin tuna (Thunnus albacares) (Figure 2). Retained catch for gummy sharks was highest in 2011/12 (1,734 ± 639) although there was no significant difference in the catches between survey years. Retained catches for southern bluefin tuna were significantly different between all survey years, with the highest retained catches occurring in 2015/16 (2,009 ± 344). Retained catches for yellowfin tuna were also significantly higher in 2011/12 (1,500 ± 282) when compared to 2015/16 (442 ± 101).
Figure 2 Estimated retained, released and total catch (by numbers and with associated standard errors) from boat-based recreational fishers for the Australian Fisheries Management Authority species of interest state-wide (Western Australia) in each survey year. Note: estimates were not reported for some survey years due to sample size <=30 and/or RSE>40%.
RESULTS
Recreational fishing in Commonwealth waters Page | 15
4.1.2 Ningaloo Marine Park
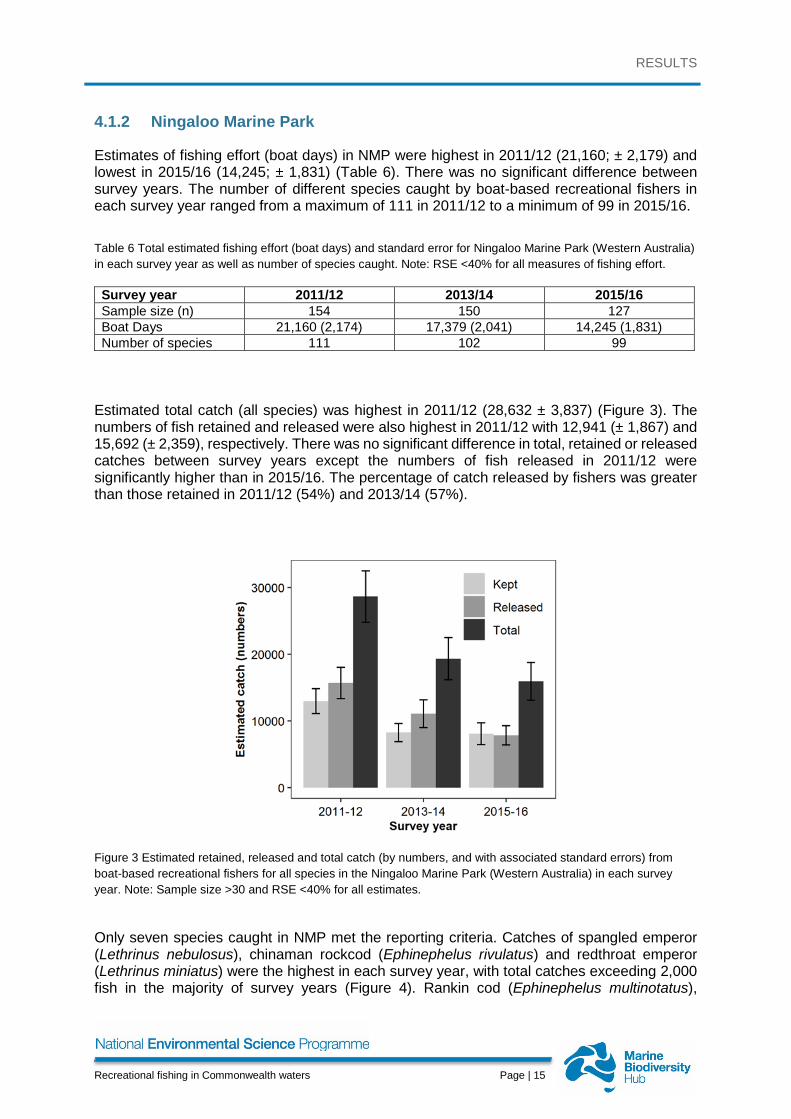
Estimates of fishing effort (boat days) in NMP were highest in 2011/12 (21,160; ± 2,179) and lowest in 2015/16 (14,245; ± 1,831) (Table 6). There was no significant difference between survey years. The number of different species caught by boat-based recreational fishers in each survey year ranged from a maximum of 111 in 2011/12 to a minimum of 99 in 2015/16. Table 6 Total estimated fishing effort (boat days) and standard error for Ningaloo Marine Park (Western Australia) in each survey year as well as number of species caught. Note: RSE <40% for all measures of fishing effort.
Survey year 2011/12 2013/14 2015/16 Sample size (n) 154 150 127 Boat Days 21,160 (2,174) 17,379 (2,041) 14,245 (1,831) Number of species 111 102 99
Estimated total catch (all species) was highest in 2011/12 (28,632 ± 3,837) (Figure 3). The numbers of fish retained and released were also highest in 2011/12 with 12,941 (± 1,867) and 15,692 (± 2,359), respectively. There was no significant difference in total, retained or released catches between survey years except the numbers of fish released in 2011/12 were significantly higher than in 2015/16. The percentage of catch released by fishers was greater than those retained in 2011/12 (54%) and 2013/14 (57%).
Figure 3 Estimated retained, released and total catch (by numbers, and with associated standard errors) from boat-based recreational fishers for all species in the Ningaloo Marine Park (Western Australia) in each survey year. Note: Sample size >30 and RSE <40% for all estimates.
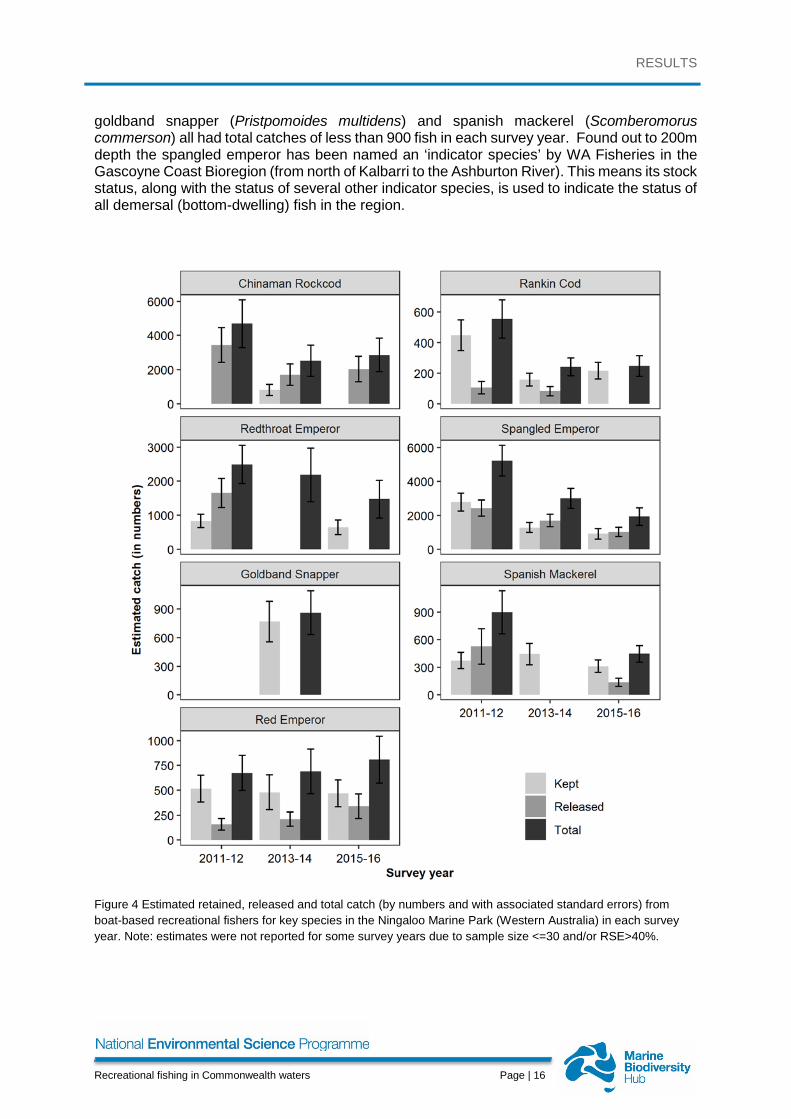
Only seven species caught in NMP met the reporting criteria. Catches of spangled emperor (Lethrinus nebulosus), chinaman rockcod (Ephinephelus rivulatus) and redthroat emperor (Lethrinus miniatus) were the highest in each survey year, with total catches exceeding 2,000 fish in the majority of survey years (Figure 4). Rankin cod (Ephinephelus multinotatus),
RESULTS
Recreational fishing in Commonwealth waters Page | 16
goldband snapper (Pristpomoides multidens) and spanish mackerel (Scomberomorus commerson) all had total catches of less than 900 fish in each survey year. Found out to 200m depth the spangled emperor has been named an ‘indicator species’ by WA Fisheries in the Gascoyne Coast Bioregion (from north of Kalbarri to the Ashburton River). This means its stock status, along with the status of several other indicator species, is used to indicate the status of all demersal (bottom-dwelling) fish in the region.
Figure 4 Estimated retained, released and total catch (by numbers and with associated standard errors) from boat-based recreational fishers for key species in the Ningaloo Marine Park (Western Australia) in each survey year. Note: estimates were not reported for some survey years due to sample size <=30 and/or RSE>40%.
RESULTS
Recreational fishing in Commonwealth waters Page | 17
Comparisons of catch between survey years was possible for all species except goldband snapper (Pristpomoides multidens). There was no significant difference between the estimated catch retained by recreational fishers in each survey year, except for spangled emperor (2011/12 was significantly higher than 2015/16) and rankin cod (Ephinephelus multinotatus) (2011/12 was significantly higher than 2013/14). There was no significant difference in released and total catches between survey years for each species.

RESULTS
Recreational fishing in Commonwealth waters Page | 18
4.2 New South Wales
4.2.1 AFMA
Five of the nine species of interest to AFMA had catches recorded within NSW waters: bluespotted and sand flathead species grouping (Platycephalus caeruleopunctatus and P. bassensis), gummy shark (Mustelus antarcticus), striped marlin (Tetrapturus audax), school shark (Galeorhinus galeus) and yellowfin tuna (Thunnus albacares) (Figure 5). Among these, the bluespotted and sand flathead grouping had the highest total catch (962,892 ± 181,433) and striped marlin had the lowest catch (163 ± 162). The spatially explicit nature of the data allowed for easy differentiation between estuarine, inshore and offshore waters. In particular flatheads were caught in inshore waters in large numbers.
Figure 5 Total estimated retained, released and total recreational state-wide (NSW/ACT) catch (by numbers) and associated standard errors for the Australian Fisheries Management Authority species of interest during 2013/14. Note that flathead scale is in 100,000s.

RESULTS
Recreational fishing in Commonwealth waters Page | 19
4.2.2 Hunter Marine Park
Estimates of fishing effort (fisher days) were higher in the inshore waters (37,426 (± 8,557) adjacent to the HMP compared to fishing effort within the approximate bounds of the HMP itself (1,901 (± 1,442)) (Table 7). The total number of species caught by fishers within the HMP was 9 (
Table 8). Total estimated catch across species within the HMP is shown in Figure 6. Catches of bluespotted and sand flathead species grouping (Platycephalus caeruleopunctatus & P. bassensis), red rockcod (Scorpaena jacksoniensis) and blue mackerel (Scomber australasicus) were the highest within the HMP exceeding 4,000 fish (Figure 5). As can be seen from the error bars, the uncertainty in these estimates is very high. Table 7 Total estimated recreational fishing effort and standard error for Hunter Marine Park NSW/ACT (HMP) during 2013/14. The HMP is approximately located within offshore waters (> 5 km from coastline/mainland). The relative inshore (< 5 km from coastline/mainland) recreational fishing effort proximal to the HMP is also depicted.
Waterbody Inshore Waters HMP (Offshore Waters) Sample Size (Households) 38 3
Fisher Days 37,426 (8,557) 1,901 (1,442)
Table 8 Sample size and number of species caught by recreational fishers in the Hunter Marine Park in NSW/ACT (HMP) during 2013-14. The HMP is approximately located within offshore waters (> 5 km from coastline/mainland). The relative sample size and number of species caught within inshore waters proximal to the HMP (< 5 km from coastline/mainland) is also depicted.
Waterbody Inshore Waters HMP (Offshore
Waters) Sample size (Households) 26 3
Number species 34 9
RESULTS
Recreational fishing in Commonwealth waters Page | 20
Figure 6 Total estimated retained, released and total catch (by numbers) and with associated standard errors) from boat-based recreational fishers for all key species in the Hunter Marine Park (NSW/ACT) during 2013/14.
DISCUSSION
Recreational fishing in Commonwealth waters Page | 21
5. DISCUSSIONSince the first national survey on recreational fishing in 2000/01 (Lyle et al., 2002; Henry and Lyle, 2003) both WA and NSW have maintained the basic methodology with a screening survey followed by 12-month longitudinal telephone-diary survey. A key difference in methodology is that WA uses a RBFL database as the sampling frame, while NSW uses the white pages telephone directory. NSW has started supplementing this data frame with their general saltwater fishing licence holders being considered within the sampling frame (Table 2) but this survey design is still being developed.
Post hoc analysis of the existing WA and NSW survey databases provided some useful information on both fishing effort and catch for Commonwealth waters. For the nine species of interest to AFMA, robust catch estimates for six were possible, with estimates for two species, gummy sharks (Mustelus antarcticus) and yellowfin tuna (Thunnus albacares) available in both states. The spatially explicit classification used in NSW (i.e. estuarine, inshore and offshore) approximates the boundary between state and Commonwealth waters and facilitated an additional breakdown of catches between state and Commonwealth jurisdictions. In WA, the 10 x 10 nm blocks overlayed both state and Commonwealth waters and could only provide catch estimates from combined jurisdictions.
Disaggregation of state-based data to our case study AMP scale showed some potential - with various caveats - for providing park scale estimates of fishing effort and total catch. Only the WA survey was of sufficient statistical power to provide robust estimations of effort and catch for commonly caught species for NMP. In some instances, these results were sensitive enough to show significant differences between survey periods. For the HMP the large variances of estimates meant the data was un-reliable above presence/absence levels. This difference in granularity was probably due to regional oversampling applied by the Western Australian’s to their survey. This resulted in a much larger sample collected within the Regional Commission Boundary (Gascoyne) for NMP compared to then Hunter sampling bio-region which contained the HMP. The proportion of the total Gascoyne population sampled - compared to sampling in the Hunter - was also much larger. However, even in WA, data could only be disaggregated to the park scale, with distributions within the park (i.e. to specific zones) unable to be calculated. This fine scale investigation of spatial use by fishers of zoning plans within marine parks is better served by dedicated on-site studies (see Part B of this report).
All sources of mortality should be considered to ensure sustainable catches but this is challenging with the cross jurisdictional movement of fish and recreational fishers. For many species targeted by recreational fishers in Australia the objective is consumption and for some species catch can exceed the take of the commercial fishery (Zischke et al., 2012; Lyle et al., 2014b; Giri and Hall, 2015). It is interesting to note that both states develop metrics for catch, which combines harvest with released animals, as release mortality can be variable based on fisher skill, gear type, species and depth of capture (Muoneke and Childress, 1994; Cooke and Philipp, 2004; Skomal, 2007; Brownscombe et al., 2014; Brownscombe et al., 2017; Shertzer et al., 2018). For consideration of total non-commercial mortality both species and/or regional MRF estimates may require adjustments to account for the proportion of released fish that die. Long-lived and historically overfished shark species (Last and Stevens, 2009) such as gummy shark (Mustelus antarcticus) were captured in both states. Both WA and NSW border the centre of the shark’s distribution and the associated recreational fishery for this species. Detection of fish caught within RSE limits by state wide assessment methods – which are a ‘broad brush’ approach – suggest considerable catches. When combined with catches from other states (i.e. South Australia, Victoria and Tasmania), and the relatively small tonnage considered sustainable (1774 t) (AFMA, 2019), the recreational take may be considerable.
DISCUSSION
Recreational fishing in Commonwealth waters Page | 22
Recreational catches of gummy sharks may be a fishery that requires targeted cross jurisdictional studies to estimate catch across the full distribution of this species. Other shark species in Australia have recognised cross-jurisdictional management requirements, for instance the grey nurse shark (Carcharias taurus), which is the subject of specific MPA and fisheries regulations across multiple states on Australia’s east coast (Lynch et al., 2013). Southern bluefin tuna (Thunnus maccoyii) is another species moving across jurisdictions that is targeted by both commercial and recreational fishers, and provides an example of a collaboration between the Commonwealth and states to obtain catch data (Moore et al., 2015). Southern bluefin tuna caught in WA are small animals (2-3 kg) compared to those captured in the eastern states (up to 260 kg and commonly to 100 kg), hence they will only contribute marginally to the 250 tonne set aside to non-commercial mortality. In jurisdictions such as Victoria and Tasmania the take of this species by the recreational sector may be considerable, with Victoria’s catch estimated at 240 tonne (± 31) over a 5-month season in 2011 (Green et al., 2012). In both the cases of shark and tuna MRF the jurisdictional extent of catch in Commonwealth waters may be relevant to issues such as resource allocation with the commercial sector, in particular for locations where the combined multi-sectorial catch might be substantial. For species subject to international management, recreational catch estimates must also be accurate enough to ensure that recreational fishers do not exceed sustainable limits and to also plan fishing rules that effectively ration the offset for efficiency gains (i.e. improvements in GPS technology)(Moore et al., 2015; Kristianson, 2018). How to target any specific recreational fishing surveys is somewhat problematic in Australia where there are highly diverse eco-systems and landed catches tend to be small, but comprise many species (Newman et al., 2018). Recent surveys in WA have recorded a diverse range of species/taxa being caught including scale-fish (182 species/taxa), elasmobranchs (18), crustaceans (7) and molluscs (5) (Ryan et al., 2017). Sample sizes for state-based assessments are determined to ensure robust estimates are obtained for key species, thus statistical power is not equivalent among species. Consequently, there are difficulties in providing estimates for those species that are less commonly caught, though grouping of catches by family may provide some opportunities for catch estimates at a coarser level. This also poses a challenge for agencies that rely on external data, where their information requirements exceed the objectives, and available budget, of the state-based survey. However, this study has revealed that state datasets are sensitive enough to provide robust estimates for some species of interest to AFMA, and those species not reported (swordfish, blue eye trevalla, pink ling and eastern gemfish) are generally caught in areas outside of the scoping project states, are deep sea species or may be rare events. If species are rarely caught and true catch is low the question then can be posed: does the recreational catch really matter? State-based surveys, if well-resourced, may act as a form of sensitivity analysis for recreational catch in Commonwealth waters for some species, thereby illustrating those that may currently be caught in numbers significant enough to be of concern from a sustainability perspective and also those that emerge or decline as targets for the recreational fishery in the future. Statistical power in the design also played an important role in the functionality of the results obtained for the AMP. In those WA regional strata with low residential populations (i.e. Gascoyne, Kimberley) over-sampling ensured that fishing activity was reported with sufficient sample sizes to produce robust estimates at the bioregional scale. This differed from the NSW approach which was proportional to the strata region’s population size. Both in WA and more generally in Australia recreational fishing rates in regional, low-population areas are high when compared to state-wide averages (Henry and Lyle, 2003; Lyle et al., 2014a; Ryan et al., 2017). Understanding this oversample in the Gascoyne may help explain the difference in statistical power after the disaggregation of data at the NMP when compared to HMP. For the area under the responsibility of the Gascoyne Regional Development Commission, of which NMP sits
DISCUSSION
Recreational fishing in Commonwealth waters Page | 23
offshore, 2,305 residents held RBFL, which is 23.6% of the total population, with an estimated 1,914 (83%) fishing at least once in 2015/16 (Table 4). This resulted in between 127-154 samples collected for NMP, compared to only three for the HMP in NSW (or 41 if the inshore data was added). More generally outside of the Metropolitan strata around Perth, WA sampled about 10% of all RBFL holders. Estimates of spatial use (i.e. bioregion, marine park) can include fishers from any residential strata, as although RBFL holders are most likely to fish in the area closest to their place of residence, many do travel throughout WA to fish further afield (Ryan et al., 2017). Another potential reason for the ability of the WA data to provide more robust estimates of NMP compared to the NSW estimates at HMP, besides oversampling, may be the unusual nature of the RFBL which was used to generate the WA sampling frame. Unlike all other licensing in Australia and elsewhere the RFBL is a form of communal licence where multiple, non-licenced fishers on board a vessel can fish to the boat bag limits of the person which holds the RFBL. In contrast to WA, very few of the estimates generated for the HMP were of adequate resolution to provide robust information. The high uncertainty associated with most HMP estimates indicate either a need for more targeted sampling effort within this area, relatively low levels of recreational fishing or fishing occurring outside of the sampling frame. Of these the first and last options seem most probable. For instance, anecdotally, southern bluefin tuna are caught recreationally in NSW but were not recorded in our case study. In NSW, access to this popular game fishing species can be limited to larger vessels due to the long distance offshore of their preferred oceanographic currents and short fishing season (Moore et al., 2015). These larger vessels are often charter or game fishing vessels and data from these fishers are collected separately to the state-wide surveys via logbooks and offshore game fishing tournament catch records. Mandatory logbooks are a condition of charter boat licensing arrangements but are reported separately to the NSW state-wide survey. Technically, game fishers are included in the state survey if a respondent participated in a tournament. However tournaments are a localised concentration of fishing effort (Flynn et al., 2018) by a small subset of the general fishing population (Griffiths et al., 2010) which have low probability of being captured in state-wide surveys. For HMP, tournament data collected between 1994–2013 (Ghosn et al., 2015) showed extensive effort within the park and charter logbooks also contain more information of the offshore recreational fisheries (Lowry and Murphy, 2003). A limitation of disaggregating data for NMP was that spatial heterogeneity within the 10 x 10 nm blocks used in the WA survey could not be accounted for while proportioning catches. In our proportional analysis of these blocks species distribution and fishing are assumed to be evenly distributed, even though the heterogeneous distribution of recreational fishers are well-documented (Lynch, 2006a; Rufino et al., 2006; Lynch, 2008; Flynn et al., 2018). Species distributions are also not uniform (i.e. different species respond to different habitats) and fisher behaviour can reflect their understanding of where fish occur as well as access to fishing locations. As expected, estimated catches for all species in the NMP were lower when proportional allocation was applied based on the area (% coverage) of each block situated within its boundary rather than reporting on the entire block. The distribution of species is also important to consider and may also affect the number of species recorded in NMP during each survey period. For example, chinaman rockcod (Ephinephelus rivulatus) is a shallow water species which is found in water depths only up to 150 m and therefore are not likely to be caught in the deeper waters of the NMP which extend to 500 m. Accurate mapping of effort and catch rates for defining spatial “hotspots” is ideal for identifying high priority areas for fishery management (Aidoo et al., 2015), conservation (Stelzenmüller et al., 2004; Lynch, 2006b), and shifts in distribution of fishing effort over space and time (Ciannelli et al., 2008; Lynch, 2014; Aidoo et al., 2016). The analysis undertaken in this study provided a pilot study for a larger WA state-wide application of
DISCUSSION
Recreational fishing in Commonwealth waters Page | 24
disaggregation techniques to investigate small scale patterns of marine recreational fishing using one of several available methods. As NMP is one of 22 AMPs in Commonwealth waters surrounding WA, the exploration of new methods and support for this state-wide survey may be an effective way to provide more detailed information on a wide suite of AMP. General methods for determining catch and effort were based on the previous national baseline and similar between states. Where they most strongly differed was in the collection of spatial data fields. As GPS is becoming more ubiquitous an increased focus on collection of spatial data on fishing location could assist future disaggregation of survey data to spatial scales relevant for both Commonwealth fisheries and AMP managers. Finer-scale blocks would also solve some issues (see Part B for examples of the improved functionality of 5 nm blocks or grids) as would fishers identifying the broad ecosystem classification in which they fished (i.e. estuarine, inshore and offshore) such as used in NSW. Coarser survey data may still, however, be useful as AMP are managed on a larger network scale across multiple parks (e.g. north-west Australia, south-east Australia), and networks which have most interactions with the MRF could be prioritised to better focus resources for monitoring. State-based surveys are primarily designed to provide robust estimates (with acceptable sample size and precision) at broad spatial and temporal scales. Species caught less frequently will therefore have lower sample size and greater uncertainty; similarly disaggregated data will lose resolution if sample sizes are set to only have sufficient power to detect changes at regional scales. The state-wide surveys may however provide a sensitivity test for identifying species or locations where MRF may be of interest to the Commonwealth. However, increased or more targeted resourcing within bio-regional strata of interest may be needed to raise sample sizes and achieve adequate statistical power. Over-sampling of regional areas in the WA state-based survey shows the success of this approach. Further harmonisation of state-wide survey datasets with charter-fishing logbook data, tournament data and size frequency information would also allow for better understandings of fish mortality and effort distributions. Alternatively, on-site interviews can be used as another mechanism to answer specific management questions on AMP. A key issue for Commonwealth fisheries is that state-based recreational fishing surveys are not aligned temporally between states. Catch estimates for species that straddle multiple jurisdictions are more readily compared when simultaneous data collection occurs across the full distributional range. Surveys that are not synchronised complicate any inferences for management as catch and subsequent mortality of cohorts will be temporally and, if the species migrate, spatially confounded. The lack of a coordinated program of state-wide surveys makes it very difficult to provide reliable catch estimates for stocks or species. Another issue for alignment is an understanding of cross jurisdictional fishing. For example for jurisdictions where recreational fishing is predominately inter-state visitors, surveys will omit a large proportion of the catch unless other jurisdictions collect data at similar times. Marine recreational fishers in Commonwealth waters share resources with many other sectors and industries, such as commercial fishers, charter boat and tourism operators (Kearney, 2001; Campbell et al., 2003; Collins, 2008) while individual states separately manage and monitor MRF on behalf of the Commonwealth. In this complex, cross-jurisdictional and contested setting there is a need for accurate, precise and consistent information on MRF (Kristianson, 2018). State-based surveys, while not perfect in addressing the research needs for the Commonwealth, still go a long way in providing the required information. They also demonstrate a well-established framework of expertise, data collection, sampling design, analysis and innovation across Australian states and particularly for commercial fisheries a strong partnership approach already exists between the Commonwealth and the states. Further development and co-ordination of recreational research may also be beneficial,
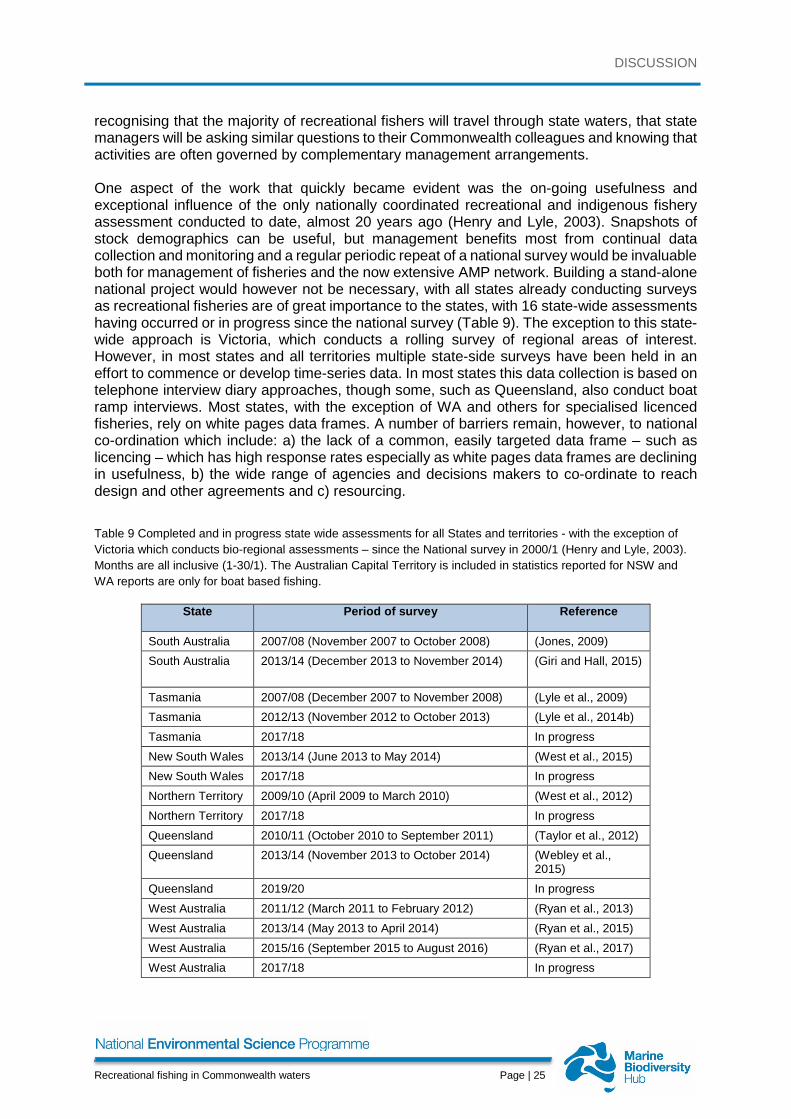
DISCUSSION
Recreational fishing in Commonwealth waters Page | 25
recognising that the majority of recreational fishers will travel through state waters, that state managers will be asking similar questions to their Commonwealth colleagues and knowing that activities are often governed by complementary management arrangements. One aspect of the work that quickly became evident was the on-going usefulness and exceptional influence of the only nationally coordinated recreational and indigenous fishery assessment conducted to date, almost 20 years ago (Henry and Lyle, 2003). Snapshots of stock demographics can be useful, but management benefits most from continual data collection and monitoring and a regular periodic repeat of a national survey would be invaluable both for management of fisheries and the now extensive AMP network. Building a stand-alone national project would however not be necessary, with all states already conducting surveys as recreational fisheries are of great importance to the states, with 16 state-wide assessments having occurred or in progress since the national survey (Table 9). The exception to this state-wide approach is Victoria, which conducts a rolling survey of regional areas of interest. However, in most states and all territories multiple state-side surveys have been held in an effort to commence or develop time-series data. In most states this data collection is based on telephone interview diary approaches, though some, such as Queensland, also conduct boat ramp interviews. Most states, with the exception of WA and others for specialised licenced fisheries, rely on white pages data frames. A number of barriers remain, however, to national co-ordination which include: a) the lack of a common, easily targeted data frame – such as licencing – which has high response rates especially as white pages data frames are declining in usefulness, b) the wide range of agencies and decisions makers to co-ordinate to reach design and other agreements and c) resourcing. Table 9 Completed and in progress state wide assessments for all States and territories - with the exception of Victoria which conducts bio-regional assessments – since the National survey in 2000/1 (Henry and Lyle, 2003). Months are all inclusive (1-30/1). The Australian Capital Territory is included in statistics reported for NSW and WA reports are only for boat based fishing.
State Period of survey Reference
South Australia 2007/08 (November 2007 to October 2008) (Jones, 2009) South Australia 2013/14 (December 2013 to November 2014) (Giri and Hall, 2015)
Tasmania 2007/08 (December 2007 to November 2008) (Lyle et al., 2009) Tasmania 2012/13 (November 2012 to October 2013) (Lyle et al., 2014b) Tasmania 2017/18 In progress New South Wales 2013/14 (June 2013 to May 2014) (West et al., 2015) New South Wales 2017/18 In progress Northern Territory 2009/10 (April 2009 to March 2010) (West et al., 2012) Northern Territory 2017/18 In progress Queensland 2010/11 (October 2010 to September 2011) (Taylor et al., 2012) Queensland 2013/14 (November 2013 to October 2014) (Webley et al.,
2015) Queensland 2019/20 In progress West Australia 2011/12 (March 2011 to February 2012) (Ryan et al., 2013) West Australia 2013/14 (May 2013 to April 2014) (Ryan et al., 2015) West Australia 2015/16 (September 2015 to August 2016) (Ryan et al., 2017) West Australia 2017/18 In progress
DISCUSSION
Recreational fishing in Commonwealth waters Page | 26
One significant advantage of surveying fishers in Commonwealth waters however is the lack of land based catch so there may be opportunities of using proxy sample frames such as the national database of recreational boat registrations, which could include regional oversampling in areas of interest. Though in experimental work, issues with boat ownership and identification of fishing vs non-fishing trips still made it difficult to use registrations as a proxy (Wise and Fletcher, 2013). Some limited national investment in coordination and capability development and adoption of best practise innovations from across the states to conduct a national survey on a long cycle (i.e. 5 yearly cycle) may be a way forward to align state surveys, while allowing states to continue to innovate. The commencement of a revitalised national survey in 2020/21 would be appropriate, being exactly 20 years from original baseline. For AMPs, if this approach is desired than any Commonwealth investment should be used to influence three areas of interest with the states: 1) lobbying for more extensive licencing, primarily to allow for a robust off-site data frame to be developed that will replace the white pages for broad scale estimates of catch and effort, 2) over-sampling in regional areas with AMPs that may be targeted by the recreational fishery, and 3) the collection of more detailed spatial results, preferable to at least 3 nautical mile blocks.
DISCUSSION
Recreational fishing in Commonwealth waters Page | 27
REFERENCES ABS 2018. Australian Demographic Statistics. Australian Bureau of Statistics. AFMA 2018. Commonwealth southern bluefin tuna catch limit set for 2018 season. AFMA 2019. Gummy Shark In Fisheries Management. Agriculture and Water Resources, D. o. 2018. Commonwealth Fisheries Harvest Strategy
Policy. 21 pp. Aidoo, E. N., Mueller, U., Goovaerts, P., and Hyndes, G. A. 2015. Evaluation of geostatistical
estimators and their applicability to characterise the spatial patterns of recreational fishing catch rates. Fisheries Research, 168: 20-32.
Aidoo, E. N., Mueller, U., Hyndes, G. A., and Ryan, K. L. 2016. The effects of measurement uncertainty on spatial characterisation of recreational fishing catch rates. Fisheries Research, 181: 1-13.
Arlinghaus, R., Tillner, R., and Bork, M. 2015. Explaining participation rates in recreational fishing across industrialised countries. Fisheries Management and Ecology, 22: 45-55.
Brownscombe, J. W., Bower, S. D., Bowden, W., Nowell, L., Midwood, J. D., Johnson, N., and Cooke, S. J. 2014. Canadian Recreational Fisheries: 35 Years of Social, Biological, and Economic Dynamics from a National Survey. Fisheries, 39: 251-260.
Brownscombe, J. W., Danylchuk, A. J., Chapman, J. M., Gutowsky, L. F. G., and Cooke, S. J. 2017. Best practices for catch-and-release recreational fisheries – angling tools and tactics. Fisheries Research, 186: 693-705.
Brownscombe, J. W., Hyder, K., Potts, W., Wilson, K. L., Pope, K. L., Danylchuk, A. J., Cooke, S. J., et al. 2019. The future of recreational fisheries: Advances in science, monitoring, management, and practice. Fisheries Research, 211: 247-255.
Buxton, C. D., and Cochrane, P. 2015. Commonwealth Marine Reserves Review; Report of the Bioregional Advisory Panel. 341 pp.
CALM, M. a. 2005. Management Plan for the Ningaloo Marine Park and Muiron Islands Marine Management Area; 2005-2015. Number 52.
Camp, E. V., Ahrens, R. N. M., Crandall, C., and Lorenzen, K. 2018. Angler travel distances: Implications for spatial approaches to marine recreational fisheries governance. Marine Policy, 87: 263-274.
Campbell, R. A., Pepperell, J. G., and Davis, T. L. O. 2003. Use of charter boat data to infer the annual availability of black marlin, <emph type="2">Makaira indica</emph>, to the recreational fishery off Cairns, Australia. Marine and Freshwater Research, 54: 447-457.
Ciannelli, L., Fauchald, P., Chan, K. S., Agostini, V. N., and Dingsør, G. E. 2008. Spatial fisheries ecology: Recent progress and future prospects. Journal of Marine Systems, 71: 223-236.
Cochran, W. G. 1977. Sampling Techniques. John Wiley & Sons, New York, USA. 428 pp. Department of Fisheries. 2011. Recreational Fishing in Western Australia: Fishing Location
Guide. Perth, Western Australia. 19 pp. Coleman, F. C., Figueira, W. F., Ueland, J. S., and Crowder, L. B. 2004. The Impact of
United States Recreational Fisheries on Marine Fish Populations. Science, 305: 1958-1960.
Collins, J. H. 2008. Marine Tourism in the Kimberley Region of Western Australia. Geographical Research, 46: 111-123.
Cooke, S. J., and Cowx, I. G. 2004. The role of recreational fishing in global fish crises. BioScience, 54: 857-859.
DISCUSSION
Recreational fishing in Commonwealth waters Page | 28
Cooke, S. J., and Philipp, D. P. 2004. Behavior and mortality of caught-and-released bonefish (Albula spp.) in Bahamian waters with implications for a sustainable recreational fishery. Biological Conservation, 118: 599-607.
Crowe, F. M., Longson, I. G., and Joll, L. M. 2013. Development and implementation of allocation arrangements for recreational and commercial fishing sectors in Western Australia. Fisheries Management and Ecology, 20: 201-210.
Day, J. 2008. The need and practice of monitoring, evaluating and adapting marine planning and management—lessons from the Great Barrier Reef. Marine Policy, 32: 823-831.
Emslie, Michael J., Logan, M., Williamson, David H., Ayling, Anthony M., MacNeil, M. A., Ceccarelli, D., Cheal, Alistair J., et al. 2015. Expectations and Outcomes of Reserve Network Performance following Re-zoning of the Great Barrier Reef Marine Park. Current Biology, 25: 983-992.
Evans, K., N.J., B., and Smith, D. C. 2016. Marine environment. Flynn, D. J. H., Lynch, T. P., Barrett, N. S., Wong, L. S. C., Devine, C., and Hughes, D. 2018.
Gigapixel big data movies provide cost-effective seascape scale direct measurements of open-access coastal human use such as recreational fisheries. Ecology and Evolution, 8: 9372-9383.
Ghosn, D. L., Collins, D. P., and Gould, A. 2015. The NSW Game Fish Tournament Monitoring Program 1994 to 2013: A summary of data and assessment of the role and design. . No. 144. 162pp pp.
Giri, K., and Hall, K. 2015. South Australian Recreational Fishing Survey. 62. 63 pp. Green, C., Brown, P., Giri, K., Bell, J., and Conron, S. 2012. Quantifying the recreational
catch of southern bluefin tuna off the Victorian coast. ICES Document R09/10/03. 7 pp.
Griffiths, S., Lynch, T. P., Lyle, J., Wotherspoon, S., Wong, L., Devine, C., Pollock, K., et al. 2017. Trial and validation of Respondent-Driven Sampling as a cost-effective method for obtaining representative catch, effort, social and economic data from recreational fisheries. 145 pp.
Griffiths, S. P., Pollock, K. H., Lyle, J. M., Pepperell, J. G., Tonks, M. L., and Sawynok, W. 2010. Following the chain to elusive anglers. Fish and Fisheries, 11: 220–228.
Henry, G. W., and Lyle, J. M. 2003. National recreational and indigenous fishing survey.
ICES Document Project No. 1999/158. 188 pp. Herfaut, J., Levrel, H., Thébaud, O., and Véron, G. 2013. The nationwide assessment of
marine recreational fishing: A French example. Ocean & Coastal Management, 78: 121-131.
Holdsworth, J. C., Hartill, B. W., Heinemann, A., and Wynne-Jones, J. 2018. Integrated survey methods to estimate harvest by marine recreational fishers in New Zealand. Fisheries Research, 204: 424-432.
Horigue, V., Pressey, R. L., Mills, M., Brotánková, J., Cabral, R., and Andréfouët, S. 2015. Benefits and Challenges of Scaling Up Expansion of Marine Protected Area Networks in the Verde Island Passage, Central Philippines. PLoS ONE, 10: e0135789.
Hyder, K., Weltersbach, M. S., Armstrong, M., Ferter, K., Townhill, B., Ahvonen, A., Arlinghaus, R., et al. 2018. Recreational sea fishing in Europe in a global context—Participation rates, fishing effort, expenditure, and implications for monitoring and assessment. Fish and Fisheries, 19: 225-243.
Ihde, T. F., Wilberg, M. J., Loewensteiner, D. A., Secor, D. H., and Miller, T. J. 2011. The increasing importance of marine recreational fishing in the US: Challenges for management. Fisheries Research, 108: 268-276.
Kearney, R. E. 2001. Fisheries property rights and recreational/commercial conflict: implications of policy developments in Australia and New Zealand. Marine Policy, 25: 49-59.
Kristianson, G. 2018. Lessons in fisheries politics. Fisheries Research, 205: 32-34.
DISCUSSION
Recreational fishing in Commonwealth waters Page | 29
Last, P. R., and Stevens, J. D. 2009. Sharks and rays of Australia,
CSIRO Publishing, Collingwood, Vic. Lewin, W. C., Arlinghaus, R., and Mehner, T. 2006. Documented and potential biological
impacts of recreational fishing: Insights for management and conservation. Reviews in Fisheries Science, 14: 305-367.
Lowry, M., and Murphy, J. 2003. Monitoring the recreational gamefish fishery off south-eastern Australia. Marine and Freshwater Research, 54: 425-434.
Lumley, T. 2010. Complex surveys: a guide to analysis using R, John Wiley & Sons, New Jersey.
Lyle, J. M., Coleman, A. P. M., West, L., Campbell, D., and Henry, G. W. 2002. New large-scale methods for evaluating sport fisheries. In Recreational fisheries: Ecological, economic and social evaluation. Fish and Aquatic Resources Series 8, pp. 207–226. Ed. by T. J. Pitcher, and C. Hollingworth. Blackwell Science, London, UK.
Lyle, J. M., Stark, K. E., and Tracey, S. R. 2014a. 2012-2013 Survey of Recreational Fishing in Tasmania.
Lyle, J. M., Stark, K. E., and Tracey, S. R. 2014b. Survey of recreational fishing in Tasmania. 124 pp.
Lyle, J. M., Wotherspoon, S., and Stark, K. E. 2010. Developing an analytical module for large-scale recreational fishery data based on phone-diary survey methodology.
Lynch, T. P. 2006a. Incorporation of recreational fishing effort into design of marine protected areas. Conservation Biology, 20: 1466-1476.
Lynch, T. P. 2006b. Incorporation of Recreational Fishing Effort into Design of Marine Protected Areas
Incorporación del Esfuerzo de Pesca Recreativa en el Diseño de Áreas Marinas Protegidas. Conservation Biology, 20: 1466-1476.
Lynch, T. P. 2008. The Difference between Spatial and Temporal Variation in Recreational Fisheries for Planning of Marine Protected Areas: Response to Steffe. Conservation Biology, 22: 486-491.
Lynch, T. P. 2014. A decadal time-series of recreational fishing effort collected during and after implementation of a multiple use marine park shows high inter-annual but low spatial variability. Fisheries Research, 151: 85-90.
Lynch, T. P., Harcourt, R., Edgar, G., and Barrett, N. 2013. Conservation of the Critically Endangered Eastern Australian Population of the Grey Nurse Shark (Carcharias taurus) Through Cross-Jurisdictional Management of a Network of Marine-Protected Areas. Environmental Management, 52: 1341-1354.
Lynch, T. P., Morello, E. B., Evans, K., Richardson, A. J., Rochester, W., Steinberg, C. R., Roughan, M., et al. 2014. IMOS National Reference Stations: a continental-wide physical, chemical and biological coastal observing system. PLoS ONE, 9: e113652.
McCluskey, S. M., and Lewison, R. L. 2008. Quantifying fishing effort: a synthesis of current methods and their applications. Fish and Fisheries, 9: 188-200.
McPhee, D., Leadbitter, D., and A. Skilleter, G. 2002. Swallowing the bait: is recreational fishing in Australia ecologically sustainable? Pacific Conservation Biology, 8: 40.
Moore, A., Hall, K., Giri, K., Tracey, S., Penrose, L., Hansen, S., and et. al. 2015. Developing robust and cost-effective methods for estimating the national recreational catch of Southern Bluefin Tuna in Australia. ICES Document 2012/022.20. 123 pp.
Muoneke, M. I., and Childress, W. M. 1994. Hooking mortality: A review for recreational fisheries. Reviews in Fisheries Science, 2: 123-156.
Nevill, J., and Ward, T. 2009. The National Representative System of Marine Protected Areas: Comment on recent progress. Ecological Management & Restoration, 10: 228-231.
DISCUSSION
Recreational fishing in Commonwealth waters Page | 30
Newman, S. J., Brown, J. I., Fairclough, D. V., Wise, B. S., Bellchambers, L. M., Molony, B. W., Lenanton, R. C. J., et al. 2018. A risk assessment and prioritisation approach to the selection of indicator species for the assessment of multi-species, multi-gear, multi-sector fishery resources. Marine Policy, 88: 11-22.
Parks, D. o. N. 2018a. North-west Commonwealth Marine Reserves Network Management Plan 2018
Parks, D. o. N. 2018b. Temperate East Marine Parks Network Management Plan 2018. Productivity Commission. 2016. Marine Fisheries and Aquaculture, Final Report,. 81. 43 pp. R Core Team. 2017. R: A language and environment for statistical computing. R Foundation
for Statistical Computing, Vienna, Austria. https://www.r-project.org/. Rufino, M. M., Stelzenmüller, V., Maynou, F., and Zauke, G. P. 2006. Assessing the
performance of linear geostatistical tools applied to artificial fisheries data. Fisheries Research, 82: 263-279.
Ryan, K. L., Hall, N. G., Lai, E. K., Smallwood, C. B., Taylor, S. M., and Wise, B. S. 2017. Statewide survey of boat-based recreational fishing in Western Australia 2015/16. ICES Document No. 287. 205 pp.
Ryan, K. L., Wise, B. S., Hall, N. G., Pollock, K. H., Sulin, E. H., and Gaughan, D. J. 2013. An integrated system to survey boat-based recreational fishing in Western Australia 2011/12. Perth, Western Australia. 249 pp.
Shertzer, K. W., Bacheler, N. M., Kellison, G. T., Fieberg, J., and Wiggers, R. K. 2018. Release mortality of endangered Warsaw grouper Hyporthodus nigritus: a state-space model applied to capture-recapture data. Endangered Species Research, 35: 15-22.
Short, A. D., and Woodroffe, C. D. 2009. The Coast of Australia, Cambridge University Press, Cambridge.
Skomal, G. B. 2007. Evaluating the physiological and physical consequences of capture on post-release survivorship in large pelagic fishes. Fisheries Management and Ecology, 14: 81-89.
Smallwood, C. B., Beckley, L. E., and Moore, S. A. 2012a. Influence of Zoning and Habitats on the Spatial Distribution of Recreational Activities in a Multiple-Use Marine Park. Coastal Management, 40: 381-400.
Smallwood, C. B., Pollock, K. H., Wise, B. S., Hall, N. G., and Gaughan, D. J. 2012b. Expanding Aerial-Roving Surveys to Include Counts of Shore-Based Recreational Fishers from Remotely Operated Cameras: Benefits, Limitations, and Cost Effectiveness. North American Journal of Fisheries Management, 32: 1265-1276.
Southwick, R., Holdsworth, J. C., Rea, T., Bragg, L., and Allen, T. 2018. Estimating marine recreational fishing’s economic contributions in New Zealand. Fisheries Research, 208: 116-123.
Stelzenmüller, V., Maynou, F., Ehrich, S., and Zauke, G.-P. 2004. Spatial Analysis of Twaite Shad, Alosa fallax (Lacepède, 1803), in the Southern North Sea: Application of Non-Linear Geostatistics as a Tool to Search for Special Areas of Conservation. International Review of Hydrobiology, 89: 337-351.
Teixeira, D., Zischke, M. T., and Webley, J. A. C. 2016. Investigating bias in recreational fishing surveys: Fishers listed in public telephone directories fish similarly to their unlisted counterparts. Fisheries Research, 181: 127-136.
Venerus, L. A., and Cedrola, P. V. 2017. Review of marine recreational fisheries regulations in Argentina. Marine Policy, 81: 202-210.
Webley, J. A. C., McInnes, K., Teixeira, D., Lawson, A., and Quinn, R. 2015. Statewide Recreational Fishing Survey 2013-14. 127 pp.
West, L. D., Stark, K. E., Murphy, J. J., and Lyle, J. M. 2013. Survey of Recreational Fishing in New South Wales and the ACT , 2013 / 14. New South Wales. 150 pp.
Wise, B. S., Telfer, C. F., Lai, E. K. M., Hall, N. G., and Jackson, G. 2012. Long-term monitoring of boat-based recreational fishing in Shark Bay, Western Australia:

DISCUSSION
Recreational fishing in Commonwealth waters Page | 31
providing scientific advice for sustainable management in a World Heritage Area. Marine and Freshwater Research, 63: 1129-1141.
Wood, G., Lynch, T. P., Devine, C., Keller, K., and Figueira, W. 2016. High-resolution photo-mosaic time-series imagery for monitoring human use of an artificial reef. Ecology and Evolution, 6: 6963-6968.
Zischke, M. T., Griffiths, S. P., and Tibbetts, I. R. 2012. Catch and effort from a specialised recreational pelagic sport fishery off eastern Australia. Fisheries Research, 127–128: 61-72.
PART B – INTRODUCTION
Recreational fishing in Commonwealth waters Page | 32
6. PART B – INTRODUCTION A novel application of trail cameras combined with interviews on boat ramps of marine recreational trailer-boat fishers, investigates their behaviours, perceptions and distributions in relation to an offshore Marine Park.
Marine recreational fishers (MRF) are increasingly seen as important stakeholders not only for fisheries but also for the conservation of marine biodiversity (Lynch, 2006; Pawson et al., 2008; Ihde et al., 2011; Smallwood et al., 2011; Productivity Commission, 2016; Monkman et al., 2018). Information needs on recreational fishing have strong overlaps between these two fields; with both Marine Protected Area (MPA) and fisheries managers interested in ensuring worthwhile experiences by fishers, reduction in any cumulative impacts on biodiversity, habitats and ecosystems and also ensuring ecologically sustainable use of natural resources (Director of National Parks, 2013; Mitchell et al., 2018). Both sets of managers also share an interest in effective compliance and communication of not only rules but also the objectives and principles of management (Read et al., 2011). To achieve these diverse management objectives understanding the behaviours and motivations of fishers is important; as fish and habitats are not usually managed, rather it is the behaviours of the people that are regulated (Fulton et al., 2011). The behaviours and motivations of fishers, however, are not well understood (Hunt et al., 2013) and there remains a lack of focus on the critical role human behaviour plays in governance (Jentoft, 2006; Fulton et al., 2011). Unlike self-reporting commercial fisheries, assessments of open access recreational fisheries requires sampling (McCluskey and Lewison, 2008). Depending on objectives and scale this can involve off-site, on-site or complemented survey methods (Pollock et al., 1994; Lyle et al., 2002; Henry and Lyle, 2003; Moore et al., 2015). The choice of method depends on survey objectives and in particular temporal and spatial scales for reporting of data. For large scale assessments offsite methods are often appropriate but where fine spatial scale information or specific activities are require on-site methods may be more useful. For instance fine scale information is often needed for assessment of zoning or management plans for MPA, which are generally sub-regional in size or for niche fisheries (Wise et al., 2012; Lynch, 2014; Taylor et al., 2018). The major limiting factor with on-site sampling is that they require field based interview clerks, which can result in expensive labour costs, especially as fishers often access the fishery outside of standard work hours and hence sampling requires a high proportion of overtime payment (Pollock et al., 1994). It is therefore not surprising that sensor approaches, such as remote photography, is an emerging field in an attempt to automate some aspects of data collection (Parnell et al., 2010; Hartill et al., 2016; Keller et al., 2016; Powers and Anson, 2016). Photographic approaches have offered either continuous or, more commonly, diurnal high-frequency direct monitoring of fishing or indirect measurements via observations of entry by participants to the fishing grounds as they pass access choke points. Often these systems use time‐lapse cameras and various studies have found them to be reliable, efficient and cost‐effective with comparable results to other methods such as aerial data or bus route sampling (Smallwood et al., 2012; Greenberg and Godin, 2015; van Poorten et al., 2015; Flynn et al., 2018; Stahr and Knudsen, 2018). Most commonly, imagery is used as a form of instantaneous count to allow extrapolations to produce estimations of fishing effort or relative effort metrics to determine trends (Hartill et al., 2016; Flynn et al., 2018) though other behavioural uses such as compliance monitoring (Lancaster et al., 2017; Harasti et al., 2019) or differentiation between fisheries sectors and other marine users (Wood et al., 2016) have also been undertaken.
PART B – INTRODUCTION
Recreational fishing in Commonwealth waters Page | 33
One limitation of access point sensor approaches is that they do not easily distinguish between fishers and other activity types of boat users (though see high resolution approaches such as Wood et al., 2016), nor does it give any information on where fishing occurs or the characteristics and perceptions of the fishers. These types of information are best provided by interviews, though due to labour costs the extent of on-site interviews is often limited. When used in conjunction, however, both sensor and interview approaches can provide complimentary information (Flynn et al., 2018). For instance sensors can provide high-frequency and continuous quantitative metrics to describe fisher behaviours (Edwards and Schindler, 2017), such as trends in effort over time and the timings when people enter and leave the fishery. Sensors can also be deployed concurrently to simultaneously record data at many sites (Hartill et al., 2016) with the interviewers moving around the fishery servicing and downloading the sensor data. Interviews can provide in-depth information both for quality assurance of the sensors, such as distinguishing the ratios of fishers to other boat users engaged in non-fishing activities (Flynn et al., 2018) and also for data on their perceptions and reported fishing locations at fine scales. Compared to recreational fisheries research, remote photography is a more well-established method in the much larger ecological and animal behaviour fields and over the last two decades automatically triggered camera traps, which usually take short videos of passing animals, have become one of the most powerful tools for wildlife research (Cutler and Swann, 1999; Rovero et al., 2013; Cusack et al., 2015). For studies of recreational fishers, however, the key feature of trail cameras commonly used by the animal ecologists – namely their ability to use a passive infrared motion sensor to trigger the taking of a short video – has seldom been used. This triggering action allows for longer launches of the gear by reducing power and memory storage demands and also constrains the post processing requirements that can become unwieldy with large continuous imagery datasets (Parnell et al., 2010). Another feature of trail cameras extensively used by ecologists but less so by fisheries scientists is the invisible black infrared LED flash that allows for night time imagery without disturbing the behaviour of the subject. Recently trail cameras have been used for collecting shore based angler use of a remote wild trout fishery (Simpson, 2018), a recreational fishery for crabs (Taylor et al., 2018) and fishers use of urban shore platforms (Smallwood et al., 2012). Crepuscular and nocturnal recreational fishing is important to understand as there can be high levels of night time fisher behaviours, which are often unaccounted for in other on-site fisheries assessments. Besides catch and effort statistics there is a maturing field of fisheries social science which describes fisher characteristics, actions, perceptions and relationships with management (Hunt et al., 2013). For instance prior to establishment of MPAs, attitudes of fishers towards parks can be negative especially as increased levels of restrictiveness are proposed (Salz and Loomis, 2004). However, strong support for more general objectives of marine conservation and fisheries management often occurs (Mangi and Austen, 2008) and, over time, increased acceptance of established MPAs can build significantly (Martin et al., 2016; Navarro et al., 2018). Besides identifying support or disagreements with management objectives, perception studies have also been used to gauge voluntary compliance in MPAs and knowledge by fishers of rules and regulations (Read et al., 2011) and can be an important tool for development of communication and enforcement plans. Since 2007 the Australian government has massively expanded its offshore (outside of state waters ~ 3nm from the coast) marine park estate. The South-east Network, consisting of 14 marine parks was declared in August 2007, although management plans and hence changes on the water did not come into effect until 1 July 2013. In 2012 the other four Networks (i.e.
PART B – INTRODUCTION
Recreational fishing in Commonwealth waters Page | 34
Temperate East, North, North-west and South-west) and Coral Sea Marine Park were declared, although management plans did not come into effect until 1 July 2018. There are now 60 Australian Marine Parks, which cover approximately 3.1 million square kilometres. (Hill et al., 2018). This recent Australian expansion has mirrored international moves expanding the global MPA estate into offshore waters (Watson et al., 2014; Jantke et al., 2018). Following the declaration of the network, there is a need to develop education, compliance and monitoring programs to effectively manage and evaluate the performance of individual parks. These mostly multiple-use parks provide for ecologically sustainable use of the natural resources which includes social uses such as recreational fishing (Director of National Parks, 2013). In some cases, broad-scale recreational fisheries data is available from other sources, such as state-wide off-site assessments, to delineate use at the marine park scale (see Part A). However, at finer-scales - which for MPA managers can often be the scales of interest - spatially explicit information on the MRF, such as preferred access points, rates of use, knowledge of rules and regulations and fishing distributions within the parks zoning schemes is often lacking. In this study we combined two alternative approaches, placement of trail cameras and concurrent on-site interviews of trailer boat fishers who potentially may access a well-established multiple-use offshore AMP. This was conducted as a pilot study to investigate the usefulness of the approach – in particular to see if trail cameras can provide an alternative to established technologies in conjunction with interviews as a form of on-site method that could be applied to other spatially limited areas of interest. As access to offshore fishing grounds require larger vessels we strategically chose four major boat ramps that bracketed the AMP on which to both set up our cameras and conduct our interviews. In this way we integrated data from the two approaches, to investigate MRF behaviour and perceptions of a subset of fishers, while collecting aggregate, high-frequency and continuous data on use from the trail cameras. Our aims were to 1) trial the usefulness of trail cameras to collect novel primary data that can be used in management and 2) to guide collection of on-site interview data for anglers, especially those fishing offshore and 3) trial a new questionnaire for on-site interviews of recreational fishers entering AMPs. Our specific objectives were to a) predict the best times to conduct our interviews based on launches and retrieval of vessels across four ramps that were monitored across a holiday periods and variable weather conditions, b) determine if ‘re-captures’ of boat/car combinations can be made with trail cameras to establish duration of trips and see if this is influenced by ramp and weather and c) determine perceptions and understanding of the AMPs d) investigate small scale spatial distributions of fishers in relation to the FMP.
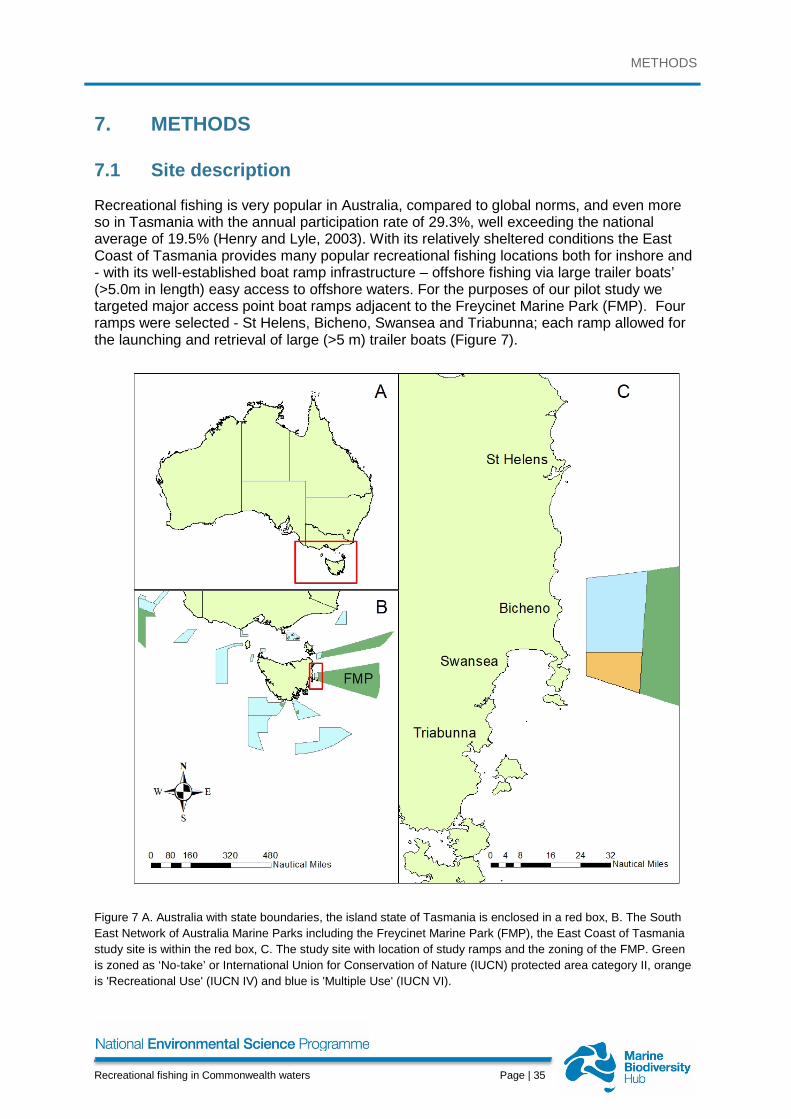
METHODS
Recreational fishing in Commonwealth waters Page | 35
7. METHODS
7.1 Site description
Recreational fishing is very popular in Australia, compared to global norms, and even more so in Tasmania with the annual participation rate of 29.3%, well exceeding the national average of 19.5% (Henry and Lyle, 2003). With its relatively sheltered conditions the East Coast of Tasmania provides many popular recreational fishing locations both for inshore and - with its well-established boat ramp infrastructure – offshore fishing via large trailer boats’ (>5.0m in length) easy access to offshore waters. For the purposes of our pilot study we targeted major access point boat ramps adjacent to the Freycinet Marine Park (FMP). Four ramps were selected - St Helens, Bicheno, Swansea and Triabunna; each ramp allowed for the launching and retrieval of large (>5 m) trailer boats (Figure 7).
Figure 7 A. Australia with state boundaries, the island state of Tasmania is enclosed in a red box, B. The South East Network of Australia Marine Parks including the Freycinet Marine Park (FMP), the East Coast of Tasmania study site is within the red box, C. The study site with location of study ramps and the zoning of the FMP. Green is zoned as ‘No-take’ or International Union for Conservation of Nature (IUCN) protected area category II, orange is 'Recreational Use' (IUCN IV) and blue is 'Multiple Use' (IUCN VI).

METHODS
Recreational fishing in Commonwealth waters Page | 36
The FMP is one of the older and more well-established AMPs. It is one of the 14 marine parks within the South-East Network and was initially declared on 31st August 2007, although management plans did not come into effect until 1 July 2013. Most of the FMP 57,942 km² is zoned as International Union for Conservation of Nature (IUCN) protected area category II (98%), which excludes both commercial and recreational fishing. However a small portion, which is the entire section within 20-25nm of the coast, is zoned as 'Recreational Use' (IUCN IV) (0.6%) and 'Multiple Use' (IUCN VI) (1.4%) both of which allow for recreational fishing.
7.2 Sampling
As this study was a pilot to test a methodological approach only limited general inferences about the marine park use and the overall behaviour of fishers are possible. The study is limited to trailer boats launched from the chosen ramps hence those from any marinas or moorings are not covered and of course any fishing originating from other ramps will also not be included. To maximise data collection we targeted our sampling immediately before and then across the busy Easter holiday period. The Easter long weekend is a traditional heavy fishing period both in Tasmania (Lyle et al., 2014) and elsewhere in Australia (Lynch, 2006; Lynch, 2014), coming towards the end of the southern Austral fishing season. All four sites were monitored over a period of 9 days (26th March to 3rd April 2018) using both trail cameras and face to face interviews by clerks with recreational fishers returning from trailer boat trip. The trail cameras were triggered across entire 24 hours periods by the launching and retrieval of trailer vessels allowed us to assess relative numbers, peak times of ramp use and duration of trips. Simultaneously, during daylight hours, we interviewed a subset of this population of trailer boat users to gauge their activities and for the recreational fishers their reported spatial use, perceptions of fisheries and MPA management. Non-fishing parties and commercial fishers were identified during interviews and counted but were then excluded from interviews. For safety, clerks only worked in pairs during daylight hours when at the boat ramps and their adjacent car parks, though, during busy periods they would simultaneously interview different parties. We used a bus-route type method to schedule interview samples across our four sites, with random sampling without replacement based on site, day type and time period (Pollock et al., 1994). Though we divided day type into weekdays or weekend/public holidays for modelling our camera data we sampled across the total period systematically so did not adjust the sampling probability to reflect expected higher recreational effort during weekends and public holidays (McCluskey & Lewison, 2008). We did, however, stratify the interview sample times into morning (08:00–11:00) and afternoon (12:00–15:00), with equal probabilities of sampling for all sites, day types and time strata. To minimize any temporal autocorrelations, the starting location, time of day shift and travel direction of the route were also randomly selected and we visited two sites each day. Equal sampling weight was provided to each ramp due to lack of prior knowledge of use rates or distribution of fishers.
7.3 Trail cameras
At each of the four boat ramps, a single Tasco trail camera (Model #119237) was swaged with 5mm steel cable onto existing infrastructure and then secured with small Abus titalium padlocks, both through the loops that terminated the swages (lock model #64TI/30) and also the camera case opening (lock model #64TI/20). Each camera was labelled as scientific equipment with a contact phone number. A secondary technical aim was to see if the trail cameras, when secured in this fashion would survive in place, be removed or otherwise vandalised. Cameras were mounted in public areas at choke points on the ramps where any
METHODS
Recreational fishing in Commonwealth waters Page | 37
cars reversing trailers would have to pass the camera well within the maximum Passive Infra-Red (PIR) sensor’s detection zone of 10m. They were placed at a height of 50-130cm off the ground that allowed for a side view of the boat and car; capturing the car’s make, model and colour (during daylight videos); trailer type and number of axles; and vessel type, markings and colour. The cameras’ position did not allow for the recording of vehicle number plates or individual identification of people but did allow, in some cases, for car, trailer and boat combinations to be identified or ‘re-captured’ to determine trip duration. Video recording commenced near instantaneously once the PIR was triggered, with the trail cameras programmed to capture 30 second videos which were time and date stamped. Colour video was available during the day and black and white at night. Following video capture a delay period of 59 seconds between the next motion activation was set so single reversing boats would not repeatedly trigger the sensor. Data was collected onto 32GB SanDisk SDHC cards (the maximum sized card possible with this model of trail camera) across all hours of the day and night. Trail cameras were powered by 4 rechargeable EverReady AA batteries. Both the cards and the batteries were serviced every two days in conjunction with the interview schedule. Data was analysed using the statistical computing package R (R Core Team, 2017) to investigate both the duration of trips and the distribution of times for both launches and recoveries at each ramp. For duration data, where possible, matched pairs of boat, trailer and cars were identified each 24 hour period and the time between deployment and recovery calculated. For the distribution of all launches and recoveries, the number of each category were summed for each hour of the day. Based on data downloaded from the Australian Bureau of Meteorology, which operates weather stations close to each of the sites, we developed a simple boating weather model. This ranked boating conditions, based on wind speeds, as good (0-10km/hr), fair (10-20km/hr) and poor (>20km/hr) for both the AM and PM strata. Using the duration data we modelled re-captured boats against site, day type and weather using a generalised linear model (GLM) based on the Gamma distribution. For the deployment and recovery timings we used a point process model based on the Poisson distribution to model summed numbers of boats per hour being deployed or recovered against site, day type and weather.
7.4 Interviews
Clerks spent 3 hours at each site awaiting the return of recreational fishers from boat trips so as to conduct face to face, on-site interviews. All interviews took place in the boat ramp carpark after the vessel had been pulled out of the water. We attempted to initiate interviews with all parties when they were retrieving vessels during the wait period, though if both clerks were interviewing and more vessels returned we did not approach skippers from these vessels and ask them to wait. Following identification that we were from CSIRO (all interviewers were CSIRO associates) one of our first questions was to ask the activity of the boat user, if they were not recreationally fishing we noted their activity but then indicated that we were focused onto recreational fisheries and politely terminated the interview. We provided interviewees with an outline of the project (Appendix A). The survey questionnaire (Appendix B) included general questions on target species and catch for the present trip. We then asked questions about motivations for fishing and their understanding of the AMP. We also gauged their satisfaction with management of local recreational fishing and the fisher’s attitudes towards the general bio-diversity and other functions of AMPs.
METHODS
Recreational fishing in Commonwealth waters Page | 38
In addition, information on small-scale spatial patterns of use were also collected. While point data was identified as ideal, due to concerns over the potential reluctance of fishers to divulge the precise locations of their favourite fishing sites the scale of spatial resolution required was set at a 5nm grid. This scale worked well when overlaid onto maps to both resolve the AMP zoning plan and also in relation to key features such as coastal landmarks and bathymetry such as the continental shelf. Fishers were presented with A3 gridded maps and asked to plot both the locations of the days fishing and also grid squares that they had fished over the past 3 months. These marks were considered as presence absence data (0,1) of fished/not fished and then summed per grid square and then colour co-ordinated based on the interview ramp. We also combined all data to generate a heat map of the distribution of fishing. While our figures show the location of the FMP zoning in the South-East Network Management Plan, for data collection from fishers we did not include this on our field maps.
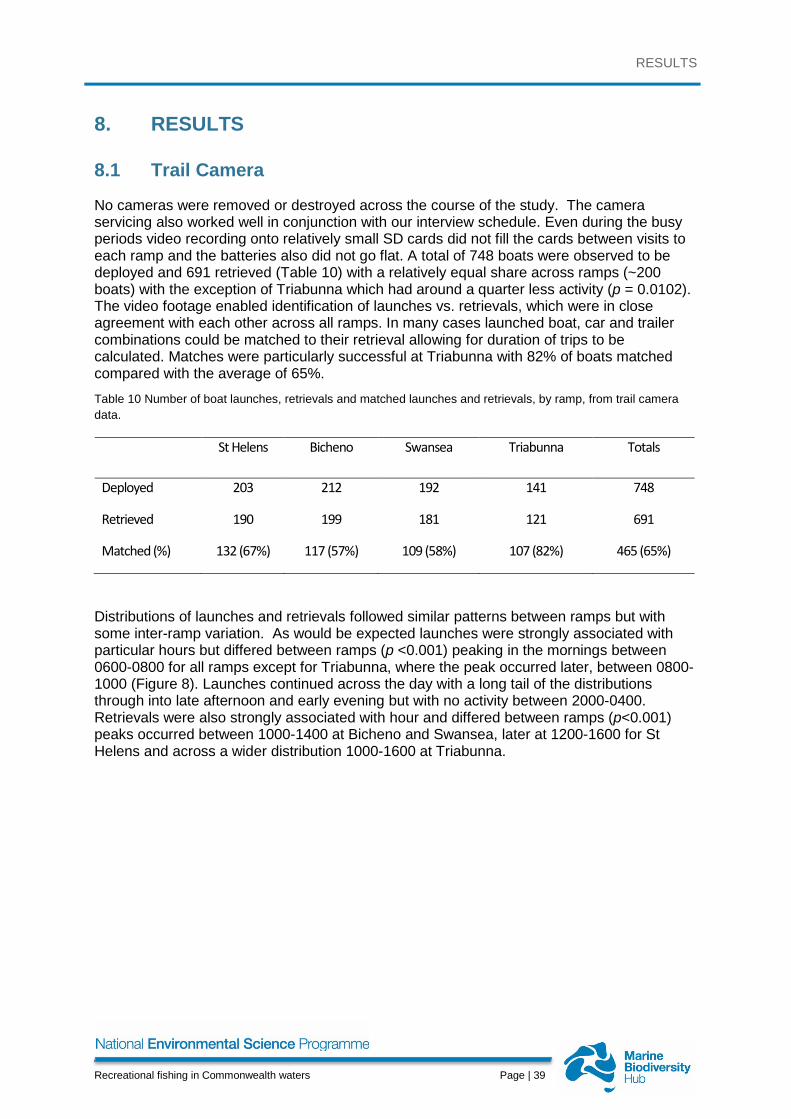
RESULTS
Recreational fishing in Commonwealth waters Page | 39
8. RESULTS
8.1 Trail Camera
No cameras were removed or destroyed across the course of the study. The camera servicing also worked well in conjunction with our interview schedule. Even during the busy periods video recording onto relatively small SD cards did not fill the cards between visits to each ramp and the batteries also did not go flat. A total of 748 boats were observed to be deployed and 691 retrieved (Table 10) with a relatively equal share across ramps (~200 boats) with the exception of Triabunna which had around a quarter less activity (p = 0.0102). The video footage enabled identification of launches vs. retrievals, which were in close agreement with each other across all ramps. In many cases launched boat, car and trailer combinations could be matched to their retrieval allowing for duration of trips to be calculated. Matches were particularly successful at Triabunna with 82% of boats matched compared with the average of 65%. Table 10 Number of boat launches, retrievals and matched launches and retrievals, by ramp, from trail camera data.
St Helens Bicheno Swansea Triabunna Totals
Deployed 203 212 192 141 748
Retrieved 190 199 181 121 691
Matched (%) 132 (67%) 117 (57%) 109 (58%) 107 (82%) 465 (65%)
Distributions of launches and retrievals followed similar patterns between ramps but with some inter-ramp variation. As would be expected launches were strongly associated with particular hours but differed between ramps (p <0.001) peaking in the mornings between 0600-0800 for all ramps except for Triabunna, where the peak occurred later, between 0800-1000 (Figure 8). Launches continued across the day with a long tail of the distributions through into late afternoon and early evening but with no activity between 2000-0400. Retrievals were also strongly associated with hour and differed between ramps (p<0.001) peaks occurred between 1000-1400 at Bicheno and Swansea, later at 1200-1600 for St Helens and across a wider distribution 1000-1600 at Triabunna.
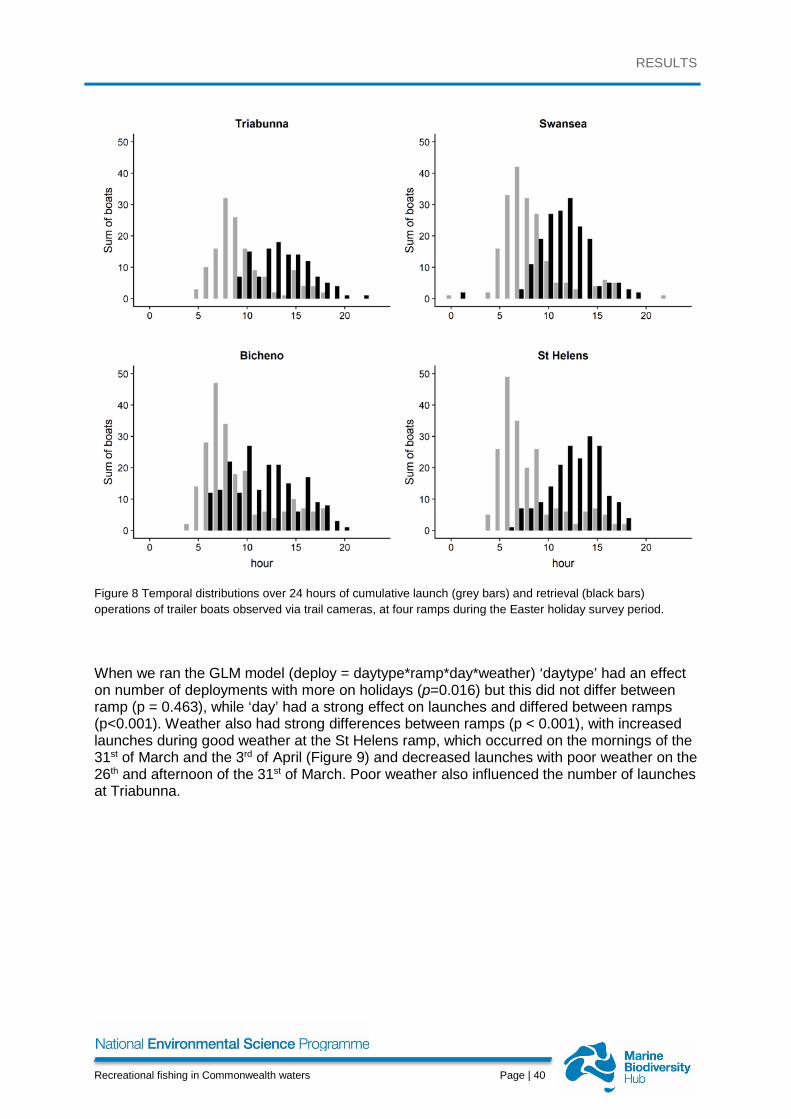
RESULTS
Recreational fishing in Commonwealth waters Page | 40
Figure 8 Temporal distributions over 24 hours of cumulative launch (grey bars) and retrieval (black bars) operations of trailer boats observed via trail cameras, at four ramps during the Easter holiday survey period.
When we ran the GLM model (deploy = daytype*ramp*day*weather) ‘daytype’ had an effect on number of deployments with more on holidays (p=0.016) but this did not differ between ramp (p = 0.463), while ‘day’ had a strong effect on launches and differed between ramps (p<0.001). Weather also had strong differences between ramps (p < 0.001), with increased launches during good weather at the St Helens ramp, which occurred on the mornings of the 31st of March and the 3rd of April (Figure 9) and decreased launches with poor weather on the 26th and afternoon of the 31st of March. Poor weather also influenced the number of launches at Triabunna.

RESULTS
Recreational fishing in Commonwealth waters Page | 41
Figure 9 Time of launch and retrieval as identified by ramp cameras. For matched boats (green squares), only launch time within the day is reported, and duration of trip (minutes) on the y axis. No data is available for Triabunna and St Helens for 3/4, as cameras were retrieved previous day.
Durations of trips also differed between ramps (p < 0.001) with Bicheno having the shortest average trips of 153 minutes (+/-13), then Swansea with 225 mins (+/- 11), then Triabunna 243 mins (+/- 14) and St Helens was the longest average durations with 269 mins (+/- 15.6) (Figure 10). Day type did not explain duration of trip (p = 0.313) or any interactions (p =0.263) but good weather resulted in longer durations trips (p<0.001) as did day (p=0.004) and when we looked at this in relation to ramp duration of trips were longer out of St Helens in good weather (p < 0.001).
020
040
060
080
0du
ratio
n (m
ins)
27/3 28/3 29/3 30/3 31/3 1/4 2/4 3/4
Triabunna
020
040
060
0
27/3 28/3 29/3 30/3 31/3 1/4 2/4 3/4
Swansea0
200
400
600
800
dura
tion
(min
s)
27/3 28/3 29/3 30/3 31/3 1/4 2/4 3/4
St Helens
020
040
060
080
0
27/3 28/3 29/3 30/3 31/3 1/4 2/4 3/4
Bicheno
matched retrieved deployed
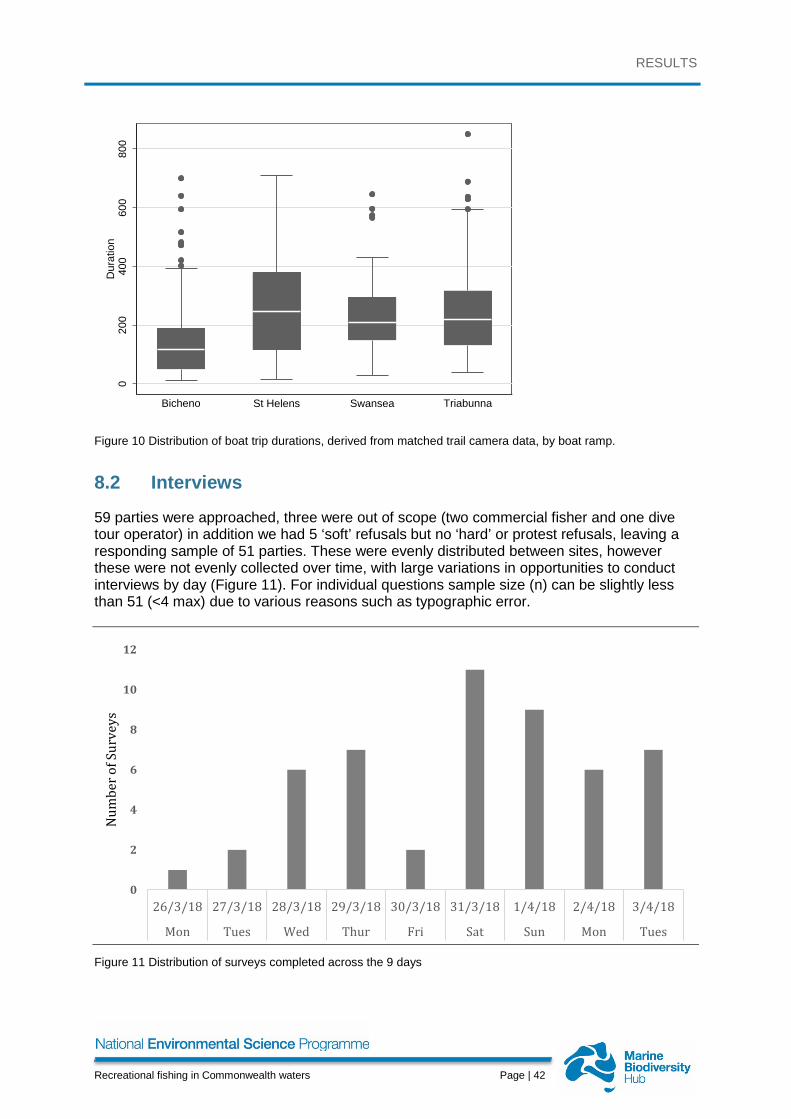
RESULTS
Recreational fishing in Commonwealth waters Page | 42
Figure 10 Distribution of boat trip durations, derived from matched trail camera data, by boat ramp.
8.2 Interviews
59 parties were approached, three were out of scope (two commercial fisher and one dive tour operator) in addition we had 5 ‘soft’ refusals but no ‘hard’ or protest refusals, leaving a responding sample of 51 parties. These were evenly distributed between sites, however these were not evenly collected over time, with large variations in opportunities to conduct interviews by day (Figure 11). For individual questions sample size (n) can be slightly less than 51 (<4 max) due to various reasons such as typographic error.
Figure 11 Distribution of surveys completed across the 9 days
020
040
060
080
0D
urat
ion
Bicheno St Helens Swansea Triabunna
0
2
4
6
8
10
12
26/3/18 27/3/18 28/3/18 29/3/18 30/3/18 31/3/18 1/4/18 2/4/18 3/4/18
Mon Tues Wed Thur Fri Sat Sun Mon Tues
Num
ber o
f Sur
veys
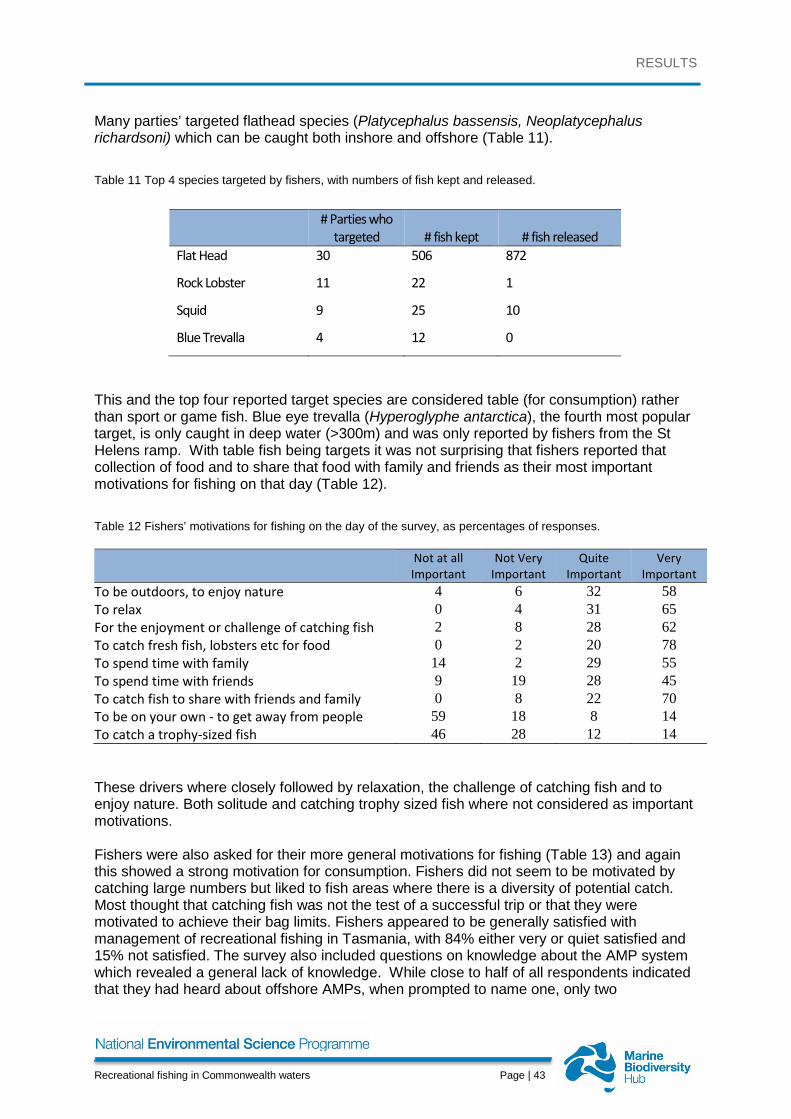
RESULTS
Recreational fishing in Commonwealth waters Page | 43
Many parties’ targeted flathead species (Platycephalus bassensis, Neoplatycephalus richardsoni) which can be caught both inshore and offshore (Table 11). Table 11 Top 4 species targeted by fishers, with numbers of fish kept and released.
This and the top four reported target species are considered table (for consumption) rather than sport or game fish. Blue eye trevalla (Hyperoglyphe antarctica), the fourth most popular target, is only caught in deep water (>300m) and was only reported by fishers from the St Helens ramp. With table fish being targets it was not surprising that fishers reported that collection of food and to share that food with family and friends as their most important motivations for fishing on that day (Table 12). Table 12 Fishers’ motivations for fishing on the day of the survey, as percentages of responses.
Not at all Important
Not Very Important
Quite Important
Very Important
To be outdoors, to enjoy nature 4 6 32 58 To relax 0 4 31 65 For the enjoyment or challenge of catching fish 2 8 28 62 To catch fresh fish, lobsters etc for food 0 2 20 78 To spend time with family 14 2 29 55 To spend time with friends 9 19 28 45 To catch fish to share with friends and family 0 8 22 70 To be on your own - to get away from people 59 18 8 14 To catch a trophy-sized fish 46 28 12 14
These drivers where closely followed by relaxation, the challenge of catching fish and to enjoy nature. Both solitude and catching trophy sized fish where not considered as important motivations. Fishers were also asked for their more general motivations for fishing (Table 13) and again this showed a strong motivation for consumption. Fishers did not seem to be motivated by catching large numbers but liked to fish areas where there is a diversity of potential catch. Most thought that catching fish was not the test of a successful trip or that they were motivated to achieve their bag limits. Fishers appeared to be generally satisfied with management of recreational fishing in Tasmania, with 84% either very or quiet satisfied and 15% not satisfied. The survey also included questions on knowledge about the AMP system which revealed a general lack of knowledge. While close to half of all respondents indicated that they had heard about offshore AMPs, when prompted to name one, only two
# Parties who
targeted # fish kept # fish released Flat Head 30 506 872
Rock Lobster 11 22 1
Squid 9 25 10
Blue Trevalla 4 12 0
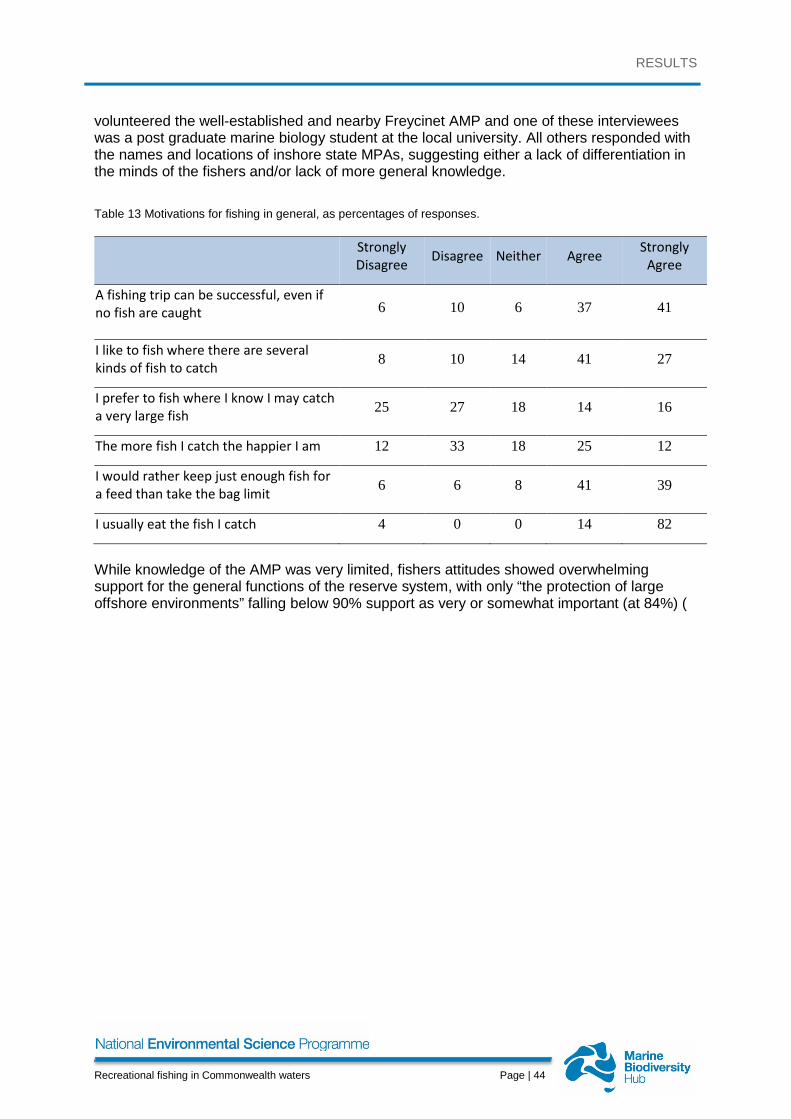
RESULTS
Recreational fishing in Commonwealth waters Page | 44
volunteered the well-established and nearby Freycinet AMP and one of these interviewees was a post graduate marine biology student at the local university. All others responded with the names and locations of inshore state MPAs, suggesting either a lack of differentiation in the minds of the fishers and/or lack of more general knowledge. Table 13 Motivations for fishing in general, as percentages of responses.
Strongly Disagree Disagree Neither Agree Strongly
Agree
A fishing trip can be successful, even if no fish are caught
6 10 6 37 41
I like to fish where there are several kinds of fish to catch 8 10 14 41 27
I prefer to fish where I know I may catch a very large fish 25 27 18 14 16
The more fish I catch the happier I am 12 33 18 25 12
I would rather keep just enough fish for a feed than take the bag limit 6 6 8 41 39
I usually eat the fish I catch 4 0 0 14 82
While knowledge of the AMP was very limited, fishers attitudes showed overwhelming support for the general functions of the reserve system, with only “the protection of large offshore environments” falling below 90% support as very or somewhat important (at 84%) (

RESULTS
Recreational fishing in Commonwealth waters Page | 45
Table 14).
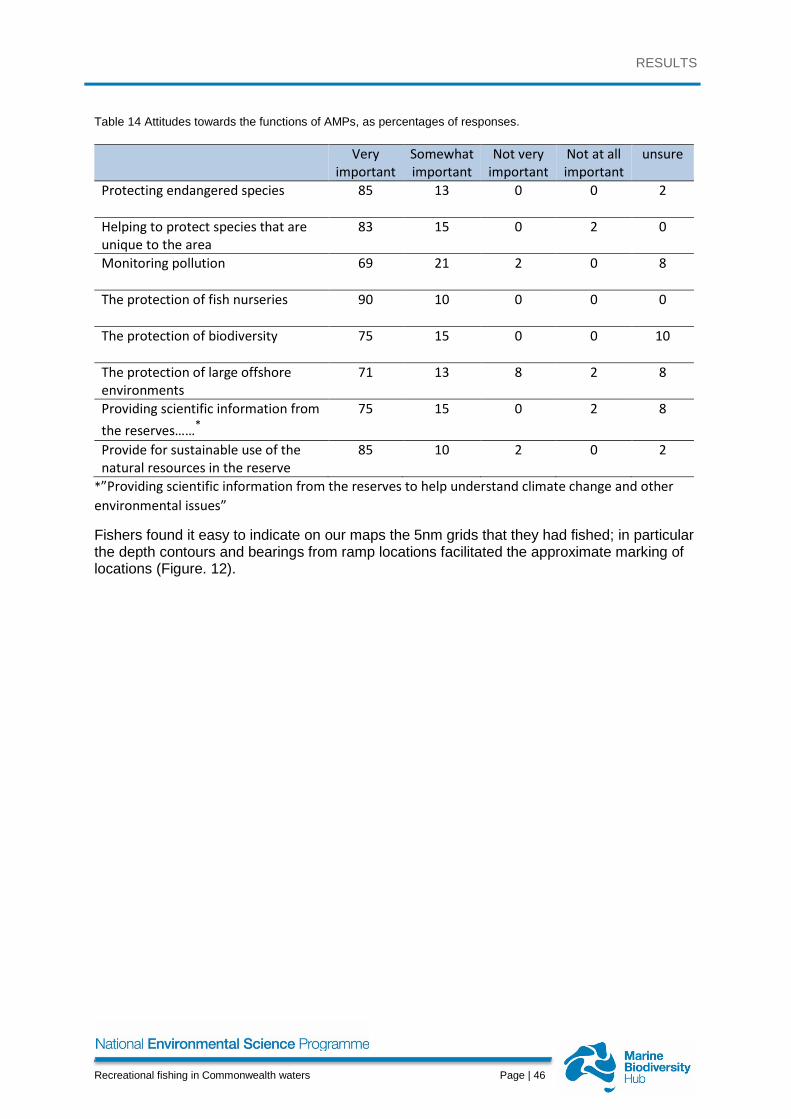
RESULTS
Recreational fishing in Commonwealth waters Page | 46
Table 14 Attitudes towards the functions of AMPs, as percentages of responses.
Very important
Somewhat important
Not very important
Not at all important
unsure
Protecting endangered species
85 13 0 0 2
Helping to protect species that are unique to the area
83 15 0 2 0
Monitoring pollution
69 21 2 0 8
The protection of fish nurseries
90 10 0 0 0
The protection of biodiversity
75 15 0 0 10
The protection of large offshore environments
71 13 8 2 8
Providing scientific information from the reserves……*
75 15 0 2 8
Provide for sustainable use of the natural resources in the reserve
85 10 2 0 2
*”Providing scientific information from the reserves to help understand climate change and other environmental issues”
Fishers found it easy to indicate on our maps the 5nm grids that they had fished; in particular the depth contours and bearings from ramp locations facilitated the approximate marking of locations (Figure. 12).
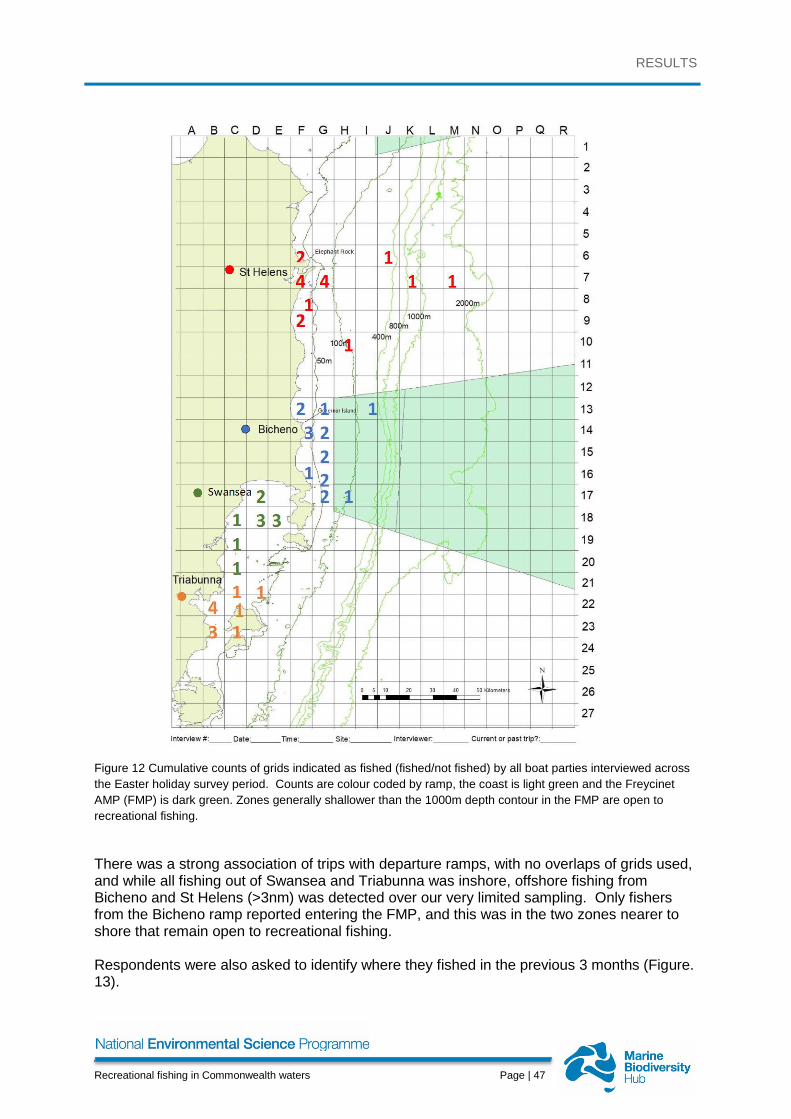
RESULTS
Recreational fishing in Commonwealth waters Page | 47
Figure 12 Cumulative counts of grids indicated as fished (fished/not fished) by all boat parties interviewed across the Easter holiday survey period. Counts are colour coded by ramp, the coast is light green and the Freycinet AMP (FMP) is dark green. Zones generally shallower than the 1000m depth contour in the FMP are open to recreational fishing.
There was a strong association of trips with departure ramps, with no overlaps of grids used, and while all fishing out of Swansea and Triabunna was inshore, offshore fishing from Bicheno and St Helens (>3nm) was detected over our very limited sampling. Only fishers from the Bicheno ramp reported entering the FMP, and this was in the two zones nearer to shore that remain open to recreational fishing. Respondents were also asked to identify where they fished in the previous 3 months (Figure. 13).
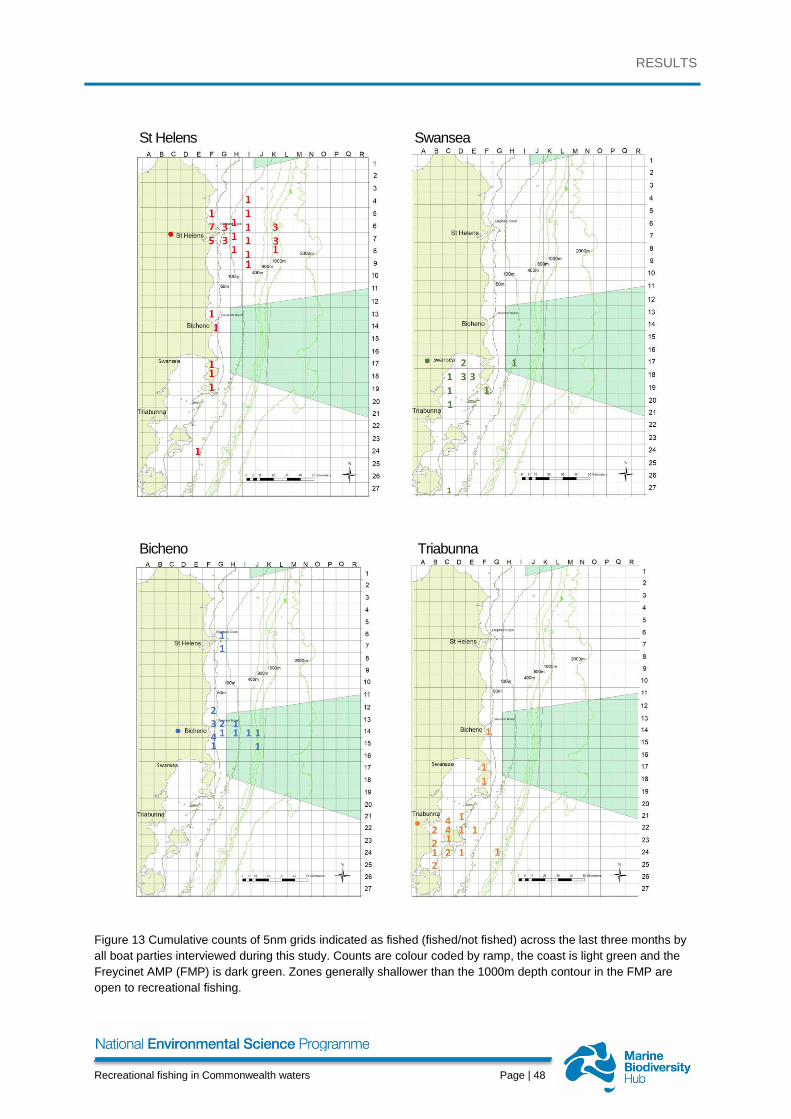
RESULTS
Recreational fishing in Commonwealth waters Page | 48
St Helens
Swansea
Bicheno
Triabunna
Figure 13 Cumulative counts of 5nm grids indicated as fished (fished/not fished) across the last three months by all boat parties interviewed during this study. Counts are colour coded by ramp, the coast is light green and the Freycinet AMP (FMP) is dark green. Zones generally shallower than the 1000m depth contour in the FMP are open to recreational fishing.

RESULTS
Recreational fishing in Commonwealth waters Page | 49
Fishers were mainly accessing waters over the previous three months immediately adjacent to the ramp that they were interviewed on – suggesting strong affinity to particular ramps and close by fishing grounds. Again both Bicheno and St Helens launching fishers indicated that they have fished offshore locations, including again in the areas open to recreational fishing in the FMP. With a longer period to draw upon, fishers from Swansea and Triabunna also indicated that they fished offshore. When all spatial data was combined hot spots of activity occurred in the 5nm grids closest to all ramps with the exception of Swansea, which had a hotspot on the far side of the sheltered bay across from the ramp. Fishing effort was also widely spread both along the entire coastline, with only 2 x 5nm blocks reported as unfished by respondents. Fishing was also reported to have occurred in grid blocks as far as 30nm out to sea (Figure. 14).
Figure 14 Cumulative counts by 5nm of grids indicated as fished (fished/not fished) by boat parties for all data collected (interview day + use of previous 3 months). Grids are colour coded with those grids used most often coloured red and those the least coloured dark green. The Freycinet AMP (FMP) is outlined in dark green. Zones generally shallower than the 1000m depth contour, in light green, in the FMP are open to recreational fishing.
DISCUSSION
Recreational fishing in Commonwealth waters Page | 50
9. DISCUSSION Inter-disciplinary research is often cited as important to further scientific knowledge, however methods development can be difficult due to increasing complexity and professional boundaries (Hunt et al., 2013). In our study we worked across both the natural and social science (Jentoft, 2006) as well as the fisheries and MPAs interdisciplinary boundaries to better understand the behaviours, motivations, perceptions and small scale spatial distributions of marine recreational fishers. We did this by pursuing two avenues of on-site enquiry: a) high frequency, fisher independent and continuous sensor measurements of activity at ramp access points using a novel application of trail cameras and b) self-reporting and perception statements by fishers via interviews. Our interview work showed that nearly all trailer boat operators (>95%) retrieving vessels were recreational fishers, suggesting that the camera data is also predominately of MRFs. Although this is only a pilot study, and limited inference can be made, our innovative approach of using trail cameras in conjunction with on-site interviews produced results that may be of interest not only to MPA practitioners but also for the efficient targeting of on-site sampling for fisheries management (Griffiths et al., 2010; Zischke et al., 2012). The patterns of boat retrievals suggest that our interview survey timing was poorly organised to best intercept fishers. Our seven hour sample day was originally organised with three hour blocks in the morning (08:00–11:00), an hour of travel time and another three hour block in the afternoon (12:00–15:00), with equal probabilities of sampling for all sites, day types and time strata. This meant that each day we were travelling during the peak of returns for Swansea and Triabunna and near the peaks for Bicheno and St Helens. We could have better organised around a) having a heavily weighted 4 hour block from 1200-1600 (St Helens) 1100-1500 at Triabunna and Swansea and 1000-1400 at Bicheno. Travel time would occur outside these hours with less weighted 2 hour blocks either pre 1000-1200 or post 1400-1600, with the precise start time for interviews dependent on the ramp location. Describing the average recreational fisher from a region can help us understand and account for diversity in fisher populations and their behaviours. To do this often involves attempts to understand the heterogeneity among the fisher populations by developing concepts and theories to identify distinct types of fishers who share certain attitudes and behaviours (Loomis and Choi, 1992). While one way to do this is through interviews, higher frequency data is available through a sensor type approach which can provide complimentary behavioural metrics such as launch and retrieval times and matched observations to determine fishing trip durations. Our trail camera data produced close to 1500 observations of launches and retrievals, with approximately 200 samples at each ramp for most metrics and over 100 for all metrics. This allowed us to conduct statistical modelling of dependent variables of fisher’s behaviour such as time of launch and retrieval against independent factors such as ramp, time and weather. Triggered camera traps are similar conceptually to traffic counter approaches for the continuous and efficient recording of boat movements on ramps (van Poorten and Brydle, 2018). Compared to more established close circuit television (CCTV) approaches trail cameras avoid the common restriction of only being functional during daylight hours (without supplementary lighting), which can lead to large underestimates of total fishing effort and catch (Taylor et al., 2018). When the triggered system is also used they limit data processing costs as only events of interest are recorded. They are also cheap (<$250AUS each) so multiple sites can be instrumented. The trail cameras can also be deployed quickly with no impact on existing infrastructure and at least across our study sites, the swaging and padlock security prevented loss of gear. An added data possibility with trail cameras compared to

DISCUSSION
Recreational fishing in Commonwealth waters Page | 51
traffic counters are ‘recaptures’ or matched samples that provide an additional metric of trip duration. Comparisons between continuous and supplementary illuminated video footage and trail camera data would be useful to confirm the launch and retrieval events are not missed by the trail cameras. However our deployment of cameras at ramp entrances appeared to work well with close agreement between numbers of launches and retrievals for all ramps. We suspect that the differences in matching, with more matches at Triabunna compared to other ramps, was due to our relative inexperience in optimally setting up trail cameras to detect trailer boat launches and retrievals. At Triabunna our placement provided the best and clearest view of boats at a point where they were travelling slowly off the ramp. Also, slightly less retrievals were observed than launches, this may be due to cars travelling more quickly when moving off the ramp than when reversing down the ramp. Better consideration of this type of field craft would benefit future deployment of trail cameras on boat ramps. Though widely used in ecological research, there is fragmented information on the fundamentals of sampling designs that deploy camera trapping, such as number of sampling sites, spatial arrangement and sampling duration (Rovero et al., 2013). In particular many ecological camera trap studies ignore expected biases in species detection arising from sampling only a limited set of potential habitat features (Cusack et al., 2015). However, biases in detection of large trailer-boats or under-coverage may be limited due to the small number of suitable ramps to launch these vessels within close proximity to fishing grounds. This limitation of suitable launching ‘habitat’ results in known bottlenecks with extensive queuing common at popular ramps (Flynn et al., 2018). It is interesting to note that one ‘gap’ in reported fishing occurred between the most widely spaced ramps (Figure. 8), this may be a coverage gap with boats accessing this area from non-instrumented ramps. Determining the best times to expend expensive labour for onsite interviews was one of the aims of the work. In this fishery, early morning departures were common and returns were compressed into a relatively small window of time, though this differed between ramps. Based on the preliminary trail camera data a more efficient interview sampling strategy would have been to stratify based on peak times of retrievals by ramp. This would involve increasing the probability of sampling between 1000-1400 at Bicheno, Swansea and Triabunna, and 1200-1600 at St Helens. Lower sampling effort could then be assigned to each tail of the observed temporal distribution of retrievals to account for any unknown auto-correlations with the avidity, target species, perceptions, motivations or catch per unit effort (CPUE) of fishers related to launch times, trip durations and retrievals of boats. If the aim of the on-site interviews was to intercept fishers prior to departure, to undertake licence checks or communication of regulations, for example, all ramps would be best targeted for clerk shifts between 0600-1000. Although our data was limited both spatially and temporally, and should not be seen as definitive, the relatively large sample sizes from the trail cameras allowed for analysis to reveal a range of differing behaviours and potential types of fishers. For instance Triabunna was relatively less used than the other ramps and the higher sensitivity of boat launches to weather at St Helens both for both poor and good conditions and the long duration of trips suggest a ramp where many fishers target offshore species. Weather may also influence the most efficient time for conducting interviews. The inter-daily distribution of when on-site interviews where completed showed a low level of responses on Friday 30th March, which though a public holiday also had poor weather in the afternoon. While there was still many trips on that day the durations of the trips was shorter, this meant that when the interviewers arrived at the boat ramp most of the recreational fishers had already retrieved their vessels. Having flexibility within the clerks scheduling to shift interview times earlier, based on weather prediction or observation, may also be a design consideration for the future.
DISCUSSION
Recreational fishing in Commonwealth waters Page | 52
Although the trail camera data gives a comprehensive evaluation of activity at the boat ramp, the real power of the approach is when it is combined with on-site interviews. Not only does this allow the modelled statistical insights to be cross-checked against observations (such as activity type) but also additional data, that sensors cannot revel, such as perception, motivation, target species, catch and recollection of trip spatial distributions of fishing effort can also be collected. Interviews in any larger study could also be used to turn vessel movement data collected by the sensors into a measure of fishing effort by accounting for non-fishing vessels (Hartill et al., 2016). Self-reporting both from off-site and on-site surveys are common in MRF research (Herfaut et al., 2013; Rocklin et al., 2014) While on-site surveys are more expensive per interview than off-site surveys they tend to have low levels of ‘soft refusals’ (Hartill et al., 2012), as we found with our interviewees, or recollection bias (Roach et al., 1999; Ditton and Hunt, 2001). From analysis of our camera data it is likely that we interviewed people from less than 7% of all trailer boats accessing the study ramps across the study period. Although we only had a relatively small sample for motivation and perceptions of fishers, within this sample there was limited heterogeneity in the range of responses to key motivation and attitudinal responses. Our interview data, due to the limited sample size should be viewed as exploratory but at the most fundamental level, east coast fishers are primarily motivated to harvest fish for consumption and to share their catch with friends and family and then by relaxation and enjoyment of nature. There was also strong agreement that fishing could be satisfying regardless of whether any fish were caught. Sports motivations, such as capture of trophy sized fish and reaching bag limits are not a prime consideration. These results are similar to those found in other larger perspective studies of the Tasmanian fishery (Frijlink and Lyle, 2010; Lyle et al., 2014) though the consumption versus relaxation motivations are reversed in their ranking. It is interesting to note the qualitative observation that the minority that took a contrary view and wished to achieve their bag limits were all targeting rock lobsters, where bag limits are small (2 per person per day) following a recent reduction. Fishers interviewed on the east coast of Tasmania had little knowledge of the presence of the long established offshore FMP, though around half were aware of the inshore state MPAs. They did, however, strongly support both MPA functions and had a positive view of fisheries management. This limited knowledge concerning existing AMPs, but support for wider use of such protections occurs in other places (Christie et al., 2018). Also, similar to other studies (Mangi and Austen, 2008) fishers supported fisheries management goals as an important consideration for MPAs, even though Australian MPAs, like many in the developed world, are designed specifically for biodiversity conservation. One reason for lack of knowledge could be that there were no functional restrictions on use of the FMP by recreational fishers. Though we did not place the FMP zoning map onto field survey paperwork no fishers indicated that they had fished in the “no-take” zone or even outside of the park in similar habitats to those reserved within the park. Deeper water targeted species, such as blue eye are more likely to be found in the shelf and slope waters and fishers targeted this specific bathymetry between 400-1000m. However, this bathymetry remain open to fishing, with no-take zones only starting in the abyssal plains deeper than 1000m. Avoidance of fished areas is a common planning strategy in MPA design (Lynch, 2006; Lynch, 2008; Devillers et al., 2015), where recreational fisher engagement in MPA planning processes is often sought to maximize voluntary compliance and manageability (Read et al., 2011).
DISCUSSION
Recreational fishing in Commonwealth waters Page | 53
The intensity of recreational fishing effort can be variable over multiple time scales, however, once the fishery is established the patterns of spatial distribution can become predictable (Lynch 2006; 2008; Lynch 2014; Wise and others 2012). Understanding small scale spatial use is of particular interest to managers of MPAs for reasons of communication, compliance and performance of zones. Recreational fishing was widespread across the inshore coast, particularly near access points, which corresponds to fisheries independent studies of declines in targeted fish size and abundance nearer to access (Stuart-Smith et al., 2008). For our four targeted species; those fishers who were seeking southern rock lobster (Jasus edwardsii), which include divers and potters (traps) the target was coastal reefs; flathead fishers target both demersal soft sediment inshore/coastal waters (< 50 m) for one species (Platycephalus bassensis) and deeper on-shelf waters (50-150m) for the other (Neoplatycephalus richardsoni), while offshore (demersal) fishers target deepwater shelf edge/break (<300m) for striped trumpeter (Latris lineata) and slope (400m +) for blue eye trevalla (Hyperoglyphe antarctica). Nearly all offshore fishing was occurring adjacent to the St Helens and Bicheno ramps, both on the day of survey and from fisher’s recollections of their previous 3 month fishing season. Interestingly Bicheno, had the shortest average trip duration of any ramp but also the largest number of long duration outliers. From the interview data this ramp had the most heterogeneous activities by fishers with lobster fishers, flathead and offshore fishers. While those launching from the Swansea and Triabunna were mostly inshore flathead fishers. With the exception of one party at the Swansea ramp, who indicated that they targeted the FMP earlier in the season, all reported activity in the park originated from fishers interviewed at the Bicheno ramp. This general trend was common across each ramp with fishers appearing to be habituated to particular fishing grounds over the last season. This preliminary data suggests the hypothesis that most trailer boats accessing the FMP originate from one ramp and these are a particular group of fishers who have very limited cross-over with fishers using other ramps. This observation requires further sampling and more specific questioning to better generalise and understand fisher decision making about where and what to fish. Strong habitual choice for ramp and fishing grounds has implications for any management consultation i.e. habituation suggests fishers view ramps as imperfect substitutes, and hence any change to closely associated MPA rules will be limited in impact to a sub-set of individuals within the regional recreational fishery. The number of fishers interviewed who accessed the offshore areas across the survey period was relatively small compared to those fishing inshore which is consistent with larger scale surveys (Lyle et al., 2014). However the large indicative numbers of launches detected also provide context on the population size of MRF from which we drew our interviews. We interviewed a small percentage of the total population over a short sampling period but we still encountered those engaged in offshore fishing. Adding recollections from the season provided a simple method to maximise our understanding of spatial use and in combination with the sensor data suggest offshore fishing is not an unusual activity but is heavily influenced by weather the hour of the day and appears to be concentrated to certain ramps. Concentrations and predictability of fisher’s response to these factors reduces the complexity of any future designs for on-site sampling of this niche fishery both for MPA and fisheries practitioners. With only limited data from our pilot study to feed our models some factors such as “day” and “day type” will be temporally confounded and we view these results with caution. However the many strong main effects and interactions between the dependent (launch, retrieval and duration) factors and the independent (weather, ramp and time) factors suggest that like other fisheries (Fulton et al., 2011) many aspects of trailer-boat MRF behaviour are predictable. Understanding these patterns may allow for fisheries independent identification
DISCUSSION
Recreational fishing in Commonwealth waters Page | 54
of ramps where fishers are targeting offshore, inshore or a mixture of species. More widespread spatial and temporal replication would be of interest to test the generalities of our results. For instance: a) would seasonality in fish lifecycles (Tracey et al., 2007) influence fisher behaviour through switches in targeting and b) would surveys adjacent to other more recently established AMPs in different states, with more recent establishment dates provide the same perception results (Navarro et al., 2018). In combination our sensor metrics and on-site interviews approach provided complimentary data. The low cost of trail camera sensors means loss of gear is not crippling, multiple sensors can be bought and deployed simultaneously and as it is a triggered system, post processing is reduced. Using trail cameras may also be a way to easily schedule efficient and representative on-site interview surveys without the expense of more complex video and traffic counter technology. Further experimental work, such as comparing different delay times before triggers, camera locations based on vehicle velocities on the ramp and in comparison to continuous video would build confidence in this promising novel application of trail cameras for MRF research.
REFERENCES
Recreational fishing in Commonwealth waters Page | 55
10. REFERENCES Christie, P., Fluharty, D., Kennard, H., Pollnac, R., Warren, B., and Williams, T. 2018. Policy
pivot in Puget Sound: Lessons learned from marine protected areas and tribally-led estuarine restoration. Ocean & Coastal Management, 163: 72-81.
Cusack, J. J., Dickman, A. J., Rowcliffe, J. M., Carbone, C., Macdonald, D. W., and Coulson, T. 2015. Random versus Game Trail-Based Camera Trap Placement Strategy for Monitoring Terrestrial Mammal Communities. PLoS ONE, 10: e0126373.
Cutler, T. L., and Swann, D. E. 1999. Using Remote Photography in Wildlife Ecology: A Review. Wildlife Society Bulletin (1973-2006), 27: 571-581.
Devillers, R., Pressey, R. L., Grech, A., Kittinger, J. N., Edgar, G. J., Ward, T., and Watson, R. 2015. Reinventing residual reserves in the sea: are we favouring ease of establishment over need for protection? Aquatic Conservation: Marine and Freshwater Ecosystems, 25: 480-504.
Director of National Parks. 2013. South-east Commonwealth Marine Reserves Network management plan 2013-23. 109 pp.
Ditton, R. B., and Hunt, K. M. 2001. Combining creel intercept and mail survey methods to understand the human dimensions of local freshwater fisheries. Fisheries Management and Ecology, 8: 295-301.
Edwards, J., and Schindler, E. 2017. A Video Monitoring System to Evaluate Ocean Recreational Fishing Effort in Astoria, Oregon. 31 pp.
Flynn, D. J. H., Lynch, T. P., Barrett, N. S., Wong, L. S. C., Devine, C., and Hughes, D. 2018. Gigapixel big data movies provide cost-effective seascape scale direct measurements of open-access coastal human use such as recreational fisheries. Ecology and Evolution, 8: 9372-9383.
Frijlink, S., and Lyle, J. M. 2010. A SOCIO-ECONOMIC ASSESSMENT OF THE TASMANIAN RECREATIONAL ROCK LOBSTER FISHERY. 67 pp.
Fulton, E. A., Smith, A. D. M., Smith, D. C., and van Putten, I. E. 2011. Human behaviour: the key source of uncertainty in fisheries management. Fish and Fisheries, 12: 2-17.
Greenberg, S., and Godin, T. 2015. A Tool Supporting the Extraction of Angling Effort Data from Remote Camera Images. Fisheries, 40: 276-287.
Griffiths, S. P., Pollock, K. H., Lyle, J. M., Pepperell, J. G., Tonks, M. L., and Sawynok, W. 2010. Following the chain to elusive anglers. Fish and Fisheries, 11: 220–228.
Harasti, D., Davis, T. R., Jordan, A., Erskine, L., and Moltschaniwskyj, N. 2019. Illegal recreational fishing causes a decline in a fishery targeted species (Snapper: Chrysophrys auratus) within a remote no-take marine protected area. PLoS ONE, 14: e0209926.
Hartill, B. W., Cryer, M., Lyle, J. M., Rees, E. B., Ryan, K. L., Steffe, A. S., Taylor, S. M., et al. 2012. Scale- and Context-Dependent Selection of Recreational Harvest Estimation Methods: The Australasian Experience. North American Journal of Fisheries Management, 32: 109-123.
Hartill, B. W., Payne, G. W., Rush, N., and Bian, R. 2016. Bridging the temporal gap: Continuous and cost-effective monitoring of dynamic recreational fisheries by web cameras and creel surveys. Fisheries Research, 183: 488-497.
Henry, G. W., and Lyle, J. M. 2003. National recreational and indigenous fishing survey.
ICES Document Project No. 1999/158. 188 pp. Herfaut, J., Levrel, H., Thébaud, O., and Véron, G. 2013. The nationwide assessment of
marine recreational fishing: A French example. Ocean & Coastal Management, 78: 121-131.
Hill, N. A., Barrett, N., Ford, J. H., Peel, D., Foster, S., Lawrence, E., Monk, J., et al. 2018. Developing indicators and a baseline for monitoring demersal fish in data-poor,

REFERENCES
Recreational fishing in Commonwealth waters Page | 56
offshore Marine Parks using probabilistic sampling. Ecological Indicators, 89: 610-621.
Hunt, L. M., Sutton, S. G., and Arlinghaus, R. 2013. Illustrating the critical role of human dimensions research for understanding and managing recreational fisheries within a social-ecological system framework. Fisheries Management and Ecology, 20: 111-124.
Ihde, T. F., Wilberg, M. J., Loewensteiner, D. A., Secor, D. H., and Miller, T. J. 2011. The increasing importance of marine recreational fishing in the US: Challenges for management. Fisheries Research, 108: 268-276.
Jantke, K., Jones, K. R., Allan, J. R., Chauvenet, A. L. M., Watson, J. E. M., and Possingham, H. P. 2018. Poor ecological representation by an expensive reserve system: Evaluating 35 years of marine protected area expansion. Conservation Letters, 11: e12584.
Jentoft, S. 2006. Beyond fisheries management: The Phronetic dimension. Marine Policy, 30: 671-680.
Keller, K., Steffe, A. S., Lowry, M., Murphy, J. J., and Suthers, I. M. 2016. Monitoring boat-based recreational fishing effort at a inshore artificial reef with a shore-based camera. Fisheries Research, 181: 84-92.
Lancaster, D., Dearden, P., Haggarty, D. R., Volpe, J. P., and Ban, N. C. 2017. Effectiveness of shore-based remote camera monitoring for quantifying recreational fisher compliance in marine conservation areas. Aquatic Conservation: Marine and Freshwater Ecosystems, 27: 804-813.
Loomis, D. K., and Choi, S. 1992. Recreation Specialization: Re-conceptualization from a Social Worlds Perspective AU - Ditton, Robert B. Journal of Leisure Research, 24: 33-51.
Lyle, J. M., Coleman, A. P. M., West, L., Campbell, D., and Henry, G. W. 2002. New large-scale methods for evaluating sport fisheries. In Recreational fisheries: Ecological, economic and social evaluation. Fish and Aquatic Resources Series 8, pp. 207–226. Ed. by T. J. Pitcher, and C. Hollingworth. Blackwell Science, London, UK.
Lyle, J. M., Stark, K. E., and Tracey, S. R. 2014. 2012-2013 Survey of Recreational Fishing in Tasmania.
Lynch, T. P. 2006. Incorporation of Recreational Fishing Effort into Design of Marine Protected Areas
Incorporación del Esfuerzo de Pesca Recreativa en el Diseño de Áreas Marinas Protegidas. Conservation Biology, 20: 1466-1476.
Lynch, T. P. 2008. The Difference between Spatial and Temporal Variation in Recreational Fisheries for Planning of Marine Protected Areas: Response to Steffe. Conservation Biology, 22: 486-491.
Lynch, T. P. 2014. A decadal time-series of recreational fishing effort collected during and after implementation of a multiple use marine park shows high inter-annual but low spatial variability. Fisheries Research, 151: 85-90.
Mangi, S. C., and Austen, M. C. 2008. Perceptions of stakeholders towards objectives and zoning of marine-protected areas in southern Europe. Journal for nature conservation, 16: 271-280.
Martin, C. L., Momtaz, S., Jordan, A., and Moltschaniwskyj, N. A. 2016. Exploring recreational fishers' perceptions, attitudes, and support towards a multiple-use marine protected area six years after implementation. Marine Policy, 73: 138-145.
McCluskey, S. M., and Lewison, R. L. 2008. Quantifying fishing effort: a synthesis of current methods and their applications. Fish and Fisheries, 9: 188-200.
Mitchell, J. D., McLean, D. L., Collin, S. P., Taylor, S., Jackson, G., Fisher, R., and Langlois, T. J. 2018. Quantifying shark depredation in a recreational fishery in the Ningaloo
REFERENCES
Recreational fishing in Commonwealth waters Page | 57
Marine Park and Exmouth Gulf, Western Australia. Marine Ecology Progress Series, 587: 141-157.
Monkman, G. G., Kaiser, M. J., and Hyder, K. 2018. Heterogeneous public and local knowledge provides a qualitative indicator of coastal use by marine recreational fishers. Journal of Environmental Management, 228: 495-505.
Moore, A., Hall, K., Giri, K., Tracey, S., Penrose, L., Hansen, S., and et. al. 2015. Developing robust and cost-effective methods for estimating the national recreational catch of Southern Bluefin Tuna in Australia. ICES Document 2012/022.20. 123 pp.
Navarro, M., Kragt, M. E., Hailu, A., and Langlois, T. J. 2018. Recreational fishers’ support for no-take marine reserves is high and increases with reserve age. Marine Policy, 96: 44-52.
Parnell, P. E., Dayton, P. K., Fisher, R. A., Loarie, C. C., and Darrow, R. D. 2010. Spatial patterns of fishing effort off San Diego: implications for zonal management and ecosystem function. Ecological Applications, 20: 2203-2222.
Pawson, M. G., Glenn, H., and Padda, G. 2008. The definition of marine recreational fishing in Europe. Marine Policy, 32: 339-350.
Pollock, K. H., Jones, C. M., and Brown, T. L. 1994. Angler survey methods and their applications in fisheries management, American Fisheries Society.
Powers, S. P., and Anson, K. 2016. Estimating Recreational Effort in the Gulf of Mexico Red Snapper Fishery Using Boat Ramp Cameras: Reduction in Federal Season Length Does Not Proportionally Reduce Catch. North American Journal of Fisheries Management, 36: 1156-1166.
Productivity Commission. 2016. Marine Fisheries and Aquaculture, Final Report,. 81. 43 pp. Read, A. D., West, R. J., Haste, M., and Jordan, A. 2011. Optimizing voluntary compliance in
marine protected areas: A comparison of recreational fisher and enforcement officer perspectives using multi-criteria analysis. Journal of Environmental Management, 92: 2558-2567.
Roach, B., Trial, J., and Boyle, K. 1999. Comparing 1994 Angler Catch and Harvest Rates from On-Site and Mail Surveys on Selected Maine Lakes. North American Journal of Fisheries Management, 19: 203-208.
Rocklin, D., Levrel, H., Drogou, M., Herfaut, J., and Veron, G. 2014. Combining Telephone Surveys and Fishing Catches Self-Report: The French Sea Bass Recreational Fishery Assessment. PLoS ONE, 9: e87271.
Rovero, F., Zimmermann, F., Berzi, D., and Meek, P. 2013. "Which camera trap type and how many do I need?" A review of camera features and study designs for a range of wildlife research applications. Hystrix, the Italian Journal of Mammalogy, 24: 148-156.
Salz, R. J., and Loomis, D. K. 2004. Saltwater Anglers' Attitudes towards Marine Protected Areas. Fisheries, 29: 10-17.
Simpson, G. 2018. Use of a Public Fishing Area Determined by Vehicle Counters with Verification by Trail Cameras. Natural Resources, 9: 188-197.
Smallwood, C. B., Beckley, L. E., Moore, S. A., and Kobryn, H. T. 2011. Assessing patterns of recreational use in large marine parks: A case study from Ningaloo Marine Park, Australia. Ocean & Coastal Management, 54: 330-340.
Smallwood, C. B., Pollock, K. H., Wise, B. S., Hall, N. G., and Gaughan, D. J. 2012. Expanding Aerial-Roving Surveys to Include Counts of Shore-Based Recreational Fishers from Remotely Operated Cameras: Benefits, Limitations, and Cost Effectiveness. North American Journal of Fisheries Management, 32: 1265-1276.
Stahr, K. J., and Knudsen, R. L. 2018. Evaluating the Efficacy of Using Time-Lapse Cameras to Assess Angling Use: An Example from a High-Use Metropolitan Reservoir in Arizona. North American Journal of Fisheries Management, 38: 327-333.
Stuart-Smith, R. D., Barrett, N. S., Crawford, C. M., Frusher, S. D., Stevenson, D. G., and Edgar, G. J. 2008. Spatial patterns in impacts of fishing on temperate rocky reefs: Are
REFERENCES
Recreational fishing in Commonwealth waters Page | 58
fish abundance and mean size related to proximity to fisher access points? Journal of Experimental Marine Biology and Ecology, 365: 116-125.
Taylor, S. M., Blight, S. J., Desfosses, C. J., Steffe, A. S., Ryan, K. L., Denham, A. M., Wise, B. S., et al. 2018. Thermographic cameras reveal high levels of crepuscular and nocturnal shore-based recreational fishing effort in an Australian estuary. ICES Journal of Marine Science: fsy066-fsy066.
Tracey, S. R., Lyle, J. M., and Haddon, M. 2007. Reproductive biology and per-recruit analyses of striped trumpeter (Latris lineata) from Tasmania, Australia: Implications for management. Fisheries Research, 84: 358-367.
van Poorten, B. T., and Brydle, S. 2018. Estimating fishing effort from remote traffic counters: Opportunities and challenges. Fisheries Research, 204: 231-238.
van Poorten, B. T., Carruthers, T. R., Ward, H. G. M., and Varkey, D. A. 2015. Imputing recreational angling effort from time-lapse cameras using an hierarchical Bayesian model. Fisheries Research, 172: 265-273.
Watson, J. E. M., Dudley, N., Segan, D. B., and Hockings, M. 2014. The performance and potential of protected areas. Nature, 515: 67.
Wise, B. S., Telfer, C. F., Lai, E. K. M., Hall, N. G., and Jackson, G. 2012. Long-term monitoring of boat-based recreational fishing in Shark Bay, Western Australia: providing scientific advice for sustainable management in a World Heritage Area. Marine and Freshwater Research, 63: 1129-1141.
Wood, G., Lynch, T. P., Devine, C., Keller, K., and Figueira, W. 2016. High-resolution photo-mosaic time-series imagery for monitoring human use of an artificial reef. Ecology and Evolution, 6: 6963-6968.
Zischke, M. T., Griffiths, S. P., and Tibbetts, I. R. 2012. Catch and effort from a specialised recreational pelagic sport fishery off eastern Australia. Fisheries Research, 127–128: 61-72.

APPENDIX A – FACT SHEET FOR RECREATIONAL OFFSHORE FISHING SURVEY
Recreational fishing in Commonwealth waters Page | 60
APPENDIX A – FACT SHEET FOR RECREATIONAL OFFSHORE FISHING SURVEY This survey is being undertaken by researchers at CSIRO and the University of Western Australia. We are interested in recreational fishing, in particular fishing in offshore waters. There is relatively little information available on recreational fishing in offshore waters compared to inshore fishing. This survey is collecting data on motivations of such fishers, where they fish and what they catch, and where they get information from. It is being funded through the National Environmental Science Program: Marine Biodiversity Hub, a Commonwealth funded research program.
What will I be asked to do?
Completing the survey should take less than 10 minutes. There are a number of questions about where you went fishing today, and what you caught, as well as some questions about your fishing in the last 3 months. Your participation is completely voluntary and you are free to withdraw by stopping at any time. If you decide to withdraw from the survey, any responses you have provided up to that point will be deleted. You may also skip any question you don’t want to answer.
How will the results of the study be used?
All information collected through the survey will be anonymous and used for research purposes only. Data will be reported in an aggregate form to ensure participants are not individually identifiable. The data may also be kept and used in a de-identified form for future research on this topic. Results from this study will be published in scientific papers, public reports and conference presentations. A summary of the findings will also be made available to participants on completion of the study. Please email [email protected] if you would like to receive a copy of this summary report.
What if I have any questions about this study?
If you have any questions about this project, please feel free to contact the project leader, Dr. Tim Lynch, at [email protected] or on (03) 6232 5239. This study has been approved by CSIRO’s Social Science Human Research Ethics Committee in accordance with the National Statement on Ethical Conduct in Human Research (2007). Any concerns or complaints about the conduct of this study can be raised with the Manager of Social Responsibility and Ethics on (07) 3833 5693 or by email at [email protected].
APPENDIX B – QUESTIONNAIRE
Recreational fishing in Commonwealth waters Page | 61
APPENDIX B – QUESTIONNAIRE
Survey ID Number _________________
Date and time _________________
Ramp location _________________
Interviewer _________________
Q1. Explanation of Study
Q2.
Introductory Questions
Good Morning/Afternoon, We are undertaking a survey about recreational fishing in offshore waters, which is part of a research project to understand how these areas are being used. It should take about 10 minutes at most. Your involvement is voluntary, and you may withdraw from the survey at any time. Your answers will be confidential, and individual responses will not be reported. The person who completes the survey needs to be over 18 years of age and who knows where you went fishing today. Is one of you happy to complete the survey?
We would like an idea of where people have travelled to get here today.
Where do you normally live? (Tasmania Postcode, Australian State, Overseas Country)
Where did you leave from this morning to get this boat ramp? (Either postcode/or town)
APPENDIX B – QUESTIONNAIRE
Recreational fishing in Commonwealth waters Page | 62
Q3. Today’s trip
(Show Map 1) Can you show us on this map, roughly, where you went fishing today? (identify main zones, identify with A,B,C,D etc.)) Map version : NB if moving to a map not for that ramp, this must be noted Okay, and how long did you fish here (hours)? (Repeat for each site, if multiple sites identified)
Map version Grid Time
How many people in group? (Observable) Did all of you fish? (Yes/ No) We would also like to get some information about your boat:
Length (m) Construction Hull Engine size (hp)
APPENDIX B – QUESTIONNAIRE
Recreational fishing in Commonwealth waters Page | 63
Q4. Type of Fishing
What gear did you use today? (select all that are relevant)
Lures
Set lines
Rod and line
Auto-line hauled / electric reel
Trolling
Scuba diving
Freediving/snorkel
Potting
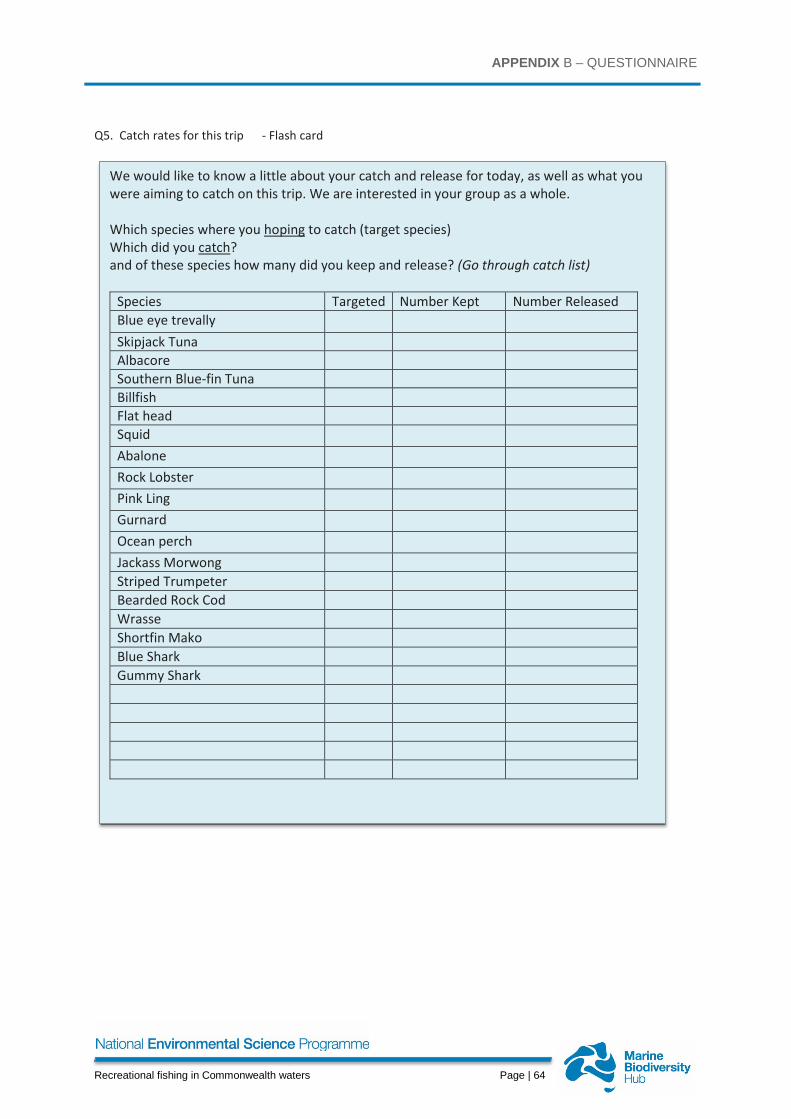
APPENDIX B – QUESTIONNAIRE
Recreational fishing in Commonwealth waters Page | 64
Q5. Catch rates for this trip - Flash card
We would like to know a little about your catch and release for today, as well as what you were aiming to catch on this trip. We are interested in your group as a whole. Which species where you hoping to catch (target species) Which did you catch? and of these species how many did you keep and release? (Go through catch list)
Species Targeted Number Kept Number Released Blue eye trevally Skipjack Tuna Albacore Southern Blue-fin Tuna Billfish Flat head Squid Abalone Rock Lobster Pink Ling Gurnard Ocean perch Jackass Morwong Striped Trumpeter Bearded Rock Cod Wrasse Shortfin Mako Blue Shark Gummy Shark
APPENDIX B – QUESTIONNAIRE
Recreational fishing in Commonwealth waters Page | 65
Q5b If Blue eye trevally reported as kept
Would it be OK to measure the size of the Blue eye trevally? If yes..

APPENDIX B – QUESTIONNAIRE
Recreational fishing in Commonwealth waters Page | 66
Q6. Previous Fishing Trips
(Show map) Thinking about the last 3 months, can you indicate on this map, roughly, where you went fishing. Map version : NB if moving to a map not for that ramp, this must be noted Can you indicate, for each area you have shown, how many days you went fishing there in the past 3 months? (Repeat for each site, if multiple sites identified)
Map version Grid Time
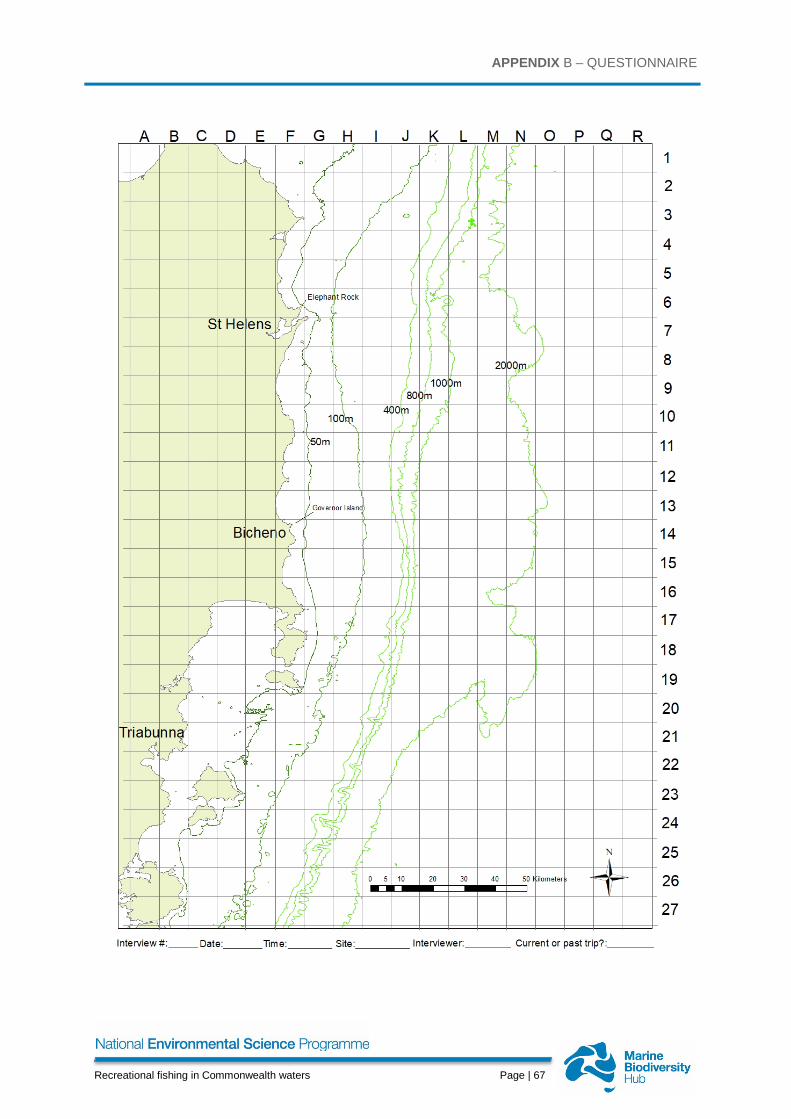
APPENDIX B – QUESTIONNAIRE
Recreational fishing in Commonwealth waters Page | 67

APPENDIX B – QUESTIONNAIRE
Recreational fishing in Commonwealth waters Page | 68
Q7. Reasons for offshore site choice: if selecting offshore areas , otherwise skip
You have indicated that you fished in offshore areas: could you tell me why you chose those areas in particular? (allow them to answer unprompted)
Not far to travel High chance of catching fish Avoid seals Avoid sharks To target certain fish Other:
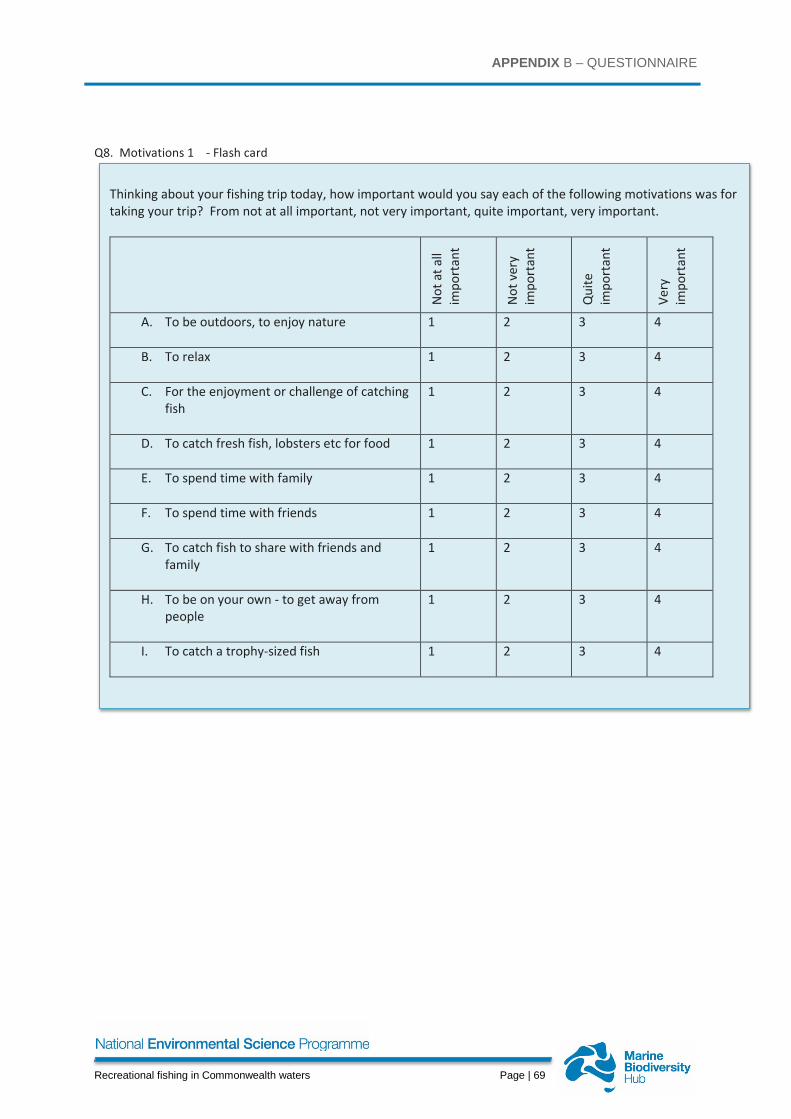
APPENDIX B – QUESTIONNAIRE
Recreational fishing in Commonwealth waters Page | 69
Q8. Motivations 1 - Flash card
Thinking about your fishing trip today, how important would you say each of the following motivations was for taking your trip? From not at all important, not very important, quite important, very important.
Not
at a
ll im
port
ant
Not
ver
y im
port
ant
Qui
te
impo
rtan
t
Very
im
port
ant
A. To be outdoors, to enjoy nature
1 2 3 4
B. To relax
1 2 3 4
C. For the enjoyment or challenge of catching fish
1 2 3 4
D. To catch fresh fish, lobsters etc for food
1 2 3 4
E. To spend time with family
1 2 3 4
F. To spend time with friends
1 2 3 4
G. To catch fish to share with friends and family
1 2 3 4
H. To be on your own - to get away from people
1 2 3 4
I. To catch a trophy-sized fish
1 2 3 4
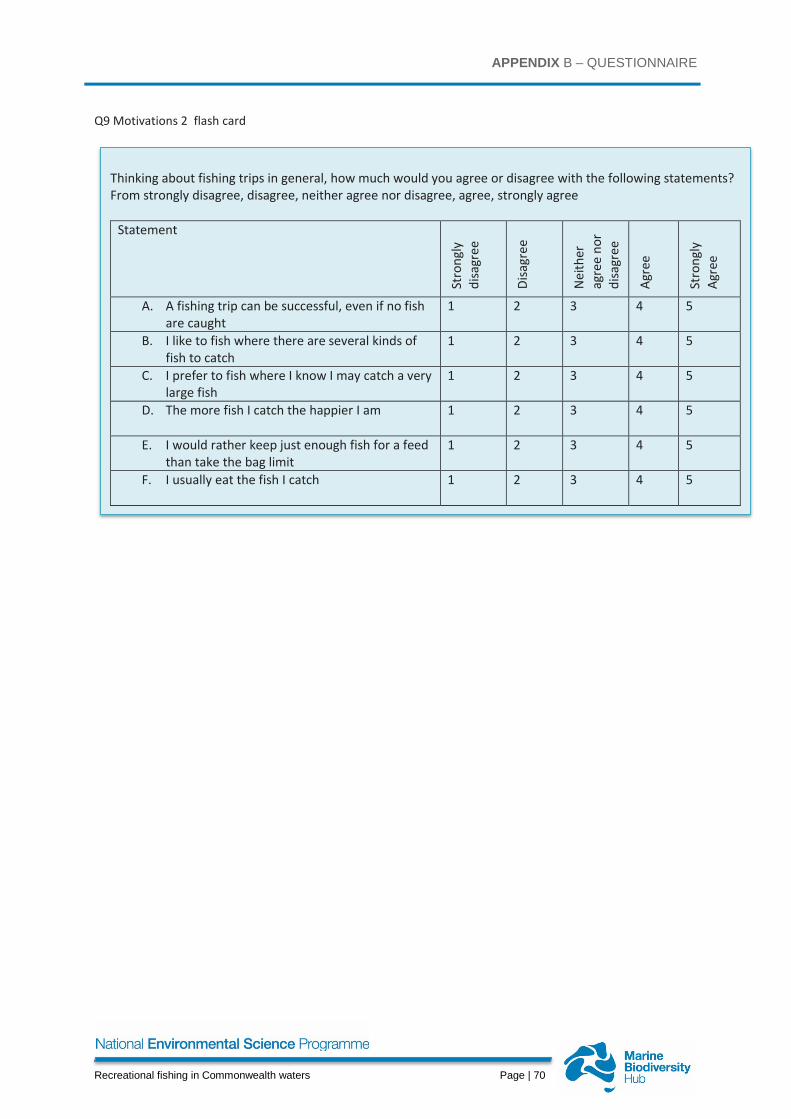
APPENDIX B – QUESTIONNAIRE
Recreational fishing in Commonwealth waters Page | 70
Q9 Motivations 2 flash card
Thinking about fishing trips in general, how much would you agree or disagree with the following statements? From strongly disagree, disagree, neither agree nor disagree, agree, strongly agree
Statement
Stro
ngly
di
sagr
ee
Disa
gree
Nei
ther
ag
ree
nor
disa
gree
Agre
e
Stro
ngly
Ag
ree
A. A fishing trip can be successful, even if no fish are caught
1 2 3 4 5
B. I like to fish where there are several kinds of fish to catch
1 2 3 4 5
C. I prefer to fish where I know I may catch a very large fish
1 2 3 4 5
D. The more fish I catch the happier I am
1 2 3 4 5
E. I would rather keep just enough fish for a feed than take the bag limit
1 2 3 4 5
F. I usually eat the fish I catch
1 2 3 4 5
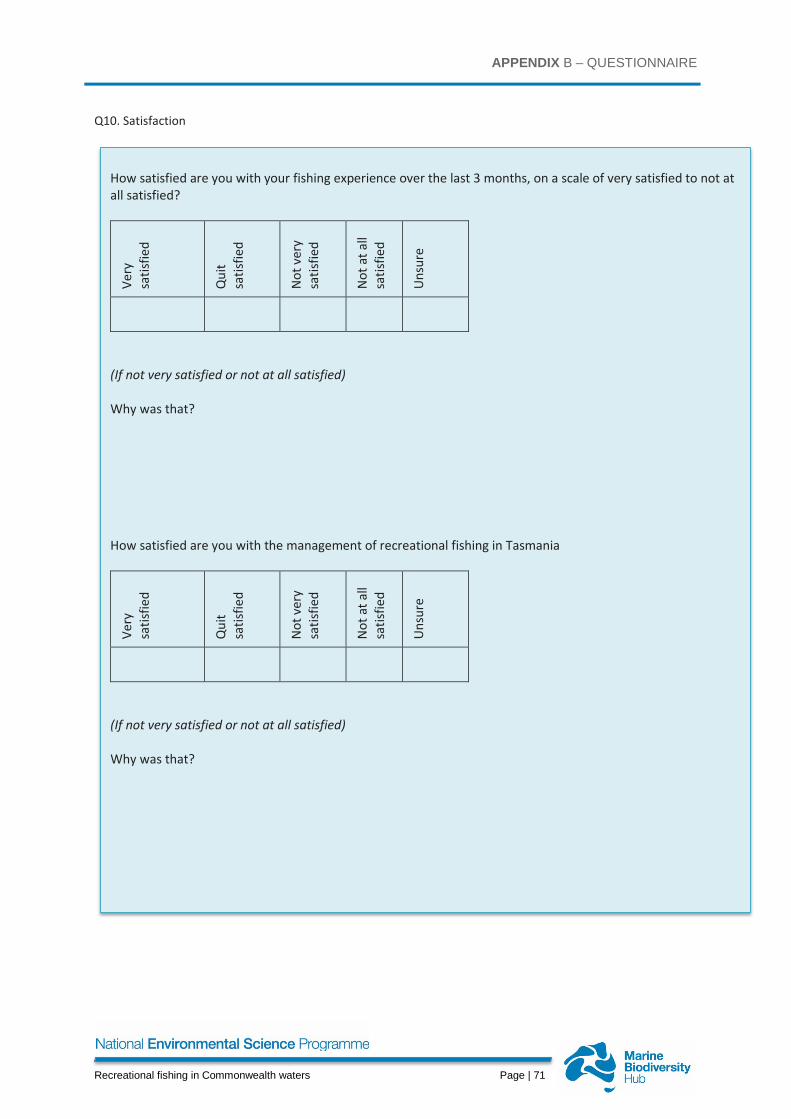
APPENDIX B – QUESTIONNAIRE
Recreational fishing in Commonwealth waters Page | 71
Q10. Satisfaction
How satisfied are you with your fishing experience over the last 3 months, on a scale of very satisfied to not at all satisfied?
Very
sa
tisfie
d
Qui
t sa
tisfie
d
Not
ver
y
satis
fied
Not
at a
ll sa
tisfie
d
Uns
ure
(If not very satisfied or not at all satisfied) Why was that? How satisfied are you with the management of recreational fishing in Tasmania
Very
sa
tisfie
d
Qui
t sa
tisfie
d
Not
ver
y
satis
fied
Not
at a
ll sa
tisfie
d
Uns
ure
(If not very satisfied or not at all satisfied) Why was that?
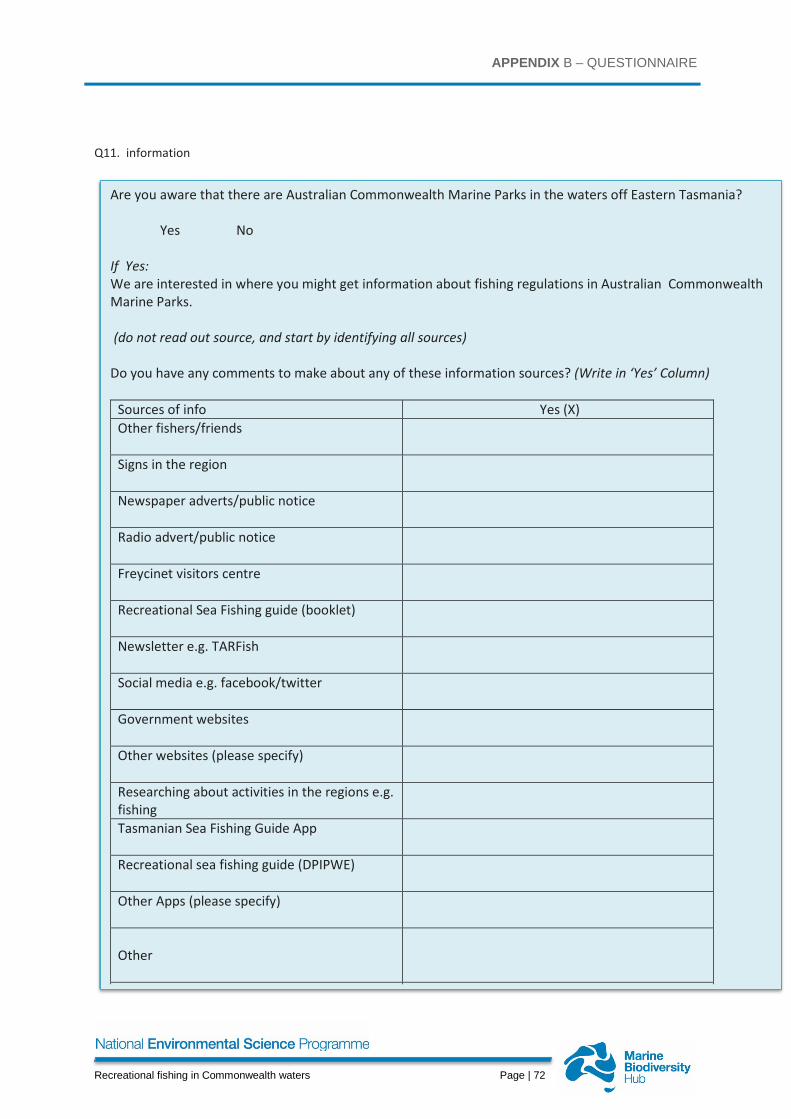
APPENDIX B – QUESTIONNAIRE
Recreational fishing in Commonwealth waters Page | 72
Q11. information
Are you aware that there are Australian Commonwealth Marine Parks in the waters off Eastern Tasmania? Yes No If Yes: We are interested in where you might get information about fishing regulations in Australian Commonwealth Marine Parks. (do not read out source, and start by identifying all sources) Do you have any comments to make about any of these information sources? (Write in ‘Yes’ Column)
Sources of info Yes (X) Other fishers/friends
Signs in the region
Newspaper adverts/public notice
Radio advert/public notice
Freycinet visitors centre
Recreational Sea Fishing guide (booklet)
Newsletter e.g. TARFish
Social media e.g. facebook/twitter
Government websites
Other websites (please specify)
Researching about activities in the regions e.g. fishing
Tasmanian Sea Fishing Guide App
Recreational sea fishing guide (DPIPWE)
Other Apps (please specify)
Other
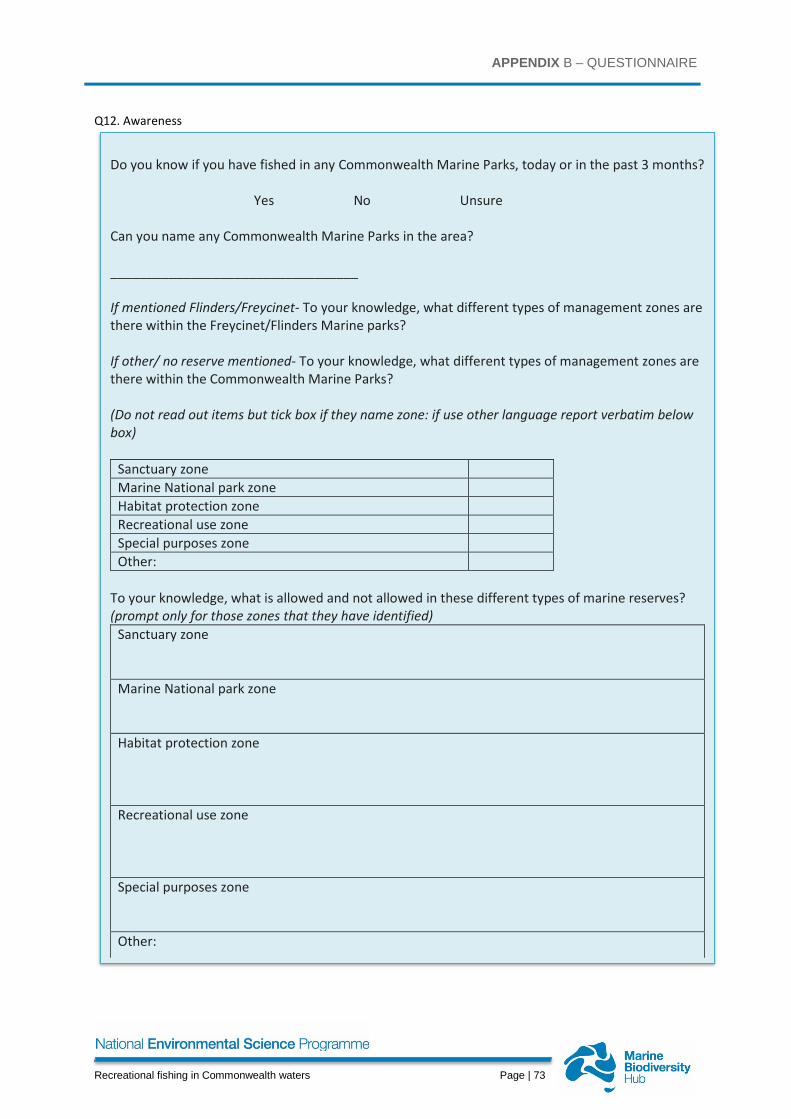
APPENDIX B – QUESTIONNAIRE
Recreational fishing in Commonwealth waters Page | 73
Q12. Awareness
Do you know if you have fished in any Commonwealth Marine Parks, today or in the past 3 months?
Yes No Unsure Can you name any Commonwealth Marine Parks in the area? __________________________________ If mentioned Flinders/Freycinet- To your knowledge, what different types of management zones are there within the Freycinet/Flinders Marine parks? If other/ no reserve mentioned- To your knowledge, what different types of management zones are there within the Commonwealth Marine Parks? (Do not read out items but tick box if they name zone: if use other language report verbatim below box)
Sanctuary zone Marine National park zone Habitat protection zone Recreational use zone Special purposes zone Other:
To your knowledge, what is allowed and not allowed in these different types of marine reserves? (prompt only for those zones that they have identified)
Sanctuary zone Marine National park zone Habitat protection zone Recreational use zone Special purposes zone Other:
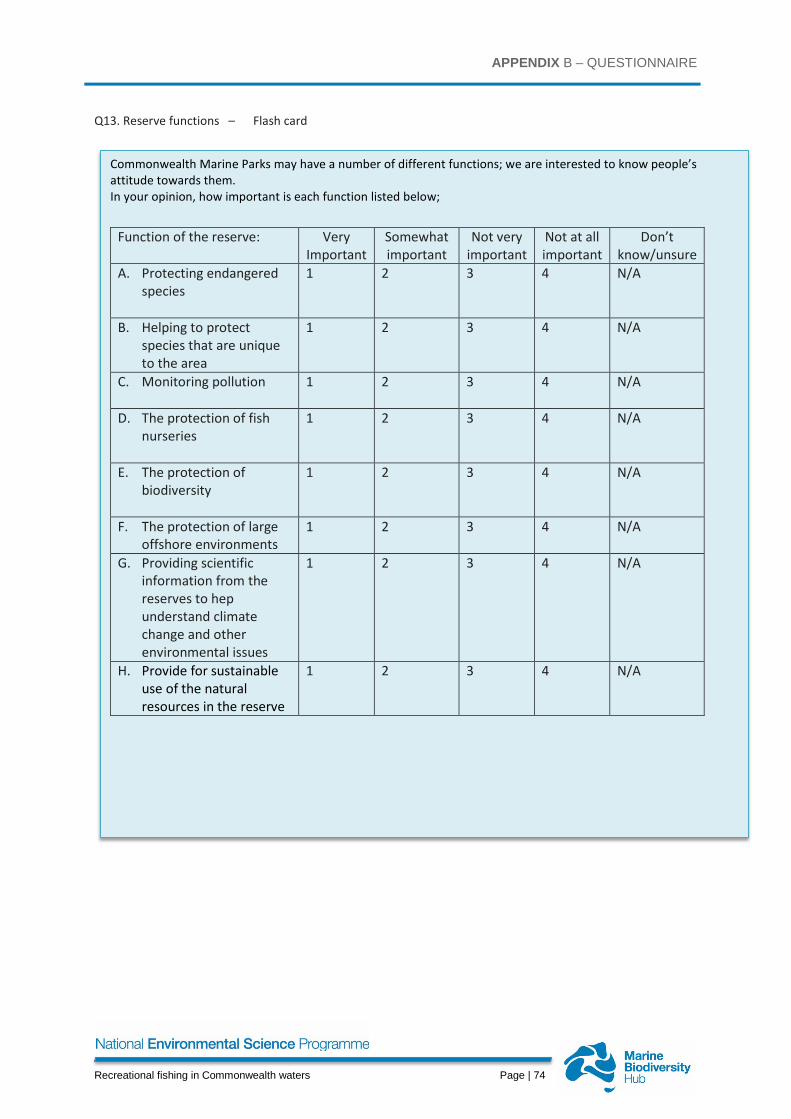
APPENDIX B – QUESTIONNAIRE
Recreational fishing in Commonwealth waters Page | 74
Q13. Reserve functions – Flash card
Commonwealth Marine Parks may have a number of different functions; we are interested to know people’s attitude towards them. In your opinion, how important is each function listed below;
Function of the reserve: Very
Important Somewhat important
Not very important
Not at all important
Don’t know/unsure
A. Protecting endangered species
1 2 3 4 N/A
B. Helping to protect species that are unique to the area
1 2 3 4 N/A
C. Monitoring pollution
1 2 3 4 N/A
D. The protection of fish nurseries
1 2 3 4 N/A
E. The protection of biodiversity
1 2 3 4 N/A
F. The protection of large offshore environments
1 2 3 4 N/A
G. Providing scientific information from the reserves to hep understand climate change and other environmental issues
1 2 3 4 N/A
H. Provide for sustainable use of the natural resources in the reserve
1 2 3 4 N/A
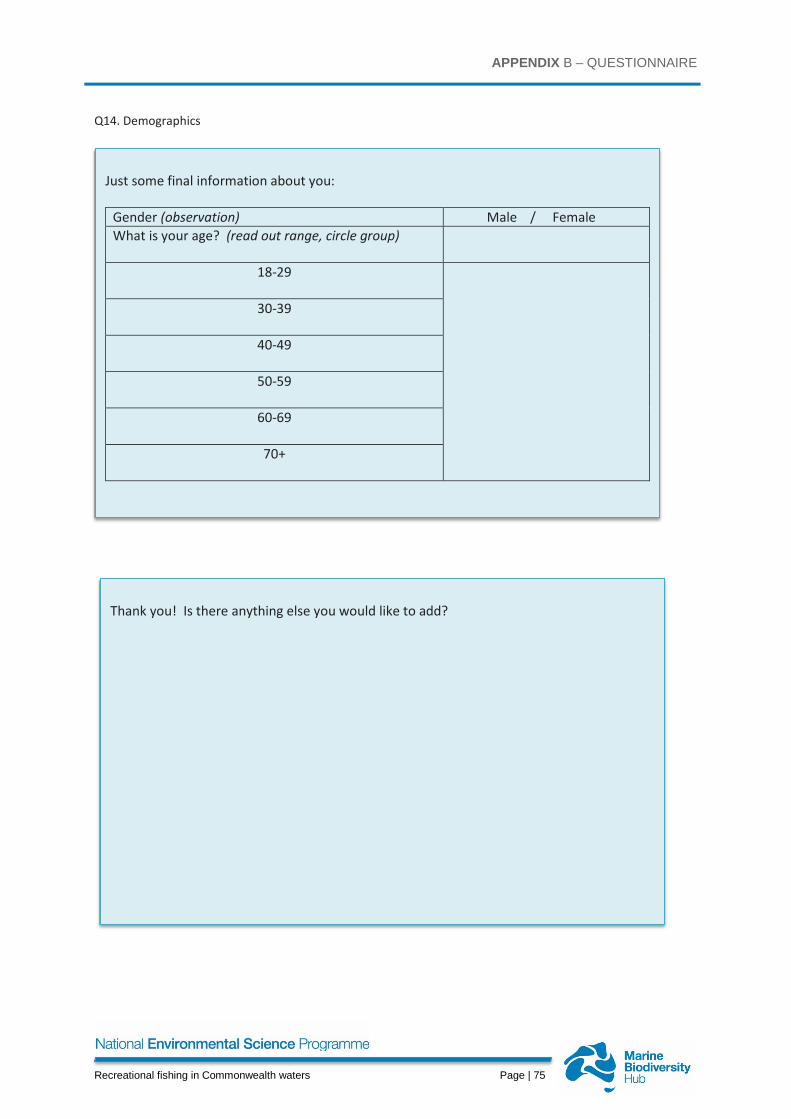
APPENDIX B – QUESTIONNAIRE
Recreational fishing in Commonwealth waters Page | 75
Q14. Demographics
Thank you! Is there anything else you would like to add?
Just some final information about you:
Gender (observation) Male / Female What is your age? (read out range, circle group)
18-29
30-39
40-49
50-59
60-69
70+

www.nespmarine.edu.au
Contact: Tim Lynch
CSIRO
Castray Esplanade, Hobart, Tas 7000 [email protected]
+61 6232 5239