recruitment and retention survey - nrmca€¦ · 2015 mixer driver recruitment and retention survey...
TRANSCRIPT

National Ready Mixed Concrete Association
2015 Mixer Driver Recruitment and Retention Survey
1930-2015
Executive Summary
2015 Mixer Driver Recruitment and Retention Survey
Executive Summary
September 2015
Jeff Hinkle, Chandler Concrete NRMCA Operations, Environmental & Safety Committee Chairman
Tim Kauzlick, CEMEX NRMCA Operations, Environmental & Safety Committee Vice Chairman
Chip Wildman, Concrete Supply Company NRMCA Operations, Environmental & Safety Committee Human Resources Task Group, Chairman
Vickie Tyminski, Carroll Concrete NRMCA Operations, Environmental & Safety Committee Human Resources Task Group, Vice Chairman
Gary Mullings, NRMCA Senior Vice President, Operations and Compliance, Liaison to the Operations, Environmental & Safety Committee
Eileen Dickson, NRMCA Vice President, Education, Liaison to the Operations, Environmental & Safety Committee Human Resources Task Group

2
2015 Mixer Driver Recruitment and Retention Survey
NRMCA’s 2015 Mixer Driver Recruitment and Retention Survey examined the state of the mixer driver employment pool from January 1, 2014 to December 31, 2014. It is the first comprehensive study of this commercially licensed driver segment. The study reported on staffing level, retention rate, average age, tenure rate and internal job mobility. It then looked at turnover analyzing the total turnover rate, voluntary turnover rate, involuntary turnover rate, layoff turnover rate and reasons for termination as well as reasons mixer drivers quit. Finally, the study analyzed the 2014 hiring rate, vacancy rate, the projected 2015 hire, hiring trends and hiring challenges.
Anonymous responses were submitted by ready mixed concrete producers from March 1, 2015 to May 31, 2015. The survey’s data set represents 161 companies or company divisions. The response rate for the 21-question survey was 97%.
The 2014 Mixer Driver Employment Pool
Staffing Level and Retention Rate
NRMCA’s 2015 Fleet Benchmarking & Costs Survey’s estimated 70,000 mixer drivers were employed in 2014. The Bureau of Labor Statistics (BLS) reported in its Occupational Employment Statistics Report in May 2014 that there were 1,700,000 heavy and tractor trailer truck drivers. Mixer drivers are counted in that population, at 4%. NRMCA also estimated the total 2014 industry population at approximately 125,000 employees; mixer drivers were estimated to be 56% of that total.
In order to ascertain the success of retaining enough employees to maintain an effective business, one calculates the rate of retention. It is determined by taking the number of “stayers” at the end of the calculation period divided by the number of employees at the beginning of the calculation period. It is reported by percentage. Retention rate does not factor turnover, that is, those who left in the same period. That consideration follows.
With a 98% response rate, this sample collectively employed 17,908 mixer drivers on January 1, 2014. On December 31, 2014, respondents employed 19,024 mixer drivers (97% response rate). To calculate the retention rate, 19,024 was divided by 17,908. The total increase of the survey population between January 1 and December 31 was 6.2%, or a 106.2% retention rate. The average producer employed 122.7 mixers drivers on January 1, 2014 and 131.7 mixer drivers on December 31, 2014. The median was 44 drivers per producer on January 1 and 50 drivers on December 31, 2014. This survey’s December 31, 2014 population represented 27% of the estimated 70,000 mixer drivers.
3
Average Age
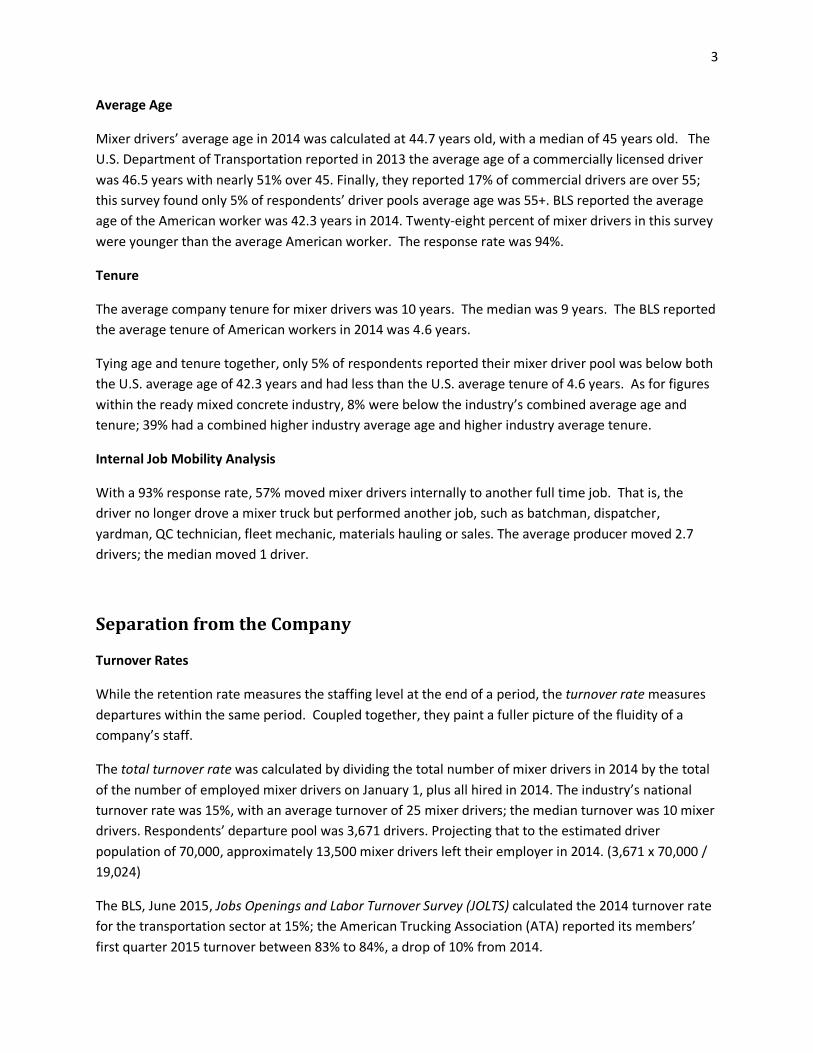
Mixer drivers’ average age in 2014 was calculated at 44.7 years old, with a median of 45 years old. The U.S. Department of Transportation reported in 2013 the average age of a commercially licensed driver was 46.5 years with nearly 51% over 45. Finally, they reported 17% of commercial drivers are over 55; this survey found only 5% of respondents’ driver pools average age was 55+. BLS reported the average age of the American worker was 42.3 years in 2014. Twenty-eight percent of mixer drivers in this survey were younger than the average American worker. The response rate was 94%.
Tenure
The average company tenure for mixer drivers was 10 years. The median was 9 years. The BLS reported the average tenure of American workers in 2014 was 4.6 years.
Tying age and tenure together, only 5% of respondents reported their mixer driver pool was below both the U.S. average age of 42.3 years and had less than the U.S. average tenure of 4.6 years. As for figures within the ready mixed concrete industry, 8% were below the industry’s combined average age and tenure; 39% had a combined higher industry average age and higher industry average tenure.
Internal Job Mobility Analysis
With a 93% response rate, 57% moved mixer drivers internally to another full time job. That is, the driver no longer drove a mixer truck but performed another job, such as batchman, dispatcher, yardman, QC technician, fleet mechanic, materials hauling or sales. The average producer moved 2.7 drivers; the median moved 1 driver.
Separation from the Company
Turnover Rates
While the retention rate measures the staffing level at the end of a period, the turnover rate measures departures within the same period. Coupled together, they paint a fuller picture of the fluidity of a company’s staff.
The total turnover rate was calculated by dividing the total number of mixer drivers in 2014 by the total of the number of employed mixer drivers on January 1, plus all hired in 2014. The industry’s national turnover rate was 15%, with an average turnover of 25 mixer drivers; the median turnover was 10 mixer drivers. Respondents’ departure pool was 3,671 drivers. Projecting that to the estimated driver population of 70,000, approximately 13,500 mixer drivers left their employer in 2014. (3,671 x 70,000 / 19,024)
The BLS, June 2015, Jobs Openings and Labor Turnover Survey (JOLTS) calculated the 2014 turnover rate for the transportation sector at 15%; the American Trucking Association (ATA) reported its members’ first quarter 2015 turnover between 83% to 84%, a drop of 10% from 2014.
4
This survey reported approximately two-thirds of mixer drivers quit to one-third who were released by the company. ATA and BLS reported approximately the same ratio for CDL drivers. Unlike their calculations, NRMCA’s do not reflect 2013 over 2014 but a percent of total separations in 2014.
The voluntary turnover rate was calculated by taking the number of quits divided by the total of 2014 hires plus the number of full time mixer drivers on January 1, 2014. The national voluntary turnover rate for mixer drivers was 9%. The average voluntary turnover was 15 mixer drivers. The median turnover was 5 mixer drivers.
The involuntary turnover rate represents separations initiated by the company. It was calculated by taking the total number of involuntary separations divided by the sum of 2014 hires and mixer drivers on staff on January 1, 2014. The involuntary turnover rate included layoffs, discharges, retirements and any other circumstances initiated by the producer. The involuntary turnover rate was 6%. The average voluntary turnover was 10 mixer drivers. The median turnover was 3 mixer drivers.
Within the involuntary turnover category, NRMCA calculated the involuntary temporary turnover rate. It was calculated by taking the total layoffs divided by the sum of total hires in 2014 plus the total number of mixer drivers on January 1, 2014. Twenty-eight percent of respondents reported they temporarily laid off mixer drivers, representing 3.1% of the this survey’s total 2014 population of mixer drivers. The national involuntary temporary turnover rate was 3%. The average involuntary voluntary turnover was 6 mixer drivers. The median turnover was 0 mixer drivers.
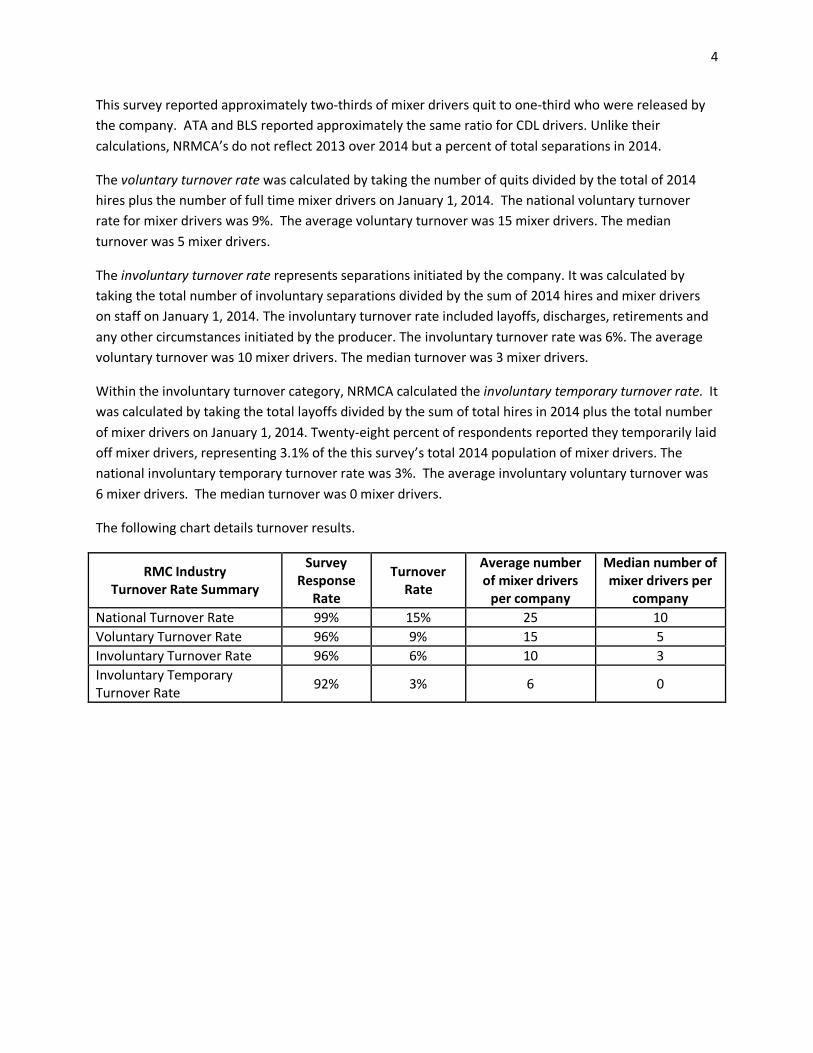
The following chart details turnover results.
RMC Industry Turnover Rate Summary
Survey Response
Rate
Turnover Rate
Average number of mixer drivers
per company
Median number of mixer drivers per
company National Turnover Rate 99% 15% 25 10 Voluntary Turnover Rate 96% 9% 15 5 Involuntary Turnover Rate 96% 6% 10 3 Involuntary Temporary Turnover Rate
92% 3% 6 0

5
Why Producers Terminated Mixer Drivers’ Employment
The survey asked respondents to rank the top three reasons why mixer drivers were released from employment. There were nine choices. Those choices were modified from the Society of Human Resource Management (SHRM) list. The response rate was 87%. All nine on the list were ranked in top three. The lowest response was “died,” with seven companies listing it in their top three. The highest response was “poor job performance.”
Of all the questions in the survey, this one had the most consistent responses from every sector analyzed, that is, nationally, by geographic region, by cubic yardage or by company market type (mixed, rural or urban). The same three responses, and approximate percentages, repeated.
Nationally, they are:
1. Poor job performance, with 82% ranking it in the top three. 2. CDL issues, with 67% ranking it in the top three. 3. Poor job attitude, with 51% ranking it in the top three.
The following chart details the results.
Why Producers Released Mixer Drivers Rank Percent of Total Respondents Poor job performance 1 82% CDL issues 2 67% Poor job attitude 3 51% Other 4 31% Illness or injury 5 24% Business slow down 6 17% Change in company policy or operation 7 14% Moved 8 9% Died 9 5%
Why Drivers Quit
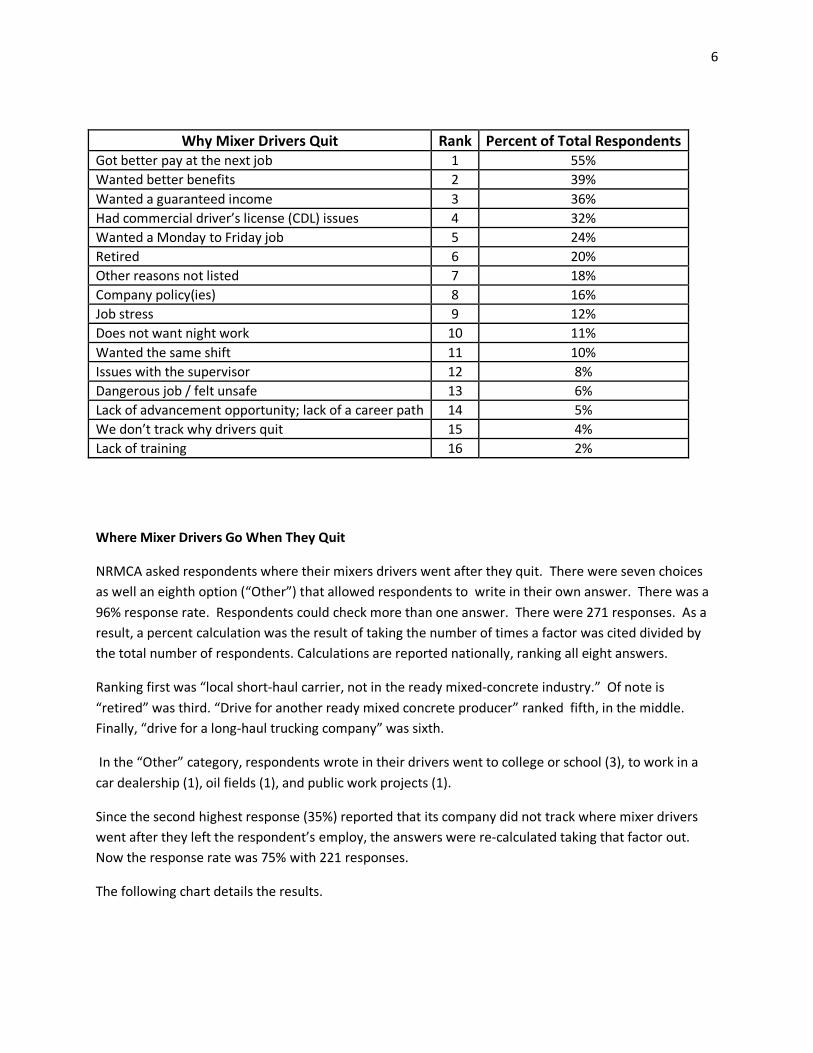
NRMCA asked respondents to rank their top three reasons why mixer drivers quit. There were 16 choices with a 98% response rate. All 16 possible answers received a rank of 1, 2 or 3 at least once.
There was an all over consistency in the top rankings, be it nationally, by region, by cubic yards or by company market type. Compensation packages were clearly the top concerns followed by life/work balance issues.
6
Why Mixer Drivers Quit Rank Percent of Total Respondents Got better pay at the next job 1 55% Wanted better benefits 2 39% Wanted a guaranteed income 3 36% Had commercial driver’s license (CDL) issues 4 32% Wanted a Monday to Friday job 5 24% Retired 6 20% Other reasons not listed 7 18% Company policy(ies) 8 16% Job stress 9 12% Does not want night work 10 11% Wanted the same shift 11 10% Issues with the supervisor 12 8% Dangerous job / felt unsafe 13 6% Lack of advancement opportunity; lack of a career path 14 5% We don’t track why drivers quit 15 4% Lack of training 16 2%
Where Mixer Drivers Go When They Quit
NRMCA asked respondents where their mixers drivers went after they quit. There were seven choices as well an eighth option (“Other”) that allowed respondents to write in their own answer. There was a 96% response rate. Respondents could check more than one answer. There were 271 responses. As a result, a percent calculation was the result of taking the number of times a factor was cited divided by the total number of respondents. Calculations are reported nationally, ranking all eight answers.
Ranking first was “local short-haul carrier, not in the ready mixed-concrete industry.” Of note is “retired” was third. “Drive for another ready mixed concrete producer” ranked fifth, in the middle. Finally, “drive for a long-haul trucking company” was sixth.
In the “Other” category, respondents wrote in their drivers went to college or school (3), to work in a car dealership (1), oil fields (1), and public work projects (1).
Since the second highest response (35%) reported that its company did not track where mixer drivers went after they left the respondent’s employ, the answers were re-calculated taking that factor out. Now the response rate was 75% with 221 responses.
The following chart details the results.

7
Where Quitting
Mixer Drivers Go
Local short-haul carrier not
in the RMC
industry
Don’t track
Retired Non-
driving job
Another producer
Long- haul
trucking Unemployed Other
National Rank
1 2 3 4 5 6 7 8
Response Percent
38% 35% 30% 27% 26% 22% 8% 3%
National
Rank 1 XX 2 3 4 5 6 7
Response Percent
48% XX 38% 35% 33% 28% 11% 4%
The rankings stayed the same. Of note is “local short-haul carrier, not in the ready mixed-concrete industry” now represented almost 50% of respondents’ first choice.
Recruitment: Mixer Driver Hiring Analysis
2014 Hiring Summary
In an effort to understand the industry’s hiring trend, a series of questions were asked:
• How many mixer drivers were hired in 2014? • How many vacant mixer driver positions did you have open on December 31, 2014? • How many mixer drivers do you anticipate hiring in 2015?
In response to the first question, 5,893 drivers were hired in 2014. They represented 31% of the 19,024 sample population of mixer drivers, as of December 31, 2014. That is, 31% of the driver population were new hires in 2014. The average producer hired 39.8 drivers; the median hire per producer was 11.5 drivers. If calculated to the projected population of 70,000 mixer drivers, the industry hired approximately 21,700 in 2014.
2015 Vacancy Rate
SHRM states an organization’s vacancy rate is the result from employee turnover and creation of new positions. It relates the unmet labor demand. It is calculated by the number of vacancies divided by the number of positions on the closing date, in this survey, December 31, 2014.
8
The survey reported 1,655 vacancies, a 9% vacancy rate. The average was 11.3 open mixer driver positions; the median was 5 open mixer driver positions. If calculated to the projected population of 70,000 mixer drivers, the industry had approximately 6,100 open mixer driver positions on December 31, 2014. Fifteen percent reported they had no vacancies.
2015 Projected Mixer Driver Hiring Analysis
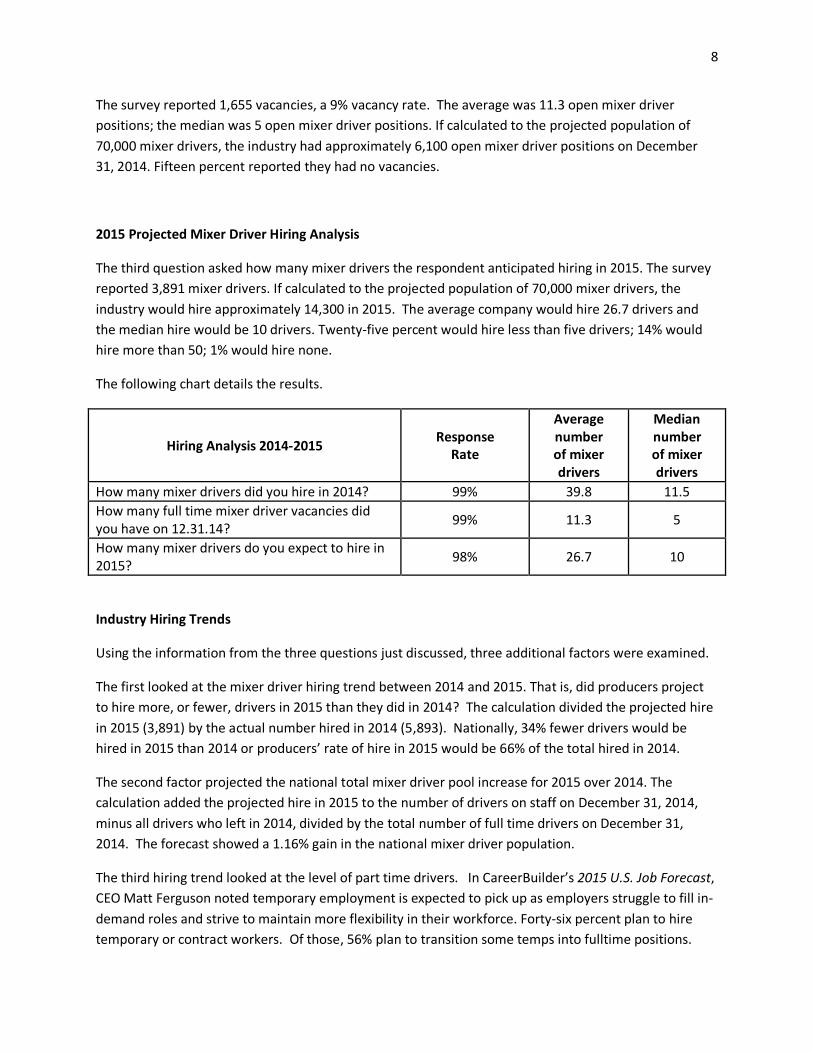
The third question asked how many mixer drivers the respondent anticipated hiring in 2015. The survey reported 3,891 mixer drivers. If calculated to the projected population of 70,000 mixer drivers, the industry would hire approximately 14,300 in 2015. The average company would hire 26.7 drivers and the median hire would be 10 drivers. Twenty-five percent would hire less than five drivers; 14% would hire more than 50; 1% would hire none.
The following chart details the results.
Hiring Analysis 2014-2015 Response
Rate
Average number of mixer drivers
Median number of mixer drivers
How many mixer drivers did you hire in 2014? 99% 39.8 11.5 How many full time mixer driver vacancies did you have on 12.31.14?
99% 11.3 5
How many mixer drivers do you expect to hire in 2015?
98% 26.7 10
Industry Hiring Trends
Using the information from the three questions just discussed, three additional factors were examined.
The first looked at the mixer driver hiring trend between 2014 and 2015. That is, did producers project to hire more, or fewer, drivers in 2015 than they did in 2014? The calculation divided the projected hire in 2015 (3,891) by the actual number hired in 2014 (5,893). Nationally, 34% fewer drivers would be hired in 2015 than 2014 or producers’ rate of hire in 2015 would be 66% of the total hired in 2014.
The second factor projected the national total mixer driver pool increase for 2015 over 2014. The calculation added the projected hire in 2015 to the number of drivers on staff on December 31, 2014, minus all drivers who left in 2014, divided by the total number of full time drivers on December 31, 2014. The forecast showed a 1.16% gain in the national mixer driver population.
The third hiring trend looked at the level of part time drivers. In CareerBuilder’s 2015 U.S. Job Forecast, CEO Matt Ferguson noted temporary employment is expected to pick up as employers struggle to fill in-demand roles and strive to maintain more flexibility in their workforce. Forty-six percent plan to hire temporary or contract workers. Of those, 56% plan to transition some temps into fulltime positions.

9
With that in mind, this survey asked producers to report part time mixer driver employment in order to collect data for a future trend analysis. Nineteen percent reported they hired part time drivers in 2014, equating to 0.5 employees per respondent company.
Industry Hiring Challenges
NRMCA asked the survey respondents what were their biggest challenges hiring mixer drivers. All but two replied for a 99% response rate.
This was an open-ended, fill-in-the-blank question. As a result, NRMCA conducted a word search to count the same or like words. Eleven “challenges”, or themes, were tracked and then ranked according to frequency. “Finding drivers who had a qualified CDL” ranked first with 25% of respondents listing it as one of their challenges. “Finding drivers with ready mixed concrete experience” ranked second, with 17% of respondents listing it.
To put this in perspective, SHRM reported on a survey conducted by Harris Poll that revealed finding qualified talent is the biggest hiring concern (48%). Assuming “qualified” can include a qualified CDL as well as qualified with ready mixed concrete experience, when those two factors are added together, they equal 42%, to SHRM’s 48%, placing the ready mixed concrete industry relatively close to the general population’s biggest hiring challenge. Ranking third was, “availability/too small a pool of driver candidates,” at 14%.
Biggest challenges hiring mixer drivers Rank Percent
of replies
Terms Counted
Finding qualified CDL’s / finding qualified drivers 1 25% 71 Finding drivers with RMC experience 2 17% 50 Small pool of candidates / no availability of candidates 3 14% 41 Not meeting hiring and company business standards 4 10% 29 Work ethic; finding a quality worker 5 9% 25 RMC seasonality and/or inconsistent schedule 6 6% 17 Competition – other job opportunities 7 6% 16 Retention is the issue, not hiring 8 5% 14 No interest in the RMC industry 9 4% 12 Pay rate not competitive 10 3% 10 Federal regulations 11 1% 4
TOTAL 289
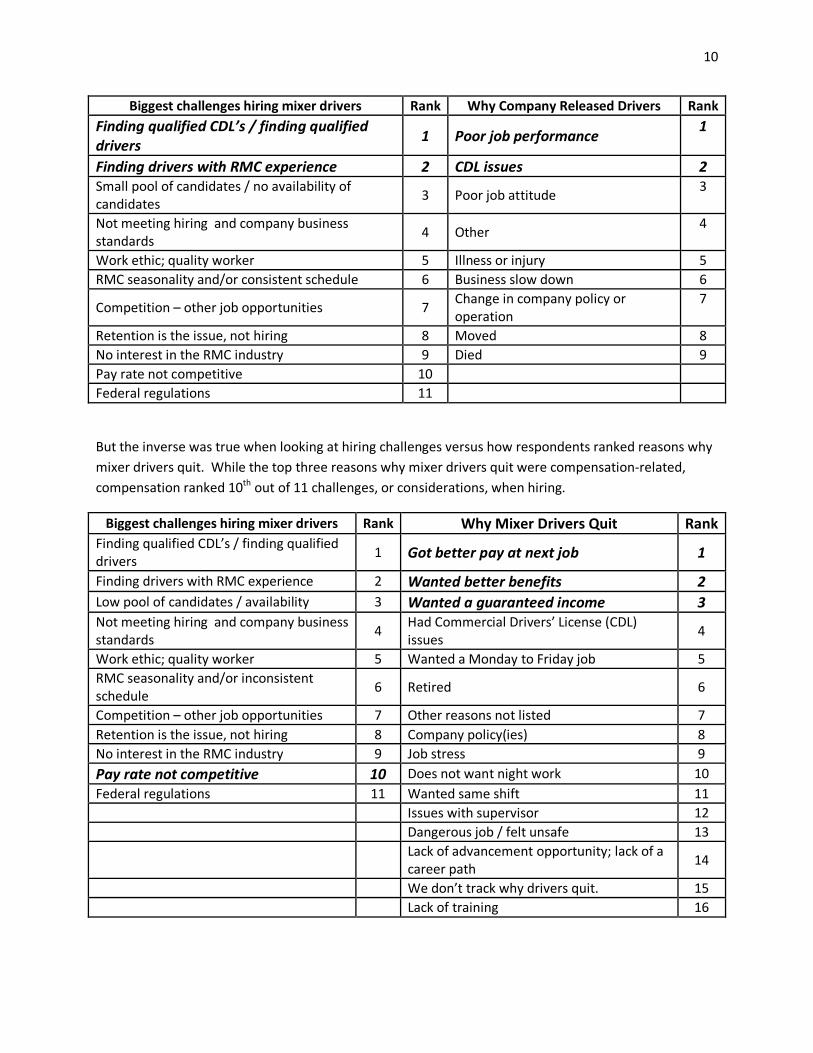
NRMCA then looked to see if there any similarities between recruitment and retention challenges. The data showed the same top two challenges in hiring were the same top two reasons for releasing mixer drivers. CDL issues ranked in the top two for both. Finding drivers with RMC experience can tie to poor job performance.
10
Biggest challenges hiring mixer drivers Rank Why Company Released Drivers Rank Finding qualified CDL’s / finding qualified drivers
1 Poor job performance 1
Finding drivers with RMC experience 2 CDL issues 2 Small pool of candidates / no availability of candidates
3 Poor job attitude 3
Not meeting hiring and company business standards
4 Other 4
Work ethic; quality worker 5 Illness or injury 5 RMC seasonality and/or consistent schedule 6 Business slow down 6
Competition – other job opportunities 7 Change in company policy or operation
7
Retention is the issue, not hiring 8 Moved 8 No interest in the RMC industry 9 Died 9 Pay rate not competitive 10 Federal regulations 11
But the inverse was true when looking at hiring challenges versus how respondents ranked reasons why mixer drivers quit. While the top three reasons why mixer drivers quit were compensation-related, compensation ranked 10th out of 11 challenges, or considerations, when hiring.
Biggest challenges hiring mixer drivers Rank Why Mixer Drivers Quit Rank Finding qualified CDL’s / finding qualified drivers
1 Got better pay at next job 1
Finding drivers with RMC experience 2 Wanted better benefits 2 Low pool of candidates / availability 3 Wanted a guaranteed income 3 Not meeting hiring and company business standards
4 Had Commercial Drivers’ License (CDL) issues
4
Work ethic; quality worker 5 Wanted a Monday to Friday job 5 RMC seasonality and/or inconsistent schedule
6 Retired 6
Competition – other job opportunities 7 Other reasons not listed 7 Retention is the issue, not hiring 8 Company policy(ies) 8 No interest in the RMC industry 9 Job stress 9 Pay rate not competitive 10 Does not want night work 10 Federal regulations 11 Wanted same shift 11
Issues with supervisor 12 Dangerous job / felt unsafe 13 Lack of advancement opportunity; lack of a
career path 14
We don’t track why drivers quit. 15 Lack of training 16

11
Industry Recruitment Methods
This survey looked at 22 recruitment methods. They were adapted from those commonly used by human resource professionals across all industries, as reported by SHRM. Respondents were asked to check one or more of their most successful methods. There was a 99% response rate.
There was also a write-in option, “other”. “Other” responses were walk-ins, word-of-mouth, acquisition, community referral, customer referral and union referral.
The average respondent used 3.5 methods to recruit mixer drivers. The median was 3 methods. Twenty-six percent of respondents reported they used more than 5 methods. Twelve percent reported they used 1 method. Fifteen wrote in “Craig’s List” and those responses were rolled into “Internet” searches. “Employee referral” was the clear front runner with 75.7% of respondents using it.
There were close similarities across all sectors analyzed, be it nationally, by region, by cubic yardage or by mixed/rural/urban markets.
Producer Recruitment Methods Rank Percent Who Used Method Successfully
Employee Referral 1 75.7% Newspaper ads 2 45.9% Post on company’s website 3 34.5% Internet 4 33.8% Post at plant gate 5 27.7% Company’s CDL program 6 25.7% Job fair 7 16.9% Social media 8 15.5% Private trucking school programs 9 12.8% Community college trucking school programs 10 12.2% State unemployment office 11 10.8% 3rd party staffing company 12 10.1% Other (please specify) 13 6.8% Radio ads 14 6.1% Post on mixer trucks & other company vehicles 15 5.4% Recruit at technical schools 16 5.4% Military release & training programs 17 4.7% Post at construction sites 18 4.7% Post at company home office 19 4.7% Recruit at high schools 20 2.7% Prison re-training program 21 1.4% Post sign at bus stops and on buses 22 1.4% Post at truck stops 23 .0.7%
12
In looking at the literature, the ready mixed concrete industry’s recruitment methods fall within the national norm. The HR Daily Advisor’s 2014 Employee Recruiting and Retention Survey found employee referral programs (77.8%) was the most frequently used recruitment method. Posting on the company website (70.8%), the internet (70.8%), word-of-mouth (65%) and print ads (49.3%) rounded out their top five methods. It noted that the most recruited positions online are mid to senior level positions.
SHRM reported that employers were struggling to hire hourly workers as turnover rises. Respondents reported to SHRM that employee referrals (71%) followed by the company website (59%), online job boards (59%), walk-ins (48%), social media (34%) and local advertising (34%) work best. Furthermore, 82% believe recruiting millennials was critical; at the same time, 70% believed retiring baby boomers would leave them with a major skill gap.
The 2015 Mixer Driver Recruitment & Retention Survey was conducted under the auspices of NRMCA’s Operations, Environmental and Safety Committee, Human Resource Task Group. It acknowledges and thanks respondents for their time and information.