recycling market situation - apo
TRANSCRIPT


Sustainable Resource Use Pty Ltd Page ii
Report title: Recycling market development review
Author: Peter Allan
Date: 18 September 2019
Disclaimer
This report has been prepared on behalf of and for the exclusive use of the Dept. of Environment and Energy, and is subject to and issued in accordance with the agreement between the Dept. of Environment and Energy, and Sustainable Resource Use Pty Ltd. Sustainable Resource Use Pty Ltd accepts no liability or responsibility whatsoever for any use of or reliance upon this report by any third party.

Sustainable Resource Use Pty Ltd Page iii
Contents 1 OBJECTIVES ................................................................................................................................ 4
1.1 Project overview .............................................................................................................. 4
1.2 Project scope ................................................................................................................. 4
2 SUMMARY .................................................................................................................................. 6
Key opportunities .................................................................................................................................... 6
3 MARKET ASSESSMENT FOR PLASTICS ........................................................................................ 8
4 MARKET ASSESSMENT FOR PAPER AND CARDBOARD .............................................................. 14
5 MARKET ASSESSMENT FOR RUBBER .......................................................................................... 18
5.1 Tyre consumption and waste generation ........................................................................ 18
5.2 Market Barriers ................................................................................................................ 18
5.3 Opportunities ................................................................................................................... 19
6 MARKET ASSESSMENT FOR GLASS ............................................................................................. 21
6.1.1 Opportunities for increased recyclate take ........................................................................... 23
7 KEY FINDINGS ............................................................................................................................. 24
7.1 Plastics ............................................................................................................................. 24
7.2 Glass ................................................................................................................................. 25
7.3 Paper and cardboard ....................................................................................................... 25
8 SUMMARY .................................................................................................................................. 26
9 REFERENCES ............................................................................................................................... 27

Sustainable Resource Use Pty Ltd Page 4
Errata
In a previous edition of this report a typographical mistake on pages 8 and 13 listed the plastics
packaging recycling rate as 27.6% rather than 20.6%. This has been rectified to align with the other
data references in the report.
1 OBJECTIVES
1.1 Project overview
The Department of Environment and Energy has stated that to assist work on an action plan
for the updated national waste policy, the taskforce has agreed to a literature review of
opportunities to grow markets in recycled glass, plastics and rubber and paper & cardboard.
1.2 Project scope
SRU has assessed a range of publicly available reports that have been produced on the
state of markets for recycled materials. These have generally been initiated following
challenging conditions for the export of collected recyclables. The reports are mostly
focussed on the range of materials collected through household kerbside systems. This
includes packaging made from paper and cardboard, plastics, glass, steel and aluminium.
The scope is generally to provide contemporary information on the market flows and
conditions for each of these materials and for rubber. As steel and aluminium are a small
component of the kerbside system, and are largely unaffected by trade conditions, these are
not always a focus of the studies behind these reports. This report draws extensively on, and
quotes from, the findings of the reports listed in the reference section and acknowledges the
work of the following authors:
o Envisage Works
o Sustainable Resource Use
o Helen Lewis Consulting
o Industry Edge
o Blue Environment
o MRA Consulting Group
o Steve Balmforth
As it is export markets that have undergone the major changes, these are often the primary
focus of the reports. Glass packaging is not widely exported and therefore is not dealt with in
analysis on changes to export markets. Glass is, however, a major component of kerbside
systems, accounting for 30% of collected material by weight. It is also a product with
recycling market difficulties reflecting the lack of revenue for MRF operators due to the cost
of preparing to the specification for use back into packaging. For this reason, it is a key focus
of much of the recycling analysis and is included for focus in this report.
The two products that have been most profoundly hit by export market restrictions are mixed
grade paper and mixed polymer plastics. These are therefore of primary focus in several
reports.
The Australian recycling collection, sorting and processing system is very broad in activity
covering materials as diverse as concrete, steel, paper, food organics and textiles. In scale it

Sustainable Resource Use Pty Ltd Page 5
is much larger than the kerbside recycling activity. Much of what is handled outside the
kerbside system is largely unaffected by the restrictions imposed by China and others.
Media reports have sometimes failed to convey this, and many in the community would be
surprised that many millions of tonnes of recycling continue to be processed in Australia
unaffected by China restrictions and associated developments. Similarly, many of the non-
kerbside collected paper and plastic materials continue to be exported without the same
difficulty that some household sourced materials face. In the following section there is a
summary of the key findings and reporting on each of the kerbside materials.
Reference to consumption in the report is the total amount of the material entering use on an
annual basis, whether sourced locally or through export. Some of this material will be of a
long-term durable nature and will therefore not necessarily result in waste generation at the
same levels.

Sustainable Resource Use Pty Ltd Page 6
2 SUMMARY
Market
In summary, the local and global markets for the recyclable materials - paper and cardboard, plastics,
and glass are all volatile in 2019. This is largely due to regulatory restrictions on the import of
recycled material into China, and then into some other Asian nations. The market security and pricing
for recyclables is strongly linked to the availability of markets back into new product, either as
packaging or durable goods.
There is a recognition that government and major brands have a role in procuring recycled content
product in order to create the market pull for a healthy circular outcome.
It is unlikely that Australia will have the same opportunities to export recyclable materials in either
the quantity or quality that existed previously. If the recycling system is to remain robust and
national targets for packaging are to be met, then each of the stakeholders will need to address the
issues raised here.
Stakeholder roles
Challenges are apparent for consumers to present recyclables clean and free of contaminant
material. Local government is facing uncertainty in collection and sorting pricing and is under
challenge to commit to procurement of recycled material. It is also facing calls for greater effort to
control contaminants and to adjust collections to accommodate soft plastics and collect glass
separately.
State and federal governments are being challenged to play a strong role in procurement of recycled
content product, particularly in road and parks agency works. There are also calls for funding
assistance to support new reprocessing infrastructure and modifications to sorting and collection
systems.
Brand owners and retailers are being challenged to modify their packaging to conform with
recyclability and to utilise recycled content, particularly in plastics.
Key opportunities
The following opportunities for increased recovery and recycling are covered in each section of this
report.
Plastics Expansion of chemical recycling capacity for PET
Development of chemical recycling capacity for PE
Expansion of mechanical recycling capacity with a focus on post-
consumer PE and PP material
Development of recycling strategies for each significant durable
plastic product
Inclusion of flexible plastic packaging in kerbside collections
Committed procurement of recyclate by governments
Committed procurement of recyclate into packaging by consumer
brands

Sustainable Resource Use Pty Ltd Page 7
Paper and Cardboard Separate collection of glass for improved kerbside paper quality
Subsequent sorting of mixed paper streams
More stringent sorting of paper grades at MRF
Screening and certifying of paper for export
Rubber Tyre derived aggregate
Pyrolysis
Spray seals
Adhesives
Explosives
Playgrounds
Asphalt
others
Glass Geographic expansion of CDS schemes
Expansion of CDS eligible glass to wine and food
Separate collection of glass at kerbside
Brand owner commitment for increased recycled content

Sustainable Resource Use Pty Ltd Page 8
3 MARKET ASSESSMENT FOR PLASTICS
Production and Consumption
According to the Australian Plastics Recycling Survey report, in 2017-18 total plastics use was
3,407,300 tonnes. Of this, 320,000 tonnes were recovered and recycled. This gives a recycling rate of
9.4%. The consumption and recovery rates for each individual polymer varied significantly as shown
in the following table.
While rubber can be classified as a plastic, this can cause some confusion and therefore rubber is not
included in plastics consumption or recycling numbers (See section 4).
Plastics consumption and recovery by polymer type in 2017–18 (tonnes and % recycling rate)
Of the total plastics consumption of 3,407,300 tonnes, 790,200 tonnes were municipal or domestic
packaging, with 163,400 tonnes of domestic packaging recycled, while a further 304,300 tonnes went
into commercial and industrial packaging, with 62,300 tonnes recycled.
The overall plastic packaging recycling rate was 20.6%.
The following table shows the consumption and recovery for each plastics application area.

Sustainable Resource Use Pty Ltd Page 9
Plastics consumption and recovery by application area in 2017–18 (tonnes and % recycling rate)
Application area Recovery Consumption Recycling rate
Agriculture 6 400 90 900 7.0%
Automotive 600 219 700 0.3%
Built environment 5 800 579 300 1.0%
Electrical & electronic 10 500 188 900 5.5%
Packaging – municipal 163 400 790 200 20.7%
Packaging – C&I 62 300 304 300 20.5%
Other application area 58 300 837 500 7.0%
Unidentified applications 12 800 396 500 3.2%
Total 320 000 3 407 300 9.4%
The following chart indicates the relative size of consumption for each plastic polymer and the
recovery rate.
Plastics consumption and recovery by polymer type in 2017–18 (tonnes and % recycling rate)
Polymer type Recovery Consumption Recycling rate
PET (1) 74 900 355 300 21.1%
PE-HD (2) 98 100 656 500 15.0%
PVC (3) 5 900 410 200 1.4%
PE-LD/LLD (4) 57 100 399 900 14.3%
PP (5) 37 500 468 900 8.0%
PS (6) 7 300 63 600 11.5%
PS-E (6) 6 600 87 100 7.6%
ABS/SAN/ASA (7) 5 900 67 300 8.7%
PU (7) 6 500 86 600 7.6%
Nylon (7) 7 700 125 500 6.1%
Bioplastic (7) 0 <100 0.0%
Other (7) 2 600 218 000 1.2%
Unknown polymer 9 800 468 400 2.1%
Total 320 000 3 407 300 9.4%
Current Recycling
The level of export of plastics for reprocessing determined for 2017-18 is the highest yet observed.
In this year 54% of recyclable plastics collected were exported for recycling. For comparative
purposes, in the year 2000 the level of export for reprocessing was 26.0%.
The chart below shows that as plastics recycling has increased over the past two decades, most of
this has resulted in increased export rather than expansion of our local plastics recycling sector. The
local plastics recycling sector is now smaller than it was in 2005.

Sustainable Resource Use Pty Ltd Page 10
Annual Australian plastics recovery 2000 to 2017–18, by location of reprocessing (tonnes)
Presented in the following chart is plastics recycling by source jurisdiction and polymer type in 2017–
18. The high level of recycling in Victoria is contributed to by the disproportionally large plastics
manufacturing sector based in Victoria. Out of the 52,100 tonnes of plastics recovered from Victoria
and reprocessed in Australia, 33,900 tonnes were manufacturing scrap (or ‘pre-consumer’ scrap)
sourced from the plastics manufacturing sector. This compares with only 15,400 tonnes of
manufacturing scrap recovery reported as recovered from NSW.
Recycling by source jurisdiction and polymer type in 2017–18 (tonnes)
Recent assessments of the local and export markets for plastics have shown the following conditions.

Sustainable Resource Use Pty Ltd Page 11
Plastics collected through kerbside collections are generally sent to MRFs and sorted from commingled recycling into either a single mixed plastics grade (1–7 plastic-polymer mix), or more commonly three grades, which are PET, HDPE and the residual mixed plastics grade (a 3–7 plastic-polymer mix, but with some residual quantities of PET and HDPE still present).
Most MRF operators undertake the polymer sorting locally, but others have overseas partners for the polymer sorting so are particularly exposed to import restrictions on mixed and contaminated materials. This is because mixed polymer loads requiring subsequent sorting, are the loads most restricted from Asian market destinations.
Baled PET and HDPE packaging is processed and remanufactured locally and is also exported to a wide range of countries. The main overseas destinations for sorted PET and HDPE across January to May 2019 were Indonesia, Malaysia and Taiwan (in order of quantities). New Malaysian import restrictions entered into force in July 2018 and had a major impact on Australian exports. However, Malaysia receivals of Australian shipments recovered in February and March and were steady in April but a fall in exports in May is apparent.
Prices, demand and supply
There continues to be strong local and export markets for clean baled PET that are collected and sorted to specification, with prices holding fairly steady over the past April–June quarter at $350–$400 /tonne (EXW MRF1).
The price of recycled resin is linked to the price for virgin resin. In the case of PET, the virgin price generally increased across 2018, in part due to China utilising more of this material as it received less imported recyclate, however virgin prices did see some significant falls starting in October 2018 and continuing into early 2019.
The situation is similar for HDPE, with markets and pricing for clean material remaining strong. There was some export price reduction due to the Chinese restrictions with prices falling to around $500 /tonne in early to mid-2018. Prices then recovered somewhat but over the last couple of months have fallen back to the $500 /tonne level. Virgin resin prices have been fairly steady since the first quarter of 2018 at around $1,700–$1,800.
The market for mixed plastic packaging bales continues to be very poor at $0 /tonne or less, assuming it can be sold. Due to a lack of demand for this product it is understood that storage of mixed plastics packaging continues to be undertaken by both MRF operators and reprocessors.
Exported plastics packaging has specifications relating mostly to contamination levels. The positive sorting of PET and HDPE that is undertaken at MRFs allows the baled material to generally meet these specifications without major difficulty or manual sorting input.
Previously plastics packaging has been overwhelmingly exported to China, until the latest round of restrictions. Indonesia is now the largest destination for Australian kerbside plastics, followed by Malaysia and Thailand.
A proportion of the mixed plastic packaging is reprocessed locally and is used in durable (timber
substitute type) plastics applications such as outdoor equipment and building materials. This market
is constrained by the scale of sales for the end products. If government and others buy more of the
end products, there is an ability for the companies to take in more material for recycling.
Plastic packaging exports from Australia compete in receiving countries with plastics from the US,
Europe and many other countries. It is destined for wherever the market requires material for
production. Generally, demand and pricing will increase or decrease based on worldwide supply and
demand conditions.
1 EXW MRF means that the sale price is an estimate at the outgoing gate of the MRF.

Sustainable Resource Use Pty Ltd Page 12
Exports of kerbside recovered mixed plastic packaging have dropped dramatically over the past few
years. In 2016 exports were around 42,000 tonnes, down to 37,000 tonnes in 2017 and then 29,000
tonnes in 2018. So far this year, January to May 2019 exports have been around 12,000 tonnes, so the
level appears similar to that of 2018.
The falls across 2017 and 2018 were driven entirely by lost sales to China, with exports to Malaysia and
Indonesia taking up some of this material. Malaysian sales dropped sharply after the introduction of
import restrictions around July 2018 but have seen strong recovery across February–April of this year,
and steady exports in May.
The level of stockpiling of sorted and baled plastics has become a much more significant issue around
the country. It is particularly acute in Victoria where the challenges at SKM (fires and enforced closures)
have seen material destined for export banking up.
Context
The following table shows the virgin prices for different polymers in Australia.
n material commodity values end June 2019 ($/tonne)
Material category Value
Plastic – PET (1) virgin resin $1,300–$1,400
Plastic – HDPE (2) virgin resin $1,700–$1,800
Plastic – PVC (3) virgin resin $1,000–$1,200
Plastic – LDPE (4) virgin resin $1,700–$1,800
Plastic – PP (5) virgin resin $1,600–$1,700
Plastic – PS (6) virgin resin $1,900–$2,000
To provide some context, plastics manufacturers sometimes report that recycled plastics have to be around 10–20 per cent cheaper than virgin resin to justify the additional purchasing, handling, processing and quality assurance cost imposts associated with introducing a significant proportion of high quality recycled content into the incoming material mix.
In 2018 all State and Federal governments committed to targets related to the recycling and
waste reduction of packaging.
The 2025 National Packaging Targets are:
1. 100% of all Australia’s packaging will be reusable, recyclable or compostable by 2025 or earlier
2. 70% of Australia’s plastic packaging will be recycled or composted by 2025
3. 30% average recycled content will be included across all packaging by 2025
4. Problematic and unnecessary single-use plastic packaging will be phased out through design, innovation or introduction of alternatives
The achievement of the target for 70% of Australia’s plastic packaging to be recycled is going to require a major expansion of plastics recycling activity.

Sustainable Resource Use Pty Ltd Page 13
Expanded activity
In an environment of constrained export markets for some plastics, the need to dramatically increase local plastic reprocessing is seen as crucial. That expansion may need to be a 400% increase in throughput and this in turn will require new market outlets for recycling plastic resin, both into packaging and other applications.
In relation to flexible plastics, this is the fastest growing packaging media and now accounts for a third of all plastic packaging. The achievement of the target for 70% of plastic packaging to be recycled by 2025 will require a significant increase in both rigid and flexible plastic packaging recycling from its current level of 20.6%.
Flexible plastic packaging is currently not designated for inclusion in most kerbside collections. Point of sale drop off collections are seen as an interim measure and are yielding a very small proportion of flexible plastic packaging. There are four councils in Melbourne who include flexible plastic packaging into commingled kerbside collection. This is in the form of putting bags in a bag to aid sorting at the MRF. This approach is being actively considered by other councils in several jurisdictions.
Opportunity 2020-25 Current Take
(tonnes)
Potential Take (tonnes) Current Price/tonne
Expansion of chemical
recycling capacity for PET
>12,000 >50,000 $300-500
Development of chemical
recycling capacity for PE
0 >50,000 $300-500
Expansion of mechanical
recycling capacity with a
focus on post-consumer PE
and PP material
225,000 >200,000 $200-500
Development of recycling
strategies for each
significant durable plastic
product
minimal > 300,000 $200-500
Inclusion of flexible plastic
packaging in kerbside
collections
minimal >100,000 $0-150
Committed procurement of
recyclate by governments
minimal >100,000 $300-500
Committed procurement of
recyclate into packaging by
consumer brands
minimal >100,000 $300-500

Sustainable Resource Use Pty Ltd Page 14
4 MARKET ASSESSMENT FOR PAPER AND CARDBOARD
Paper market
Paper and cardboard packaging is the dominant from of packaging and accounts for over half of the
packaging in the Australian market. For many years, the collection and sale of paper and cardboard
packaging has underpinned the kerbside recycling system and commercial recycling collections. The
dominant fibre packaging material is corrugated cardboard for box production. There are also
significant quantities of non-corrugated boxboard into applications such a cereal box.
There is also a supply of moulded fibre packaging into applications such as egg cartons. These
packaging formats account for the biggest fibre use format. There is also fibre consumed at household
level as newspaper and magazine, and printing and writing paper grades across household and
commercial sectors. Both of these paper uses are declining. A smaller amount of fibre goes into tissue
product production and most of this is into applications that are not recoverable.
Demand for products that need to be packaged locally in corrugated boxes has remained relatively
stable.
Prices, demand and supply
Recovered paper and paperboard prices appear to have stabilised somewhat in the global market in
June. Local demand and supply are generally unaffected because the main local users (manufacturers
of recycled paperboard for use in corrugated carton manufacture and newsprint manufacturers) are
experiencing relatively normal demand.
Kerbside collected mixed paper & paperboard continues to be almost unsaleable locally or through
export in any significant volume and has a current value of around $0 /tonne. Little has changed in the
local market over the last few months, with respect to sales.
Non-kerbside (and low contamination) sourced newsprint and magazine grades continue to be
purchased in the Australian market at prices as high as $250/tonne. However, there is generally no
sorting of these grades by most Australian MRFs, severely limiting the supply and quality of available
material.
Premium prices (as much as $350 /tonne) are available for the negligible volumes of post-consumer
sorted white office paper or bleached kraft, that is available in the market. Pre-consumer volumes
from printers and converters is highly sought after and premiums are still paid for what is a limited
supply.
Sorted and baled cardboard prices continued to be under stress at the end of June 2019.
Sorted grade paper
Market demand for the MRF sorted mixed paper & paperboard product remains negligible. Visy is
understood to be the only MRF operator moving any paper & paperboard. This is due to its vertical
integration with its own papermills. It is unique in being able to take material in and produce a recycled
sheet with strong end-markets.
Unless secondary sorting of MRF mixed paper & paperboard (to multiple higher quality grades)
meets the requirements of a local or international market, it will not find an end market.

Sustainable Resource Use Pty Ltd Page 15
Sorted grades can be achieved by two methods or a combination of these. Firstly, different grades of
paper and cardboard can be kept separate at the generation source. This then requires each grade to
be collected separately to maintain its fibre purity and value. This method of source separation
means the different grades do not require subsequent sorting and can be delivered directly to the
end market either locally or globally. Source separated material usually is in stronger demand and
attracts a high purchase price accordingly.
The alternative is to collect all grades together, and often with other materials, and then subject this
material to a paper grade separation. This allows a more efficient collection, particularly at a
household level. The product of subsequent sorting often produces a grade separation below the
internationally accepted specifications for each paper grade.
If the paper and cardboard has not been mixed with glass, is not highly compacted and is sorted at a
rate below some high speed MRF’s, it can produce paper of sufficient quality. It is one of the key
reasons, collection of glass separate from other recyclables is being trialled and considered for
adoption at kerbside.
Sites that generate larger volumes than detached housing, such as commercial sites and multi-unit
dwellings, offer the opportunity to collect paper and cardboard separate from other materials, and
often to collect specific grades separately for optimal market outcomes.
Export and interstate market review
In May, kerbside related exports from Victoria were around 12,000 tonnes, and total recovered
paper exports from Victoria totalled 46,000 tonnes (kerbside plus all other sources). This result was
similar to April.
The average export price in May was down to around $160 /tonne on a free-on-board (FOB) basis
($170 /tonne in April). Given the sharp downturn in virgin pulp prices reported last month,
expectations are that export prices will trend a little lower in coming months.
The following key observations have recently been made:
Contaminant standards will tighten in key markets across the second half of 2019 and into 2020, implying less recovered paper will be exportable than normally observed.
In May 2019, virgin pulp prices slumped in the main Chinese market. The major traded pulps experienced, on average, a 12.5 % decrease in prices in May relative to April 2019. Prices fell a little further into June but appear to have largely stabilised.
The closure of SKM Recycling is likely to result in significant quantities of paper & paperboard being sent to landfill in the short to medium term. This will affect Victoria, Tasmania and, possibly, South Australia.
The following table shows the trend in export of Victorian recovered kerbside paper & paperboard. The trend and destinations are likely to be similar for other states.
Victorian recovered kerbside paper & paperboard, to export country (tonnes/month)
Figure 2.1.2 – Victorian recovered kerbside paper & paperboard, to export country (tonnes/month)

Sustainable Resource Use Pty Ltd Page 16
Source: ABS (2019) and Envisage Works
Market risks, opportunities and activities
One of the major risks associated with stockpiling materials has crystallised over the last couple of
months, with the distressed sale and/or insolvency of Victorian sorter SKM. The other MRF operators
in Victoria are likely to also be highly stressed at the current time. The increasing stockpiles of
recovered paper, and other recyclables, are economically damaging and increase the risks of operating
MRFs, from a regulatory and commercial perspective.
Over the next few months it appears likely that significant quantities of kerbside commingled
recyclables, previously going to SKM, will be disposed to landfill (possibly around 10,000–20,000
tonnes/month).
Some material will be diverted to the other MRF operators. However, a proportion of the recovered
mixed paper & paperboard, mixed glass and mixed plastics still do not have end-markets and so will
be placed into storage, increasing the storage related risks for those companies.
Moving on from the SKM situation, a significant opportunity in the fibre market is to undertake a
secondary sort (following primary sorting by MRFs) of larger quantities of paper and cardboard, free
from the major contaminants. A major contaminant is glass, and as Australian Paper Recovery (APR)
appears to be demonstrating, when the glass is removed (or excluded from the incoming stream in the
case of APR) and sorting occurs, satisfactory grades of recovered papers can be achieved.
This approach appears to be a path forward, where source separation might be introduced selectively
and progressively. This would provide scrap paper and paperboard products of ever improving quality
and quantity, suitable for domestic reprocessing or for sale into export markets.
Opportunity Current Take (tonnes) Potential Take
(tonnes)
Current Price/tonne
Separate collection of
glass for improved
kerbside paper quality
0 >200,000 $0-50

Sustainable Resource Use Pty Ltd Page 17
Subsequent sorting of
mixed paper streams
minimal >100,000 $0-50
More stringent sorting of
paper grades at MRF
minimal >200,000 $0-50
Screening and certifying
of paper for export
980,000 980,000 $150-200

Sustainable Resource Use Pty Ltd Page 18
5 MARKET ASSESSMENT FOR RUBBER
5.1 Tyre consumption and waste generation
Rubber, in the form of tyres is a significant resource and also a major waste management challenge.
The primary materials for end of life tyres-rubber and steel, are valuable materials, however the
economic recycling of these is difficult.
In 2017 a used tyres market development strategy was developed by Tyre Stewardship Australia and
a range of government agencies.
In 2015-16 Australia generated 447,000 tonnes of end of life tyres. This equated to 56.3 million
Equivalent Passenger Tyre Units (EPU’s). The generation of end of life tyres (EOLTS) had increased by
16% over the previous six years. New tyre sales had increased 50% since 2007-08. Based on this
increase the projected tyre sales for 2019-20 was over 58 million EPU’s. The industry currently lists
sales at 56 million EPU’s, possibly reflecting reduced new car sales or a decline in mining activity.
Data for 2015-16 showed 60-65% of all waste tyres were disposed of to landfill or dumped or illegally
stockpiled.
The fates of EOLTS were summarised as:
o 63% landfill or unknown (no value)
o 27% exported (low value)
o 10% locally recycled (high value)
Local recycling was limited by both lack of markets for tyre derived products and a strong
international demand for tyre-derived fuels.
Local recycling, though small was increasing significantly, doubling to 44,000 tonnes between 2013-
14 and 2015-16.
Markets for Tyre Derived Products (TDP’s) were summarised in descending order of size as follows:
o Tile adhesives
o Spray seals
o Playgrounds
o Sports surfaces
o Steel making (steel component)
o Other minor markets
The tyres being exported were in the form of baled tyres (81%) or shredded tyres (19%). These were
used predominantly as a fuel in cement kilns, industrial boilers, power plants and other industrial
applications. When burnt in a controlled environment, the tyres have a similar calorific value to black
coal. There was no current burning for recovered energy in Australia.
5.2 Market Barriers
A range of barriers to growing the market for TDP’s were identified. These included:
Low barriers to entry for collection
New collectors can capture volume from retailers, undercutting larger recyclers and often ending in
stockpiling or dumping.

Sustainable Resource Use Pty Ltd Page 19
Transport costs
The geographic scale of Australia presents challenges to collection costs and accordingly more tyres
are landfilled in rural and remote areas.
Regulatory settings
States with weak regulatory frameworks can see higher levels of stockpiling and dumping.
Conversely, restrictions on storage of processed EOLTs can restrict large contracts being serviced.
Infrastructure costs
There are high infrastructure costs for higher value facilities such as crumbing and granulating. These
can cost between $2M and #10M depending on scale.
Retailer disposal fees
These are often inflated by as much as 500% and not passed through to the tyre recycling industry. In
some cases, this is referred to as a recycling fee despite the tyres going to landfill.
Cheap imports
Import of cheaper crumbed rubber product can undercut the markets for locally produced recyclate.
Sometimes the lower price is the result of subsidies in the generating country and can be as much as
40% cheaper.
Standards and specifications
The lack of standards that apply directly to TDPs or excluding standards can be a major barrier to
market use.
Attitudes and awareness
Entrenched attitudes tend to favour virgin or traditional products and so new products can find it
difficult to enter new markets.
Market scale
The local recycling industry can struggle to scale up to meet demand in some markets.
5.3 Opportunities
In estimating the market impact of different opportunities for TDP’s, the analysis looked at short,
medium- and long-term impacts. The following table indicates the scale of long term (10 year)
market opportunities.
Opportunity Potential Take (tonnes)
Tyre derived
aggregate
>50,000
Pyrolysis >35,000
Spray seals >25,000
Adhesives >25,000
Explosives >25,000
Sustainable Resource Use Pty Ltd Page 20
Playgrounds >20,000
Asphalt >10,000
others >50,000
The key focus of attention in the shorter term is in the following:
1. Road construction applications such as a polymer modified binder in sprayed seals and
asphalt production
2. Rail construction as ballast stabilization
3. Nonstructural civic construction, particularly as a drainage medium.

Sustainable Resource Use Pty Ltd Page 21
6 MARKET ASSESSMENT FOR GLASS
Production and Consumption
There are two glass packaging manufacturers in Australia. Glass packaging is produced from virgin
materials such as silica and soda ash or from recycled glass known as cullet. The largest producer is
Owens Illinois (O-I) who produce around 650,000 tonnes of glass packaging for a range of beverage
and food applications. Beer and wine bottle usage dominates this.
They operate glass making plants in four locations - Adelaide, Melbourne, Sydney and Brisbane. In
addition, they operate the glass beneficiation plant in Brisbane. Their other manufacturing plants are
supplied with cullet from beneficiation plants operated by Visy Recycling, SKM and Polytrade. Their
total cullet (recycled glass) usage is around 350,000 tonnes.
Orora operates glass manufacturing in Adelaide, primarily geared to supply wine bottles for the
South Australian wine producing market. Their total production is around 380,000 tonnes. Their
cullet usage is between 75-80,000 tonnes. They source from the Visy Adelaide beneficiation plant
that supplies cullet to the Orora bottle production plant.
In combination, the two companies-O-I and Orora, produce a little over one million tonnes of glass
packaging each year. Some of this is exported as bottled wine. Offsetting this export is the import of
a quantity of both empty glass packaging and full beer, wine and food packaging. In total the glass
packaging consumption figure for Australia is estimated at 1.275 million tonnes.
Current Recycling
The cullet use in Australian bottle production is around 407,000 tonnes or an estimated 32% post-
consumer recycled content in Australian bottles. A further 146,000 tonnes of pre-consumer glass is
estimated to be added to production. This varies from state to state with higher levels in South
Australia and lower in other states. This variation is linked to two aspects. Deposit collection systems
in SA, NT, NSW and recently QLD have seen more higher quality cullet available in these markets. In
addition, the demand for packaging can vary by state, by colour and by season. It is easier to utilise
recycled content in amber and green coloured bottles than it is for clear (flint) coloured packaging.
O-I has adopted an international target to achieve 50% post-consumer recycled content in its glass
packaging. Here in Australia and New Zealand it is setting a goal to achieve 60% content. Technically
it can go higher, possibly to 80% depending on quality of cullet and the colour specifications of its
customers. For every 10% of cullet used, the energy saving is 3%. The same increase also results in a
carbon emission reduction of 5%. The O-I furnaces in each capital city benefit from cullet use as it
requires less maintenance.
The prices paid for glass cullet into the furnace is complex. The glass coming out of sorting facilities
carries significant levels of contaminants. As a result, losses during beneficiation can be significant. A
market analysis of glass packaging published by Sustainability Victoria in 2014 estimated that around
34 per cent of glass that is collected for recycling is lost through collection, sorting and beneficiation
losses. This has been verified recently by glass industry sources.
Gate fee rates for MRFs sending material for beneficiation can vary, based on quality and quantities.
Gate fees of $0 /tonne (EXW MRF2) to -$30 /tonne (EXW MRF) are reported.
2 EXW MRF means that the sale price is an estimate at the outgoing gate of the MRF.
Sustainable Resource Use Pty Ltd Page 22
There is a small amount of separated glass going directly from pubs and clubs to beneficiation. This material is cleaner and generates a gate price of approximately $70 per tonne.
The cost of beneficiation is estimated at around $150–$200 per tonne.
Container Deposit Schemes
When the glass is coming from CDS schemes, the contaminant levels are lower, and the value into
beneficiation is higher accordingly. It is reported that the figure applied to pub collections is around
$70 tonne depending on quality. Colour sorted CDS glass is higher value than mixed colour CDS glass.
CDS schemes vary in how they handle the glass, and some have different levels of optical sorting
equipment based on the minimum fragment size they can sort for contaminants and colour. The
bottles collected in South Australia stay intact longer, reducing the risk of contaminants, and would
therefore be expected to gain a higher price into beneficiation.
While there are prospects for increased glass to be collected at a higher quality through CDS
schemes, the matching of these tonnes to beneficiation plants and demand for each colour in each
state may present challenges. A key aspect is that the beneficiation plant operators are often the
MRF operators and will prioritise processing their own sourced material over CDS sourced glass.
New approaches to collection and reprocessing
Beyond taking glass packaging waste back into packaging production, there are a range of other
secondary markets that can be used, but these do not offer a high market price. These include glass
into road base material, abrasives, and filter media. The Alex Fraser Group has recently announced a
new plant geared to blend glass into asphalt and a range of other road making products. Their plant,
which opened in Melbourne in 2018, is capable of recycling up to 150,000 tonnes a year, equating to
four million bottles per day. This process separates metals, paper and other contaminants. It has a
higher tolerance of CSP (ceramics, stones and porcelain). The gate fee for glass fines into road
material is likely to be -$75 tonne. This places it below the cost of landfill but higher than applies into
beneficiation.
In recent weeks, the regulatory enforced closure of the beneficiation plant operated by SKM and
sister company Glass Recycling Service is likely to result in significant quantities of glass being sent to
landfill in the short to medium term. Thirty Victorian councils were sending material to this sorter.
The pricing of cullet into glass packaging production is competing directly with virgin material
production. The virgin material inputs are estimated to be in the range $550-650 tonne.
Source Separation
A number of councils are currently trialling the collection of glass separate from other recyclables.
The driver for this is twofold. First, by collecting and sending glass directly to beneficiation, there is a
saving from glass losses in MRFs and a cleaner product is provided for bottle production. Second, the
glass fragments that cause significant problems to recycled paper production are kept out of the
fibre. Based on European experience and the current trial results, separate glass collection could
become a major focus in Australian kerbside systems.
Non packaging glass
There are quantities for sheet glass reaching end of life in the automotive and building sectors. Each
year over 800,000 vehicles are taken off the road and, in most cases, these are sent to metal
recyclers for steel and non-ferrous recovery. There is little glass window recovery in vehicle recycling
systems in Australia. In the Netherlands all material from vehicle metal recyclers are required to be
sent to a plant equipped to recover glass as well as plastics, rubber and textiles. This offers a model
for consideration by Government and industry in Australia.

Sustainable Resource Use Pty Ltd Page 23
In addition to vehicle shredding, there is also a significant windscreen replacement industry. Some of
these windscreens are sent to Potters Industries who grind the glass into round spheres where they
are added to road line marking paint to aid reflect ability. Other smaller, high end military
applications can command very high value. There is presently very little recovery of window glass
from either the automotive or building demolition industry.
6.1.1 Opportunities for increased recyclate take
Glass back into packaging
If glass can be collected and provided for beneficiation in large enough fragment size for sorting, and
in a form free from contaminants, there are opportunities for additional cullet usage into packaging
production. This could amount to an additional 200,000 tonnes.
This material could be sourced from either CDS systems or from glass separate collections. The
quality requirement would also extend to matching glass colour supply and demand in each capital
as interstate transport is very costly. There would also need to be acceptance of a higher recycled
content product by the brand owners utilising glass packaging.
Beneficiation access and capacity
In some cities, the ability to process additional tonnes would require an increased throughput of
tonnes at beneficiation plants. Some of these plants may have throughput constraints due to optical
sorting equipment that is not able to detect below a certain fragment size. There may also be
competition for access for material coming from contracted kerbside contracts rather than CDS.
Some expansion of beneficiation capacity or sorting technology may be crucial if existing
beneficiators
CDS expansion
Road material applications
Opportunity Current Take (tonnes) Potential Take
(tonnes)
Current
Price/tonne
Geographic expansion of CDS
schemes
126,000 200,000 $70
Expansion of CDS eligible glass
to wine and food
126,000 200,000 $70
Separate collection of glass at
kerbside
minimal 200,000 $70
Brand owner commitment for
increased recycled content
300,000 450,000 -$30-$0
Sustainable Resource Use Pty Ltd Page 24
7 KEY FINDINGS
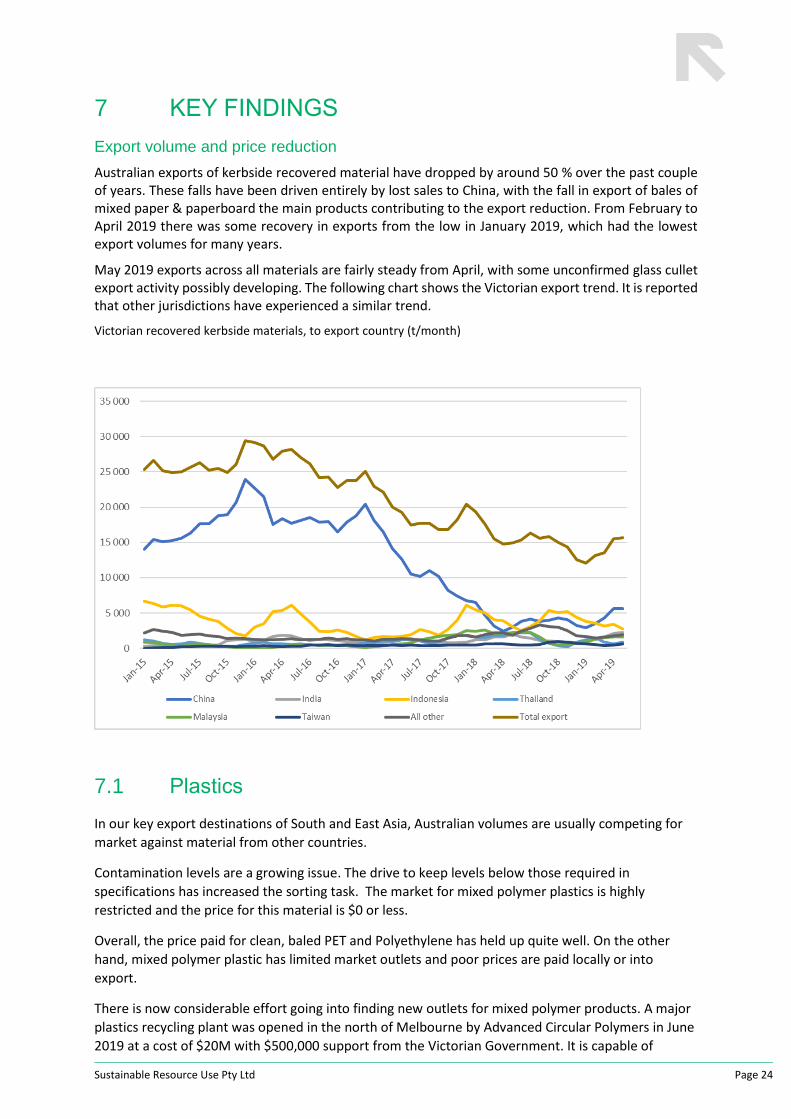
Export volume and price reduction
Australian exports of kerbside recovered material have dropped by around 50 % over the past couple of years. These falls have been driven entirely by lost sales to China, with the fall in export of bales of mixed paper & paperboard the main products contributing to the export reduction. From February to April 2019 there was some recovery in exports from the low in January 2019, which had the lowest export volumes for many years.
May 2019 exports across all materials are fairly steady from April, with some unconfirmed glass cullet export activity possibly developing. The following chart shows the Victorian export trend. It is reported that other jurisdictions have experienced a similar trend.
Victorian recovered kerbside materials, to export country (t/month)
Figure 1.4.1 – Victorian recovered kerbside materials, to export country (t/month)
7.1 Plastics
In our key export destinations of South and East Asia, Australian volumes are usually competing for
market against material from other countries.
Contamination levels are a growing issue. The drive to keep levels below those required in
specifications has increased the sorting task. The market for mixed polymer plastics is highly
restricted and the price for this material is $0 or less.
Overall, the price paid for clean, baled PET and Polyethylene has held up quite well. On the other
hand, mixed polymer plastic has limited market outlets and poor prices are paid locally or into
export.
There is now considerable effort going into finding new outlets for mixed polymer products. A major
plastics recycling plant was opened in the north of Melbourne by Advanced Circular Polymers in June
2019 at a cost of $20M with $500,000 support from the Victorian Government. It is capable of

Sustainable Resource Use Pty Ltd Page 25
processing 70,000 tonnes of plastic annually. The company may have market connections for the
product that the plant produces.
There is now an increased focus on markets for recycled resin, including assessment of the role
government procurement can play in providing outlets for kerbside sourced recyclate.
7.2 Glass
There are currently excessive losses of glass in collection and sorting of around 30-40%. A lot of
thought, and some trialing of different systems, is occurring to seek a better outcome for collected
glass packaging.
There are adequate glass packaging market outlets back into packaging production through
beneficiation facilities in four capital cities.
More glass is coming through deposit systems which produce cleaner glass with less contaminants
and generates a higher price into packaging production.
O-I and Orora are committed to increased cullet usage through each of their five glass production
facilities.
In some states there are now strong secondary markets for application to road construction material.
These may prove to be substantial and deal with glass fragments that cannot meet packaging
production requirements.
Most sorters receive no revenue for their glass but pay a fee. This is at a level well below landfill
disposal costs. With more material coming back through deposit systems, the MRF tonnes may
decrease and access to beneficiation will need to be assured.
7.3 Paper and cardboard
The sorting of paper and cardboard more diligently to specification will likely open up greater local
and export destinations and prices. The Australian recycling system will need to evolve to be less
reliant on export destinations. Recycled material will need to lock markets into packaging production,
newspaper and magazine manufacture, and moulded fibre products. To achieve this, glass separate
collections will assist in specification compliance, as will a more diligent sorting of fibre fractions.
The market pull for paper will increase as more brand owners demand higher recycled content of
their packaging.
There also needs to be a recognition that Australia is a net importer of goods and therefore export of
packaging to supplying country markets will be necessary. Rather than focussing on export of
wastepaper, the domestic pulping of the paper and export of pulp may be more market secure and
will maximise employment through the value adding of the pulping process.

Sustainable Resource Use Pty Ltd Page 26
8 SUMMARY
Market
In summary, the local and global markets for the recyclable materials - paper and cardboard, plastics,
and glass are all volatile in 2019. This is largely due to regulatory restrictions on the import of
recycled material into China, and then into some other Asian nations. The market security and pricing
for recyclables is strongly linked to the availability of markets back into new product, either as
packaging or durable goods.
There is a recognition that government and major brands have a role in procuring recycled content
product in order to create the market pull for a healthy circular outcome.
It is unlikely that Australia will have the same opportunities to export recyclable materials in either
the quantity or quality that existed previously. If the recycling system is to remain robust and
national targets for packaging are to be met, then each of the stakeholders will need to address the
issues raised here.
Stakeholder roles
Challenges are apparent for consumers to present recyclables clean and free of contaminant
material. Local government is facing uncertainty in collection and sorting pricing and is under
challenge to commit to procurement of recycled material. It is also facing calls for greater effort to
control contaminants and to adjust collections to accommodate soft plastics and collect glass
separately.
State and federal governments are being challenged to play a strong role in procurement of recycled
content product, particularly in road and parks agency works. There are also calls for funding
assistance to support new reprocessing infrastructure and modifications to sorting and collection
systems.
Brand owners and retailers are being challenged to modify their packaging to conform with
recyclability and to utilise recycled content, particularly in plastics.

Sustainable Resource Use Pty Ltd Page 27
9 REFERENCES
Victorian Government (2019) Recovered Resources Market Bulletin
APCO (2019) Packaging Consumption and Recycling Data
APCO (2018) Market Assessment Report -Chinese Import Restrictions
Fed and state governments (2000-2018) Australian Plastics Recycling Survey
Sustainability Victoria (2018) Chinese import restrictions impact assessment on Victoria
ACOR (2018) China National Sword-The role of Federal Government
APCO (2016) National Recycling and Recovery Survey (NRRS) for plastics packaging
ACOR (2018) Ten point plan for results based recycling
Sustainability Victoria (2013) Recycled materials market report