recycling: need of the hour - gravita india ltd
TRANSCRIPT

Recycling:Need ofthe Hour
We recycle to save environment
Gravita India LimitedAnnual Report 2019-20

1-15All about Gravita
We explain who we are, where we operate, our business model and strategy, corporate action and a summary of how we performed.
1 Cover story
2 Our business identity
4 On the path of success!
8 Performance review by our Chairman
10 Our financial journey
11 Our key milestones
12 Key future trends in our business
13 Social responsibility initiatives
14 Our business model
16-83Statutory Reports
We explain our approach to corporate governance and give details of the Company’s operating stakeholder value creation.
16 Management Discussion & Analysis Report
23 Board Report
63 Corporate Governance Report
84-228Financial Section
This section contains the financial statements, the auditors’ report, the accounting policies and the notes forming part of the accounts.
85 Standalone Financials
155 Consolidated Financials
Disclaimer
This document contains statements about expected future events and financials of Gravita India Ltd, which are
forward-looking. By their nature, forward-looking statements require the Company to make assumptions and
are subject to inherent risks and uncertainties. There is significant risk that the assumptions, predictions and
other forward-looking statements may not prove to be accurate. Readers are cautioned not to place undue
reliance on forward-looking statements as a number of factors could cause assumptions, actual future results
and events to differ materially from those expressed in the forward-looking statements. Accordingly, this
document is subject to the disclaimer and qualified in its entirety by the assumptions, qualifications and risk
factors referred to in the Management Discussion and Analysis of this Annual Report.
Find this Annual report online at
www.gravitaindia.com

Four fields of business, one explicit emphasis: Preserving resources for the future through recycling!At Gravita, as one of the world’s leading recycling companies, we are delivering innovation and working to the highest standards to conserve our planet’s natural resources and promoting sustainable development.
All our four specialist business interests – Lead, Aluminium and Plastic recycling, and Turnkey Solutions for recycling infrastructure development, are at the forefront of advancing awareness of the need to protect the environment, bolstered by heightened responsiveness amongst both producers and consumers, and also by regulations that are becoming more stringent over time.
Corporate Overview Statutory Reports Financial Statements
2
Our business identity
At Gravita we understand that responsible recycling not only creates sustainable value for the green economy, but for our stakeholders too!

3
Annual Report2019-2020
Business: The Company possesses specialist
experience in recycling of used Lead-Acid
Batteries, Cable Scrap/other Lead Scrap,
Aluminium Scrap and Plastic Scrap, etc.
Network: Gravita has a well-entrenched global
scrap collection network that helps it to secure
scrap resources at globally competitive prices.
Manufacturing Facilities: Gravita’s state-of-
the-art recycling facilities are located in the
established growth centres of Asia, Africa and
Central America.
Products: The Company’s recycled products
include pure Lead, Lead Alloys, Lead Powder
and Oxides, Aluminium Alloys, PP Granules and
PET flakes that find application in a variety of
industries and sectors.
Heritage: Incorporated in 1992, Gravita is a pure-
play global resource recycling company with a
diversified product and geographic presence.
121,819 MTPALead recycling capacity
19,200 MTPAAluminium recycling capacity
26,400 MTPAPlastic recycling capacity
100 +Global customers
1,200 +Workforce
12Manufacturing plants

Corporate Overview Statutory Reports Financial Statements
4
On the path of success!
At Gravita our ability to capture value from the waste we collect and through our modern recycling and recovery processes, we are able to foster a profitable and environmentally-sustainable business model that is set to scale.

5
Annual Report2019-2020
Our strong heritage and global reputation give us a competitive edge and makes it challenging for new and existing players to compete with us. Further, we possess a robust and well-established track record of reinvesting in our business, people, infrastructure and processes, and have a deep and unrivalled understanding of the global non-ferrous recycling industry, which comes with close to over three decades of experience. Further, our well-planned focus on Aluminium and Plastic recycling not only helps in product/revenue diversification, but is also synergistic with our operating model in terms of helping us optimise our resource aggregation and other variable costs.
Our business model is further bolstered by our turnkey technical services division that provides us with an unparalleled R&D advantage in technology, process quality and construction cycles. With recovery being the most critical viability determinant of the recycling industry, our continuous focus on efficiency and value engineering not only enable us to operate our own plants at global standards, but also open up our ability to consult third-party players, thus creating a valuable revenue stream.
These aspects, along with our scalable infrastructure and diversifying global recycling platform, distinguishes us from our competitors, thus paving the path for an exciting growth journey ahead.
60 +Turnkey orders executed

Corporate Overview Statutory Reports Financial Statements
6
On the path of success!
At Gravita we have a clear strategy for growth, anchored on the strategic pillar of profitability accretion. This is underpinned by our focus on the specific opportunities under product value-addition, capacity utilisation and globalisation.
Sales Mix
52 %Domestic Sales
48 %Export Sales

7
Annual Report2019-2020
Premiumisation is an ongoing strategy at Gravita, as we shift focus to enhancing value-added products in our portfolio, particularly concentrating on alloys and value added products wherein we have better premiums, and with our technology and strong process knowhow we are able to control incremental refining costs, thus boosting prospects for higher profitability.
The second part of pursuing opportunities in the space of capacity utilisation comprises our focus on optimising production and productivity levels across all our plants. We expect to incur only maintenance capex at least over the next 12-15 months with a view to enhance the capacity of our machinery and infrastructure to augment production. Further, adequate space availability across some of our key manufacturing facilities boost prospects for developing/expanding recycling capacities for both Lead and non-Lead products.
Over the medium- to long-term, we will continue to explore global organic/acquisition opportunities across a variety of recyclable products. Setting up overseas assets facilitates better working capital management as it optimises resource costs, while also improving Lead times.
We believe that these focus areas will enable us to expand our growth prospects sustainably, resting on stronger foundations.

Corporate Overview Statutory Reports Financial Statements
8
Performance review by our Chairman
At Gravita our focused approach in resourcing the world will gain accelerated precedence in the months and years ahead, as environmental management and green concerns come to the fore.
Dear Shareholders,
Resources have become a central issue for Gravita’s clients as they increasingly turn to secure their requirements amidst scarcity and pollution concerns. This duality is on account of both surplus withdrawals from nature that have led to deficiencies, as well as excess emissions that have Lead to a deteriorating environment.
In such an operating context, as a Company with longstanding experience in the resources and recycling business, we have seen from up close our growing relevance in global supply chains, as well as in helping protect and preserve the environment, while advancing the green economy.
- Dr. Mahavir Prasad Agarwal Chairman and Whole-Time Director
Reinforcing our specialist position in secondary Lead
Lead is one of the most recycled resources in terms of its recovery rate. It can be re-melted infinitely to remove impurities, thus making it easily identifiable and cost-effective to aggregate and recycle. Further, the quality of recycled Lead is near-identical to primary Lead collected from mining. Hence, over 65% of Lead used in the production of new Lead products is sourced from recycled Lead.
As a Company with specialist position in secondary Lead manufacture, our core competencies include our deeply-embedded global Lead scarp collection network and our plants that are located close to these scrap collection centres. Further, we possess robust technical expertise that enable us to secure best-in-class Lead recovery rates from scrap, with incremental recoveries being directly accretive to profitability. Our rich R&D expertise and sound knowledge around the science of Lead has reinforced our turnkey services offering for third-party clients in recycling infrastructure, thus opening up a growing revenue stream and enabling us to continuously improve our technical services.

9
Annual Report2019-2020
During the year 2019-20, we made good progress in establishing a new Lead recycling facility in Accra, Ghana through technology transfer to a location that offers us with the benefits of a free zone. We are also engaged in capacity expansion at this plant to 12,000 MTPA. Further, as part of our focus to enhance our footprint in Africa, we also established Tanzania’s first export-oriented recycling plant in Dar es Salaam, a major city and commercial port, of capacity of 3,000 MTPA for Lead and 6,000 MTPA for aluminium.
Going forward, with a view to strengthening our recycling base, we are also in the process of establishing a new recycling facility in Mundra, Gujarat that has the potential to lower our logistics costs, hence optimising our working capital requirements.
Focused on achieving growth and efficiency
Despite macro headwinds, Gravita emerged from 2019-20 stronger and more dynamic. During the year, the Company continued with its rigorous and pragmatic strategy, focused on the dual momentum of achieving both growth and efficiency. This growth momentum sought to amplify our organic development focus with enhancing existing efficiencies and plant utilisation levels.
Through such a twofold focus, we will steadily expand our geographic and sector platforms. Our efficiency momentum is rooted on our operating performance improvement and cost saving programs that enable us to fund our expansion, improve our profit levels and diversify and derisk our business. This focus relies not only on the technical quality of our offerings, but also on our clients’ confidence in our operations, by virtue of us placing strict adherence to ethics and compliance.
Importantly, widening and strengthening our recycling platform is a natural extension, as it enables us to achieve synergies in waste aggregation, while also lowering the costs associated with collection. This feature was most visible in our new 6,000 MTPA aluminium recycling facility in Tanzania that witnessed high stabilisation since its establishment in July 2019. With our growing focus on value-addition, blended with lower resource costs enabled us to achieve both topline and profitability acceleration at our aluminium recycling business during the year.
Moreover today, emboldened by the insights, knowledge, network, infrastructure, capacity and resources that we have created across our business, we are exploring further attractive opportunities in the value chain, including such new streams as tyre, paper, e-waste and waste oil recycling, etc. We are also closely appraising end of life vehicle policy and even EPR, or extended producer responsibility, policy that will enable us to dovetail with
the evolving requirements of the world.
While we continue to focus on bolstering our business in India and Africa, we are also simultaneously looking into tapping opportunities in Latin America, Europe and Australia. With a view to further bolster our foundations, we are developing new scrap collection centres in Africa and Latin and North America, while also consolidating our pan-India scrap collection network. In parallel to such infrastructure development activities, we are also looking to enlist more clients through back-to-back arrangements.
Looking forward with optimism and confidence
Pressure on natural resources is only mounting, as demand rises in a world with growing population levels, increasing urbanisation and urgent threats around pollution and climate change. In this context, we must rethink our use of resources and come up with new models of socio-economic development that are more efficient, balanced and sustainable.
Faced with increasing international competition and the need to adhere to more stringent environmental regulations, industrial companies are finding that they need support to be more competitive and to be able to implement their growth strategies despite constant change and uncertainty. Against this backdrop, concurrent demand for safe disposal of used products and those of recycled products that offer significant added value is increasing and can be seen in the many growth opportunities opening up around the world.
Gravita offers expert, innovative solutions that enable us to position ourselves as a sustainable value creator. Our growth roadmap is founded on sustainable value creation momentum, with offerings that help our customers reduce their environmental footprint, while also enhancing their green credentials.
What sets Gravita apart is our clear understanding that recycling of scrap and other waste is the most viable, sustainable and scalable route to protect the environment from degradation and foster a positive impact on climate change.
As I close, I extend heartfelt thanks to each and every stakeholder who has been a part of our journey. We look forward to your continued support and cooperation.
With regards,Dr. Mahavir Prasad AgarwalChairman & WTD(DIN : 00188179)

Corporate Overview Statutory Reports Financial Statements
10
Our financial journey
Our relentless focus on efficiency and expansion has enabled consistent financial performance and shareholder value creation.(All figures are consolidated, ` Cr. unless otherwise stated)
Sales
15-16
431.
20
17-18
1,02
9.48
16-17
688.
00
18-19
1,24
1.73
19-20
1,34
7.80
Earnings Per Share (Basic, `)
15-16
0.64
17-18
6.42
16-17
4.78
18-19
2.26
19-20
4.82
ROCE (%)
15-16
6.10
17-18
21.9
9
16-17
19.2
6
18-19
12.0
4
19-20
16.9
8
Debt-Equity (Ratio)
15-16
0.83
17-18
1.23
16-17
1.10
18-19
1.26
19-20
1.21
Figures for FY2015-16 are based on I-GAAP and those of the rest of the financial years shown above are based on IND AS
Dividend (`)
15-16
0.20
17-18
0.70
16-17
0.60
18-19
0.30
19-20
0.70
*
*Declared
22%5 year CAGR of Revenue
EBIDTA
15-16
16.0
3
17-18
88.7
0
16-17
55.3
7
18-19
58.7
1
19-20
97.4
7
39%5 year CAGR of EBIDTA
PAT
15-164.
37
17-18
44.0
8
16-17
30.5
4
18-19
15.4
8
19-20
33.1
8
38%5 year CAGR of PAT
ROE (%)
15-16
3.72
17-18
25.9
4
16-17
22.6
8
18-19
7.96
19-20
15.6
3
38%5 year CAGR of EPS
Networth
15-16
119.
16
17-18
189.
68
16-17
150.
14
18-19
199.
32
19-20
225.
18
14%5 year CAGR of Networth

11
Annual Report2019-2020
Our key milestones
Deep passion and an enduring quest to create value for our stakeholders have enabled us to achieve many milestones in our journey of growth and progress.
1992-93 Started the business of welding technology and power metallurgy of surface coating
1994-95 Established a Lead recycling facility in Jaipur, Rajasthan
1997-98Commenced manufacture of pure Lead, grey oxide, red Lead and litharge
2000-01Established first overseas lead recycling unit in Sri Lanka
2001-02Started the business of providing turnkey solutions for lead recycling
2006-07Established second overseas Lead recycling facility in Ghana, Africa
2007-08Set up Lead recycling facilities in Senegal and Mozambique
2010-11Completed a successful IPO with listing on the BSE and NSE
2011-12• EstablishedaTurnkey
Plant fabrication facility at SEZ, Jaipur
• AcquiredtwoLeadrecycling units in Jammu & Kashmir
• Acquiredlicenseforimport of scrap batteries
2012-13• EstablishedaLead
recycling unit at Gandhidham, Gujarat
• Incorporatedasubsidiarycompany in Nicaragua
2013-14• Completedexpansionat
flagship Lead recycling unit in Phagi, Jaipur
• Commencedmanufacture of value-added products, including Lead sheets, Lead powder and Lead
2015-16Diversified the business through the establishment of the Company’s first Plastic recycling unit in Managua, Nicaragua
2016-17 • Establishedaworld-class
aluminium recycling unit at Phagi, Jaipur
• SetupaLeadrecyclingunit at Chittoor
2017-18• EstablishedaPlastic
recycling unit at Jaipur
• EstablishedaPETrecycling unit in Jamaica
2018-19Launched a Plastic recycling unit in Chittoor
2019-20• EstablishedLeadand
aluminium recycling facilities in Tanzania
• EstablishedLeadrecycling plant in Ghana
Corporate Overview Statutory Reports Financial Statements
12
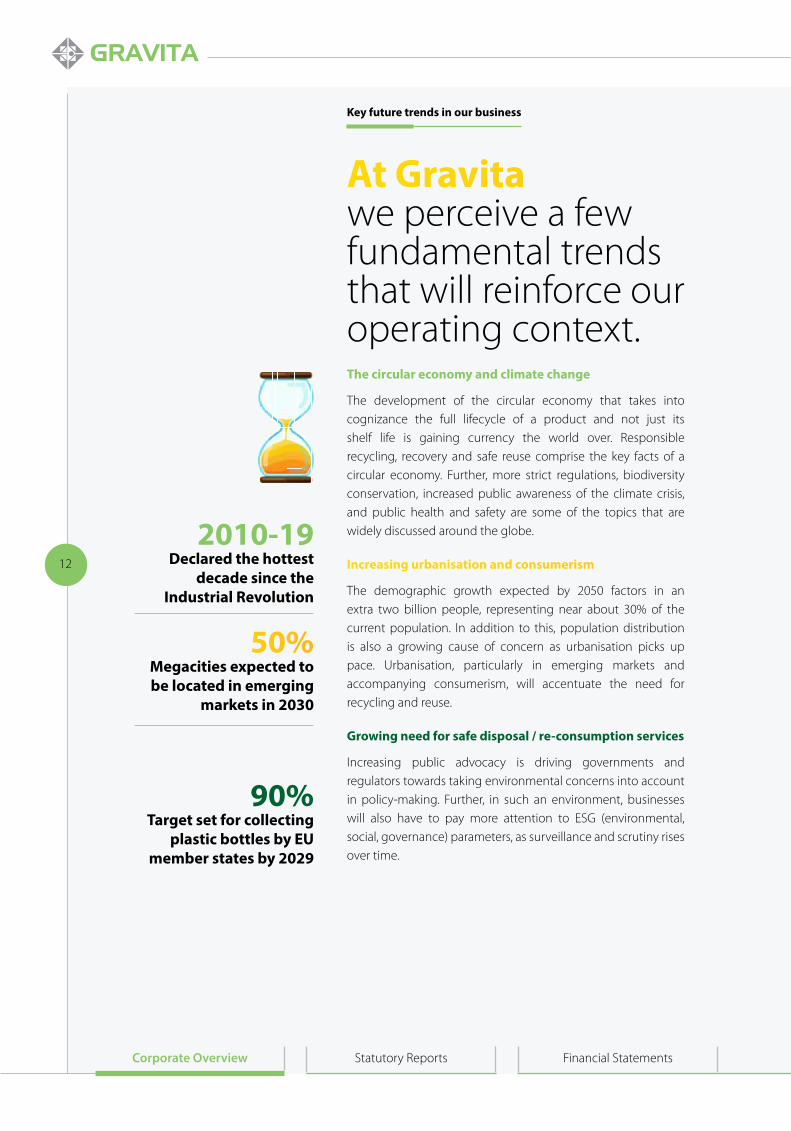
Key future trends in our business
At Gravita we perceive a few fundamental trends that will reinforce our operating context.The circular economy and climate change
The development of the circular economy that takes into cognizance the full lifecycle of a product and not just its shelf life is gaining currency the world over. Responsible recycling, recovery and safe reuse comprise the key facts of a circular economy. Further, more strict regulations, biodiversity conservation, increased public awareness of the climate crisis, and public health and safety are some of the topics that are widely discussed around the globe.
Increasing urbanisation and consumerism
The demographic growth expected by 2050 factors in an extra two billion people, representing near about 30% of the current population. In addition to this, population distribution is also a growing cause of concern as urbanisation picks up pace. Urbanisation, particularly in emerging markets and accompanying consumerism, will accentuate the need for recycling and reuse.
Growing need for safe disposal / re-consumption services
Increasing public advocacy is driving governments and regulators towards taking environmental concerns into account in policy-making. Further, in such an environment, businesses will also have to pay more attention to ESG (environmental, social, governance) parameters, as surveillance and scrutiny rises over time.
2010-19 Declared the hottest
decade since the Industrial Revolution
50%Megacities expected to be located in emerging
markets in 2030
90%Target set for collecting
plastic bottles by EU member states by 2029

13
Annual Report2019-2020
Social responsibility initiatives
At Gravita we are focused on creating sustainable community value that serves the basic needs of people located in and around our operations. Whenever we think beyond the industry, we always try to ensure the viability of the economy and the society. In the ultimate analysis, it is the ecosystem that precipitates the seasons, that in turn brings the giving rain. Our commitment towards sustainability is unequivocal and unwavering. For us, they too are an equally vital and inextricable part of our business ecosystem and often provide critical ingredients for our success. As a responsible corporate citizen, we have always acknowledged and reciprocated to their contribution through a slew of environment, educational and health initiatives for the overall welfare of the communities we live in.
1.09 cr.Expenditure in CSR during F.Y. 2019-20

Corporate Overview Statutory Reports Financial Statements
14
Our business model
At Gravita our business model is focused on resourcing the world with products that support recycling and find application in a wide variety of materials used in everyday life.
KEY STRENGThS VALUE SUSTENANCE
Well-established global scrap collection network Scrap collection from across 20 countries, including own scrap collection centres located in over 10 countries
Raw material resources chiefly sourced from Asia, the Middle East, Africa, Central America, etc. 80% of scrap sourced from international markets; 20% from India Back-to-back procurement arrangement with major Lead-acid battery manufacturers like Amara Raja, HBL Power, etc.
Scrap collection from large domestic customers like Vodafone, Airtel, TCS, Sukam, etc. Bulk procurement enables competitive prices
Global expertise in customer service Longstanding multi-year relationships with global customers
Specialist recycling knowhow Integrated and well-established approach to waste recycling Turnkey recycling solutions offered to third-party customers on the back of robust R&D practice
Strategically located manufacturing facilities in global growth centres 12 plants located in emerging/developing economies All plants proximate to ports/customers for logistically efficient resource access/distribution 1st Indian Lead recycling company with facility approved by International Lead Association (ILA)
Back-to-back metal hedging policy Hedging helps mitigate metal commodity price risks and enables focus on the core business Under the mechanism, scrap procured equivalent to finished goods volume is sold and bought on daily basis under weekly, monthly and long-term contracts at the LME and also through sales to customers
Experienced team HR practice focused on team-building, training, skills development and career enhancement Strong focus on productivity with emphasis on ownership and collaboration Decentralised culture that fosters empowerment and entrepreneurialism
Alignment with governance Diverse Board with rich experience and expertise Culture of alignment with regulatory guidelines, with the tone set by the leadership

15
Annual Report2019-2020
KEY STRENGThS VALUE SUSTENANCE
Well-established global scrap collection network Scrap collection from across 20 countries, including own scrap collection centres located in over 10 countries
Raw material resources chiefly sourced from Asia, the Middle East, Africa, Central America, etc. 80% of scrap sourced from international markets; 20% from India Back-to-back procurement arrangement with major Lead-acid battery manufacturers like Amara Raja, HBL Power, etc.
Scrap collection from large domestic customers like Vodafone, Airtel, TCS, Sukam, etc. Bulk procurement enables competitive prices
Global expertise in customer service Longstanding multi-year relationships with global customers
Specialist recycling knowhow Integrated and well-established approach to waste recycling Turnkey recycling solutions offered to third-party customers on the back of robust R&D practice
Strategically located manufacturing facilities in global growth centres 12 plants located in emerging/developing economies All plants proximate to ports/customers for logistically efficient resource access/distribution 1st Indian Lead recycling company with facility approved by International Lead Association (ILA)
Back-to-back metal hedging policy Hedging helps mitigate metal commodity price risks and enables focus on the core business Under the mechanism, scrap procured equivalent to finished goods volume is sold and bought on daily basis under weekly, monthly and long-term contracts at the LME and also through sales to customers
Experienced team HR practice focused on team-building, training, skills development and career enhancement Strong focus on productivity with emphasis on ownership and collaboration Decentralised culture that fosters empowerment and entrepreneurialism
Alignment with governance Diverse Board with rich experience and expertise Culture of alignment with regulatory guidelines, with the tone set by the leadership

16
Corporate Overview Statutory Reports Financial Statements
Global economic overview and outlook
Gravita carried out its business in 2019 in a slowing economic environment (2.4% estimated in 2019 vs. 3% in 2018) due to trade tensions between the US and China and the uncertainty regarding the manner in which the UK would exit the EU. Uncertainty reduced at year end though, with the US and China reaching a tentative trade consensus and the result of the UK elections confirmed its exit from the European Union (via referendum on 31 January 2020). This reduction in uncertainty, together with the expansionary monetary policy measures, had created a platform for greater economic stability.
Yet, the Covid-19 pandemic that started to spread in the first quarter of the current calendar year, triggered a global crisis like no other, representing a global health crisis that morphed into an economic crisis that is expected to plunge the world into the deepest recession since the Second World War. The pandemic caused a collapse in global activity, as various mitigation measures such as lockdowns, closure of schools and non-essential business, and travel restrictions imposed by most countries to limit the spread of COVID-19 and ease the strain on health care systems sharply curbed consumption and investment, as well as restricted labor supply and production. Further, far-reaching cross-border spillovers have disrupted financial and commodity markets, global trade and supply chains and travel and tourism, with certain sectors facing an impaired future.
While the ultimate growth outcome is still uncertain, the pandemic will result in output contractions across the vast majority of both emerging market and developing
economies (EMDEs).
The World Bank states that immediate policy priorities are necessary to alleviate the ongoing health and human costs and attenuate the near-term economic losses, while addressing challenges, such as weak social safety nets, that have heightened the impact on vulnerable populations. Once the crisis abates, it will be necessary to reaffirm credible commitment to sustainable policies - including medium-term fiscal frameworks in energy-exporting EMDEs suffering from the plunge in oil prices - and undertake necessary reforms to reinforce long-term growth prospects. For these to be materialised, global coordination and cooperation will be crucial.
In all, the IMF anticipates a sharp recession and a slow recovery. The global economy is expected to contract sharply by -4.9% in 2020, far worse than the financial crisis of 2008. On a more granular level, the pandemic is expected to have a huge impact, with advanced economies projected to shrink by 7% in 2020, as widespread social-distancing measures, tightening of financial conditions and collapse in external demand subdues activity. Assuming that the outbreak remains under control and activity recovers later this year, China is projected to slow to 1% in 2020 - by far the lowest growth it has registered in more than four decades.
Real GDP (% change YoY)
Region 2019 (E) 2020 (P)World 2.4 -5.2Advanced economies 1.6 -7.0- United States 2.3 -6.1- Euro Area 1.2 -9.1- Japan 0.7 -6.1Emerging market and developing economies (EMDEs) 3.5 -2.5- Commodity exporting EMDEs 1.5 -4.8- Other EMDEs 4.8 -1.1East Asia and Pacific 5.9 0.5- China 6.1 1.0Europe and Central Asia 2.2 -4.7Latin America and the Caribbean 0.8 -7.2Middle East and North Africa -0.2 -4.2South Asia 4.7 -2.7- India 4.2 -3.2
World Bank, June 2020
Indian economic review and outlook
The 6.1% GDP growth rate achieved in 2018-19 slid down to 4.2% in 2019-20, the lowest in over a decade. This was an outcome of several economic and geopolitical developments transpiring across the globe, which dampened manufacturing and gross capital
formation, leading to the economic growth to subside. Such externalities were exacerbated by a subdued economic environment in India on account of political pronouncements that led to unrest, creating uncertainty. In fact, the three pillars of demand: consumption, exports and investments, all fell sharply. In fact, the latter two
Management discussion and analysis

17
Annual Report2019-2020
components were in the negative zone during the year.
A few headline indicators demonstrated the lethargic environment. In 2018-19, industrial output grew at a 3.8% rate, but contracted to 0.7% in 2019-20. Due to the slowdown, the government’s tax revenues remained constrained, yet public sector spending proved to be the mainstay of the economy. Total receipts were 10% short of the budgeted ` 19.31 lac crore, standing at `17.5 lac crore. Expenditure was met at around 99.5% of the target, at ` 26.86 lac crore. With revenue shortfall and limited space for curbing expenditure, the fiscal deficit overshot its revised estimates by ` 170,000 crore, raising the deficit from a revised estimate of 3.8% to 4.6% of the Gross Domestic Product (GDP) for 2019-20. Yet, the mining sector with a 3.1% and agriculture sector with a 3.7% growth were the green shoots in the economy. In fact, growth of the agriculture sector at current prices would be 11.3%, almost 60% more than the non-agriculture sector.
During the period under review, another bright spot in the economy was record high foreign direct investment (FDI) receipts, which grew from USD 44.36 billion in 2018-19 to USD 49.97 billion in 2019-20.
Such vibrancy in foreign investment had a direct influence on India’s global ranking. The country’s rank in the World Bank’s Ease of Doing Business stood at 63, demonstrating a jump of 14 spots. Further, GST collections crossed the ` 1 lac crore-mark for four consecutive months between November 2019 and February 2020. Overall, gross GST revenues witnessed a rise of 4% in FY2019-20, as compared to the previous financial year.
With the onslaught of the coronavirus pandemic, the last quarter of 2019-20 felt the jolt with the country’s GDP growth rate slowing down to 3.1%, when consumer demand shrank and private investments were drying up. In April 2020, the country’s manufacturing and services sectors had already witnessed the sharpest contraction among the world’s top-10 economies.
Yet, resilience and diversity of the Indian economy, aided by continued government fiscal and policy support, is bound to ensure faster economic recovery in the medium term, with the World bank expecting India’s GDP growth to reverse from the -3.2% projected in 2020 to 3.1% forecasted for 2021.
Lead: A versatile, infinitely recyclable resource
Lead (Pb) is a metal that has been used by humans for centuries, dating back to 7000 BC. The element is present in various minerals in minute quantities, which is used to produce the metal around the world.
Lead is a versatile metal that has well-established applications. It has been used since ancient times for making paints and pipes as a corrosion-resistant resource. It is also used in car batteries and comprises a major ingredient of lead-acid batteries. Further, lead is also used for soldering parts of electrical equipment and
as electrodes in electrolysis processes.
One of the most important properties of lead is that it is highly malleable, which makes it fairly easy to recycle. In fact, it possesses one of the highest recycling rates of all materials commonly used today. Notably, more lead is now produced through recycling than through mining.
With intrinsic properties such as softness and malleability making it highly valuable and usable in a wide variety of applications, lead lends itself perfectly to reuse. Recycled lead is no different from newly-sourced metal in terms of quality and can be reused infinitely. Additionally, lead-based products are easily identified, allowing for a relatively simple collection and recycling process.
Approximately 85% of the lead used today is found in batteries, most often lead-acid batteries, all of which can be recovered and recycled for use in new products. Proper disposal of batteries is important as they, when left to decay or if burned with other waste items, can leak harmful chemicals into the local environment. Thus, recycling lead is not only crucial in terms of catering to the demand for lead, but also with respect to protecting the environment.
Global lead industry overview
Lead reserves:
As per the International Lead and Zinc Study Group (ILZSG), proven lead ore resources stand at over 2 billion tonnes, with reserve volumes of about 89 million tonnes. The world´s lead resources are mainly distributed in Siberia, Russia; the central and western regions of China; Queensland, New South Wales in Australia; the south-eastern area of Missouri and the Mississippi River valley area in the US; Zacatecas and San Luis Potosi in Mexico and Cerro de Pasco and Morococha in Peru. Australia possesses about 29% of the world’s lead reserves, followed by China (22%), Russia (8%), Peru, Mexico and Turkey at 7% each and USA at 6%.
Australia
ChinaRussia Peru
MexicoUSA
IndiaPoland
BoliviaSweden
TurkeyIreland
South Africa
Other
35
30
25
20
15
10
5
0
World Lead Ore Reserves 2018Million Tonnes
Source USGS
Lead mine production (lead in ore concentrates):
A study by Wood Mackenzie forecasts that global lead production, excluding that of China, will increase in 2019 by about 0.25 mn tonnes, which is equivalent to over

18
Corporate Overview Statutory Reports Financial Statements
10% of current output. Much of this output growth is primarily expected from mines in Mexico and Australian. On a more granular level continent-wise, in the Americas, output is expected to be stable at between 1-1.2 mn tonnes, while in Asia, production has experienced fast growth and is expected to reach more than the 2.65 mn tonnes reported in 2018.
Lead production and consumption:
As per ILZSG, the global market for refined lead witnessed supply exceeding demand by 8,000 tonnes in 2019, highlighting greater balance in the sector. The London
Metal Exchange (LME), Shanghai Futures Exchange (SHFE) and producers and consumers reported inventories of 0.38 mn tonnes, the same levels as at the end of 2018.Secondary or recycled raw materials, as crucial sources of refined lead metal, accounted for 63.5% of the global output in 2019, compared with 62.5% in 2018.
Consumption of refined lead metal moderated by 1.8% in China, 1.4% in the US, 0.5% in Europe and 6.7% in Japan. This was due to the overall underperformance of the global automotive sector. World over, lead usage fell by 1.1%.
World Refined Lead Supply and Usage 2015-2020000 tonnes
2015 2016 2017 2018 20192019 2020 2019 / 2020
Jan-Mar Dec Jan Feb MarMine Production 4857 4699 4550 4606 4604 1138 1099 433.1 367.2 359.6 372.3Metal Production 11059 11308 11569 11829 11919 2923 2714 1080.2 950.5 861.6 902.3Metal Usage 11049 11268 11724 11906 11888 2910 2695 1061.3 962.0 845.2 888.1
Source : ILZSG
Lead prices:
Like other base metals, lead prices were also volatile during the year FY20, primarily owing to the international trade dispute between the US and its trading partners and the onset of the pandemic. Lead prices were range-bound, oscillating between $2,267-1,589 during the year, with average lead prices being $1,952 per MT during the year. Lead stock levels witnessed continuous declines at LME warehouses. Globally, 70% of lead consumed originates out of recycled lead, and during the year under report Chinese lead recycling has witnessed a rising trend. Global consumption of lead was largely stagnant during the year vis-a-vis last year. Going into the medium-term, lead prices are projected to remain volatile on account of macro challenges continuing to impact the global economy.
Outlook:
Lead recycling in global market is witnessing a rising trend, including in China. There is sufficient un-utilised capacity also available worldwide. Demand is expected to increase by around 1.5%, largely driven by the Asian markets. Further, the automobile sector, being the largest consumer of lead, is expected to drive the market. Although electric vehicles (EVs) are increasingly being focused upon worldwide, EVs use lead batteries as well. At Gravita, we are poised to expand our supply base to more end-users, tapping into opportunities as demand recovers in the automotive sector.
India’s lead industry
Overview:
Storage battery scrap represents the primary source of secondary lead production. Lead is one of the highest recycled metals as it can be re-melted any number of times and the final product (or ‘secondary lead’) is
indistinguishable from primary lead produced from ore. In India, the amount of lead recycled is about 75% of the consolidated lead production in India. In India, major states producing lead include Rajasthan, Tamil Nadu, Andhra Pradesh and Uttar Pradesh.
Notably, more than 80% of lead consumed in the country goes into the manufacturing of lead batteries. Considering the sensitivity around lead recycling, the Government enacted Battery Management and Handling Rules (BMHR), 2002, to organise the recycling of lead-acid batteries and to make available raw material to lead reproducers.
The battery industry in India consumes about 80% of lead, and the remaining 20% is consumed by a vast number of industries and for various applications. It is used in pigments and compounds, rolled and extruded products, alloys, cable sheathing and other industries. The apparent consumption of lead stood at 0.16 million tonnes in 2017-18. Even assuming a modest 3% incremental consumption every year, lead consumption, would have expanded to about 1.7 million tonnes in 2019-20. In addition to this, it is known that large quantities of recycled lead were also consumed in
certain other industries.
Demand drivers:
India is expected to witness sustainable growth in demand for lead over the next five years, riding on the back of demand from diversified core sectors, like automotive, telecoms, defence and railways, which require lead-acid batteries.
Automobile sector
The automobile sector, through use of lead-acid batteries, is the largest consumer of lead and therefore the demand and prospects for the metal are directly connected to the

19
Annual Report2019-2020
prospects of the auto industry. The India Brand Equity Foundation (IBEF) notes that in 2019, India became the fifth largest auto market, with sales touching 3.81 million units during the year. In FY2019-20, the Indian lead-acid battery market reached a size of USD 5 billion. Further, in 2019, the country was the seventh largest manufacturer of commercial vehicles in the world. As per data released by DPIIT, the automobile sector has attracted FDI worth USD 24.21 billion between April 2000 and March 2020. By 2026, the industry, including component manufacturing, is expected to reach a size of USD 282.8 billion, therefore leading to sustainable demand for lead.
Telecoms sector
The telecommunications sector is among the most promising end-users for lead-acid batteries. With the expansion of the telecoms sector, notably with the advent of a new player, the demand for such batteries is bound to increase over the medium- to long-term. According to IBEF, India is the second-largest telecoms market in the world. The country is also the second-largest in terms of internet subscribers, and also has the highest data usage per smartphone, which is expected to double by 2024. India’s internet user base is expected to reach 627 million by the end of 2019. As of May 2020, India had over 500 million active internet users. Effective government policy and the lifting of the FDI cap in the sector to 100% from 74% have provided a strong impetus to the segment. FDI inflows amounted to USD 37.27 billion during the April 2000 - March 2020 period. Moreover, the National Digital Communications Policy foresees investments of USD 100 billion in the sector by 2022.
Power sector
The Indian power sector, also fuelled by lead-acid batteries, is a core constituent of the economy. Sustainable electrification is a prime agenda for the Government and over the years there have been several structural policy reforms aimed at expanding the scope and importance of the sector. Taking this agenda forward, the Union Budget of 2020-21 allocated nearly `16,000 crore to the Ministry of Power. Between April 2000 and March 2020, the sector attracted FDI of USD 14.98 billion, accounting for nearly 3% of the total FDI inflows into the country.
Outlook:
The Indian market size for lead is about 1.2 mn MT, including primary and secondary lead. Almost 30% of this lead comes from the informal sector. Similar to the global markets, in India too lead-acid batteries comprise the major consumer of lead. Lead-acid batteries are chiefly used in the automotive and telecoms sectors and in power storage devices, including the UPS segment. The expected growth of lead-acid batteries is projected in the range of 5-7%, thus lead consumption is also expected to achieve similar growth rates. Approximately 30% of the market is with the informal sector, comprising both lead and lead-acid battery segments together.
Notably, Government initiatives towards environmental concerns through the implementation of structured waste management policies will help grow the share of the formal segment. This market shift will provide an added impetus to recycling companies like Gravita.
As India looks to recover from the adverse economic effects of the pandemic with extensive policy implementation and stimulus packages, consumer demand is bound to pick up. Demand recovery, especially on the back of personal mobility, push towards widening the digital mobile economy, especially in rural India, and the government’s focused agenda of providing 24x7 electricity across the country augur well for the lead industry in India.
Aluminium: An essential metal powering everyday lives
Aluminium (Al) is an extremely versatile metal with a number of advantages, being recognised for both its lightweight and flexibility. It can be cast, melted, formed, machined and extruded, that is it can be manufactured into a variety of shapes and then subsequently fabricated to suit a whole variety of uses.
A known lightweight metal, about one-third of the weight of steel, aluminium is easier and cheaper to transport than most other metals. Further, the strength of aluminium can be adapted using varying alloying elements to provide better benefits, including higher strength/easier formability. Because of its lightweight nature, corrosion resistance and ease of fabrication, aluminium sheets are used in vehicle panelling, architecture and building cladding and kitchen fitting, among various other applications. Aluminium is 100% recyclable and during the recycling process, it retains all its original properties.
Aluminium finds use in several industries, and is the second most used metal in the world. In fact, the metal’s production has a direct economic impact of over USD 70 billion every year.
Aluminium recycling industry:
An important source of aluminium is aluminium scrap, generated mostly by the automotive and power industries. It is a cost-efficient and energy-saving resource, where only 5% energy is required to produce aluminium from scrap, as compared to the production of the metal from alumina, a derivative of bauxite. Energy constitutes as much as 40% of the production cost of primary aluminium, with coal comprising the primary fuel. Thus, producing aluminium from recycled scrap produces much less carbon emissions as compared to the primary route, thus underscoring the importance of greater environmental sustenance.
India’s annual demand for secondary (recycled) aluminium stands at 1.1 mn tonnes, accounting for nearly 30% of the total consumption of 3.3 million tonnes. By 2021, demand for aluminium is expected to touch 1.5 million tonnes, thus also accelerating demand for

20
Corporate Overview Statutory Reports Financial Statements
secondary aluminium. The need for a circular economy is crucial for the accelerated development of India, and the demand for aluminium, a core resource, has to be met increasingly through recycling, indicated NITI Aayog.
Over the past few years, secondary aluminium demand has almost doubled, of which a large quantity is imported. Almost 90% of secondary aluminium consumed was imported, as not significant amount of scrap is not generated in the country. Further, the country’s domestic scrap market is fast-growing and has a substantive opportunity in organising scrap collection and raising public awareness. Further, new large-scale initiatives are also underway to boost recycling, including end of life vehicle dismantling, etc. Steps such as these will progressively abort scrap import dependency and through sustained regulatory support, India’s secondary aluminium industry can cater to the growing aluminium requirements of the country.
Raw material resource procurement
Due to the absence of regulation on metal recycling, India has to depend on imports for aluminium scrap. There are no designated zones for metal recycling as well. Domestically, the country is still grappling with procurement issues, with dependence on unorganised methods, including daily collection through street vendors and scrap dealers. This process does not yield a sustainable and reliable supply of quality, graded scrap and hence costly chemical analysis methods have to be adopted for sorting and grading scrap.
An analysis of scrap production and consumption mechanism shows that India will follow two phases. In the first phase, the country’s consumption of aluminium will grow strongly due to investments in infrastructure and defense. However, consumption needs would have to be largely fulfilled from imports due to the absence of a structured recycling policy, despite significant scrap generation and processing potential available in the country. The highlights of the second phase would be lndia reaching a steady state in terms of aluminium consumption. In this phase, scrap could be recycled repeatedly to thus create a stable, secure and diversified supply of aluminium.
Aluminium cast alloys:
The global aluminium casting market is poised to grow at a CAGR (compounded annual growth rate) of 6% by 2020. An increase in the preference for aluminium casting for the production of vehicles and their components will drive the prospects for growth in this market. Aluminium castings are lightweight and can be easily customised through heat treatment. The growing preference for corrosion-resistant and highly conductive materials will drive the demand for aluminium casting until 2020.
Further, automotive manufacturers are moving from cast iron engine blocks to aluminium engine blocks. This shift in the preference for non-ferrous materials, such as aluminium casting, is expected to fuel demand growth. The expanding market offers a plethora of opportunities for Indian semis makers, given their low contribution to worldwide fabrication shipments. Fabricated products would be increasingly absorbed by sectors like automobiles, heavy machinery and industrials, aerospace and shipping, building and construction hardware, power and hand tools and telecoms, etc.
The automobiles sector is set to make up 55% of the market share, as more stringent emission norms will force manufacturers to use lighter materials, such as aluminium as it helps to cut emissions by reducing the overall weight of the vehicle. To acquire a foothold in this competitive space, Indian vendors have to invest in developing new technologies and keep themselves abreast of emerging technologies that could have a positive impact on their product lines.
The electric vehicle (EV) segment represents the bright spot in the automotive segment, with the trend suggesting an increase in demand for e-mobility. It is estimated that the average amount of aluminium used in the EVs is 30% higher than internal combustion engine (ICE) cars. Hence, aluminium battery casing is expected to be a market of substantial value and growth potential in the future.
Financial review in brief
Despite a challenging external environment, Gravita achieved creditable performance during the year 2019-20. Key financial highlights comprise:
Sales:
Gravita’s sales or revenue increased by 9% to ̀ 1,347.80 cr in 2019-20. This performance can be attributed to better sales mix for lead products and sound contribution from the aluminium recycling business.
EBIDTA:
The Company’s EBIDTA or operating profit increased by a respectable 66% to ` 97.47 cr during the year. With growth in EBIDA, EBIDTA margins also improved by about 300 bps during the year under review.
Net profit:
Gravita’s net profit surged by 114% to ` 33.18 on account of better overall operational and business performance.
Earnings per share:
With good profitability performance, the Company’s earnings per share (EPS) enhanced from ` 2.26 in 2018-19 to ` 4.82 in 2019-20.

21
Annual Report2019-2020
SCOT Analysis
Strengths
Diversified Product & Geography
Global Access to Raw Material
Modern Environment Friendly Recycling Facilities with high process and operational efficiencies
Versatile Product mix
Strong Brand
Multi-decade relationships along with approval products with several reputed global customers
Professional and dedicated team with longstanding industry experience
Back to Back Hedging Policy
In house R & D division with Equipment manufacturing.
Deep Routed collection network.
Challenges
High dependence on imported scrap metal/ Lead ingots
Stiff competition with unorganised sector in India
Opportunities
Increased demand of Lead Batteries in the Auto, Telecom and Power sectors
Depletion of mining resources, increasing the demand for secondary source
Increase in Government focus on strict regulatory compliance to control unorganized or backyard smelters
Enhancement of product portfolio as well as venturing into new geographics.
Threats
Hazardous Industry
Volatile Metal prices
Competition from local unorganized sector
Poor monitoring of environmental regulations in Countries
Human capital
At Gravita, our employees are key to our success as they drive and ensure continued business growth and excellence. Towards this extent, talent development is a central priority to our HR roadmap. Encouraging up-skilling is a way for us to accelerate the transformation of our business and improve our performance. For employees, it is a factor in their engagement, their desire for upward mobility, career progression and improved employability. We offer our employees competitive salary and attractive benefits, while also providing career opportunities and work-life balance. As on 31 March 2020, we employed 1,107 people.
Our strategic priorities
• Ensureintegrationofsustainabilitythroughoutourbusiness
• Focus on cost optimisation and operationalefficiencies
• Sustainarobustandflexiblebalancesheet
• Emphasiseontransparency,ethicsandexcellencein all that we do
• Focusonsustainablediversificationby leveragingour robust network and technological strengths
Internal Controls:
In order to ensure orderly and efficient conduct of business, Company’s management has put in place necessary internal control systems commensurate with its business requirements, scale of operations, geographical spread and applicable statutes. The Company has an in-house Internal Audit department manned by qualified professionals and an external firm acting as independent internal auditors that reviews internal controls and operating systems and procedures on a regular basis. Company’s internal control systems include policies and procedures, IT systems, delegation of authority, segregation of duties, internal audit and review framework etc. Company has designed the necessary internal financial controls and systems with regard to adherence to company’s policies, safeguarding of its assets, prevention and detection of frauds and errors, accuracy and completeness of the accounting records and timely preparation of reliable financial information.

22
Corporate Overview Statutory Reports Financial Statements
Key financial ratios
S. No.
Particulars 2019-20 2018-19 % Change
Details of significant changes, if any
1. Debtors’ turnover ratio 19.96 12.87 55% Due to faster realization of sale proceeds
2. Inventory turnover ratio 6.01 6.80 (12%)
3. Interest coverage ratio 3.01 2.27 33% Due to increase in profitability
4. Current ratio 1.24 1.10 13%
5. Debt equity ratio 1.21 1.26 4%
6. Operating profit margin 7.03% 4.73% 49% Due to increase in profitability
7. Net profit margin 2.62% 1.30% 101% Due to increase in profitability
8. Return on net worth 16.63% 8.33% 100% Due to increase in profitability

23
Annual Report2019-2020
BOARD REPORT
ToThe Members ofGravita India Limited
We are delighted to present on behalf of Board of Directors of the Company, the 28th Annual Report of the Company along with Audited Financial Statements (Consolidated & Standalone) for the year ended 31st March, 2020.
CONSOLIDATED FINANCIAL PERFORMANCE
Particulars Amount (` in Lacs)2019-20 2018-19
Total Revenue 1,34,780.03 1,24,172.83Operational Expenditure 1,25,032.70 1,18,301.93Profit Before Interest, Depreciation and Tax (EBIDTA) 9,747.33 5,870.90Add: Other Income 99.42 544.99Less: Interest 2,817.23 2,299.99Less: Depreciation 1,812.54 1,156.49Less: Exceptional items 522.94 -Profit Before Tax 4694.04 2,959.41Profit from Ordinary Activities Before Tax 4694.04 2,959.41Less: Provisions for Taxation Including Deferred Tax 1,034.92 1,019.12Profit After Tax Before Non-Controlling Interest 3,659.12 1,940.29Add: Other Comprehensive Income 211.20 56.61Add: Share in Profit of Associates (0.96) (1.36)Less: Minority Share in Profit & Loss 339.99 375.32Profit Available for Appropriation 3,529.37 1,620.22APPROPRIATION:Final Dividend 2017-18 - 481.24Final Dividend 2018-19 207.11 -Interim Dividend 2019-20 483.27 -Corporate Tax on Dividend 22.25 98.94Balance Carried to Balance Sheet 2816.74 1,040.04
1. State of Company’s Affairs
The 6.1% GDP growth rate achieved in 2018-19 slid down to 4.2% in 2019-20, the lowest in over a decade. This was an outcome of several economic and geopolitical developments transpiring across the globe, which dampened manufacturing and gross capital formation, leading to the economic growth to subside. Such externalities were exacerbated by a subdued economic environment in India on account of political pronouncements that led to unrest, creating uncertainty. In fact, the three pillars of demand: consumption, exports and investments, all fell sharply. In fact, the latter two components were in the negative zone during the year.
Like other base metals, lead prices were volatile largely due to international trade dispute between the US and its trading partners and pandemic. The Lead price range bound $2267 to $1589 during the year and the average lead price was $1952 per MT during the year. The lead stocks were dropping
continuously at LME warehouses. Globally 70% lead is recycled lead and during the year Chinese lead recycling has been on increasing trend. The global consumption of lead was stagnant during the year vis a vis last year.
The Indian market sizing about 1.2 million MT of lead including primary and secondary lead. 30% of this lead comes from informal sector. Like global market, In India also the major consumer of lead is Lead acid batteries mainly used in automotive sector, telecom sectors and power storage device like UPS segments. The expected market growth of lead acid batteries is expected 5% to 7% thus lead consumption is also expected to achieve similar growth. Approximately 30% market is captured by informal segment in Lead and Lead acid battery segment together. The government initiatives towards environment concerns, implementation of waste management policy will divert informal segment to formal one. The market shift will give an added advantage to recycling companies like

24
Corporate Overview Statutory Reports Financial Statements
Gravita.
COVID IMPACT: In view of the lockdown across the country due to the COVID-19 pandemic, the manufacturing operations of the Company across all its locations had been suspended temporarily in compliance with the directives/orders issued by the relevant authorities. The Company has made detailed assessments of the recoverability and carrying values of its assets comprising property, plant and equipment, inventories, receivables and other current assets as at the balance sheet date and on the basis of evaluation, has concluded that no material adjustments are required in the financial statements. The Company is taking all the necessary steps and precautionary measures to ensure smooth functioning of its operations and to ensure the safety and well-being of all its employees. Given the criticalities associated with nature, condition and duration of COVID-19, the impact assessment on the Company’s financial statements will be continuously made and provided for as required. Subsequent to year end, Company’s plants across all its locations have resumed operations as per government guidelines and directives prescribed.
Consolidated Financial Summary:
• Consolidated Total Revenue stood at ` 1,347.80 crores.
• Operating Profit before Interest, Depreciation and Tax stood at ` 97.47 crores in financial year 2019-20 as compared to ` 58.71 crores in previous year.
• Net Profit after Tax and Minority Interest during the year stood at ` 35.29 crores.
• Earnings Per Share of the Company stood at ` 4.82 per share having face value of ` 2 each.
Standalone Financial Summary:
• Total Revenue stood at ` 1,172.38 crores as compared to ̀ 1,059.36 crores in the previous year.
• Operating Profit before Interest, Depreciation and Tax stood at ` 62.38 crores in financial year 2019-20 as compared to ` 39.62 crores in previous year.
• Net Profit after Tax during the year is reported at ` 22.43 crores.
• Earnings Per Share of the Company stood at ` 3.25 per share having face value of ` 2 each.
2. Dividend & Reserve
The Board of Directors of Company has recommended and declared Interim dividend @ 35 % (` 0.70 per equity share) amounting to ` 483.27 Lacs. The dividend has been paid to the members whose name appears in the Register of Members
as at the closure of business hours of Friday,i.e. 06th March, 2020 and further in respect of shares held in dematerialized form, it has been paid to the members whose names are furnished by National Securities Depository Limited and Central Depository Services (India) Limited, as beneficial owners as on that date .Further, Company has not transferred any amount to General Reserve.
3. Performance of Subsidiaries/ Associate Companies and Firms
a. Gravita Mozambique LDA, Mozambique: Gravita Mozambique LDA is a step-down subsidiary of Gravita India Limited and is engaged in the business of Manufacturing of Re-Melted Lead & PP Chips and trading of Aluminium Scrap. During the year under review this subsidiary has produced 3943 MT of Re-Melted Lead Ingots and has done trading of 2312 MT of Aluminium Scrap. This subsidiary achieved turnover of ` 72.32 crores and reported Net Profit of ` 7.75 crores during the year.
b. Gravita Senegal SAU, Senegal: Gravita Senegal SAU is a step-down subsidiary of Gravita India Limited. The subsidiary is engaged in recycling of Lead Acid Battery Scrap for producing Re-Melted Lead Ingots, PP Chips etc. During the year under review this plant produced 4121 MT of Re-Melted Lead Ingots and achieved a turnover of `53.83 crores coupled with Net Profit of ` 7.46 crores.
c. Navam Lanka Ltd, Sri Lanka: Navam Lanka Limited is a step-down subsidiary of Gravita India Limited operating in Sri Lanka for more than a decade. It is the largest producer of Refined Lead Ingots and PP Chips in Sri Lanka. This subsidiary is engaged in Recycling of Lead Acid Battery Scrap for producing Refined Lead Ingots. During the year under review this subsidiary produced 3719 MT of Refined Lead Ingots and Re-Melted Lead Ingots and achieved a total turnover of ` 55.63 crores coupled with Net Profit of ` 7.06 crores.
d. Gravita Ghana Limited, Ghana: Gravita Ghana Limited is a wholly-owned subsidiary of the Company. The subsidiary is engaged in recycling and trading of Lead Acid Battery Scrap for producing Re-Melted Lead Ingots, PP Chips etc. During the year under review this plant delivered revenue of ` 18.94 crores and incurred a Net Loss of ` 1.34 crores.
e. Gravita Nicaragua S.A., Nicaragua: Gravita Nicaragua S.A. is a step-down subsidiary of the Company. This subsidiary is engaged in recycling of Plastic and Trading of Battery

25
Annual Report2019-2020
Scrap. During the year under review the production of this subsidiary stood at 4451 MT. This subsidiary achieved turnover of `27.99 crores coupled with Net Loss of ` 2.69 crores.
f. Gravita Tanzania Limited, Tanzania: Gravita Tanzania Limited is a step-down subsidiary of the Company. This subsidiary is engaged in manufacturing of Re-melted Lead and Aluminium. During the year under review subsidiary produced 2768 MT of Lead and 2062 MT of Aluminium and achieved turnover of ` 56.71 Crores coupled with Net Profit of ` 7.74 Crores.
g. Recyclers Ghana Limited, Ghana: Recyclers Ghana Limited is a step-down subsidiary of the Company. This subsidiary is engaged in manufacturing of Refined Lead and Lead Alloys. During the year under review subsidiary achieved turnover of ` 67.34 Crores coupled with Net Loss of ` 2.16 Crores.
h. M/s Gravita Metal Inc, India: Gravita India Limited along with its wholly owned subsidiary Gravita Infotech Limited (formerly known as Gravita Exim Limited) holds 100% share in this partnership firm. This firm is engaged in Manufacturing of Lead Ingots and all kind of Specific Lead Alloys. During the year under review this subsidiary produced 5184 MT of Lead and has achieved a turnover of ` 83.15 crores coupled with Net Profit of ` 0.80 crores.
i. Gravita USA Inc, USA.: Gravita USA Inc. is a step-down subsidiary of the Company. This subsidiary is engaged in trading of Re-Melted Lead Ingots and Plastic Scrap. During the year under review this subsidiary has done trading of 5139 MT of Re-Melted Lead Ingots and 718 MT of Plastic Scrap and achieved turnover of ` 67.93 crores coupled with Net Profit of ` 1.48 crores.
j. Gravita Jamaica Limited, Jamaica: Gravita Jamaica Limited is a step-down subsidiary of the Company. This subsidiary is engaged in recycling of plastic. During the year under review subsidiary produced 1029 MT of PET and achieved turnover of ` 6.20 crores coupled with Net Loss of ` 1.70 crores.
k. Gravita Netherlands B.V., Netherlands: Gravita Netherlands B.V. is a step-down subsidiary of Gravita India Limited. During the year under review this subsidiary achieved Profit of ` 3.71 crores.
l. Gravita Global Pte. Ltd, Singapore: Gravita Global Pte. Ltd is a wholly owned subsidiary
of the Company and is based at Singapore which is engaged in the trading business. During the year under review this subsidiary has done trading of 175 MT and has been able to achieve a turnover of ` 0.48 crores resulting in a Net Loss of ` 0.14 crores.
m. Gravita Infotech Limited (formerly known as Gravita Exim Limited), India: Gravita Infotech Limited is a wholly-owned subsidiary of the Company. In this current financial year company generated revenue of ` 0.40 lacs resulting in Net Loss of ` 19 Lacs.
n. M/s Gravita Infotech, India: Gravita India Limited together with its subsidiary holds 100% share in this firm. This firm is engaged in business of Information Technology. During the year under review the firm incurred Net Loss of ` 1.09 Lacs.
o. M/s Recycling Infotech LLP, India: Gravita India Limited together with its subsidiary holds 100% stake in this LLP. Recycling Infotech LLP is engaged in business related to E-Marketing database collection etc. The LLP incurred Net Loss of ` 0.11 Lacs.
p. Gravita Ventures Limited, Tanzania: Gravita Ventures Limited is a step-down subsidiary of the Company. This subsidiary is engaged in trading of aluminum scrap. During the year under review subsidiary incurred Net Loss of ` 25.61 Lacs.
q. Recyclers Gravita Costa Rica SA, Costa Rica: Recyclers Gravita Costa Rica SA is a step-down subsidiary of the Company. This subsidiary is engaged in trading of PET waste. During the year under review subsidiary achieved turnover of ` 5.48 crores coupled with Net Loss of ` 0.73 crores.
r. Mozambique Recyclers LDA, Mozambique: Mozambique Recyclers LDA is a step-down subsidiary of the Company. This subsidiary is engaged in Manufacturing and Recycling of Aluminium. During the year under review subsidiary achieved turnover of ` 1.05 crores coupled with Net Loss of ` 0.38 crores.
s. Pearl Landcon Private Limited, India: Pearl Landcon Private Limited is a step-down associate company in which Gravita Infotech Limited holds 25% shareholding. This associate company is engaged in business of Real Estate. During the year under review subsidiary incurred Net Loss of ` 5.28 Lacs.
t. Other Subsidiaries
The Company has some other Subsidiaries/

26
Corporate Overview Statutory Reports Financial Statements
Step Down Subsidiaries which are under process of implementation of projects/commercial production. The details of the same are given below:
• NobleBuildEstatePrivateLimited,India
• GravitaMaliSA,Mali
• Gravita Dominican SAS, DominicanRepublic
• GravitaPeruSAC
u. During the year under review, the following subsidiaries/ firms have been closed/ disinvested:
• M/sGravitaMetals,India.
• GravitaCameroonLimited,Cameroon.
• Met Mauritania Recycling SARL,Mauritania.
Further as on 31st March, 2020 company has not made any investment in Joint Venture
4. Disclosures under Companies Act, 2013
a) Extract of Annual Return: The extract of the Annual Return of the Company as on 31st
March, 2020 is set out in Annexure-1 to this report. Further the return referred in Section 92 (3) of the Act read with Companies (Management and Administration) Rules, 2014, is available on the website of the Company at https://www.gravitaindia.com/investors.
b) Material Subsidiaries:
The Company has in accordance with the amendments to Listing Regulations revised the Policy for determining material subsidiaries. The said policy may be accessed on the website of the Company at http://www.gravitaindia.com/wp-content/uploads/pdf/material-subsidiaries-policy.pdf. There are below mentioned subsidiaries of the company which fall under the criteria of material subsidiary:
• GravitaNetherlandsBV
• GravitaMozambiqueLDA
c) Number of Board Meetings: During the year under review, the Board of Directors of the company met 10 (Ten) times. Further the details of the Board Meetings and the attendance of each of the Directors has been provided in Corporate Governance Report which forms integral part of this report. The intervening gap between the meetings was within the period prescribed under the Companies Act, 2013 and Listing Regulations.
d) Committees of the Board: Details of all the Committees including Audit Committee of
Board of Directors along with their terms of reference, composition and meetings held during the year, is provided in the Corporate Governance Report, and forms integral part of this report.
e) Directors’ Responsibility Statement
Pursuant to Section 134 of the Companies Act, 2013, with respect to the Director’s responsibility Statement, the Directors hereby confirm that:
(i) In the preparation of the Annual Accounts the applicable Accounting Standards had been followed along with proper explanations relating to material departures, ;
(ii) They had selected such Accounting Policies and applied them consistently and made judgment and estimates that are reasonable and prudent so as to give a true and fair view of the state of affairs of the Company as on 31st March, 2020 and of the profit and loss of the company for that period;
(iii) To the best of their knowledge and information, they had taken proper and sufficient care for the maintenance of adequate accounting records in accordance with the provisions of Companies Act, 2013 for safeguarding the assets of the Company and for preventing and detecting fraud and other irregularities;
(iv) They had prepared the Annual Accounts on a Going Concern basis;
(v) They had laid down internal financial controls to be followed by the Company and that such internal financial controls are adequate and are operating effectively; and
(vi) Proper system had been devised by directors, to ensure compliance with the provisions of all applicable laws and that such systems are adequate and operating effectively.
f ) Declaration by Independent Directors and Statement on compliance of Code of Conduct:
The Company has received declarations from all the Independent Directors of the Company confirming that they meet the criteria of independence as prescribed both under sub-section (6) of section 149 of the Companies Act, 2013 and Regulation 16(1) (b) of SEBI (Listing Obligations and Disclosure Requirements) Regulations, 2015 and also a

27
Annual Report2019-2020
declaration as per Rule-6 of the Companies (Appointment and Qualification of Directors) Rules, 2014, amended as on date has been received from all the independent directors.
Further, in the opinion of the Board, Independent Directors of the company are persons of high integrity, expertise and experience and thus qualify to be appointed/continue as Independent Directors of the Company. Further, as required under section 150(1) of the Companies Act, 2013 they have registered themselves as Independent Directors in the independent director data bank. They shall pass the proficiency self-assessment test in due course in terms of Companies (Appointment and Qualifications of Directors), Rules 2014 (as amended).
In terms of Regulation 25(8) of the Listing Regulations, the Independent Directors have confirmed that they are not aware of any circumstance or situation, which exist or may be reasonably anticipated, that could impair or impact their ability to discharge their duties with an objective independent judgment and without any external Influence and that they are independent of the management. The Independent Directors have also confirmed that they have complied with the Company’s code of conduct as prescribed in Schedule IV to the Companies Act, 2013.
g) Vigil Mechanism/Whistle Blower Policy: The Company is having an established and effective mechanism called the Vigil Mechanism, to provide a formal mechanism for the Directors and employees to report their genuine concerns about unethical behaviour, actual or suspected fraud or violation of the company’s code of conduct. The policy provides adequate safeguards against victimization of employees and provide direct access to the higher levels of supervisors and/or to the Chairman of the Audit Committee in appropriate or exceptional cases. The mechanism under the Whistle Blower Policy of the company has been appropriately communicated within the organization. The purpose of this Policy is to provide a framework to promote responsible whistle blowing by employees. It protects employees wishing to raise a concern about serious irregularities, unethical behavior, actual or suspected fraud within the Company. The company’s whistle blower policy is available on following web link: https://www.gravitaindia.com/wp-content/uploads/pdf/whistle-blower-policy.pdf.
h) Familiarization Programme for Independent Directors: The Company has Familiarization Program for Independent Directors to familiarize them with regard to their roles, rights, duties and responsibilities in the Company, along with industry, business operations, business model, code of conduct and policies of the Company etc. The Familiarization Program has been disclosed on the website of the Company. The company’s policy on familiarization programme is available on following web link:http://www.gravitaindia.com/wp-content/uploads/pdf/familarization-policy.pdf. The Company conducts an introductory familiarization programme when a new Independent Director joins the Board of the Company. New Independent Directors are provided with a copy of latest Annual Report, the Company’s Code of Conduct, the Company’s Code of Conduct for Prevention of Insider Trading to let them have an insight of the Company’s present status and their regulatory requirements. The induction comprises a detailed overview of the business verticals of the Company and meetings with business heads / senior leadership team, and with the Managing Director of the Company, apart from this, the company also conducts various familiarization programmes as and when required. The detail of such familiarization programmes conducted is available on the website of the company and can be accessed from the following web link: https://www.gravitaindia.com/wp-content/uploads/pdf/familiarization-programme.pdf.
i) Nomination and Remuneration Policy: The policy of the Company on Director’s appointment and remuneration, including criteria for determining qualifications, positive attributes, independence of a Director and other matters, as required under sub-section (3) of Section 178 of the Companies Act, 2013, are formulated by the Nomination and Remuneration Committee. During the year the said policy has been revised by Board of Directors of the Company by making the changes as required under Companies Act, 2013 and Listing Regulations. The salient features of the said policy can be accessed through Company’s website from the following web link: https://www.gravitaindia.com/wp-content/uploads/pdf/nomination-remuneration policy.pdf.

28
Corporate Overview Statutory Reports Financial Statements
j) Annual Performance Evaluation: Pursuant to the provisions of the Companies Act, 2013 and Regulation 17(10) of SEBI (Listing Obligations and Disclosure Requirements) Regulations, 2015, the Board carried out annual evaluation of its own performance, performance of its Committees, and evaluation of individual Directors including Independent Directors. The Independent Directors had carried out an annual performance evaluation of non-independent Directors, the Board as a Whole and Chairperson of the Company taking into account the views of Executive and Non-Executive Directors. The Nomination and Remuneration Committee of the Board of Directors evaluated the performance of every Director. The performance is evaluated on the basis of number of Board and Committee meetings attended by individual Director, participation of each director in the affairs of the company, duties performed by each Director and targets achieved by company during the year. The Board / committee /directors found that the evaluation is satisfactory, and no observations were raised from the said evaluation in current year as well as in previous year.
k) Internal Financial Controls: In order to ensure orderly and efficient conduct of business, Company’s management has put in place necessary internal control systems commensurate with its business requirements, scale of operations, geographical spread and applicable statutes. The Company has an in-house Internal Audit department manned by qualified professionals and an external firm acting as independent internal auditors that reviews internal controls and operating systems and procedures on a regular basis. Company’s internal control systems include policies and procedures, IT systems, delegation of authority, segregation of duties, internal audit and review framework etc. Company has designed the necessary internal financial controls and systems with regard to adherence to company’s policies, safeguarding of its assets, prevention and detection of frauds and errors, accuracy and completeness of the accounting records and timely preparation of reliable financial information.
l) Related Party Transactions: All related party transactions that were entered by the company during the financial year were on an arm’s length basis and in the ordinary course of business. The company has not entered into any contract, arrangement
and transaction with related parties which could be considered material in accordance with the policy of the company on Related Party Transactions. Details with respect to transactions with related parties entered into by the company during the year under review are disclosed in the accompanying financial results. There are no materially significant related party transactions made by the Company with Promoters, Directors, Key Managerial Personnel or other designated persons which may have a potential conflict with the interest of the Company at large. Accordingly, the disclosure of related party transactions as required under Section 134(3) (h) of the Companies Act, 2013 in Form AOC-2, is not required. Your directors draw attention of the shareholders to the financial statements which set out related party disclosures. The policy on Related Party Transactions as approved by the Board is available on the Company’s website at https://www.gravitaindia.com/wp-content/uploads/pdf/rpt-policy.pdf
m) Corporate Social Responsibility (CSR): The Corporate Social Responsibility Committee (CSR Committee) has formulated and recommended to the Board, a Corporate Social Responsibility Policy (CSR Policy) indicating the activities to be undertaken by the Company, which has been approved by the Board. The Company has developed and implemented the CSR Policy accordingly. The Company undertakes its CSR initiatives as per the activities covered in the CSR Policy of the Company. The details about Committee composition and terms of reference of Committee are given in Corporate Governance Report and forms integral part of this report. A CSR Report on activities undertaken by the company and amount spent on them is attached as Annexure-2.
n) Risk Management Policy: The Company has developed and implemented a very comprehensive risk management policy under which all key risks and mitigation plans are compiled into a Risk Matrix. The same is reviewed quarterly by senior management and periodically also by the Board of Directors. The Risk Matrix contains the Company’s assessment of impact and probability of each significant risk and mitigation steps taken or planned. For a detailed risk management policy please refer the website link http://www.gravitaindia.com/wp-content/uploads/pdf/risk-management-policy.pdf.
29
Annual Report2019-2020
o) Material Changes and Commitments, if any Affecting Financial Position of the Company which have occurred between the end of the financial year of the company to which the financial statements relate and the date of the report: No material changes and commitments have occurred after the closure of the Financial Year till the date of this Report, which affect the financial position of the Company.
5. Corporate Governance
In compliance with Regulation 34 of the Listing Regulations, a separate report on Corporate Governance along with a certificate from the Auditors on its compliance forms an integral part of this Annual Report.
6. Statutory Auditor and Auditor’s Report
M/s Walker Chandiok & Co LLP, Chartered Accountants ( Firm Registration No. 001076N) were appointed as the Statutory auditors of the company at the 27th Annual General Meeting of the Company held on 20th September, 2019, for a period of five years from the conclusion of the 27th AGM till the conclusion of the 32nd AGM. In this regard the Company has received a certificate from its Statutory Auditor, M/s Walker Chandiok & Co LLP, Chartered Accountants (Firm Registration No. 001076N) in accordance with the provisions of Section 141 of the Companies Act, 2013.
Further, there are no qualifications or adverse remarks in the Auditors’ Report which require any clarification/explanation. The Notes on financial statements are self-explanatory and need no further explanation.
7. Cost Auditor and Cost Audit Report
The Company is required to maintain cost records for certain products as specified by the Central Government under sub-section (1) of Section 148 of the Act, and accordingly such accounts and records are made and maintained in the prescribed manner.
The Company has received consent from M/s K.G. Goyal & Associates, Cost Accountants, to act as the Cost Auditor for conducting audit of the cost records for the financial year 2020-21 having firm registration no. 000024 along with a certificate confirming their independence and arm’s length relationship.
The Board of Directors of the Company, on the recommendations given by the Audit Committee, has appointed M/s K.G. Goyal & Associates, Cost Accountants having firm registration no. 000024 as Cost Auditors for conducting the audit of Cost Records maintained by the company for the
Financial Year 2020-21, subject to ratification of remuneration by the members in the ensuing AGM.
The Cost Audit Report for the F.Y. 2018-19 was filed with Registrar of Companies (Central Government) on 26th September, 2019 while the due date for filing of Cost Audit Report for F.Y. 2018-19 was 27th September, 2019. There are no qualifications or adverse remarks in the Cost Audit Report which require any clarification/explanation.
8. Particulars of Loans given, Investments made, guarantees given and Securities provided under Section186 of the Companies Act, 2013
Particulars of loans given, investments made, guarantees given and securities provided along with the purpose for which the loan or guarantee or security is proposed to be utilized by the recipient are provided herein below:
Name of Person / Body
Corporate
Nature (Loan /
Guarantee/ Security /
Acquisition)
Particulars of Loan given / Investment
made, or Guarantee
made
Purpose for which the loan or guarantee or security is
proposed to be utilized by the
recipientGravita Employee Welfare Trust
Loan Loan of ` 2.25 Crores at an interest rate of 10.00% per annum
For the purpose of implementing Gravita Stock Appreciation Right Scheme 2017 by acquiring equity shares of the company from secondary market.
Apart from above company has not made any investment and has not provided any guarantee or security pursuant to Section 186 of Companies Act, 2013.
9. Secretarial Auditor and Secretarial Audit Report
The Board has appointed M/s P. Pincha & Associates, Company Secretaries, to carry out Secretarial Audit of the Company under the provisions of Section 204 of the Companies Act, 2013. The Secretarial Audit Report for the financial year ended 31st March, 2020 is set out in the Annexure-3 to this report.
The report does not contain any qualification, reservation or adverse remark except on compliance related to regulation 30 of SEBI (LODR) Regulations, 2015 where an information to exchanges was delayed due to COVID-19 pandemic and lockdown in the State of Rajasthan.
30
Corporate Overview Statutory Reports Financial Statements
10. Insider Trading Prevention Code
Pursuant to the SEBI Insider Trading Code, the company has formulated a comprehensive policy for prohibition of Insider Trading in equity shares of Gravita India Limited to preserve the confidentiality and to prevent misuse of unpublished price sensitive information. The Company Secretary has been designated as the Compliance Officer. It has also been posted on the website of the Company https://www.gravitaindia.com/investors/insider-trading-code.
11. The conservation of energy, technology absorption, foreign exchange earnings and outgo
A detailed statement on Particulars of Conservation of Energy, Technology Absorption and Foreign Exchange Earnings and Outgo as required under Section 134 of the Companies Act, 2013 read with Companies (Accounts) Rules 2014, forms part of this Report as Annexure-4.
12. Particulars of Employees and related disclosures
In terms of the provisions of Section 197(12) of the Act read with Rules 5(2) and 5(3) of the Companies (Appointment and Remuneration of Managerial Personnel) Rules, 2014, a statement showing the names and other particulars of the top ten employees and employees drawing remuneration in excess of the limits set out in the said rules are provided as Annexure-5. Further, the disclosures pertaining to remuneration and other details as required under Section 197(12) of the Act read with Rule 5(1) of the Companies (Appointment and Remuneration of Managerial Personnel) Rules, 2014 are provided in the Annual Report as Annexure-6.
Further, in terms of the provisions of Section 197(12) of the Companies Act, 2013 read with Rules 5(2) and 5(3) of the Companies (Appointment and Remuneration of Managerial Personnel) Rules, 2014, a statement showing the names of employees and other particulars of the top ten employees as provided in the said rules are set out in the Board’s Report as an addendum thereto. However, in terms of provisions of the first proviso to Section 136(1) of the Companies Act, 2013, the Annual Report is being sent to the members of the Company excluding the aforesaid information. The said information is available for inspection at the Registered Office of the Company during working hours and any member interested in obtaining such information may write to the Company Secretary and the same will be furnished on request.
13. Appointment/Resignation of KMP’s/Director Dr. Mahavir Prasad Agarwal, Whole time Director
(DIN:00188179) shall be liable for retiring by rotation at the ensuing Annual General Meeting and being eligible, offer himself for re-appointment and none of the Director is disqualified under Section
164 of the Companies Act, 2013 and rules made thereunder, for the reporting period.
Mr. Naveen Prakash Sharma, ceased to be Chief Executive Officer of the company w.e.f 01st January, 2020.
Mr. Yogesh Malhotra (DIN: 05332393) has been appointed as Chief Executive Officer of the company in addition to his existing role of Whole-time Director of the Company w.e.f 01st January, 2020.
Mr. Dinesh Kumar Govil (DIN: 02402409) Indepen-dent director of the company, first term of his tenure as the Independent director was expired on 29th
June, 2019 and was re-appointed for the second term of 5 consecutive years as an Independent Director of the company w.e.f 30th June, 2019. In view of the above, approval of members by way of special resolution was obtained through postal ballot on 15th June, 2019 for the continuation of his directorship.
Mr. Arun Kumar Gupta (DIN: 02749451) Independent director of the company, first term of his tenure as the Independent director was expired on 10th August, 2019 and was re-appointed for the second term of 5 consecutive years as an Independent Director of the company w.e.f 11th August, 2019. In view of the above, approval of members by way of special resolution was obtained through postal ballot on 15th June, 2019 for the continuation of his directorship.
Mrs. Chanchal Chadha Phadnis (DIN: 07133840) Independent director of the company, first term of her tenure as the Independent director was expired on 23rd March, 2020 and was re-appointed for the second term of 5 consecutive years as an Independent Director of the company w.e.f 24th March, 2020. In view of the above, approval of members by way of special resolution was obtained at the Annual General Meeting of the company held on 20th September, 2019 for the continuation of her directorship.
The above appointments and resignations are recommended by Nomination & Remuneration Committee and the same was approved by the Board of Directors.
14. Consolidated Financial Statements and Cash Flow Statement
In accordance with the provisions of Companies Act, 2013 (hereinafter referred to as “the Act”), Regulation 33 of the Securities and Exchange Board of India (Listing Obligations and Disclosure Requirements) Regulations, 2015 (hereinafter referred to as “Listing Regulations”) and applicable Accounting Standards, the Audited Consolidated Financial Statements of the Company for the financial year 2019-20, together with the Auditors’ Report form part of this Annual Report.

31
Annual Report2019-2020
15. Subsidiaries and Associates
The Company has prepared Consolidated Financial Statements in accordance with Section 129 (3) of the Companies Act, 2013 which forms part of the Annual Report. Further, the report on the performance and financial position of each of the subsidiary, associate and joint venture and salient features of the financial statements in the prescribed Form AOC-1 is annexed to this report in Annexure -7.
In accordance with Section 136 of the Companies Act, 2013, the Audited Financial Statements, including the Consolidated Financial Statements and related information of the Company are available on our website https://www.gravitaindia.com/investors/annual-report-of-subsidiaries/. Further the copies of the financial statements of the company and its subsidiaries are available for inspection during working hours for a period of 21 days before the date of meeting.
16. Business Responsibility Report (BRR):
The Company is also providing business responsibility Report as stipulated under the Listing Regulations, the Business Responsibility Report (BRR) describes about the initiatives taken by the Company from an environmental, social and governance perspective and it is put up on the Company’s website and can be accessed at https://gravitaindia.com/wp-content/uploads/pdf/BRpolicy.pdf. The BRR Report is attached as Annexure-8.
17. Employees’ Stock Option Scheme/Stock Appreciation Right Scheme
In terms of the SEBI (Share Based Employee Benefits) Regulations, 2014, as amended from time to time (‘SEBI Regulations’), the Compensation Committee of Board, inter alia, administers and monitors the Gravita Employee Stock Option Plan 2011 and Gravita Stock Appreciation Rights Scheme 2017 of your Company. The Compensation Committee, at its meeting held on 27th April, 2019 granted 2,91,200 stock options under Gravita Employee Stock Option Plan 2011 to the eligible employees at an exercise option price of ` 2/- per option. Further, Compensation Committee, at its meeting held on 21st March, 2020 granted 1,29,600 Stock Appreciation Rights to the employees of the company and its subsidiaries under Gravita Stock Appreciation Rights Scheme 2017. In addition, during the financial year 2019-20, Gravita Employee Welfare Trust has purchased 5,28,000 Equity shares from Secondary Market. A certificate from the Statutory Auditor on the implementation of your Company’s Employees Stock Option Scheme will be placed at the ensuing Annual General Meeting for inspection by the Members. Further disclosures
pursuant to Regulation 14 of the SEBI (Share Based Employee Benefits) Regulations, 2014, read with SEBI circular dated 16th June, 2015 for the financial year ended 31st March, 2020 are available on website of the company www.gravitaindia.com.
18. Management Discussion and Analysis Report
Management Discussion and Analysis Report for the year under review as stipulated under SEBI (LODR), Regulations, 2015 is presented in a separate section forming part of this Annual Report.
19. Deposit
The Company has not accepted any Deposits from public, shareholders or employees mentioned under section 73 of Companies Act, 2013 and the Companies (Acceptance of Deposits) Rules, 2014 during the reporting period. Additionally company has never accepted deposits from public, shareholders or employees mentioned under section 73 of Companies Act, 2013 and the Companies (Acceptance of Deposits) Rules, 2014 therefore no amount is unclaimed or outstanding for payment as on 31st March, 2020.
20. Statement on compliances of applicable Secretarial Standards
Company has complied with the secretarial standards issued by Institute of Companies Secretaries of India (ICSI) on Board Meetings (SS-1) and General Meetings (SS-2).
21. Share Capital
The Company has made allotment of 2,91,200 Equity Shares of ` 2/- each to the Employees of the Company and its subsidiaries upon exercise of an equal number of stock options granted to them pursuant to the Stock Option Scheme of the Company. Consequently, the issued, subscribed and paid-up equity share capital of the Company has increased from 6, 87,46,714 equity shares of ` 2/- each as at March 31, 2019 to 6, 90,37,914 equity shares of ` 2/- each as at March 31, 2020.
22. Policy on Prevention, Prohibition and Redressal of Sexual Harassment at Workplace
The Company has adopted a Policy on Prevention, Prohibition and Redressal of Sexual Harassment at the Workplace, in line with the provisions of the “Sexual Harassment of Women at Workplace (Prevention, Prohibition and Redressal) Act, 2013” and the Rules made there under. Company has complied with provisions relating to the constitution of Internal Complaints Committee under the Sexual Harassment of Women at Workplace (Prevention, Prohibition and Redressal) Act, 2013 and has formed an “Internal Complaints Committee” for prevention and redressal of sexual

32
Corporate Overview Statutory Reports Financial Statements
For and on behalf of the Board of Directors
Rajat Agrawal Dr. Mahavir Prasad Agarwal Managing Director Whole-time Director DIN: 00855284 DIN: 00188179
Date: 05th August, 2020 C-137, Dayanand Marg C-137, Dayanand MargPlace: Jaipur Tilak Nagar Jaipur-302004 Tilak Nagar Jaipur-302004
harassment at workplace. The Committee is having requisite members and is chaired by a senior woman member of the organization. Further, the Company has not received any complaint of sexual harassment during the financial year 2019-20..
23. Investor Education and Protection Fund (IEPF)
Pursuant to Section 125 of Companies Act, 2013 (corresponding to Section 205C of Companies Act, 1956) read-with Rules made thereunder all unpaid application money received by company for allotment of any securities and due for refund for seven years has to be transferred to Investor Education and Protection fund maintained by the Central Government. Accordingly, the company has transferred a sum of ` 0.27 Lacs during the year to the said fund on account of unpaid dividend account. Further during the year under review the company has transferred 289 equity shares to IEPF suspense account relating to the investors who have not claimed any dividend from last 7 years. The detail of the investors whose amount and shares are transferred is available on the website of the company https://www.gravitaindia.com/investors/iepf-details.
24. Remuneration from Subsidiary:
Mr. Rajat Agrawal (DIN: 00855284), Managing Director of the Company received remuneration from Gravita USA Inc., a step-down Subsidiary of the Company. Apart from this neither the Managing Director nor the Whole Time Director received any remuneration from any Subsidiary.
25. Miscellaneous:
Your Directors state that as there were no transactions during the year under review therefore
no disclosure or reporting is required in respect of the following items:
• Issueofequityshareswithdifferentialrightsas to dividend, voting or otherwise.
• Issue of shares (including sweat equityshares) to employees of the Company under any scheme save and except ESOP’s referred to in this Report.
• Details relating to significant and materialorders passed by the Regulators or Courts or Tribunals which impact the going concern status and Company’s operations in future.
• Details relating toprovisionsof section 134(3) (ca) of Companies Act, 2013 in respect of particulars of fraud reported by the auditors.
• Details related to change in nature ofbusiness of the company.
26. Acknowledgement
The Directors wish to place on record their appreciation for the co-operation and support received from the Banks, Government Authorities, Customers, Suppliers, BSE, NSE, CDSL, NSDL, Business Associates, Shareholders, Auditors, Financial Institutions and other individuals / bodies for their continued co-operation and support. The Directors also acknowledge the hard work, dedication and commitment of the employees. Their enthusiasm and unstinting efforts have enabled the Company to emerge stronger than ever, enabling it to maintain its position as one of the leading players in the recycling industry, in India and around the world.

33
Annual Report2019-2020
Annexures to the Board ReportAnnexure-1
Form No. MGT-9EXTRACT OF ANNUAL RETURN
As on the financial year ended on 31st March, 2020[Pursuant to Section 92(3) of the Companies Act, 2013 and rule 12(1) of the
Companies (Management and Administration) Rules, 2014]
1. Registration and Other Details:
1. CIN L29308RJ1992PLC0068702. Registration Date 04th August 19923. Name of the Company Gravita India Limited4. Category/Sub-Category Public Company Limited by Shares
(Non-Govt. Company)5. Address of the Registered office and
contact details‘Saurabh’, Chittora Road, Harsulia Mod, Diggi – Malpura Road, Tehsil – Phagi, Jaipur – 303 904, Rajasthan, India, Tel.: 09928070682
6. Whether Listed Company Listed7. Name Address and Contact Details of
Registrar and Transfer Agent, if anyKFin Technologies Pvt. LtdSelenium Building, Tower-B, Plot No 31 & 32, Financial District, Nanakramguda, Serilingampally, Hyderabad, Rangareddi, Telangana India - 500 032.Phone No. 040-67162222
2. Principal Business Activities of the Company All the business activities contributing 10 % or more of the total turnover on standalone basis of the company
shall be stated: -
S. No.
Name and Description of main products / services NIC Code of the Product/ service
% to total turnover of the company
1 Lead 24203 89.37%2 Aluminium 24202 6.85%
3. Particulars of Holding, Subsidiary and Associate Company
S. No.
Name and address of the company CIN/GLN Holding/Subsidiary/Associate
%of shares
held
ApplicableSection
1 Gravita Infotech Limited (Formerly Known as Gravita Exim Limited) 501, Rajputana Tower, A-27-B, Shanti Path, Tilak Nagar, Jaipur 302004, Rajasthan
U51109RJ2001PLC016924 Subsidiary 100.00% 2(87) (ii)
2 Noble Build Estate Private Limited402, Gravita Tower, A-27-B, Shanti Path, Tilak Nagar, Jaipur 302004, Rajasthan
U45201RJ2007PTC025501 Subsidiary 100.00% 2(87) (ii)
3 Gravita Ghana LimitedIN/A/43/IB Heavy Industrial Area (Opposite Licensing Office), Tema Ghana
CA-30,197 Subsidiary 100.00% 2(87) (ii)
4 Gravita Senegal SAUL’Usine, Zone Industrielle de Sebikotane, Sebikotane, Dakar, Senegal (West Africa)
SN-DKR-2007-B-6703 Subsidiary 100.00% 2(87) (ii)
5 Gravita Mozambique LDAAv. Samora Machel, No 672-EN4, Bairro Matola-Gare, Tchumene-2, Municipio da Matola, Provincia de Maputo, Mozambique
000318728 Subsidiary 100.00% 2(87) (ii)
6 Gravita Global Pte. Ltd160 Robinson Road, #23-08 SBF Centre, Singapore - 068914
201204623C Subsidiary 100.00% 2(87) (ii)
7 Gravita Netherlands B.V.Kraijenhoffstraat 137a, 1018RG Amsterdam, Netherlands
55270271 Subsidiary 100.00% 2(87) (ii)
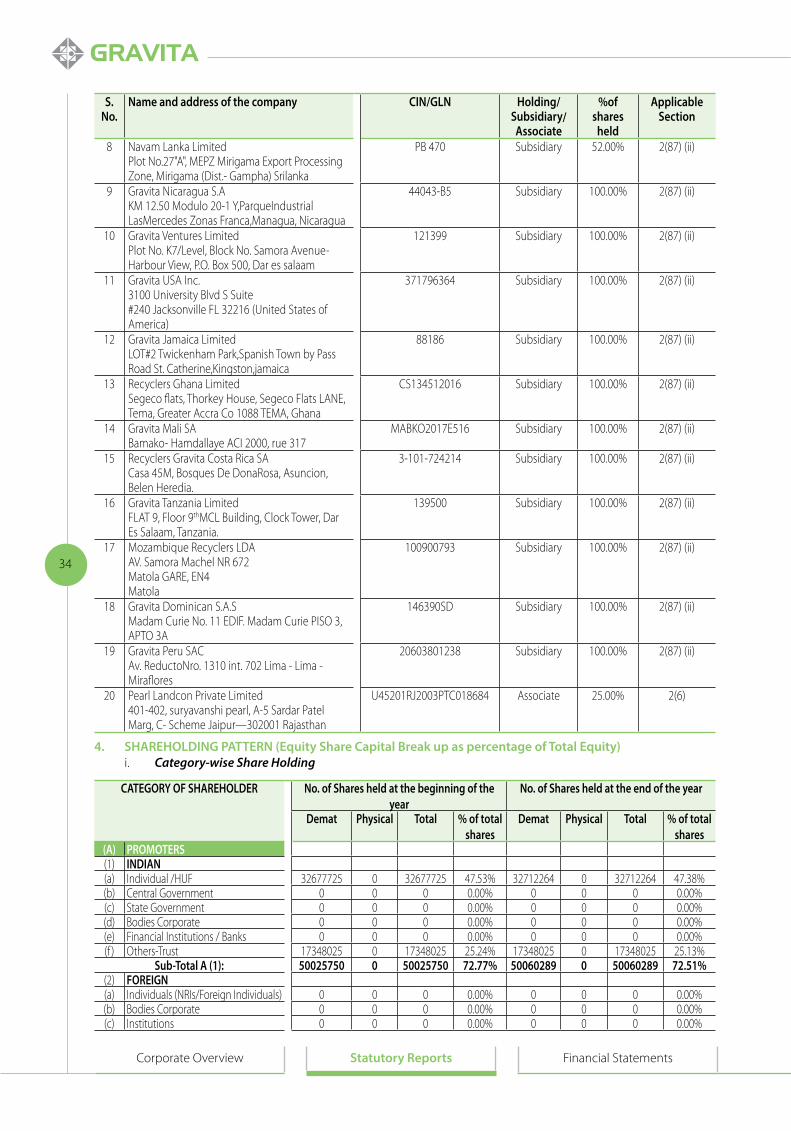
34
Corporate Overview Statutory Reports Financial Statements
S. No.
Name and address of the company CIN/GLN Holding/Subsidiary/Associate
%of shares
held
ApplicableSection
8 Navam Lanka LimitedPlot No.27"A", MEPZ Mirigama Export Processing Zone, Mirigama (Dist.- Gampha) Srilanka
PB 470 Subsidiary 52.00% 2(87) (ii)
9 Gravita Nicaragua S.AKM 12.50 Modulo 20-1 Y,ParqueIndustrial LasMercedes Zonas Franca,Managua, Nicaragua
44043-B5 Subsidiary 100.00% 2(87) (ii)
10 Gravita Ventures LimitedPlot No. K7/Level, Block No. Samora Avenue-Harbour View, P.O. Box 500, Dar es salaam
121399 Subsidiary 100.00% 2(87) (ii)
11 Gravita USA Inc.3100 University Blvd S Suite#240 Jacksonville FL 32216 (United States of America)
371796364 Subsidiary 100.00% 2(87) (ii)
12 Gravita Jamaica LimitedLOT#2 Twickenham Park,Spanish Town by Pass Road St. Catherine,Kingston,jamaica
88186 Subsidiary 100.00% 2(87) (ii)
13 Recyclers Ghana LimitedSegeco flats, Thorkey House, Segeco Flats LANE, Tema, Greater Accra Co 1088 TEMA, Ghana
CS134512016 Subsidiary 100.00% 2(87) (ii)
14 Gravita Mali SABamako- Hamdallaye ACI 2000, rue 317
MABKO2017E516 Subsidiary 100.00% 2(87) (ii)
15 Recyclers Gravita Costa Rica SA Casa 45M, Bosques De DonaRosa, Asuncion, Belen Heredia.
3-101-724214 Subsidiary 100.00% 2(87) (ii)
16 Gravita Tanzania LimitedFLAT 9, Floor 9thMCL Building, Clock Tower, Dar Es Salaam, Tanzania.
139500 Subsidiary 100.00% 2(87) (ii)
17 Mozambique Recyclers LDAAV. Samora Machel NR 672Matola GARE, EN4Matola
100900793 Subsidiary 100.00% 2(87) (ii)
18 Gravita Dominican S.A.SMadam Curie No. 11 EDIF. Madam Curie PISO 3, APTO 3A
146390SD Subsidiary 100.00% 2(87) (ii)
19 Gravita Peru SACAv. ReductoNro. 1310 int. 702 Lima - Lima - Miraflores
20603801238 Subsidiary 100.00% 2(87) (ii)
20 Pearl Landcon Private Limited401-402, suryavanshi pearl, A-5 Sardar Patel Marg, C- Scheme Jaipur—302001 Rajasthan
U45201RJ2003PTC018684 Associate 25.00% 2(6)
4. SHAREHOLDING PATTERN (Equity Share Capital Break up as percentage of Total Equity) i. Category-wise Share Holding
CATEGORY OF SHAREHOLDER No. of Shares held at the beginning of the year
No. of Shares held at the end of the year
Demat Physical Total % of total shares
Demat Physical Total % of total shares
(A) PROMOTERS(1) INDIAN(a) Individual /HUF 32677725 0 32677725 47.53% 32712264 0 32712264 47.38%(b) Central Government 0 0 0 0.00% 0 0 0 0.00%(c) State Government 0 0 0 0.00% 0 0 0 0.00%(d) Bodies Corporate 0 0 0 0.00% 0 0 0 0.00%(e) Financial Institutions / Banks 0 0 0 0.00% 0 0 0 0.00%(f ) Others-Trust 17348025 0 17348025 25.24% 17348025 0 17348025 25.13%
Sub-Total A (1): 50025750 0 50025750 72.77% 50060289 0 50060289 72.51%(2) FOREIGN(a) Individuals (NRIs/Foreign Individuals) 0 0 0 0.00% 0 0 0 0.00%(b) Bodies Corporate 0 0 0 0.00% 0 0 0 0.00%(c) Institutions 0 0 0 0.00% 0 0 0 0.00%

35
Annual Report2019-2020
CATEGORY OF SHAREHOLDER No. of Shares held at the beginning of the year
No. of Shares held at the end of the year
Demat Physical Total % of total shares
Demat Physical Total % of total shares
(d) Qualified Foreign Investor 0 0 0 0.00% 0 0 0 0.00%(e) Others 0 0 0 0.00% 0 0 0 0.00%
Sub-Total A (2): 0 0 0 0.00% 0 0 0 0.00%Total A=A (1) +A (2) 50025750 0 50025750 72.81% 50060289 0 50060289 72.51%
(B) PUBLIC SHAREHOLDING(1) INSTITUTIONS(a) Mutual Funds /UTI 1308268 0 1308268 1.90% 408396 0 408396 0.59%(b) Financial Institutions /Banks 76337 0 76337 0.11% 27906 0 27906 0.04%(c) Central Government 0 0 0 0.00% 0 0 0 0.00%(d) State Government 0 0 0 0.00% 0 0 0 0.00%(e) Venture Capital Funds 0 0 0 0.00% 0 0 0 0.00%(f ) Insurance Companies 0 0 0 0.00% 0 0 0 0.00%(g) Foreign Institutional Investors 1474 0 1474 0.00% 0 0 0 0.00%(h) Foreign Venture Capital Investors 0 0 0 0.00% 0 0 0 0.00%(i) Others 0 0 0 0.00% 0 0 0 0.00%
Sub-Total B(1): 1386079 0 1386079 2.01% 436302 0 436302 0.63%(2) NON-INSTITUTIONS(a) Bodies Corporate 1584003 0 1584003 2.30% 1610908 0 1610908 2.33%(b) Individuals
(i) Individuals holding nominal share capital upto ` 1 lac
8476299 5793 8482092 12.34% 8368731 5631 8374362 12.13%
(ii) Individuals holding nominal share capital in excess of ` 1 lac
5652863 0 5652863 8.22% 6500646 0 6500646 9.42%
(c) OthersCLEARING MEMBERS 121110 0 121110 0.18% 56835 0 56835 0.08%NON-RESIDENT INDIANS 232237 0 232237 0.34% 233271 0 233271 0.34%NBFCs Registered with RBI 0 0 0 0.00% 0 0 0 0.00%Trusts 39733 0 39733 0.06% 23945 0 23945 0.03%Employee Trust 199992 0 199992 0.10% 716510 0 716510 1.04%IEPF 254 0 254 0.00% 543 0 543 0.00%Alternative Investment Fund 843315 0 843315 1.23% 843315 0 843315 1.22%Non-Resident Indian Non Repatriable
177011 0 177011 0.26% 180988 0 180988 0.26%
(d) Qualified Foreign Investor 0 0 0 0.00% 0 0 0 0.00%Sub-Total B(2) : 17326817 5793 17326817 25.21% 18535692 5631 18541323 26.86%
Total Public ShareholdingTotal B=B(1)+B(2)
18669894 5793 18720964 27.23% 18971994 5631 18977625 27.23%
Total (A+B) : 68740921 5793 68746714 100.00% 69037914 5631 69037914 100.00%(C) Shares held by custodians,
against GDRs ADRs0 0 0 0.00% 0 0 0 0.00%
Grand Total (A+B+C) 68740921 5793 68746714 100.00% 69032283 5631 69037914 100.00%
ii. Shareholding of Promoters
S. No.
Shareholder’s Name Shareholding at the beginning of the year
Shareholding at the end of the year % change in sharehold-ing during
the yearNo. of Shares
%of total Shares of the
company
%of Shares Pledged/
encumbered to total shares
No. of Shares
%of total Shares of the
company
%of Shares Pledged/
encumbered to total shares
1 Rajat Agrawal 32677725 47.53% 0.00% 32712264 47.38% 0.00% 0.15%*
2 Dr. Mahavir Prasad Agarwal Trustee on Behalf of Agrawal Family Private Trust
17348025 25.24% 0.00% 17348025 25.13% 0.00% 0.11%*
Total 50025750 72.77% 0.00% 50060289 72.51% 0.00% 0.26%*

36
Corporate Overview Statutory Reports Financial Statements
*There is no change in the number of share held by the promoters of the Company except as mentioned above. However, the percentage of the shareholding has changed during the year due to allotments against exercise of Employee Stock Options.
iii. Change in Promoters’ Shareholding (please specify, if there is no change)
S. No.
Shareholder Name Shareholding at the beginning of the year Cumulative Shareholding during the yearNo. of shares %of total
shares of the company
No. of shares %of total shares of the company
Mr. Rajat Agrawal(DIN:00855284)
At the beginning of the year
32677725 47.33%
Date wise Increase / Decrease in Promoters Share Holding during the year specifying the reasons for increase/Decrease (e.g. allotment / Transfer / Bonus/ Sweat equity etc.)
16/08/201923/08/201930/08/2019
PurchasePurchasePurchase
97730262
3300
0.0014%0.0438%0.0048%
326787023270896432712264
47.33%47.38%47.38%
At the end of the year 32712264 47.38%
S. No.
Shareholder Name Shareholding at the beginning of the year Cumulative Shareholding during the yearNo. of shares % of total shares of the company No. of shares % of total shares of the
companyDr. Mahavir Prasad AgarwalTrustee on Behalf of Agrawal Family Private TrustAt the beginning of the year
17348025 25.24% 17348025 25.24%
Date wise Increase / Decrease in Promoters Share Holding during the year specifying the reasons for increase/Decrease (e.g. allotment / Transfer / Bonus/ Sweat equity etc.)
No Change
At the end of the year 17348025 25.13%
*There is no change in the number of share held by the promoters of the Company except as mentioned above. However, the percentage of the shareholding has changed during the year due to allotments against exercise of Employee Stock Options.
iv. Shareholding Pattern of top ten Shareholders(other than Directors, Promoters and Holders of GDRs and ADRs):
S. No Name Shareholding at the beginning of the year-1st
April 2019
Date Reason Increase/Decrease in shareholding
Cumulative Shareholding during
the yearNo. of Shares
% of total shares of the Company
No. of Shares
% of total shares of the
Company
No. of Shares
% of total shares of the
Company1 Ram Sharan Modi 1591824 2.32% 10/05/2019
31/05/201928/06/2019
SaleSalePurchase
(50)(7500)
8500
0.01%0.03%0.01%
159177415842741592774
2.31%2.29%2.31%
31/03/2020 At the end of the year 1592774 2.31%

37
Annual Report2019-2020
S. No Name Shareholding at the beginning of the year-1st
April 2019
Date Reason Increase/Decrease in shareholding
Cumulative Shareholding during
the yearNo. of Shares
% of total shares of the Company
No. of Shares
% of total shares of the
Company
No. of Shares
% of total shares of the
Company2 Atul Kuchhal 1333424 1.94% 13/12/2019
20/12/201927/12/201928/02/202006/03/202027/03/2020
PurchasePurchasePurchasePurchaseSalePurchase
274608225101137662
8700(10277)
10277
0.39%0.72%0.91%0.93%0.91%0.93%
160803218331331970795197949519692181979495
2.33%2.66%2.85%2.87%2.85%2.87%
31/03/2020 At the end of the year 1979495 2.87%3 Boi Axa Trustee
Services Pvt. Ltd.1308268 1.90% 14/06/2019
21/06/201928/06/201905/07/201912/07/201919/07/201926/07/201902/08/201909/08/201916/08/201923/08/201930/08/201906/09/201913/09/201927/09/201930/09/201911/10/201925/10/201901/11/201908/11/201915/11/201922/11/201928/02/202006/03/2020
SaleSaleSaleSaleSaleSaleSaleSaleSaleSaleSaleSaleSaleSaleSaleSaleSaleSaleSaleSaleSaleSaleSaleSale
(14683)(49000)(16677)
(4910)(25162)(50339)(45290)
(102642)(45531)(20000)(65814)(20000)(19497)(66611)(20000)(20000)(35361)(66507)(35445)(43845)(72558)(15000)(25000)(20000)
0.03%0.10%0.12%0.13%0.16%0.24%0.30%0.45%0.52%0.55%0.64%0.67%0.70%0.80%0.83%0.85%0.91%1.00%1.05%1.12%1.22%1.24%1.28%1.31%
1293585124458512279081222998119783611474971102207
999565954034934034868220848220828723762112742112722112686751620244584799540954468396453396428396408396
1.87%1.80%1.78%1.77%1.74%1.66%1.60%1.45%1.38%1.35%1.26%1.23%1.20%1.10%1.07%1.05%0.99%0.90%0.85%0.78%0.68%0.66%0.62%0.59%
31/03/2020 At the end of the year 408396 0.59%4 UNIFI AIF 2 843315 1.23% 843315 1.23%
31/03/2020 At the end of the year 843315 1.22%5 Yagyadatt Sharma 199992 0.29% 12/04/2019
13/03/202020/03/202027/03/202031/03/2020
PurchasePurchasePurchasePurchasePurchase
8122520236722137838
19430
200000322520559242697080716510
0.29%0.47%0.81%1.01%1.04%
31/03/2020 At the end of the year 716510 1.04%6 Deepak Modi 614241 0.89% 05/04/2019
12/04/201919/04/201926/04/201903/05/201917/05/201931/05/201928/06/2019
SalePurchaseSaleSalePurchasePurchaseSalePurchase
(41849)5369(175)
(5928)3426124700(4500)
5000
0.06%0.05%0.05%0.06%0.01%0.02%0.02%0.02%
572392577761577586571658605919630619626119631119
0.830.840.840.830.880.910.910.91

38
Corporate Overview Statutory Reports Financial Statements
S. No Name Shareholding at the beginning of the year-1st
April 2019
Date Reason Increase/Decrease in shareholding
Cumulative Shareholding during
the yearNo. of Shares
% of total shares of the Company
No. of Shares
% of total shares of the
Company
No. of Shares
% of total shares of the
Company12/07/201919/07/201926/07/201909/08/201916/08/201927/09/201917/01/202031/01/202006/03/2020
SalePurchaseSaleSalePurchaseSaleSaleSaleSale
(10839)7977
(9175)(11277)
53544(77552)(54863)
(220428)(308506)
0.01%0.02%0.01%0.01%0.07%0.04%0.12%0.44%0.89%
620280628257619082607805661349583797528934308506
0
0.900.910.900.880.960.850.770.45
0.00%31/03/2020 At the end of the year 0 0.00%
7 Sangeeta Devi Modi 250 0.00% 31/01/202014/02/202006/03/202020/03/202027/03/2020
PurchasePurchasePurchaseSaleSale
22042888993
308506(47152)(44999)
032%0.45%0.90%0.83%0.76%
220678309671618177571025526026
0.32%0.45%0.90%0.83%0.76%
31/03/2020 At the end of the year 526026 0.76%8 Saravana Stocks
Pvt. Ltd.50000 0.07% 05/04/2019
23/08/201930/08/201906/09/201927/09/201930/09/201904/10/201911/10/201918/10/201925/10/201908/11/201908/11/2019
PurchasePurchasePurchasePurchasePurchasePurchasePurchasePurchasePurchasePurchasePurchaseSale
50000100000
800002000050000
43954550534753331123223512000
(12000)
0.08%0.22%0.34%0.36%0.44%0.44%0.51%0.56%0.61%0.65%0.67%0.65%
100000200000280000300000350000354395399900434653467765500000512000500000
0.15%0.29%0.41%0.43%0.51%0.51%0.58%0.63%0.68%0.72%0.74%0.72%
31/03/2020 At the end of the year 500000 0.72%9 Meenakshi Batwara 132042 0.19% 10/05/2019
27/12/201931/12/201903/01/202010/01/202017/01/202024/01/202031/01/202007/02/202014/02/202021/02/202028/02/202006/03/2020
SalePurchasePurchaseSaleSaleSalePurchasePurchaseSalePurchasePurchasePurchasePurchase
(50)87711
999(4110)
(16355)(90161)
438051748
(30656)71686168215973518720
0.00%0.13%0.13%0.12%0.10%0.03%0.02%0.05%0.01%0.11%0.13%0.22%0.25%
131992219703220702216592200237110076114456166204135548207234224055283790302510
0.19%0.32%0.32%0.31%0.29%0.16%0.17%0.24%0.20%0.30%0.32%0.41%0.44%
31/03/2020 At the end of the year 302510 0.44%11 Raveena Kothari 204822 0.30% 12/04/2019
03/05/201902/08/201914/02/202021/02/2020
Purchase PurchasePurchasePurchasePurchase
50007449
511629534500
0.01%0.02%0.01%0.04%0.09%
209822217271217322233617268117
0.31%0.32%0.31%0.34%0.39%
31/03/2020 At the end of the year 268117 0.39%12 Jaikrishan Jajoo 203695 0.30% 13/12/2019
20/12/2019SaleSale
(65020)(138675)
0.10%0.30%
1386750
0.20%0.00%
31/03/2020 At the end of the year 76298 0.11%

39
Annual Report2019-2020
v. Shareholding of Directors and Key Managerial Personnel:
S. No.
For Each Directors and KMP Shareholding at the beginning of the year-1st
April 2019
Cumulative Shareholding during
the yearNo. of Shares
%of total shares of the
company
No. of Shares
% of total shares of the
company1 Rajat Agrawal (DIN:00855284) At the beginning of the year 32677725 47.33%
Date wise Increase / Decrease in Share Holding during the year specifying the reasons for increase/Decrease (e.g. allotment / Transfer / Bonus/ Sweat equity etc.)
16/08/201923/08/201930/08/2019
PurchasePurchasePurchase
97730262
3300
0.0014%0.0438%0.0048%
326787023270896432712264
47.33%47.38%47.38%
At the end of the year 32712264 47.38%2 Dr. Mahavir Prasad Agarwal (DIN: 00188179)
(Trustee on Behalf of Agrawal Family Private Trust)
At the beginning of the year 17348025 25.24% 17348025 25.24%
Date wise Increase / Decrease in Share Holding during the year specifying the reasons for increase/Decrease (e.g. allotment / Transfer / Bonus/ Sweat equity etc.)
No Change
At the end of the year 17348025 25.13%3 Mr. Dinesh Kumar Govil (DIN:02402409) At the beginning of the year Nil Nil Nil Nil
Date wise Increase / Decrease in Share Holding during the year specifying the reasons for increase/Decrease (e.g. allotment / Transfer / Bonus/ Sweat equity etc.)
No Change
At the end of the year Nil Nil4 Mr. Yogesh Malhotra (DIN:05332393) At the beginning of the year 3756 0.0055%
Date wise Increase / Decrease in Share Holding during the year specifying the reasons for increase/Decrease (e.g. allotment / Transfer / Bonus/ Sweat equity etc.)
10/05/19 ESOP 22750 0.0330% 26506 0.0385%
At the end of the year 26506 0.0385%5 Mr. Arun Kumar Gupta (DIN: 02749451) At the beginning of the year Nil Nil Nil Nil
Date wise Increase / Decrease in Share Holding during the year specifying the reasons for increase/Decrease (e.g. allotment / Transfer / Bonus/ Sweat equity etc.)
No Change
At the end of the year Nil Nil6 Mrs. Chanchal Chadha Phadnis (DIN:
07133840)At the beginning of the year Nil Nil Nil Nil
Date wise Increase / Decrease in Share Holding during the year specifying the reasons for increase/Decrease (e.g. allotment / Transfer / Bonus/ Sweat equity etc.)
No Change
At the end of the year Nil Nil7 Mr. Sunil Kansal At the beginning of the year 37050 0.0539%

40
Corporate Overview Statutory Reports Financial Statements
S. No.
For Each Directors and KMP Shareholding at the beginning of the year-1st
April 2019
Cumulative Shareholding during
the yearNo. of Shares
%of total shares of the
company
No. of Shares
% of total shares of the
companyDate wise Increase / Decrease in Share Holding during the year specifying the reasons for increase/Decrease (e.g. allotment / Transfer / Bonus/ Sweat equity etc.)
10/05/2019 ESOP 12600 0.0183% 49650 0.0007%
At the end of the year 49650 0.0007%8 Mr. Nitin Gupta At the beginning of the year 10 0.0000%
Date wise Increase / Decrease in Share Holding during the year specifying the reasons for increase/Decrease (e.g. allotment / Transfer / Bonus/ Sweat equity etc.)
10/05/201907/06/201907/06/201910/06/201918/06/201920/06/201920/06/2019
ESOPSaleSaleSaleSaleSaleSale
3500500500
1000578347
75
0.0051%0.0007%0.0007%0.0017%0.0008%0.0005%0.0001%
3510301025101510
932585510
0.0051%0.0044%0.0036%0.0022%0.0013%0.0008%0.0007%
At the end of the year 510 0.0007%
*The percentage of the shareholding in shareholding of Directors and KMP has changed during the year due to allotments against exercise of Employee Stock Options.
5. Indebtedness of the Company including interest outstanding/accrued but not due for payment
(` In lacs)Indebtedness at the beginning of the year Secured Loans
excluding depositsUnsecured
LoansDeposits Total
Indebtednessi. Principal Amount 21,633.09 0.00 0.00 21,633.09ii. Interest due but not paid 0.00 0.00 0.00 0.00iii. Interest accrued but not paid 6.43 0.00 0.00 6.43Total (i+ii+iii) 21,639.52 0.00 0.00 21,639.52Change in Indebtedness during the financial year•Addition 2,928.15 0.00 0.00 2,928.15•Reduction 1822.80 0.00 0.00 1822.80Net Change 1,105.35 0.00 0.00 1,105.35Indebtedness at the end of the yeari. Principal Amount 22,738.44 0.00 0.00 22,738.44ii. Interest due but not paid 0.00 0.00 0.00 0.00iii. Interest accrued but not paid 23.17 0.00 0.00 23.17Total (i+ii+iii) 22,761.61 0.00 0.00 22,761.61

41
Annual Report2019-2020
6. Remuneration of Directors and Key Managerial Personnel
(A) Remuneration to Managing Director, Whole-Time Directors and/or Manager: (` In lacs)
S. No
Particulars of Remuneration Name of MD/WTD/Manager Total AmountMr. Rajat Agrawal
DIN:00855284Dr. Mahavir Prasad
AgarwalDIN:00188179
Mr. Yogesh MalhotraDIN:05332393
1 Gross Salary(a) Salary as per provisions
contained in section 17(1)of the Income Tax Act
119.02 119.81 47.03 285.86
(b) Value of perquisites u/s 17(2) Income Tax Act, 1961
0.98 0.19 3.48 4.65
(c) Profits in lieu of salary under Section 17(3) Income Tax Act, 1961
Nil Nil Nil Nil
2. Stock Option* Nil Nil 18.71 18.713. Sweat Equity Nil Nil Nil Nil4. Commission
-As % of profitOthers -Variable Pay-PAT Incentive/Performance Incentive/ Special Ex- Gratia**
Nil Nil 28.93 28.93
5. Others:Provident FundGratuityNPS Contribution
5.712.28Nil
5.752.30Nil
2.110.841.82
13.575.421.82
Performance Bonus Nil Nil Nil NilTotal (A) 127.99 128.05 102.92 358.96Ceiling as per the Act Remuneration is paid as per Schedule V of Companies Act, 2013 and ceiling is based
on effective capital of the company.
*Represent the value of options exercised and regarded as perquisite. However, it does not include the value of unvested options or options vested but not exercised.
** PAT Incentive/Performance Incentive is subject to Performance and Target Achievement
(B) Remuneration to Other Directors:
S. No
Particulars of Remuneration Name of Directors Total Amount
1. Independent Directors
(a) Fees for attending board committee meetings
NIL
(b) Commission
(c) Other, please specify
Total (1)
2. Other Non-Executive Directors
(a) Fees for attending board committee meetings
(b) Commission
(c) Other, please specify
Total (2)
Total (B) = (1+2)
Total Managerial Remuneration
Overall Ceiling as per the Act

42
Corporate Overview Statutory Reports Financial Statements
(C) Remuneration to Key Managerial Personnel Other Than MD/ Manager/ WTD: (` In lacs)
Sr. No
Particulars of Remuneration Name of KMP Total AmountMr. Yogesh Malhotra
[Whole Time Director & Chief
Executive Officer]
Mr. Nitin Gupta[Company Secretary]
Mr. Sunil Kansal[Chief Financial
Officer]
1. Gross Salary(a) Salary as per provisions contained in
section 17(1) of the Income Tax Act47.03 7.52 45.53 100.08
(b) Value of perquisites u/s 17(2) Income Tax Act, 1961
3.48 0.29 1.73 5.50
(c) Profits in lieu of salary under Section 17(3) Income Tax Act, 1961
Nil Nil Nil Nil
2. Stock Option* 18.71 2.77 10.36 31.843. Sweat Equity Nil Nil Nil Nil4. Commission
-As % of profitOthers -Variable Pay-PAT Incentive/Performance Incentive/ Special Ex- Gratia**
NilNil
28.93
NilNil
0.62
NilNil
31.50
NilNil
61.05
5. Others, please specifyProvident Fund & other Funds 4.77 0.37 5.24 10.38Performance Bonus Nil Nil Nil NilTotal (A) 102.92 11.57 94.36 208.85Ceiling as per the Act N.A. N.A. N.A. N.A.
*Represent the value of options exercised and regarded as perquisite. However, it does not include the value of unvested options or options vested but not exercised.
** PAT Incentive/Performance Incentives subject to Performance and Target Achievement
7. PENALTIES / PUNISHMENT/ COMPOUNDING OF OFFENCES:
Type Section of the Companies
Act
Brief Description
Details of Penalty / Punishment / Compounding
fees imposed
Authority [RD / NCLT /
COURT]
Appeal made, if any (give Details)
A. COMPANY Penalty N.A. N.A. N.A. N.A. N.A.Punishment N.A. N.A. N.A. N.A. N.A.Compounding N.A. N.A. N.A. N.A. N.A.B. DIRECTORS Penalty N.A. N.A. N.A. N.A. N.A.Punishment N.A. N.A. N.A. N.A. N.A.Compounding N.A. N.A. N.A. N.A. N.A.C. OTHER OFFICERS IN DEFAULT Penalty N.A. N.A. N.A. N.A. N.A.Punishment N.A. N.A. N.A. N.A. N.A.Compounding N.A. N.A. N.A. N.A. N.A.
For and on behalf of the Board of Directors
Rajat Agrawal Dr. Mahavir Prasad Agarwal Managing Director Whole-time Director DIN: 00855284 DIN: 00188179
Date: 05th August, 2020 C-137, Dayanand Marg C-137, Dayanand MargPlace: Jaipur Tilak Nagar Jaipur-302004 Tilak Nagar Jaipur-302004

43
Annual Report2019-2020
Annexure-2
CSR REPORTFORMAT FOR THE ANNUAL REPORT ON CSR ACTIVITIES TO BE INCLUDED IN THE BOARD REPORT
1 A brief outline of the company’s CSR policy, including overview of projects or programs proposed to be undertaken and a reference to the web-link to the CSR policy and projects or programs.
The Company has framed a CSR Policy in compliance with the provisions of the Companies Act, 2013 and the same is placed on the Company’s website and the weblink for the same is http://www.gravitaindia.com/wp-content/uploads/pdf/csr-policy.pdfAs per CSR Policy of the Company, the Company may engage in any of the activities related to Health, Education, Environment, Sports and Others. The Company may also collaborate with other companies/trust/societies for undertaking projects or programs or CSR activities in accordance with the provisions, amendments and rules specified in the Act. In addition, it may build CSR capacities of their own personnel as well as their implementing agencies through institutions while complying with respective provisions and amendments, if any, under Companies Act, 2013. The CSR initiatives of the Company shall focus the areas surrounding its plants, locations or where the Company has its offices.
2 The Composition of the CSR Committee. As on 31st March, 2020 CSR Committee of the Company comprises of following Directors:Mr. Dinesh Kumar Govil (DIN: 02402409) (Chairman)Mr. Rajat Agrawal (DIN:00855284) (Member)Dr. Mahavir Prasad Agarwal (DIN:00188179) (Member)
3 Average net profit of the company for last three financial years
` 2987.98 Lacs
4 Prescribed CSR Expenditure (two percent of the amount as in item 3 above)
` 59.76 Lacs
5 Details of CSR spent during the financial year.(1) Total amount to be spent for the F.Y.
(2) Amount unspent , if any;(3) Manner in which the amount spent during the financial year :
` 109.57 Lacs (Out of which ` 49.81 Lacs relates to the unspent CSR amount of past years). Total unspent amount of past years was ` 73.23 Lacs out of which ` 49.81 Lacs has been spent in F.Y. 2019-20 and ̀ 23.42 has been carried forward to next F.Y. ` NilThe manner in which the amount is spent is detailed hereunder in Table A
6 Reason for not spending 2% of average net profits
N.A.
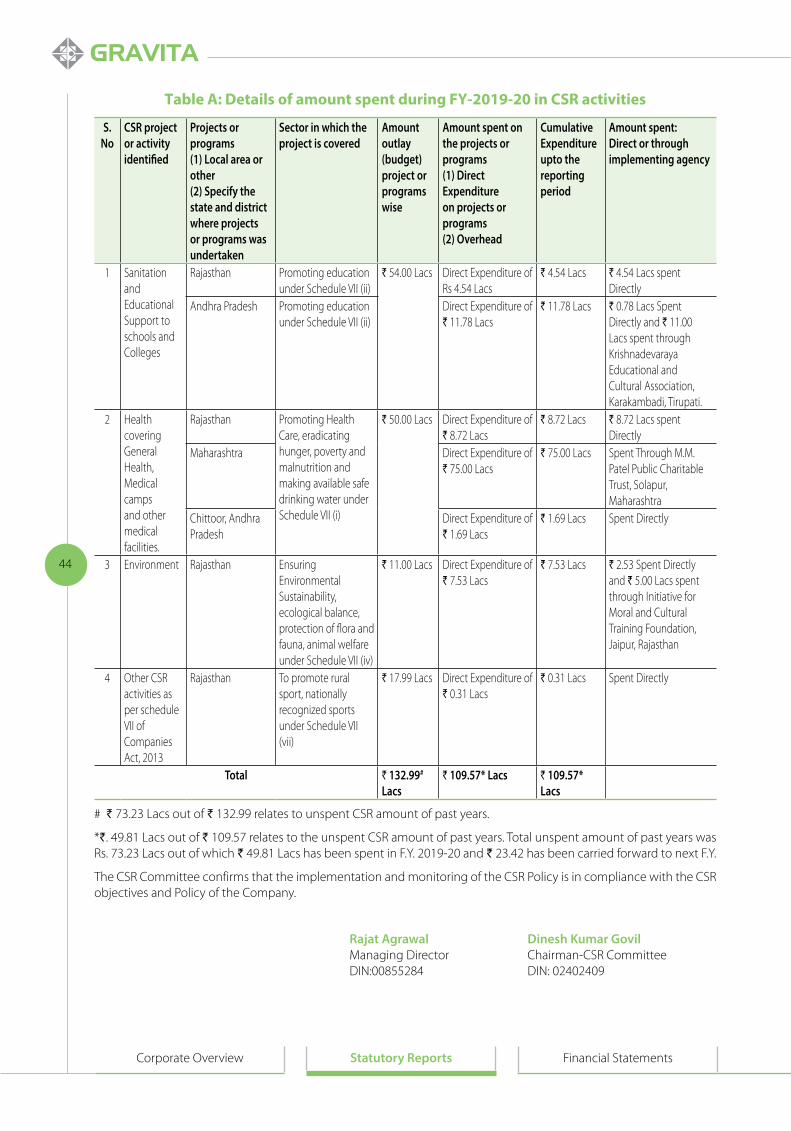
44
Corporate Overview Statutory Reports Financial Statements
Table A: Details of amount spent during FY-2019-20 in CSR activities
S.No
CSR projector activityidentified
Projects or programs(1) Local area or other(2) Specify the state and district where projects or programs was undertaken
Sector in which the project is covered
Amountoutlay(budget)project orprogramswise
Amount spent on the projects or programs(1) Direct Expenditure on projects or programs(2) Overhead
Cumulative Expenditure upto the reporting period
Amount spent:Direct or through implementing agency
1 Sanitation and Educational Support to schools and Colleges
Rajasthan Promoting education under Schedule VII (ii)
` 54.00 Lacs Direct Expenditure of Rs 4.54 Lacs
` 4.54 Lacs ` 4.54 Lacs spent Directly
Andhra Pradesh Promoting education under Schedule VII (ii)
Direct Expenditure of ` 11.78 Lacs
` 11.78 Lacs ` 0.78 Lacs Spent Directly and ` 11.00 Lacs spent through Krishnadevaraya Educational and Cultural Association, Karakambadi, Tirupati.
2 Health covering General Health, Medical camps and other medical facilities.
Rajasthan Promoting Health Care, eradicating hunger, poverty and malnutrition and making available safe drinking water under Schedule VII (i)
` 50.00 Lacs Direct Expenditure of ` 8.72 Lacs
` 8.72 Lacs ` 8.72 Lacs spent Directly
Maharashtra Direct Expenditure of ` 75.00 Lacs
` 75.00 Lacs Spent Through M.M. Patel Public Charitable Trust, Solapur, Maharashtra
Chittoor, Andhra Pradesh
Direct Expenditure of ` 1.69 Lacs
` 1.69 Lacs Spent Directly
3 Environment Rajasthan Ensuring Environmental Sustainability, ecological balance, protection of flora and fauna, animal welfare under Schedule VII (iv)
` 11.00 Lacs Direct Expenditure of ` 7.53 Lacs
` 7.53 Lacs ` 2.53 Spent Directly and ` 5.00 Lacs spent through Initiative for Moral and Cultural Training Foundation, Jaipur, Rajasthan
4 Other CSR activities as per schedule VII of Companies Act, 2013
Rajasthan To promote rural sport, nationally recognized sports under Schedule VII (vii)
` 17.99 Lacs Direct Expenditure of ` 0.31 Lacs
` 0.31 Lacs Spent Directly
Total ` 132.99#
Lacs` 109.57* Lacs ` 109.57*
Lacs
# ` 73.23 Lacs out of ` 132.99 relates to unspent CSR amount of past years.
*`. 49.81 Lacs out of ` 109.57 relates to the unspent CSR amount of past years. Total unspent amount of past years was Rs. 73.23 Lacs out of which ` 49.81 Lacs has been spent in F.Y. 2019-20 and ` 23.42 has been carried forward to next F.Y.
The CSR Committee confirms that the implementation and monitoring of the CSR Policy is in compliance with the CSR objectives and Policy of the Company.
Rajat AgrawalManaging DirectorDIN:00855284
Dinesh Kumar GovilChairman-CSR CommitteeDIN: 02402409

45
Annual Report2019-2020
Annexure-3
Form No.: MR-3
SECRETARIAL AUDIT REPORTFor the Financial Year ended on 31st March, 2020
{Pursuant to Section 204 (1) of the Companies Act, 2013 and Rule No. 9 of the Companies (Appointment and Remuneration of Managerial Personnel) Rules, 2014}
To The Members,Gravita India Limited‘Saurabh’, Chittora Road, Harsulia Mod,Diggi Malpura, Tehsil-Phagi,Jaipur-303 904 (Rajasthan)
I have conducted the secretarial audit of the compliance of applicable statutory provisions and the adherence to good corporate practices by Gravita India Limited (hereinafter called “the Company”). Secretarial Audit was conducted in a manner that provided me a reasonable basis for evaluating the corporate conducts/statutory compliances and expressing my opinion thereon.
Based on my verification of Gravita India Limited’s books, papers, minute books, forms and returns filed and other records maintained by the Company and also the information provided by the Company, its officers, agents and authorized representatives during the conduct of Secretarial Audit, I hereby report that in my opinion, the Company has, during the audit period covering the financial year ended on 31st March, 2020complied with the statutory provisions listed hereunder and also that the Company has proper Board-processes and compliance mechanism in place to the extent, in the manner and subject to the reporting made hereinafter:
I have examined the books, papers, minute books, forms and returns filed, and other records maintained by the Company for the financial year ended on 31st March, 2020 according to the provisions of:
1. The Companies Act, 2013 (the Act) and the rules made thereunder;
2. The Securities Contracts (Regulation) Act, 1956 (‘SCRA’) and the rules made thereunder;
3. The Depositories Act, 1996 and the Regulations and Bye-laws framed thereunder;
4. Foreign Exchange Management Act, 1999 and the rules and regulations made thereunder to the extent of Foreign Direct Investment, Overseas Direct Investment and External Commercial Borrowings;
5. The following Regulations and Guidelines prescribed under the Securities and Exchange Board of India Act, 1992 (‘SEBI Act’): -
a. The Securities and Exchange Board of India (Substantial Acquisition of Shares and Takeovers) Regulations, 2011;
b. The Securities and Exchange Board of India (Prohibition of Insider Trading) Regulations, 2015
c. The Securities and Exchange Board of India (Issue of Capital and Disclosure Requirements) Regulations, 2009; (Not applicable to the Company during the reporting period under audit)
d. The Securities and Exchange Board of India (Employee Stock Option Scheme and Employee Stock Purchase Scheme) Guidelines, 1999/ The Securities and Exchange Board of India (Share Based Employee Benefits) Regulations, 2014;
e. The Securities and Exchange Board of India (Issue and Listing of Debt Securities) Regulations, 2008; (Not applicable to the Company during the reporting period under audit)
f. The Securities and Exchange Board of India (Registrars to an Issue and Share Transfer Agents) Regulations, 1993 regarding the Companies Act and dealing with client;
g. The Securities and Exchange Board of India (Delisting of Equity Shares) Regulations, 2009; (Not applicable to the Company during the reporting period under audit) &
h. The Securities and Exchange Board of India (Buyback of Securities) Regulations, 1998; (Not applicable to the Company during the reporting period under audit)

46
Corporate Overview Statutory Reports Financial Statements
I have also examined compliance with the applicable clauses of the following:
(i) Secretarial Standards on Board and General Meetings (SS-1 & SS-2) issued by The Institute of Company Secretaries of India.
(ii) The Listing Agreements entered into by the Company with BSE Limited and National Stock Exchange of India Limited.
During the period under review the Company has complied with the provisions of the Acts, Rules, Regulations, Guidelines, Standards, etc. as mentioned above subject to the following observations:
• The Board of Directors of the Company at their meeting held on 21st March, 2020 has decided to sell its investment in one of the partnership firm named as “ Gravita Metals”, J&K, Dueto OngoingCovid-2019 Pandemic and lockdown in the state of Rajasthan declared on 21st March, 2020, the intimation under regulation 30 of Securities and Exchange Board of India (listing obligation and disclosure requirements) regulation, 2015 was submitted delayed on 21st May, 2020 to respective stock exchange(s). Accordingly, the company has not intimated the same within the timelines prescribed in securities and exchange board of India (Listing obligation and disclosure requirements) regulation, 2015
I further report that having regard to the compliance system prevailing in the company and on examination of the relevant documents and records in pursuance thereof, on test-check basis, the Company has complied with the following laws applicable specifically to the Company:
1. The Manufacture, Storage & Import of Hazardous Chemical Rules, 1989
2. Batteries (Management and Handling) Rules, 2001.
3. Hazardous Waste Management and Handling Rules, 2008
I further report that, during the year under review:
The Board of Directors of the Company is duly constituted with proper balance of Executive Directors, Non-Executive Directors and Independent Directors. The changes, if any, in the composition of the Board of Directors that took place during the period under review were carried out in compliance with the provisions of the Act.
Adequate notices were given to all directors to schedule the Board Meetings, agenda and detailed notes on agenda are sent at least seven days in advance, or at short period, as the case may be, a system exists for seeking and obtaining further information and clarifications on the agenda items before the meeting and for meaningful participation at the meeting.
All the decisions at Board Meetings and Board Committee Meetings are carried out unanimously as recorded in the minutes of the meetings of Board of Directors of the Company or committee of the Board, as the case may be.
I further report that there are adequate systems and processes in the company commensurate with the size and operations of the company to monitor and ensure compliance with applicable laws, rules, regulations and guidelines.
I further report that during the audit period:
a) The name of the RTA of the company has been changed from Karvy Fintech Private Limited to Kfin Technologies Private Limited with effect from December 05,2019.
b) The Company has issued & allotted 2,91,200 Equity Shares of ` 2/- each under Gravita Employee Stock Option Scheme.
For P. Pincha & AssociatesCompany Secretaries
Pradeep PinchaProprietor
Dated: 04th June, 2020 M. No.: FCS 5369Place: Jaipur C. P. No.:4426UDIN: F005369B0003173131
(This report is to be read with our letter of even date which is annexed as Annexure-A which forms an integral part of this report.)

47
Annual Report2019-2020
Annexure-A”
To The Members,Gravita India Limited‘Saurabh’, Chittora Road, Harsulia Mod,Diggi Malpura,Tehsil-Phagi, Jaipur,Rajasthan-303904
Our report of even date is to be read along with this letter:
1. Maintenance of secretarial record is the responsibility of the management of the Company. My responsibility is to express an opinion on these secretarial records based on our audit.
2. I have followed the audit practices and processes as were appropriate to obtain reasonable assurance about the correctness of the contents of the secretarial records. The verification was done on test basis to ensure that correct facts are reflected in secretarial records. I believe that the processes and practices, we followed provide a reasonable basis for our opinion.
3. I have not verified the correctness and appropriateness of financial records and books of accounts of the Company.
4. Where ever required, I have obtained the management representation about the compliance of laws, rules, and regulations and happening of events etc.
5. The compliance of the provisions of corporate and other applicable laws, rules, regulations, standards is the responsibility of management. My examination was limited to the verification of procedures on test basis.
6. The Secretarial Audit report is neither an assurance as to the future viability of the Company nor of the efficacy or effectiveness with which the management has conducted the affairs of the Company.
For P. Pincha & AssociatesCompany Secretaries
Pradeep PinchaProprietor
Dated: 04th June, 2020 M. No.: FCS 5369Place: Jaipur C. P. No.:4426UDIN: F005369B0003173131
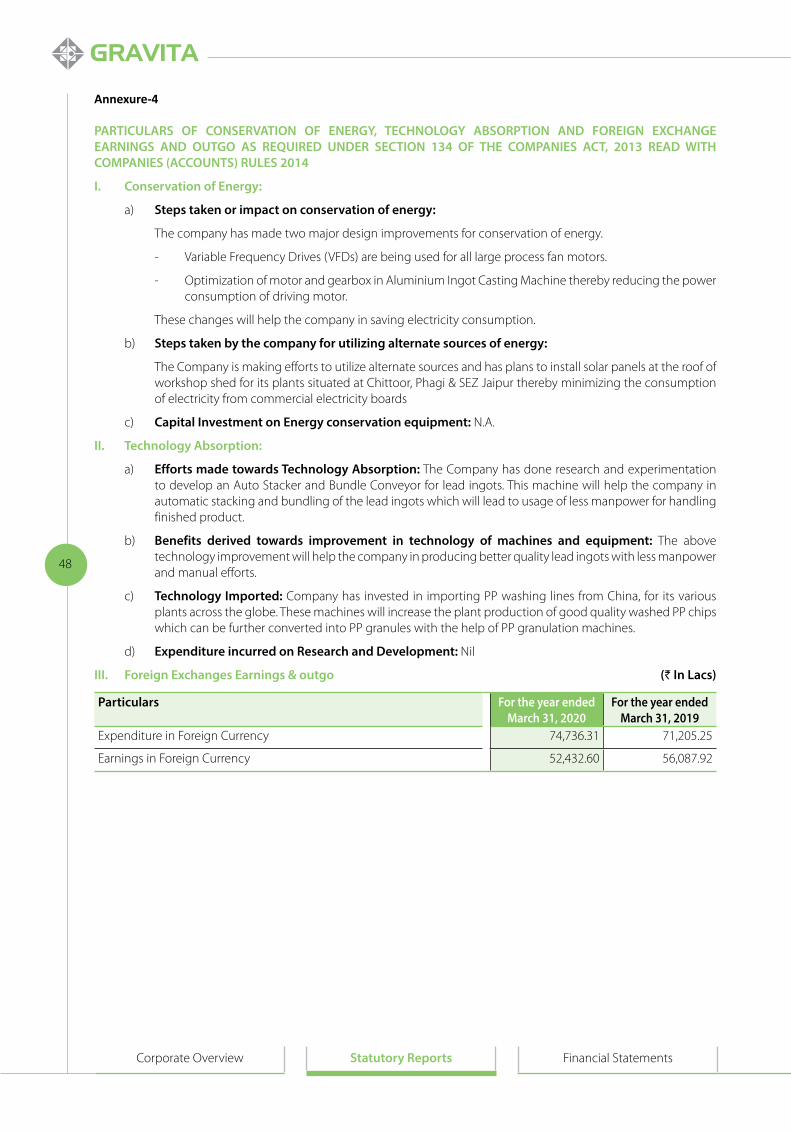
48
Corporate Overview Statutory Reports Financial Statements
Annexure-4
PARTICULARS OF CONSERVATION OF ENERGY, TECHNOLOGY ABSORPTION AND FOREIGN EXCHANGE EARNINGS AND OUTGO AS REQUIRED UNDER SECTION 134 OF THE COMPANIES ACT, 2013 READ WITH COMPANIES (ACCOUNTS) RULES 2014
I. Conservation of Energy:
a) Steps taken or impact on conservation of energy:
The company has made two major design improvements for conservation of energy.
- Variable Frequency Drives (VFDs) are being used for all large process fan motors.
- Optimization of motor and gearbox in Aluminium Ingot Casting Machine thereby reducing the power consumption of driving motor.
These changes will help the company in saving electricity consumption.
b) Steps taken by the company for utilizing alternate sources of energy:
The Company is making efforts to utilize alternate sources and has plans to install solar panels at the roof of workshop shed for its plants situated at Chittoor, Phagi & SEZ Jaipur thereby minimizing the consumption of electricity from commercial electricity boards
c) Capital Investment on Energy conservation equipment: N.A.
II. Technology Absorption:
a) Efforts made towards Technology Absorption: The Company has done research and experimentation to develop an Auto Stacker and Bundle Conveyor for lead ingots. This machine will help the company in automatic stacking and bundling of the lead ingots which will lead to usage of less manpower for handling finished product.
b) Benefits derived towards improvement in technology of machines and equipment: The above technology improvement will help the company in producing better quality lead ingots with less manpower and manual efforts.
c) Technology Imported: Company has invested in importing PP washing lines from China, for its various plants across the globe. These machines will increase the plant production of good quality washed PP chips which can be further converted into PP granules with the help of PP granulation machines.
d) Expenditure incurred on Research and Development: Nil
III. Foreign Exchanges Earnings & outgo (` In Lacs)
Particulars For the year ended March 31, 2020
For the year ended March 31, 2019
Expenditure in Foreign Currency 74,736.31 71,205.25
Earnings in Foreign Currency 52,432.60 56,087.92
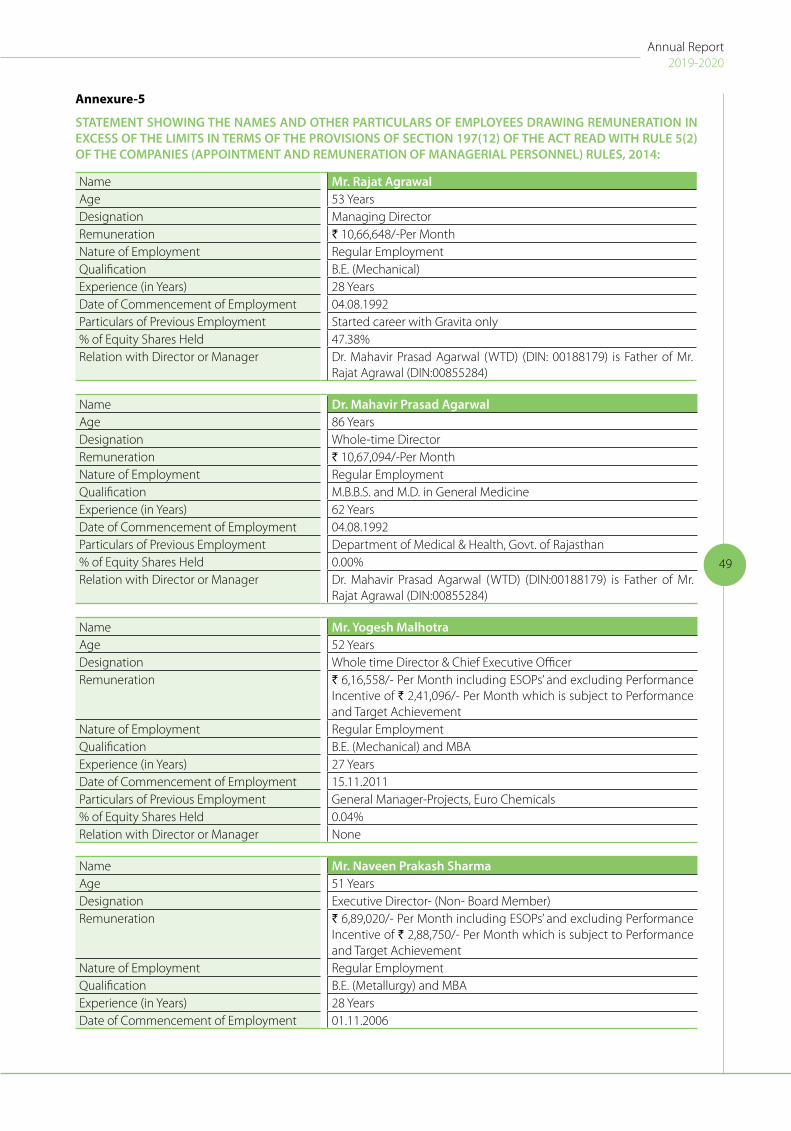
49
Annual Report2019-2020
Annexure-5
STATEMENT SHOWING THE NAMES AND OTHER PARTICULARS OF EMPLOYEES DRAWING REMUNERATION IN EXCESS OF THE LIMITS IN TERMS OF THE PROVISIONS OF SECTION 197(12) OF THE ACT READ WITH RULE 5(2) OF THE COMPANIES (APPOINTMENT AND REMUNERATION OF MANAGERIAL PERSONNEL) RULES, 2014:
Name Mr. Rajat AgrawalAge 53 YearsDesignation Managing DirectorRemuneration ` 10,66,648/-Per MonthNature of Employment Regular EmploymentQualification B.E. (Mechanical)Experience (in Years) 28 YearsDate of Commencement of Employment 04.08.1992Particulars of Previous Employment Started career with Gravita only% of Equity Shares Held 47.38%Relation with Director or Manager Dr. Mahavir Prasad Agarwal (WTD) (DIN: 00188179) is Father of Mr.
Rajat Agrawal (DIN:00855284)
Name Dr. Mahavir Prasad AgarwalAge 86 YearsDesignation Whole-time DirectorRemuneration ` 10,67,094/-Per MonthNature of Employment Regular EmploymentQualification M.B.B.S. and M.D. in General MedicineExperience (in Years) 62 YearsDate of Commencement of Employment 04.08.1992Particulars of Previous Employment Department of Medical & Health, Govt. of Rajasthan% of Equity Shares Held 0.00%Relation with Director or Manager Dr. Mahavir Prasad Agarwal (WTD) (DIN:00188179) is Father of Mr.
Rajat Agrawal (DIN:00855284)
Name Mr. Yogesh MalhotraAge 52 YearsDesignation Whole time Director & Chief Executive OfficerRemuneration ` 6,16,558/- Per Month including ESOPs’ and excluding Performance
Incentive of ` 2,41,096/- Per Month which is subject to Performance and Target Achievement
Nature of Employment Regular EmploymentQualification B.E. (Mechanical) and MBAExperience (in Years) 27 YearsDate of Commencement of Employment 15.11.2011Particulars of Previous Employment General Manager-Projects, Euro Chemicals% of Equity Shares Held 0.04%Relation with Director or Manager None
Name Mr. Naveen Prakash SharmaAge 51 YearsDesignation Executive Director- (Non- Board Member)Remuneration ` 6,89,020/- Per Month including ESOPs’ and excluding Performance
Incentive of ` 2,88,750/- Per Month which is subject to Performance and Target Achievement
Nature of Employment Regular EmploymentQualification B.E. (Metallurgy) and MBAExperience (in Years) 28 YearsDate of Commencement of Employment 01.11.2006

50
Corporate Overview Statutory Reports Financial Statements
Name Mr. Naveen Prakash SharmaParticulars of Previous Employment Assistant General Manager- Sales in Finolex Cables Limited% of Equity Shares Held 0.09%Relation with Director or Manager None
Name Mr. Vijay Kumar PareekhAge 51 YearsDesignation Executive Director- (Non- Board Member)Remuneration ` 6,47,432/- Per Month including ESOPs’ and excluding Performance
Incentive of ` 3,47,500/- Per Month which is subject to Performance and Target Achievement
Nature of Employment Regular EmploymentQualification B.E. (Metallurgy) and MBAExperience (in Years) 28 YearsDate of Commencement of Employment 29.09.2012Particulars of Previous Employment Assistant Vice President –Marketing, Aditya Birla Insulators % of Equity Shares Held 0.08%Relation with Director or Manager None

51
Annual Report2019-2020
Annexure-6
DISCLOSURES OF REMUNERATION TO DIRECTORS & KMP [PURSUANT TO SECTION 197(12) OF THE ACT READ WITH RULE 5 (1) OF THE COMPANIES (APPOINTMENT AND REMUNERATION OF MANAGERIAL PERSONNEL) RULES, 2014]
1. The Ratio of the remuneration of each Director to the median remuneration of employees of the Company for the financial year ended 31st March 2020 are: -
S. No.
Name of Director/CFO/CEO/Company Secretary
Designation Ratio of remuneration to median remuneration of the
Employee of the Company
Percentage increase in the remuneration for the
Financial Year 2019-201 Dr. Mahavir Prasad Agarwal
(DIN:00188179)Chairman & Whole-time
Director 71:1 Nil
2 Mr. Rajat Agrawal (DIN: 00855284)
Managing Director 71:1 Nil
3 Mr. Yogesh Malhotra (DIN:05332393)
Whole-time Director & Chief Executive Officer
52:1 0.50%
4 Mr. Nitin Gupta Company Secretary N.A. 5.00%
5 Mr. Sunil Kansal Chief Financial Officer N.A. 5.00%
* Median remuneration of the Employees of the Company assumed to be ` 1.68 Lacs.
** The above increase in remuneration is calculated excluding PAT/Performance incentive during the year.
i. There is no Percentage increase in the median remuneration of employees in the financial year 2019-20 as Median remuneration of the Employees of the Company has decreased from ` 1.81 Lacs to ` 1.68 Lacs.
ii. Number of Permanent Employees on the payroll as on 31st March 2020 of the Company are 1107 (One Thousand One Hundred and Seven only).
iii. Average Percentile increase in the Salaries of the Employees other than Managerial Personnel is 8.04% and increase in salary of Managerial Personnel during last financial year is disclosed in point no.(i).
It is hereby affirmed that the remuneration paid during the year is as per the Remuneration Policy of the Company.

52
Corporate Overview Statutory Reports Financial Statements
Ann
exur
e-7
Form
AO
C-I
(Pur
suan
t to
first
pro
visi
o to
sub
-sec
tion
(3) o
f sec
tion
129
read
with
rule
5 o
f Com
pani
es (A
ccou
nts)
Rul
e, 2
014)
Stat
emen
t con
tain
ing
salie
nt fe
atur
es o
f the
fina
ncia
l sta
tem
ents
of S
ubsi
diar
ies/
Ass
ocia
tes
Com
pani
es/ J
oint
Ven
ture
sPa
rt -
A :
Subs
idia
ries
S.
No.
Nam
e of
subs
idia
ry(i)
Dat
e of
acq
uisit
ion
of
cont
rol
Repo
rtin
g pe
riod
of th
e su
bsid
iary
co
ncer
ned,
if
diffe
rent
fro
m th
e ho
ldin
g co
mpa
ny’s
repo
rtin
g pe
riod
Repo
rtin
g Cu
rren
cyEx
rate
as
at 3
1st
Mar
ch
2020
Shar
e Ca
pita
l (ii
)
Rese
rves
an
d su
rplu
s(iii)
Tota
l As
sets
(iv)
Tota
l Li
ablit
ies
Inve
st-
men
ts
(v),
(vi)
Turn
over
(v
),(vi
i)Pr
ofit/
(L
oss)
be
fore
ta
xatio
n (v
)
Tax
expe
nse/
(cre
dit)
(v)
Profi
t/
(Los
s)
afte
r ta
xatio
n(e
xclu
ding
O
CI) (v
)
Exte
nt
of
shar
e -ho
ldin
g (in
%)
1N
avam
Lan
ka L
imite
d24
th F
ebru
ary
2000
(D
ate
of In
corp
orat
ion)
09th
May
, 201
2 (D
ate
of
acqu
isiti
on o
f con
trol
)
NA
LKR
0.40
40
9.63
67
3.64
1
,905
.48
822.
21
- 5,
562.
90
815.
00
108
.77
706.
23
52%
2G
ravi
ta G
loba
l Pte
Lim
ited
24th
Feb
ruar
y, 2
012
NA
USD
75.3
9 72
8.60
24
5.36
98
1.74
7.
78
791.
29
46.2
2 (1
4.28
)-
(14.
28)
100%
3Re
cycl
ers
Gha
na L
imite
d28
th Ju
ly, 2
016
NA
GH
C 1
3.85
4
88.9
1 (3
20.0
9)4,
789.
72
4,62
0.90
-
6,73
4.13
(2
15.8
1)-
(215
.81)
100%
4G
ravi
ta S
eneg
al S
AU26
th Ju
ne, 2
007
NA
CFA
0.1
3 22
3.93
1,
553.
48
2,1
55.9
7 3
78.5
6 -
5,38
2.76
87
1.62
1
25.7
6 74
5.86
10
0%5
Gra
vita
Moz
ambi
que
LDA
30th
July
, 200
7N
AM
ZN1.
13
260.
67
3,54
6.15
5,
444.
94
1,63
8.12
-
7,33
1.17
93
6.51
16
1.77
77
4.74
10
0%6
Gra
vita
Ven
ture
s Li
mite
d06
th N
ovem
ber,
2015
NA
USD
75.3
9 6.
27
(98.
19)
2.5
1 94
.43
- (1
.17)
(28.
02)
(2.4
1)(2
5.61
)10
0%7
Gra
vita
Mal
i SA
(viii
)23
rd Ja
nuar
y, 2
017
NA
CFA
0.1
3 1
3.07
(2
47.6
1)8.
09
242
.63
- -
(235
.12)
- (2
35.1
2)10
0%8
Gra
vita
Nic
arag
ua S
A14
th F
ebru
ary,
201
3N
AN
IO 2
.21
435.
72
(509
.39)
1,74
1.89
1,
815.
56
- 2,
800.
20
(268
.51)
- (2
68.5
1)10
0%9
Gra
vita
Tan
zani
a Li
mite
d22
nd N
ovem
ber,
2017
NA
TZS
0.03
18
3.19
72
2.78
3,
202.
07
2,29
6.10
-
5,67
1.26
7
74.2
6 -
774.
26
100%
10M
ozam
biqu
e Re
cycl
ers
LDA
28th
Aug
ust,
2017
NA
MZN
1.13
6.
50
(63.
84)
161.
66
219
.00
- 10
4.54
(3
7.75
)-
(37.
75)
100%
11G
ravi
ta U
SA In
c04
th N
ovem
ber,
2015
NA
USD
75.3
9 1
66.6
0 20
6.59
3,
529.
85
3,15
6.66
-
6,84
2.92
1
82.0
1 34
.37
147
.64
100%
12G
ravi
ta Ja
mai
ca L
imite
d04
th S
epte
mbe
r, 20
14N
AU
SD75
.39
186
.74
(485
.35)
965
.54
1,2
64.1
5 -
621.
03
(169
.88)
- (1
69.8
8)10
0%13
Recy
cler
s G
ravi
ta C
osta
Ric
a SA
16th
Sep
tem
ber,
2016
NA
CRC
0.1
3 13
1.59
(3
17.6
8)97
.16
283
.25
- 5
48.0
0 (7
3.12
)-
(73.
12)
100%
14G
ravi
ta N
ethe
rland
s BV
08th
May
, 201
2N
AU
SD75
.39
14.
63
4,21
7.50
7,
825.
72
3,59
3.59
3,
235.
63
759
.90
371.
32
- 3
71.3
2 10
0%15
Gra
vita
Dom
inic
an S
AS
23rd
Feb
ruar
y, 2
018
NA
DO
P 1
.40
30.0
5 (5
1.89
) 3
3.00
54
.84
- 8
1.00
(5
0.90
)-
(50.
90)
100%
16G
ravi
ta P
eru
SAC
(viii
)07
th N
ovem
ber,
2018
NA
SOL
21.
89
7.34
(0
.23)
24.
83
17.
72
- -
- -
- 10
0%17
M/s
Gra
vita
Met
al In
c.28
th Ju
ne, 2
005
(Dat
e of
In
corp
orat
ion)
08th
June
, 201
1 (D
ate
of
acqu
istio
n)
NA
INR
1.0
0 1
00.0
0 5
58.7
1 2,
408.
78
1,75
0.07
-
8,33
9.41
2
22.8
3 1
42.4
9 8
0.34
10
0%
18G
ravi
ta G
hana
Lim
ited
13th
Dec
embe
r, 20
06N
AG
HC
13.
85
123
.66
(44.
63)
114
.67
35.6
4 -
1,89
4.28
(1
33.5
8)-
(133
.58)
100%

53
Annual Report2019-2020
S.
No.
Nam
e of
subs
idia
ry(i)
Dat
e of
acq
uisit
ion
of
cont
rol
Repo
rtin
g pe
riod
of th
e su
bsid
iary
co
ncer
ned,
if
diffe
rent
fro
m th
e ho
ldin
g co
mpa
ny’s
repo
rtin
g pe
riod
Repo
rtin
g Cu
rren
cyEx
rate
as
at 3
1st
Mar
ch
2020
Shar
e Ca
pita
l (ii
)
Rese
rves
an
d su
rplu
s(iii)
Tota
l As
sets
(iv)
Tota
l Li
ablit
ies
Inve
st-
men
ts
(v),
(vi)
Turn
over
(v
),(vi
i)Pr
ofit/
(L
oss)
be
fore
ta
xatio
n (v
)
Tax
expe
nse/
(cre
dit)
(v)
Profi
t/
(Los
s)
afte
r ta
xatio
n(e
xclu
ding
O
CI) (v
)
Exte
nt
of
shar
e-ho
ldin
g (in
%)
19G
ravi
ta In
fote
ch L
imite
d28
th Ju
ne, 2
005
(Dat
e of
In
corp
orat
ion)
27th
Mar
ch, 2
009
(Dat
e of
acq
uist
ion)
NA
INR
1.0
0 20
.00
233.
72
267
.76
14.
04
7.5
7 1
2.08
(2
2.67
) (3
.80)
(18.
87)
100%
20M
/s G
ravi
ta In
fote
ch03
rd M
arch
, 201
1N
AIN
R 1
.00
2.00
5
.63
7.70
0.
07
- -
(1.0
8)0.
01
(1.0
9)10
0%21
Nob
le B
uild
esta
te P
rivat
e Li
mite
d (viii
)
14th
Dec
embe
r, 20
07
(Dat
e of
Inco
rpor
atio
n)03
rd Ju
ly, 2
012
(Dat
e of
ac
quis
tion)
NA
INR
1.0
0 2.
00
(158
.48)
219.
32
375
.80
- 1
2.55
(4
0.43
)-
(40.
43)
100%
22M
/s R
ecyc
ling
info
tech
LLP
02nd
Dec
embe
r, 20
15N
AIN
R 1
.00
2.00
(1
.72)
0.36
0.
08
- -
(0.0
9) 0
.02
(0.1
1)10
0%23
Met
Mau
ritan
ia R
ecyc
ling
SARL
(upt
o Ju
ly 3
, 201
9) (ix
)
09th
Janu
ary,
201
7N
AM
RO0.
20
- -
- -
- -
- -
- 0
24G
ravi
ta C
amer
oon
Lim
ited
(upt
o Fe
brua
ry 2
5, 2
020)
(ix)
12th
Janu
ary,
201
7N
AXO
F 0
.13
- -
- -
- 8
36.2
4 -
- -
0
25M
/s S
hasi
n In
dust
ries
(For
mer
ly k
now
n as
M/s
G
ravi
ta M
etal
s) (u
pto
Mar
ch
21, 2
020)
(ix)
06th
Aug
ust,
2004
(Dat
e of
Inco
rpor
atio
n)30
th M
arch
, 201
1 (D
ate
of a
cqui
stio
n)
NA
INR
1.0
0 -
(65.
47)
- -
- 34
.39
(65.
47)
- (6
5.47
)0
Not
es(i)
Pr
opos
ed d
ivid
end
from
any
of t
he s
ubsi
diar
ies
is N
il.(ii
) Co
nver
ted
at h
isto
rical
exc
hang
e ra
tes
(iii)
Rese
rve
and
surp
lus
incl
udes
oth
er c
ompr
ehen
sive
inco
me,
Sec
urity
pre
miu
m, G
ener
al re
serv
e, L
egal
rese
rve
and
Shar
e op
tions
out
stan
ding
acc
ount
(iv)
Incl
udin
g Fi
xed
asse
ts a
nd in
vest
men
ts a
t his
torc
al e
xcha
nge
rate
s(v
) Co
nver
ted
at a
vera
ge e
xcha
nge
rate
s(v
i) In
vest
men
ts in
clud
es in
vest
men
ts in
sub
sidi
arie
s(v
ii)
Turn
over
incl
udes
oth
er in
com
e an
d ot
her o
pera
ting
reve
nues
(inc
ludi
ng in
ter-
com
pany
tran
sact
ions
)(v
iii)
Subs
idia
ries
of th
e Co
mpa
ny a
re y
et to
com
men
ce th
eir o
pera
tions
(ix)
Subs
idia
ries
whi
ch h
ave
been
liqu
idat
ed o
r sol
d du
ring
the
year
.

54
Corporate Overview Statutory Reports Financial Statements
Part
- B
: Ass
ocia
tes
Stat
emen
t pur
suan
t to
sect
ion
129(
3)of
the
Com
pani
es A
ct, 2
013
rela
ted
to A
ssoc
iate
Com
pani
es a
nd Jo
int V
entu
res
S.
No.
Nam
e of
Ass
ocia
tes
Dat
e on
whi
ch
the
Asso
ciat
e or
Join
tVe
ntur
e w
as
asso
ciat
ed o
r ac
quire
d
Late
st B
alan
ce
shee
t dat
eSh
are
of a
ssoc
iate
s hel
d by
the
Com
pany
on
the
year
end
Des
crip
tion
of h
ow th
ere
is sig
nific
ant i
nflue
nce
Reas
on w
hy
the
asso
ciat
e is
not
cons
olid
ated
Net w
orth
at
trib
utab
le to
sh
areh
olde
rs
as p
er la
test
au
dite
d Ba
lanc
e sh
eet
Profi
t/ (l
oss)
for t
he y
ear
No
of
shar
es
held
Am
ount
of
Inve
stm
ent
%
Hol
ding
Cons
ider
ed in
co
nsol
idat
ion
Not
con
side
red
in c
onso
lidat
ion
1Pe
arl L
andc
on P
rivat
e Li
mite
d21
st O
ctob
er,
2003
Mar
ch 3
1,
2020
5,00
0 0.
50
25%
Equi
ty h
oldi
ng m
ore
than
20
%, b
ut le
ss th
an 5
0% N
ot
appl
icab
le
5.23
(0
.96)
(4.3
2)
Fo
r and
on
beha
lf of
the
Boar
d of
Dire
ctor
s
Ra
jat A
graw
al
Yoge
sh M
alho
tra
Dr.
M. P
. Aga
rwal
M
anag
ing
Dire
ctor
W
hole
Tim
e D
irect
or &
CEO
C
hairm
an
DIN
: 008
5528
4 D
IN: 0
5332
393
DIN
: 001
8817
9
Suni
l Kan
sal
Niti
n G
upta
Chi
ef F
inan
cial
Offi
cer
Com
pany
Sec
reta
ry
Mem
bers
hip
No:
FC
S 99
84D
ate:
June
25,
202
0Pl
ace
: Jai
pur

55
Annual Report2019-2020
ANNEXURE - 8
BUSINESS RESPONSIBILITY REPORTSECTION A: GENERAL INFORMATION ABOUT THE COMPANY
1 Corporate Identity Number (CIN) of the Company L29308RJ1992PLC006870
2 Name of the Company Gravita India Limited3 Registered address “Saurabh”, Chittora Road, Harsulia Mod, Diggi- Malpura Road,
Tehsil - Phagi Jaipur-3039044 Website www.gravitaindia.com5 E-mail id [email protected] Financial Year reported 1st April, 2019 to 31st March, 20207 Sector(s) that the Company is engaged in (industrial activity
code-wise)Group Class Sub-
ClassDescription
242 2420 24203 Manufacturing of lead, zinc and tin products and alloys
242 2420 24202 Manufacture of Aluminium from alumina and by other methods and productsof Aluminium and alloys
222 2220 22209 Manufacture of other plastics products n.e.c.
8 List three key products/services that the Company manufactures/provides (as in balance sheet)
Lead, Aluminium & Plastic Products
9 Total number of locations where business activity is undertaken by the Company(a) Number of International Locations 11(b) Number of National Locations Plant Locations:
(i) ‘Saurabh’, Chittora Road, Harsulia Mod, Diggi- Malpura Road, Tehsil-Phagi Jaipur-303904.
(ii) Plot No. 322, Mithirohar Industrial Estate, Mithirohar, Taluka Gandhidham, Gujarat.
(iii) Plot No. PA-011-006, Mahindra SEZ, Village Kalwara, Tehsil Sanganer, Distt. Jaipur.
(iv) Survey No. 233/15 to 233/30, Thiruthani Road, Ananthapuram- Panchayat Narasingarayani Pettah Post, Chittoor.
(v) 25, SICOP Industrial Estate, Kathua-184101, J&K.10 Markets served by the Company Local State National International
ü ü ü ü
SECTION B: FINANCIAL DETAILS OF THE COMPANY
1 Paid up Capital (INR) 13.81 Crore2 Total Turnover (INR) 1,172.39 Crore3 Total profit after taxes (INR) 21.88 Crore4 Total Spending on Corporate Social Responsibility (CSR) as
percentage of profit after tax (%)4.98% of average net profit of last three financial years computed as per Section-198 of Companies Act, 2013 (CSR Spent is ` 109.57 Lacs)
5 List of activities in which expenditure in 4 above has been incurred
Please refer Annexure- 2 of the Board Report.

56
Corporate Overview Statutory Reports Financial Statements
SECTION C: OTHER DETAILS
1 Does the Company have any Subsidiary Company/ Companies? Yes2 Do the Subsidiary Company/Companies participate in the BR Initiatives of the parent
company? If yes, then indicate the number of such subsidiary company(s)No
3 Do any other entity/entities (e.g. suppliers, distributors etc.) that the Company does business with, participate in the BR initiatives of the Company? If yes, then indicate the percentage of such entity/entities? [Less than 30%, 30-60%, More than 60%]
No
SECTION D: BR INFORMATION
1. Details of Director/Directors responsible for BR
(a) Details of the Directors/Director responsible for implementation of the BR policy/policies
DIN Number 00855284Name Rajat AgrawalDesignation Managing Director
(b) Details of the BR head
DIN Number (if applicable) 05332393Name Yogesh MalhotraDesignation WTD & CEOTelephone number +91-141-4057700E-mail id [email protected]
2. Principle-wise (as per NVGs) BR Policy/policies
a. Details of compliance (Reply in Y/N)
The National Voluntary Guidelines (NVGs) on Social, Environmental and Economic Responsibilities of Business released by the Ministry of Corporate Affairs have identified nine areas of Business Responsibility which have been coined in the form of nine business principles. These principles are as under –
P1 Business should conduct and govern themselves with Ethics, Transparency and AccountabilityP2 Businesses should provide goods and services that are safe and contribute to sustainability throughout their
life cycleP3 Businesses should promote the well-being of all employeesP4 Businesses should respect the interests of, and be responsive towards all stakeholders, especially those who
are disadvantaged, vulnerable and marginalizedP5 Businesses should respect and promote human rightsP6 Businesses should respect, protect, and make efforts to restore the environmentP7 Businesses when engaged in influencing public and regulatory policy, should do so in a responsible mannerP8 Businesses should support inclusive growth and equitable developmentP9 Businesses should engage with and provide value to their customers and consumers in a responsible manner
S. No.
Questions P1 P2 P3 P4 P5 P6 P7 P8 P9
1 Do we have a policy / policy for the BR principles?
Y Y Y Y Y Y Y Y Y
2 Has the policy being formulated in consultation with the relevant stakeholders?
Y Y Y Y Y Y Y Y Y
3 Does the policy conform to any national / international standards? If yes, specify? (50 words)
Company has adopted various standards specified by the International Organization for Standardization (ISO). These are-
a) ISO 9001: Quality management systems.
b) ISO 14001: Environment.

57
Annual Report2019-2020
S. No.
Questions P1 P2 P3 P4 P5 P6 P7 P8 P9
Apart from these, other standards which the Company is following with are:a) OHSAS 18001: Health and Safety Management.b) National Voluntary Guidelines (NVG) given by Ministry of Corporate
Affairs for Social, Environment and Economic responsibility of business.
The policies related to all principles are formulated with detailed consultation with relevant stakeholders as per industry framework and market standards, as per management guidelines within the applicable legal and regulatory framework requirements, at national and international level.
4 Has the policy being approved by the Board? Is yes, has it been signed by MD/ owner/ CEO/ appropriate Board Director?
Y Y Y Y Y Y Y Y Y
5 Does the company have a specified committee of the Board/ Director/ Official to oversee the implementation of the policy?
The relevant policies are administered by the Departmental Heads who report to the Management of the Company who is responsible for monitoring and overseeing all policy implementation.
6 Indicate the link for the policy to be viewed online?
https://gravitaindia.com/wp-content/uploads/pdf/BRpolicy.pdf
7 Has the policy been formally communicated to all relevant internal and external stakeholders?
Communication is an on-going process. For this purpose, the policies have been posted on the Company’s website for information of all stakeholders. Rest of the policies are internal documents of the Company and/or available on intranet for all employees of the Company.
8 Does the company have in-house structure to implement the policy/ policies?
Y Y Y Y Y Y Y Y Y
9 Does the Company have a grievance redressal mechanism related to the policy/ policies to address stakeholders’ grievances related to the policy/ policies?
Y Y Y Y Y Y Y Y Y
10 Has the company carried out independent audit/ evaluation of the working of this policy by an internal or external agency?
Y Y Y Y Y Y Y Y Y
b. If answer to the question at serial number 1 against any principle, is ‘No’, please explain why: (Tick up to 2 options)
S. No.
Questions P1 P2 P3 P4 P5 P6 P7 P8 P9
1 The company has not understood the Principles - - - - - - - - -2 The company is not at a stage where it finds itself in a
position to formulate and implement the policies on specified principles
- - - - - - - - -
3 The company does not have financial or manpower resources available for the task
- - - - - - - - -
4 It is planned to be done within next 6 months - - - - - - - - -5 It is planned to be done within the next 1 year - - - - - - - - -6 Any other reason (please specify) - - - - - - - - -

58
Corporate Overview Statutory Reports Financial Statements
4. Governance related to BR
(a) Indicate the frequency with which the Board of Directors, Committee of the Board or CEO to assess the BR performance of the Company. Within 3 months, 3-6 months, Annually, More than 1 year
The BR performance of the Company is regularly assessed by the Executive Committee comprising of senior management personnel. However, there is no specific frequency.
(b) Does the Company publish a BR or a Sustainability Report? What is the hyperlink for viewing this report? How frequently it is published?
Yes. The Company publishes BR report annually and the same forms part of annual report, which can be accessed in the Company’s website i.e. https://gravitaindia.com/wp-content/uploads/pdf/BRpolicy.pdf
SECTION E: PRINCIPLE-WISE PERFORMANCE
Principle 1
1. Does the policy relating to ethics, bribery and corruption cover only the Company? Yes/ No. Does it extend to the Group/Joint Ventures/ Suppliers/Contractors/NGOs /Others?
The policy relating to ethics, bribery and corruption extends beyond our Company employees, both permanent and temporary, Directors and also covers the Gravita group of Companies.
The Company has adopted a Code of conduct applicable to the Board of Directors and senior management personnel of the Company. The members of the Board of Directors and the members of the Senior Management of the Company are required to affirm on an annual compliance of this code. This Code requires the Directors and senior management personnel of the Company to act honestly, ethically and with integrity. The Code guides the Directors and senior management personnel to conduct themselves in professional, courteous and respectful manner and also to ensure their independent judgement is not impacted.
2. How many stakeholder complaints have been received in the past financial year and what percentage was satisfactorily resolved by the management? If so, provide details thereof, in about 50 words or so.
The Company has not received any significant complaints from stakeholders in the previous financial year. During F.Y. 2019-20 company has received 21 complaints and all the complaints have been resolved and nothing is pending as on 31st March, 2020.
Principle 2
1. List up to 3 of your products or services whose design has incorporated social or environmental concerns, risks and/or opportunities.
The Company is engaged in manufacturing and trading of:
• Re-meltedLead,LeadAlloys;
• AluminiumAlloys,
• RecyclingofPlasticScrap
catering to requirements of Automotive and Industrial applications.
The Company is committed to attainment of environmental and economic benefits from efficient use of energy, water and raw materials. The Company ensures compliance requirements of the law that relate to products and services, environmental aspects and occupational hazards.
The company designs, develops and supplies products for:
a. Assure safety & optimal use of resources over the product lifecycle and ensure that everyone connected with it are aware of their responsibilities;
b. Ensure that all services are procured/delivered embedding the principles of labour practices, human rights, ethics, occupational health, safety and environment;
c. The Company shall endeavor to regularly review and improve upon the technological advancement & commercialization thereof, incorporating social, ethical and environmental considerations;
d. The Company will continuously encourage its business partners and third parties with whom it conducts business to abide by this policy.

59
Annual Report2019-2020
2 For each such product, provide the following details in respect of resource use (energy, water, raw material etc.) per unit of product (optional):
a. Reduction during sourcing/production/ distribution achieved since the previous year throughout the value chain?
Being a manufacturing company there is intensive need for resources – water, energy and raw materials, in our operations. We therefore recognise the impact of our operations on the environment and adopt strategies to minimise our resource use in all our processes. To further channelise our endeavours, we consciously track usage of these resources – water, energy and raw materials, throughout our operations.
b. Reduction during usage by consumers (energy, water) has been achieved since the previous year?
The company has made two major design improvements for conservation of energy.
1. Variable Frequency Drives (VFDs) are being used for all large process fan motors.
2. Optimization of motor and gearbox in Aluminium Ingot Casting Machine thereby reducing the power consumption of driving motor.
These changes will help the company in saving electricity consumption.
The Company is making efforts to utilize alternate sources and has plans to install solar panels at the roof of workshop shed for its plants situated at Chittoor, Phagi & SEZ Jaipur thereby minimizing the consumption of electricity from commercial electricity boards.
3 Does the company have procedures in place for sustainable sourcing (including transportation)?
a. If yes, what percentage of your inputs was sourced sustainably? Also, provide details thereof, in about 50 words or so.
The Company endeavors to focus on protection of environment, stakeholders’ interest and cost effectiveness while procuring any raw material or goods. The main raw materials – Battery, Aluminum and plastic scrap is collected from traders who are well reputed global players. Adequate steps are taken for safety during transportation and optimization of logistics, which, in turn, help to mitigate the impact on climate.
4 Has the company taken any steps to procure goods and services from local & small producers, including communities surrounding their place of work?
a. If yes, what steps have been taken to improve their capacity and capability of local and small vendors?
The Company encourages procurement of raw materials and avail services from the local vendors who are in close proximity to the Company’s plants and region, which helps us in time saving and reduction in logistic costs. The Company is in continuous communication with the local and small vendors to improve their capacity to meet the procurement requirements of the Company.
5 Does the company have a mechanism to recycle products and waste? If yes what is the percentage of recycling of products and waste (separately as <5%, 5-10%, >10%). Also, provide details thereof, in about 50 words or so.
The Company endeavors to manage the environmental impacts of organizational activities, products and services. The Company uses scrap of Lead, Aluminum and Plastic in manufacturing of finished goods and has in place a structure to collect the scrap and recycle the same. The Company has systems in place to mitigate the exposure risk of hazardous materials during manufacturing, application and disposal at all our plants.
Principle 3
1. Please indicate the Total number of employees
The Company has 1107 employees as on 31st March, 2020 including employees hired on temporary basis.
2. Please indicate the Total number of employees hired on temporary/ contractual/ casual basis.
The Company do not hire employees on contractual or casual basis.
3. Please indicate the Number of permanent women employees
The Company has 52 permanent women employees as on 31st March, 2020.
4. Please indicate the Number of permanent employees with disabilities
The Company has no permanent employees with disabilities.

60
Corporate Overview Statutory Reports Financial Statements
5. Do you have an employee association that is recognized by management?
No
6. What percentage of your permanent employees is members of this recognized employee association?
NA (check)
7. Please indicate the Number of complaints relating to child labour, forced labour, involuntary labour, sexual harassment in the last financial year and pending, as on the end of the financial year.
S. No.
Category No of complaints filed during the financial year
No of complaints pending as on end of the financial year
1 Child labour/forced labour/ involuntary labour
Nil Nil
2 Sexual harassment Nil Nil3 Discriminatory employment Nil Nil
8. What percentage of your under mentioned employees were given safety and skill up-gradation training in the last year?
a. Permanent Employees 100% of our employees have been given safety training and 100% of our employees are given skill development training in their respective fields.
b. Permanent Women Employeesc. Casual/Temporary/Contractual Employeesd. Employees with Disabilities
Principle 4
1. Has the company mapped its internal and external stakeholders? Yes/No
Yes
2. Out of the above, has the company identified the disadvantaged, vulnerable & marginalized stakeholders
Yes
3. Are there any special initiatives taken by the company to engage with the disadvantaged, vulnerable and marginalized stakeholders? If so, provide details thereof, in about 50 words or so.
We have provided residential facilities to our employees working at manufacturing facility. We have ensured good education to the children of our marginalized employees by providing ward fees to them and we have provided medical facilities to our marginalized employees and their children. We have also provided free canteen facility to all our employees.
The Company builds a lasting relationship with all the stakeholders, internal and external, through meaningful discussions. This process helps us review the actions, rethink the roadmaps, redress grievances and recognize new venues of growth for all the stakeholders.
The details of engagements platforms for each stakeholder are as follows:
Key Stakeholders Engagement PlatformsEmployees Intranet, Communication Meeting, Training Programs, Annual health check-ups,
canteen services, residential colony for labours at manufacturing facilities, ward fees to marginalized employees
Investors and Shareholders Quarterly Results, Annual Reports, Earnings call, Analyst Meet, Press ReleasesSociety Various initiatives are taken by the Company for welfare of society through its CSR
programmesCustomers & Partners Customers: Regular business meetings, Customer satisfaction survey
Principle 5
1. Does the policy of the company on human rights cover only the company or extend to the Group/Joint Ventures/Suppliers/ Contractors/NGOs/Others?
The Company remains committed to respect and protect human rights. The Company’s Code of Conduct & Ethics and the HR policies and processes adequately addresses these aspects. The Company does not hire child /forced or involuntary labour. All the employees are treated in a just, fair and equal manner. This practice extends across the Gravita Group of Companies.

61
Annual Report2019-2020
2. How many stakeholder complaints have been received in the past financial year and what percent was satisfactorily resolved by the management?
The Company has not received any significant complaints from stakeholders in the previous financial year. During F.Y. 2019-20 company has received 21 complaints and all the complaints have been resolved and nothing is pending as on 31st March, 2020.
Principle 6
1. Does the policy relate to Principle 6 cover only the company or extends to the Group/JointVentures/Suppliers/Contractors/ NGOs/others?
The Company has well-defined policies/principles in place relating to Health, Safety and Environment. These policies foster utmost employee safety and wellbeing which not only takes care of the wellness of employees but also the environment. The policy and principles are communicated to the relevant external stakeholders. At present, these policies are applicable to the company only.
2. Does the company have strategies/ initiatives to address global environmental issues such as climate change, global warming, etc? Y/N. If yes, please give hyperlink for webpage etc.
The Company’s policy requires conduct of operations in such a manner, so as to ensure safety of all concerned, compliances of environmental regulations and preservation of natural resources. In line with the Company’s commitment towards conservation of energy, all its manufacturing units continue with their efforts aimed at improving energy efficiency through innovative measures to reduce wastage and optimize consumption.
3. Does the company identify and assess potential environmental risks? Y/N
Yes
4. Does the company have any project related to Clean Development Mechanism? If so, provide details thereof, in about 50 words or so. Also, if Yes, whether any environmental compliance report is filed?
None of our activities damage the environment, most of our activities are environment friendly and an effective pollution control measures have been taken at all our manufacturing facilities.
5. Has the company undertaken any other initiatives on – clean technology, energy efficiency, renewable energy, etc. Y/N. If yes, please give hyperlink for web page etc.
No. Our activities use minimum energy and they are environment friendly.
6. Are the Emissions/Waste generated by the company within the permissible limits given by CPCB/SPCB for the financial year being reported?
The emissions/waste generated by the Company are within the permissible limits given by CPCB/SPCB.
7. Number of show cause/ legal notices received from CPCB/SPCB which are pending (i.e. not resolved to satisfaction) as on end of Financial Year.
There are no legal notices from CPCB/SPCB are pending as on end of financial year.
Principle 7
1. Is your company a member of any trade and chamber or association? If Yes, Name only those major ones that your business deals with:
a. Confederation of Indian Industry (CII)
b. Federation of Indian Export Organisation (FIEO)
c. Rajasthan Chamber of Commerce Industries (RCCI)
d. Material Recycling Association of India (MRAI)
2. Have you advocated/lobbied through above associations for the advancement or improvement of public good? Yes/No; if yes specify the broad areas (drop box: Governance and Administration, Economic Reforms, Inclusive Development Policies, Energy security, Water, Food Security, Sustainable Business Principles, Others)
The Company is represented on the governing bodies and several committees – both at the state and national levels of CII and through these forums the Company actively participates in various issues concerning business and society.

62
Corporate Overview Statutory Reports Financial Statements
Principle 8
1. Does the company have specified programmes/initiatives/projects in pursuit of the policy related to Principle 8? If yes details thereof.
At Gravita CSR activities are as important and critical as business processes. Gravita Group, through its CSR initiatives, has been involved in making holistic and meaningful contribution to the society. Along with business values, it is the company’s vision of maintaining environmental integrity which has enabled us to extend these CSR initiatives beyond our core business objectives & practices. Our CSR policy encompasses initiatives to conserve, sustain and renew our environment to encourage a self-sustainable system. An amount of ` 109.57 Lacs was spent towards various CSR projects and initiatives taken by the Company during the financial year 2019-20 and people from all over the country have benefitted from these CSR activities of the Company. The details of the CSR projects undertaken by the Company during the year under review are set out in Annexure - 2 to the Board’s Report
2. Are the programmes/projects undertaken through in-house team/own foundation/external NGO/government structures/any other organization?
Some of the programmes have been undertaken by the in-house team whereas some are being undertaken by external organizations.
3. Have you done any impact assessment of your initiative?
No
4. What is your company’s direct contribution to community development projects- Amount in INR and the details of the projects undertaken?
The Company has spent ` 109.57 Lacs on the CSR Activities during the financial year 2019-20 The amount was spent on areas as mentioned in Annexure -2 to the Board’s Report.
5. Have you taken steps to ensure that this community development initiative is successfully adopted by the community? Please explain in 50 words, or so
The main focus of the CSR policy of the Company is on health, education and environment. The various initiatives taken in these areas have a positive impact on the stakeholders surrounding the communities where such community development programs were undertaken by the Company.
Principle 9
1. What percentage of customer complaints/consumer cases are pending as on the end of financial year.
Nil
2. Does the company display product information on the product label, over and above what is mandated as per local laws? Yes/No/N.A. /Remarks (additional information)
N.A.
3. Is there any case filed by any stakeholder against the company regarding unfair trade practices, irresponsible advertising and/or anti-competitive behavior during the last five years and pending as on end of financial year? If so, provide details thereof, in about 50 words or so.
There were no cases against the Company in relation to unfair trade practices, irresponsible advertising and/or Anti-competitive behavior during the past five years and there are no pending cases as on 31st March, 2020.
4. Did your company carry out any consumer survey/ consumer satisfaction trends?
Consumer survey/Consumer satisfaction survey is being conducted periodically to assess the consumer satisfaction levels.
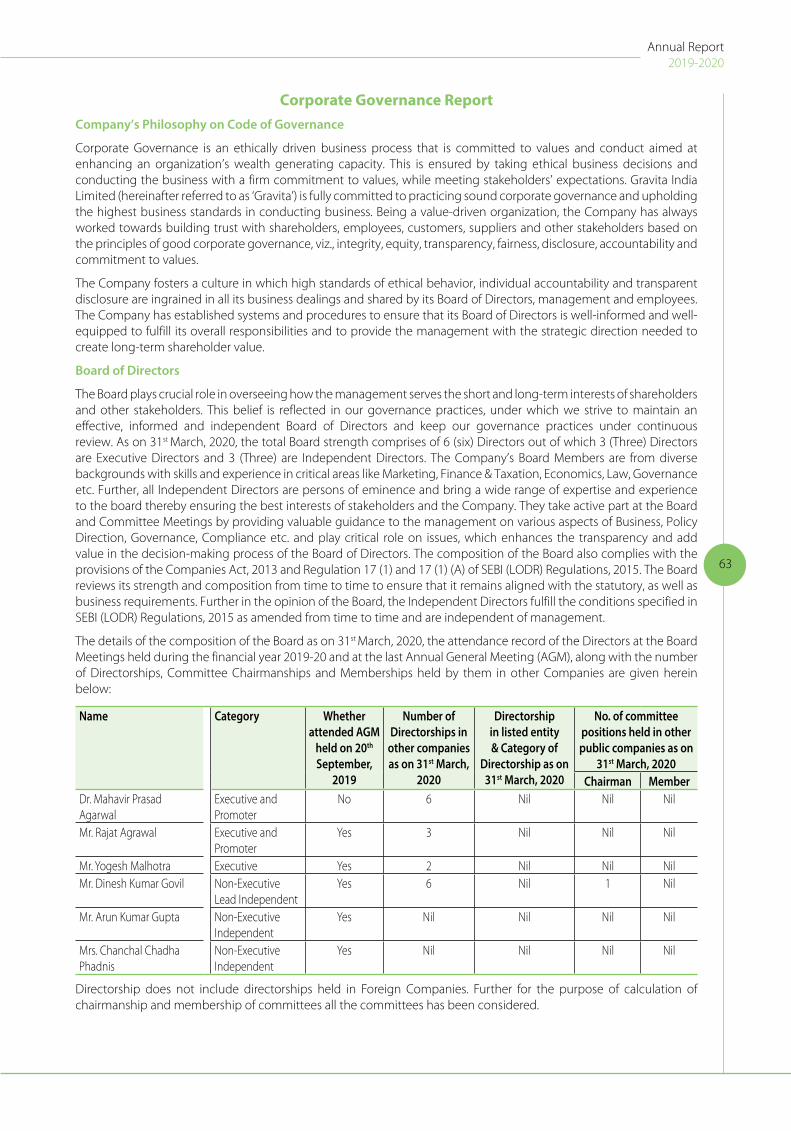
63
Annual Report2019-2020
Corporate Governance ReportCompany’s Philosophy on Code of Governance
Corporate Governance is an ethically driven business process that is committed to values and conduct aimed at enhancing an organization’s wealth generating capacity. This is ensured by taking ethical business decisions and conducting the business with a firm commitment to values, while meeting stakeholders’ expectations. Gravita India Limited (hereinafter referred to as ‘Gravita’) is fully committed to practicing sound corporate governance and upholding the highest business standards in conducting business. Being a value-driven organization, the Company has always worked towards building trust with shareholders, employees, customers, suppliers and other stakeholders based on the principles of good corporate governance, viz., integrity, equity, transparency, fairness, disclosure, accountability and commitment to values.
The Company fosters a culture in which high standards of ethical behavior, individual accountability and transparent disclosure are ingrained in all its business dealings and shared by its Board of Directors, management and employees. The Company has established systems and procedures to ensure that its Board of Directors is well-informed and well-equipped to fulfill its overall responsibilities and to provide the management with the strategic direction needed to create long-term shareholder value.
Board of Directors
The Board plays crucial role in overseeing how the management serves the short and long-term interests of shareholders and other stakeholders. This belief is reflected in our governance practices, under which we strive to maintain an effective, informed and independent Board of Directors and keep our governance practices under continuous review. As on 31st March, 2020, the total Board strength comprises of 6 (six) Directors out of which 3 (Three) Directors are Executive Directors and 3 (Three) are Independent Directors. The Company’s Board Members are from diverse backgrounds with skills and experience in critical areas like Marketing, Finance & Taxation, Economics, Law, Governance etc. Further, all Independent Directors are persons of eminence and bring a wide range of expertise and experience to the board thereby ensuring the best interests of stakeholders and the Company. They take active part at the Board and Committee Meetings by providing valuable guidance to the management on various aspects of Business, Policy Direction, Governance, Compliance etc. and play critical role on issues, which enhances the transparency and add value in the decision-making process of the Board of Directors. The composition of the Board also complies with the provisions of the Companies Act, 2013 and Regulation 17 (1) and 17 (1) (A) of SEBI (LODR) Regulations, 2015. The Board reviews its strength and composition from time to time to ensure that it remains aligned with the statutory, as well as business requirements. Further in the opinion of the Board, the Independent Directors fulfill the conditions specified in SEBI (LODR) Regulations, 2015 as amended from time to time and are independent of management.
The details of the composition of the Board as on 31st March, 2020, the attendance record of the Directors at the Board Meetings held during the financial year 2019-20 and at the last Annual General Meeting (AGM), along with the number of Directorships, Committee Chairmanships and Memberships held by them in other Companies are given herein below:
Name Category Whether attended AGM
held on 20th September,
2019
Number of Directorships in
other companies as on 31st March,
2020
Directorship in listed entity & Category of
Directorship as on 31st March, 2020
No. of committee positions held in other public companies as on
31st March, 2020Chairman Member
Dr. Mahavir Prasad Agarwal
Executive and Promoter
No 6 Nil Nil Nil
Mr. Rajat Agrawal Executive and Promoter
Yes 3 Nil Nil Nil
Mr. Yogesh Malhotra Executive Yes 2 Nil Nil NilMr. Dinesh Kumar Govil Non-Executive
Lead IndependentYes 6 Nil 1 Nil
Mr. Arun Kumar Gupta Non-Executive Independent
Yes Nil Nil Nil Nil
Mrs. Chanchal Chadha Phadnis
Non-Executive Independent
Yes Nil Nil Nil Nil
Directorship does not include directorships held in Foreign Companies. Further for the purpose of calculation of chairmanship and membership of committees all the committees has been considered.

64
Corporate Overview Statutory Reports Financial Statements
1. Dr. Mahavir Prasad Agarwal, Whole-time Director of the Company is father of Mr. Rajat Agrawal, Managing Director of the Company. Except this there are no inter-se relationships among the other Directors.
2. None of the Director is member in more than 10 committees or Chairman of more than five committees across all companies in which he is a Director. Further none of the Director acts as an Independent Director in more than 7 Listed Companies.
3. Non-executive Directors of the company do not hold any shares and convertible instruments of the company as on 31st March, 2020.
Skills/Expertise/Competence of the Board of Directors
List of core skills / expertise / competencies required by the Board (identified by the Board) for efficient functioning of the Company in the present business environment and those skills/expertise/competence actually available with the Board are as follows: -
S. No.
Skills / Expertise / Competencies identified by the board of directors as required in the context of the business and sector(s) to function effectively
Status of availability with the Board
1 Understanding of Business/Industry
Experience and knowledge of Manufacturing and Recycling associated businesses
P
2 Strategy and strategic planning
Ability to think strategically and identify and critically assess strategic opportunities and threats and develop effective strategies in the context of the strategic objectives of the Company’s policies and priorities.
P
3 Critical and innovative thoughts
The ability to critically analyse the information and develop innovative approaches and solutions to the problems.
P
4 Financial Understanding
Ability to analyse and understand the key financial statements, assess financial viability of the projects and efficient use of resources.
P
5 Market Understanding
Understanding of market scenario related to the business segment in which company is working.
P
6 Risk and compliance oversight
Ability to identify key risks to the organization in a wide range of areas including legal and regulatory compliance and monitor risk and compliance management frameworks.
P
Name of Director Areas of ExpertiseUnderstanding
of Business/Industry
Strategy and strategic planning
Critical and innovative thoughts
Financial Understanding
Market Understanding
Risk and compliance
oversightDr. Mahavir Prasad Agarwal ü ü ü ü ü üMr. Rajat Agrawal ü ü ü ü ü üMr. Yogesh Malhotra ü ü ü ü ü üMr. Dinesh Kumar Govil ü ü ü ü ü üMr. Arun Kumar Gupta ü ü ü ü ü üMrs. Chanchal Chadha Phadnis ü ü ü ü ü ü
Board Meetings
Dates for the Board Meetings are decided well in advance and communicated to the Directors. The Agenda along with the explanatory notes are sent in advance to the Directors. Additional meetings of the Board to address specific needs of the Company are held as and when deemed necessary by the Board.In case of any emergency, resolutions may be passed by circulation. The Board periodically reviews compliance reports of all laws applicable to the Company. Steps are taken by the Company to rectify instances of non-compliance, if any. 10 (Ten) Board Meeting(s) were held during the reporting period. The intervening period between two Board meetings is well within the maximum gap as prescribed under Regulation 17 (2) of SEBI (LODR) Regulations, 2015. Details of the same are reproduced herein below:
S. No
Date of Meeting Board Strength No. of Directors Present
1 27th April, 2019 6 52 28th May, 2019 6 53 07th August, 2019 6 54 14thAugust, 2019 6 55 26th September, 2019 6 46 12th November, 2019 6 6

65
Annual Report2019-2020
S. No
Date of Meeting Board Strength No. of Directors Present
7 01st January, 2020 6 68 05th February, 2020 6 59 24th February, 2020 6 5
10 21st March, 2020 6 5
Attendance of each Director at the Board Meetings:
Name of Director Board Meetings held during the year
Meetings Attended
Dr. Mahavir Prasad Agarwal 10 10Mr. Rajat Agrawal 10 9Mr. Yogesh Malhotra 10 7Mr. Dinesh Kumar Govil 10 9Mr. Arun Kumar Gupta 10 7Mrs. Chanchal Chadha Phadnis 10 9
Meeting of Independent Directors
In compliance of Section 149 of Companies Act, 2013 read-with the provisions of Schedule IV of the Companies Act, 2013 and the provisions of SEBI (LODR) Regulations, 2015 a separate meeting of Independent Directors was held on 01stJanuary, 2020. Further, it is confirmed that in the opinion of the board, the independent directors fulfill the conditions specified in these regulations and are independent of the management. Attendance of Independent Directors at the meeting is given hereunder:
Name of Director Whether present or notMr. Dinesh Kumar Govil YesMr. Arun Kumar Gupta YesMrs. Chanchal Chadha Phadnis Yes
Audit CommitteeThe Audit Committee of the Company comprises of three Non-Executive and Independent Directors and is constituted in accordance with the requirements of the SEBI (LODR) Regulations, 2015 read with Companies Act 2013. Mr. Dinesh Kumar Govil is the Chairman of the Audit Committee. All the members of the committee are financially literate and possess thorough knowledge of accounting or related financial management expertise.
The Statutory Auditors, Cost Auditors and Internal Auditors are invited to the Audit Committee Meetings to discuss with Directors the scope of audit, their comments, and to discuss the Internal Audit Reports. Minutes of the Audit Committee Meetings are circulated to all the Members of the Audit Committee and thereafter discussed and noted at the subsequent Board Meetings.
The Company Secretary of the Company acts as Secretary of the Audit Committee.
The Audit Committee met 5 (five) times during the financial year 2019-20 on:
28th May, 201907th August, 201914th August, 201912th November, 201905th February, 2020
The intervening period between two Audit Committee meetings is well within the maximum gap of one hundred and twenty days as prescribed under Regulation 18 (2) (a) of SEBI (LODR) Regulations, 2015.
Composition of Audit Committee and Attendance:
Name of the Members Designation Number of Meetings held during the year
No. of Meetings Attended
Mr. Dinesh Kumar Govil Chairman 5 5Mr. Arun Kumar Gupta Member 5 3Mrs. Chanchal Chadha Phadnis Member 5 5
The terms of reference of the Audit Committee are broadly as follows:
Oversight of the entity’s financial reporting process and the disclosure of its financial information to ensure that

66
Corporate Overview Statutory Reports Financial Statements
the financial statement is correct, sufficient and credible;
Recommending to the Board, the appointment, re-appointment and if required, the replacement or removal of auditors, remuneration and terms of appointment of auditors of the company;
Approval of payment to statutory auditors for any other services rendered by the statutory auditors;
Reviewing, with the management, the Annual Financial Statements and Auditor’s Report thereon before submission to the Board for approval, with particular reference to:
• MattersrequiredtobeincludedintheDirector’sResponsibilityStatementtobestatedintheBoard’sreportin terms of provisions of Companies Act;
• Changes,ifany,inaccountingpoliciesandpracticesandreasonsforthesame
• Majoraccountingentriesinvolvingestimatesbasedontheexerciseofjudgmentbymanagement
• Significantadjustmentsmadeinthefinancialstatementsarisingoutofauditfindings
• Compliancewithlistingandotherlegalrequirementsrelatingtofinancialstatements
• Disclosureofanyrelatedpartytransactions
• Modifiedopinion(s)/Qualificationsinthedraftauditreport
Reviewing, with the management, the quarterly financial statements before submission to the Board for approval;
Reviewing, with the management, the statement of uses / application of funds raised through an issue (public issue, rights issue, preferential issue, etc.), the statement of funds utilized for purposes other than those stated in the offer document / prospectus / notice and the report submitted by the monitoring agency monitoring the utilization of proceeds of a public or rights issue, and making appropriate recommendations to the board to take up steps in this matter;
Reviewing, with the management, performance of statutory and internal auditors and adequacy of the internal control systems;
Reviewing the adequacy of internal audit function, if any, including the structure of the internal audit department, staffing and seniority of the official heading the department, reporting structure coverage and frequency of internal audit;
Discussion with internal auditors of any significant findings and follow up there on;
Reviewing the findings of any internal investigations by the internal auditors into matters where there is suspected fraud or irregularity or a failure of internal control systems of a material nature and reporting the matter to the Board;
Discussion with statutory auditors before the audit commences, about the nature and scope of audit as well as post-audit discussion to ascertain any area of concern;
To look into the reasons for substantial defaults in the payment to the depositors, debenture holders, shareholders (in case of non-payment of declared dividends) and creditors;
Reviewing the functioning of Whistle Blower Mechanism;
Approval of appointment of chief financial officer after assessing the qualifications, experience and background, etc. of the candidate;
To lay down the criteria for granting the omnibus approval in line with the policy on related party transactions of the Company and such approval shall be applicable in respect of transactions which are repetitive in nature;
To review, at least on a quarterly basis, the details of related party transactions entered into by the listed entity pursuant to each of the omnibus approvals given;
To review the financial statements, in particular, the investments made by the unlisted subsidiary;
To take note of an annual statement of funds utilized for purposes other than those stated in the offer document/prospectus/notice, certified by the statutory auditors of the listed entity, and place it before the audit committee till such time the full money raised through the issue has been fully utilized;
To take note of indications made by Chief Executive Officer or Chief Financial Officer of the Company, if any;
To review the utilization of loans and/ or advances from/investment by the holding company in the subsidiary exceeding rupees 100 crore or 10% of the asset size of the subsidiary, whichever is lower including existing loans / advances / investments;
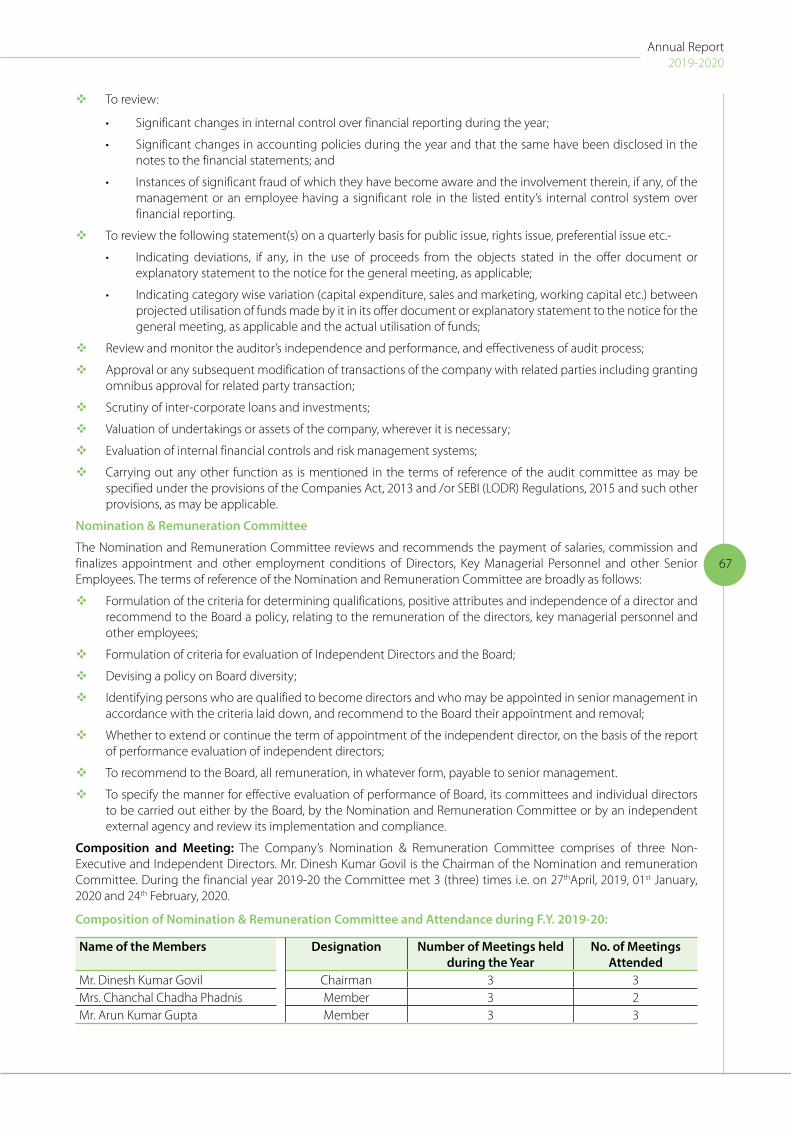
67
Annual Report2019-2020
To review:
• Significantchangesininternalcontroloverfinancialreportingduringtheyear;
• Significantchangesinaccountingpoliciesduringtheyearandthatthesamehavebeendisclosedinthenotes to the financial statements; and
• Instancesofsignificantfraudofwhichtheyhavebecomeawareandtheinvolvementtherein,ifany,ofthemanagement or an employee having a significant role in the listed entity’s internal control system over financial reporting.
To review the following statement(s) on a quarterly basis for public issue, rights issue, preferential issue etc.-
• Indicating deviations, if any, in the use of proceeds from the objects stated in the offer document orexplanatory statement to the notice for the general meeting, as applicable;
• Indicatingcategorywisevariation(capitalexpenditure,salesandmarketing,workingcapitaletc.)betweenprojected utilisation of funds made by it in its offer document or explanatory statement to the notice for the general meeting, as applicable and the actual utilisation of funds;
Review and monitor the auditor’s independence and performance, and effectiveness of audit process;
Approval or any subsequent modification of transactions of the company with related parties including granting omnibus approval for related party transaction;
Scrutiny of inter-corporate loans and investments;
Valuation of undertakings or assets of the company, wherever it is necessary;
Evaluation of internal financial controls and risk management systems;
Carrying out any other function as is mentioned in the terms of reference of the audit committee as may be specified under the provisions of the Companies Act, 2013 and /or SEBI (LODR) Regulations, 2015 and such other provisions, as may be applicable.
Nomination & Remuneration Committee
The Nomination and Remuneration Committee reviews and recommends the payment of salaries, commission and finalizes appointment and other employment conditions of Directors, Key Managerial Personnel and other Senior Employees. The terms of reference of the Nomination and Remuneration Committee are broadly as follows:
Formulation of the criteria for determining qualifications, positive attributes and independence of a director and recommend to the Board a policy, relating to the remuneration of the directors, key managerial personnel and other employees;
Formulation of criteria for evaluation of Independent Directors and the Board;
Devising a policy on Board diversity;
Identifying persons who are qualified to become directors and who may be appointed in senior management in accordance with the criteria laid down, and recommend to the Board their appointment and removal;
Whether to extend or continue the term of appointment of the independent director, on the basis of the report of performance evaluation of independent directors;
To recommend to the Board, all remuneration, in whatever form, payable to senior management.
To specify the manner for effective evaluation of performance of Board, its committees and individual directors to be carried out either by the Board, by the Nomination and Remuneration Committee or by an independent external agency and review its implementation and compliance.
Composition and Meeting: The Company’s Nomination & Remuneration Committee comprises of three Non-Executive and Independent Directors. Mr. Dinesh Kumar Govil is the Chairman of the Nomination and remuneration Committee. During the financial year 2019-20 the Committee met 3 (three) times i.e. on 27thApril, 2019, 01st January, 2020 and 24th February, 2020.
Composition of Nomination & Remuneration Committee and Attendance during F.Y. 2019-20:
Name of the Members Designation Number of Meetings held during the Year
No. of Meetings Attended
Mr. Dinesh Kumar Govil Chairman 3 3Mrs. Chanchal Chadha Phadnis Member 3 2Mr. Arun Kumar Gupta Member 3 3

68
Corporate Overview Statutory Reports Financial Statements
Details of Remuneration paid to Directors during F.Y. 2019-20
Name of the Director Designation Salary and other
allowances
Stock options
Performance Incentive/ Special
Ex- Gratia
Provident Fund and Gratuity
Total
Dr. Mahavir Prasad Agarwal Whole-time Director 1,20,00,000 Nil Nil 8,05,140 1,28,05,128Mr. Rajat Agrawal Managing Director 1,20,00,000 Nil Nil 7,99,812 1,27,99,776Mr. Yogesh Malhotra Whole-time Director & CEO 52,32,493 18,71,187* 44,67,840** 2,95,016 1,18,66,536
*Represent the value of options exercised and regarded as perquisite. However, it does not include the value of unvested options or options vested but not exercised. Mr. Yogesh Malhotra has been issued 32,500 ESOP’s on 01st April, 2015 at ` 2/- per share i.e. at face value. Further during F.Y. 2019-20 he has exercised 70% of ESOP’s allotted to him and as on 31st March, 2020 there is no outstanding ESOPS’ which are to be exercised in future.
** PAT Incentive/Performance Incentive/Special Ex- Gratia is subject to Performance and Target Achievement.
Notes:
a) The Company does not have any pecuniary relationship with any Non-Executive Independent Director except for reimbursement of traveling expenses to the Directors for attending Board Meeting. No sitting fee is paid for attending the meetings of Board/Committees of Directors.
b) None of the Non-Executive Directors of the company have any equity shares of the Company.
c) The company has issued memorandum of terms and conditions of appointment including remuneration to Managing Director and Whole-time Director of the Company.
d) The appointment of Mr. Rajat Agrawal and Dr. Mahavir Prasad Agarwal is for a period of 3 years from the date of their respective appointment and notice period is as per rules of the company. Further except Gratuity and Leave encashment no other severance fees is payable.
Criteria for evaluation of Director:
Following are the criteria for evaluation of performance of Directors:
1. How the person fares across different competencies as identified for effective functioning of the entity and the Board.
2. Whether the person has sufficient understanding and knowledge of the entity and the sector in which it operates.
3. Whether the person understands and fulfills the functions to him/her as assigned by the Board and the law.
4. Whether the person is able to function as an effective team- member.
5. Whether the person actively takes initiative with respect to various areas.
6. Whether the person is available for meetings of the Board and attends the meeting regularly and timely, without delay.
7. Whether the person is adequately committed to the Board and the entity.
8. Whether the person contributed effectively to the entity and in the Board meetings.
9. Whether the person demonstrates highest level of integrity (including conflict of interest disclosures, maintenance of confidentiality, etc).
10. Whether person is independent from the entity and the other directors and there is no conflict of interest.
11. Whether the person exercises his/ her own judgement and voices opinion freely.
Remuneration Policy
The remuneration paid to Executive Directors is recommended by Nomination & Remuneration Committee and approved by Board in Board Meeting, subject to the subsequent approval of the shareholders at the General Meeting and such other authorities, as may be required. The remuneration is decided after considering various factors such as qualification, experience, performance, responsibilities shouldered, industry standards as well as financial position of the Company and it can be accessed through web link: http://www.gravitaindia.com/wp-content/uploads/pdf/nomination-remuneration-policy.pdf

69
Annual Report2019-2020
Appointment Criteria and qualifications:
The Committee shall identify and ascertain the integrity, qualification, expertise and experience of the person for appointment as Director, KMP or at Senior Management level and recommend to the Board his / her appointment.
A person should possess adequate qualification, expertise and experience for the position he / she is considered for appointment. The Directors including Independent Directors and KMPs should meet the requirements/criteria, if any, as prescribed/may be prescribed under the provisions of the Companies Act, 2013, from time to time. The Committee has discretion to decide whether qualification, expertise and experience possessed by a person are sufficient / satisfactory for the concerned position.
The Company shall not appoint or continue the employment of any person as Managing Director/Whole-time Director/Manager who has attained the age of seventy years. Provided that the term of the person holding this position may be extended beyond the age of seventy years with the approval of shareholders by passing a special resolution based on the explanatory statement annexed to the notice for such motion indicating the justification for extension of appointment beyond seventy years.
Appointment of Independent Directors is subject to compliance of provisions of Section 149 of the Act, read with Schedule IV and Rules thereunder and SEBI (LODR) Regulations, 2015 as amended from time to time.
Remuneration to the Whole-time Director/Managing Director:
The Remuneration/ Commission/Performance Incentive etc. to be paid to Managing Director/ Whole-time Directors, etc. shall be governed as per provisions of the Companies Act, 2013 and rules made there under or any other enactment for the time being in force and the approvals obtained from the Members of the Company.
The Nomination and Remuneration Committee shall make such recommendations to the Board of Directors, as it may consider appropriate with regard to remuneration to Managing Director / Whole-time Directors in accordance with the provision of the Companies Act, 2013 and Listing Regulations.
Remuneration to Non- Executive/ Independent Director:
Sitting Fees:
The Non-executive/ Independent Directors of the Company may be paid sitting fees, if any, as per the applicable Regulations and provisions of the Companies Act, 2013 or any other enactment for the time being in force. Further no sitting fee shall be paid to Executive Directors. The quantum of sitting fees will be determined as per the recommendation of Nomination and Remuneration Committee and approved by the Board of Directors of the Company Provided that the amount of such fees shall not exceed the amount as prescribed in Companies Act, 2013.
Profit Linked Commission:
The profit –linked commission shall be paid as per applicable provisions of the Companies Act and Listing Regulations.
Stock Options:
Pursuant to the provisions of the Act, an Independent Director shall not be entitled to any stock option of the Company.
Remuneration to Senior Management Personnel, Key Managerial Personnel and Other Employees:
The Senior Management Personnel and other employees of the Company shall be paid monthly remuneration as per the Company’s HR policies and/ or as may be approved by the Committee. The Remuneration may consist of Fixed and Flexible Pay, Performance Based Incentive, Stock Options or in any other form as per HR Policies of the company.
Minimum Remuneration:
If, in any financial year, the Company has no profits, or its profits are inadequate, the Company shall pay remuneration to its Managerial Personnel in accordance with the provisions of Schedule V of the Act, and if it is not able to comply with such provisions, with the prior approval of the Central Government.
Provisions for excess remuneration:
If any Managerial Personnel draws or receives, directly or indirectly by way of remuneration any such sums in excess of the limits prescribed under the Act, or without the prior sanction of the Central Government, where required, he / she shall refund such sums to the Company and until such sum is refunded, hold it in trust for the

70
Corporate Overview Statutory Reports Financial Statements
Company. The Company shall not waive recovery of such sum refundable to it unless permitted by the Central Government.
Stakeholders Relationship Committee
The Stakeholders Relationship Committee is entrusted with the responsibility of addressing the shareholders’/ investors’ complaints with respect to transfer of shares, non-receipt of Annual Report, non-receipt of dividend etc. As on 31st March, 2020, the Committee comprises of three Directors viz. Mr. Dinesh Kumar Govil, Dr. Mahavir Prasad Agarwal and Mr. Rajat Agrawal.
No. of Meetings: During the year under review 4 (Four) Meeting of Stakeholders’ Relationship Committee was held i.e. on 28th May, 2019, 07th August, 2019, 12th November, 2019 and 05th February, 2020.
Meeting of Stakeholder Relationship Committee and Attendance during F.Y. 2019-20:
Name of the Members Designation Number of Meetings held during the Year
Meetings Attended
Mr. Dinesh Kumar Govil Chairman 4 4Dr. Mahavir Prasad Agarwal Member 4 4Mr. Rajat Agrawal Member 4 4
The terms of reference of the Stakeholders’ Relationship Committee are broadly as follows:
Resolving the grievances of the security holders of the listed entity including complaints related to transfer/transmission of shares, non-receipt of annual report, non-receipt of declared dividends, issue of new/duplicate certificates, general meetings etc.;
Review of measures taken for effective exercise of voting rights by shareholders;
Review of adherence to the service standards adopted by the listed entity in respect of various services being rendered by the Registrar & Share Transfer Agent;
Review of the various measures and initiatives taken by the listed entity for reducing the quantum of unclaimed dividends and ensuring timely receipt of dividend warrants/annual reports/statutory notices by the shareholders of the company.
Further before the above changes the terms of reference i.e. till 31st March, 2020 of Stakeholders’ Relationship Committee were as under:
To consider and review shareholders’/ investors’ grievances and complaints and ensure that all shareholders’/ investors’ grievances and correspondence are attended to expeditiously and satisfactorily unless constrained by incomplete documentation and/ or legal impediments;
To approve and register transfers and transmission of Equity Shares;
To Sub Divide, Consolidate and /or replace any Share Certificate of the Company;
To authorize affixation of Common Seal of the Company to share certificates;
To do all other acts and deeds as may be necessary or incidental to the above.
Compliance Officer: Mr. Nitin Gupta is Compliance Officer and Company Secretary of the Company.
Status of Investor Complaints: The Company received 21 (Twenty-one) complaints from investors which were resolved well in stipulated time by the Company and there were no complaints pending with the company or its Share Transfer Agents as on 31st March, 2020.
Compensation Committee
The Compensation Committee of the company comprises of three Non-Executive and Independent Directors. The Chairman of Compensation Committee is Mr. Dinesh Kumar Govil. The Compensation Committee administers the Employee Stock Option Plans and Stock Appreciation Right Scheme of the Company and determines eligibility of employees for Stock Options and Stock Appreciation Rights. As on 31st March, 2020 the committee comprises of following directors Mr. Dinesh Kumar Govil, Mrs. Chanchal Chadha Phadnis and Mr. Arun Kumar Gupta.
No. of Meetings: The Committee met 2 (two) times during the F.Y. 2019–20 on 27th April, 2019 and 21st March, 2020 respectively.

71
Annual Report2019-2020
Meetings of Compensation Committee and Attendance during F.Y. 2019-20:
Name of the Members Designation Number of Meetings held during the Year
Meetings Attended
Mr. Dinesh Kumar Govil Chairman 2 1Mrs. Chanchal Chadha Phadnis Member 2 2Mr. Arun Kumar Gupta Member 2 2
Investment Committee:
The Company has an Investment Committee comprising of three Directors viz., Mr. Rajat Agrawal, Dr. Mahavir Prasad Agarwal and Mr. Dinesh Kumar Govil. The committee has no designated chairman.
No. of Meetings: During the year under review no Meeting of investment Committee took place.
Terms of Reference
To make decisions about investments to be made by the Company in various overseas ventures whether by way of Equity or Capitalization of Exports or by way of loan;
To make decisions about investments to be made by the Company in shares, stocks, units of mutual funds, subscription to public issues of other companies etc.; and
To make decisions about disinvestments/ alienation/ sale/ transfer/ gift or pledge of any of the investments made in clause mentioned above which the Committee may consider most beneficial in the interest of the Company.
Corporate Social Responsibility Committee
In terms of the requirement of Section 135 of Companies Act, 2013 and Rules made thereunder, the Company has constituted the Corporate Social Responsibility Committee (“CSR Committee”) comprising of three Directors; amongst them-Dr. Mahavir Prasad Agarwal and Mr. Rajat Agrawal are executive directors and the Chairman of the Committee Mr. Dinesh Kumar Govil, is a Non-Executive Independent Director.
No. of Meetings: The Committee met 2 (two) times during the F.Y. 2019–20 on 14th August, 2019 and 21st March, 2020 respectively.
Composition of Corporate Social Responsibility Committee and Attendance:
Name of the Members Designation Number of Meetings held during the Year
Meetings Attended
Mr. Dinesh Kumar Govil Chairman 2 1Mr. Rajat Agrawal Member 2 2Dr. Mahavir Prasad Agarwal Member 2 2
Terms of Reference
To formulate the Corporate Social Responsibility policy of the company which shall indicate the activities to be undertaken by the company as specified in Schedule VII to the Act;
To recommend the expenditure that can be incurred for this purpose;
To monitor CSR policy of the company from time to time;
To prepare a transparent monitoring mechanism for ensuring implementation of the projects / programs / activities proposed to be undertaken by the Company;
To ensure that all kind of income accrued to the Company by way of CSR activities should be credited back to the community or CSR corpus.
Finance & Risk Management Committee
The Company has a Finance & Risk Management Committee comprising of three directors viz. Mr. Rajat Agrawal, Dr. Mahavir Prasad Agarwal and Mr. Dinesh Kumar Govil.
No. of Meetings: The Committee met 5 (Five) times during the F.Y. 2019-20 on:
02nd July, 201929th July, 2019
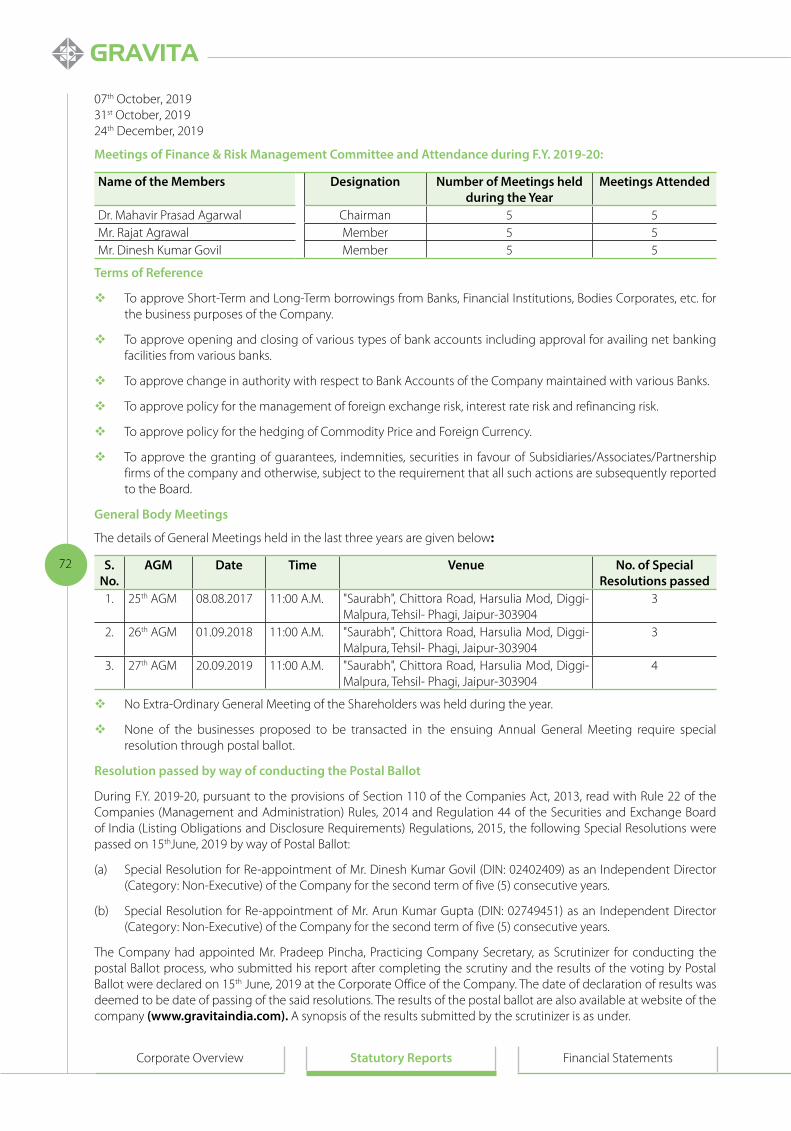
72
Corporate Overview Statutory Reports Financial Statements
07th October, 201931st October, 201924th December, 2019
Meetings of Finance & Risk Management Committee and Attendance during F.Y. 2019-20:
Name of the Members Designation Number of Meetings held during the Year
Meetings Attended
Dr. Mahavir Prasad Agarwal Chairman 5 5Mr. Rajat Agrawal Member 5 5Mr. Dinesh Kumar Govil Member 5 5
Terms of Reference
To approve Short-Term and Long-Term borrowings from Banks, Financial Institutions, Bodies Corporates, etc. for the business purposes of the Company.
To approve opening and closing of various types of bank accounts including approval for availing net banking facilities from various banks.
To approve change in authority with respect to Bank Accounts of the Company maintained with various Banks.
To approve policy for the management of foreign exchange risk, interest rate risk and refinancing risk.
To approve policy for the hedging of Commodity Price and Foreign Currency.
To approve the granting of guarantees, indemnities, securities in favour of Subsidiaries/Associates/Partnership firms of the company and otherwise, subject to the requirement that all such actions are subsequently reported to the Board.
General Body Meetings
The details of General Meetings held in the last three years are given below:
S. No.
AGM Date Time Venue No. of Special Resolutions passed
1. 25th AGM 08.08.2017 11:00 A.M. "Saurabh", Chittora Road, Harsulia Mod, Diggi- Malpura, Tehsil- Phagi, Jaipur-303904
3
2. 26th AGM 01.09.2018 11:00 A.M. "Saurabh", Chittora Road, Harsulia Mod, Diggi- Malpura, Tehsil- Phagi, Jaipur-303904
3
3. 27th AGM 20.09.2019 11:00 A.M. "Saurabh", Chittora Road, Harsulia Mod, Diggi- Malpura, Tehsil- Phagi, Jaipur-303904
4
No Extra-Ordinary General Meeting of the Shareholders was held during the year.
None of the businesses proposed to be transacted in the ensuing Annual General Meeting require special resolution through postal ballot.
Resolution passed by way of conducting the Postal Ballot
During F.Y. 2019-20, pursuant to the provisions of Section 110 of the Companies Act, 2013, read with Rule 22 of the Companies (Management and Administration) Rules, 2014 and Regulation 44 of the Securities and Exchange Board of India (Listing Obligations and Disclosure Requirements) Regulations, 2015, the following Special Resolutions were passed on 15thJune, 2019 by way of Postal Ballot:
(a) Special Resolution for Re-appointment of Mr. Dinesh Kumar Govil (DIN: 02402409) as an Independent Director (Category: Non-Executive) of the Company for the second term of five (5) consecutive years.
(b) Special Resolution for Re-appointment of Mr. Arun Kumar Gupta (DIN: 02749451) as an Independent Director (Category: Non-Executive) of the Company for the second term of five (5) consecutive years.
The Company had appointed Mr. Pradeep Pincha, Practicing Company Secretary, as Scrutinizer for conducting the postal Ballot process, who submitted his report after completing the scrutiny and the results of the voting by Postal Ballot were declared on 15th June, 2019 at the Corporate Office of the Company. The date of declaration of results was deemed to be date of passing of the said resolutions. The results of the postal ballot are also available at website of the company (www.gravitaindia.com). A synopsis of the results submitted by the scrutinizer is as under.

73
Annual Report2019-2020
Resolution No. 1:
Particulars Number of Votes casted through Total in Percentage (%)Postal Ballot e-Voting Total
Assent 25927 52596491 52622418 97.57Dissent - 1308738 1308738 2.43Invalid Votes - - - NegligibleTotal 25927 53905229 53931156 100.00
Resolution No. 2:
Particulars Number of Votes casted through Total in Percentage (%)Postal Ballot e-Voting Total
Assent 25927 52596565 52622492 97.52Dissent - 1308664 1308664 2.43Invalid Votes - - - NegligibleTotal 25927 53905229 53931156 100.00
Procedure Followed:
I. The Company issued the Postal Ballot Notice dated 27th April, 2019 containing draft resolution together with the explanatory statement and the Postal Ballot Forms and self-addressed envelopes to the members whose names appeared in the register of members as on 10th May, 2019 and other concerned.
II. Members were advised to read carefully the instructions printed on the Postal Ballot Form and return the duly completed form in the attached self-addressed envelope so as to reach the Scrutinizer on or before the close of business hours on 14th June, 2019. The members who opted for the e-voting could vote on or before the business hours, i.e. 5.00 P.M. on 14th June, 2019.
III. After due scrutiny of all the Postal Ballot Forms / E-voting received up to the close of the working hours on 14th June, 2019. The Scrutinizer submitted his final report on 15th June, 2019.
IV. The results of the Postal Ballot / E-voting were declared on 15th June, 2019. The date of declaration of the results of the Postal Ballot was taken as the date of passing of the resolution.
The results of the Postal Ballot were also placed on the website of the Company at http://www.gravitaindia.com/investors/postal-ballots/
Pledge of Shares: No Pledge has been created over the Equity Shares held by the Promoters and/or Promoter Group Shareholders during the Financial Year ended 31st March, 2020.
Review of Legal Compliance Reports: Alike the previous years, the Board, during the year, periodically reviewed the reports placed by the management with respect to adherence and compliance with various laws and regulations applicable to the Company. The Internal Auditors also reviewed the compliance status of the Company within their terms of reference and reported to the Audit Committee accordingly.
Certificate from Company Secretary in Practice: The company has obtained a certificate from Mr. Pradeep Pincha, Practicing Company Secretary confirming that none of the directors on the board of the company have been debarred or disqualified from being appointed or continuing as directors of companies by the Board/Ministry of Corporate Affairs or any such statutory authority as on 31st March, 2020 and the same is attached to this Report.
Disclosures:
Financial Statements/Accounting Treatments: In the preparation of Financial Statements, the Company has followed the Accounting Standards issued by the Institute of Chartered Accountants of India to the extent applicable.
Materially Significant Related Party Transactions: There have been no materially significant related party transactions, pecuniary transactions or relationships between the Company and its Directors that may have potential conflict with the interests of the Company.
Disclosure on Risk Management: The Board is periodically informed about the key risks and their minimization procedures. Business risk evaluation and management is an ongoing process within the Company.
Details of non-compliance: During the year under review company has made a delayed filing under Regulation 30 of SEBI (LODR) Regulations, 2015. Further, no penalties and/or strictures have been imposed on it by Stock Exchanges or SEBI or any Statutory Authority on any matter related to the capital markets during the last three years.
Familiarization Programme: The Company has Familiarization Program for Independent Directors to familiarize them with regard to their roles, rights, responsibilities in the Company, along with industry, business operations, business

74
Corporate Overview Statutory Reports Financial Statements
model, code of conduct and policies of the Company etc. The Familiarization Program has been disclosed on the website of the Company. The company’s policy on familiarization programme is available on following web link: http://www.gravitaindia.com/wp-content/uploads/pdf/familarization-programme.pdf.
CEO and CFO Certification: The certificate required under Regulation 17 (8) of SEBI (LODR) Regulations, 2015 duly signed by CEO and CFO was placed before the Board and the same is also provided with this report.
Compliance with the mandatory requirements of Corporate Governance as per SEBI (LODR) Regulations, 2015: During the year, the Company has complied with all applicable mandatory corporate governance requirements of the Listing Regulations. Specifically, Company confirms compliance with corporate governance requirements specified in Regulation 17 to 27 and clauses (b) to (i) of sub regulation (2) of Regulation 46 of the Listing Regulations.
Certificate of compliance of Corporate Governance: The Company has obtained a certificate affirming the compliances of Corporate Governance from M/s P. Pincha & Associates, Practicing Company Secretaries, Jaipur and the same is attached to this Report.
During the year under review the company has not raised any funds through preferential allotment or qualified institutions placement as specified under SEBI Regulations.
Web link for Policies: The Policies adopted by company can be accessed by following web link:
For Policy on determining Material Subsidiaries: http://www.gravitaindia.com/wp-content/uploads/pdf/material-subsidiaries-policy.pdf
For Policy on Related Party Transactions: http://www.gravitaindia.com/wp-content/uploads/pdf/rpt-policy.pdf
Whistle Blower Policy: The Audit Committee of the Board is committed to ensure fraud-free work environment and for that purpose the Committee has laid down a Whistle Blower Policy providing a platform to all its stakeholders including employees and auditors, regulatory agencies and customers of the Company to report any suspected or confirmed incident of fraud/misconduct through any of the following reporting protocols:
• Name of Vigilance Officer: Mr. Nitin Gupta
• E-mail: [email protected]
• Written Communication to: Vigilance officer- Gravita India Whistle Blower Policy, A-27 B, Gravita Tower, Shanti Path, Tilak Nagar, Rajasthan.
During the year, no one has been denied access to the audit committee. The Policy is also available at website of the Company (www.gravitaindia.com).
Means of Communication
Financial Results
Pursuant to Regulation 33 (4) of SEBI (LODR) Regulations, 2015, the Company has regularly furnished, by way of online electronic uploading on NEAPS and BSE Listing Centre the quarterly/half-yearly/annual audited results to both the Stock exchanges i.e. BSE & NSE within the timelines prescribed by SEBI in this regard.
The quarterly, half-yearly and annual results are published in ’Financial Express’ in English, and in ‘Nafa Nuksan’ (Vernacular) in Hindi. Further the same are also available on website of the company (www.gravitaindia.com)
The quarterly/half-yearly Results are not sent individually to the Shareholders.
Website& Newsletter
The Company’s website www.gravitaindia.com contains a dedicated functional segment called ‘Investors Information’ (http://www.gravitaindia.com/investors) where all the information needed by the shareholders is available, including the Corporate Governance Report, Shareholding Patterns, Financial Results, Intimations sent to exchanges and Annual Reports.
News Releases, Presentations, etc.
The price sensitive information’s, if any, are immediately informed to the Stock Exchange(s) before the same is communicated to general public through press releases.
Official news releases and Official Media Releases are sent to the Stock Exchanges regularly.
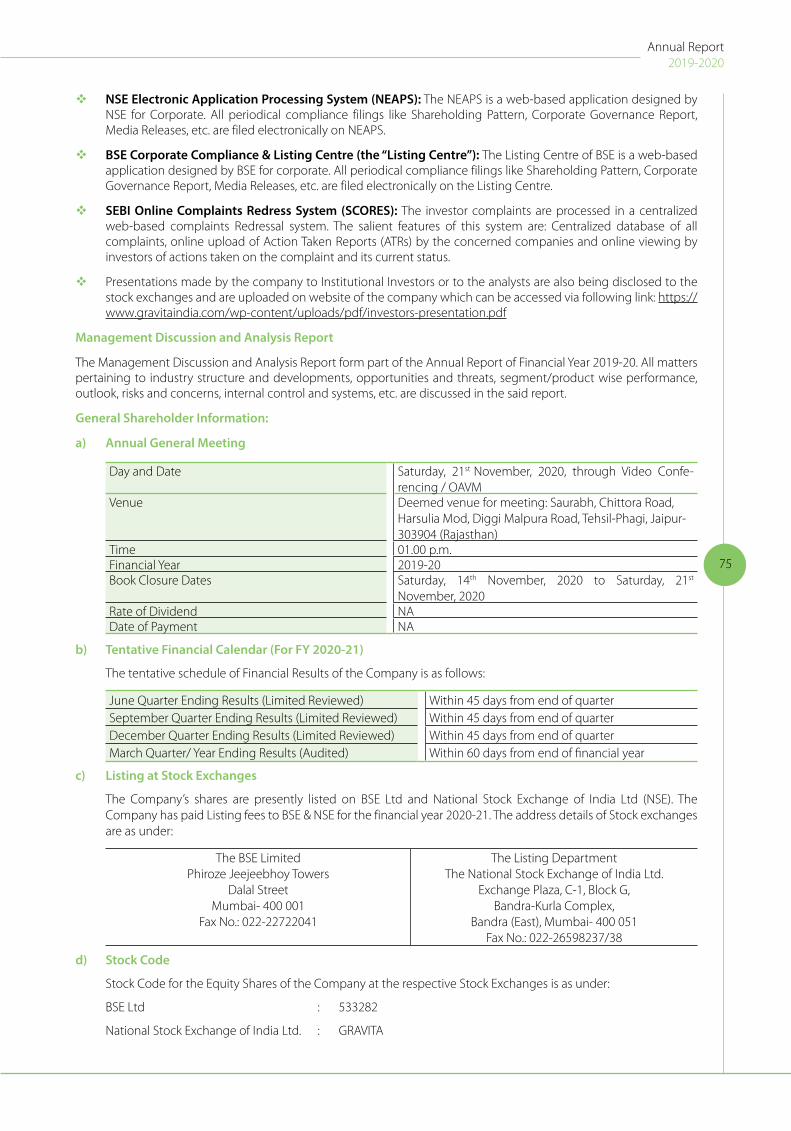
75
Annual Report2019-2020
NSE Electronic Application Processing System (NEAPS): The NEAPS is a web-based application designed by NSE for Corporate. All periodical compliance filings like Shareholding Pattern, Corporate Governance Report, Media Releases, etc. are filed electronically on NEAPS.
BSE Corporate Compliance & Listing Centre (the “Listing Centre”): The Listing Centre of BSE is a web-based application designed by BSE for corporate. All periodical compliance filings like Shareholding Pattern, Corporate Governance Report, Media Releases, etc. are filed electronically on the Listing Centre.
SEBI Online Complaints Redress System (SCORES): The investor complaints are processed in a centralized web-based complaints Redressal system. The salient features of this system are: Centralized database of all complaints, online upload of Action Taken Reports (ATRs) by the concerned companies and online viewing by investors of actions taken on the complaint and its current status.
Presentations made by the company to Institutional Investors or to the analysts are also being disclosed to the stock exchanges and are uploaded on website of the company which can be accessed via following link: https://www.gravitaindia.com/wp-content/uploads/pdf/investors-presentation.pdf
Management Discussion and Analysis Report
The Management Discussion and Analysis Report form part of the Annual Report of Financial Year 2019-20. All matters pertaining to industry structure and developments, opportunities and threats, segment/product wise performance, outlook, risks and concerns, internal control and systems, etc. are discussed in the said report.
General Shareholder Information:
a) Annual General Meeting
Day and Date Saturday, 21st November, 2020, through Video Confe-rencing / OAVM
Venue Deemed venue for meeting: Saurabh, Chittora Road, Harsulia Mod, Diggi Malpura Road, Tehsil-Phagi, Jaipur- 303904 (Rajasthan)
Time 01.00 p.m.Financial Year 2019-20Book Closure Dates Saturday, 14th November, 2020 to Saturday, 21st
November, 2020Rate of Dividend NADate of Payment NA
b) Tentative Financial Calendar (For FY 2020-21)
The tentative schedule of Financial Results of the Company is as follows:
June Quarter Ending Results (Limited Reviewed) Within 45 days from end of quarterSeptember Quarter Ending Results (Limited Reviewed) Within 45 days from end of quarterDecember Quarter Ending Results (Limited Reviewed) Within 45 days from end of quarterMarch Quarter/ Year Ending Results (Audited) Within 60 days from end of financial year
c) Listing at Stock Exchanges
The Company’s shares are presently listed on BSE Ltd and National Stock Exchange of India Ltd (NSE). The Company has paid Listing fees to BSE & NSE for the financial year 2020-21. The address details of Stock exchanges are as under:
The BSE LimitedPhiroze Jeejeebhoy Towers
Dalal StreetMumbai- 400 001
Fax No.: 022-22722041
The Listing DepartmentThe National Stock Exchange of India Ltd.
Exchange Plaza, C-1, Block G, Bandra-Kurla Complex,
Bandra (East), Mumbai- 400 051Fax No.: 022-26598237/38
d) Stock Code
Stock Code for the Equity Shares of the Company at the respective Stock Exchanges is as under:
BSE Ltd : 533282
National Stock Exchange of India Ltd. : GRAVITA
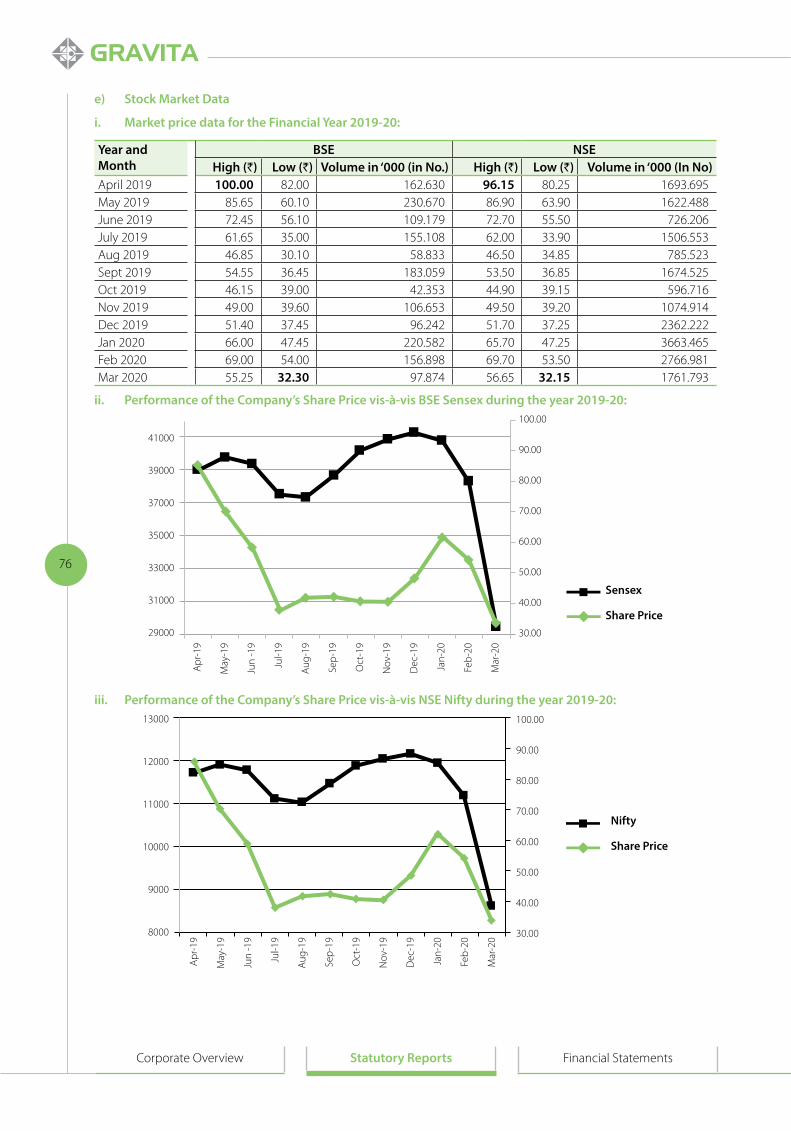
76
Corporate Overview Statutory Reports Financial Statements
e) Stock Market Data
i. Market price data for the Financial Year 2019-20:
Year and Month
BSE NSEHigh (`) Low (`) Volume in ‘000 (in No.) High (`) Low (`) Volume in ‘000 (In No)
April 2019 100.00 82.00 162.630 96.15 80.25 1693.695May 2019 85.65 60.10 230.670 86.90 63.90 1622.488June 2019 72.45 56.10 109.179 72.70 55.50 726.206July 2019 61.65 35.00 155.108 62.00 33.90 1506.553Aug 2019 46.85 30.10 58.833 46.50 34.85 785.523Sept 2019 54.55 36.45 183.059 53.50 36.85 1674.525Oct 2019 46.15 39.00 42.353 44.90 39.15 596.716Nov 2019 49.00 39.60 106.653 49.50 39.20 1074.914Dec 2019 51.40 37.45 96.242 51.70 37.25 2362.222Jan 2020 66.00 47.45 220.582 65.70 47.25 3663.465Feb 2020 69.00 54.00 156.898 69.70 53.50 2766.981Mar 2020 55.25 32.30 97.874 56.65 32.15 1761.793
ii. Performance of the Company’s Share Price vis-à-vis BSE Sensex during the year 2019-20:100.00
90.00
80.00
70.00
60.00
50.00
40.00
30.00
41000
39000
37000
35000
33000
31000
29000
Apr
-19
May
-19
Jun
-19
Jul-1
9
Aug
-19
Sep-
19
Oct
-19
Nov
-19
Dec
-19
Jan-
20
Feb-
20
Mar
-20
Share Price
Sensex
iii. Performance of the Company’s Share Price vis-à-vis NSE Nifty during the year 2019-20:
Apr
-19
May
-19
Jun
-19
Jul-1
9
Aug
-19
Sep-
19
Oct
-19
Nov
-19
Dec
-19
Jan-
20
Feb-
20
Mar
-20
Share Price
Nifty
100.00
90.00
80.00
70.00
60.00
50.00
40.00
30.00
13000
12000
11000
10000
9000
8000

77
Annual Report2019-2020
f) Shareholding Pattern as on 31st March, 2020
Category No. of Shares %ageMutual Funds 408396 0.59Trusts 23945 0.03Alternative Investment Fund 843315 1.22Resident Individuals 13587707 19.68Employee Trusts 716510 1.04Employees 597418 0.87Non-Resident Indians 233271 0.34Clearing Members 56835 0.08Indian Financial Institutions 27906 0.04Promoters Individuals 32712264 47.38Non-Resident Indian Non-Repatriable 180988 0.26Bodies Corporates 1610908 2.33I E P F 543 NegligibleH U F 689883 1.00Promoter Trust 17348025 25.13Grand Total 69037914 100.00
Mutual FundsTrustsAlternative Investment FundResident IndividualsEmployee TrustsEmployeesNon-Resident IndiansClearing MembersIndian Financial InstitutionsPromoters IndividualsNon-Resident Indian Non-RepatriableBodies CorporatesI E P FH U FPromoter Trust
g) Distribution Schedule as on 31st March, 2020
Nominal Value of Each Equity Share is ` 2/-
No. of Equity Shares Held
No. of Share Holders
% of Share holders
No. of Shares Amount(In `)
% of Total Shares
1-5000 15474 95.47 4623061 9246122.00 6.705001-10000 407 2.51 1470220 2940440.00 2.1310001-20000 173 1.07 1251053 2502106.00 1.8120001-30000 51 0.31 628242 1256484.00 0.9130001-40000 16 0.10 275577 551154.00 0.4040001-50000 14 0.09 313957 627914.00 0.4550001- 100000 33 0.20 1106727 2213454.00 1.60100001 & Above 40 0.25 59369077 118738154.00 85.99TOTAL 16208 100.00 69037914 138075828.00 100.00

78
Corporate Overview Statutory Reports Financial Statements
h) Corporate Identification Number (CIN)
The Company is registered with the Registrar of Companies, Jaipur, Rajasthan. The CIN allotted to the Company by the Ministry of Corporate Affairs is L29308RJ1992PLC006870.
i) Subsidiary Companies
As per definition defined under SEBI (LODR) regulations, 2015, the Company does not have any Material Subsidiary, whose Income or Net worth exceeds 20% of the Consolidated income or Net Worth respectively of the Company and its subsidiaries in the immediately preceding accounting year. Further as per amendment in definition of Material Subsidiary inserted by SEBI (LODR) (Amendment) Regulations, 2018 in which limit of 20% of Consolidated income or Net Worth has been revised to 10% w.e.f 01st April, 2019, there are below mentioned subsidiaries of the company which fall under the criteria of material subsidiary:
Gravita Netherlands BV
Gravita Mozambique LDA
j) Discretionary requirements Part E of schedule II
On discretionary basis, the company has adopted clause C, D and E as mentioned in Part E of schedule II.
k) Reconciliation of Share Capital Audit
A Qualified Practicing Company Secretary carried out the Quarterly Reconciliation of Share Capital Audit to reconcile the total admitted equity capital with National Securities Depository Limited (NSDL) and the Central Depository Services (India) Limited (CDSL) of the total issued and listed Equity Share Capital. The Report on Reconciliation of Share Capital confirms that the total issued/paid up capital of the Company admitted with depositories is in agreement with the capital of the Company listed with the Stock Exchanges. Further none of the shares of the company are lying in suspense account as on 31st March, 2020.
l) Share Transfer System
The Share transfers documents complete in all respects are registered and/or share transfers under objections are returned within stipulated time period.
m) Dematerialization of Shares and Liquidity
The Shares of Company are compulsorily traded in dematerialized form and are available for trading on both the depositories in India viz. National Securities Depository Limited (NSDL) and Central Depository Services (India) Limited (CDSL). Equity Shares of the Company representing 99.99% of the Company’s Equity Share Capital are dematerialized as on 31stMarch, 2020 and the promoters holding of 72.51% is completely held in the dematerialized form as on 31stMarch, 2020. The Company’s Equity Shares are regularly traded on the Bombay Stock Exchange and National Stock Exchange in dematerialized form. Under the Depository system, the International Security Identification Number (ISIN) allotted to the Company’s shares is INE024L01027.
Disclosure with respect to demat suspense account/unclaimed suspense account
As on March 31, 2020, there are no outstanding shares lying in the demat suspense account/unclaimed suspense account.
n) Green Initiative in Corporate Governance
As per the MCA Circular Nos. 17/2011 dated April 21, 2011 & 18/2011 dated April 29, 2011, Ministry of Corporate Affairs has undertaken a Green Initiative in Corporate Governance whereby the shareholders desirous of receiving notices, documents and other communication from the Company through electronic mode, can register their e-mail addresses with the Company. As a responsible citizen, your Company strongly urge our shareholders to support the Green Initiative by giving positive consent by registering/updating your email addresses with your respective Depository Participants or the Registrar and Transfer Agents of the Company, KFIN TECHNOLOGIES PRIVATE LIMITED for the purpose of receiving soft copies of various communications including the Annual Report.
o) Outstanding GDRs/ADRs/Warrants or Any Convertible Instruments
The Company has not issued GDRs/ADRs/Warrants or any other instruments which is convertible into Equity Shares of the Company during 2019-20.
p) Commodity Price Risk or Foreign Exchange Risk and Hedging Activities
Please refer to Management Discussion and Analysis Report for the same.

79
Annual Report2019-2020
q) Address for Correspondence
Shareholder’s correspondence should be addressed to the Company’s RTA at the address mentioned below:
Registrar and Share Transfer Agents
Mr. N Shyam Kumar KFin Technologies Pvt. Ltd Selenium Tower B, Plot 31-32, Gachibowli, Financial District, Nanakramguda, Hyderabad – 500 032 Phone No. 040-67162222 Email: [email protected] Web site: www.Kfintech.com
For any further assistance, the Shareholders may Contact:
Company’s Corporate Office
Company Secretary Gravita India Limited 402, Gravita Tower, A-27B, Shanti Path, Tilak Nagar, Jaipur – 302 004, Rajasthan, India Tel. 0141-2623266 Email: [email protected] Web Site: www.gravitaindia.com
Registered Office
Gravita India Limited
‘Saurabh’, Chittora Road, Harsulia Mod, Diggi – Malpura Road,
Tehsil – Phagi, Jaipur – 303 904, Rajasthan, India
Tel. 09928070682
In Compliance of Regulation 46 of SEBI (LODR) Regulations, 2015, the Company has designated exclusive Email ID for redressal of Investor Grievances [email protected]
r) During the financial year, there have been no instances where the Board of Directors of the Company has not accepted a recommendation of any committee of the Board which is mandatory in nature.
s) Details of fees paid by the company to its Statutory Auditors:
During F.Y. 2019-20 the company has paid following fees to its Statutory Auditors.
(` In Lacs)
S. No Particulars Amount Paid in F.Y. 19-20
1 Statutory Audit fees (` 6.00 lacs out of ̀ 31.50 Lacs has been paid to erstwhile Statutory Auditors i.e. Deloitte Haskins & Sells)
31.50
2 Fees paid for Statutory Auditor Certificates under FEMA and SEBI (Employee Based Share Benefit Regulations), 2014 (` 1.10 lacs out of ` 1.80 Lacs has been paid to erstwhile Statutory Auditors i.e. Deloitte Haskins & Sells)
1.80
3 Reimbursement of Expenses (` 1.30 lacs out of ` 4.03 Lacs has been paid to erstwhile Statutory Auditors i.e. Deloitte Haskins & Sells)
4.03
Total 37.33
Apart from above nothing is paid by any subsidiary of the company to the Statutory Auditors and all entities in the network firm/network entity of which the statutory auditor is a part.
t) Plant Locations:
i. ‘Saurabh’, Chittora Road, Harsulia Mod, Diggi – Malpura Road, Tehsil – Phagi, Jaipur –303 904, Rajasthan, India.
ii. Plot No. 322, Mithirohar Industrial Estate, Mithirohar, Taluka Gandhidham, Gujarat.
iii. Plot No. PA-011-006, Mahindra SEZ, Village Kalwara, Tehsil Sanganer, Distt. Jaipur.

80
Corporate Overview Statutory Reports Financial Statements
iv. Survey No. 233/15 to 233/30, Thiruthani Road, Ananthapuram- Panchayat Narasingarayani Pettah Post Chittoor, Andhra Pradesh.
DECLARATION regarding compliance by Board Members and Senior Management Personnel with the Company’s Code of Conduct
We, Rajat Agrawal, Managing Director and Yogesh Malhotra, Whole-Time Director & CEO of Gravita India Limited, hereby declare that all the members of the Board of Directors and the Senior Management Personnel have affirmed compliance with the Code of Conduct of the Company, applicable to them as laid down by the Board of Directors in terms of Schedule V of SEBI (LODR) Regulations, 2015, for the year ended 31st March 2020.
For Gravita India Limited Yogesh Malhotra Rajat AgrawalDate: 06th April, 2020 (Whole-time Director & CEO) (Managing Director)Place: Jaipur DIN: 05332393 DIN: 00855284

81
Annual Report2019-2020
CEO/CFO Certification
To The Board of Directors Gravita India Limited Jaipur
We, Yogesh Malhotra, CEO & Whole-time Director (DIN:05332393), and Sunil Kansal, CFO of the Company, hereby certify to the Board that:
A. We have reviewed financial statements and the cash flow statement for the year ended 31st March,2020 and that to the best of our knowledge and belief:
1. These statements do not contain any materially untrue statement or omit any material fact or contain statements that might be misleading;
2. These statements together present a true a fair view of the company’s affairs and are in compliance with existing Accounting Standards, applicable laws and regulations.
B. There are, to the best of our knowledge and belief, no transactions entered into by the company during the year which are fraudulent, illegal or violative of the company’s Code of Conduct.
C. We accept responsibility for establishing and maintaining internal controls for financial reporting and that we have evaluated the effectiveness of internal control systems of the company pertaining to financial reporting and we have disclosed to the auditors and the Audit Committee, deficiencies in the design or operation of such internal controls, if any, of which we are aware and the steps we have taken or propose to take to rectify these deficiencies.
D. We have indicated to the Auditors and the Audit committee:
1. Significant changes in internal control over financial reporting during the year;
2. Significant changes in accounting policies during the year and that the same have been disclosed in the notes to the financial statements; and
3. Instances of significant fraud of which we have become aware and the involvement therein, if any, of the management or any employee having a significant role in the company’s internal control system over financial reporting
For Gravita India Limited Yogesh Malhotra Sunil KasalDate: 25th June, 2020 (Whole-time Director & CEO) (CFO)Place: Jaipur DIN: 05332393

82
Corporate Overview Statutory Reports Financial Statements
Corporate Governance Compliance Certificate
To The Members,Gravita India Limited
We have examined the compliance of conditions of Corporate Governance by Gravita India Limited, for the year ended on 31st March 2020, as stipulated in applicable provisions of Securities and Exchange Board of India (Listing Obligations and Disclosure Requirements) Regulations, 2015 (’Listing Regulations').
The compliance of conditions of Corporate Governance is the responsibility of the Management. Our examination has been limited to a review of the procedures and implementation thereof adopted by the Company for ensuring compliance with the conditions of the Corporate Governance as stipulated in the Listing Regulations. It is neither an audit nor an expression of opinion on the financial statements of the Company.
In our opinion and to the best of our information and according to the explanations given to us and based on the representations made by the Directors and the Management, we certify that the Company has complied with the conditions of Corporate Governance as specified under the applicable provisions of Listing Regulations.
We further state that such compliance is neither an assurance as to future viability of the Company nor of the efficiency or effectiveness with which the management has conducted the affairs of the Company.
For P. Pincha & Associates Company Secretaries
Pradeep Pincha Proprietor
M. No. : FCS 5369 C. P. No.: 4426
UDIN: F005369B000317175
Dated: 04th June, 2020Place: Jaipur

83
Annual Report2019-2020
CERTIFICATE OF NON-DISQUALIFICATION OF DIRECTORS(Pursuant to Regulation 34(3) and Schedule V Para C clause (10)(i) of the SEBI
(Listing Obligations and Disclosure Requirements) Regulations, 2015)
ToThe Members of Gravita India LimitedSaurabh', Harsulia Mod, P.O. Harsulia, Diggi-Malpura Road Phagi, Rajasthan-303 904
We have examined the relevant registers, records, forms, returns and disclosures received from the Directors of Gravita India Limited having CIN L29308RJ1992PLC006870 and having registered office at Saurabh', Harsulia Mod, P.O. Harsulia, Diggi-Malpura Road Phagi, Rajasthan-303904 (hereinafter referred to as ‘the Company’), produced before us by the Company for the purpose of issuing this Certificate, in accordance with Regulation 34(3) read with Schedule V Para-C Sub clause 10(i) of the Securities Exchange Board of India (Listing Obligations and Disclosure Requirements) Regulations, 2015.
In our opinion and to the best of our information and according to the verifications (including Directors Identification Number (DIN) status at the portal www.mca.gov.in) as considered necessary and explanations, representations furnished to us by the Company & its officers, We hereby certify that none of the Directors on the Board of the Company as stated below for the Financial Year ending on 31st March, 2020 have been debarred or disqualified from being appointed or continuing as Directors of companies by the Securities and Exchange Board of India, Ministry of Corporate Affairs, or any such other Statutory Authority:
S. No. Name of the Members DIN Date of appointment in the Company
1. Dr. Mahavir Prasad Agarwal 00188179 27/03/2007
2. Rajat Agrawal 00855284 04/08/1992
3. Dinesh Kumar Govil 02402409 30/06/2009
4. Arun Kumar Gupta 02749451 11/08/2009
5. Yogesh Malhotra 05332393 31/03/2019
6. Chanchal Chadha Phadnis 07133840 24/03/2015
Ensuring the eligibility of for the appointment / continuity of every Director on the Board is the responsibility of the management of the Company. Our responsibility is to express an opinion on these based on our verification. This certificate is neither an assurance as to the future viability of the Company nor of the efficiency or effectiveness with which the management has conducted the affairs of the Company.
For P. Pincha & Associates Company Secretaries
Pradeep Pincha Proprietor
M. No. : FCS 5369 C. P. No.: 4426
UDIN: F005369B000317120
Dated: 04th June, 2020Place: Jaipur

84
Corporate Overview Statutory Reports Financial Statements
Financial Section

85
Annual Report2019-2020
To the Members of Gravita India Limited
Report on the Audit of the Standalone Financial Statements
Opinion
1. We have audited the accompanying standalone financial statements of Gravita India Limited (‘the Company’), which comprise the Balance Sheet as at 31 March 2020, the Statement of Profit and Loss (including Other Comprehensive Income), the Cash Flow Statement and the Statement of Changes in Equity for the year then ended, and a summary of the significant accounting policies and other explanatory information.
2. In our opinion and to the best of our information and according to the explanations given to us, and based on the consideration of the reports of the other auditors as referred to in paragraph 15 below, the aforesaid standalone financial statements give the information required by the Companies Act, 2013 (‘Act’) in the manner so required and give a true and fair view in conformity with the accounting principles generally accepted in India including Indian Accounting Standards (‘Ind AS’) specified under section 133 of the Act, of the state of affairsof the Company as at 31 March 2020, and its profit (including other comprehensive income), its cash flows and the changes in equity for the year ended on that date.
Basis for Opinion
3. We conducted our audit in accordance with the Standards on Auditing specified under section 143(10) of the Act. Our responsibilities under those standards are further described in the Auditor’s Responsibilities for the Audit of the Financial Statements section of our report. We are independent of the Company in accordance with the Code of Ethics issued by the Institute of Chartered Accountants of India (‘ICAI’) together with the ethical requirements that are relevant to our audit of the financial statements under the provisions of the Act and the rules thereunder, and we have fulfilled our other ethical responsibilities in accordance with these requirements and the Code of Ethics. We believe that the audit evidence we have obtained and that obtained by the other auditors, in terms of their reports referred to in paragraph 15 of the Other Matter section below is sufficient and appropriate to provide a basis for our opinion.
Key Audit Matters
4. Key audit matters are those matters that, in our professional judgment were of most significance in our audit of the standalone financial statements of the current period. These matters were addressed in the context of our audit of the financial statements as a whole, and in forming our opinion thereon, and we do not provide a separate opinion on these matters.
5. We have determined the matters described below to be the key audit matters to be communicated in our report.
Key audit matter How our audit addressed the key audit matterInitial Audit engagement – Opening Balances
We have been appointed as the statutory auditors of Company for year ended 31 March 2020.
Standard on Auditing 510, Initial Audit Engagements – Opening Balances, in conducting an initial audit engagement, several considerations are involved which are generally not associated with recurring audits. The audit transition, including the audit of the opening balances requires additional planning activities and considerations necessary to establish an appropriate audit plan and strategy. This includes:
a) Gaining an initial understanding of the Company and its business including its control environment and information systems, sufficient to make an audit assessment and develop the audit strategy and plan;
Our audit work included, but was not limited to, the following procedures:
a) Prepared a detailed transition plan, including ensuring compliance with independence requirements, prior to the start of the audit;
b) Inspected management’s process and control documentation to assist us in obtaining and understanding of the Company’s financial reporting and business processes, including control environment;
c) Obtained and read management reports, policies, instructions as well as planning and governing documents, minutes of the board of directors, audit committee and other committees of the board, internal audit reports;
Independent Auditor’s Report

86
Corporate Overview Statutory Reports Financial Statements
Key audit matter How our audit addressed the key audit matterb) Obtaining sufficient appropriate audit evidence
regarding the opening balances including the selection and application of accounting policies; and
c) Communicating with the predecessor auditors, as required and permitted under applicable professional regulations.
The aforesaid activities required involvement of considerable audit efforts, and accordingly, audit of the opening balances was identified as a key audit matter for the current year audit.
d) Held discussions with the management at various levels of the Company and heads of the Business, Risk and Finance functions, to understand their roles in the business and company’s financial reporting process;
e) Obtained an understanding of and evaluated appropriateness and consistency of the accounting policies used in the preparation of the financial statements of the Company for the financial year ended 31 March 2019;
f ) Read previous year financial statements to identify material opening balances. Obtained underlying accounting schedules prepared by the management and scanned for unusual items;
g) Traced the account balances from the trial balance for the previous financial year to the audited financial statements, and traced the balance sheet account balances to the opening trial balance of the current year; and
h) On a sample basis, tested the opening balances for financial line items including property, plant and equipment, bank balances, borrowings, share capital, and other current assets and liabilities, as considered necessary.
Estimation and taxability in respect of SGST incentives
The Company’s manufacturing facility at Chittoor, is eligible for incentives available under “Industrial Development Policy 2015-2020”, notified by the Andhra Pradesh government. The Company has been granted “Small Industry” status and is eligible for incentives like, power cost reimbursement, interest reimbursement, refund of sales tax/ state goods and services tax paid in cash, etc. Based on such policy, the Company has continued to recognize the incentives which are computed on the basis of the State Goods and Services Tax (SGST) paid to the Government of Andhra Pradesh. The SGST incentives amounting to ` 1,569.28 Lacs have been accrued in the financial statements for the year ended 31 March 2020. Refer note 23 to the standalone financial statements.
The key judgement is involved in the taxability of the SGST incentive on accrual or receipt basis relying on case laws and judgements and the resultant impact on the financial position, results of operations and cash flows. In March 2019, the incentive income was offered to tax on accrual basis, while as per the tax opinion obtained in quarter ended 31 December 2019, such income was to be offered to tax on receipt basis.
Considering the materiality of amounts involved and significant Judgements involved, the same has been considered as a Key audit matter for the current year’s audit.
Our audit work included, but was not limited to the following procedures:
a) Discussed the underlying SGST incentive matter with the management and obtained an understanding of the basis for management’s judgement;
b) Evaluated the design and tested the operating effectiveness of key controls around the taxability of SGST incentives;
c) Obtained the tax views sought by the Company’s management from an external legal counsel on the matter and evaluated the independence, objectivity and competency of the specialists involved;
d) Involved auditor’s expert to perform an evaluation of the relevant judgements passed by the authorities and assess the taxability of these incentives including the appropriateness of the tax rates used;
e) Tested the arithmetical accuracy of the computation performed by the management; and
f ) Evaluated the appropriateness of the accounting policy used and related disclosures made in the accompanying standalone financial statements with regard to this matter.
Independent Auditor’s Report (Contd.)

87
Annual Report2019-2020
Key audit matter How our audit addressed the key audit matterRevenue recognition
Refer note 23 to the standalone financial statements.
The Revenues of the Company consists primarily of sale of products and is recognized when control of products being sold is transferred to the customer and there is no unfulfilled obligation.
Revenue is measured at fair value of the consideration received or receivable and is accounted for net of rebates and trade discounts.
Revenue recognition process also involves certain key judgements relating to identification of distinct performance obligations, determination of transaction price of the identified performance obligations and the appropriateness of revenue recognized.
The Company also focuses on revenue as a key performance measure, which could create an incentive for overstating revenue.
Considering the materiality of amounts involved and significant judgements involved, the same has been considered as a key audit matter for the current year’s audit.
Our audit work included, but was not limited to, the following procedures:
a) Assessed the appropriateness of the Company’s revenue recognition accounting policies in accordance with Ind AS 115 – Revenue from contracts with customers (Ind AS 115);
b) Tested the design and operating effectiveness of the general IT control environment and the manual controls for recognition of revenue;
c) Performed substantive analytical procedures on revenue which included ratio analysis, product mix analysis, customer analysis, etc.;
d) Tested, on a sample basis, sales transactions to the underlying supporting documentation which includes goods dispatch notes and shipping documents;
e) Reviewed, on a sample basis, sales agreements and the underlying contractual terms related to delivery of goods and rebates to assess the Company’s revenue recognition policies with reference to the requirements of the applicable accounting standards;
f ) Obtained supporting documentation for a sample of credit notes issued after the year end to determine whether the transaction was recognized in the correct accounting period;
g) Performed other substantive audit procedures including obtaining debtor confirmations on a sample basis and reconciling revenue recorded during the year with statutory returns;
h) Assessed if there is any modification to, or other impact on the contracts with customers due to COVID 19 outbreak;
i) Tested manual journal entries impacting revenue including credit notes, claims etc., which were material or irregular in nature with supporting documents and evaluated business rationale thereof; and
j) Ensured the adequacy and appropriateness of disclosures made in the financial statements in accordance with the requirements of Ind AS 115.
Information other than the Financial Statements and Auditor’s Report thereon
6. The Company’s Board of Directors is responsible for the other information. The other information comprises the information included in the Annual Report, but does not include the standalone financial statements and our auditor’s report thereon. The Annual Report is expected to be made available to us after the date of this auditor’s report.
Our opinion on the standalone financial statements
does not cover the other information and we will not express any form of assurance conclusion thereon.
In connection with our audit of the standalone financial statements, our responsibility is to read the other information identified above when it becomes available and, in doing so, consider whether the other information is materially inconsistent with the standalone financial statements or our knowledge obtained in the audit or otherwise appears to be materially misstated.
Independent Auditor’s Report (Contd.)
88
Corporate Overview Statutory Reports Financial Statements
When we read the Annual Report, if we conclude that there is a material misstatement therein, we are required to communicate the matter to those charged with governance.
Responsibilities of Management and Those Charged with Governance for the Standalone Financial Statements
7. The accompanying standalone financial statements have been approved by the Company’s Board of Directors. The Company’s Board of Directors is responsible for the matters stated in section 134(5) of the Act with respect to the preparation of these standalone financial statements that give a true and fair view of the financial position, financial performance including other comprehensive income, changes in equity and cash flows of the Company in accordance with the accounting principles generally accepted in India, including the Ind AS specified under section 133 of the Act. This responsibility also includes maintenance of adequate accounting records in accordance with the provisions of the Act for safeguarding of the assets of the Company and for preventing and detecting frauds and other irregularities; selection and application of appropriate accounting policies; making judgments and estimates that are reasonable and prudent; and design, implementation and maintenance of adequate internal financial controls, that were operating effectively for ensuring the accuracy and completeness of the accounting records, relevant to the preparation and presentation of the financial statements that give a true and fair view and are free from material misstatement, whether due to fraud or error.
8. In preparing the financial statements, management is responsible for assessing the Company’s ability to continue as a going concern, disclosing, as applicable, matters related to going concern and using the going concern basis of accounting unless management either intends to liquidate the Company or to cease operations, or has no realistic alternative but to do so.
9. Those Board of Directors is also responsible for overseeing the Company’s financial reporting process.
Auditor’s Responsibilities for the Audit of the Financial Statements
10. Our objectives are to obtain reasonable assurance about whether the financial statements as a whole are free from material misstatement, whether due to fraud or error, and to issue an auditor’s report that includes our opinion. Reasonable assurance
is a high level of assurance, but is not a guarantee that an audit conducted in accordance with Standards on Auditing will always detect a material misstatement when it exists. Misstatements can arise from fraud or error and are considered material if, individually or in the aggregate, they could reasonably be expected to influence the economic decisions of users taken on the basis of these financial statements.
11. As part of an audit in accordance with Standards on Auditing, we exercise professional judgment and maintain professional skepticism throughout the audit. We also:
• Identify and assess the risks of materialmisstatement of the financial statements, whether due to fraud or error, design and perform audit procedures responsive to those risks, and obtain audit evidence that is sufficient and appropriate to provide a basis for our opinion. The risk of not detecting a material misstatement resulting from fraud is higher than for one resulting from error, as fraud may involve collusion, forgery, intentional omissions, misrepresentations, or the override of internal control;
• Obtainanunderstandingof internalcontrolrelevant to the audit in order to design audit procedures that are appropriate in the circumstances. Under section 143(3)(i) of the Act, we are also responsible for expressing our opinion on whether the Company has adequate internal financial controls with reference to financial statements in place and the operating effectiveness of such controls;
• Evaluate the appropriateness of accountingpolicies used and the reasonableness of accounting estimates and related disclosures made by management;
• Conclude on the appropriateness ofmanagement’s use of the going concern basis of accounting and, based on the audit evidence obtained, whether a material uncertainty exists related to events or conditions that may cast significant doubt on the Company’s ability to continue as a going concern. If we conclude that a material uncertainty exists, we are required to draw attention in our auditor’s report to the related disclosures in the financial statements or, if such disclosures are inadequate, to modify our opinion. Our conclusions are based on the audit evidence obtained up to the date of our auditor’s report. However, future events or conditions may cause the Company to cease to continue as a going concern; and
Independent Auditor’s Report (Contd.)

89
Annual Report2019-2020
• Evaluate the overall presentation, structureand content of the financial statements, including the disclosures, and whether the financial statements represent the underlying transactions and events in a manner that achieves fair presentation.
12. We communicate with those charged with governance regarding, among other matters, the planned scope and timing of the audit and significant audit findings, including any significant deficiencies in internal control that we identify during our audit.
13. We also provide those charged with governance with a statement that we have complied with relevant ethical requirements regarding independence, and to communicate with them all relationships and other matters that may reasonably be thought to bear on our independence, and where applicable, related safeguards.
14. From the matters communicated with those charged with governance, we determine those matters that were of most significance in the audit of the financial statements of the current period and are therefore the key audit matters. We describe these matters in our auditor’s report unless law or regulation precludes public disclosure about the matter or when, in extremely rare circumstances, we determine that a matter should not be communicated in our report because the adverse consequences of doing so would reasonably be expected to outweigh the public interest benefits of such communication.
Other Matter
15. We did not audit the financial statements of four partnership firms included in the standalone financial statements, whose financial information reflects total net profit after tax of ` 13.19 lacs for the year ended 31 March 2020, as considered in the standalone financial statements. These financial statements have been audited by other auditors whose audit reports have been furnished to us by the management, and our opinion in so far as it relates to the amounts and disclosures included in respect of these partnership firms is based solely on the audit reports of such other auditors.
Our opinion on the standalone financial statements, and our report on other legal and regulatory requirements below, are not modified in respect of the above matters with respect to our reliance on the work done by and the reports of the other auditors.
16. The standalone financial statements of the Company for the year ended 31 March 2019 were audited by the predecessor auditor, Deloitte Haskin and Sells, who have expressed an unmodified opinion on those standalone financial statements vide their audit report dated 28 May 2019.
Report on Other Legal and Regulatory Requirements
17. As required by section 197(16) of the Act, based on our audit, we report that the Company has paid remuneration to its directors during the year in accordance with the provisions of and limits laid down under section 197 read with Schedule V to the Act.
18. As required by the Companies (Auditor’s Report) Order, 2016 (‘the Order’) issued by the Central Government of India in terms of section 143(11) of the Act, we give in the Annexure A statement on the matters specified in paragraphs 3 and 4 of the Order.
19. Further to our comments in Annexure A, as required by section 143(3) of the Act, based on our audit, we report, to the extent applicable, that:
a) we have sought and obtained all the information and explanations which to the best of our knowledge and belief were necessary for the purpose of our audit of the accompanying standalone financial statements;
b) in our opinion, proper books of account as required by law have been kept by the Company so far as it appears from our examination of those books;
c) the standalone financial statements dealt with by this report are in agreement with the books of account;
d) in our opinion, the aforesaid standalone financial statements comply with Ind AS specified under section 133 of the Act;
e) on the basis of the written representations received from the directors and taken on record by the Board of Directors, none of the directors is disqualified as on 31 March 2020 from being appointed as a director in terms of section 164(2) of the Act;
f ) we have also audited the internal financial controls with reference to financial statements of the Company as on 31 March 2020 in conjunction with our audit of the standalone financial statements of the Company for the year ended on that date and our report dated
Independent Auditor’s Report (Contd.)

90
Corporate Overview Statutory Reports Financial Statements
25 June 2020 as per Annexure B expressed unmodified opinion; and
g) with respect to the other matters to be included in the Auditor’s Report in accordance with rule 11 of the Companies (Audit and Auditors) Rules, 2014 (as amended), in our opinion and to the best of our information and according to the explanations given to us:
i. the Company, as detailed in note 35 to the standalone financial statements, has disclosed the impact of pending litigations on its financial position as at 31 March 2020;
ii. the Company did not have any long-term contracts including derivative contracts for which there were any
material foreseeable losses as at 31 March 2020;
iii. there has been no delay in transferring amounts, required to be transferred, to the Investor Education and Protection Fund by the Company during the year ended 31 March 2020; and
iv. the disclosure requirements relating to holdings as well as dealings in specified bank notes were applicable for the period from 8 November 2016 to 30 December 2016, which are not relevant to these standalone financial statements. Hence, reporting under this clause is not applicable.
For Walker Chandiok & Co LLPChartered Accountants
Firm’s Registration No.: 001076N/N500013
Manish AgrawalPartner
Place: Ghaziabad Membership No.: 507000Date: 25 June 2020 UDIN: 20507000AAAABN8979
Independent Auditor’s Report (Contd.)

91
Annual Report2019-2020
Annexure A to the Independent Auditor’s Report
Based on the audit procedures performed for the purpose of reporting a true and fair view on the financial statements of the Company and taking into consideration the information and explanations given to us and the books of account and other records examined by us in the normal course of audit, and to the best of our knowledge and belief, we report that:
(i) (a) The Company has maintained proper records showing full particulars, including quantitative details and situation of fixed assets comprising ‘property, plant and equipment’, ‘capital work-in-progress’, and ‘other intangible assets’.
(b) The fixed assets comprising ‘property, plant and equipment’ and ‘capital work-in-progress’ have been physically verified by the management during the year and no material discrepancies were noticed on such verification. In our opinion, the frequency of verification of the fixed assets is reasonable having regard to the size of the Company and the nature of its assets.
(c) The title deeds of all the immovable properties (which are included under the head ‘Property, plant and equipment’) are held in the name of the Company. In respect of immovable properties in the nature of land, buildings and “plant and machinery”, that have been taken on lease and disclosed under the head right-of-use assets in the standalone financial statements, the lease agreements are in the name of the Company, where the Company is the lessee as per the lease agreement.
(ii) In our opinion, the management has conducted physical verification of inventory at reasonable intervals during the year, except for goods-in-transit. Material discrepancies noticed on such verification have been properly dealt with in the books of account.
(iii) The Company has not granted any loan, secured or unsecured to companies, firms, Limited Liability Partnerships (LLPs) or other parties covered in the
register maintained under Section 189 of the Act. Accordingly, the provisions of clauses 3(iii)(a), 3(iii)(b) and 3(iii)(c) of the Order are not applicable.
(iv) In our opinion, the Company has complied with the provisions of Sections 185 and 186 of the Act in respect of loans, investments and guarantees. Further, in our opinion, the Company has not entered into any transaction covered under Section 185 and Section 186 of the Act in respect of security.
(v) In our opinion, the Company has not accepted any deposits within the meaning of Sections 73 to 76 of the Act and the Companies (Acceptance of Deposits) Rules, 2014 (as amended). Accordingly, the provisions of clause 3(v) of the Order are not applicable.
(vi) We have broadly reviewed the books of account maintained by the Company pursuant to the Rules made by the Central Government for the maintenance of cost records under sub-section (1) of Section 148 of the Act in respect of Company’s products and are of the opinion that, prima facie, the prescribed accounts and records have been made and maintained. However, we have not made a detailed examination of the cost records with a view to determine whether they are accurate or complete.
(vii) (a) Undisputed statutory dues including provident fund, employees’ state insurance, income-tax, sales-tax, service tax, duty of customs, duty of excise, value added tax, cess and other material statutory dues, as applicable, have generally been regularly deposited to the appropriate authorities, though there has been a slight delay in a few cases. Further, no undisputed amounts payable in respect thereof were outstanding at the year-end for a period of more than six months from the date they became payable.
(b) The dues outstanding in respect of income-tax, sales-tax, service-tax, duty of customs, duty of excise and value added tax on account of any dispute, are as follows:

92
Corporate Overview Statutory Reports Financial Statements
Statement of Disputed Dues
Name of the statute
Nature of dues
Amount (` in lacs)
Amount paid under Protest
(` in lacs)
Period to which the amount relates (FY)
Forum where dispute is pending
Central Excise Act, 1944
Excise duty 9.80 - 2013-14 Appellate authority tillCommissioner level
Central Excise Act, 1944
Service tax 53.09 3.98 2010-11 to 2014-15
Customs Excise and Service Tax Appellate Tribunal
Central Excise Act, 1944
Service tax 49.25 3.69 2015-16 to 2016-17
Customs Excise and Service Tax Appellate Tribunal
Central Excise Act, 1944
Excise duty 114.90 - 2014-15 to 2017-18
Customs Excise and Service Tax Appellate Tribunal
Central Excise Act, 1944
Excise duty 4.02 - 2016-17 Customs Excise and Service Tax Appellate Tribunal
Central Excise Act, 1944
Excise duty 24.29 - 2014-15 to 2017-18
Appellate authority tillCommissioner level
Central Excise Act, 1944
Excise duty 15.04 - 2014-15 to 2017-18
Appellate authority tillCommissioner level
Central Excise Act, 1944
Excise duty 64.81 - 2014-15 to 2017-18
Appellate authority tillCommissioner level
Customs Act, 1962
Custom duty 98.45 14.41 2011-12 to 2014-15
Appellate authority tillCommissioner level
Customs Act, 1962
Custom duty 2.81 - 2015-16 Customs Excise and Service Tax Appellate Tribunal
Customs Act, 1962
Custom duty 4.54 - 2014-15 Customs Excise and Service Tax Appellate Tribunal
The Rajasthan Value Added Tax Act, 2003
Value added tax
1.87 - 2012-13 Appellate Tribunal
Goods and Services Tax, 2017
Goods and Services Tax
4.77 0.48 2018-19 Commissioner (Appeals)
Income-tax Act, 1961
Income tax 3.70 3.70 2011-12 Income Tax Appellate Tribunal
Annexure A to the Independent Auditor’s Report (Contd.)
(viii) The Company has not defaulted in repayment of loans or borrowings to any banks and financial institution during the year. The Company did not have any outstanding debentures or dues to government during the year.
(ix) The Company did not raise moneys by way of initial public offer or further public offer (including debt instruments). In our opinion, the term loans were applied for the purposes for which the loans were obtained, though idle funds which were not required for immediate utilisation have been invested in liquid investments, payable on demand.
(x) No fraud by the Company or on the Company by its officers or employees has been noticed or reported during the period covered by our audit.
(xi) Managerial remuneration has been provided by the Company in accordance with the requisite approvals mandated by the provisions of Section 197 of the Act read with Schedule V to the Act.
(xii) In our opinion, the Company is not a Nidhi Company. Accordingly, provisions of clause 3(xii) of the Order are not applicable.

93
Annual Report2019-2020
(xiii) In our opinion all transactions with the related parties are in compliance with Sections 177 and 188 of Act, where applicable, and the requisite details have been disclosed in the financial statements etc., as required by the applicable Ind AS.
(xiv) During the year, the Company has not made any preferential allotment or private placement of shares or fully or partly convertible debentures.
(xv) In our opinion, the Company has not entered into any non-cash transactions with the directors or persons connected with them covered under Section 192 of the Act.
(xvi) The Company is not required to be registered under Section 45-IA of the Reserve Bank of India Act, 1934.
Annexure A to the Independent Auditor’s Report (Contd.)
For Walker Chandiok & Co LLPChartered Accountants
Firm’s Registration No.: 001076N/N500013
Manish AgrawalPartner
Place: Ghaziabad Membership No.: 507000Date: 25 June 2020 UDIN: 20507000AAAABN8979

94
Corporate Overview Statutory Reports Financial Statements
Annexure B to the Independent Auditor’s Report
Independent Auditor’s Report on the internal financial controls with reference to the standalone financial statements under Clause (i) of Sub-section 3 of Section 143 of the Companies Act, 2013 (‘the Act’)
1. In conjunction with our audit of the standalone financial statements of Gravita India Limited (‘the Company’) as at and for the year ended 31 March 2020, we have audited the internal financial controls with reference to financial statements of the Company as at that date.
Responsibilities of Management and Those Charged with Governance for Internal Financial Controls
2. The Company’s Board of Directors is responsible for establishing and maintaining internal financial controls based on the internal financial controls with reference to financial statements criteria established by the Company considering the essential components of internal control stated in the Guidance Note on Audit of Internal Financial Controls over Financial Reporting (‘the Guidance Note’)issued by the Institute of Chartered Accountants of India (‘ICAI’). These responsibilities include the design, implementation and maintenance of adequate internal financial controls that were operating effectively for ensuring the orderly and efficient conduct of the Company’s business, including adherence to the Company’s policies, the safeguarding of its assets, the prevention and detection of frauds and errors, the accuracy and completeness of the accounting records, and the timely preparation of reliable financial information, as required under the Act.
Auditor’s Responsibility for the Audit of the Internal Financial Controls with Reference to Financial Statements
3. Our responsibility is to express an opinion on the Company’s internal financial controls with reference to financial statements based on our audit. We conducted our audit in accordance with the Standards on Auditing issued by the ICAI prescribed under Section 143(10) of the Act, to the extent applicable to an audit of internal financial controls with reference to financial statements, and the Guidance Note issued by the ICAI. Those Standards and the Guidance Note require that we comply with ethical requirements and plan and perform the audit to obtain reasonable assurance about whether adequate internal financial controls
with reference to financial statements were established and maintained and if such controls operated effectively in all material respects.
4. Our audit involves performing procedures to obtain audit evidence about the adequacy of the internal financial controls with reference to financial statements and their operating effectiveness. Our audit of internal financial controls with reference to financial statements includes obtaining an understanding of such internal financial controls, assessing the risk that a material weakness exists, and testing and evaluating the design and operating effectiveness of internal control based on the assessed risk. The procedures selected depend on the auditor’s judgement, including the assessment of the risks of material misstatement of the financial statements, whether due to fraud or error.
5. We believe that the audit evidence we have obtained is sufficient and appropriate to provide a basis for our audit opinion on the Company’s internal financial controls with reference to financial statements.
Meaning of Internal Financial Controls with Reference to Financial Statements
6. A company’s internal financial controls with reference to financial statements is a process designed to provide reasonable assurance regarding the reliability of financial reporting and the preparation of financial statements for external purposes in accordance with generally accepted accounting principles. A company’s internal financial controls with reference to financial statements include those policies and procedures that (1) pertain to the maintenance of records that, in reasonable detail, accurately and fairly reflect the transactions and dispositions of the assets of the company; (2) provide reasonable assurance that transactions are recorded as necessary to permit preparation of financial statements in accordance with generally accepted accounting principles, and that receipts and expenditures of the company are being made only in accordance with authorisations of management and directors of the company; and (3) provide reasonable assurance regarding prevention or timely detection of unauthorised acquisition, use, or disposition of the company’s assets that could have a material effect on the financial statements.

95
Annual Report2019-2020
For Walker Chandiok & Co LLPChartered Accountants
Firm’s Registration No.: 001076N/N500013
Manish AgrawalPartner
Place: Ghaziabad Membership No.: 507000Date: 25 June 2020 UDIN: 20507000AAAABN8979
Annexure B to the Independent Auditor’s Report (Contd.)
Inherent Limitations of Internal Financial Controls with Reference to Financial Statements
7. Because of the inherent limitations of internal financial controls with reference to financial statements, including the possibility of collusion or improper management override of controls, material misstatements due to error or fraud may occur and not be detected. Also, projections of any evaluation of the internal financial controls with reference to financial statements to future periods are subject to the risk that the internal financial controls with reference to financial statements may become inadequate because of changes in
conditions, or that the degree of compliance with the policies or procedures may deteriorate.
Opinion
8. In our opinion, the Company has, in all material respects, adequate internal financial controls with reference to financial statements and such controls were operating effectively as at 31 March 2020, based on the internal control over financial reporting criteria established by the Company considering the essential components of internal control stated in the Guidance Note issued by the ICAI.

96
Corporate Overview Statutory Reports Financial Statements
(All amounts in ` lacs, unless otherwise stated)
Standalone Balance SheetAs at March 31, 2020
The accompanying summary of significant accounting policies and other explanatory information are an integral part of the standalone financial statements.This is the Standalone Balance Sheet referred to in our report of even date.For Walker Chandiok & Co. LLP For and on behalf of the Board of DirectorsChartered AccountantsFirm’s Registration No.: 001076N/N500013
Manish Agrawal Rajat Agrawal Yogesh Malhotra Dr. M. P. AgarwalPartner Managing Director Whole Time Director & CEO ChairmanMembership No: 507000 DIN: 00855284 DIN: 05332393 DIN: 00188179
Sunil Kansal Nitin GuptaDate: June 25, 2020 Chief Financial Officer Company SecretaryPlace : Ghaziabad Place : Jaipur Membership No: FCS 9984
Particulars Note As at March 31, 2020 As at March 31, 2019I. ASSETS
Non - current assetsProperty, plant and equipment 2 10,890.21 10,620.46 Capital work-in-progress 3 281.46 943.19 Right-of-use assets 4 798.68 -Other intangible assets 5 55.61 92.94 Financial assets
- Investments 6(I) 1,050.34 1,430.34 - Loans 7 853.23 596.29 - Others financial assets 8 1.26 1.26
Other non-current assets 9 79.84 507.72 Total non-current assets 14,010.63 14,192.20
Current assetsInventories 10 15,408.58 13,290.00 Financial assets
- Investments 6(II) 443.04 919.93 - Trade receivables 11 6,158.58 10,666.70 - Cash and cash equivalents 12 84.54 387.15 - Bank balances other than above 13 640.85 652.72 - Loans 7 27.79 92.17 - Others financial assets 8 1,439.47 1,035.68
Current tax assets (net) 4.49 59.35 Other current assets 9 9,753.13 7,163.95
Total current assets 33,960.47 34,267.65 TOTAL ASSETS 47,971.10 48,459.85
II. EQUITY AND LIABILITIESEquityEquity share capital 14 1,380.76 1,374.93 Other equity 15 15,034.41 13,565.86 Total equity 16,415.17 14,940.79 LiabilitiesNon-current liabilitiesFinancial liabilities
- Borrowings 16 3,000.02 1,227.68 - Lease liabilities 17 260.87 -
Provisions 18 321.73 260.64 Deferred tax liabilities (net) 19 61.13 126.06 Total non-current liabilities 3,643.75 1,614.38 Current liabilitiesFinancial liabilities
- Borrowings 16 18,423.16 19,485.74 - Lease liabilities 17 114.97 -- Trade payables 20 -Total outstanding due of micro and small enterprises 138.24 72.18 Total outstanding due of creditors other than micro and small enterprises 7,649.28 10,712.51
- Other financial liabilities 21 1,314.51 936.55 Other current liabilities 22 191.82 496.97 Provisions 18 39.93 35.44 Current tax liabilities (net) 40.27 165.29
Total current liabilities 27,912.18 31,904.68 Total liabilities 31,555.93 33,519.06
TOTAL EQUITY AND LIABILITIES 47,971.10 48,459.85

97
Annual Report2019-2020
For Walker Chandiok & Co. LLP For and on behalf of the Board of DirectorsChartered AccountantsFirm’s Registration No.: 001076N/N500013
Manish Agrawal Rajat Agrawal Yogesh Malhotra Dr. M. P. AgarwalPartner Managing Director Whole Time Director & CEO ChairmanMembership No: 507000 DIN: 00855284 DIN: 05332393 DIN: 00188179
Sunil Kansal Nitin GuptaDate: June 25, 2020 Chief Financial Officer Company SecretaryPlace : Ghaziabad Place : Jaipur Membership No: FCS 9984
(All amounts in ` lacs, unless otherwise stated)
Standalone Statement of Profit and LossFor the year ended March 31, 2020
Particulars Note For the year ended March 31, 2020
For the year ended March 31, 2019
I IncomeRevenue from operations 23 117,239.18 105,935.55 Other income 24 275.85 1,212.58 Total income (I) 117,515.03 107,148.13
II ExpensesCost of materials consumed 25 89,063.67 85,071.12 Purchases of traded goods 26 12,112.41 6,817.56 Changes in inventories of finished goods, work-in-progress and traded goods
27 720.46 1,438.50
Employee benefits expense 28 4,375.26 4,496.99 Finance costs 29 2,454.57 2,080.62 Depreciation and amortisation expense 30 860.69 683.52 Other expenses 31 4,728.10 4,150.07 Total expenses (II) 114,315.16 104,738.38
III Profit before exceptional items and tax (I - II) 3,199.87 2,409.75 IV Exceptional items 32 381.86 -V Profit before tax (III - IV) 2,818.01 2,409.75 VI Tax expense 33
- Current tax (including earlier years) 610.23 471.03 - Deferred tax (credit)/ charge (35.36) 43.43 Total tax expense 574.87 514.46
VII Profit for the year (V - VI) 2,243.14 1,895.29 VIII Other comprehensive income
Items that will not be reclassified to profit or lossRemeasurements of the defined benefit liabilities (3.66) (3.63)Income tax on above items 1.28 1.27
Items that will be reclassified to profit or lossChange in fair value of hedging instruments (80.97) 0.73 Income tax on above items 28.29 (0.26)
Total other comprehensive income, net of tax (55.06) (1.89)IX Total comprehensive income for the year (VII + VIII) 2,188.08 1,893.40 X Earnings per share 36
Basic 3.25 2.76 Diluted 3.25 2.75
The accompanying summary of significant accounting policies and other explanatory information are an integral part of the standalone financial statements.
This is the Standalone Statement of Profit and Loss referred to in our report of even date.

98
Corporate Overview Statutory Reports Financial Statements
(All amounts in ` lacs, unless otherwise stated)
Standalone Cash Flow StatementFor the year ended March 31, 2020
Particulars For the year ended March 31, 2020
For the year ended March 31, 2019
A. Cash flow from operating activitiesProfit before tax 2,818.01 2,409.75 Adjustments for:
Depreciation and amortisation expense 860.69 683.52 Lease hold land amortisation - 5.22 Loss on sale/discard of property, plant and equipment 1.18 28.57 Finance cost 2,454.57 2,080.62 Incentive income (1,569.28) (929.28)Corporate guarantee expenses 12.55 23.67 Corporate guarantee income (12.30) -Interest income on bank deposits (36.88) (36.07)Interest income on income tax refund - (2.99)Interest income on others (61.15) (59.92)Expenditure on share-based payments to employees - 40.48 Dividend income - (636.09)Liabilities/ provisions no longer required written back (22.32) (43.36)Allowance for expected credit loss on financial assets (including write off )
378.77 163.26
Loss on sale/discard of investment - Exceptional item 381.86 - 2,387.69 1,317.63
Operating profit before working capital changes 5,205.70 3,727.38 Changes in working capital:Adjustments for changes in operating assets:
Inventories (2,118.58) (799.60)Trade receivables 4,214.84 (240.18)Other current and non-current assets (1,012.99) (2,242.92)Other current financials assets (403.79) 26.90 Current and non-current loans 0.45 (110.31)
Adjustments for change in operating liabilities:Trade payables (2,974.85) 5,247.16 Other current financials liabilities 2.74 1.26 Other current liabilities (305.15) 246.18 Current and non-current provisions 61.91 53.14
(2,535.42) 2,181.63 Cash generated from operations 2,670.28 5,909.01 Income tax paid (net of refunds) (680.39) (498.27)Net cash flow from operating activities (A) 1,989.89 5,410.74
B. Cash flow from investing activitiesCapital expenditure on property, plant and equipment and intangible assets (adjusted for suppliers payable and capital work-in-progress including capital advances)
(367.19) (2,715.64)
Proceeds from sale of property, plant and equipment 21.92 34.94 Movement in current investments (net) 467.48 (702.50)Loans given to related parties (222.97) (181.67)Interest received 41.06 98.98 Movement in bank balances not considered as cash and cash equivalents
13.31 81.00
Net cash (used in) investing activities (B) (46.39) (3,384.89)

99
Annual Report2019-2020
(All amounts in ` lacs, unless otherwise stated)
Standalone Cash Flow Statement (Contd.)For the year ended March 31, 2020
Particulars For the year ended March 31, 2020
For the year ended March 31, 2019
C. Cash flow from financing activitiesProceeds from issue of equity shares 5.83 0.84 Proceeds from non-current borrowings 2,928.15 600.00 Repayment of non-current borrowings (807.04) (629.73)(Repayment of )/ proceeds from current borrowings (net) (1,143.55) 927.63 Payment of lease liabilities (79.04) -Finance cost paid (including in relation to lease liabilities) (2,437.83) (2,126.72)Dividends including corporate dividend tax paid (712.63) (580.18)
Net cash (used in) financing activities (C) (2,246.11) (1,808.16)Net (decrease) / increase in cash and cash equivalents (A+B+C)
(302.61) 217.69
Cash and cash equivalents at the beginning of the year 387.15 169.46 Cash and cash equivalents at the end of the year (refer note 12)
84.54 387.15
The above Standalone Cash Flow Statement has been prepared under the “Indirect Method” as set out in the Ind AS 7, ‘Statement of Cash flow’.
The accompanying summary of significant accounting policies and other explanatory information are an integral part of the standalone financial statements.
This is the Standalone Cash Flow Statement referred to in our report of even date.
For Walker Chandiok & Co. LLP For and on behalf of the Board of DirectorsChartered AccountantsFirm’s Registration No.: 001076N/N500013
Manish Agrawal Rajat Agrawal Yogesh Malhotra Dr. M. P. AgarwalPartner Managing Director Whole Time Director & CEO ChairmanMembership No: 507000 DIN: 00855284 DIN: 05332393 DIN: 00188179
Sunil Kansal Nitin GuptaDate: June 25, 2020 Chief Financial Officer Company SecretaryPlace : Ghaziabad Place : Jaipur Membership No: FCS 9984

100
Corporate Overview Statutory Reports Financial Statements
Standalone Statement of Changes in EquityFor the year ended March 31, 2020
(All amounts in ` lacs, unless otherwise stated)(a) Equity share capital (refer note 14)
Particulars Balance as at April 1, 2018
Changes during the FY
18-19
Balance as at March 31, 2019
Changes duringthe FY
19-20
Balance as at March 31, 2020
Equity share capital 1,374.09 0.84 1,374.93 5.83 1,380.76
(b) Other equity (refer note 15)
Particulars
Reserves and surplus
Securitiespremium
Generalreserve
Share options Outstanding
account
Retained earnings
Cash flow
hedging reserve
Total
Balance as at April 1, 2018 4,159.58 517.90 70.01 7,464.67 - 12,212.16 Profit for the year - - - 1,895.29 - 1,895.29 Other comprehensive income, net of tax - - - (2.36) 0.47 (1.89)Total comprehensive income for the year - - - 1,892.93 0.47 1,893.40 Issue of equity shares (refer note 44) 13.86 - (13.86) - - -Equity dividend paid (including tax thereon) - - - (580.18) - (580.18)Employee share-based expenses - - 40.48 - - 40.48 Balance as at March 31, 2019 4,173.44 517.90 96.63 8,777.42 0.47 13,565.86 Profit for the year - - - 2,243.14 - 2,243.14 Other comprehensive income, net of tax - - - (2.38) (52.68) (55.06)Total comprehensive income for the year - - - 2,240.76 (52.68) 2,188.08 Issue of equity shares (refer note 44) 96.63 - (96.63) - - -Equity dividend paid (including tax thereon) - - - (207.11) - (207.11)Interim equity dividend paid (including tax thereon)
- - - (505.52) - (505.52)
Adjustment on adoption of Ind AS-116 (refer note 17)
- - - (6.90) - (6.90)
Balance as at March 31, 2020 4,270.07 517.90 - 10,298.65 (52.21) 15,034.41
The accompanying summary of significant accounting policies and other explanatory information are an integral part of the standalone financial statements.
This is the Standalone Statement of Changes in Equity referred to in our report of even date.
For Walker Chandiok & Co. LLP For and on behalf of the Board of DirectorsChartered AccountantsFirm’s Registration No.: 001076N/N500013
Manish Agrawal Rajat Agrawal Yogesh Malhotra Dr. M. P. AgarwalPartner Managing Director Whole Time Director & CEO ChairmanMembership No: 507000 DIN: 00855284 DIN: 05332393 DIN: 00188179
Sunil Kansal Nitin GuptaDate: June 25, 2020 Chief Financial Officer Company SecretaryPlace : Ghaziabad Place : Jaipur Membership No: FCS 9984

101
Annual Report2019-2020
Summary of the significant accounting policies and other explanatory information (Contd.)For the year ended March 31, 2020
Note 1 - Corporate information, statement of compliance with Ind AS, basis of preparation and summary of significant accounting policies
(A) Corporate Information
Gravita India Limited (the ‘Company’) is a public limited Company domiciled and incorporated under the provisions of the Companies Act, 1956 applicable in India. The Company’s equity shares are listed at the Bombay Stock Exchange (BSE) and the National Stock Exchange (NSE). The registered office of the Company is situated at “Saurabh”, Chittora Road, Harsulia Mod, Diggi-Malpura Road, Tehsil-Phagi, Jaipur-303904 and having principal place of business in Jaipur (Rajasthan), Gujarat and Chittoor (Andhra Pradesh).
The Principal activities of the Company are - Lead processing, Aluminium processing, trade (Lead products and Aluminium scrap) and dealing in Turn-key Lead recycling projects. The Company carries out smelting of Lead battery scrap / Lead concentrate to produce secondary Lead metal, which is further transformed into Pure Lead, Specific Lead Alloy, Lead Oxides (Lead sub-oxide, Red Lead, and Litharge) and Lead products like Lead sheets, Lead powder, Lead shot etc. Further, Company has also entered in the PET product manufacturing.
These financial statements for the year ended March 31, 2020 are approved and adopted by the Board of Directors in their meeting held on June 25, 2020. The revision to financial statements is permitted by Board of Directors after obtaining necessary approvals or at the instance of regulatory authorities as per provisions of Companies Act, 2013.
(B) Statement of compliance with Ind AS and basis of preparation
These financial statements have been prepared in accordance with the Indian Accounting Standards (hereinafter referred to as the ‘Ind AS’) as notified by Ministry of Corporate Affairs pursuant to section 133 of the Companies Act, 2013.
These financial statements are separate financial statements of the Company. The Company has also prepared consolidated financial statements for the year ended March 31, 2020 in accordance with Ind AS 110 and the same were also approved for issue by the Board of Directors on June 25, 2020. The financial statements have been prepared on accrual and going concern basis.
The financial statements have been prepared under historical cost convention basis except for the following –
• Certainfinancialassetswhicharemeasuredatfairvalue;
• Definedbenefitplans–planassetsmeasuredatfairvalue;
Further, certain financial assets and financial liabilities are measured at fair value and are categorised into level 1, level 2 and level 3 based on the degree to which the inputs to the fair value measurements are observable.
(C) Significant accounting policies
I. Current versus non-current classification
The Company presents assets and liabilities in the balance sheet based on current/ non-current classification.
An asset is treated as current when it is:
• Expectedtoberealisedorintendedtobesoldorconsumedinnormaloperatingcycle,
• Heldprimarilyforthepurposeoftrading,
• Expectedtoberealisedwithintwelvemonthsafterthereportingperiod,or
• Cashorcashequivalentunlessrestrictedfrombeingexchangedorusedtosettlealiabilityforatleasttwelve months after the reporting period.
A liability is current when:
• Itisexpectedtobesettledinnormaloperatingcycle,
• Itisheldprimarilyforthepurposeoftrading,
• Itisduetobesettledwithintwelvemonthsafterthereportingperiod,or
• Thereisnounconditionalrighttodeferthesettlementoftheliabilityforatleasttwelvemonthsafterthe reporting period
Deferred tax assets and liabilities are classified as non-current assets and liabilities.

102
Corporate Overview Statutory Reports Financial Statements
Based on the nature of products and the time between acquisition of assets for processing and their realisation in cash and cash equivalents, the Company has ascertained its operating cycle as 12 months for the purpose of current or non-current classification of assets and liabilities.
II. Property, plant and equipment
Recognition and initial measurement
Property, plant and equipment are stated at their cost of acquisition or construction. Following initial recognition, property plant and equipment are carried at cost less any accumulated depreciation and accumulated impairment losses, if any. The cost comprises purchase price, borrowing cost if capitalisation criteria are met and directly attributable cost of bringing the asset to its working condition for the intended use. Any trade discount and rebates are deducted in arriving at the purchase price.
Subsequent costs are included in the asset’s carrying amount or recognised as a separate asset, as appropriate, only when it is probable that future economic benefits associated with the item will flow to the entity and the cost can be measured reliably. All other repair and maintenance costs are recognised in the Statement of Profit and Loss as incurred.
Subsequent measurement (depreciation and useful lives)
Depreciation on property, plant and equipment is provided on the straight-line method computed on the basis of the useful life prescribed under Schedule II of the Companies Act, 2013. The following useful life of assets has been taken by the Company:
Tangible assets* Useful lifeBuildings – factory and non-factory 5 - 60 years
Plant and equipment 15 years
Furniture and fixtures 10 years
Vehicles 8 years
Computer and accessories 3- 6 years
Office equipment 5 years
*Freehold land is measured at cost and is not depreciated.
Property, plant and equipment costing upto ` 5,000 each are fully depreciated in the year of purchase.
Where, during any financial year, any addition has been made to any asset, or where any asset has been sold, discarded, demolished or destroyed, or significant components replaced; depreciation on such assets is calculated on a pro rata basis as individual assets with specific useful life from the month of such addition or, as the case may be, up to the month on which such asset has been sold, discarded, demolished or destroyed or replaced.
The estimated useful lives and methods of depreciation of property, plant and equipment are reviewed at each financial year end and adjusted prospectively, if appropriate.
De-recognition
An item of property, plant and equipment or any significant part initially recognised of such item of property plant and equipment is derecognised upon disposal or when no future economic benefits are expected from its use or disposal. Any gain or loss arising on de-recognition of the asset (calculated as the difference between the net disposal proceeds and the carrying amount of the asset) is included in the income statement when the asset is derecognised.
Capital work-in-progress are assets which are not yet ready for their intended use are carried at cost comprising direct cost, related incidental expenses and attributable interest.
III. Intangible assets
Recognition and initial measurement
Intangible assets acquired separately are measured on initial recognition at cost. Following initial recognition, intangible assets are carried at cost less any accumulated amortization and accumulated impairment losses, if any.
Summary of the significant accounting policies and other explanatory information (Contd.)For the year ended March 31, 2020

103
Annual Report2019-2020
Subsequent measurement (amortisation and useful lives)
All finite-lived intangible assets are amortised on a straight-line basis over their estimated useful lives. The estimated useful life of an identifiable intangible asset is based on a number of factors including the effects of obsolescence, demand, competition, and other economic factors (such as the stability of the industry, and known technological advances), and the level of maintenance expenditures required to obtain the expected future cash flows from the asset.
Residual values and useful lives are reviewed at each reporting date. The following useful lives are applied:
Intangible Assets Useful life (in years)Software 3-5 years
De-recognition
Gains or losses arising from derecognition of an intangible asset are measured as the difference between the net disposal proceeds and the carrying amount of the asset and are recognised in the Statement of Profit or Loss when the asset is derecognised.
IV. Impairment of non-financial assets
For impairment assessment purposes, assets are grouped at the lowest levels for which there are largely independent cash inflows (cash generating units). As a result, some assets are tested individually for impairment and some are tested at cash-generating unit level.
The Company assesses at each balance sheet date whether there is any indication that an asset may be impaired. If any such indication exists, the Company estimates the recoverable amount of the asset. If such recoverable amount of the asset or the recoverable amount of the cash generating unit to which the asset belongs is less than its carrying amount, the carrying amount is reduced to its recoverable amount. The reduction is treated as an impairment loss and is recognized in the Statement of Profit and Loss. If at the balance sheet date, there is an indication that a previously assessed impairment loss no longer exists then the recoverable amount is reassessed and the asset is reflected at the recoverable amount subject to a maximum of depreciated historical cost. Impairment losses previously recognised are accordingly reversed in the Statement of Profit and Loss.
To determine value-in-use, management estimates expected future cash flows from each cash generating unit and determines a suitable discount rate in order to calculate the present value of those cash flows. The data used for impairment testing procedures are directly linked to the Company’s latest approved budget, adjusted as necessary to exclude the effects of future re-organisations and asset enhancements. Discount factors are determined individually for each cash-generating unit and reflect current market assessment of the time value of money and asset-specific risk factors.
V. Borrowing costs
Borrowing costs directly attributable to the acquisition, construction or production of a qualifying asset are capitalised during the period of time that is necessary to complete and prepare the asset for its intended use. Borrowing costs consist of interest calculated using the effective interest method that an entity incurs in connection with the borrowing of funds. Borrowing cost also includes exchange differences to the extent regarded as an adjustment to the borrowing costs.
All other borrowing costs are charged to the Statement of Profit and Loss as incurred.
VI. Inventories
Inventories are valued at cost or net realisable value, whichever is lower. The basis of determining the cost for various categories of inventory are as follows:
a) Raw materials and stores and spares: Cost includes cost of purchase and other costs incurred in bringing the inventories to their present location and condition. Cost is determined on moving weighted average basis.
b) Stock in process and finished goods: Direct cost plus appropriate share of overheads and excise duty, wherever applicable.
c) Traded goods: Purchase cost and other overheads incurred to bring the goods to their present location.
d) By products: At estimated realisable value.
Summary of the significant accounting policies and other explanatory information (Contd.)For the year ended March 31, 2020

104
Corporate Overview Statutory Reports Financial Statements
Net realisable value is the estimated selling price in the ordinary course of business less any applicable selling expenses. Provision for obsolescence and slow moving inventory is made based on management’s best estimates of net realisable value of such inventories.
VII. Foreign Currency Translations
Functional and presentation currency
The financial statements are presented in Indian Rupees (INR) and are rounded to two decimal places of lacs, which is also the Company’s functional currency.
Transactions and balances
Transactions in foreign currencies are initially recorded by the Company at its functional currency spot rates at the date the transaction first qualifies for recognition.
Monetary assets and liabilities denominated in foreign currencies are translated at the functional currency spot rates of exchange at the reporting date. Exchange differences arising on settlement or translation of monetary items as at reporting date are recognised in profit or loss.
Non-monetary items that are measured in terms of historical cost in a foreign currency are translated using the exchange rates at the dates of the initial transactions.
VIII. Leases
Effective April 1, 2019, the Company adopted Ind AS 116 “Leases” and applied the standard to all lease contracts existing on April 1, 2019 using the modified retrospective method. The Company has recorded the lease liability at the present value of the lease payments discounted at the incremental borrowing at the date of initial application and right-of-use assets at its carrying amount as if the standard had been applied since the commencement date. Right of use asset has been adjusted for any prepaid or accrued lease payments that existed at the date of transition. The cumulative effect of adopting Ind AS 116 has been recognised in equity as an adjustment to the opening balance of retained earnings for the current period.
Comparatives as at and for the year ended March 31, 2019 have not been retrospectively adjusted.
The Company as a lessee
The Company’s lease asset classes primarily consist of leases for land, buildings and equipment. The Company assesses whether a contract contains a lease, at inception of a contract. A contract is, or contains, a lease if the contract conveys the right to control the use of an identified asset for a period of time in exchange for consideration. To assess whether a contract conveys the right to control the use of an identified asset, the Company assesses whether:
(i) the contract involves the use of an identified asset
(ii) the Company has substantially all of the economic benefits from use of the asset through the period of the lease and
(iii) the Company has the right to direct the use of the asset.
The Company at the commencement of the lease contract recognizes a right-of-use asset at cost and corresponding lease liability, except for leases with term of less than twelve months (short term leases) and low-value assets. For these short term and low value leases, the Company recognizes the lease payments as an operating expense on a straight-line basis over the lease term.
Certain lease arrangements include the options to extend or terminate the lease before the end of the lease term. Right-of-use assets and lease liabilities includes these options when it is reasonably certain that they will be exercised.
The cost of right-of-use asset comprises the amount of the initial measurement of the lease liability, any lease payments made at or before the inception date of the lease, plus any initial direct costs, less any lease incentives received. Subsequently, the right-of-use assets are measured at cost less any accumulated depreciation and impairment losses, if any. The right-of-use asset are depreciated using the straight-line method from the commencement date over the shorter of lease term or useful life of right-of-use asset.
The lease liability is initially measured at amortized cost at the present value of the future lease payments. The lease payments are discounted using the interest rate implicit in the lease or, if not readily determinable, using the incremental borrowing rates in the country of domicile of these leases. Lease liabilities are re-measured with a corresponding adjustment to the related right of use asset if the Company changes its assessment if whether it will exercise an extension or a termination option.
Summary of the significant accounting policies and other explanatory information (Contd.)For the year ended March 31, 2020

105
Annual Report2019-2020
IX. Fair value measurement
Fair value is the price that would be received to sell an asset or paid to transfer a liability in an orderly transaction between market participants at the measurement date. The fair value measurement is based on the presumption that the transaction to sell the asset or transfer the liability takes place either:
• Intheprincipalmarketfortheassetorliability,or
• Intheabsenceofaprincipalmarket,inthemostadvantageousmarketfortheassetorliability.
The principal or the most advantageous market must be accessible by the Company.
The fair value of an asset or a liability is measured using the assumptions that market participants would use when pricing the asset or liability, assuming that market participants act in their economic best interest.
A fair value measurement of a non-financial asset takes into account a market participant’s ability to generate economic benefits by using the asset in its highest and best use or by selling it to another market participant that would use the asset in its highest and best use.
Company uses valuation techniques that are appropriate in the circumstances and for which sufficient data are available to measure fair value, maximizing the use of relevant observable inputs and minimizing the use of unobservable inputs.
All assets and liabilities for which fair value is measured or disclosed in the financial results are categorized within the fair value hierarchy, described as follows, based on the lowest level input that is significant to the fair value measurement as a whole:
Level 1 — Quoted (unadjusted) market prices in active markets for identical assets or liabilities.
Level 2 — Valuation techniques for which the lowest level input that is significant to the fair value measurement is directly or indirectly observable.
Level 3 — Valuation techniques for which the lowest level input that is significant to the fair value measurement is Unobservable.
For assets and liabilities that are recognized in the financial statements on a recurring basis, the Company determines whether transfers have occurred between levels in the hierarchy by re-assessing categorization (based on the lowest level input that is significant to the fair value measurement as a whole) at the end of each reporting period or each case.
For the purpose of fair value disclosures, the Company has determined classes of assets and liabilities on the basis of the nature, characteristics and risks of the asset or liability and the level of the fair value hierarchy as explained above.
X. Revenue Recognition
To determine whether to recognise revenue, the Company follows a 5-step process:
1. Identifying the contract with a customer
2. Identifying the performance obligations
3. Determining the transaction price
4. Allocating the transaction price to the performance obligations
5. Recognising revenue when/as performance obligation(s) are satisfied.
Sale of products (including scrap sales and service income): Sales (including scrap sales) are recognised when control of products is transferred to the buyer as per the terms of the contract and are accounted for net of returns and rebates. Control of goods refers to the ability to direct the use of and obtain substantially all of the remaining benefits from goods. Sales, as disclosed, are exclusive of goods and services tax. Generally, control is transferred upon shipment of goods to the customer or when the goods is made available to the customer, provided transfer of title to the customer occurs and the Company has not retained any significant risks of ownership or future obligations with respect to the goods shipped.
Income in respect of service contracts are recognised in Statement of Profit and Loss on completion of performance obligation.
Summary of the significant accounting policies and other explanatory information (Contd.)For the year ended March 31, 2020

106
Corporate Overview Statutory Reports Financial Statements
The Company considers the terms of the contract and its customary business practices to determine the transaction price. The transaction price is the amount of consideration to which the Company expects to be entitled in exchange for transferring promised goods or services to a customer, excluding amounts collected on behalf of third parties (for example, indirect taxes). The consideration promised in a contract with a customer may include fixed consideration, variable consideration (if reversal is less likely in future), or both. No element of financing is deemed present as the sales are largely made on advance payment terms or with credit term of not more than one year.
The transaction price is allocated by the Company to each performance obligation (or distinct good or service) in an amount that depicts the amount of consideration to which it expects to be entitled in exchange for transferring the promised goods or services to the customer.
For each performance obligation identified, the Company determines at contract inception whether it satisfies the performance obligation over time or satisfies the performance obligation at a point in time.
The Company recognises contract liabilities for consideration received in respect of unsatisfied performance obligations and reports these amounts as other liabilities in the statement of financial position. Similarly, if the Company satisfies a performance obligation before it receives the consideration, the Company recognises either a contract asset or a receivable in its statement of financial position, depending on whether something other than the passage of time is required before the consideration is due.
Interest income: Interest income from a financial asset is recognised when it is probable that the economic benefit will flow to the Company and the amount of income can be measured reliably. Interest income is accrued on a time basis, by reference to the principal outstanding and at the effective rate applicable, which is the rate that discounts estimated future cash receipts through the expected life of the financial assets to that asset’s net carrying amount on initial recognition.
Profit/ (Loss) from partnership firms: Profit/ (Loss) from partnership firms which are in the same line of operation is considered as operating Income. The share of profit/ (loss) in partnership firm is recognised as income in the statement of profit and loss as and when the right to receive the profit/ (loss) share is established.
Job Work Income: Revenue from job work services is recognised based on the services rendered in accordance with the terms of contracts.
Dividend income: Dividend income is recognised at the time when right to receive the payment is established, which is generally when the shareholders approve the dividend.
XI. Non- current assets held for sale
An entity shall classify a non-current asset as held for sale if its carrying amount will be recovered principally through a sale transaction rather than through continuing use. This condition is regarded as met only when the asset is available for immediate sale in its present condition subject only to terms that are usual and customary for sale of such asset and its sale is highly probable. Management must be committed to sale which should be expected to qualify for recognition as a completed sale within one year from the date of classification.
Non-current assets classified as held for sale are presented separately and measured at the lower of their carrying amounts immediately prior to their classification as held for sale and their fair value less costs to sell. However, some held for sale assets such as financial assets, assets arising from employee benefits and deferred tax assets, continue to be measured in accordance with the Company’s relevant accounting policy for those assets. Once classified as held for sale, the assets are not subject to depreciation or amortisation.
XII. Financial Instruments
Initial measurement
Financial instruments are recognised when the Company becomes a party to the contractual provisions of the instrument and are measured initially at fair value adjusted for transaction costs, except for those carried at fair value through profit or loss which are measured initially at fair value.
If the Company determines that the fair value at initial recognition differs from the transaction price, the Company accounts for that instrument at that date as follows:
• Atthemeasurementbasismentionedaboveifthatfairvalueisevidencedbyaquotedpriceinanactivemarket for an identical asset or liability (i.e. a Level 1 input) or based on a valuation technique that uses only data from observable markets. The Company recognises the difference between the fair value at initial recognition and the transaction price as a gain or loss.
Summary of the significant accounting policies and other explanatory information (Contd.)For the year ended March 31, 2020
107
Annual Report2019-2020
• Inallothercases,atthemeasurementbasismentionedabove,adjustedtodeferthedifferencebetweenthefair value at initial recognition and the transaction price. After initial recognition, the Company recognises that deferred difference as a gain or loss only to the extent that it arises from a change in a factor (including time) that market participants would take into account when pricing the asset or liability.
Subsequent measurement of financial assets and financial liabilities is described below.
Financial assets
Classification and subsequent measurement
For the purpose of subsequent measurement, financial assets are classified into the following categories upon initial recognition:
a. Financial assets at amortised cost – A financial instrument is measured at amortised cost if both the following conditions are met:
• Theassetisheldwithinabusinessmodelwhoseobjectiveistoholdassetsforcollectingcontractualcash flows, and
• Contractualtermsoftheassetgiveriseonspecifieddatestocashflowsthataresolelypaymentsofprincipal and interest (SPPI) on the principal amount outstanding.
After initial measurement, such financial assets are subsequently measured at amortised cost using the effective interest method. Effective interest rate (EIR) is the rate that exactly discounts estimated future cash receipts through the expected life of the financial asset to the net carrying amount of the financial assets. The future cash flows include all other transaction costs paid or received, premiums or discounts if any, etc.
b. Financial assets at fair value
• Derivative assets - All derivative assets are measured at fair value through profit and loss (FVTPL).
• Investments in equity instruments (other than subsidiaries/ associates/ joint ventures) – All equity investments in scope of Ind AS 109 are measured at fair value. Equity instruments which are held for trading are generally classified at fair value through profit and loss (FVTPL). For all other equity instruments, the Company decides to classify the same either at fair value through other comprehensive income (FVOCI) or fair value through profit and loss (FVTPL). The Company makes such election on an instrument by instrument basis. The classification is made on initial recognition and is irrevocable.
If the Company decides to classify an equity instrument as at FVOCI, then all fair value changes on the instrument, excluding dividends, are recognised in the other comprehensive income (OCI). There is no recycling of the amounts from OCI to P&L, even on sale of investment. However, the Company may transfer the cumulative gain or loss within equity. Dividends on such investments are recognised in profit or loss unless the dividend clearly represents a recovery of part of the cost of the investment.
Equity instruments included within the FVTPL category are measured at fair value with all changes recognised in the Statement of Profit and Loss account.
De-recognition of financial assets
A financial asset is primarily de-recognised when the rights to receive cash flows from the asset have expired or the Company has transferred its rights to receive cash flows from the asset.
Financial liabilities
Subsequent measurement
After initial recognition, the financial liabilities, other than derivative liabilities, are subsequently measured at amortised cost using the effective interest method.
Amortised cost is calculated by considering any discount or premium on acquisition and fees or costs that are an integral part of the EIR. The effect of EIR amortisation is included as finance costs in the statement of profit and loss.
All derivative liabilities are measured at fair value through profit and loss (FVTPL).
Summary of the significant accounting policies and other explanatory information (Contd.)For the year ended March 31, 2020

108
Corporate Overview Statutory Reports Financial Statements
De-recognition of financial liabilities
A financial liability is de-recognised when the obligation under the liability is discharged or cancelled or expires. When an existing financial liability is replaced by another from the same lender on substantially different terms, or the terms of an existing liability are substantially modified, such an exchange or modification is treated as the de-recognition of the original liability and the recognition of a new liability. The difference in the respective carrying amounts is recognised in the statement of profit or loss.
Offsetting of financial instruments
Financial assets and financial liabilities are offset and the net amount is reported in the balance sheet if there is a currently enforceable legal right to offset the recognised amounts and there is an intention to settle on a net basis, to realize the assets and settle the liabilities simultaneously
XIII. Hedge accounting
The Company designates non derivative financial liabilities, such as foreign currency borrowings from banks, as hedging instruments for the hedge of foreign currency risk associated with highly probable forecasted transactions and, accordingly, applies cash flow hedge accounting for such relationships. At the inception of a hedge relationship, the Company formally designates and documents the hedge relationship to which the Company wishes to apply hedge accounting and the risk management objective and strategy for undertaking the hedge.
The documentation includes the Company’s risk management objective and strategy for undertaking hedge, the hedging/ economic relationship, the hedged item or transaction, the nature of the risk being hedged and how the entity will assess the effectiveness of changes in the hedging instrument’s fair value in offsetting the exposure to changes in the hedged item’s fair value or cash flows attributable to the hedged risk.
Such hedges are expected to be highly effective in achieving offsetting changes in fair value or cash flows and are assessed on an ongoing basis to determine that they actually have been highly effective throughout the financial reporting periods for which they were designated.
Hedges that meet the strict criteria for hedge accounting are accounted for, as described below:
Amounts recognised as other comprehensive income are transferred to profit or loss when the hedged transaction affects profit or loss, such as when the hedged financial income or financial expense is recognised or when a forecast transaction occurs. If the hedging instrument expires or is sold, terminated or exercised without replacement or rollover (as part of the hedging strategy), or if its designation as a hedge is revoked, or when the hedge no longer meets the criteria for hedge accounting, any cumulative gain or loss previously recognised in other comprehensive income remains separately in other equity until the forecast transaction occurs or the foreign currency firm commitment is met.
XIV. Impairment of financial assets
All financial assets except for those at FVTPL are subject to review for impairment at least at each reporting date to identify whether there is any objective evidence that a financial asset or a group of financial assets is impaired. Different criteria to determine impairment are applied for each category of financial assets.
In accordance with Ind-AS 109, the Company applies expected credit loss (ECL) model for measurement and recognition of impairment loss for financial assets carried at amortised cost.
ECL is the weighted average of difference between all contractual cash flows that are due to the Company in accordance with the contract and all the cash flows that the Company expects to receive, discounted at the original effective interest rate, with the respective risks of default occurring as the weights. When estimating the cash flows, the Company is required to consider:
• Allcontractualtermsofthefinancialassets(includingprepaymentandextension)overtheexpectedlifeofthe assets; and
• Cashflowsfromthesaleofcollateralheldorothercreditenhancementsthatareintegraltothecontractualterms.
Trade receivables
The Company applies approach permitted by Ind AS 109 Financial Instruments, which requires lifetime expected credit losses to be recognised upon initial recognition of receivables. Lifetime ECL are the expected credit losses resulting from all possible default events over the expected life of a financial instrument.
Summary of the significant accounting policies and other explanatory information (Contd.)For the year ended March 31, 2020

109
Annual Report2019-2020
The Company uses the expected credit loss model to assess any required allowances and uses a provision matrix to compute the expected credit loss allowance for trade receivables. Life time expected credit losses are assessed and accounted based on company’s historical collection experience for customers and forecast of macro-economic factors.
The Company defines default as an event when the financial asset is past due for more than 180 days. This definition is based on management’s expectation of the time period beyond which if a receivable is outstanding, it is an objective evidence of impairment.
The Company writes off trade receivables when there is no objective evidence that such amounts would not be recovered. Financial assets that are written-off are still subject to enforcement activity by the Company.
Other financial assets
For recognition of impairment loss on other financial assets and risk exposure, the Company determines whether there has been a significant increase in the credit risk since initial recognition. If the credit risk has not increased significantly since initial recognition, the Company measures the loss allowance at an amount equal to 12-month expected credit losses, else at an amount equal to the lifetime expected credit losses.
XV. Investment in subsidiaries and associates
In accordance with Ind AS 27 – Separate Financial Statements, investments in equity instruments of subsidiaries and associates can be measured at cost or at fair value in accordance with Ind AS 109. The Company has opted to measure such investments at cost at initial recognition.
Subsequently, such investments in subsidiaries and associates are carried at cost less accumulated impairment losses, if any. Where an indication of impairment exists, the carrying amount of the investment is assessed and written down immediately to its recoverable amount. On disposal of these investments, the difference between net disposal proceeds and the carrying amounts are recognised in the statement of profit and loss.
XVI. Cash Flow Statement
Cash flows are reported using the indirect method, whereby profit for the year is adjusted for the effects of transactions of a non-cash nature, any deferrals or accruals of past or future operating cash receipts or payments and item of income or expenses associated with investing or financing cash flows. The cash flows from operating, investing and financing activities of the Company are segregated. The Company considers all highly liquid investments that are readily convertible to known amounts of cash to be cash equivalents.
XVII. Post-employment, long term and short term employee benefits
The Company provides post-employment benefits through various defined contribution and defined benefit plans.
Defined Contribution plan
The Company makes contribution to statutory provident fund in accordance with Employees’ Provident Fund and Miscellaneous Provisions Act, 1952. The plan is a defined contribution plan and contribution paid or payable is recognized as an expense in the period in which services are rendered by the employee.
Defined benefit plan
The liability recognized in respect of gratuity is the present value of defined benefit obligation at the end of the reporting period less the fair value of plan assets. The Company makes contribution to the trust namely Gravita India Limited Employees Gratuity Trust for Employees Gratuity Scheme. The defined benefit obligation is calculated annually by actuary using the Projected Unit Credit Method. Re-measurement comprising actuarial gains and losses and return on plan assets (excluding net interest) are recognized in the other comprehensive income for the period in which they occur and are not reclassified to profit or loss.
Other long-term employee benefits
Liability in respect of compensated absences becoming due or expected to be availed more than one year after the balance sheet date is estimated on the basis of an actuarial valuation performed by an independent actuary using the projected unit credit method.
Actuarial gains and losses arising from past experience and changes in actuarial assumptions are charged to statement of profit and loss in the year in which such gains or losses are determined.
Summary of the significant accounting policies and other explanatory information (Contd.)For the year ended March 31, 2020

110
Corporate Overview Statutory Reports Financial Statements
Short term employee benefit
Expense in respect of other short-term benefits is recognized on the basis of amount paid or payable for the period during which services are rendered by the employees.
XVIII. Share based payments
Employees of the Company receive remuneration in the form of share-based payments in consideration of the services rendered, under “Gravita ESOP 2011 scheme” and “Gravita Stock Appreciation Rights Scheme 2017”.
Under the equity settled share-based payment, the fair value of options granted is recognized as an employee benefits expense with a corresponding increase in other equity. The total amount to be expensed is determined by reference to the fair value of the options. The total expense is recognized over the vesting period, which is the period over which all of the specified vesting conditions are to be satisfied. Upon exercise of share options, the proceeds received are allocated to share capital up to the par value of the shares issued with any excess being recorded as share premium.
For cash-settled share-based payments, the fair value of the amount payable to employees is recognised as ‘employee benefit expenses’ with a corresponding increase in liabilities, over the period of non-market vesting conditions getting fulfilled. The liability is remeasured at each reporting period up to, and including the settlement date, with changes in fair value recognised in employee benefits expenses.
XIX. Provisions, contingent assets and contingent liabilities
Provisions are recognised only when there is a present obligation, as a result of past events, it is probable that an outflow of resources embodying economic benefits will be required to settle the obligation, and when a reliable estimate of the amount of obligation can be made at the reporting date. These estimates are reviewed at each reporting date and adjusted to reflect the current best estimates.
Provisions are discounted to their present values, where the time value of money is material.
Contingent liability is disclosed for:
• Possibleobligationswhichwillbeconfirmedonlyby futureeventsnotwhollywithinthecontrolof theCompany or
• Presentobligationsarisingfrompasteventswhereitisnotprobablethatanoutflowofresourceswillberequired to settle the obligation or a reliable estimate of the amount of the obligation cannot be made.
Contingent assets are not recognised. However, when inflow of economic benefits is probable, related asset is disclosed.
XX. Earnings per share
Basic earnings per share is calculated by dividing the net profit or loss for the period attributable to equity shareholders (after deducting attributable taxes) by the weighted average number of equity shares outstanding during the period. The weighted average number of equity shares outstanding during the period is adjusted for events including a bonus issue.
For the purpose of calculating diluted earnings per share, the net profit or loss for the period attributable to equity shareholders and the weighted average number of shares outstanding during the period are adjusted for the effects of all dilutive potential equity shares.
Potential ordinary shares shall be treated as dilutive when, and only when, their conversion to ordinary shares would decrease earnings per share or increase loss per share from continuing operations.
XXI. Taxes
Income taxes
Current income tax assets and liabilities are measured at the amount expected to be recovered from or paid to the taxation authorities. The tax rates and tax laws used to compute the amount are those that are enacted or substantively enacted, at the reporting date.
Current income tax relating to items recognised outside profit or loss is recognised outside profit or loss (either in other comprehensive income or in equity). Management periodically evaluates positions taken in the tax returns with respect to situations in which applicable tax regulations are subject to interpretation and establishes provisions where appropriate.
Summary of the significant accounting policies and other explanatory information (Contd.)For the year ended March 31, 2020

111
Annual Report2019-2020
Deferred tax
Deferred tax liabilities are generally recognised in full for all taxable temporary differences. Deferred tax assets are recognised to the extent that it is probable that the underlying tax loss, unused tax credits (Minimum alternate tax credit entitlement) or deductible temporary difference will be utilised against future taxable income. This is assessed based on the Company’s forecast of future operating results, adjusted for significant non-taxable income and expenses and specific limits on the use of any unused tax loss or credit.Unrecognised deferred tax assets are re-assessed at each reporting date and are recognised to the extent that it has become probable that future taxable profits will allow deferred tax asset to be recovered.
Deferred tax assets and liabilities are measured at the tax rates that are expected to apply in the year when the asset is realised or the liability is settled, based on tax rates (and tax laws) that have been enacted or substantively enacted at the reporting date. Deferred tax items are recognised in correlation to the underlying transaction either in other comprehensive income or directly in equity. Deferred tax assets are only recognised to the extent that it is probable that future taxable profits will be available against which the temporary differences can be utilised.
Deferred tax relating to items recognized outside profit or loss is recognized outside profit or loss (either in other comprehensive income or in equity). Deferred tax items are recognized in correlation to the underlying transaction either in OCI or directly in equity.
Minimum Alternate Tax (‘MAT’) credit is recognized as an asset only when and to the extent it is probable that the Company will pay normal income tax during the specified period. In the year in which MAT credit becomes eligible to be recognized as an asset, the said asset is created by way of a credit to the Statement of profit and loss and shown as MAT credit entitlement. The Company reviews the same at each balance sheet date and writes down the carrying amount of MAT credit entitlement to the extent it is not probable that the Company will pay normal income tax during the specified period.
XXII. Cash and cash equivalents
Cash and cash equivalent in the balance sheet comprise cash at banks and on hand and short-term deposits with an original maturity of three months or less.
XXIII. Dividend payment
A final dividend, including tax thereon, on equity shares is recorded as a liability on the date of approval by the shareholders. An interim dividend, including tax thereon, is recorded as a liability on the date of declaration by the Board of directors.
XXIV. Government grants
Income includes export and other recurring and non-recurring incentives from Government (referred as “incentives’). Government grants are assistance by government in the form of transfers of resources to an entity in return for past or future compliance with certain conditions relating to the operating activities of the entity. The Company is entitled to subsidies from government in respect of manufacturing units located in specified regions.
Government grants are recognised when there is a reasonable assurance that the Company will comply with the relevant conditions and the grant will be received. These are recognised in the statement of profit and loss, either on a systematic basis when the Company recognises, as expenses, the related costs that the grants are intended to compensate or, immediately if the costs have already been incurred. Government grants related to assets are deferred and amortised over the useful life of the asset. Government grants related to income are presented as an offset against the related expenditure, and government grants that are awarded as incentives with no ongoing performance obligations to the Company are recognised as income in the period in which the grant is received. Government grant in form of subsidy for unit at Chittoor, Andhra Pradesh is awarded as incentive to the Company, and is recognised as income in the period in which the grant is accrued.
XXV. Use of estimates and judgement
The following are the critical judgments and the key estimates concerning the future that management has made in the process of applying the Company’s accounting policies and that may have the most significant effect on the amounts recognised in the financial statements or that have a significant risk of causing a material adjustment to the carrying amounts of assets and liabilities within the next financial year.
Summary of the significant accounting policies and other explanatory information (Contd.)For the year ended March 31, 2020
112
Corporate Overview Statutory Reports Financial Statements
a. Useful lives of depreciable/ amortisable assets: Management reviews its estimate of the useful lives of depreciable/amortisable assets at each reporting date, based on the expected utility of the assets. Uncertainties in these estimates relate to technical and economic obsolescence that may change the utility of assets.
b. Evaluation of indicators for impairment of assets: The evaluation of applicability of indicators of impairment of assets requires assessment of several external and internal factors which could result in deterioration of recoverable amount of the assets.
c. Recognition of Deferred tax assets and Minimum Alternate Tax assets: The extent to which deferred tax assets can be recognized is based on an assessment of the probability of the future taxable income against which the deferred tax assets can be utilized.
d. Allowance for expected credit loss: The allowance for expected credit loss reflects management’s estimate of losses inherent in its credit portfolio. This allowance is based on Company’s estimate of the losses to be incurred, which derives from past experience with similar receivables, current and historical past due amounts, dealer termination rates, write-offs and collections, the careful monitoring of portfolio credit quality and current and projected economic and market conditions. The Company has also taken into account estimates of possible effect from the pandemic relating to COVID-19. Should the present economic and financial situation persist or even worsen, there could be a further deterioration in the financial situation of the Company’s debtors compared to that already taken into consideration in calculating the allowances recognised in the financial statements.
e. Allowance for obsolete and slow-moving inventory: The allowance for obsolete and slow-moving inventory reflects management’s estimate of the expected loss in value and has been determined on the basis of past experience and historical and expected future trends in the used vehicle market. A worsening of the economic and financial situation could cause a further deterioration in conditions compared to that taken into consideration in calculating the allowances recognized in the financial statements
f. Contingent liabilities: The Company is the subject of legal proceedings and tax issues covering a range of matters, which are pending in various jurisdictions. Due to the uncertainty inherent in such matters, it is difficult to predict the final outcome of such matters. The cases and claims against the Company often raise difficult and complex factual and legal issues, which are subject to many uncertainties, including but not limited to the facts and circumstances of each particular case and claim, the jurisdiction and the differences in applicable law. In the normal course of business management consults with legal counsel and certain other experts on matters related to litigation and taxes. The Company accrues a liability when it is determined that an adverse outcome is probable, and the amount of the loss can be reasonably estimated
g. Provisions: At each balance sheet date basis the management judgment, changes in facts and legal aspects, the Company assesses the requirement of provisions against the outstanding contingent liabilities. However, the actual future outcome may be different from this judgement.
h. Leases: Ind AS 116 defines a lease term as the non-cancellable period for which the lessee has the right to use an underlying asset including optional periods, when an entity is reasonably certain to exercise an option to extend (or not to terminate) a lease. The Company considers all relevant facts and circumstances that create an economic incentive for the lessee to exercise the option when determining the lease term. The option to extend the lease term is included in the lease term, if it is reasonably certain that the lessee would exercise the option. The Company reassesses the option when significant events or changes in circumstances occur that are within the control of the lessee.
i. Defined benefit obligations (DBO): Management’s estimate of the DBO is based on a number of critical underlying assumptions such as standard rates of inflation, mortality, discount rate and anticipation of future salary increases. Variation in these assumptions may significantly impact the DBO amount and the annual defined benefit expenses.
XXVI. Standards issued but not yet effective
Ministry of Corporate Affairs (“MCA”) notifies new standard or amendments to the existing standards. There is no such notification which would have been applicable from April 1, 2020.
Summary of the significant accounting policies and other explanatory information (Contd.)For the year ended March 31, 2020

113
Annual Report2019-2020
Sum
mar
y of
the
sign
ifica
nt a
ccou
ntin
g po
licie
s an
d ot
her e
xpla
nato
ry in
form
atio
n (C
ontd
.)Fo
r the
yea
r end
ed M
arch
31,
202
0
Not
e 2
- Pro
pert
y, p
lant
and
equ
ipm
ent
Part
icul
ars
Fre
ehol
d la
nd
Bui
ldin
gs
Pla
nt a
nd
mac
hine
ry
Offi
ce
equi
pmen
t C
ompu
ter a
nd
acce
ssor
ies
Fur
nitu
re
and
fixtu
res
Veh
icle
s T
otal
Gro
ss c
arry
ing
amou
ntA
s at
Apr
il 1,
201
8 8
83.5
6 3
,374
.41
3,3
66.4
5 3
83.8
6 9
5.26
8
4.76
6
46.9
1 8
,835
.21
Add
ition
s -
1,8
80.5
6 1
,004
.72
163
.66
18.
03
82.
75
57.
45
3,2
07.1
7 D
ispo
sals
/ ad
just
men
ts -
- (8
1.34
) (1
.60)
(0.8
8) (0
.05)
(13.
42)
(97.
29)
As
at M
arch
31,
201
9 8
83.5
6 5
,254
.97
4,2
89.8
3 5
45.9
2 1
12.4
1 1
67.4
6 6
90.9
4 1
1,94
5.09
A
dditi
ons
- 5
03.9
1 4
69.6
1 2
5.22
2
.10
47.
64
- 1
,048
.48
Dis
posa
ls/
adju
stm
ents
- -
(33.
06)
(1.0
3) (1
.17)
(0.4
5) (4
5.83
) (8
1.54
)A
s at
Mar
ch 3
1, 2
020
883
.56
5,7
58.8
8 4
,726
.38
570
.11
113
.34
214
.65
645
.11
12,
912.
03
Acc
umul
ated
dep
reci
atio
nA
s at
Apr
il 1,
201
8 -
153
.81
332
.05
53.
54
43.
96
12.
09
121
.89
717
.34
Cha
rge
for t
he y
ear
- 1
57.0
5 2
96.7
4 5
4.96
2
7.92
1
1.74
9
0.51
6
38.9
2 D
ispo
sals
/ ad
just
men
ts -
- (2
1.30
) (0
.45)
(0.4
0) (0
.01)
(9.4
7) (3
1.63
)A
s at
Mar
ch 3
1, 2
019
- 3
10.8
6 6
07.4
9 1
08.0
5 7
1.48
2
3.82
2
02.9
3 1
,324
.63
Cha
rge
for t
he y
ear
- 1
99.3
7 3
25.2
0 7
0.15
2
1.20
2
0.26
8
6.88
7
23.0
6 D
ispo
sals
/ ad
just
men
ts -
- (5
.09)
(0.4
4) (0
.77)
(0.0
9) (1
9.48
) (2
5.87
)A
s at
Mar
ch 3
1, 2
020
- 5
10.2
3 9
27.6
0 1
77.7
6 9
1.91
4
3.99
2
70.3
3 2
,021
.82
Net
car
ryin
g va
lue
As
at M
arch
31,
201
9 8
83.5
6 4
,944
.11
3,6
82.3
4 4
37.8
7 4
0.93
1
43.6
4 4
88.0
1 1
0,62
0.46
A
s at
Mar
ch 3
1, 2
020
883
.56
5,2
48.6
5 3
,798
.78
392
.35
21.
43
170
.66
374
.78
10,
890.
21
(i) A
bove
men
tione
d as
sets
are
mor
tgag
ed a
s se
curit
y w
ith b
anks
/ fin
anci
al in
stitu
tions
. Ref
er n
ote
16 fo
r det
ails
.
(ii) R
efer
not
e 35
for d
iscl
osur
e of
con
trac
tual
com
mitm
ents
for t
he a
cqui
sitio
n of
pro
pert
y, p
lant
and
equ
ipm
ent.
(All
amou
nts
in `
lacs
, unl
ess
othe
rwis
e st
ated
)
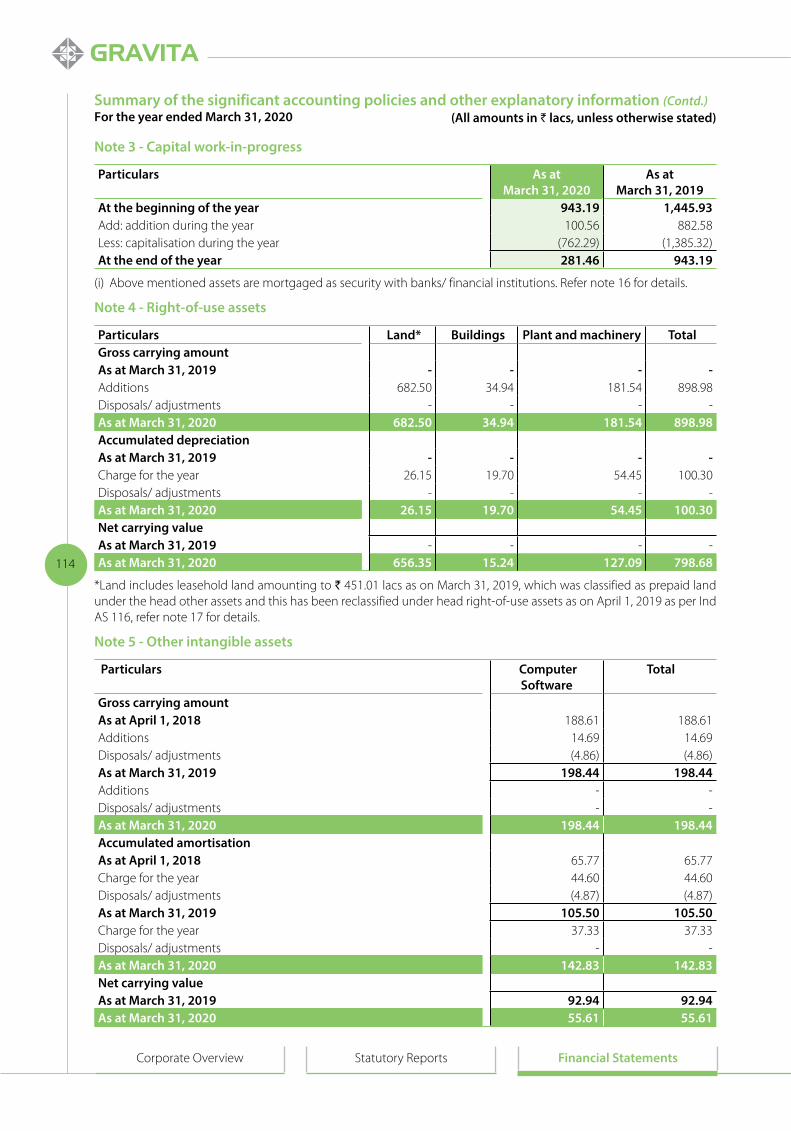
114
Corporate Overview Statutory Reports Financial Statements
Note 3 - Capital work-in-progress
Particulars As atMarch 31, 2020
As atMarch 31, 2019
At the beginning of the year 943.19 1,445.93 Add: addition during the year 100.56 882.58 Less: capitalisation during the year (762.29) (1,385.32)At the end of the year 281.46 943.19
(i) Above mentioned assets are mortgaged as security with banks/ financial institutions. Refer note 16 for details.
Note 4 - Right-of-use assets
Particulars Land* Buildings Plant and machinery Total Gross carrying amountAs at March 31, 2019 - - - - Additions 682.50 34.94 181.54 898.98 Disposals/ adjustments - - - - As at March 31, 2020 682.50 34.94 181.54 898.98 Accumulated depreciationAs at March 31, 2019 - - - - Charge for the year 26.15 19.70 54.45 100.30 Disposals/ adjustments - - - - As at March 31, 2020 26.15 19.70 54.45 100.30 Net carrying valueAs at March 31, 2019 - - - - As at March 31, 2020 656.35 15.24 127.09 798.68
*Land includes leasehold land amounting to ` 451.01 lacs as on March 31, 2019, which was classified as prepaid land under the head other assets and this has been reclassified under head right-of-use assets as on April 1, 2019 as per Ind AS 116, refer note 17 for details.
Note 5 - Other intangible assets
Particulars Computer Software
Total
Gross carrying amountAs at April 1, 2018 188.61 188.61 Additions 14.69 14.69 Disposals/ adjustments (4.86) (4.86)As at March 31, 2019 198.44 198.44 Additions - - Disposals/ adjustments - - As at March 31, 2020 198.44 198.44 Accumulated amortisationAs at April 1, 2018 65.77 65.77 Charge for the year 44.60 44.60 Disposals/ adjustments (4.87) (4.87)As at March 31, 2019 105.50 105.50 Charge for the year 37.33 37.33 Disposals/ adjustments - - As at March 31, 2020 142.83 142.83 Net carrying valueAs at March 31, 2019 92.94 92.94 As at March 31, 2020 55.61 55.61
Summary of the significant accounting policies and other explanatory information (Contd.)For the year ended March 31, 2020 (All amounts in ` lacs, unless otherwise stated)

115
Annual Report2019-2020
Note 6 - Investments
Particulars As at March 31, 2020 As at March 31, 2019 Numbers Amount umbers Amount
I. Non-current investments, carried at costInvestment in equity instrumentsInvestment in subsidiaries (unquoted) (fully paid shares)Gravita Infotech LimitedShares of face value of ` 10 each (previous year: ` 10 each)
200,000 26.09 200,000 26.09
Gravita Ghana LimitedShares of face value of GHS 1 each (previous year: GHS 1 each)
314,363 123.66 314,363 123.66
Gravita Global Pte LimitedShares of face value of USD 1 each (previous year: USD 1 each)
1,345,000 728.60 1,345,000 728.60
Noble Build Estate Private LimitedShares of face value of Rs. 10 each (previous year: ` 10 each)
19,990 74.96 19,990 74.96
Total (a) 953.31 953.31 Investment in partnership firms (unquoted)*M/s Shasin Industries (Formerly known as M/s Gravita Metals) - 380.00 M/s Gravita Metal Inc 95.00 95.00 M/s Gravita Infotech 0.98 0.98
Total (b) 95.98 475.98 Investment in government securities (unquoted)National saving certificate 0.03 0.03
Total (c) 0.03 0.03 Investment in limited liability partnership (LLP) (unquoted)M/s Recycling Infotech LLP 1.02 1.02
Total (d) 1.02 1.02 Total non-current investments (e) = (a + b + c + d) 1,050.34 1,430.34
II. Current investments, carried at costInvestment in partnership firms (unquoted)#
M/s Shasin Industries (Formerly known as M/s Gravita Metals) - 260.01 M/s Gravita Metal Inc 438.82 654.17 M/s Gravita Infotech 5.86 7.55
Total (f) 444.68 921.73 Investment in limited liability partnership (LLP)M/s Recycling Infotech LLP (1.64) (1.80)
Total (g) (1.64) (1.80)Total current investments (h)= (f + g) 443.04 919.93
Aggregate amount of unquoted investments 1,493.38 2,350.27
# As current capital account is covered by partnership deed, the closing balance in current capital account has been disclosed as current investments.
Summary of the significant accounting policies and other explanatory information (Contd.)For the year ended March 31, 2020 (All amounts in ` lacs, unless otherwise stated)

116
Corporate Overview Statutory Reports Financial Statements
* Other details relating to Investment in partnership firms:
Particulars As at March 31, 2020
As at March 31, 2019
Investment in M/s Shasin Industries (Formerly known as M/s Gravita Metals) (refer note 32)Name of the partner and share in profits (in %)- Gravita India Limited - 95.00%- Gravita Infotech Limited - 5.00%Total capital of the firm (in lacs) - 400.00 Investment in M/s Gravita Metal IncName of the partner and share in profits (in %)- Gravita India Limited 95.00% 95.00%- Gravita Infotech Limited 5.00% 5.00%Total capital of the firm (in lacs) 100.00 100.00 Investment in M/s Gravita Infotech Name of the partner and share in profits (in %)- Gravita India Limited 49.00% 49.00%- Gravita Infotech Limited 51.00% 51.00%Total capital of the firm (in lacs) 2.00 2.00
Note 7 - Loans
Particulars As at March 31, 2020
As at March 31, 2019
Non-current (unsecured)Security deposits (considered good) 156.88 92.95 Loans receivable (refer note 34 and 45) - -- Considered good 696.35 503.34 - Credit impaired 181.57 96.08 Less: Loss allowance (181.57) (96.08)
Total 853.23 596.29 Current (unsecured)Security deposits (considered good) 27.79 92.17
Total 27.79 92.17
(i) Refer note 16 for hypothecation as securities with bank/financial institution on current loan.
Note 8 - Others financial assets
Particulars As at March 31, 2020
As at March 31, 2019
Non-currentDeposits with bank (with remaining maturity more than 12 months)* 1.26 1.26
Total 1.26 1.26 CurrentDerivatives designated at fair value through profit or loss- For forward contracts# 1,263.72 442.66 Receivable for sale of investment (refer note 32) 175.75 -Dividend receivable - 593.02
Total 1,439.47 1,035.68
(i) Above mention other current financial assets have been hypothecated as securities with banks/ financial institutions, refer note 16 for details.
* Represent lien with banks and financial institution and are restricted from being exchanged or used to settle a liability.
Summary of the significant accounting policies and other explanatory information (Contd.)For the year ended March 31, 2020 (All amounts in ` lacs, unless otherwise stated)

117
Annual Report2019-2020
# Details of balance against derivative contracts
Particulars As at March 31, 2020
As at March 31, 2019
Margin money 1,870.25 323.20 Effect of marked to market on open contracts (606.53) 119.46
Total 1,263.72 442.66
Note 9 - Other assets
Particulars As at March 31, 2020
As at March 31, 2019
Unsecured, considered goodNon-currentCapital advances 6.00 7.44
Prepaid expenses 21.58 3.38
Prepaid lease (leasehold land) (refer note 17) - 445.79
Balance with government authorities 52.26 51.11
Total 79.84 507.72 CurrentAdvances to related parties (refer note 45) 2,488.44 2,271.77
Advances to vendors 3,624.76 2,975.62
Advances to employees 32.03 27.57
Prepaid expenses 76.75 134.13
Prepaid lease (leasehold land) (refer note 17) - 5.22
Corporate guarantee receivable 7.55 -
Balance with government authorities 3,523.60 1,749.64
Total 9,753.13 7,163.95
(i) Above mentioned Other current assets have been hypothecated as securities with banks/ financial institutions, refer note 16 for details.
Note 10 - Inventories*
(At lower of cost and net realisable value)
Particulars As at March 31, 2020
As at March 31, 2019
Raw materials 3,862.44 2,526.51
Raw materials - goods-in-transit 5,798.83 4,311.14
Work-in-progress 2,497.27 2,031.61
Finished goods (other than those acquired for trading) 2,132.32 1,770.41
Finished goods - goods-in-transit 461.72 2,020.31
Traded goods 22.95 12.39
Stores and spares 379.66 362.16
Consumables 253.39 255.47
Total 15,408.58 13,290.00
* Above mentioned inventories have been hypothecated as securities with banks/ financial institutions, refer note 16 for details.
Summary of the significant accounting policies and other explanatory information (Contd.)For the year ended March 31, 2020 (All amounts in ` lacs, unless otherwise stated)

118
Corporate Overview Statutory Reports Financial Statements
Note 11 - Trade receivables
Particulars As at March 31, 2020
As at March 31, 2019
Unsecured -
Trade receivables - considered good 6,158.58 10,666.70
Trade receivables - credit impaired 373.16 118.58
Less: allowance for expected credit losses (373.16) (118.58)
Total 6,158.58 10,666.70
(i) Above mentioned trade receivables have been hypothecated as securities with banks/ financial institutions, refer note 16 for details. Also refer note 45 for related parties details.
(ii) Transferred receivables: During current year, the Company follows non-recourse factoring arrangement for domestic receivables. Under the arrangement, the Company has transferred certain receivables to the factor in exchange for cash along with the credit risk. Correspondingly, no amount is shown as repayable under the factoring arrangement as at March 31, 2020.
During the previous year, the Company had followed recourse factoring arrangement for domestic receivables. Under the arrangement, the company had transferred the relevant receivables to the factor in exchange for cash but had retained the credit risk. The Company therefore had recognised the full carrying amount of the relevant receivables amounting to ̀ 1,803.92 lacs and the carrying amount of associated liabilities amounting to ̀ 1,803.92 lacs as at March 31, 2019.
Note 12 - Cash and cash equivalents
Particulars As at March 31, 2020
As at March 31, 2019
Balances with banks
- in current accounts 68.23 307.84
Cash on hand 16.31 12.71
Cheques on hand - 66.60
Total 84.54 387.15
(i) Refer note 16 for hypothecation as securities with bank/financial institution on cash and cash equivalent
Note 13 - Bank balances other than cash and cash equivalents
Particulars As at March 31, 2020
As at March 31, 2019
Earmarked balances with banks in current accounts
- Unclaimed dividend account (ii) 6.48 3.73
Balance held as margin money against borrowings (with original maturity more than 3 months but remaining maturity less than 12 months)(iii)
634.37 648.99
Total 640.85 652.72
(i) Refer note 16 for hypothecation as securities with bank/financial institution on bank balance other than cash and cash equivalent except unclaimed dividend account.
(ii) These balances are not available for use by the Company and corresponding balance is disclosed as unclaimed dividend in note 21.
(iii) Includes interest accrued but not due.
Summary of the significant accounting policies and other explanatory information (Contd.)For the year ended March 31, 2020 (All amounts in ` lacs, unless otherwise stated)

119
Annual Report2019-2020
Note 14 - Equity share capital
Particulars As at March 31, 2020 As at March 31, 2019 Number of
shares Amount Number of shares Amount
AuthorisedEquity shares of ` 2 each 75,000,000 1,500.00 75,000,000 1,500.00
75,000,000 1,500.00 75,000,000 1,500.00 Issued, subscribed and fully paid upEquity shares of ` 2 each 69,037,914 1,380.76 68,746,714 1,374.93
Total 69,037,914 1,380.76 68,746,714 1,374.93
(a) Changes in equity share capital during the year
Particulars As at March 31, 2020 As at March 31, 2019 Number of
shares Amount Number of shares Amount
Equity shares with voting rightsBalance as at the beginning of the year 68,746,714 1,374.93 68,704,614 1,374.09
Add: shares issued during the year (ESOP) 291,200 5.83 42,100 0.84
Closing at the end of the year 69,037,914 1,380.76 68,746,714 1,374.93
(b) Terms/ rights attached to equity shares
The Company has only one class of shares referred to as equity shares having a face value of ` 2 per share. Each equity shareholder is entitled to one vote per share held. The Company declares and pays dividends in Indian Rupees. The final dividend proposed, if any, by the Board of Directors is subject to the approval of the shareholders in the ensuing Annual General Meeting, except in the case of interim dividend.
In the event of liquidation of the Company, the holder of equity shares will be entitled to receive remaining assets of the Company, after payment of all liabilities. The distribution will be in proportion to the number of equity shares held by the shareholders.
(c) Shareholder holding more than 5 percent shares
Particulars As at March 31, 2020 As at March 31, 2019 Number of shares held
% of holding
Number of shares held
% of holding
Equity shares with voting rightsMr. Rajat Agrawal 32,712,264 47.38 32,677,725 47.53
Agrawal Family Private Trust 17,348,025 25.13 17,348,025 25.23
(d) During the five years immediately preceding 31 March 2020, the Company has neither allotted any bonus shares nor have any shares been bought back.
(e) No shares has been issued for consideration other than cash in the current reporting year and in last five years immediately preceding the current reporting year.
(f) Dividend:
The Board of Directors, in its meeting held on February 24, 2020, have recommended an interim dividend of `0.70 per equity share of ` 2 each aggregating to ` 505.52 lacs (including dividend tax of ` 22.25 lacs) for the financial year ended March 31, 2020, was transferred to separate bank account on February 28, 2020.
The Board of Directors, in its meeting held on May 28, 2019, recommended a final dividend of ` 0.30 per equity share of ` 2 each for the financial year ended March 31, 2019 and the same was approved by the shareholders at the Annual General Meeting held on September 20, 2019 . This resulted in outflow of ` 207.11 lacs (including dividend tax).
Summary of the significant accounting policies and other explanatory information (Contd.)For the year ended March 31, 2020 (All amounts in ` lacs, unless otherwise stated)

120
Corporate Overview Statutory Reports Financial Statements
Note 15 - Other equity
Particulars As at March 31, 2020
As at March 31, 2019
Reserves and surplusSecurities premium 4,270.07 4,173.44
General reserve 517.90 517.90
Share options outstanding account - 96.63
Retained earnings 10,298.65 8,777.42
Cash flow hedging reserve (52.21) 0.47
Total 15,034.41 13,565.86
Description of nature and purpose of each reserve
Security premiumThe security premium is the amount paid by shareholder over and above the face value of equity share. Security premium can be utilised as per the provisions of the Companies Act, 2013.
General reserve The general reserve is created on transfer of profits from retained earnings. General reserve is created by transfer from one component of equity to another and is not an item of other comprehensive income.
Share options Outstanding accountThis reserve relates to share options granted by the Company to its employees under its employee share option plan. Further information about share-based payments to employees is set out in note 44.
Retained earningsRetained earnings represents surplus in Statement of Profit and Loss.
Cash flow hedging reserveThe cash flow hedging reserve represents the cumulative effective portion of gains or losses arising on changes in fair value of designated portion of hedging instruments entered into for cash flow hedges. Such gains or losses will be reclassified to statement of profit and loss in the period in which the hedged transaction occurs.
Note 16 - Borrowings(1)
Particulars As at March 31, 2020
As at March 31, 2019
Non-current borrowingsSecuredTerm loans- from bank 2,975.30 1,937.35 - from institutions other than banks 1,271.73 -Vehicle loans 68.25 209.98 Less: Loan processing fees (71.42) (24.58)
4,243.86 2,122.75 Less: Current maturities disclosed under other financial liabilities (refer note 21) 1,243.84 895.07
Total 3,000.02 1,227.68 Current borrowingsLoans repayable on demand - From banks (Secured)Cash credit / overdraft 9,200.80 8,408.54 Packing credit 2,110.71 5,764.79 Buyers credit 1,480.20 -Payable recognised on account of factoring with recourse for receivables (Refer note (3)(i)(d) below)
- 1,803.92
Suppliers credit - 1,511.36 Working capital demand loan 5,631.45 1,997.13
Total 18,423.16 19,485.74
Summary of the significant accounting policies and other explanatory information (Contd.)For the year ended March 31, 2020 (All amounts in ` lacs, unless otherwise stated)

121
Annual Report2019-2020
1. There is no default in repayment of principal repayment or interest thereon.
2. Repayment terms and security disclosure for the outstanding non-current borrowings (including current maturities) are as follows:
i. Vehicle loan from banks of ` 68.24 (March 31, 2019: ` 209.98 lacs) carry interest ranging from 8.40% p.a. to 9.90% p.a. The loans are secured by way of hypothecation of vehicles and repayable in equal monthly installments over a period of 31 to 48 Months.
ii. Corporate loan-I of ` 119.13 lacs (March 31, 2019 ` 200.07 lacs) with currency swing option@ 6months @ LIBOR +3.25% P.A. on fully hedged basis. The loan is repayable in 23 quarterly installments commencing from March 31, 2016 and ending on September 30, 2021. The loan is secured by way of following:
a) First parri-passu charge over the entire current assets of the Company including raw material, stock in process, finished goods including stocks in transit and those lying in godowns, ports, etc. and book debts (both present and future)
b) Second charge over the entire fixed assets of the Company both present and future (including Equitable Mortgage (EM) of properties disclosed under Note-2) excluding vehicles and entire assets situated at Plot No. P.A. 011-66, Light Engineering Zone, Mahindra World City - Sez, Jaipur and assets of Survey no. 233/15 to 233/30, Tiruthani Road, Ananthapuram-panchayat, Narasingharayani Pettah - Post Chittoor, Andhra Pradesh, Chittoor plant.
Corporate loan II of ` 83.72 lacs (March 31, 2019: ` 155.90 lacs) with currency swing option @ 6 months @ LIBOR +3.25% P.A. on fully hedged basis. The loan is secured by way of following:
a) First pari-passu over the entire fixed assets of the Company both present and future (including Equitable Mortgage (EM) of properties disclosed under Note-2) excluding vehicles and entire assets situated at Plot No. P.A. 011-66, Light Engineering Zone, Mahindra World City - Sez, Jaipur and assets of asset situated at Survey No. 233/15 to 233/30 Tiruthani Road, Ananthapuram-Panchayat Narasingharayani Post Chittoor, Andhra Pradesh Chittoor plant.
b) First pari-passu charge by way of equitable mortgage of flat no. 203, on first floorin Rajputana Tower situated at plot no , A-27-B, Tilak Nagar, Shanti Path, Jaipur of Managing Director Mr. Rajat Agrawal.
c) First pari-passu charge by way of equitable mortgage of land and houseHIG, SFS Block 3, plot no 90, HIG, Mansarovar, Jaipur of Gravita Impex Private Limited (Related Party).
d) Second charge over the entire current assets of the Company including raw material, stock in process, finished goods including stocks in transit and those lying in godowns, ports, etc. and book debts(both present and future)
iii. PNB Term Loan of ` 789.71 lacs (March 31, 2019: ` 1,001.38 lacs) @ 9.45% P.A.The loan is repayable in 22 quarterly installments commencing from October 1, 2017 and ending on January 1, 2023. The loan is secured by way of following:
a) First pari-passu charge on the entire block assets present and future of the Chittoor project.
b) Second pari-passu charge on following Immovable Properties:
Land and Building at Jaychand Ka Bas Harsulia Mod Diggi Malpura Road, Phagi, Jaipur Kasara no. 209/1/5/3, 209/1/4/1, 209/1/5/1 and 209/1/5/2.
Flat no. 203, 302, 401 and 403 located in Rajputana Tower situated at plot no, A-27-B, Tilak Nagar, Shanti Path, Jaipur
c) Residential Land & H No. 3/90, Mansarovar, Jaipur
d) Personal guarantee of Managing Director Mr. Rajat Agrawal.
e) Corporate guarantee of M/s Gravita Impex Private Limited (Related Party)
Summary of the significant accounting policies and other explanatory information (Contd.)For the year ended March 31, 2020 (All amounts in ` lacs, unless otherwise stated)

122
Corporate Overview Statutory Reports Financial Statements
iv. TATA Term Loan of ` 551.76 lacs (March 31, 2019: ` Nil) @ 10.50% P.A. The loan is repayable in 60 monthly installments commencing from February 2020 and ending on December 2025. The loan is secured by way of following:
(a) First Pari-passu charge by way of Hypothecation over movable fixed assets of Borrower at Plot No. PA-011-006, Mahindra Sez, Village Kalwara, Tehsil Sanganer Distt-Jaipur (with ICICI Bank).
(b) Personal guarantee of Managing Director Mr. Rajat Agrawal.
The loan will be further secured by way of first Pari passu Charge by way of mortgage over property situated of borrower at Plot No. PA-011-006, Mahindra Sez, Village Kalwara, Tehsil Sanganer Distt-Jaipur (with ICICI Bank).
v. Bajaj Term Loan of ̀ 720.00 lacs (march 31,2019: Rs. Nil ) @ 10% P.A. The loan is repayable in 60 monthly installments commencing from October 2019 and ending on September 2024. Then loan is secured by way of following:
a) First Pari Passu charge over movable fixed assets of the company (both present and future) excluding the assets situated at Chittor and SEZ unit.
b) First pari passu charge over entire current assets of the company.
c) Personal gurantee of Managing Director Mr. Rajat Agrawal.
The loan will be secured by way of the following:
a) First Pari Passu charge over the land and building of the company situated at Phagi Jaipur.
b) First pari-passu charge by way of mortgage over Flat No. 302,403,401 in Rajaputana Tower situated at plot no. 27B, Shanti Path, Tilak Nagar jaipur in the name of the company.
c) First pari-passu charge by way of mortgage over flat No. 203 in Rajaputana Tower situated at plot no. A27B, Shanti Path, Tilak jaipur in the name of Mr. Rajat Agrawal.
d) First pari-passu charge by way of mortgage over land & building HIG, SFS block 3, plot 90, Mansarovar, Jaipur of Gravita Impex Private Limited
e) Corporate Gurantee of M/s Gravita Impex Private Limited (only for Term Loan and PRD Limits)
vi. Bandhan Bank Term Loan of ̀ 982.72 lacs (March 31, 2019: ` Nil) @ 10.50% P.A. The loan is repayable in 48 monthly installments commencing from March 2020 and ending on Feb 2024. The loan is secured by way of following:
(a) First Pari-passu charge by way of Hypothecation over moveable fixed assets of Borrower at Chittoor Plant situated at Survey No. 233/15 to 233/30 Tiruthani Road, Ananthapuram-Panchayat Narasingharayani Post Chittoor, Andhra Pradesh with Punjab National Bank.
(b) Personal guarantee of Managing Director Mr. Rajat Agrawal.
The loan will be further secured by way of first Pari passu Charge by way of equitable mortgage over industrial property in the name of Company situated at Survey No. 233/15 to 233/30 Tiruthani Road, Ananthapuram-Panchayat Narasingharayani Post Chittoor, Andhra Pradesh with Punjab National Bank.
vii. Bandhan Bank Term Loan of ` 1,000 lacs (March 31, 2019: ` Nil) @ 10.50% P.A. The loan is repayable in 48 monthly installments commencing from May 2020 and ending on Mar 2024. The loan is secured by way of following:
(a) First Pari-passu charge by way of Hypothecation over moveable fixed assets of Borrower at Chittoor Plant situated at Survey No. 233/15 to 233/30 Tiruthani Road, Ananthapuram-Panchayat Narasingharayani Post Chittoor, Andhra Pradesh with Punjab National Bank.
(b) Personal guarantee of Managing Director Mr. Rajat Agrawal.
The loan will be further secured by way of first Pari passu Charge by way of equitable mortgage over industrial property in the name of Company situated at Survey No. 233/15 to 233/30 Tiruthani Road, Ananthapuram-Panchayat Narasingharayani Post Chittoor, Andhra Pradesh with Punjab National Bank.
viii. TATA Term Loan of ` Nil (March 31, 2019: ` 580 lacs) @ 10.50% P.A. The loan was repayable in 60 quarterly installments commencing from November 27, 2018. The loan was secured by way of following:
(a) First pari-passu charge by way of mortgage over industrial property in the name of the Borrower situated at Survey No 233/15 to 233/30, Tiruthani Road, Ananthapuram Panchayat Narasingha Rayaru Post Chittoor, Andhra Pradesh.
Summary of the significant accounting policies and other explanatory information (Contd.)For the year ended March 31, 2020 (All amounts in ` lacs, unless otherwise stated)

123
Annual Report2019-2020
(b) First Pari-passu charge by way of Hypothecation over moveable fixed assets of Borrower at Chittoor plant with PNB.
3. Security disclosure for the outstanding current borrowings are as follows:
i. Loans repayable on demand from banks are secured by way of:
(a) First pari-passu charge over the entire current assets of the Company including raw material, stock in process, finished goods including stocks in transit and those lying in godowns, ports, etc and book debts (both present and future).
(b) First pari-passu charge on the entire fixed assets of the Company both present and future, excluding vehicles and entire assets situated at Plot No. P.A. 011-006, Light Engineering Zone, Mahindra World City - Sez, Jaipur and assets of Survey no. 233/15 to 233/30, Tiruthani Road, Ananthapuram-panchayat, Narasingharayani Pettah - Post Chittoor, Andhra Pradesh, but including the following:
(i) Flat no. 302, 401, 403 in Gravita Tower, A-27-B, Tilak Nagar, Shanti Path, Jaipur.
(ii) Land and building at Jai Chand ka Bas, Diggi Malpura Road, Phagi, Jaipur.
(c) First pari-passu charge on the following other assets:
(i) Land and house at 3/90, HIG, Mansarovar, Jaipur of Gravita Impex Private Limited (related party).
(ii) Flat no. 203 in Gravita Tower, A-27-B, Tilak Nagar, Shanti Path, Jaipur of Managing Director Mr. Rajat Agrawal.
(d) Charge over certain of the Company’s trade receivables [refer note 11(ii)].
(e) Personal guarantee of Managing Director Mr. Rajat Agrawal.
(f ) Corporate guarantee of M/s Gravita Impex Private Limited (related party).
(g) Second pari passu charge on the fixed assets of Chittoor Plant.
(h) Corporate guarantee of M/s Noble Buildestate Private Limited (related party).
(i) Land and building situated at B-11A, Malviya Industrial area, Jaipur of Noble Buildestate Private Limited.
4. Collateral:
Inventory, trade receivables, other current assets, other current financial assets, property, plant and equipment, capital work-in-progress with a net carrying amount of ` 45,574 lacs and ` 46,279 lacs are given as collateral/ security against the borrowings as at March 31, 2020 and March 31, 2019, respectively.
Note 17 - Lease liabilities
Particulars As at March 31, 2020
As at March 31, 2019
Non-current 260.87 -
Current 114.97 -
Total 375.84 -
i. Disclosures on lease pursuant to Ind AS 116 - Leases
The Company has leases for the factory lands, office premises, equipment, etc. Also, the Company has a leasehold land at Jaipur which has been taken on a lease for a period of 92 years in the year 2013. Initial land premium of ` 481 Lacs has been paid by the Company which is amortised over the period of lease. Unamortised amount of upfront premium paid was classified as prepaid land under the head “Other assets” as on March 31, 2019.
Each lease generally imposes a restriction that, unless there is a contractual right for the Company to sublet the asset to another party, the right-of-use asset can only be used by the Company. Leases contain an option to extend the lease for a further term after mutual consent of both the parties. The Company is prohibited from selling or pledging the underlying leased assets as security against the Company’s other debts and liabilities.
Summary of the significant accounting policies and other explanatory information (Contd.)For the year ended March 31, 2020 (All amounts in ` lacs, unless otherwise stated)

124
Corporate Overview Statutory Reports Financial Statements
The table below describes the nature of the Company’s leasing activities by type of right-of-use asset recognised on balance sheet:
Right-of-use asset Number of RoU assets
leased
Range of remaining
term (in years)
Number of leases with extension
options
Number of leases with termination
optionsLand 2 8.86-85.44 - -
Plant and machinery 11 1.92-3.42 - -
Building 2 0.59-1.25 - -
ii. Adoption of Ind AS 116 ‘Leases’
Ind AS 116 ‘Leases’ replaces Ind AS 17 ‘Leases’ along with three Interpretations (Appendix A ‘Operating Leases-Incentives’, Appendix B ‘Evaluating the Substance of Transactions Involving the Legal Form of a Lease’ and Appendix C ‘Determining whether an Arrangement contains a Lease’).
The adoption of this new Standard has resulted in the Company recognising a right-of-use asset and related lease liability in connection with all former operating leases except for those identified as low-value or having a remaining lease term of less than 12 months from the date of initial application.
The new Standard has been applied using the modified retrospective approach, with the cumulative effect of adopting Ind AS 116 being recognised in equity as an adjustment to the opening balance of retained earnings for the current period. Prior periods have not been restated.
On transition, for leases previously accounted for as operating leases with a remaining lease term of less than 12 months and for leases of low-value assets the Company has applied the optional exemptions to not recognise right-of-use assets but to account for the lease expense on a straight-line basis over the remaining lease term.
On transition to Ind AS 116 the weighted average incremental borrowing rate applied to lease liabilities recognised under Ind AS 116 was 10%.
The following is a reconciliation of the financial statement line items from Ind AS 17 to Ind AS 116 at April 1, 2019:
Particulars Carrying amount at
March 31, 2019
Re-classification
Adjustment upon transition
to Ind AS 116
Ind AS 116 carrying amount at April 1, 2019
Right-of-use assets - 451.01 447.98 898.99 Lease liabilities - - (454.88) (454.88)
Other non-current assets 507.72 (445.79) - 61.93
Other current assets 7,163.95 (5.22) - 7,158.73
Retained earnings - - 6.90 6.90
Total 7,671.67 - - 7,671.67
iii. Lease payments not recognised as a liability
The Company has elected not to recognise a lease liability for short term leases (leases with an expected term of 12 months or less) or for leases of low value assets. Payments made under such leases are expensed on a straight-line basis. The Company does not have any liability to make variable lease payments for the right to use the underlying asset recognised in the Financial statement. The expense relating to payments not included in the measurement of the lease liability for short term leases is ` 115.68 lacs.
Total cash outflow for leases for the year ended March 31, 2020 was ` 235.18 lacs.
Summary of the significant accounting policies and other explanatory information (Contd.)For the year ended March 31, 2020 (All amounts in ` lacs, unless otherwise stated)

125
Annual Report2019-2020
iv. The following is a reconciliation of total operating lease commitments at March 31, 2019 (as disclosed in the financial statements for the year ended March 31, 2019) to the lease liabilities recognised at April 01, 2019:
Particulars AmountTotal operating lease commitments disclosed at March 31, 2019 190.55 Recognition exemptions:
•Leasesoflowvalueassets -
•Leaseswithremainingleasetermoflessthan12months (7.23)
Reasonably certain extension options taken -
Leases considered cancellable under Ind AS 17 458.74
Operating lease liabilities before discounting 642.06 Discounted using incremental borrowing rate (187.18)
Total lease liabilities recognised under Ind AS 116 at April 01, 2019 454.88
v. Disclosures under Ind AS 17 for the year ended March 31, 2019:
Operating leases - Assets taken on lease
Particulars As at March 31, 2019
Not later than one year 69.94
Later than one year but not more than 5 years 120.61
Later than 5 years -
Total 190.55
Total lease rent charged to the Statement of Profit and Loss for the year ended March 31, 2019 was ` 179.90 lacs.
vi. Refer note 41 (C.2) (b) for contractual maturity of lease liabilities.
Note 18 - Provisions
Particulars As at March 31, 2020
As at March 31, 2019
Non-current provisions (refer note 43)- Provision for gratuity 246.87 200.66
- Provision for compensated absences 74.86 59.98
Total 321.73 260.64 Current provisions (refer note 43)- Provision for gratuity 35.23 31.78
- Provision for compensated absences 4.70 3.66
Total 39.93 35.44
Summary of the significant accounting policies and other explanatory information (Contd.)For the year ended March 31, 2020 (All amounts in ` lacs, unless otherwise stated)

126
Corporate Overview Statutory Reports Financial Statements
Note 19 - Deferred tax liabilities (net)
Particulars As at March 31, 2020
As at March 31, 2019
Deferred tax liability arising on account of:Property, plant and equipment and intangible assets 820.59 721.43
Cash flow hedge reserve - 0.26
Other temporary differences 24.76 8.33
Gross deferred tax liabilities 845.35 730.02 Deferred tax asset arising on account of:Provision for employee benefits and other liabilities deductible on actual payment
147.22 122.75
Allowances for expected credit losses 193.84 75.01
RoU assets and lease liabilities 8.93 -
Cash flow hedge reserve 28.03 -
Gross deferred tax assets 378.02 197.76 Minimum alternate tax (MAT) credit entitlement 406.20 406.20 Deferred tax liabilities (net) (including MAT credit entitlement) 61.13 126.06
The Company has tax losses amounting to ` 381.86 lacs (March 31, 2019: Nil), on which no deferred tax asset has been recognised considering there is no probability which demonstrate realisation of deferred tax asset in the near future. Further, the Company has not recognised additional minimum alternate tax (MAT) credit entitlement in current financial year considering there is no probability which demonstrates realisation, considering the exemption available under section 80-IA of Income tax Act, 1961.
(iii) Deferred tax movements
Movement of net deferred tax assets and liabilities for the year ended March 31, 2020 is as follows:Particulars Opening
balance(Charge)/ credit in Statement of Profit and loss
(Charge)/ credit in other
comprehensive income
Closing balance
Provision for employee benefits and other liabilities deductible on actual payment
122.75 23.19 1.28 147.22
Allowances for expected credit losses 75.01 118.83 - 193.84 Property, plant and equipment and other intangible assets - depreciation and amortisation
(721.43) (99.16) - (820.59)
MAT credit entitlement 406.20 - - 406.20 RoU assets and lease liabilities - 8.93 - 8.93 Cash flow hedge reserve (0.26) - 28.29 28.03 Others (8.33) (16.43) - (24.76)
Total (126.06) 35.36 29.57 (61.13)
Summary of the significant accounting policies and other explanatory information (Contd.)For the year ended March 31, 2020 (All amounts in ` lacs, unless otherwise stated)

127
Annual Report2019-2020
Movement of net deferred tax assets and liabilities for the year ended March 31, 2019 is as follows:Particulars Opening
balance(Charge)/ credit in Statement of Profit and loss
(Charge)/ credit in other
comprehensive income
Closing balance
Provision for employee benefits and other liabilities deductible on actual payment
83.63 37.85 1.27 122.75
Allowances for expected credit losses 27.61 47.40 - 75.01
Property, plant and equipment and other intangible assets - depreciation and amortisation
(544.23) (177.20) - (721.43)
MAT credit entitlement 352.09 54.11 - 406.20
Cash flow hedge reserve - - (0.26) (0.26)
Others (2.74) (5.59) - (8.33)
Total (83.64) (43.43) 1.01 (126.06)
Note 20 - Trade payables
Particulars As at March 31, 2020
As at March 31, 2019
Total outstanding dues of micro and small enterprises(i) 138.24 72.18
Total outstanding dues of creditors other than micro and small enterprises(ii)
7,649.28 10,712.51
Total 7,787.52 10,784.69
(i) On the basis of confirmation obtained from suppliers who have registered themselves under the Micro, Small and Medium Enterprise Development Act, 2006 (MSMED Act, 2006) and based on the information available with the Company, dues disclosed as per the Micro, Small and Medium Enterprise Development Act, 2006 (‘MSMED Act, 2006’) at the year end are below, This has been relied upon by the auditors.
Particulars As at March 31, 2020
As at March 31, 2019
i Principal amount remaining unpaid to any supplier as at the end of the accounting year
138.24 72.18
ii Interest due thereon remaining unpaid to any supplier as at the end of the accounting year
2.29 4.61
iii The amount of interest paid by the buyer in terms of section 16, along with the amounts of the payment made to the supplier beyond the appointed day during each accounting year
- -
iv The amount of interest due and payable for the period of delay in making payment (which have been paid but beyond the appointed day during the year) but without adding the interest specified under the Act
- -
v The amount of interest accrued and remaining unpaid at the end of the accounting year
2.29 4.61
vi The amount of further interest remaining due and payable even in the succeeding years, until such date when the interest dues as above are actually paid to the small enterprise, for the purpose of disallowance as a deductible expenditure under section 23.
- -
(ii) Include acceptances/ arrangements where operational suppliers of goods and services are initially paid by banks/ financial institutions, while the Company continues to recognise the liability till settlement with the banks/ financial institutions.
Summary of the significant accounting policies and other explanatory information (Contd.)For the year ended March 31, 2020 (All amounts in ` lacs, unless otherwise stated)
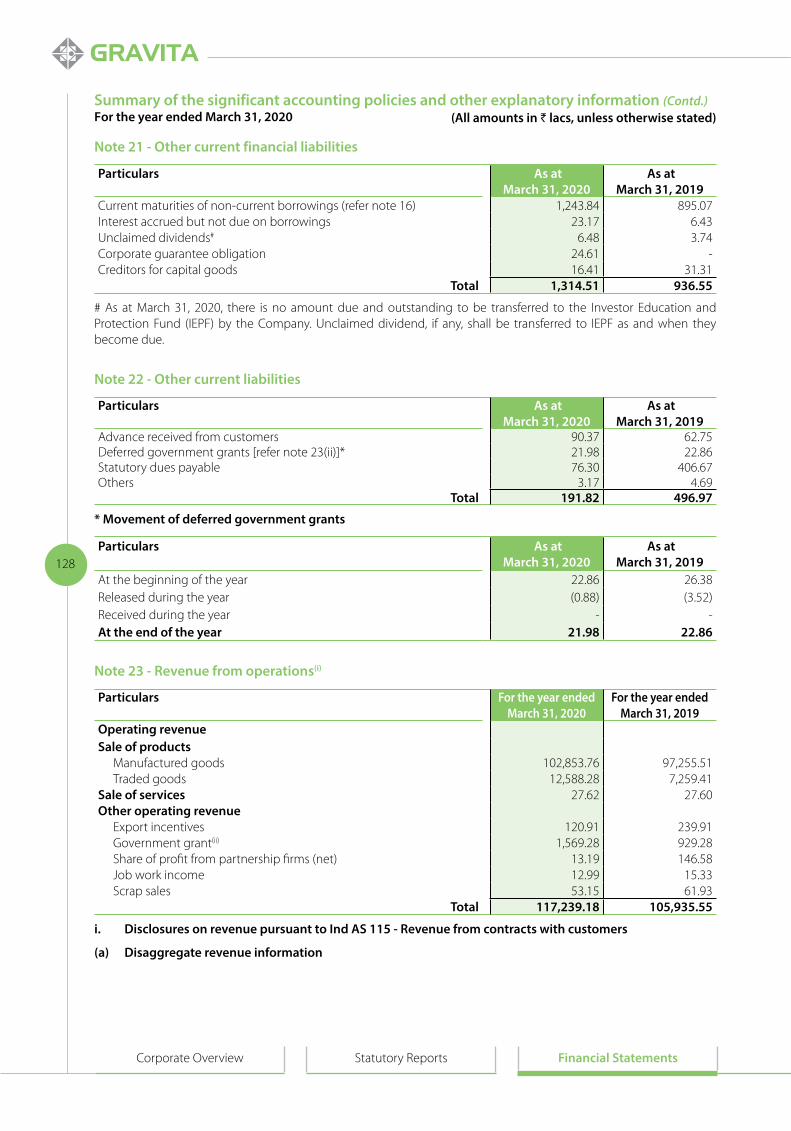
128
Corporate Overview Statutory Reports Financial Statements
Note 21 - Other current financial liabilities
Particulars As at March 31, 2020
As at March 31, 2019
Current maturities of non-current borrowings (refer note 16) 1,243.84 895.07 Interest accrued but not due on borrowings 23.17 6.43 Unclaimed dividends# 6.48 3.74 Corporate guarantee obligation 24.61 -Creditors for capital goods 16.41 31.31
Total 1,314.51 936.55
# As at March 31, 2020, there is no amount due and outstanding to be transferred to the Investor Education and Protection Fund (IEPF) by the Company. Unclaimed dividend, if any, shall be transferred to IEPF as and when they become due.
Note 22 - Other current liabilities
Particulars As at March 31, 2020
As at March 31, 2019
Advance received from customers 90.37 62.75 Deferred government grants [refer note 23(ii)]* 21.98 22.86 Statutory dues payable 76.30 406.67 Others 3.17 4.69
Total 191.82 496.97
* Movement of deferred government grants
Particulars As at March 31, 2020
As at March 31, 2019
At the beginning of the year 22.86 26.38 Released during the year (0.88) (3.52)Received during the year - -At the end of the year 21.98 22.86
Note 23 - Revenue from operations(i)
Particulars For the year ended March 31, 2020
For the year ended March 31, 2019
Operating revenueSale of products
Manufactured goods 102,853.76 97,255.51 Traded goods 12,588.28 7,259.41
Sale of services 27.62 27.60 Other operating revenue
Export incentives 120.91 239.91 Government grant(ii) 1,569.28 929.28 Share of profit from partnership firms (net) 13.19 146.58 Job work income 12.99 15.33 Scrap sales 53.15 61.93
Total 117,239.18 105,935.55
i. Disclosures on revenue pursuant to Ind AS 115 - Revenue from contracts with customers
(a) Disaggregate revenue information
Summary of the significant accounting policies and other explanatory information (Contd.)For the year ended March 31, 2020 (All amounts in ` lacs, unless otherwise stated)
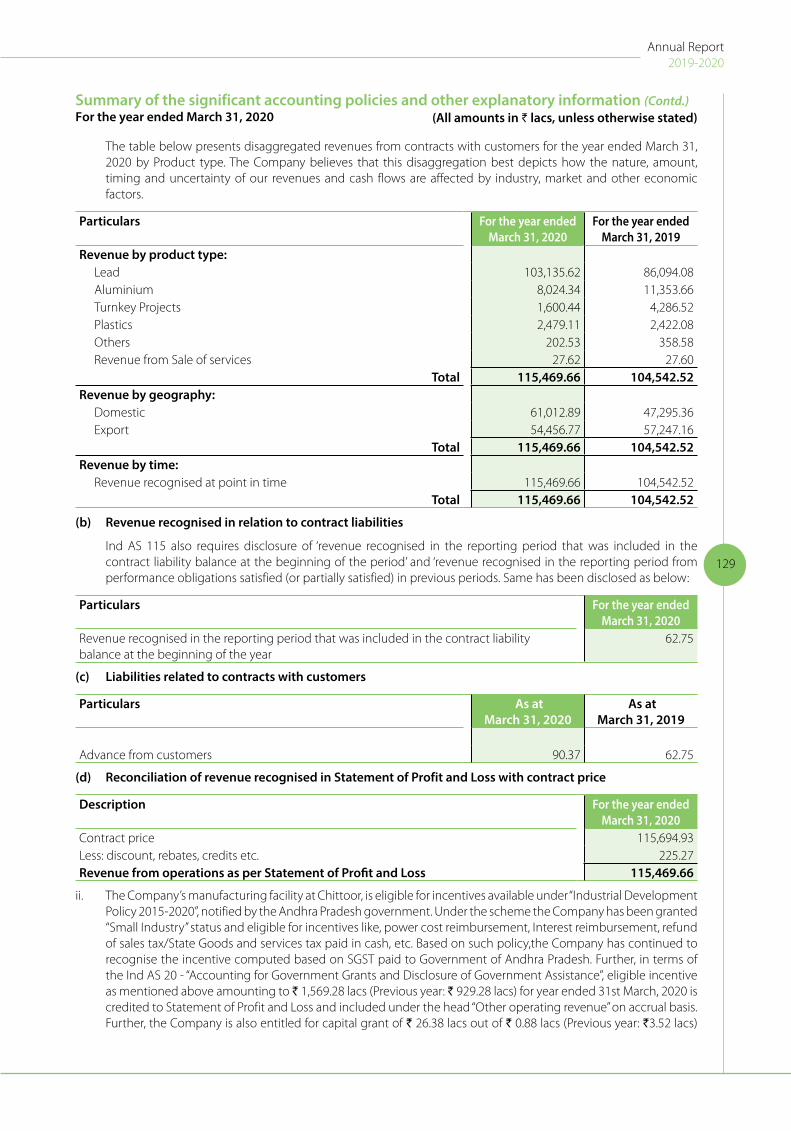
129
Annual Report2019-2020
The table below presents disaggregated revenues from contracts with customers for the year ended March 31, 2020 by Product type. The Company believes that this disaggregation best depicts how the nature, amount, timing and uncertainty of our revenues and cash flows are affected by industry, market and other economic factors.
Particulars For the year ended March 31, 2020
For the year ended March 31, 2019
Revenue by product type:Lead 103,135.62 86,094.08 Aluminium 8,024.34 11,353.66 Turnkey Projects 1,600.44 4,286.52 Plastics 2,479.11 2,422.08 Others 202.53 358.58 Revenue from Sale of services 27.62 27.60
Total 115,469.66 104,542.52Revenue by geography:
Domestic 61,012.89 47,295.36 Export 54,456.77 57,247.16
Total 115,469.66 104,542.52Revenue by time:
Revenue recognised at point in time 115,469.66 104,542.52 Total 115,469.66 104,542.52
(b) Revenue recognised in relation to contract liabilities
Ind AS 115 also requires disclosure of ‘revenue recognised in the reporting period that was included in the contract liability balance at the beginning of the period’ and ‘revenue recognised in the reporting period from performance obligations satisfied (or partially satisfied) in previous periods. Same has been disclosed as below:
Particulars For the year ended March 31, 2020
Revenue recognised in the reporting period that was included in the contract liability balance at the beginning of the year
62.75
(c) Liabilities related to contracts with customers
Particulars As at March 31, 2020
As at March 31, 2019
Advance from customers 90.37 62.75
(d) Reconciliation of revenue recognised in Statement of Profit and Loss with contract price
Description For the year ended March 31, 2020
Contract price 115,694.93 Less: discount, rebates, credits etc. 225.27 Revenue from operations as per Statement of Profit and Loss 115,469.66
ii. The Company’s manufacturing facility at Chittoor, is eligible for incentives available under “Industrial Development Policy 2015-2020”, notified by the Andhra Pradesh government. Under the scheme the Company has been granted “Small Industry” status and eligible for incentives like, power cost reimbursement, Interest reimbursement, refund of sales tax/State Goods and services tax paid in cash, etc. Based on such policy,the Company has continued to recognise the incentive computed based on SGST paid to Government of Andhra Pradesh. Further, in terms of the Ind AS 20 - “Accounting for Government Grants and Disclosure of Government Assistance”, eligible incentive as mentioned above amounting to ` 1,569.28 lacs (Previous year: ` 929.28 lacs) for year ended 31st March, 2020 is credited to Statement of Profit and Loss and included under the head “Other operating revenue” on accrual basis. Further, the Company is also entitled for capital grant of ` 26.38 lacs out of ` 0.88 lacs (Previous year: `3.52 lacs)
Summary of the significant accounting policies and other explanatory information (Contd.)For the year ended March 31, 2020 (All amounts in ` lacs, unless otherwise stated)
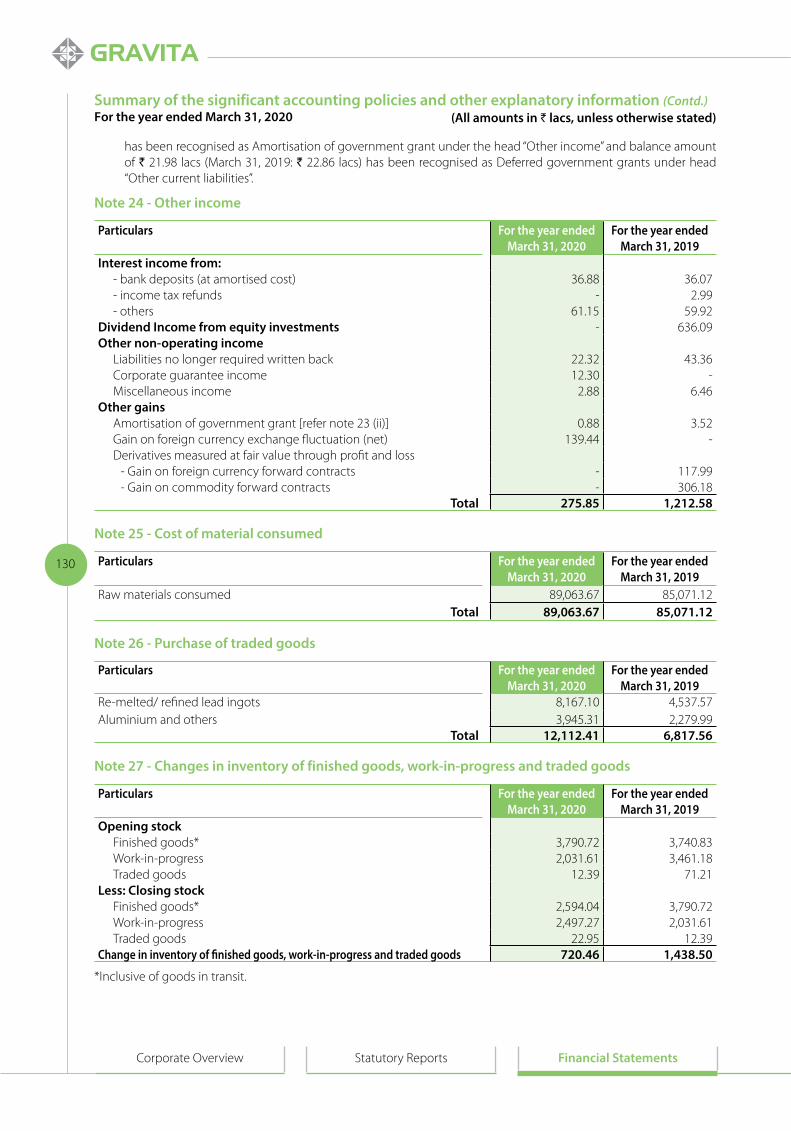
130
Corporate Overview Statutory Reports Financial Statements
has been recognised as Amortisation of government grant under the head “Other income” and balance amount of ` 21.98 lacs (March 31, 2019: ` 22.86 lacs) has been recognised as Deferred government grants under head “Other current liabilities”.
Note 24 - Other income
Particulars For the year ended March 31, 2020
For the year ended March 31, 2019
Interest income from:- bank deposits (at amortised cost) 36.88 36.07 - income tax refunds - 2.99 - others 61.15 59.92
Dividend Income from equity investments - 636.09 Other non-operating income
Liabilities no longer required written back 22.32 43.36 Corporate guarantee income 12.30 -Miscellaneous income 2.88 6.46
Other gainsAmortisation of government grant [refer note 23 (ii)] 0.88 3.52 Gain on foreign currency exchange fluctuation (net) 139.44 -Derivatives measured at fair value through profit and loss
- Gain on foreign currency forward contracts - 117.99 - Gain on commodity forward contracts - 306.18
Total 275.85 1,212.58
Note 25 - Cost of material consumed
Particulars For the year ended March 31, 2020
For the year ended March 31, 2019
Raw materials consumed 89,063.67 85,071.12 Total 89,063.67 85,071.12
Note 26 - Purchase of traded goods
Particulars For the year ended March 31, 2020
For the year ended March 31, 2019
Re-melted/ refined lead ingots 8,167.10 4,537.57 Aluminium and others 3,945.31 2,279.99
Total 12,112.41 6,817.56
Note 27 - Changes in inventory of finished goods, work-in-progress and traded goods
Particulars For the year ended March 31, 2020
For the year ended March 31, 2019
Opening stockFinished goods* 3,790.72 3,740.83 Work-in-progress 2,031.61 3,461.18 Traded goods 12.39 71.21
Less: Closing stockFinished goods* 2,594.04 3,790.72 Work-in-progress 2,497.27 2,031.61 Traded goods 22.95 12.39
Change in inventory of finished goods, work-in-progress and traded goods 720.46 1,438.50
*Inclusive of goods in transit.
Summary of the significant accounting policies and other explanatory information (Contd.)For the year ended March 31, 2020 (All amounts in ` lacs, unless otherwise stated)
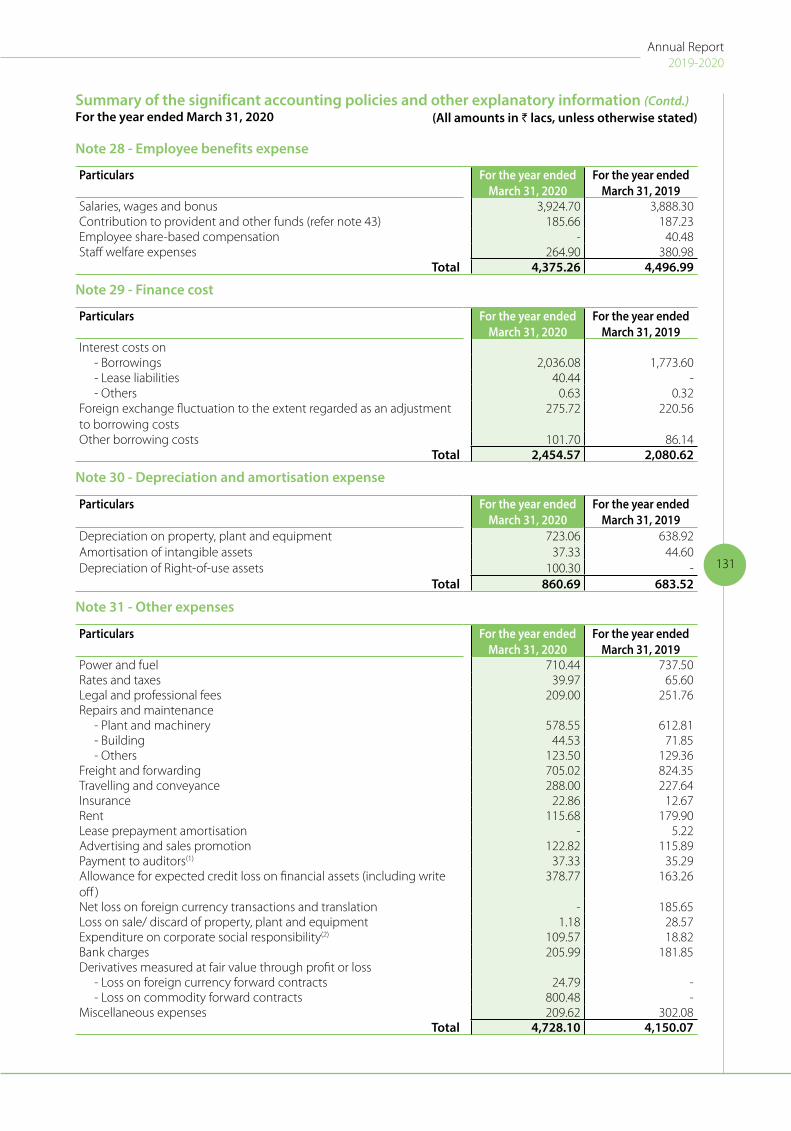
131
Annual Report2019-2020
Note 28 - Employee benefits expense
Particulars For the year ended March 31, 2020
For the year ended March 31, 2019
Salaries, wages and bonus 3,924.70 3,888.30 Contribution to provident and other funds (refer note 43) 185.66 187.23 Employee share-based compensation - 40.48 Staff welfare expenses 264.90 380.98
Total 4,375.26 4,496.99
Note 29 - Finance cost
Particulars For the year ended March 31, 2020
For the year ended March 31, 2019
Interest costs on- Borrowings 2,036.08 1,773.60 - Lease liabilities 40.44 -- Others 0.63 0.32
Foreign exchange fluctuation to the extent regarded as an adjustment to borrowing costs
275.72 220.56
Other borrowing costs 101.70 86.14 Total 2,454.57 2,080.62
Note 30 - Depreciation and amortisation expense
Particulars For the year ended March 31, 2020
For the year ended March 31, 2019
Depreciation on property, plant and equipment 723.06 638.92 Amortisation of intangible assets 37.33 44.60 Depreciation of Right-of-use assets 100.30 -
Total 860.69 683.52
Note 31 - Other expenses
Particulars For the year ended March 31, 2020
For the year ended March 31, 2019
Power and fuel 710.44 737.50 Rates and taxes 39.97 65.60 Legal and professional fees 209.00 251.76 Repairs and maintenance
- Plant and machinery 578.55 612.81 - Building 44.53 71.85 - Others 123.50 129.36
Freight and forwarding 705.02 824.35 Travelling and conveyance 288.00 227.64 Insurance 22.86 12.67 Rent 115.68 179.90 Lease prepayment amortisation - 5.22 Advertising and sales promotion 122.82 115.89 Payment to auditors(1) 37.33 35.29 Allowance for expected credit loss on financial assets (including write off )
378.77 163.26
Net loss on foreign currency transactions and translation - 185.65 Loss on sale/ discard of property, plant and equipment 1.18 28.57 Expenditure on corporate social responsibility(2) 109.57 18.82 Bank charges 205.99 181.85 Derivatives measured at fair value through profit or loss
- Loss on foreign currency forward contracts 24.79 -- Loss on commodity forward contracts 800.48 -
Miscellaneous expenses 209.62 302.08 Total 4,728.10 4,150.07
Summary of the significant accounting policies and other explanatory information (Contd.)For the year ended March 31, 2020 (All amounts in ` lacs, unless otherwise stated)

132
Corporate Overview Statutory Reports Financial Statements
(1) Payment to auditors
Particulars For the year ended March 31, 2020
For the year ended March 31, 2019
As auditor- Audit fee 31.50 31.00
In other capacity- Certification and other matters 1.80 0.70 - Reimbursement of out of pocket expenses 4.03 3.59
Total 37.33 35.29
(2) Details of corporate social responsibility expenditure
Particulars For the year ended March 31, 2020
For the year ended March 31, 2019
Amount required to be spent by the Company 59.76 44.27Amount spent during the year- Construction or acquisition of any asset - -- On purposes other than above 109.57 18.82
Note 32 - Exceptional items
‘The exceptional item amounting to ` 381.86 lacs for the year ended March 31, 2020 represents loss on sale of investment in subsidiary.
Note 33 - Tax expense
Particulars For the year ended March 31, 2020
For the year ended March 31, 2019
Current taxCurrent tax expense 549.40 495.93 Taxes relating to earlier year 60.83 (24.90)
610.23 471.03 Deferred taxIn respect of current year (35.36) 97.54 Minimum alternate tax credit (created) - (54.11)
(35.36) 43.43 Income tax recognised in Profit and Loss 574.87 514.46
The reconciliation of the estimated tax expense at statutory income tax rate to income tax expense reported in the statement of profit and loss is as follows:Accounting profit before tax 2,818.01 2,409.75 Statutory income tax rate 34.94% 34.94%Tax expense at statutory income tax rate 984.73 842.06 Tax effect of amounts which are not deductible/ (taxable) in calculating taxable income:Effect of income that is exempt from taxation (under section 80IA, 10(2A) and 10A of Income-tax Act, 1961)*
(614.10) (155.25)
Dividend Income - chargeable at different rate - (111.14)Effect of expenses that are not deductible in determining taxable profit 171.87 8.47 Movement in tax provision relating to prior years 60.83 (56.29)Others (28.45) (13.39)
Income tax expense recognised in Statement of Profit and Loss 574.87 514.46
*Deferred tax has not been created on incentive income in Chittoor plant, considering the same will be realised in the period of exemption available under section 80IA of Income tax Act, 1961.
Summary of the significant accounting policies and other explanatory information (Contd.)For the year ended March 31, 2020 (All amounts in ` lacs, unless otherwise stated)

133
Annual Report2019-2020
Note 34 - Disclosure as per Section 186(4) of the Companies Act, 2013
Particulars March 31, 2020 March 31, 2019Amount
outstandingMaximum
amount outstanding
during the year
Amount outstanding
Maximum amount
outstanding during the
yearCorporate guarantee given for related parties:- M/s Gravita Metal Inc(i) 891.64 900.00 863.43 900.00 - Gravita Netherlands B.V.(i) 1,827.86 3,150.00 1,788.99 3,150.00 Loan given to related parties:- Noble Build Estate Private Limited(i) (ii) 367.13 367.13 340.04 340.04 - Gravita Employee Welfare Trust(ii) (iii) (iv) 510.79 510.79 259.38 259.38 Investment in subsidiaries:- Gravita Infotech Limited(i) 26.09 26.09 26.09 26.09 - Gravita Ghana Limited(i) 123.66 123.66 123.66 123.66 - Gravita Global Pte Limited(i) 728.60 728.60 728.60 728.60 - Noble Build Estate Private Limited(i) 74.96 74.96 74.96 74.96 Investment in partnership firm: (Fixed and current)- M/s Shasin Industries (Formerly known as M/s Gravita Metals)(i)
- 640.01 640.01 640.01
-M/s Gravita Metal Inc(i) 533.82 533.82 749.17 749.17 -M/s Gravita Infotech(i) 6.84 6.84 8.53 8.53 - M/s Recycling Infotech LLP(i) (0.62) (0.62) (0.78) (0.78)
(i) For business purposes of the entity.
(ii) Including interest till reporting date since inception of the loan agreement.
(iii) Gross of impairment.
(iv) For the purpose of implementing Gravita Stock Appreciation Right Scheme 2017 by acquiring equity shares of the company from secondary market.
Note 35 - Contingent liabilities and commitments
(a) Contingent liabilities
Particulars As at March 31, 2020
As at March 31, 2019
(i) Corporate guarantee given to bank for loans availed by the following related parties:- M/s Gravita Metal Inc 900.00 900.00 - Gravita Netherlands B.V.# (Cash margin given of Rs. 200 lacs) 3,150.00 3,150.00 Dues outstanding in respect of above, considered contingent- M/s Gravita Metal Inc 891.64 863.43 - Gravita Netherlands B.V.# 1,827.86 1,788.99
(ii) Claim against the company not acknowledged as debt*- Excise Duty/Customs Duty/Service Tax/Goods and services Tax 445.77 240.69 - Value Added Tax/ Central Sales Tax/Entry Tax 1.87 111.90
3,167.14 3,005.01
# Secured by way of mortgaging its Industrial Land, Building and Other Assets located at Plot No. PA-011-006, SEZ, Village Kalwara, Tehsil Sanganer, Jaipur.
* All the matters above other than guarantee given by the Company are subject to legal proceedings in the ordinary course of business. The management is confident that its position to be upheld in the appeals pending before various appellate authorities and no liability could arise on the Company on account of these proceedings.
Summary of the significant accounting policies and other explanatory information (Contd.)For the year ended March 31, 2020 (All amounts in ` lacs, unless otherwise stated)

134
Corporate Overview Statutory Reports Financial Statements
(b) Commitments
Particulars As at March 31, 2020
As at March 31, 2019
Estimated amount of contracts remaining to be executed on capital account and not provided for (net of capital advances)
126.67 141.88
Note 36 - Earning per share
Particulars For the year ended March 31, 2020
For the year ended March 31, 2019
Profit for the year attributable to equity shares (Rs. in lacs) (A) 2,243.14 1,895.29 Total shares outstanding at the beginning of the year (in numbers) (B) 68,746,714 68,704,614 Add: Weighted average number of shares issued during the year on account of exercise of employee stock option (C)
270,514 39,216
Weighted-average number of equity shares for basic EPS (D) = (B + C) 69,017,228 68,743,830 Effect of dilution:Add: Weighted average number of potential dilutive equity shares on account of employee stock options outstanding (E)
- 284,068
Weighted-average number of equity shares for diluted EPS (F) = (D + E) 69,017,228 69,027,898 Basic earnings per share (in `) (A/D) 3.25 2.76
Diluted earnings per share (in `) (A/F) 3.25 2.75
Note 37 - Segment ReportingSegment information has been provided under the notes forming part of the consolidated financial statement for the year ended March 31, 2020 as per para 4 of Indian Accounting Standard (Ind AS) 108 “Operating Segments”, specified under Section 133 of the Companies Act, 2013.
Note 38 - Reconciliation of liabilities arising from financing activitiesFor financial year 2019-20
Particulars Non-current borrowing^
Current borrowing
Lease liabilities
As at March 31, 2019 2,122.75 19,485.74 454.88 Cash inflow 2,928.15 - -cash outflow (819.90) (1,143.55) (119.48)Non-cash changes- Amortisation of transaction costs 12.86 - -- Exchange loss on borrowing - 80.97 -- Interest accrued - - 40.44 As at March 31, 2020 4,243.86 18,423.16 375.84
^ Including current maturities
For financial year 2018-19
Particulars Non-current borrowing^
Current borrowing
As at March 31, 2018 2,153.20 18,558.11 Cash inflow 600.00 928.36 cash outflow (634.98) -Non-cash changes- Amortisation of transaction costs 4.53 -- Exchange gain on borrowing - (0.73)As at March 31, 2019 2,122.75 19,485.74
^ Including current maturities
Summary of the significant accounting policies and other explanatory information (Contd.)For the year ended March 31, 2020 (All amounts in ` lacs, unless otherwise stated)

135
Annual Report2019-2020
Not
e 39
- D
iscl
osur
e of
eff
ects
of h
edge
acc
ount
ing
on fi
nanc
ial p
ositi
on(a
) D
iscl
osur
e of
eff
ects
of h
edge
acc
ount
ing
on fi
nanc
ial p
ositi
on
As
at M
arch
31,
202
0
Type
of h
edge
and
risk
sNo
min
al
valu
e in
USD
Carr
ying
am
ount
of
hedg
ing
inst
rum
ent
Mat
urity
dat
esHe
dge
ratio
Aver
age
strik
e pr
ice
Chan
ge in
fair
valu
e of
hed
ging
in
stru
men
t
Chan
ge in
the
valu
e of
hed
ged
item
use
d as
the
basi
s for
re
cogn
isin
g he
dge
effec
tiven
ess
Cash
flow
hed
gePr
e-sh
ipm
ent c
redi
t in
fore
ign
curr
ency
(PC
FCs)
28.0
0 2,
110.
71
May
15,
202
0Se
ptem
ber 1
6, 2
020
1:1
` 72
.99/
USD
152.
64
152.
64
As
at M
arch
31,
201
9
Type
of h
edge
and
risk
sNo
min
al
valu
e in
USD
Carr
ying
am
ount
of
hedg
ing
inst
rum
ent
Mat
urity
dat
esHe
dge
ratio
Aver
age
strik
e pr
ice
Chan
ge in
fair
valu
e of
hed
ging
in
stru
men
t
Chan
ge in
the
valu
e of
hed
ged
item
use
d as
the
basi
s for
re
cogn
isin
g he
dge
effec
tiven
ess
Cash
flow
hed
gePr
e-sh
ipm
ent c
redi
t in
fore
ign
curr
ency
(PC
FCs)
83.
34
5,7
64.7
9 A
ugus
t 8, 2
019
- Se
ptem
ber 8
, 201
91:
1`
69.1
9/ U
SD 3
96.7
5 3
96.7
5
(b)
Dis
clos
ure
of e
ffec
ts o
f hed
ge a
ccou
ntin
g on
fina
ncia
l per
form
ance
For t
he y
ear e
nded
Mar
ch 3
1, 2
020
Type
of h
edge
and
risk
sCh
ange
in th
e va
lue
of
hedg
ing
inst
rum
ent i
n ot
her
com
preh
ensiv
e lo
ss (i
ncom
e)
Hedg
e in
effec
tiven
ess
reco
gnise
d in
pro
fit o
r lo
ss
Amou
nt re
clas
sified
from
cash
flo
w h
edgi
ng re
serv
e to
pro
fit
or lo
ss
Line
item
affe
cted
in st
atem
ent o
f pro
fit a
nd
loss
bec
ause
of r
ecla
ssifi
catio
n an
d he
dge
ineff
ectiv
enes
sCa
sh fl
ow h
edge
Pre-
ship
men
t cre
dit i
n fo
reig
n cu
rren
cy (P
CFC
s)80
.97
-71
.67
Fina
nce
cost
and
oth
er in
com
e
For t
he y
ear e
nded
Mar
ch 3
1, 2
019
Type
of h
edge
and
risk
sCh
ange
in th
e va
lue
of
hedg
ing
inst
rum
ent i
n ot
her
com
preh
ensiv
e lo
ss (i
ncom
e)
Hedg
e in
effec
tiven
ess
reco
gnise
d in
pro
fit o
r lo
ss
Amou
nt re
clas
sified
from
cash
flo
w h
edgi
ng re
serv
e to
pro
fit
or lo
ss
Line
item
affe
cted
in st
atem
ent o
f pro
fit
and
loss
bec
ause
of r
ecla
ssifi
catio
n an
d he
dge
ineff
ectiv
enes
sCa
sh fl
ow h
edge
Pre-
ship
men
t cre
dit i
n fo
reig
n cu
rren
cy (P
CFC
s) (0
.73)
- 3
97.4
8 Fi
nanc
e co
st a
nd o
ther
exp
ense
s
Sum
mar
y of
the
sign
ifica
nt a
ccou
ntin
g po
licie
s an
d ot
her e
xpla
nato
ry in
form
atio
n (C
ontd
.)Fo
r the
yea
r end
ed M
arch
31,
202
0(A
ll am
ount
s in
` la
cs, u
nles
s ot
herw
ise
stat
ed)

136
Corporate Overview Statutory Reports Financial Statements
(c) Movements in cash flow hedging reserve
Particulars March 31, 2020 March 31, 2019 Amount at the beginning of the year (0.47) -Add: Changes in value of PCFCs 152.64 396.75 Less: Amount reclassified to profit or loss (71.67) (397.48)Less: Deferred tax relating to above (net) (28.29) 0.26 Amount at the end of the year 52.21 (0.47)
Note 40 - Financial Instruments
A Financial assets and liabilities
The accounting classification of each category of financial instruments, and their carrying amounts, are set out below:
Particulars NoteAs at March 31, 2020 As at March 31, 2019
Amortised cost FVTPL Amortised
cost FVTPL
Financial assetsInvestments* 6 0.03 - 0.03 -Trade receivables 11 6,158.58 - 10,666.70 -Other financial assets 8 2,047.26 - 917.48 -Derivative assets 8 - - - 119.46 Loans 7 881.02 - 688.46 -Cash and cash equivalents 12 84.54 - 387.15 -bank balances 13 640.85 - 652.72 -
Total financial assets 9,812.28 - 13,312.54 119.46
Financial liabilitiesBorrowings 16 & 21 22,667.02 - 21,608.49 -Lease liabilities 17 375.84 - - -Trade payables 20 7,787.52 - 10,784.69 -Other financial liabilities 21 70.67 - 41.48 -Derivative liabilities 8 - 606.53 - -
Total financial liabilities 30,901.05 606.53 32,434.66 -
* Investment in subsidiaries are measured at cost as per Ind AS 27, ‘Separate financial statements’ and hence, not presented here.
B Fair values hierarchy
The fair value of financial instruments as referred to in note (A) above has been classified into three categories depending on the inputs used in the valuation technique. The hierarchy gives the highest priority to quoted prices in active markets for identical assets or liabilities (Level 1 measurements) and lowest priority to unobservable inputs (Level 3 measurements).
The categories used are as follows:
Level 1: Quoted prices for identical instruments in an active market;
Level 2: Directly (i.e. as prices) or indirectly (i.e. derived from prices) observable market inputs, other than Level 1 inputs; and
Level 3: Inputs which are not based on observable market data (unobservable inputs). Fair values are determined in whole or in part using a net asset value or valuation model based on assumptions that are neither supported by prices from observable current market transactions in the same instrument nor are they based on available market data.
Summary of the significant accounting policies and other explanatory information (Contd.)For the year ended March 31, 2020 (All amounts in ` lacs, unless otherwise stated)

137
Annual Report2019-2020
B.1 Financial assets and liabilities measured at fair value - recurring fair value measurements
Particulars Note Level 1 Level 2 Level 3 TotalAs at March 31, 2020Financial liabilities measured at fair value through profit or lossDerivative liabilities 8 - 606.53 - 606.53 As at March 31, 2019Financial assets measured at fair value through profit or lossDerivative assets 8 - 119.46 - 119.46
Valuation process and technique used to determine fair value
(i) The fair value of investments in quoted equity shares is based on the current bid price of respective investment as at the balance sheet date.
(ii) The fair value of investments in unquoted equity shares is estimated at their respective costs, since those companies do not have any significant operations and there has neither been any significant change in their performance since initial recognition nor there is any expectation of such changes in foreseeable future.
(iii) The Company enters into commodity contracts with financial institutions for hedging price risk of lead arising from its import and export. Fair values of such contracts are determined based on observable rates of the commodity for similar contracts for the remaining maturity on the balance sheet date.
(iv) There are no significant changes in value of level 3 investment measured at fair value through other comprehensive income.
B.2 Fair value of instruments measured at amortised cost
Fair value of instruments measured at amortised cost for which fair value is disclosed is as follows, these fair values are calculated using Level 3 inputs:
Particulars Note March 31, 2020 March 31, 2019Carrying
valueFair value Carrying
valueFair value
Non-current financial assetsInvestments 6 0.03 0.03 0.03 0.03 Security deposits 7 156.88 156.88 92.95 92.95 Deposits with bank (with remaining maturity more than 12 months)
8 1.26 1.26 1.26 1.26
Loans (net of impairment) 7 696.35 696.35 503.34 503.34
Non-current financial liabilitiesBorrowings 16 3,000.02 3,000.02 1,227.68 1,227.68 Lease liabilities 17 260.87 260.87 - -
The management assessed that fair values of current loans, current financial assets, cash and cash equivalents, other bank balances, trade receivables, short term borrowings, trade payables , current lease liabilities and other current financial liabilities approximate their respective carrying amounts largely due to the short-term maturities of these instruments. The fair value of the financial assets and liabilities is disclosed at the amount at which the instrument could be exchanged in a current transaction between willing parties, other than in a forced or liquidation sale. The following methods and assumptions were used to estimate the fair values:
(i) Non-current loans and non-current financial liabilities are evaluated by the Company based on parameters such as interest rates, individual creditworthiness of the counterparty/borrower and other market risk factors.
(ii) The fair values of the Company’s fixed interest-bearing liabilities, loans and receivables are determined by applying discounted cash flows (‘DCF’) method, using discount rate that reflects the issuer’s borrowing rate as at the end of
the reporting period. The own non-performance risk as at March 31, 2020 was assessed to be insignificant.
(iii) All the other long term borrowing facilities availed by the Company are variable rate facilities which are subject to changes in underlying interest rate indices. Further, the credit spread on these facilities are subject to change
Summary of the significant accounting policies and other explanatory information (Contd.)For the year ended March 31, 2020 (All amounts in ` lacs, unless otherwise stated)

138
Corporate Overview Statutory Reports Financial Statements
with changes in Company's creditworthiness. The management believes that the current rate of interest on these loans are in close approximation from market rates applicable to the Company. Therefore, the management estimates that the fair value of these borrowings are approximate to their respective carrying values.
Note 41 - Financial Risk Management
Risk Management
‘The Company’s activities expose it to market risk, liquidity risk and credit risk. The Company’s Board of Directors has overall responsibility for the establishment and oversight of the Company’s risk management framework. This note explains the sources of risk which the entity is exposed to and how the entity manages the risk and the related impact in the financial statements.
Risk Exposure arising from Measurement ManagementCredit risk Loans, Cash and cash equivalents, trade receivables,
derivative financial instruments and other financial assets measured at amortised cost
Ageing analysis, Credit ratings
Bank deposits, diversification of asset base, credit limits
Liquidity risk Borrowings and other liabilities Rolling cash flow forecasts
Availability of committed credit lines and borrowing facilities
Market risk - foreign exchange
Recognised financial assets and liabilities not denominated in Indian rupee (INR)
Cash flow forecasting
Forward foreign exchange contracts
Market risk - interest rate
Long-term borrowings at variable rates Sensitivity analysis Negotiation of terms that reflect the market factors
The Company’s risk management is carried out by a central treasury department (of the Company) under policies approved by the board of directors. The board of directors provides written principles for overall risk management, as well as policies covering specific areas, such as foreign exchange risk, interest rate risk, credit risk and investment of excess liquidity.
C.1 Credit risk
Credit risk is the risk that a counterparty fails to discharge its obligation to the Company. The Company's exposure to credit risk is influenced mainly by loans, cash and cash equivalents, trade receivables, derivative financial instruments and other financial assets measured at amortised cost. The Company continuously monitors defaults of customers and other counterparties and incorporates this information into its credit risk controls.
(a) Credit risk management
The Company assesses and manages credit risk based on internal credit rating system. Internal credit rating is performed for each class of financial instruments with different characteristics. The Company assigns the following credit ratings to each class of financial assets based on the assumptions, inputs and factors specific to the class of financial assets.
(i) Low credit risk
(ii) Moderate credit risk
(iii) High credit risk
Based on business environment in which the Company operates, a default on a financial asset is considered when the counter party fails to make payments within the agreed time period as per contract. Loss rates reflecting defaults are based on actual credit loss experience and considering differences between current and historical economic conditions.
Assets are written off when there is no reasonable expectation of recovery, such as a debtor declaring bankruptcy or a litigation decided against the Company. The Company continues to engage with parties whose balances are written off and attempts to enforce repayment. Recoveries made are recognised in Statement of Profit and Loss.
Summary of the significant accounting policies and other explanatory information (Contd.)For the year ended March 31, 2020 (All amounts in ` lacs, unless otherwise stated)

139
Annual Report2019-2020
The Company provides for expected credit loss based on the following:
Basis of categorisation
Asset class exposed to credit risk Provision for expected credit loss
Low credit risk Loans, trade receivables, cash and cash equivalents, derivative financial instruments, financial assets measured at amortised cost
12 month expected credit loss
High credit risk Loans and trade receivables Trade receivables - Life time expected credit loss or specific provision whichever is higher
Financial assets that expose the entity to credit risk*
Particulars Note At at March 31, 2020
At at March 31, 2019
Low credit riskSecurity deposits 7 184.67 185.12 Loans 7 696.35 503.34 Trade receivables 11 6,158.58 10,666.70 Cash and cash equivalents 12 84.54 387.15 Other bank balances 13 640.85 652.72 Other financial assets (including derivative assets) 8 2,047.26 1,036.94
High credit riskTrade receivables 11 373.16 118.58 Loans 7 181.57 96.08
Total 10,366.98 13,646.63
*These represent carrying values of financial assets, without deduction for expected credit losses
Cash and cash equivalents and bank deposits
Credit risk related to cash and cash equivalents and bank deposits is managed by only accepting highly rated banks and diversifying bank deposits and accounts in different banks across the country.
Derivative financial instruments
Derivative financial instruments are considered to have low credit risk since the contracts are with reputable financial institutions.
Trade receivables
Trade receivables are generally unsecured and non-interest bearing. There is no significant concentration of credit risk. The Company’s credit risk management policy in relation to trade receivables involves periodically assessing the financial reliability of customers, taking into account their financial position, past experience and other factors. The utilization of credit limit is regularly monitored. The Company’s credit risk is mainly confined to the risk of customers defaulting against credit sales made. Outstanding trade receivables are regularly monitored by credit monitoring Company. The Company has also taken advances from its customers, which mitigate the credit risk to an extent. In respect of trade receivables, the Company recognises a impairment for lifetime expected credit losses after evaluating the individual probabilities of default of its customers which are duly based on the inputs received from the marketing teams of the Company.
Other financial assets measured at amortised cost
Other financial assets measured at amortised cost includes loans to related parties, loans to employees, security deposits and others. Credit risk related to these other financial assets is managed by monitoring the recoverability of such amounts continuously, while at the same time internal control system are in place ensure the amounts are within defined limits.
Summary of the significant accounting policies and other explanatory information (Contd.)For the year ended March 31, 2020 (All amounts in ` lacs, unless otherwise stated)

140
Corporate Overview Statutory Reports Financial Statements
(b) Expected credit losses for financial assets
(i) Financial assets (other than trade receivables)
Company provides for expected credit losses on financial assets other than trade receivables by assessing individual financial instruments for expectation of any credit losses.
- For cash & cash equivalents, other bank balances and derivative financial instruments- Since the Company deals with only high-rated banks and financial institutions, credit risk in respect of cash and cash equivalents, derivative financial instruments, other bank balances and bank deposits is evaluated as very low.
- For security deposits paid - Credit risk is considered low because the Company is in possession of the underlying asset.
- For other financial assets - Credit risk is evaluated based on Company knowledge of the credit worthiness of those parties and loss allowance is measured. For such financial assets, the Company policy is to provide for 12 month expected credit losses upon initial recognition and provide for lifetime expected credit losses upon significant increase in credit risk.
March 31, 2020 Notes Gross carrying amount
Expected probability of
default
Expected creditlosses
Carrying amount net of
impairment provision
Cash and cash equivalents 12 84.54 0.00% - 84.54 Other bank balances 13 640.85 0.00% - 640.85 Security deposits 7 184.67 0.00% - 184.67 Loans 7 877.92 20.68% 181.57 696.35 Other financial assets 8 2047.26 0.00% - 2047.26
March 31, 2019 Notes Gross carrying amount
Expected probability of
default
Expected creditlosses
Carrying amount net of
impairment provision
Cash and cash equivalents 12 387.15 0.00% - 387.15 Other bank balances 13 652.72 0.00% - 652.72 Security deposits 7 185.12 0.00% - 185.12 Loans 7 599.42 16.03% 96.08 503.34 Other financial assets 8 1,036.94 0.00% - 1,036.94
Reconciliation of loss allowance provision for loans from beginning to end of reporting period:
Reconciliation of loss allowance LoansLoss allowance as at April 1, 2018 - Changes in loss allowance 96.08 Loss allowance as at March 31, 2019 96.08 Changes in loss allowance 85.49 Loss allowance on March 31, 2020 181.57
(ii) Expected credit loss for trade receivables under simplified approach
As at March 31, 2020 and March 31, 2019, the Company considered the individual probabilities of default of its financial assets (other than trade receivables) and determined that in respect of counterparties with low credit risk, no default events are considered to be possible within the 6 months after the reporting date. In respect of trade receivables, the Company measures the loss allowance at an amount equal to lifetime expected credit losses using a simplified approach.
Summary of the significant accounting policies and other explanatory information (Contd.)For the year ended March 31, 2020 (All amounts in ` lacs, unless otherwise stated)

141
Annual Report2019-2020
March 31, 2020 Gross carrying amount
% of expected credit losses
Allowance for expected credit
losses
Net carrying amount of
impairment provision
Amount not yet due 4,147.70 0.00% - 4,147.70 Between one to six month overdue 2,043.42 1.59% 32.54 2,010.88 Greater than six month overdue 340.62 100.00% 340.62 -
Total 6,531.74 373.16 6,158.58
March 31, 2019 Gross carrying amount
% of expected credit losses
Allowance for expected credit
losses
Net carrying amount of
impairment provision
Amount not yet due 6,988.07 0.00% - 6,988.07 Between one to six month overdue 3,216.98 0.00% - 3,216.98 Greater than six month overdue 580.23 20.44% 118.58 461.65
Total 10,785.28 118.58 10,666.70
Reconciliation of loss allowance provision for Trade receivables from beginning to end of reporting period:
Reconciliation of loss allowance Trade receivablesLoss allowance as at April 1, 2018 79.01 Changes in loss allowance 39.57 Loss allowance as at March 31, 2019 118.58 Changes in loss allowance 254.58 Loss allowance on March 31, 2020 373.16
C.2 Liquidity risk
Liquidity risk is the risk that the Company will encounter difficulty in raising funds to meet commitments associated with financial instruments that are settled by delivering cash or another financial asset. Liquidity risk may result from an inability to sell a financial asset quickly at close to its fair value.
The Company has an established liquidity risk management framework for managing its short term, medium term and long term funding and liquidity management requirements. The Company’s exposure to liquidity risk arises primarily from mismatches of the maturities of financial assets and liabilities. The Company manages the liquidity risk by maintaining adequate funds in cash and cash equivalents. The Company also has adequate credit facilities agreed with banks to ensure that there is sufficient cash to meet all its normal operating commitments in a timely and cost-effective manner.
(a) Financing arrangements
The Company has access to the following undrawn borrowing facilities at the end of the reporting period:
Particulars As at March 31, 2020
As atMarch 31, 2019
Secured* 4,736.84 2,024.26
* Working capital facilities due for review every year
Summary of the significant accounting policies and other explanatory information (Contd.)For the year ended March 31, 2020 (All amounts in ` lacs, unless otherwise stated)

142
Corporate Overview Statutory Reports Financial Statements
(b) Maturities of financial liabilities
The tables below analyse the Company’s financial liabilities into relevant maturity groupings based on their contractual maturities.
The amounts disclosed in the table are the contractual undiscounted cash flows. Balances due within 12 months equal their carrying balances as the impact of discounting is not significant:
March 31, 2020 Less than 1 year
1-5 year More than 5 years
Total
Non-derivativesBorrowing (including current maturities of non-current borrowings) along with estimated future interest obligation
1,630.65 3,515.16 - 5,145.81
Short term borrowings 18,423.16 - - 18,423.16 Lease liabilities 114.97 237.52 170.08 522.57 Trade payables 7,787.52 - - 7,787.52 Other financial liabilities 47.50 - - 47.50 DerivativesDerivative Liability 606.53 - 606.53
Total 28,610.33 3,752.68 170.08 32,533.09
March 31, 2019 Less than 1 year
1-5 year More than 5 years
Total
Non-derivativesBorrowing (including current maturities of non-current borrowings) along with estimated future interest obligation
1,048.04 1,441.61 - 2,489.65
Short term borrowings 19,485.74 - - 19,485.74 Trade payables 10,784.69 - - 10,784.69 Other financial liabilities 35.05 - - 35.05
Total 31,353.52 1,441.61 - 32,795.13
C.3 Market risk
(a) Foreign currency risk
The Company is exposed to foreign exchange risk in the normal course of its business. Multiple currency exposures arise from commercial transactions like sales, purchases, borrowings, recognized financial assets and liabilities (monetary items). Certain transactions of the Company act as natural hedge as a portion of both assets and liabilities are denominated in similar foreign currencies. For the remaining exposure to foreign exchange risk, the Company adapts the policy of selective hedging based on risk perception of management. Foreign exchange hedging contracts are carried at fair value. The Company’s exposure to foreign currency changes for all other currencies which are not stated below is not material. Foreign currency exposures that are not hedged by derivative instruments outstanding as on the balance sheet date are as under:
Particulars Financial assets Financial liabilitiesAs at
March 31, 2020As at
March 31, 2019As at
March 31, 2020As at
March 31, 2019USD 4,752.90 6,979.43 2,784.34 2,509.56 EURO - 13.88 - - GHS - 593.02 - -
Foreign exchange risk sensitivity analysis has been performed on the foreign currency exposures in the Company’s financial assets and financial liabilities at the reporting date, net of derivative contracts for hedging those exposures. Reasonably possible changes are based on an analysis of historic currency volatility, together with any relevant assumptions regarding near-term future volatility.
Summary of the significant accounting policies and other explanatory information (Contd.)For the year ended March 31, 2020 (All amounts in ` lacs, unless otherwise stated)

143
Annual Report2019-2020
The impact on the Company’s profit before tax and equity due to changes in the foreign currency exchange rates are given below:
Particulars For the Year ended March 31, 2020
For the Year ended March 31, 2019
USD SensitivityINR/USD - Increase by 5.45% (March 31, 2019 - 6.82%) 107.29 304.85 INR/USD - Decrease by 5.45% (March 31, 2019 - 6.82%) (107.29) (304.85)Euro SensitivityINR/EURO - Increase by 7.57% (March 31, 2019 - 7.26%) - 1.01 INR/EURO - Decrease by 7.57% (March 31, 2019 - 7.26%) - (1.01)GHS SensitivityINR/GHS - Increase by 1% (31 March 2019 - 1%) - 44.89 INR/GHS - Decrease by 1% (31 March 2019 - 1%) - (44.89)
Foreign exchange derivative contracts
The Company uses derivative financial instruments exclusively for hedging financial risks that arise from its commercial business or financing activities. The Company’s Corporate Treasury team manages its foreign currency risk by hedging transactions that are expected to occur within of 12 to 15 months for hedges of forecasted sales, purchases and capital expenditures. When a derivative is entered into for the purpose of being a hedge, the Company negotiates the terms of those derivatives to match the terms of the hedged exposure. For hedges of forecast transactions the derivatives cover the period of exposure from the point the cash flows of the transactions are forecasted up to the point of settlement of the resulting receivable or payable that is denominated in the foreign currency. All identified exposures are managed as per the policy duly approved by the Board of Directors.
Outstanding contracts
No. of deals Foreign currency (FCY) Nominal amountAs at
March 31, 2020As at
March 31, 2019As at
March 31, 2020As at
March 31, 2019As at
March 31, 2020As at
March 31, 2019USD / INR sell forward (2,000) - (2,000,000) - (150,771,800) - USD / INR Buy forward - 550 - 550,000 - 39,351,125
(b) Interest rate risk
(i) Financial liabilities
The Company’s policy is to minimise interest rate cash flow risk exposures on external financing. At March 31, 2020 and March 31, 2019, the Company is exposed to changes in interest rates through bank borrowings carrying
variable interest rates. The Company's investments in fixed deposits carry fixed interest rates.
Interest rate risk exposure
Below is the overall exposure of the Company to interest rate risk:
Particulars As atMarch 31, 2020
As atMarch 31, 2019
Variable rate borrowing 15,035.10 10,761.64 Fixed rate borrowing 7,631.92 10,846.85
Total borrowings 22,667.02 21,608.49
Sensitivity
Below is the sensitivity of profit or loss to changes in interest rates.
Particulars As atMarch 31, 2020
As atMarch 31, 2019
Interest sensitivity*Interest rates – increase by 100 basis points 150.35 107.62 Interest rates – decrease by 100 basis points (150.35) (107.62)
* Holding all other variables constant
Summary of the significant accounting policies and other explanatory information (Contd.)For the year ended March 31, 2020 (All amounts in ` lacs, unless otherwise stated)

144
Corporate Overview Statutory Reports Financial Statements
(c) Price risk Exposure The Company exposure to price risk arises from investments held and classified in the balance sheet either as fair
value through other comprehensive income or at fair value through profit or loss. To manage the price risk arising from investments, the Company diversifies its portfolio of assets. There are no investments held by the company which are measured at fair value either through profit and loss or fair value through other comprehensive income, hence the Company is not exposed to price risk.
Note 42 - Capital ManagementFor the purpose of the Company’s capital management, capital includes issued capital and all other equity reserves attributable to the equity shareholders of the Company. The primary objective of the Company when managing capital is to safeguard its ability to continue as a going concern and to maintain an optimal capital structure so as to maximize shareholder value.
As at March 31, 2020, the Company is not subject to any externally imposed capital requirements. In order to maintain or achieve an optimal capital structure, the Company allocates its capital for distribution as dividend or re-investment into business based on its long term financial plans. The Company’s management reviews the capital structure of the Company on a periodic basis. As part of review, the management considers the cost of capital and risk associated with each class of capital. The Company also evaluates its gearing measures like Debt Equity Ratio, Debt Service Coverage Ratio, Interest Service Coverage Ratio, Debt to EBIDTA Ratio to arrive at an appropriate level of debt and accordingly evolve its capital structure.
The following table summarises the capital of the Company:
Particulars As atMarch 31, 2020
As atMarch 31, 2019
Total equity 16,415.17 14,940.79 Non-current borrowings (including current maturities) 4,243.86 2,122.75 Current borrowings 18,423.16 19,485.74 Total capital (Debt + Equity) 39,082.19 36,549.28
Note 43 - Employee benefits plans
(i) Defined Contribution Plans
The Company makes contribution towards employees’ provident fund and employees’ deposit linked insurance scheme for qualifying employees. Under the schemes, the Company is required to contribute a specified percentage of payroll cost, as specified in the rules of the schemes, to these defined contribution schemes.
The Company has recognised for contributions to these plans in the Statement of Profit and Loss as under:
Particulars For the year endedMarch 31, 2020 March 31, 2019
Employer's contribution to provident funds 138.76 134.18 Employer’s contribution to employee state insurance 46.90 53.05
There are numerous interpretive issues relating to the Hon’ble Supreme Court (SC) judgement dated February 28, 2019 on provident fund. The Company has started recognising such expenditure/liability on account of enhanced provident fund contributions prospectively. Pending further clarification on the applicability of such ruling, the management is of the view that such ruling is applicable prospectively.
(ii) Defined benefits plans
The employees’ gratuity fund scheme managed by a trust namely ‘Gravita India Limited Employees Gratuity Trust’ is defined benefit plan. The gratuity plan provides for a lump sum payment to the employees at the time of separation from the service on completion of vested year of employment i.e. five years. The liability of gratuity plan is determined based on actuarial valuation as at the end of each financial year using the Projected Unit Credit Method, which recognises each period of service as giving rise to additional unit of employees benefit entitlement and measures each unit separately to build up the final obligation.
Earned leaves – Long term leaves includes earned leaves. These have been provided on accrual basis, based on year end actuarial valuation.
Summary of the significant accounting policies and other explanatory information (Contd.)For the year ended March 31, 2020 (All amounts in ` lacs, unless otherwise stated)
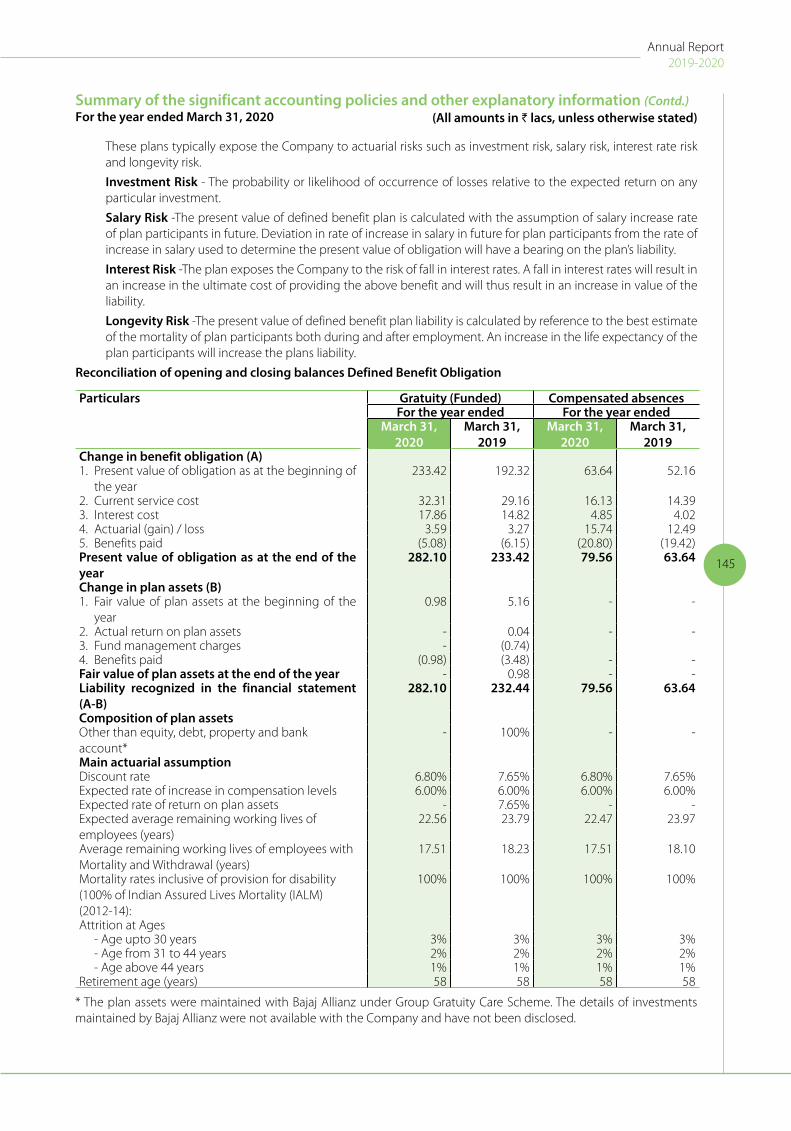
145
Annual Report2019-2020
These plans typically expose the Company to actuarial risks such as investment risk, salary risk, interest rate risk and longevity risk.
Investment Risk - The probability or likelihood of occurrence of losses relative to the expected return on any particular investment.
Salary Risk -The present value of defined benefit plan is calculated with the assumption of salary increase rate of plan participants in future. Deviation in rate of increase in salary in future for plan participants from the rate of increase in salary used to determine the present value of obligation will have a bearing on the plan’s liability.
Interest Risk -The plan exposes the Company to the risk of fall in interest rates. A fall in interest rates will result in an increase in the ultimate cost of providing the above benefit and will thus result in an increase in value of the liability.
Longevity Risk -The present value of defined benefit plan liability is calculated by reference to the best estimate of the mortality of plan participants both during and after employment. An increase in the life expectancy of the plan participants will increase the plans liability.
Reconciliation of opening and closing balances Defined Benefit Obligation
Particulars Gratuity (Funded) Compensated absencesFor the year ended For the year ended
March 31, 2020
March 31, 2019
March 31, 2020
March 31, 2019
Change in benefit obligation (A)1. Present value of obligation as at the beginning of
the year 233.42 192.32 63.64 52.16
2. Current service cost 32.31 29.16 16.13 14.39 3. Interest cost 17.86 14.82 4.85 4.02 4. Actuarial (gain) / loss 3.59 3.27 15.74 12.49 5. Benefits paid (5.08) (6.15) (20.80) (19.42)Present value of obligation as at the end of the year
282.10 233.42 79.56 63.64
Change in plan assets (B)1. Fair value of plan assets at the beginning of the
year 0.98 5.16 - -
2. Actual return on plan assets - 0.04 - -3. Fund management charges - (0.74)4. Benefits paid (0.98) (3.48) - -Fair value of plan assets at the end of the year - 0.98 - -Liability recognized in the financial statement (A-B)
282.10 232.44 79.56 63.64
Composition of plan assetsOther than equity, debt, property and bank account*
- 100% - -
Main actuarial assumption Discount rate 6.80% 7.65% 6.80% 7.65%Expected rate of increase in compensation levels 6.00% 6.00% 6.00% 6.00%Expected rate of return on plan assets - 7.65% - -Expected average remaining working lives of employees (years)
22.56 23.79 22.47 23.97
Average remaining working lives of employees with Mortality and Withdrawal (years)
17.51 18.23 17.51 18.10
Mortality rates inclusive of provision for disability (100% of Indian Assured Lives Mortality (IALM) (2012-14):
100% 100% 100% 100%
Attrition at Ages- Age upto 30 years 3% 3% 3% 3%- Age from 31 to 44 years 2% 2% 2% 2%- Age above 44 years 1% 1% 1% 1%
Retirement age (years) 58 58 58 58
* The plan assets were maintained with Bajaj Allianz under Group Gratuity Care Scheme. The details of investments maintained by Bajaj Allianz were not available with the Company and have not been disclosed.
Summary of the significant accounting policies and other explanatory information (Contd.)For the year ended March 31, 2020 (All amounts in ` lacs, unless otherwise stated)

146
Corporate Overview Statutory Reports Financial Statements
Maturity profile of defined benefit obligation
Year Gratuity Compensated absences (Unfunded)
For the year ended For the year endedMarch 31,
2020March 31,
2019March 31,
2020March 31,
20190 to 1 year 35.23 31.77 4.70 3.65 1 to 2 year 3.98 2.99 1.39 1.09 2 to 3 year 8.80 3.08 3.76 1.17 3 to 4 year 4.48 3.23 1.43 2.82 4 to 5 year 6.02 3.39 2.17 1.22 5 to 6 year 69.81 3.48 4.21 1.64 6 year onwards 153.78 185.45 61.91 52.01
Particulars Gratuity Compensated absencesCurrent year Previous
yearCurrent year Previous
yearCost for the period1. Current service cost 32.31 29.15 16.13 14.39 2. Net interest cost 17.86 14.43 4.87 4.02 3. Actuarial loss - - 15.74 12.49 Total amount recognised in profit or loss 50.17 43.58 36.74 30.90 Re-measurements recognised in Other comprehensive income1. Actuarial (gain) / loss on plan assets 0.08 0.36 - -2. Effect of changes in demographic assumptions (0.11) - -3. Effect of changes in financial assumptions 18.78 1.15 - -4. Effect of experience adjustments (15.09) 2.12 - -5 Expected return on Plan Assets - - -Total re-measurements included in Other Comprehensive Income
3.66 3.63 - -
Total amount recognised in statement of profit and loss
53.83 47.21 36.74 30.90
Sensitivity analysis of the defined benefit obligation
The significant actuarial assumption for the determination of defined benefit obligations are discount rate and expected salary increase. The sensitivity analysis below have been determined based on reasonably possible changes
of the respective assumptions occurring at the end of reporting period, while holding all other assumptions constant.
Particulars Gratuity (Funded) Compensated absences (Unfunded)
For the year ended For the year endedMarch 31,
2020March 31,
2019March 31,
2020March 31,
2019Present value of Obligation at the end of the year 282.10 233.42 79.56 63.64 (a) Impact of the change in discount rate(i) Impact due to increase of 0.50% (11.44) (9.46) (4.38) (3.46)(ii) Impact due to decrease of 0.50% 12.34 10.18 4.77 3.75 (b) Impact of the change in salary increase(i) Impact due to increase of 0.50% 12.38 10.29 4.78 3.80 (ii) Impact due to decrease of 0.50% (11.58) (9.65) (4.43) (3.52)
Summary of the significant accounting policies and other explanatory information (Contd.)For the year ended March 31, 2020 (All amounts in ` lacs, unless otherwise stated)
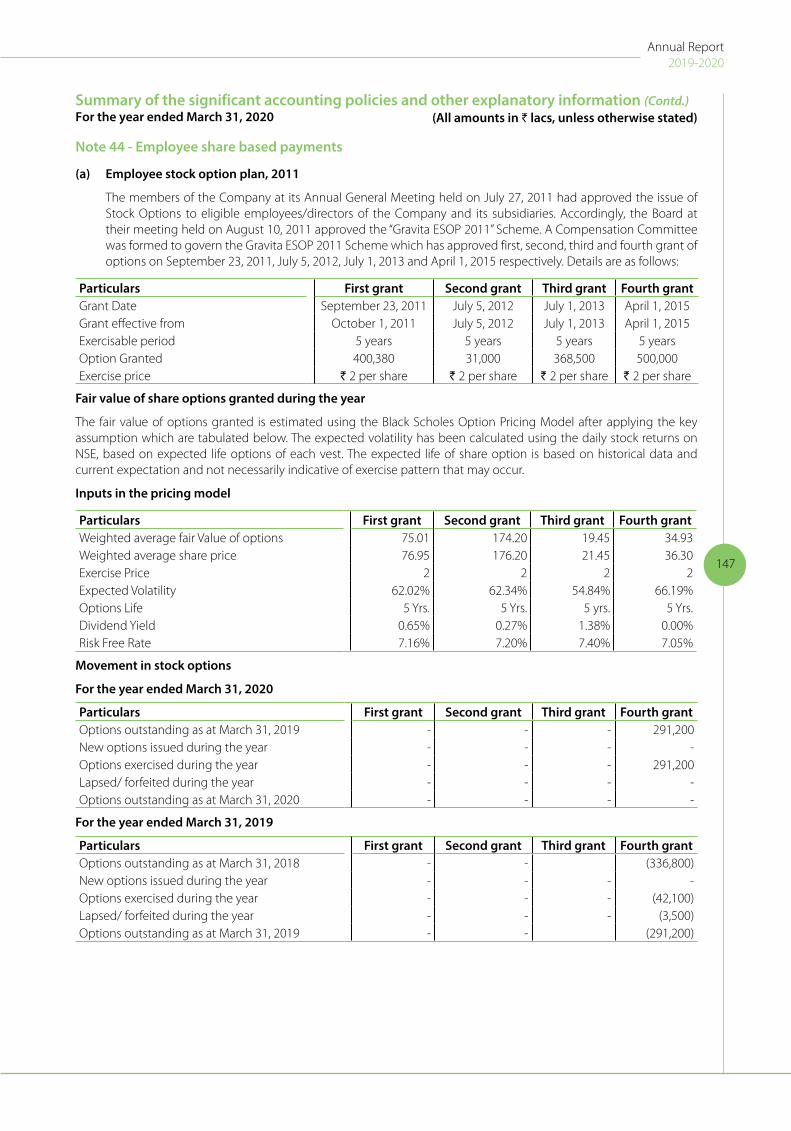
147
Annual Report2019-2020
Note 44 - Employee share based payments
(a) Employee stock option plan, 2011
The members of the Company at its Annual General Meeting held on July 27, 2011 had approved the issue of Stock Options to eligible employees/directors of the Company and its subsidiaries. Accordingly, the Board at their meeting held on August 10, 2011 approved the “Gravita ESOP 2011” Scheme. A Compensation Committee was formed to govern the Gravita ESOP 2011 Scheme which has approved first, second, third and fourth grant of options on September 23, 2011, July 5, 2012, July 1, 2013 and April 1, 2015 respectively. Details are as follows:
Particulars First grant Second grant Third grant Fourth grantGrant Date September 23, 2011 July 5, 2012 July 1, 2013 April 1, 2015Grant effective from October 1, 2011 July 5, 2012 July 1, 2013 April 1, 2015Exercisable period 5 years 5 years 5 years 5 yearsOption Granted 400,380 31,000 368,500 500,000Exercise price ` 2 per share ` 2 per share ` 2 per share ` 2 per share
Fair value of share options granted during the year
The fair value of options granted is estimated using the Black Scholes Option Pricing Model after applying the key assumption which are tabulated below. The expected volatility has been calculated using the daily stock returns on NSE, based on expected life options of each vest. The expected life of share option is based on historical data and current expectation and not necessarily indicative of exercise pattern that may occur.
Inputs in the pricing model
Particulars First grant Second grant Third grant Fourth grantWeighted average fair Value of options 75.01 174.20 19.45 34.93 Weighted average share price 76.95 176.20 21.45 36.30 Exercise Price 2 2 2 2Expected Volatility 62.02% 62.34% 54.84% 66.19%Options Life 5 Yrs. 5 Yrs. 5 yrs. 5 Yrs.Dividend Yield 0.65% 0.27% 1.38% 0.00%Risk Free Rate 7.16% 7.20% 7.40% 7.05%
Movement in stock options
For the year ended March 31, 2020
Particulars First grant Second grant Third grant Fourth grantOptions outstanding as at March 31, 2019 - - - 291,200 New options issued during the year - - - -Options exercised during the year - - - 291,200 Lapsed/ forfeited during the year - - - -Options outstanding as at March 31, 2020 - - - -
For the year ended March 31, 2019
Particulars First grant Second grant Third grant Fourth grantOptions outstanding as at March 31, 2018 - - (336,800)New options issued during the year - - - -Options exercised during the year - - - (42,100)Lapsed/ forfeited during the year - - - (3,500)Options outstanding as at March 31, 2019 - - (291,200)
Summary of the significant accounting policies and other explanatory information (Contd.)For the year ended March 31, 2020 (All amounts in ` lacs, unless otherwise stated)

148
Corporate Overview Statutory Reports Financial Statements
Share options exercised during the year
Option plan No. of options exercised
Weighted share price at exercise date
Fourth grant 291,200 86.50
Share options outstanding at end of the yearOption plan Options outstanding
as on Remaining contractual life
as on Exercise
price March 31,
2020 March 31,
2019 March 31,
2020 March 31,
2019 Fourth grant - 291,200 - - 2.00
During the year ended March 31, 2020, the Company recorded an employee share based payment expense of Nil (previous year ` 40.48 lacs) in the Statement of Profit and Loss.
(b) Employee Stock appreciation rights Scheme
In terms of SEBI (Share Based Employee Benefits) Regulations, 2014, as amended from time to time (‘SEBI Regulations’), the Compensation Committee of Board, inter alia, administers and monitors the Gravita Stock Appreciation Rights Scheme 2017 of the Company. The Compensation Committee, at its meeting granted 129,600 (Previous year: 70,400) Stock Appreciation Rights to the employees of the company and its subsidiaries under Gravita Stock Appreciation rights Scheme 2017. In addition, Gravita Employee Welfare Trust has purchased 528,000 (previous year: 129,600) equity shares from secondary market.
Movement of shares acquired by Gravita Employee Welfare Trust
Particulars Number of shares
Shares outstanding as at April 1, 2018 70,400
Equity shares acquired during the year 129,600
Shares outstanding as at March 31, 2019 200,000
Equity shares acquired during the year 528,000
Shares outstanding as at March 31, 2020 728,000
Movement of shares appreciation rights granted by Gravita Employee Welfare Trust
Particulars Number of shares
Shares appreciation rights granted as at April 1, 2018 -
Shares appreciation rights granted during the year 70,400
Shares appreciation rights granted as at March 31, 2019 70,400
Shares appreciation rights granted during the year 129,600
Shares appreciation rights granted as at March 31, 2020 200,000
Note 45 - Related party disclosures under Accounting Standard Ind-AS - 24 “Related Party Disclosures”
(i) Name of related parties and nature of related party relationship
(a) Subsidiaries
Name of Entity Country of incorporation
% of Holding as at March 31, 2020
% of Holding as at March 31, 2019
Gravita Infotech Limited India 100.00 100.00 Noble Build Estate Private Limited India 100.00 100.00 Gravita Ghana Limited Ghana 100.00 100.00 Gravita Global Pte Limited Singapore 100.00 100.00
Summary of the significant accounting policies and other explanatory information (Contd.)For the year ended March 31, 2020 (All amounts in ` lacs, unless otherwise stated)

149
Annual Report2019-2020
(b) Step down subsidiaries
Name of Entity Country of incorporation
% of Holding as at March 31, 2020
% of Holding as at March 31, 2019
Gravita Mozambique LDA Mozambique 100.00 100.00Navam Lanka Limited Srilanka 52.00 52.00Gravita Netherlands BV Netherlands 100.00 100.00Gravita Senegal S.A.U Senegal 100.00 100.00Gravita Nicaragua S.A. Nicaragua 100.00 100.00Gravita Jamaica Limited Jamaica 100.00 100.00Gravita Ventures Limited Tanzania 100.00 100.00Gravita USA Inc. USA 100.00 100.00Gravita Mali SA Mali 100.00 100.00Gravita Cameroon Limited (upto February 25, 2020) Cameroon - 100.00Met Mauritania Recycling SARL (Formerly known as Gravita Mauritania SARL) (upto July 3, 2019)
Mauritania - 100.00
Recyclers Gravita Costa Rica SA Costa Rica 100.00 100.00Gravita Tanzania Limited Tanzania 100.00 100.00Recyclers Ghana Ltd. Ghana 100.00 100.00Mozambique Recyclers LDA Mozambique 100.00 100.00Gravita Dominican SAS Dominican
Republic 100.00 100.00
Gravita Peru SAC Peru 100.00 100.00
(c) Associate
Name of the firm Country of incorporation
% of Holding as at March 31, 2020
% of Holding as at March 31, 2019
Pearl Landcon Private Limited India 25.00 25.00
(d) Partnership firms (refer note 6)
Name of the firm Country of incorporation
% of Holding as at March 31, 2020
% of Holding as at March 31, 2019
M/s Shasin Industries (Formerly known as M/s Gravita Metals) upto March 21, 2020
India - 95.00
M/s Gravita Metal Inc India 95.00 95.00M/s Gravita Infotech India 49.00 49.00
(e) Limited liability partnership firm
Name of the firm Country of incorporation
% of Holding as at March 31, 2020
% of Holding as at March 31, 2019
M/s Recycling Infotech LLP India 51.00 51.00
(f) Trusts
Gravita Employee Welfare Trust
(g) Enterprises over which Key Managerial Personnel and / or their relatives exercise significant influence:
Saurabh Farms Limited
Shah Buildcon Private Limited
Jalousies India Private Limited
Gravita Impex Private Limited
Summary of the significant accounting policies and other explanatory information (Contd.)For the year ended March 31, 2020 (All amounts in ` lacs, unless otherwise stated)
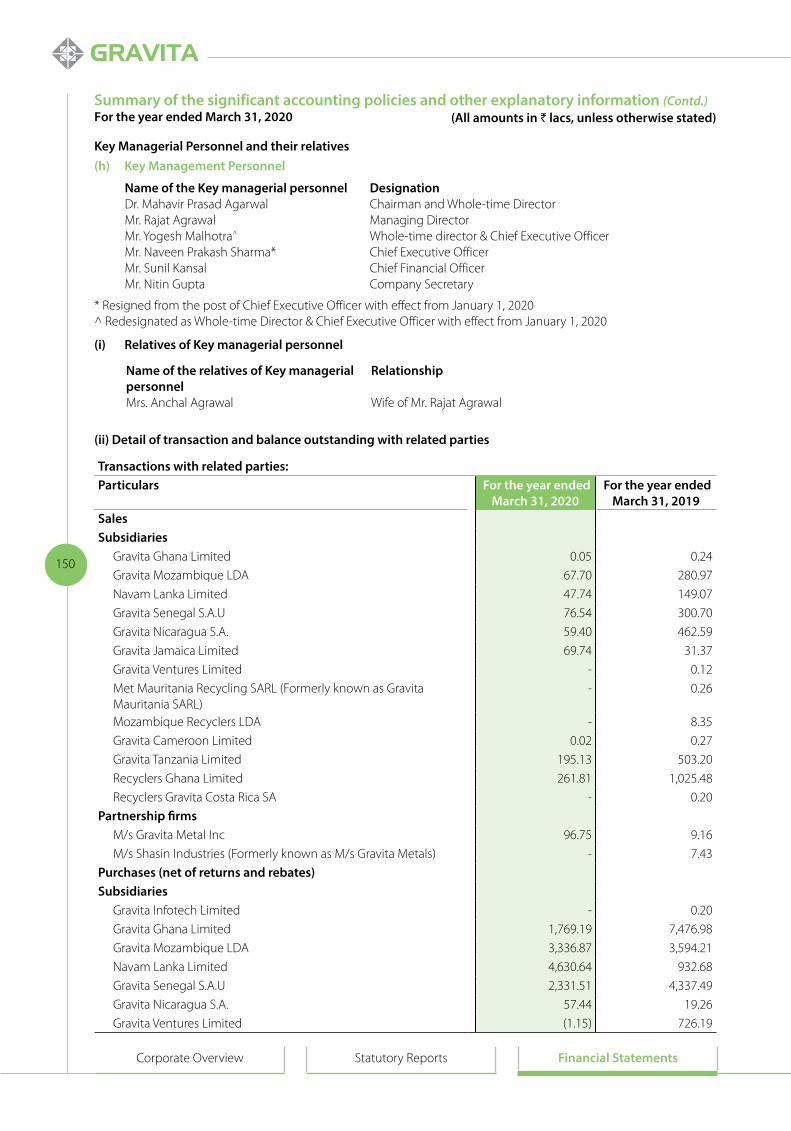
150
Corporate Overview Statutory Reports Financial Statements
Key Managerial Personnel and their relatives(h) Key Management Personnel
Name of the Key managerial personnel DesignationDr. Mahavir Prasad Agarwal Chairman and Whole-time DirectorMr. Rajat Agrawal Managing DirectorMr. Yogesh Malhotra^ Whole-time director & Chief Executive OfficerMr. Naveen Prakash Sharma* Chief Executive OfficerMr. Sunil Kansal Chief Financial OfficerMr. Nitin Gupta Company Secretary
* Resigned from the post of Chief Executive Officer with effect from January 1, 2020^ Redesignated as Whole-time Director & Chief Executive Officer with effect from January 1, 2020
(i) Relatives of Key managerial personnel
Name of the relatives of Key managerial personnel
Relationship
Mrs. Anchal Agrawal Wife of Mr. Rajat Agrawal
(ii) Detail of transaction and balance outstanding with related parties
Transactions with related parties:Particulars For the year ended
March 31, 2020 For the year ended
March 31, 2019 Sales Subsidiaries
Gravita Ghana Limited 0.05 0.24
Gravita Mozambique LDA 67.70 280.97
Navam Lanka Limited 47.74 149.07
Gravita Senegal S.A.U 76.54 300.70
Gravita Nicaragua S.A. 59.40 462.59
Gravita Jamaica Limited 69.74 31.37
Gravita Ventures Limited - 0.12
Met Mauritania Recycling SARL (Formerly known as Gravita Mauritania SARL)
- 0.26
Mozambique Recyclers LDA - 8.35
Gravita Cameroon Limited 0.02 0.27
Gravita Tanzania Limited 195.13 503.20
Recyclers Ghana Limited 261.81 1,025.48
Recyclers Gravita Costa Rica SA - 0.20
Partnership firmsM/s Gravita Metal Inc 96.75 9.16
M/s Shasin Industries (Formerly known as M/s Gravita Metals) - 7.43
Purchases (net of returns and rebates)Subsidiaries
Gravita Infotech Limited - 0.20
Gravita Ghana Limited 1,769.19 7,476.98
Gravita Mozambique LDA 3,336.87 3,594.21
Navam Lanka Limited 4,630.64 932.68
Gravita Senegal S.A.U 2,331.51 4,337.49
Gravita Nicaragua S.A. 57.44 19.26
Gravita Ventures Limited (1.15) 726.19
Summary of the significant accounting policies and other explanatory information (Contd.)For the year ended March 31, 2020 (All amounts in ` lacs, unless otherwise stated)

151
Annual Report2019-2020
Transactions with related parties:Particulars For the year ended
March 31, 2020 For the year ended
March 31, 2019 Purchases (net of returns and rebates) (contd.)
Gravita USA Inc. 890.85 -Gravita Tanzania Limited 5,766.99 -Recyclers Mozambique LDA 131.32 -Met Mauritania Recycling SARL (Formerly known as Gravita Mauritania SARL)
- 304.34
Gravita Cameroon Limited 803.68 -Recyclers Ghana Ltd. 6,772.96 -
Partnership firmsM/s Gravita Metal Inc 249.16 79.46 M/s Shasin Industries (Formerly known as M/s Gravita Metals) 24.46 111.68 M/s Gravita Infotech - 0.09
Profit/ (loss) from partnership firm:M/s Gravita Metal Inc 76.00 203.20 M/s Shasin Industries (Formerly known as M/s Gravita Metals) (62.22) (56.28)M/s Gravita Infotech (0.53) (0.45)M/s Recycling Infotech LLP (0.06) 0.11
Loan given during the yearTrust
Gravita Employee Welfare Trust 228.51 139.43 Interest incomeSubsidiaries
Noble Build Estate Private Limited 30.08 30.00 Trust
Gravita Employee Welfare Trust 25.44 16.93 Service charges incomeSubsidiaries
Gravita Netherlands BV 10.50 17.70 Management consultancy incomePartnership firms
Gravita Metal Inc - 1.20 Corporate guarantee expensesSubsidiaries
Noble Build Estate Private Limited 12.55 19.35 Enterprise having common Key Management Personnel and/or their relative
Gravita Impex Private Limited - 4.32 Corporate guarantee income
Gravita Netherlands BV 12.30 -Rent expensesSubsidiaries
Gravita Infotech Limited 10.17 9.65 Key management personnel
Mr. Rajat Agrawal 40.09 37.86 Relatives of key management personnel
Mrs. Anchal Agrawal 6.05 5.74
Summary of the significant accounting policies and other explanatory information (Contd.)For the year ended March 31, 2020 (All amounts in ` lacs, unless otherwise stated)

152
Corporate Overview Statutory Reports Financial Statements
Transactions with related parties:Particulars For the year ended
March 31, 2020 For the year ended
March 31, 2019 Enterprises having common key management personnel and/or their relatives
Saurabh Farms Limited 39.26 14.29
Shah Buildcon Private Limited 2.99 2.65
Jalousies India Private Limited 30.63 30.02
Remuneration paid to key managerial personnelShort-term benefits*
Dr. Mahavir Prasad Agarwal 120.00 120.00
Mr. Rajat Agrawal 120.00 120.00
Mr. Yogesh Malhotra 79.44 0.22
Mr. Naveen Prakash Sharma 64.76 77.78
Mr. Sunil Kansal 78.76 70.61
Mr. Nitin Gupta 8.43 8.06
Post-employment benefits**Dr. Mahavir Prasad Agarwal 8.05 8.05
Mr. Rajat Agrawal 8.00 7.99
Mr. Yogesh Malhotra 4.77 0.01
Mr. Naveen Prakash Sharma 4.23 4.72
Mr. Sunil Kansal 5.24 4.39
Mr. Nitin Gupta 0.37 0.34
Share based payment***
Mr. Yogesh Malhotra 18.71 0.01
Mr. Naveen Prakash Sharma 24.93 6.92
Mr. Sunil Kansal 10.36 3.06
Mr. Nitin Gupta 2.77 0.78
* Short-term benefits includes PAT incentive/ performance incentive, which is subject to Performance and target achievement.** Post-employment benefits does not include provisions for incremental gratuity and compensated absences liabilities, since the provisions are based on actuarial valuations for the Company as a whole.*** Represent the value of options exercised and regarded as perquisite. However, it does not include the value of unvested options or options vested but not exercised.
Closing balances with related parties:
Particulars As at March 31, 2020
As at March 31, 2019
AdvancesSubsidiaries
Gravita Senegal S.A.U - 214.18 Gravita Ghana Limited - 688.41 Navam Lanka Limited - 5.88 Gravita Mozambique LDA - 90.16 Gravita Jamaica Limited - 32.68 Gravita Ventures Limited - 0.01 Met Mauritania Recycling SARL (Formerly known as Gravita Mauritania SARL)
- 110.00
Gravita Nicaragua S.A. 43.24 111.47 Gravita Ventures Limited - 186.73
Summary of the significant accounting policies and other explanatory information (Contd.)For the year ended March 31, 2020 (All amounts in ` lacs, unless otherwise stated)

153
Annual Report2019-2020
Particulars As at March 31, 2020
As at March 31, 2019
Recyclers Gravita Costa Rica S.A. - 34.06 Mozambique Recyclers LDA - 58.36 Gravita Tanzania limited 1,618.21 1,091.58 Recyclers Ghana Limited 649.18 1,245.36 Gravita Cameroon Limited - 71.59 Gravita Infotech Limited (Formerly known as M/s Gravita Exim Ltd) 0.61 - Gravita USA Inc. 119.40 -
Recoverable from related partySubsidiaries
Navam Lanka Limited 7.59 6.49 Gravita Ghana Limited - 70.24 Gravita Senegal S.A.U 47.38 34.03 Gravita Netherlands BV 235.62 203.59 Gravita Mozambique LDA 33.60 39.22 Gravita Tanzania limited 117.82 - Gravita Jamaica Limited 61.10 - Mozambique Recyclers LDA 7.68 - Recyclers Ghana Limited 208.58 -
Payable – OthersSubsidiaries
Gravita Senegal S.A.U 11.15 652.48 Gravita Mozambique LDA 478.59 1,580.04 Gravita Infotech Limited - 115.93 Navam Lanka Limited 660.83 371.49 Noble Build Estate Private Limited 30.45 14.11
Partnership firmsM/s Gravita Infotech 0.04 0.02
Loan givenSubsidiaries
Noble Build Estate Private Limited (including interest) 367.13 340.04 Trust
Gravita Employee Welfare Trust (including interest) 510.79 259.38 Corporate guarantee givenSubsidiaries
Gravita Netherlands B.V. 1,827.86 1,788.99 Partnership firms
M/s Gravita Metal Inc 891.64 863.43 Corporate guarantee takenEnterprises having common key management personnel and/or their relatives
Gravita Impex Private Limited 19,415.72 19,619.17Subsidiaries
Noble Build Estate Private Limited 978.79 1234.45Remuneration payable to Key managerial personnel
Dr. Mahavir Prasad Agrawal 6.33 6.15 Mr. Rajat Agrawal 6.73 7.03 Mr. Yogesh Malhotra 0.50 -Mr. Naveen Prakash Sharma - 0.74 Mr. Sunil Kansal 1.85 2.89 Mr. Nitin Gupta 0.59 0.48
(i) Refer note16(2) for details of Personal guarantee given by KMP
Summary of the significant accounting policies and other explanatory information (Contd.)For the year ended March 31, 2020 (All amounts in ` lacs, unless otherwise stated)
Closing balances with related parties (contd.)

154
Corporate Overview Statutory Reports Financial Statements
Note 46 - The outbreak of Covid-19 pandemic is causing significant disturbance and slowdown of economic activities globally (including in India). The nationwide lockdown ordered by the Government of India has resulted in significant reduction in economic activities and also the business operations of the Company in terms of sales and production. The management has considered the possible effects that may result from the pandemic on the recoverability/carrying value of the assets. Based on the current indicators of future economic conditions, the management expects to recover the carrying amount of the assets, however the management will continue to closely monitor any material changes to future economic conditions. Given the uncertainties, the final impact on Company’s assets in future may differ from that estimated as at the date of approval of these financial statements.
Note 47 - The figures of the previous year have been regrouped/ reclassed to make them comparable with those of current year wherever considered necessary.
For Walker Chandiok & Co. LLP For and on behalf of the Board of DirectorsChartered Accountants Firm’s Registration No.: 001076N/N500013
Manish Agrawal Rajat Agrawal Yogesh Malhotra Dr. M. P. AgarwalPartner Managing Director Whole Time Director & CEO ChairmanMembership No: 507000 DIN: 00855284 DIN: 05332393 DIN: 00188179
Sunil Kansal Nitin GuptaDate: June 25, 2020 Chief Financial Officer Company SecretaryPlace : Ghaziabad Place : Jaipur Membership No: FCS 9984
Summary of the significant accounting policies and other explanatory information (Contd.)For the year ended March 31, 2020 (All amounts in ` lacs, unless otherwise stated)

155
Annual Report2019-2020
Independent Auditor’s Report
To the Members of Gravita India Limited
Report on the Audit of the Consolidated Financial Statements
Opinion
1. We have audited the accompanying consolidated financial statements of Gravita India Limited (‘the Holding Company’) and its subsidiaries (the Holding Company and its subsidiaries together referred to as ‘the Group’), and its associate, as listed in Annexure 1, which comprise the Consolidated Balance Sheet as at 31 March 2020, the Consolidated Statement of Profit and Loss (including Other Comprehensive Income), the Consolidated Cash Flow Statement and the Consolidated Statement of Changes in Equity for the year then ended, and a summary of the significant accounting policies and other explanatory information.
2. In our opinion and to the best of our information and according to the explanations given to us and based on the consideration of the reports of the other auditors on separate financial statements and on the other financial information of the subsidiaries and associate the aforesaid consolidated financial statements give the information required by the Companies Act, 2013 (‘Act’) in the manner so required and give a true and fair view in conformity with the accounting principles generally accepted in India including Indian Accounting Standards (‘Ind AS’) specified under section 133 of the Act, of the consolidated state of affairs of the Group and its associate, as at 31 March 2020, and their consolidated profit (including other comprehensive income), consolidated cash flows and the consolidated changes in equity for the year ended on that date.
Basis for Opinion
3. We conducted our audit in accordance with the Standards on Auditing specified under section 143(10) of the Act. Our responsibilities under those standards are further described in the Auditor’s Responsibilities for the Audit of the Consolidated Financial Statements section of our report. We are independent of the Company in accordance with the Code of Ethics issued by the Institute of Chartered Accountants of India (‘ICAI’) together with the ethical requirements that are relevant to our audit of the financial statements under the provisions of the Act and the rules thereunder, and we have fulfilled our other ethical responsibilities in accordance with these requirements and the Code of Ethics. We believe that the audit evidence we have obtained and the audit evidence obtained by the other auditors in terms of their reports referred to in paragraph 15 of the Other Matters section below, is sufficient and appropriate to provide a basis for our opinion.
Key Audit Matters
4. Key audit matters are those matters that, in our professional judgment and based on the consideration of the reports of the other auditors on separate financial statements and on the other financial information of the subsidiaries and associate were of most significance in our audit of the financial statements of the current period. These matters were addressed in the context of our audit of the consolidated financial statements as a whole, and in forming our opinion thereon, and we do not provide a separate opinion on these matters.
5. We have determined the matters described below to be the key audit matters to be communicated in our report.
Key audit matter How our audit addressed the key audit matterInitial Audit engagement – Opening Balances
We have been appointed as the statutory auditors of Group for year ended 31 March 2020.
Standard on Auditing 510, Initial Audit Engagements – Opening Balances, in conducting an initial audit engagement, several considerations are involved which are generally not associated with recurring audits. The audit transition, including the audit of the opening balances requires additional planning activities and considerations necessary to establish an appropriate audit plan and strategy. This includes:
Our audit work included, but was not limited to, the following procedures:
a) Prepared a detailed transition plan, including ensuring compliance with independence requirements, prior to the start of the audit;
b) Inspected management’s process and control documentation to assist us in obtaining and understanding of the Group’s financial reporting and business processes, including control environment;
c) Obtained and read management reports, policies, instructions as well as planning and governing documents, minutes of the board of directors, audit committee and other committees of the board, internal audit reports;

156
Corporate Overview Statutory Reports Financial Statements
Independent Auditor’s Report (Contd.)
Key audit matter How our audit addressed the key audit mattera) Gaining an initial understanding of the Group and
its business including its control environment and information systems, sufficient to make an audit assessment and develop the audit strategy and plan;
b) Obtaining sufficient appropriate audit evidence regarding the opening balances including the selection and application of accounting policies; and
c) Communicating with the predecessor auditors, as required and permitted under applicable professional regulations.
The aforesaid activities required involvement of considerable audit efforts, and accordingly, audit of the opening balances was identified as a key audit matter for the current year audit;
d) Held discussions with the management at various levels of the Group and heads of the Business, Risk and Finance functions, to understand their roles in the business and Group’s financial reporting process;
e) Obtained an understanding of and evaluated appropriateness and consistency of the accounting policies used in the preparation of the financial statements of the Group for the financial year ended 31 March 2019;
f ) Read previous year financial statements to identify material opening balances. Obtained underlying accounting schedules prepared by the management and scanned for unusual items;
g) Traced the account balances from the trial balance for the previous financial year to the audited financial statements, and traced the balance sheet account balances to the opening trial balance of the current year; and
h) On a sample basis, tested the opening balances for financial line items including property, plant and equipment, bank balances, borrowings, share capital, and other current assets and liabilities, as considered necessary
Estimation and taxability in respect of SGST incentives
The Holding Company’s manufacturing facility at Chittoor, is eligible for incentives available under “Industrial Development Policy 2015-2020”, notified by the Andhra Pradesh government. The Holding Company has been granted “Small Industry” status and is eligible for incentives like, power cost reimbursement, interest reimbursement, refund of sales tax/ state goods and services tax paid in cash, etc. Based on such policy, the Holding Company has continued to recognize the incentives which are computed on the basis of the State Goods and Services Tax (SGST) paid to the Government of Andhra Pradesh. The SGST incentives amounting to `1,569.28 Lacs have been accrued in the financial statements for the year ended 31 March 2020 Refer note 23 to the consolidated financial statements.
The key judgement is involved in the taxability of the SGST incentive on accrual or receipt basis relying on case laws and judgements and the resultant impact on the financial position, results of operations and cash flows. In March 2019, the incentive income was offered to tax on accrual basis, while as per the tax opinion obtained in quarter ended 31 December 2019, such income was to be offered to tax on receipt basis.
Considering the materiality of amounts involved and significant judgement involved the same has been considered as a key audit matter for the current year’s audit.
Our audit work included, but was not limited to the following procedures:
a) Discussed the underlying SGST incentive matter with the management and obtained an understanding of the basis for management’s judgement;
b) Evaluated the design and tested the operating effectiveness of key controls around the taxability of SGST incentives;
c) Obtained the tax views sought by the Holding Company’s management from an external legal counsel on the matter and evaluated the independence, objectivity and competency of the specialists involved;
d) Involved auditor’s expert to perform an evaluation of the relevant judgements passed by the authorities and assess the taxability of these incentives including the appropriateness of the tax rates used;
e) Tested the arithmetical accuracy of the computation performed by the management; and
f ) Evaluated the appropriateness of the accounting policy used and related disclosures made in the accompanying consolidated financial statements with regard to this matter.

157
Annual Report2019-2020
Independent Auditor’s Report (Contd.)
Key audit matter How our audit addressed the key audit matterRevenue recognition
Refer note 23 to the consolidated financial statements.
The Revenues of the Group consists primarily of sale of products and is recognized when control of products being sold is transferred to the customer and there is no unfulfilled obligation.
Our audit work included, but was not limited to, the following procedures:
a) Assessed the appropriateness of the Group’s revenue recognition accounting policies in accordance with Ind AS 115 – Revenue from contracts with customers (Ind AS 115);
b) Tested the design and operating effectiveness of the general IT control environment and the manual controls for recognition of revenue;
Revenue is measured at fair value of the consideration received or receivable and is accounted for net of rebates and trade discounts.
Revenue recognition process also involves certain key judgements relating to identification of distinct performance obligations, determination of transaction price of the identified performance obligations and the appropriateness of revenue recognized.
The Group also focuses on revenue as a key performance measure, which could create an incentive for overstating revenue.
Considering the materiality of amounts involved and significant judgements involved, the same has been considered as a key audit matter for the current year’s audit.
c) Performed substantive analytical procedures on revenue which included ratio analysis, product mix analysis, customer analysis, etc.;
d) Tested, on a sample basis, sales transactions to the underlying supporting documentation which includes goods dispatch notes and shipping documents;
e) Reviewed, on a sample basis, sales agreements and the underlying contractual terms related to delivery of goods and rebates to assess the Group’s revenue recognition policies with reference to the requirements of the applicable accounting standards;
f ) Obtained supporting documentation for a sample of credit notes issued after the year end to determine whether the transaction was recognized in the correct accounting period;
g) Performed other substantive audit procedures including obtaining debtor confirmations on a sample basis and reconciling revenue recorded during the year with statutory returns;
h) Assessed if there is any modification to, or other impact on the contracts with customers due to COVID 19 outbreak;
i) Tested manual journal entries impacting revenue including credit notes, claims etc., which were material or irregular in nature with supporting documents and evaluated business rationale thereof; and
j) Ensured the adequacy and appropriateness of disclosures made in the financial statements in accordance with the requirements of Ind AS 115.
Information other than the Consolidated Financial Statements and Auditor’s Report thereon
6. The Holding Company’s Board of Directors are responsible for the other information. The other information comprises the information included in the Annual Report, but does not include the consolidated financial statements and our auditor’s report thereon. The Annual Report is expected to be made available to us after the date of this auditor’s report.
Our opinion on the consolidated financial statements does not cover the other information and we will not express any form of assurance conclusion thereon.
In connection with our audit of the consolidated financial statements, our responsibility is to read the other information identified above when it becomes available and, in doing so, consider whether the other information is materially inconsistent with the consolidated financial statements or our knowledge obtained in the audit or otherwise appears to be materially misstated.
When we read the Annual Report, if we conclude that there is a material misstatement therein, we are required to communicate the matter to those charged with governance.

158
Corporate Overview Statutory Reports Financial Statements
Independent Auditor’s Report (Contd.)
Responsibilities of Management and Those Charged with Governance for the Consolidated Financial Statements
7. The accompanying consolidated financial statements have been approved by the Holding Company’s Board of Directors. The Holding Company’s Board of Directors is responsible for the matters stated in section 134(5) of the Act with respect to the preparation of these consolidatedfinancial statements that give a true and fair view of the consolidated state of affairs (consolidated financial position), consolidated profit or loss (consolidated financial performance including other comprehensive income), consolidated changes in equity and consolidated cash flows of the Group including its associate in accordance with the accounting principles generally accepted in India, including the Ind AS specified under section 133 of the Act. The Holding Company’s Board of Directors is also responsible for ensuring accuracy of records including financial information considered necessary for the preparation of consolidated Ind AS financial statements. Further, in terms of the provisions of the Act, the respective Board of Directors /management of the companies included in the Group, and its associate company covered under the Act are responsible for maintenance of adequate accounting records in accordance with the provisions of the Act for safeguarding the assets and for preventing and detecting frauds and other irregularities; selection and application of appropriate accounting policies; making judgments and estimates that are reasonable and prudent; and design, implementation and maintenance of adequate internal financial controls, that were operating effectively for ensuring the accuracy and completeness of the accounting records, relevant to the preparation and presentation of the financial statements that give a true and fair view and are free from material misstatement, whether due to fraud or error. These financial statements have been used for the purpose of preparation of the consolidated financial statements by the Directors of the Holding Company, as aforesaid.
8. In preparing the consolidated financial statements, the respective Board of Directors of the companies included in the Group and of its associate are responsible for assessing the ability of the Group and of its associate to continue as a going concern, disclosing, as applicable, matters related to going concern and using the going concern basis of accounting unless the Board of Directors either intend to liquidate the Group or to cease
operations, or has no realistic alternative but to do so.
9. Those Board of Directors are also responsible for overseeing the financial reporting process of the companies included in the Group and of its associate.
Auditor’s Responsibilities for the Audit of the Financial Statements
10. Our objectives are to obtain reasonable assurance about whether the financial statements as a whole are free from material misstatement, whether due to fraud or error, and to issue an auditor’s report that includes our opinion. Reasonable assurance is a high level of assurance but is not a guarantee that an audit conducted in accordance with Standards on Auditing will always detect a material misstatement when it exists. Misstatements can arise from fraud or error and are considered material if, individually or in the aggregate, they could reasonably be expected to influence the economic decisions of users taken on the basis of these consolidated financial statements.
11. As part of an audit in accordance with Standards on Auditing, we exercise professional judgment and maintain professional skepticism throughout the audit. We also:
• Identify and assess the risks of materialmisstatement of the consolidated financial statements, whether due to fraud or error, design and perform audit procedures responsive to those risks, and obtain audit evidence that is sufficient and appropriate to provide a basis for our opinion. The risk of not detecting a material misstatement resulting from fraud is higher than for one resulting from error, as fraud may involve collusion, forgery, intentional omissions, misrepresentations, or the override of internal control;
• Obtainanunderstandingof internalcontrolrelevant to the audit in order to design audit procedures that are appropriate in the circumstances. Under section 143(3)(i) of the Act, we are also responsible for expressing our opinion on whether the Holding Company has adequate internal financial controls with reference to financial statements in place and the operating effectiveness of such controls;
• Evaluate the appropriateness of accountingpolicies used and the reasonableness of accounting estimates and related disclosures made by management;

159
Annual Report2019-2020
Independent Auditor’s Report (Contd.)
• Conclude on the appropriateness ofmanagement’s use of the going concern basis of accounting and, based on the audit evidence obtained, whether a material uncertainty exists related to events or conditions that may cast significant doubt on the ability of the Group and its associate to continue as a going concern. If we conclude that a material uncertainty exists, we are required to draw attention in our auditor’s report to the related disclosures in the financial statements or, if such disclosures are inadequate, to modify our opinion. Our conclusions are based on the audit evidence obtained up to the date of our auditor’s report. However, future events or conditions may cause the Group and its associate to cease to continue as a going concern;
• Evaluate the overall presentation, structureand content of the financial statements, including the disclosures, and whether the consolidated financial statements represent the underlying transactions and events in a manner that achieves fair presentation; and
• Obtainsufficientappropriateauditevidenceregarding the financial information of the entities within the Group, and its associate, to express an opinion on the financial statements. We are responsible for the direction, supervision and performance of the audit of financial statements of such entities included in the consolidated financial statements, of which we are the independent auditors. For the other entities included in the consolidated financial statements, which have been audited by the other auditors, such other auditors remain responsible for the direction, supervision and performance of the audits carried out by them. We remain solely responsible for our audit opinion.
12. We communicate with those charged with governance regarding, among other matters, the planned scope and timing of the audit and significant audit findings, including any significant deficiencies in internal control that we identify during our audit.
13. We also provide those charged with governance with a statement that we have complied with relevant ethical requirements regarding independence, and to communicate with them all relationships and other matters that may reasonably be thought to bear on our independence, and where applicable, related safeguards.
14. From the matters communicated with those charged with governance, we determine those matters that were of most significance in the audit of the consolidated financial statements of the current period and are therefore the key audit matters. We describe these matters in our auditor’s report unless law or regulation precludes public disclosure about the matter or when, in extremely rare circumstances, we determine that a matter should not be communicated in our report because the adverse consequences of doing so would reasonably be expected to outweigh the public interest benefits of such communication.
Other Matters
15. We did not audit the financial statements of 26 subsidiaries, whose financial statements reflects total assets of ` 21,351.06 lacs and net assets of ` 9,099.41 lacs as at 31 March 2020, total revenues of ` 47,167.77 lacs and net cash inflows amounting to ` 141.22 lacs for the year ended on that date, as considered in the consolidated financial statements. These financial statements have been audited by other auditors whose reports have been furnished to us by the management and our opinion on the consolidated financial statements, in so far as it relates to the amounts and disclosures included in respect of these subsidiaries, and our report in terms of sub-section (3) of Section 143 of the Act, in so far as it relates to the aforesaid subsidiaries and associate, are based solely on the reports of the other auditors.
Our opinion above on the consolidated financial statements, and our report on other legal and regulatory requirements below, are not modified in respect of the above matters with respect to our reliance on the work done by and the reports of the other auditors.
16. We did not audit the financial statements of one associate, whose financial statements reflects the Group’s share of net loss (including other comprehensive income) of ` 0.96 lacs for the year ended 31 March 2020, as considered in the consolidated financial statements. These financial statements are unaudited and have been furnished to us by the management and our opinion on the consolidated financial statements, in so far as it relates to the amounts and disclosures included in respect of the aforesaid associate, and our report in terms of sub-section (3) of Section 143 of the Act in so far as it relates to the aforesaid associate, are based solely on such unaudited financial statements. In our opinion and according to the information and explanations given to us by the

160
Corporate Overview Statutory Reports Financial Statements
Independent Auditor’s Report (Contd.)
management, these financial statements are not material to the Group.
Our opinion above on the consolidated financial statements, and our report on other legal and regulatory requirements below, are not modified in respect of the above matter with respect to our reliance on the financial statements certified by the management.
17. The consolidated financial statements of the Company for the year ended 31 March 2019 were audited by the predecessor auditor, Deloitte Haskins and Sells, Chartered Accountants, who have expressed an unmodified opinion on those consolidated financial statements vide their audit report dated 28 May 2019.
Report on Other Legal and Regulatory Requirements
18. As required by section 197(16) of the Act, based on our audit and on the consideration of the reports of the other auditors, referred to in paragraph 15, on separate financial statements of the subsidiaries, we report that the Holding Company covered under the Act paid remuneration to their respective directors during the year in accordance with the provisions of and limits laid down under section 197 read with Schedule V to the Act. Further, we report that 2 subsidiary companies covered under the Act have not paid on provided for any Managerial Remuneration during the year. Accordingly, reporting under Section 197(16) of the Act is not applicable inrespect such subsidiary companies.
19. As required by Section 143 (3) of the Act, based on our audit and on the consideration of the reports of the other auditors on separate financial statements and other financial information of the subsidiaries and associate, we report, to the extent applicable, that:
a) we have sought and obtained all the information and explanations which to the best of our knowledge and belief were necessary for the purpose of our audit of the aforesaid consolidated financial statements;
b) in our opinion, proper books of account as required by law relating to preparation of the aforesaid consolidated financial statements have been kept so far as it appears from our examination of those books and the reports of the other auditors;
c) the consolidated financial statements dealt
with by this report are in agreement with the relevant books of account maintained for the purpose of preparation of the consolidated financial statements;
d) in our opinion, the aforesaid consolidated financial statements comply with Ind AS specified under section 133 of the Act;
e) on the basis of the written representations received from the directors of the Holding Company and taken on record by the Board of Directors of the Holding Company and the reports of the statutory auditors of its subsidiary companies and associate company covered under the Act, none of the directors of the Group companies and its associate company covered under the Act, are disqualified as on 31 March 2020 from being appointed as a director in terms of Section 164(2) of the Act;
f ) with respect to the adequacy of the internal financial controls with reference to financial statements of the Holding Company, and its subsidiary companies and associate company covered under the Act, and the operating effectiveness of such controls, refer to our separate report in ‘Annexure A’; and
g) with respect to the other matters to be included in the Auditor’s Report in accordance with rule 11 of the Companies (Audit and Auditors) Rules, 2014 (as amended), in our opinion and to the best of our information and according to the explanations given to us and based on the consideration of the report of the other auditors on separate financial statements as also the other financial information of the subsidiaries and associate:
i. the consolidated financial statements disclose the impact of pending litigations on the consolidated financial position of the Group and its associate as detailed in Note 35 to the consolidated financial statements;
ii. the Group and its associate did not have any long-term contracts including derivative contracts for which there were any material foreseeable losses as at 31 March 2020;
iii. there has been no delay in transferring amounts, required to be transferred, to the Investor Education and Protection

161
Annual Report2019-2020
For Walker Chandiok & Co LLPChartered Accountants
Firm’s Registration No.: 001076N/N500013
Manish AgrawalPartner
Place: Ghaziabad Membership No.: 507000Date: 25 June 2020 UDIN: 20507000AAAABP2451
Independent Auditor’s Report (Contd.)
Fund by the Holding Company during the year ended 31 March 2020 and there were no amounts which were required to be transferred to the Investor Education and Protection Fund by the subsidiary companies and associate company covered under the Act, during the year ended 31 March 2020; and
iv. the disclosure requirements relating to holdings as well as dealings in specified bank notes were applicable for the period from 8 November 2016 to 30 December 2016, which are not relevant to these consolidated financial statements. Hence, reporting under this clause is not applicable.
Annexure 1
List of entities included in the Statement
Subsidiaries (including of partnership firms and trust)
Gravita Infotech Limited, Gravita Ghana Limited, Gravita Mozambique LDA, Noble Build Estate Private Limited, Gravita Global Pte Limited, Navam Lanka Limited, Gravita Netherlands BV, Gravita Senegal S.A.U, Gravita Nicaragua S.A., Gravita Jamaica Limited, Gravita Ventures Limited, Gravita USA Inc., Gravita Mali SA, Gravita Cameroon Limited (upto 25 February 2020), Met Mauritania Recycling SARL (upto 3 July 2019), Recyclers Gravita Costa Rica SA, Gravita Tanzania Limited, Recyclers Ghana Ltd., Mozambique Recyclers LDA, Gravita Dominican SAS, Gravita Peru SAC, M/s Gravita Metals (upto 21 March 2020), M/s Gravita Metal Inc, M/s Gravita Infotech, M/s Recycling Infotech LLP and Gravita Employee Welfare Trust.
Associate
Pearl Landcon Private Limited.

162
Corporate Overview Statutory Reports Financial Statements
Annexure A to the Independent Auditor’s Report
Independent Auditor’s Report on the internal financial controls with reference to financial statements under Clause (i) of Sub-section 3 of Section 143 of the Companies Act, 2013 (‘the Act’)
1. In conjunction with our audit of the consolidated financial statements of Gravita India Limited (‘the Holding Company’) and its subsidiaries (the Holding Company and its subsidiaries together referred to as ‘the Group’) and its associate as at and for the year ended 31 March 2020, we have audited the internal financial controls with reference to financial statements of the Holding Company, its subsidiary companies and its associate company, which are companies covered under the Act, as at that date.
Responsibilities of Management and Those Charged with Governance for Internal Financial Controls
2. The respective Board of Directors of the Holding Company, its subsidiary companies and its associate company, which are companies covered under the Act, are responsible for establishing and maintaining internal financial controlsbased on the internal financial controls with reference to financial statements criteria established by the Company considering the essential components of internal control stated in the Guidance Note on Audit of Internal Financial Controls over Financial Reporting (‘the Guidance Note’)issued by the Institute of Chartered Accountants of India (‘ICAI’). These responsibilities include the design, implementation and maintenance of adequate internal financial controls that were operating effectively for ensuring the orderly and efficient conduct of the Company’s business, including adherence to the Company’s policies, the safeguarding of its assets, the prevention and detection of frauds and errors, the accuracy and completeness of the accounting records, and the timely preparation of reliable financial information, as required under the Act.
Auditor’s Responsibility for the Audit of the Internal Financial Controls with Reference to Financial Statements
3. Our responsibility is to express an opinion on the internal financial controls with reference to financial statements of the Holding Company, its subsidiary companies and its associate company, as aforesaid, based on our audit. We conducted our audit in accordance with the Standards on Auditing issued by the ICAI prescribed under Section 143(10) of the Act, to the extent applicable to an audit of internal financial controls with reference to financial statements, and the Guidance Note issued by the ICAI. Those Standards and the Guidance Note require that we comply
with ethical requirements and plan and perform the audit to obtain reasonable assurance about whether adequate internal financial controls with reference to financial statements were established and maintained and if such controls operated effectively in all material respects.
4. Our audit involves performing procedures to obtain audit evidence about the adequacy of the internal financial controls with reference to financial statements and their operating effectiveness. Our audit of internal financial controls with reference to financial statements includes obtaining an understanding of such internal financial controls, assessing the risk that a material weakness exists, and testing and evaluating the design and operating effectiveness of internal control based on the assessed risk. The procedures selected depend on the auditor’s judgement, including the assessment of the risks of material misstatement of the financial statements, whether due to fraud or error.
5. We believe that the audit evidence we have obtained and the audit evidence obtained by the other auditors in terms of their reports referred to in the Other Matter(s) paragraph below, is sufficient and appropriate to provide a basis for our audit opinion on the internal financial controls with reference to financial statements of the Holding Company, its subsidiary companies and its associate company as aforesaid.
Meaning of Internal Financial Controls with Reference to Financial Statements
6. A company’s internal financial controls with reference to financial statements is a process designed to provide reasonable assurance regarding the reliability of financial reporting and the preparation of financial statements for external purposes in accordance with generally accepted accounting principles. A company’s internal financial controls with reference to financial statements include those policies and procedures that (1) pertain to the maintenance of records that, in reasonable detail, accurately and fairly reflect the transactions and dispositions of the assets of the company; (2) provide reasonable assurance that transactions are recorded as necessary to permit preparation of financial statements in accordance with generally accepted accounting principles, and that receipts and expenditures of the company are being made only in accordance with authorisations of management and directors of the company; and (3) provide reasonable assurance regarding prevention or timely detection of unauthorised acquisition, use, or disposition of the company’s assets that could have a material effect on the financial statements.

163
Annual Report2019-2020
Annexure A to the Independent Auditor’s Report (Contd.)
For Walker Chandiok & Co LLPChartered Accountants
Firm’s Registration No.: 001076N/N500013
Manish AgrawalPartner
Place: Ghaziabad Membership No.: 507000Date: 25 June 2020 UDIN: 20507000AAAABP2451
Inherent Limitations of Internal Financial Controls with Reference to Financial Statements
7. Because of the inherent limitations of internal financial controls with reference to financial statements, including the possibility of collusion or improper management override of controls, material misstatements due to error or fraud may occur and not be detected. Also, projections of any evaluation of the internal financial controls with reference to financial statements to future periods are subject to the risk that the internal financial controls with reference to financial statements may become inadequate because of changes in conditions, or that the degree of compliance with the policies or procedures may deteriorate.
Opinion
8. In our opinion and based on the consideration of the reports of the other auditors on internal financial controls with reference to financial statements of the subsidiary companies and associate company , the Holding Company, its subsidiary companies and its associate company, which are companies covered under the Act, have in all material respects, adequate internal financial controls with reference to financial statements and such controls were operating effectively as at 31 March 2020, based on the internal financial controls with reference to financial statements criteria established by the Company considering the essential components of internal control stated in the Guidance Note issued by the ICAI.
Other Matter
9. We did not audit the internal financial controls with reference to financial statements in so far as it relates to 2 subsidiary companies, which are companies covered under the Act, whose financial statements reflect total assets of ` 487.09 lacs and net assets of ` 97.24 lacs as at 31 March 2020, total revenues of ` 24.64 lacs and net cash outflows amounting to ` 5.04 lacs for the year ended on that date, as considered in the consolidated financial statements. The internal financial controls with reference to financial statements in so far as it
relates to such subsidiary companies have been audited by other auditors whose reports have been furnished to us by the management and our report on the adequacy and operating effectiveness of the internal financial controls with reference to financial statements for the Holding Company and its subsidiary companies, as aforesaid, under Section 143(3)(i) of the Act in so far as it relates to such subsidiary companies is based solely on the reports of the auditors of such companies.
Our opinion is not modified in respect of this matter with respect to our reliance on the work done by and on the reports of the other auditors.
10. We did not audit the internal financial controls with reference to financial statements in so far as it relates to one associate company, which is the company covered under the Act, in respect of which, the Group’s share of net loss including other comprehensive income of ` 0.96 lacs for the year ended 31 March 2020 has been considered in the consolidated financial statements. The internal financial controls with reference to financial statements of the associate company, which is the company covered under the Act, are unaudited and our opinion under Section 143(3)(i) of the Act insofar as it relates to the aforesaid associate company, which is the company covered under the Act, is solely based on the corresponding internal financial controls with reference to financial statements report certified by the management of such company. In our opinion and according to the information and explanations given to us by the management, these financial statements are not material to the Group. Our report on adequacy and operating effectiveness of the internal financial controls with reference to financial statements of the Group does not include the internal financial controls with reference to financial statements assessment in respect of the aforesaid company.
Our opinion is not modified in respect of the above matter with respect to our reliance on the internal financial controls with reference to financial statements report certified by the management.
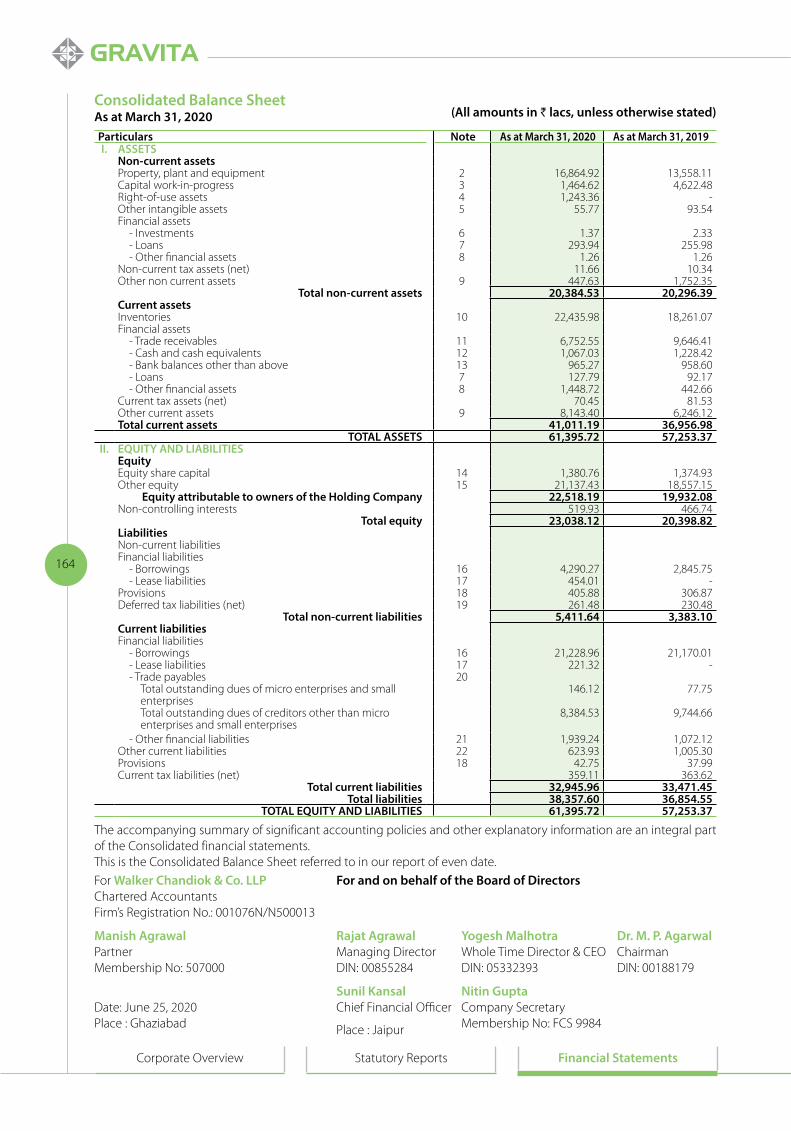
164
Corporate Overview Statutory Reports Financial Statements
(All amounts in ` lacs, unless otherwise stated)Consolidated Balance SheetAs at March 31, 2020
The accompanying summary of significant accounting policies and other explanatory information are an integral part of the Consolidated financial statements.This is the Consolidated Balance Sheet referred to in our report of even date.
Particulars Note As at March 31, 2020 As at March 31, 2019I. ASSETS
Non-current assetsProperty, plant and equipment 2 16,864.92 13,558.11 Capital work-in-progress 3 1,464.62 4,622.48 Right-of-use assets 4 1,243.36 -Other intangible assets 5 55.77 93.54 Financial assets
- Investments 6 1.37 2.33 - Loans 7 293.94 255.98 - Other financial assets 8 1.26 1.26
Non-current tax assets (net) 11.66 10.34 Other non current assets 9 447.63 1,752.35
Total non-current assets 20,384.53 20,296.39 Current assetsInventories 10 22,435.98 18,261.07 Financial assets
- Trade receivables 11 6,752.55 9,646.41 - Cash and cash equivalents 12 1,067.03 1,228.42 - Bank balances other than above 13 965.27 958.60 - Loans 7 127.79 92.17 - Other financial assets 8 1,448.72 442.66
Current tax assets (net) 70.45 81.53 Other current assets 9 8,143.40 6,246.12 Total current assets 41,011.19 36,956.98
TOTAL ASSETS 61,395.72 57,253.37 II. EQUITY AND LIABILITIES
EquityEquity share capital 14 1,380.76 1,374.93 Other equity 15 21,137.43 18,557.15
Equity attributable to owners of the Holding Company 22,518.19 19,932.08 Non-controlling interests 519.93 466.74
Total equity 23,038.12 20,398.82 LiabilitiesNon-current liabilitiesFinancial liabilities
- Borrowings 16 4,290.27 2,845.75 - Lease liabilities 17 454.01 -
Provisions 18 405.88 306.87 Deferred tax liabilities (net) 19 261.48 230.48
Total non-current liabilities 5,411.64 3,383.10 Current liabilitiesFinancial liabilities
- Borrowings 16 21,228.96 21,170.01 - Lease liabilities 17 221.32 -- Trade payables 20
Total outstanding dues of micro enterprises and small enterprises
146.12 77.75
Total outstanding dues of creditors other than micro enterprises and small enterprises
8,384.53 9,744.66
- Other financial liabilities 21 1,939.24 1,072.12 Other current liabilities 22 623.93 1,005.30 Provisions 18 42.75 37.99 Current tax liabilities (net) 359.11 363.62
Total current liabilities 32,945.96 33,471.45 Total liabilities 38,357.60 36,854.55
TOTAL EQUITY AND LIABILITIES 61,395.72 57,253.37
For Walker Chandiok & Co. LLP For and on behalf of the Board of DirectorsChartered AccountantsFirm’s Registration No.: 001076N/N500013
Manish Agrawal Rajat Agrawal Yogesh Malhotra Dr. M. P. AgarwalPartner Managing Director Whole Time Director & CEO ChairmanMembership No: 507000 DIN: 00855284 DIN: 05332393 DIN: 00188179
Sunil Kansal Nitin GuptaDate: June 25, 2020 Chief Financial Officer Company SecretaryPlace : Ghaziabad Place : Jaipur Membership No: FCS 9984

165
Annual Report2019-2020
(All amounts in ` lacs, unless otherwise stated)
Consolidated Statement of Profit and LossFor the year ended March 31, 2020
The accompanying summary of significant accounting policies and other explanatory information are an integral part of the Consolidated financial statements.This is the Consolidated Statement of Profit and Loss referred to in our report of even date.
Particulars Note For the year ended March 31, 2020
For the year ended March 31, 2019
I IncomeRevenue from operations 23 1,34,780.03 1,24,172.83 Other income 24 99.42 544.99 Total income (I) 1,34,879.45 1,24,717.82
II ExpensesCost of materials consumed 25 1,09,626.45 1,00,254.19 Purchases of traded goods 26 1,855.52 2,059.08 Changes in inventories of finished goods, work-in-progress and traded goods
27 (2,374.64) 1,231.09
Employee benefits expense 28 6,692.22 6,347.40 Finance costs 29 2,817.23 2,299.99 Depreciation and amortisation expense 30 1,812.54 1,156.49 Other expenses 31 9,233.15 8,410.17 Total expenses (II) 1,29,662.47 1,21,758.41
III Profit before exceptional items, tax and share of (loss) in associate (I - II)
5,216.98 2,959.41
IV Exceptional items 32 522.94 - V Profit before tax and share of (loss) in associate (III - IV) 4,694.04 2,959.41 VI Share of (loss) of associate (0.96) (1.36)VII Profit before tax (V + VI) 4,693.08 2,958.05 VIII Tax expense 33
- Current tax (including earlier years) 1,117.37 967.73 - Deferred tax (credit)/ charge (82.45) 51.39
Total tax expense 1,034.92 1,019.12 IX Profit for the year (VII - VIII) 3,658.16 1,938.93 X Other comprehensive income
Items that will not be reclassified to profit or lossRemeasurements of the defined benefit liabilities (4.19) (3.17)Income tax on above items 1.46 1.11
Items that may be reclassified to profit or lossForeign currency translation reserve 409.81 89.45 Change in fair value of hedging instruments (80.97) 0.73 Income tax on above items (114.91) (31.51)
Total other comprehensive income, net of tax 211.20 56.61 XI Total comprehensive income for the year (IX + X) 3,869.36 1,995.54
Profit for the year attributable to- Owners of the Holding Company 3,317.95 1,549.23 - Non-controlling interests 340.21 389.70
Other comprehensive income for the year attributable to- Owners of the Holding Company 211.42 70.99 - Non-controlling interests (0.22) (14.38)
Total comprehensive income for the year attributable to- Owners of the Holding Company 3,529.37 1,620.22 - Non-controlling interests 339.99 375.32
XII Earnings per share 34Basic 4.82 2.26 Diluted 4.82 2.25
For Walker Chandiok & Co. LLP For and on behalf of the Board of DirectorsChartered AccountantsFirm’s Registration No.: 001076N/N500013
Manish Agrawal Rajat Agrawal Yogesh Malhotra Dr. M. P. AgarwalPartner Managing Director Whole Time Director & CEO ChairmanMembership No: 507000 DIN: 00855284 DIN: 05332393 DIN: 00188179
Sunil Kansal Nitin GuptaDate: June 25, 2020 Chief Financial Officer Company SecretaryPlace : Ghaziabad Place : Jaipur Membership No: FCS 9984

166
Corporate Overview Statutory Reports Financial Statements
(All amounts in ` lacs, unless otherwise stated)
Consolidated Cash Flow StatementFor the year ended March 31, 2020
Particulars For the year ended March 31, 2020
For the year ended March 31, 2019
A. Cash flow from operating activitiesProfit before tax 4,693.08 2,958.05 Adjustments for:
Depreciation and amortisation expense 1,812.54 1,156.49 Lease hold land amortisation - 11.99 Loss on sale/discard of property, plant and equipment 252.32 60.21 Share of loss of associates 0.96 1.36 Finance cost 2,817.23 2,299.99 Incentive income (1,760.67) (1,129.21)Interest income on bank deposits (61.31) (46.61)Interest income on others - (2.99)Interest income on loans and advances and others (7.21) (17.11)Corporate guarantee expenses - 4.32 Expenditure on share-based payments to employees - 40.48 Loss on impairment - 474.54 Loss on sale/discard of investments - Exceptional item 522.94 - Liabilities / provisions no longer required written back (22.32) (43.36)Allowance for expected credit loss on financial assets (including write off )
264.17 65.95
3,818.65 2,876.05 Operating profit before working capital changes 8,511.73 5,834.10 Changes in working capital:Adjustments for changes in operating assets:
Inventories (4,174.91) (2,412.73)Trade receivables 2,629.69 1,603.00 Other current and non-current assets 99.64 (267.25)Other current financials assets (1,008.80) (197.84)Current and non-current loans (73.58) (65.77)
Adjustments for change in operating liabilities:Trade payables (1,269.45) 5117.18Other current financials liabilities 66.16 1.25Other current liabilities (381.37) 466.61Current and non-current provisions 99.58 57.40
(4,013.04) 4,301.85 Cash flow from operations 4,498.69 10,135.95 Income tax paid (net of refunds) (1,112.12) (1,233.52)Net cash flow from operating activities (A) 3,386.57 8,902.43
B. Cash flow from investing activitiesCapital expenditure on property, plant and equipment and intangible assets (adjusted for suppliers payable and capital work-in-progress including capital advances)
(1,492.23) (6,774.26)
Interest received 68.52 66.71 Movement in bank balances not considered as cash and cash equivalents (net)
(6.67) 72.28
Net cash (used in) investing activities (B) (1,430.38) (6,635.27)

167
Annual Report2019-2020
(All amounts in ` lacs, unless otherwise stated)
Consolidated Cash Flow Statement (Contd.)For the year ended March 31, 2020
Particulars For the year ended March 31, 2020
For the year ended March 31, 2019
C. Cash flow from financing activitiesProceeds from issue of equity shares 5.83 0.84 Proceeds from non-current borrowings 2,928.15 2,388.99 Repayment of non-current borrowings (759.22) (708.15)(Repayment of )/ proceeds from current borrowings (net)
(22.02) 94.90
Acquisition of treasury shares (236.72) (117.30)Payment of lease liabilities (318.07) - Finance cost paid (including in relation to lease liabilities)
(2,718.10) (2,346.09)
Dividends including tax thereon paid (710.63) (580.18)Change in non-controlling interest (286.80) (398.97)
Net cash (used in) financing activities (C) (2,117.58) (1,665.96)Net (decrease) / increase in cash and cash equivalents (A+B+C)
(161.39) 601.20
Cash and cash equivalents at the beginning of the year 1,228.42 627.22 Cash and cash equivalents at the end of the year (refer note 12)
1,067.03 1,228.42
The above Consolidated Cash Flow Statement has been prepared under the “Indirect Method” as set out in the Ind AS 7, ‘Statement of Cash flow’.
The accompanying summary of significant accounting policies and other explanatory information are an integral part of the consolidated financial statements.
This is the Consolidated Cash Flow Statement referred to in our report of even date.
For Walker Chandiok & Co. LLP For and on behalf of the Board of DirectorsChartered AccountantsFirm’s Registration No.: 001076N/N500013
Manish Agrawal Rajat Agrawal Yogesh Malhotra Dr. M. P. AgarwalPartner Managing Director Whole Time Director & CEO ChairmanMembership No: 507000 DIN: 00855284 DIN: 05332393 DIN: 00188179
Sunil Kansal Nitin GuptaDate: June 25, 2020 Chief Financial Officer Company SecretaryPlace : Ghaziabad Place : Jaipur Membership No: FCS 9984

168
Corporate Overview Statutory Reports Financial Statements
Cons
olid
ated
Sta
tem
ent o
f Cha
nges
in E
quit
yFo
r the
yea
r end
ed M
arch
31,
202
0(A
ll am
ount
s in
` la
cs, u
nles
s ot
herw
ise
stat
ed)
(a)
Equi
ty s
hare
cap
ital (
refe
r not
e 14
)
Part
icul
ars
Bala
nce
as a
t Ap
ril 1
, 201
8Ch
ange
s du
ring
the
FY
18-1
9
Bala
nce
as a
t M
arch
31,
201
9Ch
ange
s dur
ing
the
FY 1
9-20
Bala
nce
as a
t M
arch
31,
202
0
Equi
ty sh
are
capi
tal
1,3
74.0
9 0
.84
1,37
4.93
5.
83
1,38
0.76
(b)
Oth
er e
quit
y (r
efer
not
e 15
)
Part
icul
ars
Rese
rves
and
sur
plus
Lega
l re
serv
eTr
easu
ry
shar
esFo
reig
n cu
rren
cy
tran
slat
ion
rese
rve
Att
ribu
tabl
e to
ow
ners
of
the
Hol
ding
Co
mpa
ny
Non
-co
ntro
lling
in
tere
sts
Tota
lSe
curi
ties
prem
ium
Gen
eral
re
serv
eSh
are
optio
ns
outs
tand
ing
acco
unt
Reta
ined
ea
rnin
gsCa
sh fl
ow
hedg
ing
rese
rve
Bala
nce
as a
t Apr
il 1,
201
84,
159.
58
517
.90
70.0
1 13
,007
.50
- -
(100
.91)
(60.
15)
17,
593.
93
490.
39 1
8,08
4.32
Pr
ofit f
or th
e ye
ar-
- -
1,5
49.2
3 -
- -
- 1
,549
.23
389.
70
1,9
38.9
3 O
ther
com
preh
ensi
ve in
com
e, n
et
of ta
x-
- -
(2.0
6) 0
.47
- -
72.5
8 70
.99
(14.
38)
56.
61
Tota
l com
preh
ensi
ve in
com
e fo
r th
e ye
ar-
- -
1,54
7.17
0.
47
- -
72.
58
1,6
20.2
2 37
5.32
1
,995
.54
Issu
e of
equ
ity s
hare
s (re
fer n
ote
42)
13.8
6 -
(13.
86)
- -
- -
- -
- -
Equi
ty d
ivid
end
paid
(inc
ludi
ng ta
x th
ereo
n)-
- -
(580
.18)
- -
- -
(580
.18)
(398
.97)
(979
.15)
Acq
uisi
tion
of tr
easu
ry s
hare
s-
- -
- -
- (1
17.3
0)-
(117
.30)
- (1
17.3
0)Em
ploy
ee s
hare
-bas
ed e
xpen
ses
- -
40.4
8 -
- -
- -
40.4
8 -
40.
48
Bala
nce
as a
t Mar
ch 3
1, 2
019
4,17
3.44
5
17.9
0 96
.63
13,9
74.4
9 0.
47
- (2
18.2
1) 1
2.43
1
8,55
7.15
46
6.74
19,
023.
89

169
Annual Report2019-2020
Cons
olid
ated
Sta
tem
ent o
f Cha
nges
in E
quit
yFo
r the
yea
r end
ed M
arch
31,
202
0(A
ll am
ount
s in
` la
cs, u
nles
s ot
herw
ise
stat
ed)
The
acco
mpa
nyin
g su
mm
ary
of s
igni
fican
t acc
ount
ing
polic
ies
and
othe
r exp
lana
tory
info
rmat
ion
are
an in
tegr
al p
art o
f the
con
solid
ated
fina
ncia
l sta
tem
ents
.Th
is is
the
Cons
olid
ated
Sta
tem
ent o
f Cha
nges
in E
quity
refe
rred
to in
our
repo
rt o
f eve
n da
te.
For W
alke
r Cha
ndio
k &
Co.
LLP
Fo
r and
on
beha
lf of
the
Boar
d of
Dire
ctor
sC
hart
ered
Acc
ount
ants
Firm
’s Re
gist
ratio
n N
o.: 0
0107
6N/N
5000
13
Man
ish
Agr
awal
Ra
jat A
graw
al
Yoge
sh M
alho
tra
Dr.
M. P
. Aga
rwal
Part
ner
Man
agin
g D
irect
or
Who
le T
ime
Dire
ctor
& C
EO
Cha
irman
Mem
bers
hip
No:
507
000
DIN
: 008
5528
4 D
IN: 0
5332
393
DIN
: 001
8817
9
Su
nil K
ansa
l N
itin
Gup
taD
ate:
June
25,
202
0 C
hief
Fin
anci
al O
ffice
r Co
mpa
ny S
ecre
tary
Plac
e : G
hazi
abad
Pl
ace
: Jai
pur
Mem
bers
hip
No:
FC
S 99
84
Part
icul
ars
Rese
rves
and
sur
plus
Lega
l re
serv
eTr
easu
ry
shar
esFo
reig
n cu
rren
cy
tran
slat
ion
rese
rve
Att
ribu
tabl
e to
ow
ners
of
the
Hol
ding
Co
mpa
ny
Non
-co
ntro
lling
in
tere
sts
Tota
lSe
curi
ties
prem
ium
Gen
eral
re
serv
eSh
are
optio
ns
outs
tand
ing
acco
unt
Reta
ined
ea
rnin
gsCa
sh fl
ow
hedg
ing
rese
rve
Bala
nce
as a
t Mar
ch 3
1, 2
019
4,17
3.44
5
17.9
0 96
.63
13,9
74.4
9 0.
47
- (2
18.2
1) 1
2.43
1
8,55
7.15
46
6.74
19,
023.
89
Profi
t for
the
year
- -
- 3
,317
.95
- -
- -
3,3
17.9
5 34
0.21
3
,658
.16
Oth
er c
ompr
ehen
sive
inco
me,
net
of
tax
- -
- (2
.73)
(52.
68)
- -
266.
83
211.
42
(0.2
2)21
1.20
Tota
l com
preh
ensi
ve in
com
e fo
r th
e ye
ar-
- -
3,31
5.22
(5
2.68
)-
- 2
66.8
3 3
,529
.37
339.
99
3,8
69.3
6
Issu
e of
equ
ity s
hare
s (re
fer n
ote
42)
96.6
3 -
(96.
63)
- -
- -
- -
- -
Equi
ty d
ivid
end
paid
(inc
ludi
ng ta
x th
ereo
n)-
- -
(206
.51)
- -
- -
(206
.51)
(286
.80)
(493
.31)
Inte
rim e
quity
div
iden
d pa
id
(incl
udin
g ta
x th
ereo
n)-
- -
(504
.12)
- -
- -
(504
.12)
- (5
04.1
2)
Acq
uisi
tion
of tr
easu
ry s
hare
s-
- -
- -
- (2
36.7
2)-
(236
.72)
- (2
36.7
2)A
mou
nt tr
ansf
erre
d to
lega
l res
erve
- -
- (6
2.82
) -
62.8
2 -
- -
- -
Adj
ustm
ent o
n ad
optio
n of
Ind
AS-
116
(refe
r not
e 17
)-
- -
(61.
72)
- -
- -
(61.
72)
- (6
1.72
)
Effec
t of c
hang
e in
gro
up's
inte
rest
- -
- 62
.88
- -
- (2
.90)
59.9
8 -
59.
98
Bala
nce
as a
t Mar
ch 3
1, 2
020
4,27
0.07
5
17.9
0 -
16,5
17.4
2 (5
2.21
)62
.82
(454
.93)
276
.36
21,
137.
43
519.
93 2
1,65
7.36

170
Corporate Overview Statutory Reports Financial Statements
Note 1 - Corporate information, statement of compliance with Ind AS, basis of preparation and summary of significant accounting policies
(A) Corporate Information
Gravita India Limited (the ‘Holding Company’) is a public limited Company domiciled and incorporated under the provisions of the Companies Act, 1956 applicable in India. The Holding Company’s equity shares are listed at the Bombay Stock Exchange (BSE) and the National Stock Exchange (NSE). The registered office of the Holding Company is situated at “Saurabh”, Chittora Road, Harsulia Mod, Diggi-Malpura Road, Tehsil-Phagi, Jaipur-303904 and having principal place of business in Jaipur (Rajasthan), Gujarat, Chittoor (Andhra Pradesh), Kathua (Jammu and Kashmir), Ghana (East Africa), Mirigama (Sri Lanka), Mozambique (East Africa) and Senegal (East Africa). Gravita India Limited together with its subsidiaries and associate is hereinafter referred to as “Group”.
The Principal activities of the Group are - Lead processing, aluminium processing, trade (Lead products and aluminium scrap) and dealing in Turn-key lead recycling projects. The Holding Company carries out smelting of lead battery scrap / Lead concentrate to produce secondary Lead metal, which is further transformed into Pure Lead, Specific Lead Alloy, Lead Oxides (Lead sub-oxide, Red Lead, and Litharge) and Lead products like Lead sheets, Lead powder, Lead shot etc. Further, Holding Company has also entered in the PET product manufacturing.
These consolidated financial statements for the year ended March 31, 2020 are approved and adopted by the Board of Directors in their meeting held on June 25, 2020. The revision to financial statements is permitted by Board of Directors after obtaining necessary approvals or at the instance of regulatory authorities as per provisions of Companies Act, 2013.
(B) Statement of compliance with Ind AS and basis of preparation
These consolidated financial statements of the Group have been prepared in accordance with the Indian Accounting Standards (hereinafter referred to as the ‘Ind AS’) as notified by Ministry of Corporate Affairs pursuant to section 133 of the Companies Act, 2013.
The consolidated financial statements have been prepared on accrual and going concern basis.
The consolidated financial statements have been prepared using uniform accounting policies for like transactions and other events in similar circumstances and are presented in the same manner as the Company’s separate financial statements.
The consolidated financial statements have been prepared under historical cost convention basis except for the following –
• Certainfinancialassetswhicharemeasuredatfairvalue.
• Definedbenefitplans–planassetsmeasuredatfairvalue.
Further, certain financial assets and financial liabilities are measured at fair value and are categorised into level 1, level 2 and level 3 based on the degree to which the inputs to the fair value measurements are observable.
(C) Basis of consolidation
Subsidiaries
Subsidiaries are all entities (including structured entities) over which the Group has control. The Group controls an entity when the Group is exposed to, or has rights to, variable returns from its involvement with the entity and has the ability to affect those returns through its power to direct the relevant activities of the entity. Subsidiaries are fully consolidated from the date on which control is transferred to the Group. They are deconsolidated from the date that control ceases. Profit/ (loss) and Other Comprehensive Income (‘OCI’) of subsidiaries acquired or disposed of during the period are recognised from the effective date of acquisition, or up to the effective date of disposal, as applicable. All the consolidated subsidiaries have a consistent reporting date of March 31, 2020.
The Group combines the financial statements of the parent and its subsidiaries line by line adding together like items of assets, liabilities, equity, income and expenses. Intercompany transactions, balances and unrealised gains on transactions between group companies are eliminated. Unrealised losses are also eliminated unless the transaction provides evidence of an impairment of the transferred asset. Accounting policies of subsidiaries have been changed where necessary to ensure consistency with the policies adopted by the Group.
Summary of the significant accounting policies and other explanatory information (Contd.)For the year ended March 31, 2020

171
Annual Report2019-2020
Non-controlling interests, presented as part of equity, represent the portion of a subsidiary’s Statement of Profit and Loss and net assets that is not held by the Group. Profit/(loss) and each component of OCI are attributed to the equity holders of the Holding Company and to the non-controlling interests, even if this results in the non-controlling interests having a deficit balance. The Group attributes total comprehensive income or loss of the subsidiaries between the owners of the parent and the non-controlling interests based on their respective ownership interests.
The Group treats transactions with non-controlling interests that do not result in a loss of control as transactions with equity owners of the group. Such a change in ownership interest results in an adjustment between the carrying amounts of the controlling and non-controlling interests to reflect their relative interests in the subsidiary. Any difference between the amount of the adjustment to non-controlling interests and any consideration paid or received is recognised within equity.
Associate
Investment in entities in which there exists significant influence but not a controlling interest are accounted for under the equity method i.e. the investment is initially recorded at cost, identifying any goodwill/ capital reserve arising at the time of acquisition, as the case may be, which will be inherent in investment. The carrying amount of the investment is adjusted thereafter for the post acquisition change in the share of net assets of the investee, adjusted where necessary to ensure consistency with the accounting policies of the Group. The consolidated Statement of Profit and Loss includes the Group’s share of the results of the operations of the investee. Dividends received or receivable from associate ventures are recognised as a reduction in the carrying amount of the investment. Unrealised gains on transactions between the Group and associate are eliminated to the extent of the Group’s interest in these entities.
(D) Significant accounting policies
I. Current versus non-current classification
The Group presents assets and liabilities in the balance sheet based on current/ non-current classification.
An asset is treated as current when it is:
• Expectedtoberealisedorintendedtobesoldorconsumedinnormaloperatingcycle,
• Heldprimarilyforthepurposeoftrading,
• Expectedtoberealisedwithintwelvemonthsafterthereportingperiod,or
• Cashorcashequivalentunlessrestrictedfrombeingexchangedorusedtosettlealiabilityforatleasttwelve months after the reporting period.
A liability is current when:
• Itisexpectedtobesettledinnormaloperatingcycle,
• Itisheldprimarilyforthepurposeoftrading,
• Itisduetobesettledwithintwelvemonthsafterthereportingperiod,or
• Thereisnounconditionalrighttodeferthesettlementoftheliabilityforatleasttwelvemonthsafterthe reporting period
Deferred tax assets and liabilities are classified as non-current assets and liabilities.
Based on the nature of products and the time between acquisition of assets for processing and their realisation in cash and cash equivalents, the Group has ascertained its operating cycle as 12 months for the purpose of current or non-current classification of assets and liabilities.
II. Property, plant and equipment
Recognition and initial measurement
Property, plant and equipment are stated at their cost of acquisition or construction. Following initial recognition, property plant and equipment are carried at cost less any accumulated depreciation and accumulated impairment losses, if any. The cost comprises purchase price, borrowing cost if capitalisation criteria are met and directly attributable cost of bringing the asset to its working condition for the intended use. Any trade discount and rebates are deducted in arriving at the purchase price.
Summary of the significant accounting policies and other explanatory information (Contd.)For the year ended March 31, 2020

172
Corporate Overview Statutory Reports Financial Statements
Subsequent costs are included in the asset’s carrying amount or recognised as a separate asset, as appropriate, only when it is probable that future economic benefits associated with the item will flow to the entity and the cost can be measured reliably. All other repair and maintenance costs are recognised in the Statement of Profit and Loss as incurred.
Subsequent measurement (depreciation and useful lives)
Depreciation on property, plant and equipment is provided on the straight-line method computed on the basis of the useful life prescribed under Schedule II of the Companies Act, 2013. The following useful life of assets has been taken by the Group:
Tangible assets Useful lifeBuildings – factory and non-factory 5 - 60 years
Plant and equipment 15 years
Furniture and fixtures 10 years
Vehicles 8 years
Computer and accessories 3- 6 years
Office equipment 5 years
Freehold land is measured at cost and is not depreciated.
Property, plant and equipment costing upto ` 5,000 each are fully depreciated in the year of purchase.
Where, during any financial year, any addition has been made to any asset, or where any asset has been sold, discarded, demolished or destroyed, or significant components replaced; depreciation on such assets is calculated on a pro rata basis as individual assets with specific useful life from the month of such addition or, as the case may be, up to the month on which such asset has been sold, discarded, demolished or destroyed or replaced.
The estimated useful lives and methods of depreciation of property, plant and equipment are reviewed at each financial year end and adjusted prospectively, if appropriate.
De-recognition
An item of property, plant and equipment or any significant part initially recognised of such item of property plant and equipment is derecognised upon disposal or when no future economic benefits are expected from its use or disposal. Any gain or loss arising on de-recognition of the asset (calculated as the difference between the net disposal proceeds and the carrying amount of the asset) is included in the income statement when the asset is derecognised.
Capital work-in-progress are assets which are not yet ready for their intended use are carried at cost comprising direct cost, related incidental expenses and attributable interest.
III. Intangible assets
Recognition and initial measurement
Intangible assets acquired separately are measured on initial recognition at cost. Following initial recognition, intangible assets are carried at cost less any accumulated amortization and accumulated impairment losses, if any.
Subsequent measurement (amortisation and useful lives)
All finite-lived intangible assets are amortised on a straight-line basis over their estimated useful lives. The estimated useful life of an identifiable intangible asset is based on a number of factors including the effects of obsolescence, demand, competition, and other economic factors (such as the stability of the industry, and known technological advances), and the level of maintenance expenditures required to obtain the expected future cash flows from the asset.
Residual values and useful lives are reviewed at each reporting date. The following useful lives are applied:
Intangible Assets Useful life (in years)Software 3-5 years
Summary of the significant accounting policies and other explanatory information (Contd.)For the year ended March 31, 2020

173
Annual Report2019-2020
De-recognition
Gains or losses arising from derecognition of an intangible asset are measured as the difference between the net disposal proceeds and the carrying amount of the asset and are recognised in the Statement of Profit or Loss when the asset is derecognised.
IV. Impairment of non-financial assets
For impairment assessment purposes, assets are grouped at the lowest levels for which there are largely independent cash inflows (cash generating units). As a result, some assets are tested individually for impairment and some are tested at cash-generating unit level.
The Group assesses at each balance sheet date whether there is any indication that an asset may be impaired. If any such indication exists, the Group estimates the recoverable amount of the asset. If such recoverable amount of the asset or the recoverable amount of the cash generating unit to which the asset belongs is less than its carrying amount, the carrying amount is reduced to its recoverable amount. The reduction is treated as an impairment loss and is recognized in the Statement of Profit and Loss. If at the balance sheet date, there is an indication that a previously assessed impairment loss no longer exists then the recoverable amount is reassessed and the asset is reflected at the recoverable amount subject to a maximum of depreciated historical cost. Impairment losses previously recognised are accordingly reversed in the Statement of Profit and Loss.
To determine value-in-use, management estimates expected future cash flows from each cash generating unit and determines a suitable discount rate in order to calculate the present value of those cash flows. The data used for impairment testing procedures are directly linked to the Group’s latest approved budget, adjusted as necessary to exclude the effects of future re-organisations and asset enhancements. Discount factors are determined individually for each cash-generating unit and reflect current market assessment of the time value of money and asset-specific risk factors.
V. Borrowing costs
Borrowing costs directly attributable to the acquisition, construction or production of a qualifying asset are capitalised during the period of time that is necessary to complete and prepare the asset for its intended use. Borrowing costs consist of interest calculated using the effective interest method that an entity incurs in connection with the borrowing of funds. Borrowing cost also includes exchange differences to the extent regarded as an adjustment to the borrowing costs.
All other borrowing costs are charged to the Statement of Profit and Loss as incurred.
VI. Inventories
Inventories are valued at cost or net realisable value, whichever is lower. The basis of determining the cost for various categories of inventory are as follows:
a) Raw materials and stores and spares: Cost includes cost of purchase and other costs incurred in bringing the inventories to their present location and condition. Cost is determined on moving weighted average basis.
b) Stock in process and finished goods: Direct cost-plus appropriate share of overheads and excise duty, wherever applicable.
c) Traded goods: Purchase cost and other overheads incurred to bring the goods to their present location.
d) By products: At estimated realisable value.
Net realisable value is the estimated selling price in the ordinary course of business less any applicable selling expenses. Provision for obsolescence and slow-moving inventory is made based on management’s best estimates of net realisable value of such inventories.
VII. Foreign Currency Transactions and Translation
Functional and presentation currency
The consolidated financial statements are presented in Indian Rupees (`) and are rounded to two decimal places of lacs, which is also the Holding Company’s functional and presentation currency.
Transactions and balances
Transactions in foreign currencies are initially recorded by the Group at its functional currency spot rates at the date the transaction first qualifies for recognition.
Summary of the significant accounting policies and other explanatory information (Contd.)For the year ended March 31, 2020
174
Corporate Overview Statutory Reports Financial Statements
Monetary assets and liabilities denominated in foreign currencies are translated at the functional currency spot rates of exchange at the reporting date. Exchange differences arising on settlement or translation of monetary items as at reporting date are recognised in profit or loss.
Non-monetary items that are measured in terms of historical cost in a foreign currency are translated using the exchange rates at the dates of the initial transactions.
Translation of foreign operations
In the Group’s financial statements, all assets, liabilities and transactions of the Group entities with functional currency other than the Indian Rupee are translated into Indian Rupee upon consolidation. The functional currency of the entities in the Group has remained unchanged during the reporting period. On consolidation, assets and liabilities have been translated into Indian Rupee at the closing rate at the reporting date and the equity is translated at historical rate. Fair value adjustments arising on the acquisition of a foreign entity have been treated as assets and liabilities of the foreign entity and translated into Indian Rupee at the closing rate. Income and expenses have been translated into Indian Rupee at the average rate over the reporting period. Exchange differences are charged/ credited to other comprehensive income and recognized in the currency translation reserve in equity. On disposal of a foreign operation, the related cumulative translation differences recognized in equity are reclassified to the Statement of Profit or Loss and are recognized as part of the gain or loss on disposal.
VIII. Leases
Effective April 1, 2019, the Group adopted Ind AS 116 “Leases” and applied the standard to all lease contracts existing on April 1, 2019 using the modified retrospective method. The Group has recorded the lease liability at the present value of the lease payments discounted at the incremental borrowing at the date of initial application and right-of-use assets at its carrying amount as if the standard had been applied since the commencement date. Right of use asset has been adjusted for any prepaid or accrued lease payments that existed at the date of transition. The cumulative effect of adopting Ind AS 116 has been recognised in equity as an adjustment to the opening balance of retained earnings for the current period.
Comparatives as at and for the year ended March 31, 2019 have not been retrospectively adjusted.
The Group as a lessee
The Group’s lease asset classes primarily consist of leases for land, buildings and equipment. The Group assesses whether a contract contains a lease, at inception of a contract. A contract is, or contains, a lease if the contract conveys the right to control the use of an identified asset for a period of time in exchange for consideration. To assess whether a contract conveys the right to control the use of an identified asset, the Group assesses whether:
(i) the contract involves the use of an identified asset
(ii) the Group has substantially all of the economic benefits from use of the asset through the period of the lease and
(iii) the Group has the right to direct the use of the asset.
The Group at the commencement of the lease contract recognizes a right-of-use asset at cost and corresponding lease liability, except for leases with term of less than twelve months (short term leases) and low-value assets. For these short term and low value leases, the Group recognizes the lease payments as an operating expense on a straight-line basis over the lease term.
Certain lease arrangements include the options to extend or terminate the lease before the end of the lease term. Right-of-use assets and lease liabilities includes these options when it is reasonably certain that they will be exercised.
The cost of right-of-use asset comprises the amount of the initial measurement of the lease liability, any lease payments made at or before the inception date of the lease, plus any initial direct costs, less any lease incentives received. Subsequently, the right-of-use assets are measured at cost less any accumulated depreciation and impairment losses, if any. The right-of-use asset are depreciated using the straight-line method from the commencement date over the shorter of lease term or useful life of right-of-use asset.
The lease liability is initially measured at amortized cost at the present value of the future lease payments. The lease payments are discounted using the interest rate implicit in the lease or, if not readily determinable, using the incremental borrowing rates in the country of domicile of these leases. Lease liabilities are re-measured with
Summary of the significant accounting policies and other explanatory information (Contd.)For the year ended March 31, 2020
175
Annual Report2019-2020
a corresponding adjustment to the related right of use asset if the Group changes its assessment if whether it will exercise an extension or a termination option.
IX. Fair value measurement
Fair value is the price that would be received to sell an asset or paid to transfer a liability in an orderly transaction between market participants at the measurement date. The fair value measurement is based on the presumption that the transaction to sell the asset or transfer the liability takes place either:
• Intheprincipalmarketfortheassetorliability;or
• Intheabsenceofaprincipalmarket,inthemostadvantageousmarketfortheassetorliability.
The principal or the most advantageous market must be accessible by the Group.
The fair value of an asset or a liability is measured using the assumptions that market participants would use when pricing the asset or liability, assuming that market participants act in their economic best interest.
A fair value measurement of a non-financial asset takes into account a market participant’s ability to generate economic benefits by using the asset in its highest and best use or by selling it to another market participant that would use the asset in its highest and best use.
Group uses valuation techniques that are appropriate in the circumstances and for which sufficient data are available to measure fair value, maximizing the use of relevant observable inputs and minimizing the use of unobservable inputs.
All assets and liabilities for which fair value is measured or disclosed in the financial results are categorized within the fair value hierarchy, described as follows, based on the lowest level input that is significant to the fair value measurement as a whole:
Level 1 — Quoted (unadjusted) market prices in active markets for identical assets or liabilities.
Level 2 — Valuation techniques for which the lowest level input that is significant to the fair value measurement is directly or indirectly observable.
Level 3 — Valuation techniques for which the lowest level input that is significant to the fair value measurement is Unobservable.
For assets and liabilities that are recognized in the financial statements on a recurring basis, the Group determines whether transfers have occurred between levels in the hierarchy by re-assessing categorization (based on the lowest level input that is significant to the fair value measurement as a whole) at the end of each reporting period or each case.
For the purpose of fair value disclosures, the Group has determined classes of assets and liabilities on the basis of the nature, characteristics and risks of the asset or liability and the level of the fair value hierarchy as explained above.
X. Revenue Recognition
To determine whether to recognise revenue, the Group follows a 5-step process:
1. Identifying the contract with a customer
2. Identifying the performance obligations
3. Determining the transaction price
4. Allocating the transaction price to the performance obligations
5. Recognising revenue when/as performance obligation(s) are satisfied.
Sale of products (including scrap sales and service income): Sales (including scrap sales) are recognised when control of products is transferred to the buyer as per the terms of the contract and are accounted for net of returns and rebates. Control of goods refers to the ability to direct the use of and obtain substantially all of the remaining benefits from goods. Sales, as disclosed, are exclusive of goods and services tax. Generally, control is transferred upon shipment of goods to the customer or when the goods is made available to the customer, provided transfer of title to the customer occurs and the Group has not retained any significant risks of ownership or future obligations with respect to the goods shipped.
Summary of the significant accounting policies and other explanatory information (Contd.)For the year ended March 31, 2020

176
Corporate Overview Statutory Reports Financial Statements
Income in respect of service contracts are recognised in Statement of Profit and Loss on completion of performance obligation
The Group considers the terms of the contract and its customary business practices to determine the transaction price. The transaction price is the amount of consideration to which the Group expects to be entitled in exchange for transferring promised goods or services to a customer, excluding amounts collected on behalf of third parties (for example, indirect taxes). The consideration promised in a contract with a customer may include fixed consideration, variable consideration (if reversal is less likely in future), or both. No element of financing is deemed present as the sales are largely made on advance payment terms or with credit term of not more than one year.
The transaction price is allocated by the Group to each performance obligation (or distinct good or service) in an amount that depicts the amount of consideration to which it expects to be entitled in exchange for transferring the promised goods or services to the customer.
For each performance obligation identified, the Group determines at contract inception whether it satisfies the performance obligation over time or satisfies the performance obligation at a point in time.
The Group recognises contract liabilities for consideration received in respect of unsatisfied performance obligations and reports these amounts as other liabilities in the statement of financial position. Similarly, if the Group satisfies a performance obligation before it receives the consideration, the Group recognises either a contract asset or a receivable in its statement of financial position, depending on whether something other than the passage of time is required before the consideration is due
Interest income: Interest income from a financial asset is recognised when it is probable that the economic benefit will flow to the Group and the amount of income can be measured reliably. Interest income is accrued on a time basis, by reference to the principal outstanding and at the effective rate applicable, which is the rate that discounts estimated future cash receipts through the expected life of the financial assets to that asset’s net carrying amount on initial recognition
Job Work Income: Revenue from job work services is recognised based on the services rendered in accordance with the terms of contracts.
Dividend income: Dividend income is recognised at the time when right to receive the payment is established, which is generally when the shareholders approve the dividend.
XI. Non- current assets held for sale
An entity shall classify a non-current asset as held for sale if its carrying amount will be recovered principally through a sale transaction rather than through continuing use. This condition is regarded as met only when the asset is available for immediate sale in its present condition subject only to terms that are usual and customary for sale of such asset and its sale is highly probable. Management must be committed to sale which should be expected to qualify for recognition as a completed sale within one year from the date of classification.
Non-current assets classified as held for sale are presented separately and measured at the lower of their carrying amounts immediately prior to their classification as held for sale and their fair value less costs to sell. However, some held for sale assets such as financial assets, assets arising from employee benefits and deferred tax assets, continue to be measured in accordance with the Group’s relevant accounting policy for those assets. Once classified as held for sale, the assets are not subject to depreciation or amortisation.
XII. Financial Instruments
Initial measurement
Financial instruments are recognised when the Group becomes a party to the contractual provisions of the instrument and are measured initially at fair value adjusted for transaction costs, except for those carried at fair value through profit or loss which are measured initially at fair value.
If the Group determines that the fair value at initial recognition differs from the transaction price, the Group accounts for that instrument at that date as follows:
• Atthemeasurementbasismentionedaboveifthatfairvalueisevidencedbyaquotedpriceinanactivemarket for an identical asset or liability (i.e. a Level 1 input) or based on a valuation technique that uses only data from observable markets. The Group recognises the difference between the fair value at initial recognition and the transaction price as a gain or loss.
Summary of the significant accounting policies and other explanatory information (Contd.)For the year ended March 31, 2020

177
Annual Report2019-2020
• Inallothercases,atthemeasurementbasismentionedabove,adjustedtodeferthedifferencebetweenthe fair value at initial recognition and the transaction price. After initial recognition, the Group recognises that deferred difference as a gain or loss only to the extent that it arises from a change in a factor (including time) that market participants would take into account when pricing the asset or liability.
Subsequent measurement of financial assets and financial liabilities is described below.
Financial assets
Classification and subsequent measurement
For the purpose of subsequent measurement, financial assets are classified into the following categories upon initial recognition:
a. Financial assets at amortised cost – a financial instrument is measured at amortised cost if both the following conditions are met:
• Theassetisheldwithinabusinessmodelwhoseobjectiveistoholdassetsforcollectingcontractualcash flows; and
• Contractualtermsoftheassetgiveriseonspecifieddatestocashflowsthataresolelypaymentsofprincipal and interest (SPPI) on the principal amount outstanding.
After initial measurement, such financial assets are subsequently measured at amortised cost using the effective interest method. Effective interest rate (EIR) is the rate that exactly discounts estimated future cash receipts through the expected life of the financial asset to the net carrying amount of the financial assets. The future cash flows include all other transaction costs paid or received, premiums or discounts if any, etc.
b. Financial assets at fair value
• Derivative assets - All derivative assets are measured at fair value through profit and loss (FVTPL).
• Investments in equity instruments– All equity investments in scope of Ind AS 109 are measured at fair value. Equity instruments which are held for trading are generally classified at fair value through profit and loss (FVTPL). For all other equity instruments, the Group decides to classify the same either at fair value through other comprehensive income (FVOCI) or fair value through profit and loss (FVTPL). The Group makes such election on an instrument by instrument basis. The classification is made on initial recognition and is irrevocable.
If the Group decides to classify an equity instrument as at FVOCI, then all fair value changes on the instrument, excluding dividends, are recognised in the other comprehensive income (OCI). There is no recycling of the amounts from OCI to P&L, even on sale of investment. However, the Group may transfer the cumulative gain or loss within equity. Dividends on such investments are recognised in profit or loss unless the dividend clearly represents a recovery of part of the cost of the investment.
Equity instruments included within the FVTPL category are measured at fair value with all changes recognised in the Statement of Profit and Loss account.
De-recognition of financial assets
A financial asset is primarily de-recognised when the rights to receive cash flows from the asset have expired or the Group has transferred its rights to receive cash flows from the asset.
Financial liabilities
Subsequent measurement
After initial recognition, the financial liabilities, other than derivative liabilities, are subsequently measured at amortised cost using the effective interest method.
Amortised cost is calculated by considering any discount or premium on acquisition and fees or costs that are an integral part of the EIR. The effect of EIR amortisation is included as finance costs in the Statement of Profit and Loss.
All derivative liabilities are measured at fair value through profit and loss (FVTPL).
Summary of the significant accounting policies and other explanatory information (Contd.)For the year ended March 31, 2020

178
Corporate Overview Statutory Reports Financial Statements
De-recognition of financial liabilities
A financial liability is de-recognised when the obligation under the liability is discharged or cancelled or expires. When an existing financial liability is replaced by another from the same lender on substantially different terms, or the terms of an existing liability are substantially modified, such an exchange or modification is treated as the de-recognition of the original liability and the recognition of a new liability. The difference in the respective carrying amounts is recognised in the Statement of Profit or Loss
Offsetting of financial instruments
Financial assets and financial liabilities are offset and the net amount is reported in the balance sheet if there is a currently enforceable legal right to offset the recognised amounts and there is an intention to settle on a net basis, to realize the assets and settle the liabilities simultaneously
XIII. Hedge accounting
The Group designates non derivative financial liabilities, such as foreign currency borrowings from banks, as hedging instruments for the hedge of foreign currency risk associated with highly probable forecasted. transactions and, accordingly, applies cash flow hedge accounting for such relationships. At the inception of a hedge relationship, the Group formally designates and documents the hedge relationship to which the Group wishes to apply hedge accounting and the risk management objective and strategy for undertaking the hedge.
The documentation includes the Group’s risk management objective and strategy for undertaking hedge, the hedging/ economic relationship, the hedged item or transaction, the nature of the risk being hedged and how the entity will assess the effectiveness of changes in the hedging instrument’s fair value in offsetting the exposure to changes in the hedged item’s fair value or cash flows attributable to the hedged risk.
Such hedges are expected to be highly effective in achieving offsetting changes in fair value or cash flows and are assessed on an ongoing basis to determine that they actually have been highly effective throughout the financial reporting periods for which they were designated.
Hedges that meet the strict criteria for hedge accounting are accounted for, as described below:
Amounts recognised as other comprehensive income are transferred to profit or loss when the hedged transaction affects profit or loss, such as when the hedged financial income or financial expense is recognised or when a forecast transaction occurs. If the hedging instrument expires or is sold, terminated or exercised without replacement or rollover (as part of the hedging strategy), or if its designation as a hedge is revoked, or when the hedge no longer meets the criteria for hedge accounting, any cumulative gain or loss previously recognised in other comprehensive income remains separately in other equity until the forecast transaction occurs or the foreign currency firm commitment is met
XIV. Impairment of financial assets
All financial assets except for those at FVTPL are subject to review for impairment at least at each reporting date to identify whether there is any objective evidence that a financial asset or a group of financial assets is impaired. Different criteria to determine impairment are applied for each category of financial assets.
In accordance with Ind-AS 109, the Group applies expected credit loss (ECL) model for measurement and recognition of impairment loss for financial assets carried at amortised cost.
ECL is the weighted average of difference between all contractual cash flows that are due to the Group in accordance with the contract and all the cash flows that the Group expects to receive, discounted at the original effective interest rate, with the respective risks of default occurring as the weights. When estimating the cash flows, the Group is required to consider:
• Allcontractualtermsofthefinancialassets(includingprepaymentandextension)overtheexpectedlifeofthe assets; and
• Cashflowsfromthesaleofcollateralheldorothercreditenhancementsthatareintegraltothecontractualterms.
Summary of the significant accounting policies and other explanatory information (Contd.)For the year ended March 31, 2020

179
Annual Report2019-2020
Trade receivables
The Group applies approach permitted by Ind AS 109 Financial Instruments, which requires lifetime expected credit losses to be recognised upon initial recognition of receivables. Lifetime ECL are the expected credit losses resulting from all possible default events over the expected life of a financial instrument.
The Group uses the expected credit loss model to assess any required allowances and uses a provision matrix to compute the expected credit loss allowance for trade receivables. Life time expected credit losses are assessed and accounted based on Group’s historical collection experience for customers and forecast of macro-economic factors.
The Group defines default as an event when the financial asset is past due for more than 180 days. This definition is based on management’s expectation of the time period beyond which if a receivable is outstanding, it is an objective evidence of impairment.
The Group writes off trade receivables when there is no objective evidence that such amounts would not be recovered. Financial assets that are written-off are still subject to enforcement activity by the Group.
Other financial assets
For recognition of impairment loss on other financial assets and risk exposure, the Group determines whether there has been a significant increase in the credit risk since initial recognition. If the credit risk has not increased significantly since initial recognition, the Group measures the loss allowance at an amount equal to 12-month expected credit losses, else at an amount equal to the lifetime expected credit losses.
XV. Cash Flow Statement
Cash flows are reported using the indirect method, whereby profit for the year is adjusted for the effects of transactions of a non-cash nature, any deferrals or accruals of past or future operating cash receipts or payments and item of income or expenses associated with investing or financing cash flows. The cash flows from operating, investing and financing activities of the Group are segregated. The Group considers all highly liquid investments that are readily convertible to known amounts of cash to be cash equivalents.
XVI. Post-employment, long term and short term employee benefits
The Group provides post-employment benefits through various defined contribution and defined benefit plans.
Defined Contribution plan
The Group makes contribution to statutory provident fund in accordance with Employees’ Provident Fund and Miscellaneous Provisions Act, 1952. The plan is a defined contribution plan and contribution paid or payable is recognized as an expense in the period in which services are rendered by the employee
Defined benefit plan
The liability recognized in respect of gratuity is the present value of defined benefit obligation at the end of the reporting period less the fair value of plan assets. The Group makes contribution to the trust namely Gravita India Limited Employees Gratuity Trust for Employees Gratuity Scheme. The defined benefit obligation is calculated annually by actuary using the Projected Unit Credit Method. Re-measurement comprising actuarial gains and losses and return on plan assets (excluding net interest) are recognized in the other comprehensive income for the period in which they occur and are not reclassified to profit or loss.
Other long-term employee benefits
Liability in respect of compensated absences becoming due or expected to be availed more than one year after the balance sheet date is estimated on the basis of an actuarial valuation performed by an independent actuary using the projected unit credit method.
Actuarial gains and losses arising from past experience and changes in actuarial assumptions are charged to Statement of Profit and Loss in the year in which such gains or losses are determined.
Short term employee benefit
Expense in respect of other short-term benefits is recognized on the basis of amount paid or payable for the period during which services are rendered by the employees.
Summary of the significant accounting policies and other explanatory information (Contd.)For the year ended March 31, 2020

180
Corporate Overview Statutory Reports Financial Statements
XVII. Share based payments
Employees of the Group receive remuneration in the form of share-based payments in consideration of the services rendered, under “Gravita ESOP 2011 scheme” and “Gravita Stock Appreciation Rights Scheme 2017”.
Under the equity settled share-based payment, the fair value of options granted is recognized as an employee benefits expense with a corresponding increase in other equity. The total amount to be expensed is determined by reference to the fair value of the options. The total expense is recognized over the vesting period, which is the period over which all of the specified vesting conditions are to be satisfied. Upon exercise of share options, the proceeds received are allocated to share capital up to the par value of the shares issued with any excess being recorded as share premium.
For cash-settled share-based payments, the fair value of the amount payable to employees is recognised as ‘employee benefit expenses’ with a corresponding increase in liabilities, over the period of non-market vesting conditions getting fulfilled. The liability is remeasured at each reporting period up to, and including the settlement date, with changes in fair value recognised in employee benefits expenses.
XVIII. Provisions, contingent assets and contingent liabilities
Provisions are recognised only when there is a present obligation, as a result of past events, it is probable that an outflow of resources embodying economic benefits will be required to settle the obligation, and when a reliable estimate of the amount of obligation can be made at the reporting date. These estimates are reviewed at each reporting date and adjusted to reflect the current best estimates.
Provisions are discounted to their present values, where the time value of money is material.
Contingent liability is disclosed for:
• Possibleobligationswhichwillbeconfirmedonlyby futureeventsnotwhollywithinthecontrolof theGroup or
• Presentobligationsarisingfrompasteventswhereitisnotprobablethatanoutflowofresourceswillberequired to settle the obligation or a reliable estimate of the amount of the obligation cannot be made.
Contingent assets are not recognised. However, when inflow of economic benefits is probable, related asset is disclosed.
XIX. Earnings per share
Basic earnings per share is calculated by dividing the net profit or loss for the period attributable to equity shareholders (after deducting attributable taxes) by the weighted average number of equity shares outstanding during the period. The weighted average number of equity shares outstanding during the period is adjusted for events including a bonus issue.
For the purpose of calculating diluted earnings per share, the net profit or loss for the period attributable to equity shareholders and the weighted average number of shares outstanding during the period are adjusted for the effects of all dilutive potential equity shares.
Potential ordinary shares shall be treated as dilutive when, and only when, their conversion to ordinary shares would decrease earnings per share or increase loss per share from continuing operations.
XX. Taxes
Income taxes
Current income tax assets and liabilities are measured at the amount expected to be recovered from or paid to the taxation authorities. The tax rates and tax laws used to compute the amount are those that are enacted or substantively enacted, at the reporting date.
Current income tax relating to items recognised outside profit or loss is recognised outside profit or loss (either in other comprehensive income or in equity). Management periodically evaluates positions taken in the tax returns with respect to situations in which applicable tax regulations are subject to interpretation and establishes provisions where appropriate.
Summary of the significant accounting policies and other explanatory information (Contd.)For the year ended March 31, 2020

181
Annual Report2019-2020
Summary of the significant accounting policies and other explanatory information (Contd.)For the year ended March 31, 2020
Deferred tax
Deferred tax liabilities are generally recognised in full for all taxable temporary differences. Deferred tax assets are recognised to the extent that it is probable that the underlying tax loss, unused tax credits (Minimum alternate tax credit entitlement) or deductible temporary difference will be utilised against future taxable income. This is assessed based on the Group’s forecast of future operating results, adjusted for significant non-taxable income and expenses and specific limits on the use of any unused tax loss or credit.Unrecognised deferred tax assets are re-assessed at each reporting date and are recognised to the extent that it has become probable that future taxable profits will allow deferred tax asset to be recovered.
Deferred tax assets and liabilities are measured at the tax rates that are expected to apply in the year when the asset is realised or the liability is settled, based on tax rates (and tax laws) that have been enacted or substantively enacted at the reporting date. Deferred tax items are recognised in correlation to the underlying transaction either in other comprehensive income or directly in equity. Deferred tax assets are only recognised to the extent that it is probable that future taxable profits will be available against which the temporary differences can be utilised.
Deferred tax relating to items recognized outside profit or loss is recognized outside profit or loss (either in other comprehensive income or in equity). Deferred tax items are recognized in correlation to the underlying transaction either in OCI or directly in equity.
Minimum Alternate Tax (‘MAT’) credit is recognized as an asset only when and to the extent it is probable that the Group will pay normal income tax during the specified period. In the year in which MAT credit becomes eligible to be recognized as an asset, the said asset is created by way of a credit to the Statement of Profit and Loss and shown as MAT credit entitlement. The Group reviews the same at each balance sheet date and writes down the carrying amount of MAT credit entitlement to the extent it is not probable that the Group will pay normal income tax during the specified period.
XXI. Cash and cash equivalents
Cash and cash equivalent in the balance sheet comprise cash at banks and on hand and short-term deposits with an original maturity of three months or less.
XXII. Dividend payment
A final dividend, including tax thereon, on equity shares is recorded as a liability on the date of approval by the shareholders. An interim dividend, including tax thereon, is recorded as a liability on the date of declaration by the Board of directors.
XXIII. Treasury shares
The Group has formed Gravita Employee Welfare Trust, for administration of Stock Appreciation Rights Scheme 2017 of the Group. The Trust bought shares of the Holding Company from the market, for giving shares to employees. The Group treats Trust as its extension and shares held by Trust are treated as treasury shares. Own equity instruments (“treasury shares”) which are reacquired through Gravita Employee Welfare Trust are recognized at cost and deducted from equity. No gain or loss is recognized in the Consolidated Statement of Profit and Loss on the purchase, sale, issue or cancellation of the Group own equity instruments.
XXIV. Segment reporting
Operating segments are reported in a manner consistent with the internal reporting provided to the chief operating decision maker.
Identification of segments:
In accordance with Ind AS 108 – Operating Segment, the operating segments used to present segment information are identified on the basis of information reviewed by the Group’s management to allocate resources to the segments and assess their performance. An operating segment is a component of the Group that engages in business activities from which it earns revenues and incurs expenses, including revenues and expenses that relate to transactions with any of the Group’s other components. Results of the operating segments are reviewed regularly by the Board of Directors which has been identified as the chief operating decision maker (CODM), to make decisions about resources to be allocated to the segment and assess its performance and for which discrete financial information is available.

182
Corporate Overview Statutory Reports Financial Statements
Summary of the significant accounting policies and other explanatory information (Contd.)For the year ended March 31, 2020
Allocation of common costs:
Common allocable costs are allocated to each segment accordingly to the relative contribution of each segment to the total common costs.
Unallocated items:
Revenue, expenses, assets and liabilities which relate to the Group as a whole and are not allocable to segments on reasonable basis have been included under unallocated revenue / expenses / assets / liabilities.
Segment accounting policies
The Group prepares its segment information in conformity with the accounting policies adopted for preparing and presenting the financial statements of the Group as a whole.
XXV. Government grants
Income includes export and other recurring and non-recurring incentives from Government (referred as “incentives’). Government grants are assistance by government in the form of transfers of resources to an entity in return for past or future compliance with certain conditions relating to the operating activities of the entity. The Group is entitled to subsidies from government in respect of manufacturing units located in specified regions.
Government grants are recognised when there is a reasonable assurance that the Group will comply with the relevant conditions and the grant will be received.These are recognised in the Statement of Profit and Loss, either on a systematic basis when the Group recognises, as expenses, the related costs that the grants are intended to compensate or, immediately if the costs have already been incurred. Government grants related to assets are deferred and amortised over the useful life of the asset. Government grants related to income are presented as an offset against the related expenditure, and government grants that are awarded as incentives with no ongoing performance obligations to the Group are recognised as income in the period in which the grant is received.
XXVI. Use of estimates and judgement
The following are the critical judgments and the key estimates concerning the future that management has made in the process of applying the Group’s accounting policies and that may have the most significant effect on the amounts recognised in the financial Statements or that have a significant risk of causing a material adjustment to the carrying amounts of assets and liabilities within the next financial year.
a. Useful lives of depreciable/ amortisable assets: Management reviews its estimate of the useful lives of depreciable/amortisable assets at each reporting date, based on the expected utility of the assets. Uncertainties in these estimates relate to technical and economic obsolescence that may change the utility of assets.
b. Evaluation of indicators for impairment of assets: The evaluation of applicability of indicators of impairment of assets requires assessment of several external and internal factors which could result in deterioration of recoverable amount of the assets.
c. Recognition of Deferred tax assets and Minimum Alternate Tax assets: The extent to which deferred tax assets can be recognized is based on an assessment of the probability of the future taxable income against which the deferred tax assets can be utilized.
d. Allowance for expected credit loss: The allowance for expected credit loss reflects management’s estimate of losses inherent in its credit portfolio. This allowance is based on Group’s estimate of the losses to be incurred, which derives from past experience with similar receivables, current and historical past due amounts, dealer termination rates, write-offs and collections, the careful monitoring of portfolio credit quality and current and projected economic and market conditions. The Group has also taken into account estimates of possible effect from the pandemic relating to COVID-19. Should the present economic and financial situation persist or even worsen, there could be a further deterioration in the financial situation of the Group’s debtors compared to that already taken into consideration in calculating the allowances recognised in the financial statements.
e. Allowance for obsolete and slow-moving inventory: The allowance for obsolete and slow-moving inventory reflects management’s estimate of the expected loss in value and has been determined on the basis of past experience and historical and expected future trends in the used vehicle market. A worsening of the economic and financial situation could cause a further deterioration in conditions compared to that taken into consideration in calculating the allowances recognized in the financial statements

183
Annual Report2019-2020
f. Contingent liabilities: The Group is the subject of legal proceedings and tax issues covering a range of matters, which are pending in various jurisdictions. Due to the uncertainty inherent in such matters, it is difficult to predict the final outcome of such matters. The cases and claims against the Group often raise difficult and complex factual and legal issues, which are subject to many uncertainties, including but not limited to the facts and circumstances of each particular case and claim, the jurisdiction and the differences in applicable law. In the normal course of business management consults with legal counsel and certain other experts on matters related to litigation and taxes. The Group accrues a liability when it is determined that an adverse outcome is probable, and the amount of the loss can be reasonably estimated.
g. Provisions: At each balance sheet date basis the management judgment, changes in facts and legal aspects, the Group assesses the requirement of provisions against the outstanding contingent liabilities. However, the actual future outcome may be different from this judgement.
h. Leases: Ind AS 116 defines a lease term as the non-cancellable period for which the lessee has the right to use an underlying asset including optional periods, when an entity is reasonably certain to exercise an option to extend (or not to terminate) a lease. The Group considers all relevant facts and circumstances that create an economic incentive for the lessee to exercise the option when determining the lease term. The option to extend the lease term is included in the lease term, if it is reasonably certain that the lessee would exercise the option. The Group reassesses the option when significant events or changes in circumstances occur that are within the control of the lessee.
i. Defined benefit obligations (DBO): Management’s estimate of the DBO is based on a number of critical underlying assumptions such as standard rates of inflation, mortality, discount rate and anticipation of future salary increases. Variation in these assumptions may significantly impact the DBO amount and the annual defined benefit expenses.
XXVII. Standards issued but not yet effective
Ministry of Corporate Affairs (“MCA”) notifies new standard or amendments to the existing standards. There is no such notification which would have been applicable from April 1, 2020.
Summary of the significant accounting policies and other explanatory information (Contd.)For the year ended March 31, 2020

184
Corporate Overview Statutory Reports Financial Statements
(All
amou
nts
in `
lacs
, unl
ess
othe
rwis
e st
ated
)
Not
e 2
- Pro
pert
y, p
lant
and
equ
ipm
ent
Part
icul
ars
Fre
ehol
d la
nd
Bui
ldin
gs
Pla
nt a
nd
equi
pmen
t O
ffice
eq
uipm
ent
Com
pute
r and
ac
cess
orie
s F
urni
ture
and
fix
ture
s V
ehic
les
Tot
al
Gro
ss c
arry
ing
amou
ntA
s at
Apr
il 1,
201
899
4.87
3,
817.
68
5,48
8.74
40
6.63
1
08.1
2 1
28.9
2 95
9.46
11
,904
.42
Add
ition
s13
9.50
1,
940.
13
1,56
0.97
17
8.90
21
.61
89.
96
142.
73
4,07
3.80
D
ispo
sals
/ A
djus
tmen
ts-
(44.
19)
(148
.19)
(4.6
6)(2
.75)
(1.7
6)(4
0.22
) (2
41.7
7)Fo
reig
n cu
rren
cy tr
ansl
atio
n di
ffere
nces
(1.1
2)(6
.46)
1.2
7 (0
.45)
0.06
(0
.11)
(4.6
3) (1
1.44
)A
s at
Mar
ch 3
1, 2
019
1,13
3.25
5,
707.
16
6,90
2.79
58
0.42
1
27.0
4 2
17.0
1 1
,057
.34
15,7
25.0
1 A
dditi
ons
41.3
9 1,
839.
82
3,04
1.94
63
.95
8.71
6
9.87
1
2.29
5,
077.
97
Dis
posa
ls/
Adj
ustm
ents
(98.
48)
(88.
14)
(363
.28)
(8.6
4)(1
1.99
)(1
0.93
)(8
9.17
) (6
70.6
3)Fo
reig
n cu
rren
cy tr
ansl
atio
n di
ffere
nces
14.9
3 70
.48
207.
58
3.03
0.
93
1.5
6 1
4.27
31
2.78
A
s at
Mar
ch 3
1, 2
020
1,09
1.09
7,
529.
32
9,78
9.03
63
8.76
1
24.6
9 2
77.5
1 99
4.73
20
,445
.13
Acc
umul
ated
dep
reci
atio
nA
s at
Apr
il 1,
201
8-
196.
91
643.
28
57.6
4 49
.54
23.
06
166.
68
1,13
7.11
C
harg
e fo
r the
yea
r-
176.
09
671.
98
62.1
1 30
.67
18.
73
165.
00
1,12
4.58
D
ispo
sals
/ A
djus
tmen
ts-
(3.5
7)(4
7.37
) (0
.95)
(2.1
6) (0
.95)
(26.
89)
(81.
89)
Fore
ign
curr
ency
tran
slat
ion
diffe
renc
es-
(1.6
3)(8
.77)
(0.1
9)(0
.01)
(0.1
0)(2
.20)
(12.
90)
As
at M
arch
31,
201
9-
367.
80
1,25
9.12
11
8.61
78
.04
40.
74
302.
59
2,16
6.90
C
harg
e fo
r the
yea
r-
263.
74
974.
26
81.9
8 23
.99
28.
88
147.
60
1,52
0.45
D
ispo
sals
/ A
djus
tmen
ts-
(14.
27)
(150
.07)
(4.5
5)(9
.44)
(3.9
9)(3
7.97
) (2
20.2
9)Fo
reig
n cu
rren
cy tr
ansl
atio
n di
ffere
nces
-3.
47
102.
80
0.63
0.
35
0.3
3 5.
57
113.
15
As
at M
arch
31,
202
0-
620.
74
2,18
6.11
19
6.67
92
.94
65.
96
417.
79
3,58
0.21
N
et c
arry
ing
valu
eA
s at
Mar
ch 3
1, 2
019
1,13
3.25
5,
339.
36
5,64
3.67
46
1.81
49
.00
176
.27
754.
75
13,5
58.1
1 A
s at
Mar
ch 3
1, 2
020
1,09
1.09
6,
908.
58
7,60
2.92
44
2.09
31
.75
211
.55
576.
94
16,8
64.9
2
(i)
Refe
r not
e 16
for d
etai
ls o
f pro
pert
y pl
ant a
nd e
quip
men
t mor
tgag
ed a
s se
curit
y w
ith b
anks
/ fin
anci
al in
stitu
tions
.
(ii)
Refe
r not
e 35
for d
iscl
osur
e of
con
trac
tual
com
mitm
ents
for t
he a
cqui
sitio
n of
pro
pert
y, p
lant
and
equ
ipm
ent.
Sum
mar
y of
the
sign
ifica
nt a
ccou
ntin
g po
licie
s an
d ot
her e
xpla
nato
ry in
form
atio
n (C
ontd
.)Fo
r the
yea
r end
ed M
arch
31,
202
0
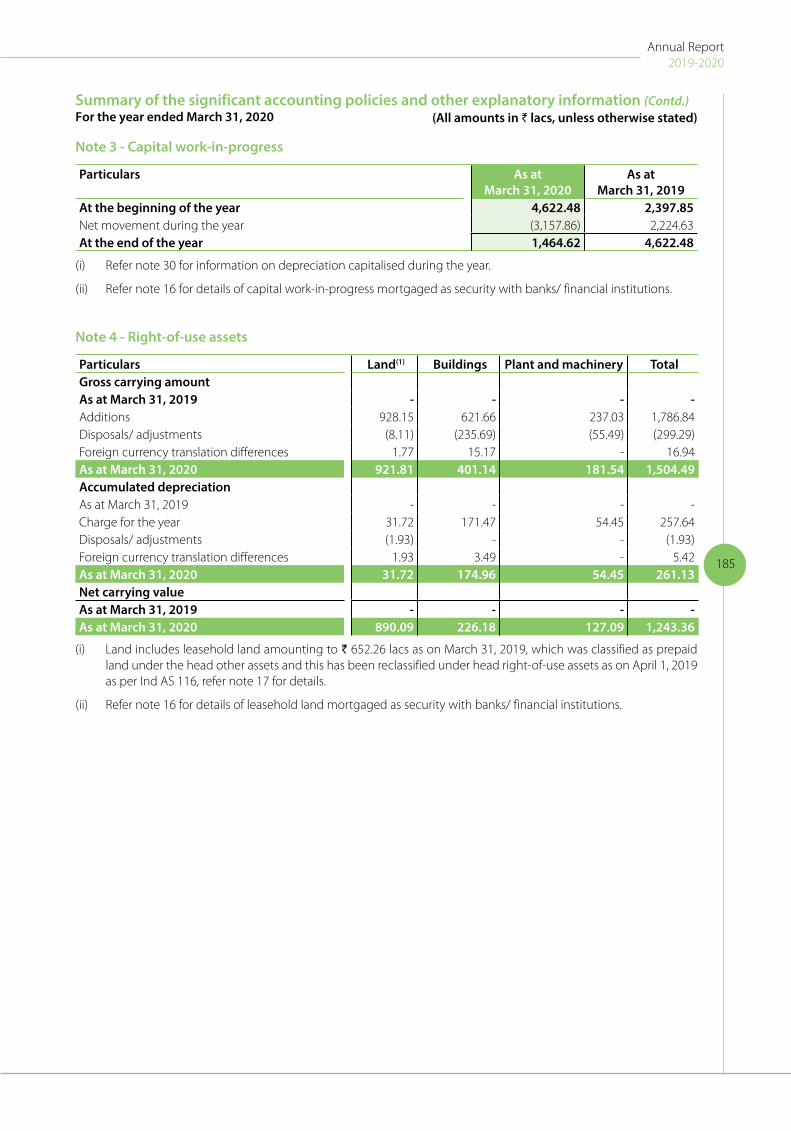
185
Annual Report2019-2020
Note 3 - Capital work-in-progress
Particulars As atMarch 31, 2020
As atMarch 31, 2019
At the beginning of the year 4,622.48 2,397.85Net movement during the year (3,157.86) 2,224.63At the end of the year 1,464.62 4,622.48
(i) Refer note 30 for information on depreciation capitalised during the year.
(ii) Refer note 16 for details of capital work-in-progress mortgaged as security with banks/ financial institutions.
Note 4 - Right-of-use assets
Particulars Land(1) Buildings Plant and machinery Total Gross carrying amountAs at March 31, 2019 - - - -Additions 928.15 621.66 237.03 1,786.84 Disposals/ adjustments (8.11) (235.69) (55.49) (299.29)Foreign currency translation differences 1.77 15.17 - 16.94 As at March 31, 2020 921.81 401.14 181.54 1,504.49 Accumulated depreciationAs at March 31, 2019 - - - -Charge for the year 31.72 171.47 54.45 257.64 Disposals/ adjustments (1.93) - - (1.93)Foreign currency translation differences 1.93 3.49 - 5.42 As at March 31, 2020 31.72 174.96 54.45 261.13 Net carrying valueAs at March 31, 2019 - - - -As at March 31, 2020 890.09 226.18 127.09 1,243.36
(i) Land includes leasehold land amounting to ` 652.26 lacs as on March 31, 2019, which was classified as prepaid land under the head other assets and this has been reclassified under head right-of-use assets as on April 1, 2019 as per Ind AS 116, refer note 17 for details.
(ii) Refer note 16 for details of leasehold land mortgaged as security with banks/ financial institutions.
Summary of the significant accounting policies and other explanatory information (Contd.)For the year ended March 31, 2020 (All amounts in ` lacs, unless otherwise stated)

186
Corporate Overview Statutory Reports Financial Statements
Note 5 - Other intangible assets
Particulars Computer Software
Total
Gross carrying amountAs at April 1, 2018 190.33 190.33 Additions 14.69 14.69 Disposals/ Adjustments (4.85) (4.85)Foreign currency translation differences (0.01) (0.01)As at March 31, 2019 200.16 200.16 Additions - -Disposals/ Adjustments - -Foreign currency translation differences (0.01) (0.01)As at March 31, 2020 200.15 200.15 Accumulated amortisationAs at April 1, 2018 66.46 66.46 Charge for the year 45.03 45.03 Disposals/ Adjustments (4.86) (4.86)Foreign currency translation differences (0.01) (0.01)As at March 31, 2019 106.62 106.62 Charge for the year 37.74 37.74 Disposals/ Adjustments - -Foreign currency translation differences 0.02 0.02 As at March 31, 2020 144.38 144.38 Net carrying valueAs at March 31, 2019 93.54 93.54 As at March 31, 2020 55.77 55.77
Note 6 - Non-current investments
Particulars As atMarch 31, 2020
As atMarch 31, 2019
Investment in associate (unquoted)In equity shares (at cost)Pearl Landcon Private LimitedShare of face value of `10 each (previous year: ` 10 each)
0.50 0.50
Profit share from associate accounted through equity method 0.81 1.77 Total 1.31 2.27
Investment in government securities (unquoted)National saving certificate 0.06 0.06
Total 0.06 0.06 Total non-current investments 1.37 2.33
Aggregate amount of unquoted investments 1.37 2.33
Note 7 - Loans
Particulars As at March 31, 2020
As at March 31, 2019
Non-current (unsecured)Security deposits 293.94 255.98
Total 293.94 255.98 Current, unsecured, considered goodSecurity deposits 27.79 92.17 Loans given 100.00 -
Total 127.79 92.17
(i) Refer note 16 for hypothecation as securities with bank/ financial institutions on current loans.
Summary of the significant accounting policies and other explanatory information (Contd.)For the year ended March 31, 2020 (All amounts in ` lacs, unless otherwise stated)

187
Annual Report2019-2020
Note 8 - Other financial assets
Particulars As at March 31, 2020
As at March 31, 2019
Non-currentDeposits with bank (with remaining maturity more than 12 months)(i) 1.26 1.26
Total 1.26 1.26 CurrentDerivatives designated at fair value through profit or loss
- For forward contracts# 1,263.72 442.66 Receivable for sale of investment (refer note 32) 185.00 -
Total 1,448.72 442.66
(i) Represents lien with banks and financial institution and are restricted from being exchanged or used to settle a liability.
(ii) Refer note 16 for hypothecation as securities with bank/ financial institutions on other current financial assets.
# Details of balance against derivative contracts
Particulars As at March 31, 2020
As at March 31, 2019
Margin money 1,870.25 323.20 Effect of mark-to-market on open contracts (606.53) 119.46
Total 1,263.72 442.66
Note 9 - Other assets
Particulars As at March 31, 2020
As at March 31, 2019
Unsecured, considered goodNon-currentCapital advances 23.97 327.05
Prepaid expenses 21.58 3.38
Prepaid lease (leasehold land) (refer note 17) - 640.56
Balance with government authorities 402.08 781.36
Total 447.63 1,752.35 Unsecured, considered goodCurrentAdvances to vendors 4,058.08 3,732.81
Advances to employees 85.71 136.53
Prepaid expenses 126.03 199.41
Prepaid lease (leasehold land) (refer note 17) - 11.70
Balance with government authorities 3,873.58 2,165.67
Total 8,143.40 6,246.12
(i) Refer note 16 for hypothecation as securities with bank/ financial institutions on other current assets.
Summary of the significant accounting policies and other explanatory information (Contd.)For the year ended March 31, 2020 (All amounts in ` lacs, unless otherwise stated)

188
Corporate Overview Statutory Reports Financial Statements
Note 10 - Inventories
(At lower of cost and net realisable value)
Particulars As at March 31, 2020
As at March 31, 2019
Raw materials 5,034.30 4,940.03
Raw materials - goods-in-transit 5,983.90 4,574.39
Work-in-progress 5,003.56 2,870.86
Finished goods (other than those acquired for trading) 2,783.79 2,468.65
Finished goods - goods-in-transit 1,989.43 2,136.33
Traded goods 167.56 93.86
Stores and spares 1,016.06 808.18
Consumables 457.38 368.77
Total 22,435.98 18,261.07
(i) Refer note 16 for hypothecation as securities with bank/ financial institutions on inventories.
Note 11 - Trade receivables
Particulars As at March 31, 2020
As at March 31, 2019
Unsecured -
Trade receivables - considered good 6,752.55 9,646.41
Trade receivables - credit impaired 373.16 138.49
Less: allowance for expected credit losses (373.16) (138.49)
Total 6,752.55 9,646.41
(i) Refer note 16 for hypothecation as securities with bank/ financial institutions on trade receivables
(ii) Transferred receivables: During current year, the Holding Company follows non-recourse factoring arrangement for domestic receivables. Under the arrangement, the Holding Company has transferred certain receivables to the factor in exchange for cash along with the credit risk. Correspondingly, no amount is shown as repayable under the factoring arrangement as at March 31, 2020.
During the previous year, the Holding Company had followed recourse factoring arrangement for domestic receivables. Under the arrangement, the Holding Company had transferred the relevant receivables to the factor in exchange for cash but had retained the credit risk. The Holding Company therefore had recognised the full carrying amount of the relevant receivables amounting to ` 1,803.92 lacs and the carrying amount of associated liabilities amounting to ` 1,803.92 lacs as at March 31, 2019.
Note 12 - Cash and cash equivalents
Particulars As at March 31, 2020
As at March 31, 2019
Balances with banks
- in current accounts 901.31 905.60
- in deposit accounts with original maturity upto 3 months 6.37 5.97
Cash on hand 76.65 46.92
Cheques on hand 82.70 269.93
Total 1,067.03 1,228.42
(i) Refer note 16 for hypothecation as securities with bank/ financial institutions on cash and cash equivalents
Summary of the significant accounting policies and other explanatory information (Contd.)For the year ended March 31, 2020 (All amounts in ` lacs, unless otherwise stated)
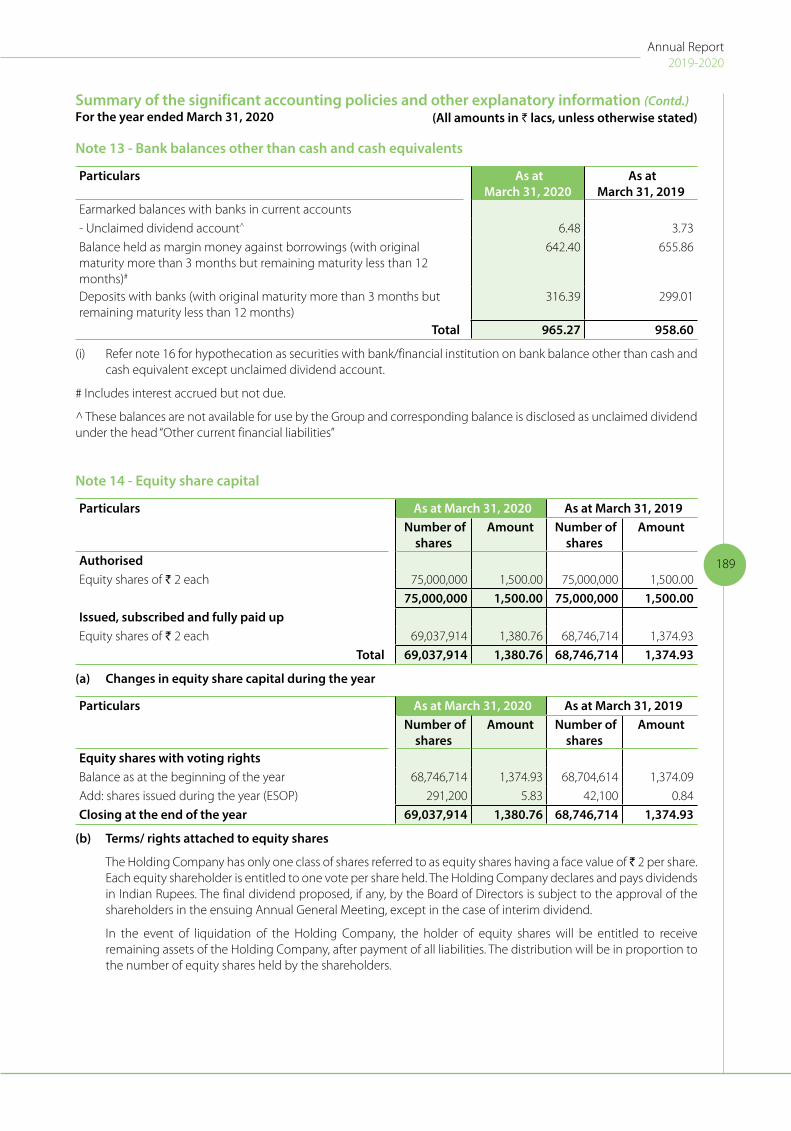
189
Annual Report2019-2020
Note 13 - Bank balances other than cash and cash equivalents
Particulars As at March 31, 2020
As at March 31, 2019
Earmarked balances with banks in current accounts
- Unclaimed dividend account^ 6.48 3.73
Balance held as margin money against borrowings (with original maturity more than 3 months but remaining maturity less than 12 months)#
642.40 655.86
Deposits with banks (with original maturity more than 3 months but remaining maturity less than 12 months)
316.39 299.01
Total 965.27 958.60
(i) Refer note 16 for hypothecation as securities with bank/financial institution on bank balance other than cash and cash equivalent except unclaimed dividend account.
# Includes interest accrued but not due.
^ These balances are not available for use by the Group and corresponding balance is disclosed as unclaimed dividend under the head “Other current financial liabilities”
Note 14 - Equity share capital
Particulars As at March 31, 2020 As at March 31, 2019 Number of
shares Amount Number of
shares Amount
AuthorisedEquity shares of ` 2 each 75,000,000 1,500.00 75,000,000 1,500.00
75,000,000 1,500.00 75,000,000 1,500.00 Issued, subscribed and fully paid upEquity shares of ` 2 each 69,037,914 1,380.76 68,746,714 1,374.93
Total 69,037,914 1,380.76 68,746,714 1,374.93
(a) Changes in equity share capital during the year
Particulars As at March 31, 2020 As at March 31, 2019 Number of
shares Amount Number of
shares Amount
Equity shares with voting rightsBalance as at the beginning of the year 68,746,714 1,374.93 68,704,614 1,374.09
Add: shares issued during the year (ESOP) 291,200 5.83 42,100 0.84
Closing at the end of the year 69,037,914 1,380.76 68,746,714 1,374.93
(b) Terms/ rights attached to equity shares
The Holding Company has only one class of shares referred to as equity shares having a face value of ̀ 2 per share. Each equity shareholder is entitled to one vote per share held. The Holding Company declares and pays dividends in Indian Rupees. The final dividend proposed, if any, by the Board of Directors is subject to the approval of the shareholders in the ensuing Annual General Meeting, except in the case of interim dividend.
In the event of liquidation of the Holding Company, the holder of equity shares will be entitled to receive remaining assets of the Holding Company, after payment of all liabilities. The distribution will be in proportion to the number of equity shares held by the shareholders.
Summary of the significant accounting policies and other explanatory information (Contd.)For the year ended March 31, 2020 (All amounts in ` lacs, unless otherwise stated)
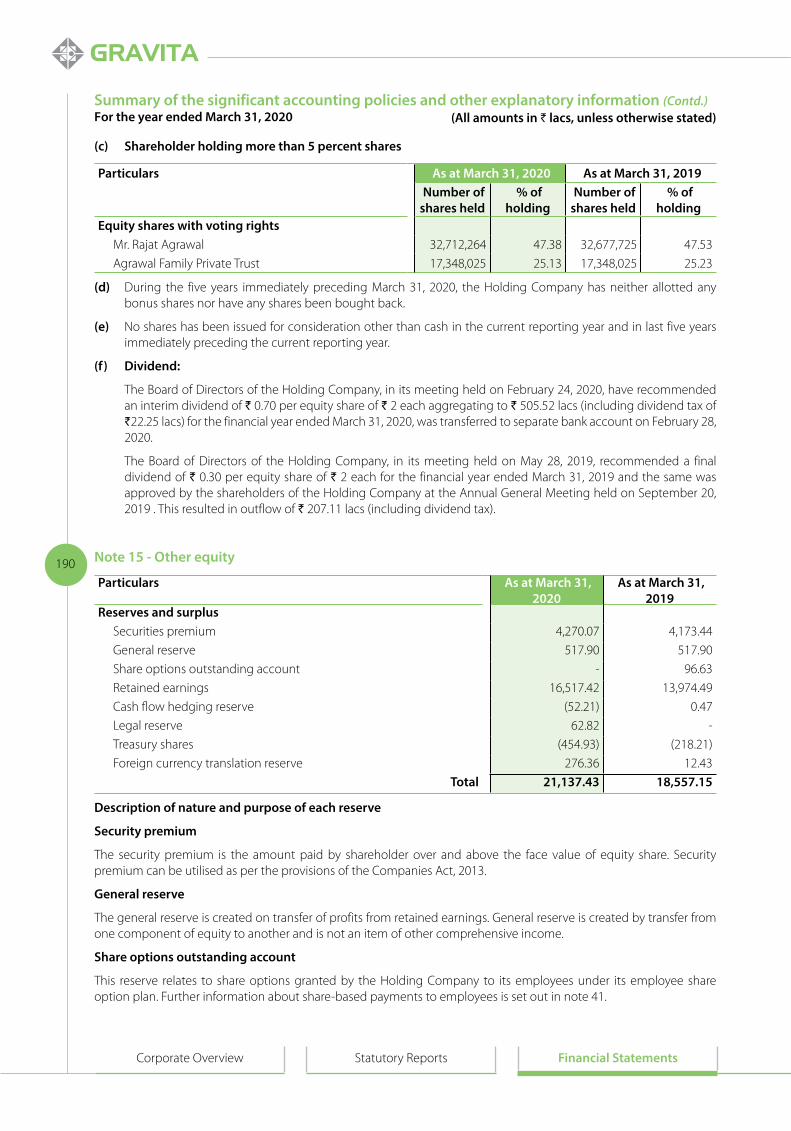
190
Corporate Overview Statutory Reports Financial Statements
(c) Shareholder holding more than 5 percent shares
Particulars As at March 31, 2020 As at March 31, 2019 Number of shares held
% of holding
Number of shares held
% of holding
Equity shares with voting rightsMr. Rajat Agrawal 32,712,264 47.38 32,677,725 47.53
Agrawal Family Private Trust 17,348,025 25.13 17,348,025 25.23
(d) During the five years immediately preceding March 31, 2020, the Holding Company has neither allotted any bonus shares nor have any shares been bought back.
(e) No shares has been issued for consideration other than cash in the current reporting year and in last five years immediately preceding the current reporting year.
(f) Dividend:
The Board of Directors of the Holding Company, in its meeting held on February 24, 2020, have recommended an interim dividend of ` 0.70 per equity share of ` 2 each aggregating to ` 505.52 lacs (including dividend tax of `22.25 lacs) for the financial year ended March 31, 2020, was transferred to separate bank account on February 28, 2020.
The Board of Directors of the Holding Company, in its meeting held on May 28, 2019, recommended a final dividend of ` 0.30 per equity share of ` 2 each for the financial year ended March 31, 2019 and the same was approved by the shareholders of the Holding Company at the Annual General Meeting held on September 20, 2019 . This resulted in outflow of ` 207.11 lacs (including dividend tax).
Note 15 - Other equity
Particulars As at March 31, 2020
As at March 31, 2019
Reserves and surplusSecurities premium 4,270.07 4,173.44
General reserve 517.90 517.90
Share options outstanding account - 96.63
Retained earnings 16,517.42 13,974.49
Cash flow hedging reserve (52.21) 0.47
Legal reserve 62.82 -
Treasury shares (454.93) (218.21)
Foreign currency translation reserve 276.36 12.43
Total 21,137.43 18,557.15
Description of nature and purpose of each reserve
Security premium
The security premium is the amount paid by shareholder over and above the face value of equity share. Security premium can be utilised as per the provisions of the Companies Act, 2013.
General reserve
The general reserve is created on transfer of profits from retained earnings. General reserve is created by transfer from one component of equity to another and is not an item of other comprehensive income.
Share options outstanding account
This reserve relates to share options granted by the Holding Company to its employees under its employee share option plan. Further information about share-based payments to employees is set out in note 41.
Summary of the significant accounting policies and other explanatory information (Contd.)For the year ended March 31, 2020 (All amounts in ` lacs, unless otherwise stated)

191
Annual Report2019-2020
Retained earnings
Retained earnings represents surplus in Statement of Profit and Loss.
Cash flow hedging reserve
The cash flow hedging reserve represents the cumulative effective portion of gains or losses arising on changes in fair value of designated portion of hedging instruments entered into for cash flow hedges. Such gains or losses will be reclassified to Statement of Profit and Loss in the period in which the hedged transaction occurs.
Foreign currency translation reserve
The Group recognises exchange differences arising on translation of the foreign operations in other comprehensive income and accumulated in foreign currency translation reserve in other equity. Exchange differences previously accumulated in foreign currency translation reserve in respect of foreign operations are reclassified to Statement of Profit and Loss on disposal of foreign operation.
Treasury shares
Treasury shares represent Holding Company’s own equity shares held by the Gravita Employee Welfare Trust [a trust set up for administration of Stock Appreciation Rights Scheme 2017 of the Holding Company].
Legal reserve
Gravita Mozambique LDA shall create a legal reserve from the profits of the accounting period, which is a part not less than twenty percent and it shall not be less than one fifth of the capital stock.
Note 16 - Borrowings(1)
Particulars As at March 31, 2020
As at March 31, 2019
Non-current borrowings(2)
SecuredTerm loans
- from bank 4,803.16 3,726.34 - from institutions other than banks 1,271.73 -
Vehicle loans 83.38 229.65 Less: Loan processing fees (131.80) (98.45)
6,026.47 3,857.54 Less: Current maturities disclosed under other financial liabilities (refer note 21)
1,736.20 1,011.79
Total 4,290.27 2,845.75 Current borrowingsLoans repayable on demandFrom banks (secured)Cash credit / overdraft 11,906.60 10,092.81 Packing credit 2,110.71 5,764.79 Buyers credit 1,480.20 -Payable recognised on account of factoring with recourse for receivables (Refer note (3)(i)(d) below)
- 1,803.92
Suppliers credit - 1,511.36 Working capital demand loan 5,631.45 1,997.13 Other loans (unsecured)From institutions other than banks 100.00 -
Total 21,228.96 21,170.01
1. There is no default in repayment of principal repayment or interest thereon.
Summary of the significant accounting policies and other explanatory information (Contd.)For the year ended March 31, 2020 (All amounts in ` lacs, unless otherwise stated)
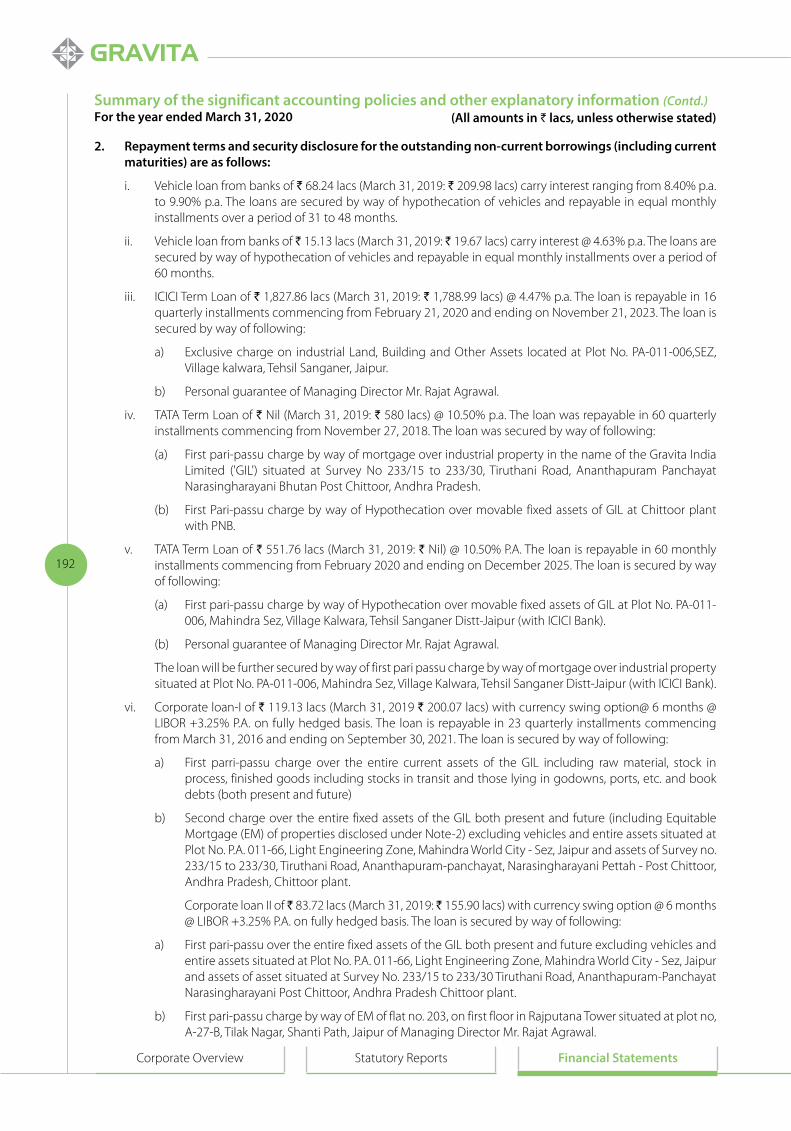
192
Corporate Overview Statutory Reports Financial Statements
2. Repayment terms and security disclosure for the outstanding non-current borrowings (including current maturities) are as follows:
i. Vehicle loan from banks of ` 68.24 lacs (March 31, 2019: ` 209.98 lacs) carry interest ranging from 8.40% p.a. to 9.90% p.a. The loans are secured by way of hypothecation of vehicles and repayable in equal monthly installments over a period of 31 to 48 months.
ii. Vehicle loan from banks of ` 15.13 lacs (March 31, 2019: ` 19.67 lacs) carry interest @ 4.63% p.a. The loans are secured by way of hypothecation of vehicles and repayable in equal monthly installments over a period of 60 months.
iii. ICICI Term Loan of ` 1,827.86 lacs (March 31, 2019: ` 1,788.99 lacs) @ 4.47% p.a. The loan is repayable in 16 quarterly installments commencing from February 21, 2020 and ending on November 21, 2023. The loan is secured by way of following:
a) Exclusive charge on industrial Land, Building and Other Assets located at Plot No. PA-011-006,SEZ, Village kalwara, Tehsil Sanganer, Jaipur.
b) Personal guarantee of Managing Director Mr. Rajat Agrawal.
iv. TATA Term Loan of ` Nil (March 31, 2019: ` 580 lacs) @ 10.50% p.a. The loan was repayable in 60 quarterly installments commencing from November 27, 2018. The loan was secured by way of following:
(a) First pari-passu charge by way of mortgage over industrial property in the name of the Gravita India Limited ('GIL') situated at Survey No 233/15 to 233/30, Tiruthani Road, Ananthapuram Panchayat Narasingharayani Bhutan Post Chittoor, Andhra Pradesh.
(b) First Pari-passu charge by way of Hypothecation over movable fixed assets of GIL at Chittoor plant with PNB.
v. TATA Term Loan of ` 551.76 lacs (March 31, 2019: ` Nil) @ 10.50% P.A. The loan is repayable in 60 monthly installments commencing from February 2020 and ending on December 2025. The loan is secured by way of following:
(a) First pari-passu charge by way of Hypothecation over movable fixed assets of GIL at Plot No. PA-011-006, Mahindra Sez, Village Kalwara, Tehsil Sanganer Distt-Jaipur (with ICICI Bank).
(b) Personal guarantee of Managing Director Mr. Rajat Agrawal.
The loan will be further secured by way of first pari passu charge by way of mortgage over industrial property situated at Plot No. PA-011-006, Mahindra Sez, Village Kalwara, Tehsil Sanganer Distt-Jaipur (with ICICI Bank).
vi. Corporate loan-I of ` 119.13 lacs (March 31, 2019 ` 200.07 lacs) with currency swing option@ 6 months @ LIBOR +3.25% P.A. on fully hedged basis. The loan is repayable in 23 quarterly installments commencing from March 31, 2016 and ending on September 30, 2021. The loan is secured by way of following:
a) First parri-passu charge over the entire current assets of the GIL including raw material, stock in process, finished goods including stocks in transit and those lying in godowns, ports, etc. and book debts (both present and future)
b) Second charge over the entire fixed assets of the GIL both present and future (including Equitable Mortgage (EM) of properties disclosed under Note-2) excluding vehicles and entire assets situated at Plot No. P.A. 011-66, Light Engineering Zone, Mahindra World City - Sez, Jaipur and assets of Survey no. 233/15 to 233/30, Tiruthani Road, Ananthapuram-panchayat, Narasingharayani Pettah - Post Chittoor, Andhra Pradesh, Chittoor plant.
Corporate loan II of ̀ 83.72 lacs (March 31, 2019: ̀ 155.90 lacs) with currency swing option @ 6 months @ LIBOR +3.25% P.A. on fully hedged basis. The loan is secured by way of following:
a) First pari-passu over the entire fixed assets of the GIL both present and future excluding vehicles and entire assets situated at Plot No. P.A. 011-66, Light Engineering Zone, Mahindra World City - Sez, Jaipur and assets of asset situated at Survey No. 233/15 to 233/30 Tiruthani Road, Ananthapuram-Panchayat Narasingharayani Post Chittoor, Andhra Pradesh Chittoor plant.
b) First pari-passu charge by way of EM of flat no. 203, on first floor in Rajputana Tower situated at plot no, A-27-B, Tilak Nagar, Shanti Path, Jaipur of Managing Director Mr. Rajat Agrawal.
Summary of the significant accounting policies and other explanatory information (Contd.)For the year ended March 31, 2020 (All amounts in ` lacs, unless otherwise stated)

193
Annual Report2019-2020
c) First pari-passu charge by way of EM of land and house HIG, SFS Block 3, plot no 90, HIG, Mansarovar, Jaipur of Gravita Impex Private Limited (Related Party).
d) Second charge over the entire current assets of the GIL including raw material, stock in process, finished goods including stocks in transit and those lying in godowns, ports, etc. and book debts (both present and future)
vii. PNB Term Loan of ` 789.71 lacs (March 31, 2019: ` 1,001.38 lacs) @ 9.45% P.A. The loan is repayable in 22 quarterly installments commencing from October 1, 2017 and ending on January 1, 2023. The loan is secured by way of following:
(a) First pari-passu charge on the entire block assets present and future of the Chittoor project.
(b) Second pari-passu charge on following Immovable Properties:
Land and Building at Jaychand Ka Bas Harsulia Mod Diggi Malpura Road, Phagi, Jaipur Kasara no. 209/1/5/3, 209/1/4/1, 209/1/5/1 and 209/1/5/2.
Flat no. 203, 302, 401 and 403 located in Rajputana Tower situated at plot no , A-27-B, Tilak Nagar, Shanti Path, Jaipur
(c) Residential Land & H No. 3/90, Mansarovar, Jaipur
(d) Personal guarantee of Managing Director Mr. Rajat Agrawal.
(e) Corporate guarantee of M/s Gravita Impex Private Limited (Related Party)
viii. Bandhan Bank Term Loan of ` 982.72 lacs (March 31, 2019: ` Nil) @ 10.50% P.A. The loan is repayable in 48 monthly installments commencing from March 2020 and ending on Feb 2024. The loan is secured by way of following:
(a) First pari-passu charge by way of Hypothecation over movable fixed assets of GIL at Chittoor Plant situated at Survey No. 233/15 to 233/30 Tiruthani Road, Ananthapuram-Panchayat Narasingharayani Post Chittoor, Andhra Pradesh with Punjab National Bank.
(b) Personal guarantee of Managing Director Mr. Rajat Agrawal.
The loan will be further secured by way of first pari passu charge by way of euqitable mortgage over industrial property in the name of the GIL situated at Survey No. 233/15 to 233/30 Tiruthani Road, Ananthapuram-Panchayat Narasingharayani Post Chittoor, Andhra Pradesh with Punjab National Bank.
ix. Bandhan Bank Term Loan of `1,000 lacs (March 31, 2019: ` Nil) @ 10.50% P.A.The loan is repayable in 48 monthly installments commencing from May 2020 and ending on Mar 2024. The loan is secured by way of following:
(a) First pari-passu charge by way of Hypothecation over movable fixed assets of GIL at Chittoor Plant situated at Survey No. 233/15 to 233/30 Tiruthani Road, Ananthapuram-Panchayat Narasingharayani Post Chittoor, Andhra Pradesh with Punjab National Bank.
(b) Personal guarantee of Managing Director Mr. Rajat Agrawal.
The loan will be further secured by way of first pari passu charge by way of equitable mortgage over industrial property in the name of the GIL situated at Survey No. 233/15 to 233/30 Tiruthani Road, Ananthapuram-Panchayat Narasingharayani Post Chittoor, Andhra Pradesh with Punjab National Bank.
x. Bajaj Term Loan of ` 720.00 lacs (March 31, 2019: ` Nil) @ 10% P.A. The loan is repayable in 60 monthly installments commencing from October 2019 and ending on September 2024. The loan is secured by way of following:
(a) First Pari passu charge over movable fixed assets of the GIL (both present and future) excluding the assets situated at Chittor and SEZ unit.
(b) First Pari passu charge over entire current assets of the GIL.
(c) Personal guarantee of Managing Director Mr. Rajat Agrawal.
Summary of the significant accounting policies and other explanatory information (Contd.)For the year ended March 31, 2020 (All amounts in ` lacs, unless otherwise stated)

194
Corporate Overview Statutory Reports Financial Statements
The loan will be further secured by way of following:
(a) First pari-passu charge over land and building of the GIL situated at Phagi Jaipur.
(b) First pari-passu charge by way of mortgage over Flat No. 302, 403, 401 in Rajputana Tower situated at plot no. A27B, Shanti Path, Tilak Nagar Jaipur in the name of the GIL.
(c) First pari-passu charge by way of mortgage over Flat No. 203 in Rajputana Tower situated at plot no. A27B, Shanti Path, Tilak Nagar Jaipur in the name of Mr. Rajat Agrawal.
(d) First pari-passu charge by way of mortgage over land & house HIG, SFS block 3, plot 90, Mansarovar, Jaipur of Gravita Impex Private Limited
(e) Corporate guarantee of M/s Gravita Impex Private Limited (only for Term Loan and PBD Limits).
3. Security disclosure for the outstanding current borrowings are as follows:
i. Loans repayable on demand from banks are secured by way of:
(a) First pari-passu charge over the entire current assets of the GIL including raw material, stock in process, finished goods including stocks in transit and those lying in godowns, ports, etc and book debts (both present and future).
(b) Hypothecation of receivables and all kind of stocks of raw material, semi finished goods, finished goods consumables including stocks in transit in the name of M/s Gravita Metal Inc ('GMI')
(c) First pari-passu charge on the entire fixed assets of the GIL both present and future, excluding vehicles and entire assets situated at Plot No. P.A. 011-006, Light Engineering Zone, Mahindra World City - Sez, Jaipur and assets of Survey no. 233/15 to 233/30, Tiruthani Road, Ananthapuram-panchayat, Narasingharayani Pettah - Post Chittoor, Andhra Pradesh, but including the following:
(i) Flat no. 302, 401, 403 in Gravita Tower, A-27-B, Tilak Nagar, Shanti Path, Jaipur.
(ii) Land and building at Jai Chand ka Bas, Diggi Malpura Road, Phagi, Jaipur.
(d) First pari-passu charge on the following other assets:
(i) Land and house at 3/90, HIG, Mansarovar, Jaipur of Gravita Impex Private Limited (related party).
(ii) Flat no. 203 in Gravita Tower, A-27-B, Tilak Nagar, Shanti Path, Jaipur of Managing Director Mr. Rajat Agrawal.
(e) Charge over certain of the GIL's trade receivables [refer note 11(ii)].
(f ) Personal guarantee of Managing Director Mr. Rajat Agrawal.
(g) Corporate guarantee of M/s Gravita Impex Private Limited (related party).
(h) Second pari passu charge on the fixed assets of Chittoor Plant.
(i) Corporate guarantee of M/s Noble Buildestate Private Limited (related party).
(j) Land and building situated at B-11A, Malviya Industrial area, Jaipur of Noble Buildestate Private Limited.
(k) Mortgage of Lease hold rights of factory land measuring 2.50 kanals, bearing plot no. 25 & 26, situated at SICOP, Industrial Area, Kathua (J&K) in the name of GMI
(l) Hypothecation of Plant and Machinery and other fixed assets of the GMI (present & future) situated at SICOP, Industrial Area, Kathua (J&K)
(m) Mortgage of Flat along with Furniture Fixtures bearing No. 102, Rajputana Tower A27B Shanti Path Tilak Nagar Jaipur standing in the name of Gravita Infotech Limited
(n) Primary Mortgage over stock in trade, book debts, leasehold land, immovable plant and machinery situated at Plot No.27 A, Mirigama EPZ, Mirigama, Sri Lanka
Summary of the significant accounting policies and other explanatory information (Contd.)For the year ended March 31, 2020 (All amounts in ` lacs, unless otherwise stated)

195
Annual Report2019-2020
4. Collateral:
Inventory, trade receivables, other current assets, other current financial assets, property, plant and equipment, capital work-in-progress with a net carrying amount of ` 43,659 lacs and ` 43,257 lacs are given as collateral/ security against the borrowings as at March 31, 2020 and March 31, 2019, respectively.
Note 17 - Lease liabilities
Particulars As at March 31, 2020
As at March 31, 2019
Non-current 454.01 -
Current 221.32 -
Total 675.33 -
i. Disclosures on lease pursuant to Ind AS 116 - Leases
The Group has leases for the factory lands, buildings, equipment, etc. Also, the Group has a leasehold land at Jaipur and Sri Lanka. Initial land premium of ` 652.26 lacs has been paid by the Group which is amortised over the period of lease. Unamortised amount of upfront premium paid was classified as prepaid land under the head “Other assets” as on March 31, 2019.
Each lease generally imposes a restriction that, unless there is a contractual right for the Group to sublet the asset to another party, the right-of-use asset can only be used by the Group. Leases contain an option to extend the lease for a further term after mutual consent of both the parties. The Group is prohibited from selling or pledging the underlying leased assets as security against the Group’s other debts and liabilities.
The table below describes the nature of the Group’s leasing activities by type of right-of-use asset recognised on balance sheet:
Right-of-use asset Number of RoU assets
leased
Range of remaining
term (in years)
Number of leases with extension
options
Number of leases with termination
optionsLand 7 8.86-85.44 - -
Plant and machinery 11 1.92-3.42 - -
Building 10 0.25-2.17 - -
ii. Adoption of Ind AS 116 ‘Leases’
Ind AS 116 ‘Leases’ replaces Ind AS 17 ‘Leases’ along with three Interpretations (Appendix A ‘Operating Leases-Incentives’, Appendix B ‘Evaluating the Substance of Transactions Involving the Legal Form of a Lease’ and Appendix C ‘Determining whether an Arrangement contains a Lease’).
The adoption of this new Standard has resulted in the Group recognising a right-of-use asset and related lease liability in connection with all former operating leases except for those identified as low-value or having a remaining lease term of less than 12 months from the date of initial application.
The new Standard has been applied using the modified retrospective approach, with the cumulative effect of adopting Ind AS 116 being recognised in equity as an adjustment to the opening balance of retained earnings for the current period. Prior periods have not been restated.
On transition, for leases previously accounted for as operating leases with a remaining lease term of less than 12 months and for leases of low-value assets the Group has applied the optional exemptions to not recognise right-of-use assets but to account for the lease expense on a straight-line basis over the remaining lease term.
On transition to Ind AS 116 the weighted average incremental borrowing rate applied to lease liabilities recognised under Ind AS 116 was 10%.
Summary of the significant accounting policies and other explanatory information (Contd.)For the year ended March 31, 2020 (All amounts in ` lacs, unless otherwise stated)

196
Corporate Overview Statutory Reports Financial Statements
The following is a reconciliation of the financial statement line items from Ind AS 17 to Ind AS 116 at April 01, 2019:
Particulars Carrying amount at
March 31, 2019
Re-classification
Adjustment upon transition
to Ind AS 116
Ind AS 116 carrying amount at April 01, 2019
Right-of-use assets - 652.26 1,127.31 1,779.57 Lease liabilities - - (1,189.03) (1,189.03)
Other non-current assets 1,752.35 (640.56) - 1,111.79
Other current assets 6,246.12 (11.70) - 6,234.42
Retained earnings - - 61.72 61.72
Total 7,998.47 - - 7,998.47
iii. Lease payments not recognised as a liability
The Group has elected not to recognise a lease liability for short term leases (leases with an expected term of 12 months or less) or for leases of low value assets. Payments made under such leases are expensed on a straight-line basis. The Group does not have any liability to make variable lease payments for the right to use the underlying asset recognised in the Financial statement. The expense relating to payments not included in the measurement of the lease liability for short term leases is `376.13 lacs.
Total cash outflow for leases for the year ended March 31, 2020 was ` 694.20 lacs
iv. The following is a reconciliation of total operating lease commitments at March 31, 2019 (as disclosed in the financial statements for the year ended March 31, 2019) to the lease liabilities recognised at April 01, 2019:
Particulars AmountTotal operating lease commitments disclosed at March 31, 2019 291.78Recognition exemptions:
- Leases of low value assets
Leases with remaining lease term of less than 12 months (7.23)
- Reasonably certain extension options taken
Leases considered cancellable under Ind AS 17 1,348.31
Operating lease liabilities before discounting 1,632.86 Discounted using incremental borrowing rate (443.83)
Total lease liabilities recognised under Ind AS 116 at April 01, 2019 1189.03
v. Disclosures under Ind AS 17 for the year ended March 31, 2019:
Operating leases - Assets taken on lease
Particulars As at March 31, 2019
Not later than one year 170.14
Later than one year but not more than 5 years 121.64
Later than 5 years -
Total 291.78
Total lease rent charged to the Statement of Profit and Loss for the year ended March 31, 2019 was ` 588.42 lacs.
vi. Refer note 40 (C.2) (b) for contractual maturity of lease liabilities.
Summary of the significant accounting policies and other explanatory information (Contd.)For the year ended March 31, 2020 (All amounts in ` lacs, unless otherwise stated)

197
Annual Report2019-2020
Note 18 - Provisions
Particulars As at March 31, 2020
As at March 31, 2019
Non-current provisions for- Gratuity (refer note 43) 251.08 203.45
- Compensated absences (refer note 43) 76.69 60.95
- Other employee benefits 78.11 42.47
Total 405.88 306.87 Current provisions for- Gratuity (refer note 43) 35.60 32.05
- Compensated absences (refer note 43) 4.88 3.88
- Other employee benefits 2.27 2.06
Total 42.75 37.99
Note 19 - Deferred tax liabilities (net)
Particulars As at March 31, 2020
As at March 31, 2019
Deferred tax liability arising on account of:Property, plant and equipment and other intangible assets 846.83 746.85
Incentive income 63.45 -
Foreign currency translation reserve 242.39 99.19
Cash flow hedge reserve - 0.26
Others 24.81 8.32
Gross deferred tax liabilities 1,177.48 854.62 Deferred tax asset arising on account of:Provision for employee benefits and other liabilities deductible on actual payment
153.97 125.06
Allowances for expected credit losses 193.84 75.01
RoU assets and lease liabilities 9.16 -
Cash flow hedge reserve 28.03 -
Unrealised gain on unsold stock 124.80 17.87
Gross deferred tax assets 509.80 217.94 Minimum alternate tax (MAT) credit entitlement 406.20 406.20 Deferred tax liabilities (net) (including MAT credit entitlement) 261.48 230.48
The Holding Company has tax losses amounting to ` 381.86 lacs (March 31, 2019: Nil), on which no deferred tax asset has been recognised considering there is no probability which demonstrates realisation of deferred tax asset in the near future. Further, the Holding Company has not recognised additional minimum alternate tax (MAT) credit entitlement in current financial year considering there is no probability which demonstrates realisation, considering the exemption available under section 80-IA of Income tax Act, 1961.
Also, no deferred tax asset has been recognised on tax losses of ` 87.77 lacs (March 31, 2019: ` 113.64 lacs), pertaining to the Indian subsidiaries of the Group, considering there is no probability which demonstrates realisation of deferred tax asset in the near future.
Summary of the significant accounting policies and other explanatory information (Contd.)For the year ended March 31, 2020 (All amounts in ` lacs, unless otherwise stated)

198
Corporate Overview Statutory Reports Financial Statements
Deferred tax movements
Movement of net deferred tax assets and liabilities for the year ended March 31, 2020 is as follows:Particulars Opening
balance(Charge)/ credit in Statement of Profit and loss
(Charge)/ credit in other
comprehensive income
Closing balance
Provision for employee benefits and other liabilities deductible on actual payment
125.06 27.45 1.46 153.97
Allowances for expected credit losses 75.01 118.83 - 193.84 Property, plant and equipment and other intangible assets
(746.85) (99.98) - (846.83)
MAT credit entitlement 406.20 - - 406.20 RoU assets and lease liabilities - 9.16 - 9.16 Cash flow hedge reserve (0.26) - 28.29 28.03 Foreign currency translation reserve (99.19) - (143.20) (242.39)Unrealised gain on unsold stock 17.87 106.93 - 124.80 Incentive income - (63.45) - (63.45)Others (8.32) (16.49) - (24.81)
Total (230.48) 82.45 (113.45) (261.48)
Movement of net deferred tax assets and liabilities for the year ended March 31, 2019 is as follows:
Particulars Opening balance
(Charge)/ credit in Statement of Profit and loss
(Charge)/ credit in other
comprehensive income
Closing balance
Provision for employee benefits and other liabilities deductible on actual payment
86.22 37.73 1.11 125.06
Allowances for expected credit losses 27.61 47.40 - 75.01 Property, plant and equipment and other intangible assets
(574.45) (172.40) - (746.85)
MAT credit entitlement 352.09 54.11 - 406.20 Cash flow hedge reserve - - (0.26) (0.26)Foreign currency translation reserve (67.94) - (31.25) (99.19)Unrealised gain on unsold stock 30.52 (12.65) - 17.87 Others (2.74) (5.58) - (8.32)
Total (148.69) (51.39) (30.40) (230.48)
Note 20 - Trade payables
Particulars As at March 31, 2020
As at March 31, 2019
Total outstanding dues of micro and small enterprises(i) 146.12 77.75 Total outstanding dues of creditors other than micro and small enterprises(ii)
8,388.51 9,744.66
Total 8,534.63 9,822.41
(i) On the basis of confirmation obtained from suppliers who have registered themselves under the Micro, Small and Medium Enterprise Development Act, 2006 (MSMED Act, 2006) and based on the information available with the Group, dues disclosed as per the Micro, Small and Medium Enterprise Development Act, 2006 (‘MSMED Act, 2006’) at the year end are below, This has been relied upon by the auditors.
Summary of the significant accounting policies and other explanatory information (Contd.)For the year ended March 31, 2020 (All amounts in ` lacs, unless otherwise stated)
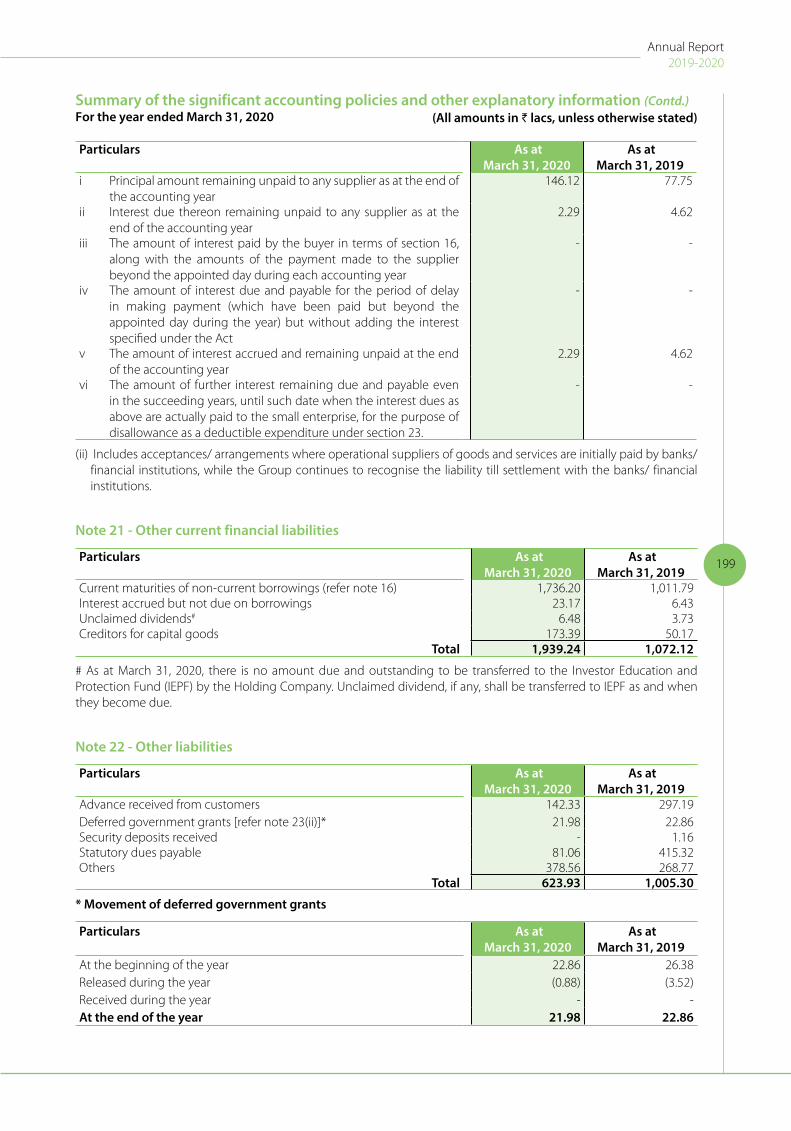
199
Annual Report2019-2020
Particulars As at March 31, 2020
As at March 31, 2019
i Principal amount remaining unpaid to any supplier as at the end of the accounting year
146.12 77.75
ii Interest due thereon remaining unpaid to any supplier as at the end of the accounting year
2.29 4.62
iii The amount of interest paid by the buyer in terms of section 16, along with the amounts of the payment made to the supplier beyond the appointed day during each accounting year
- -
iv The amount of interest due and payable for the period of delay in making payment (which have been paid but beyond the appointed day during the year) but without adding the interest specified under the Act
- -
v The amount of interest accrued and remaining unpaid at the end of the accounting year
2.29 4.62
vi The amount of further interest remaining due and payable even in the succeeding years, until such date when the interest dues as above are actually paid to the small enterprise, for the purpose of disallowance as a deductible expenditure under section 23.
- -
(ii) Includes acceptances/ arrangements where operational suppliers of goods and services are initially paid by banks/ financial institutions, while the Group continues to recognise the liability till settlement with the banks/ financial institutions.
Note 21 - Other current financial liabilities
Particulars As at March 31, 2020
As at March 31, 2019
Current maturities of non-current borrowings (refer note 16) 1,736.20 1,011.79 Interest accrued but not due on borrowings 23.17 6.43 Unclaimed dividends# 6.48 3.73 Creditors for capital goods 173.39 50.17
Total 1,939.24 1,072.12
# As at March 31, 2020, there is no amount due and outstanding to be transferred to the Investor Education and Protection Fund (IEPF) by the Holding Company. Unclaimed dividend, if any, shall be transferred to IEPF as and when they become due.
Note 22 - Other liabilities
Particulars As at March 31, 2020
As at March 31, 2019
Advance received from customers 142.33 297.19 Deferred government grants [refer note 23(ii)]* 21.98 22.86 Security deposits received - 1.16 Statutory dues payable 81.06 415.32 Others 378.56 268.77
Total 623.93 1,005.30
* Movement of deferred government grants
Particulars As at March 31, 2020
As at March 31, 2019
At the beginning of the year 22.86 26.38 Released during the year (0.88) (3.52)Received during the year - -At the end of the year 21.98 22.86
Summary of the significant accounting policies and other explanatory information (Contd.)For the year ended March 31, 2020 (All amounts in ` lacs, unless otherwise stated)

200
Corporate Overview Statutory Reports Financial Statements
Note 23 - Revenue from operations
Particulars For the year ended March 31, 2020
For the year ended March 31, 2019
Operating revenueSale of products
Manufactured goods 130,903.27 120,252.29 Traded goods 1,903.14 2,452.45
Sale of services 17.12 10.34 Other operating revenue
Export incentives 120.91 240.75 Government grant(ii) 1,760.67 1,129.21 Job work income 12.99 15.33 Scrap sales 61.93 72.46
Total 134,780.03 124,172.83
i. Disclosures on revenue pursuant to Ind AS 115 - Revenue from contracts with customers
(a) Disaggregate revenue information
The table below presents disaggregated revenues from contracts with customers for the year ended March 31, 2020 by Product type. The Group believes that this disaggregation best depicts how the nature, amount, timing and uncertainty of our revenues and cash flows are affected by industry, market and other economic factors.
Particulars For the year ended March 31, 2020
For the year ended March 31, 2019
Revenue by product type:Lead 118,149.50 104,335.39 Aluminium 8,039.99 11,268.41 Turnkey projects 882.35 1,663.75 Plastics 5,636.36 5,027.62 Others 98.21 409.57 Revenue from sale of services 17.12 10.34
Total 132,823.53 122,715.08 Revenue by time:
Revenue recognised at point in time 132,823.53 122,715.08 Total 132,823.53 122,715.08
(b) Revenue recognised in relation to contract liabilities
Ind AS 115 also requires disclosure of ‘revenue recognised in the reporting period that was included in the contract liability balance at the beginning of the period’ and ‘revenue recognised in the reporting period from performance obligations satisfied (or partially satisfied) in previous periods. Same has been disclosed as below:
Particulars For the year ended March 31, 2020
Revenue recognised in the reporting period that was included in the contract liability balance at the beginning of the year
297.19
(c) Liabilities related to contracts with customers
Particulars As at March 31, 2020
As at March 31, 2019
Advance from customers 142.33 297.19
Summary of the significant accounting policies and other explanatory information (Contd.)For the year ended March 31, 2020 (All amounts in ` lacs, unless otherwise stated)

201
Annual Report2019-2020
(d) Reconciliation of revenue recognised in Statement of Profit and Loss with contract price
Description For the year ended March 31, 2020
Contract price 133,205.31 Less: discount, rebates, credits etc. 381.78 Revenue from operations as per Statement of Profit and Loss 132,823.53
ii. The Holding Company’s manufacturing facility at Chittoor plant, is eligible for incentives available under “Industrial Development Policy 2015-2020”, notified by the Andhra Pradesh government. Under the scheme, the plant has been granted “Small Industry” status and eligible for incentives like, power cost reimbursement, Interest reimbursement, refund of sales tax/State Goods and services tax paid in cash, etc. Based on such policy, the Group has continued to recognise the incentive computed based on SGST paid to Government of Andhra Pradesh. Further, in terms of the Ind AS 20 - “Accounting for Government Grants and Disclosure of Government Assistance”, eligible incentive as mentioned above amounting to ` 1,569.28 lacs (Previous year: ` 929.28 lacs) for year ended March 31, 2020 is credited to Statement of Profit and Loss and included under the head “Other operating revenue” on accrual basis. Further, the Group is also entitled for capital grant of ̀ 26.38 lacs out of which ` 0.88 lacs (Previous year: ` 3.52 lacs) has been recognised as Amortisation of government grant under the head “Other income” and balance amount of ̀ 21.98 lacs (March 31, 2019: ̀ 22.86 lacs) has been recognised as Deferred government grants under head “Other current Liabilities”.
Further, one of the Group’s partnership firm, (Gravita Metal Inc.) has also recognised ` 191.39 lacs (Previous year: `199.93 lacs) as government grant during the year.
Note 24 - Other income
Particulars For the year ended March 31, 2020
For the year ended March 31, 2019
Interest income from:- bank deposits (at amortised cost) 61.31 46.61 - income tax refunds - 2.99 - others 7.21 17.11
Other non-operating incomeLiabilities/ provision no longer required written back 22.32 43.36 Miscellaneous income 7.70 7.23
Other gainsAmortisation of government grant [refer note 23 (ii)] 0.88 3.52 Derivatives measured at fair value through profit and loss- Gain on foreign currency forward contracts - 117.99 - Gain on commodity forward contracts - 306.18
Total 99.42 544.99
Note 25 - Cost of material consumed
Particulars For the year ended March 31, 2020
For the year ended March 31, 2019
Raw materials consumed 109,626.45 100,254.19 Total 109,626.45 100,254.19
Note 26 - Purchase of traded goods
Particulars For the year ended March 31, 2020
For the year ended March 31, 2019
Battery scrap and others 1,855.52 2,059.08 Total 1,855.52 2,059.08
Summary of the significant accounting policies and other explanatory information (Contd.)For the year ended March 31, 2020 (All amounts in ` lacs, unless otherwise stated)

202
Corporate Overview Statutory Reports Financial Statements
Note 27 - Changes in inventories of finished goods, work-in-progress and traded goods
Particulars For the year ended March 31, 2020
For the year ended March 31, 2019
Opening stockFinished goods* 4,604.98 4,378.54 Work-in-progress 2,870.86 4,273.07 Traded goods 93.86 149.18
Less: Closing stockFinished goods* 4,773.22 4,604.98 Work-in-progress 5,003.56 2,870.86 Traded goods 167.56 93.86
Change in inventory of finished goods, work-in-progress and traded goods
(2,374.64) 1,231.09
* inclusive of goods-in-transit
Note 28 - Employee benefits expense
Particulars For the year ended March 31, 2020
For the year ended March 31, 2019
Salaries, wages and bonus 5,989.78 5,556.66 Contribution to provident and other funds (refer note 43) 229.18 225.48 Share-based payments to employees - 40.48 Staff welfare expenses 473.26 524.78
Total 6,692.22 6,347.40
Note 29 - Finance cost
Particulars For the year ended March 31, 2020
For the year ended March 31, 2019
Interest costs on- Borrowings 2,314.07 1,973.51 - Lease liabilities 80.52 -- Others 3.44 0.32
Foreign exchange fluctuation to the extent regarded as an adjustment to borrowing costs
275.72 220.56
Other borrowing costs 143.48 105.60 Total 2,817.23 2,299.99
Note 30 - Depreciation and amortisation expense
Particulars For the year ended March 31, 2020
For the year ended March 31, 2019
Depreciation on property, plant and equipment 1,520.45 1,124.58 Amortisation of intangible assets 37.74 45.03 Depreciation of Right-of-use assets 257.64 -Less: Depreciation on property, plant and equipment capitalised during the year
3.29 13.12
Total 1,812.54 1,156.49
Summary of the significant accounting policies and other explanatory information (Contd.)For the year ended March 31, 2020 (All amounts in ` lacs, unless otherwise stated)

203
Annual Report2019-2020
Note 31 - Other expenses
Particulars For the year ended March 31, 2020
For the year ended March 31, 2019
Power and fuel 1,337.15 1,082.74 Rates and taxes 76.58 105.86 Legal and professional fees 321.17 332.98 Repairs and maintenance
- Plant and machinery 1,176.40 1,088.92 - Building 277.27 111.39 - Others 233.19 212.57
Freight and forwarding 2,149.06 2,194.95 Travelling and conveyance 544.99 488.80 Insurance 42.79 26.13 Rent 376.13 588.42 Lease prepayment amortisation - 11.99 Advertising and sales promotion 202.70 169.40 Payment to auditors(i) 58.75 49.51 Allowance for expected credit loss on financial assets (including write off )
264.17 65.95
Net loss on foreign currency transactions and translation 98.38 241.87 Loss on sale/ discard of property, plant and equipment 252.32 60.21 Expenditure on corporate social responsibility(ii) 109.57 18.82 Bank charges 326.03 315.94 Impairment loss(iii) - 474.54 Derivatives measured at fair value through profit or loss
- Loss on foreign currency forward contracts 24.79 -- Loss on commodity forward contracts 800.48 -
Miscellaneous expenses 561.23 769.18 Total 9,233.15 8,410.17
(i) Payment to auditors
Particulars For the year ended March 31, 2020
For the year ended March 31, 2019
As auditor- Audit fee 52.38 43.86 - Tax audit 0.40 0.40
In other capacity- Certification and other matters 1.90 1.30 - Reimbursement of out of pocket expenses 4.07 3.95
Total 58.75 49.51
(ii) Details of corporate social responsibility expenditure eligible under Companies Act, 2013
Particulars For the year ended March 31, 2020
For the year ended March 31, 2019
Amount required to be spent by the holding Company 59.76 44.27Amount spent during the year
- Construction or acquisition of any asset - -- On purposes other than above 109.57 18.82
(iii) During the pervious year, Group has entered into arrangement for sale of entire stake in one of its subsidiary (Met Mauritania Recycling - SARL) and consequent to such arrangement Group has recognised probable loss of `474.54 lacs.
Note 32 - Exceptional itemsThe exceptional item amounting to ` 522.94 lacs for the year ended March 31, 2020 represents loss on sale/ discard of investment in subsidiaries.
Summary of the significant accounting policies and other explanatory information (Contd.)For the year ended March 31, 2020 (All amounts in ` lacs, unless otherwise stated)

204
Corporate Overview Statutory Reports Financial Statements
Note 33 - Tax expenseParticulars For the year ended
March 31, 2020For the year ended
March 31, 2019Current taxCurrent tax expense 1,056.04 999.34 Taxes relating to earlier year 61.33 (31.61)
1,117.37 967.73 Deferred tax In respect of current year (82.45) 105.50 Minimum alternate tax credit (created) - (54.11)
(82.45) 51.39 Income tax recognised in Statement of Profit and Loss 1,034.92 1,019.12
The reconciliation of the estimated tax expense at statutory income tax rate to income tax expense reported in the statement of profit and loss is as follows:Accounting profit before tax 4,693.08 2,958.05 Statutory income tax rate 34.94% 34.94%Tax expense at statutory income tax rate 1,639.95 1,033.54
Tax effect of amounts which are not deductible/ (taxable) in calculating taxable income:Effect of income that is exempt from taxation (880.05) (104.03)Effect of expenses that are not deductible in determining taxable profit 171.87 9.14 Effect of different tax rates of subsidiaries operating in other jurisdictions
5.30 88.66
Movement in tax provision relating to prior years 61.33 (31.61)Others 36.52 23.42
Income tax expense recognised in Statement of Profit and Loss 1,034.92 1,019.12
Deferred tax has not been created on incentive income in Chittoor plant of the Holding Company, considering the same will be realised in the period of exemption available under section 80IA of Income tax Act, 1961.
Note 34 - Earning per share
Particulars For the year ended March 31, 2020
For the year ended March 31, 2019
Profit for the year attributable to equity shares (` in lacs) (A) 3,317.95 1,549.23 Total shares issued at the beginning of the year (in numbers) 68,746,714 68,704,614 Add:Weighted average number of shares issued during the year on account of exercise of employee stock option
270,514 39,216
Less:Weighted average number of shares reserved under 'Stock Appreciation Rights Scheme 2017' held by Gravita Employee Welfare Trust at the beginning of the year
200,000 70,400
Weighted average number of shares acquired during the year under 'Stock Appreciation Rights Scheme 2017' held by Gravita Employee Welfare Trust
24,417 49,205
Weighted-average number of equity shares for basic EPS (B) 68,792,811 68,624,225 Effect of dilution:Add: Weighted average number of potential dilutive equity shares on account of employee stock options outstanding
- 284,068
Weighted-average number of equity shares for diluted EPS (C) 68,792,811 68,908,293 Basic earnings per share (in `) (A/B) 4.82 2.26 Diluted earnings per share (in `) (A/C) 4.82 2.25
Summary of the significant accounting policies and other explanatory information (Contd.)For the year ended March 31, 2020 (All amounts in ` lacs, unless otherwise stated)

205
Annual Report2019-2020
Note 35 - Contingent liabilities and commitments
(a) Contingent liabilities
Particulars As at March 31, 2020
As at March 31, 2019
Claim against the company not acknowledged as debt*- Excise Duty/Customs Duty/Service Tax 538.75 339.11 - Value Added Tax/ Central Sales Tax/Entry Tax 1.87 111.90
Total 540.62 451.01
* All the matters above are subject to legal proceedings in the ordinary course of business. The management is confident that its position to be upheld in the appeals pending before various appeallate authorities and no liability could arise on the Group on account of these proceedings.
(b) Commitments
Particulars As at March 31, 2020
As at March 31, 2019
Estimated amount of contracts remaining to be executed on capital account and not provided for (net of capital advances)
126.67 141.88
Total 126.67 141.88
Note 36 - Capital Management
For the purpose of the Group’s capital management, capital includes issued capital and all other equity reserves attributable to the equity shareholders of the Group. The primary objective of the Group when managing capital is to safeguard its ability to continue as a going concern and to maintain an optimal capital structure so as to maximize shareholder value.
As at March 31, 2020, the Group is not subject to any externally imposed capital requirements. In order to maintain or achieve an optimal capital structure, the Group allocates its capital for distribution as dividend or re-investment into business based on its long term financial plans. The Group’s management reviews the capital structure of the Group on a periodic basis. As part of review, the management considers the cost of capital and risk associated with each class of capital. The Group also evaluates its gearing measures like Debt Equity Ratio, Debt Service Coverage Ratio, Interest Service Coverage Ratio, Debt to EBIDTA Ratio to arrive at an appropriate level of debt and accordingly evolve its capital structure.
The following table summerises the capital of the Group:
Particulars As at March 31, 2020
As at March 31, 2019
Total equity 22,518.19 19,932.08 Non-current borrowings (including current maturities) 6,026.47 3,857.54 Current borrowings 21,228.96 21,170.01
Total capital (Debt + Equity) 49,773.62 44,959.63
Note 37The outbreak of Covid-19 pandemic is causing significant disturbance and slowdown of economic activities globally (including in India). The nationwide lockdown ordered by the Government of India has resulted in significant reduction in economic activities and also the business operations of the Group in terms of sales and production. The management has considered the possible effects that may result from the pandemic on the recoverability/carrying value of the assets. Based on the current indicators of future economic conditions, the management expects to recover the carrying amount of the assets, however the management will continue to closely monitor any material changes to future economic conditions. Given the uncertainties, the final impact on Group’s assets in future may differ from that estimated as at the date of approval of these financial statements.
Summary of the significant accounting policies and other explanatory information (Contd.)For the year ended March 31, 2020 (All amounts in ` lacs, unless otherwise stated)

206
Corporate Overview Statutory Reports Financial Statements
Note 38 - Financial InstrumentsA Financial assets and liabilities
The accounting classification of each category of financial instruments, and their carrying amounts, are set out below:
Particulars Note As at March 31, 2020 As at March 31, 2019Amortised
costFVTPL Amortised
costFVTPL
Financial assetsInvestments* 6 0.06 - 0.06 -Trade receivables 11 6,752.55 - 9,646.41 -Other financial assets 8 2,056.51 - 324.46 -Derivative assets 8 - - - 119.46 Loans 7 421.73 - 348.15 -Cash and cash equivalents 12 1,067.03 - 1,228.42 -Other bank balances 13 965.27 - 958.60 -
Total financial assets 11,263.15 - 12,506.10 119.46 Financial liabilitiesBorrowings 16 & 21 27,255.43 - 25,027.55 -Lease liabilities 17 675.33 - - -Trade payables 20 8,530.65 - 9,822.41 -Other financial liabilities 21 203.04 - 60.33 -Derivative liabilities 8 - 606.53 - -
Total financial liabilities 36,664.45 606.53 34,910.29 -
* Investment in associates are measured at using equity method of accounting and hence, not presented here.
B Fair values hierarchy
The fair value of financial instruments as referred to in note (A) above has been classified into three categories depending on the inputs used in the valuation technique. The hierarchy gives the highest priority to quoted prices in active markets for identical assets or liabilities (Level 1 measurements) and lowest priority to unobservable inputs (Level 3 measurements).
The categories used are as follows:
Level 1: Quoted prices for identical instruments in an active market;
Level 2: Directly (i.e. as prices) or indirectly (i.e. derived from prices) observable market inputs, other than Level 1 inputs; and
Level 3: Inputs which are not based on observable market data (unobservable inputs). Fair values are determined in whole or in part using a net asset value or valuation model based on assumptions that are neither supported by prices from observable current market transactions in the same instrument nor are they based on available market data.
B.1 Financial assets and liabilities measured at fair value - recurring fair value measurements
Particulars Note Level 1 Level 2 Level 3 TotalAs at March 31, 2020Financial liabilities measured at fair value through profit or loss
Derivative liabilities 8 - 606.53 - 606.53 As at March 31, 2019Financial assets measured at fair value through profit or loss
Derivative assets 8 - 119.46 - 119.46
Summary of the significant accounting policies and other explanatory information (Contd.)For the year ended March 31, 2020 (All amounts in ` lacs, unless otherwise stated)

207
Annual Report2019-2020
Valuation process and technique used to determine fair value(i) The fair value of investments in quoted equity shares is based on the current bid price of respective investment
as at the balance sheet date.
(ii) The fair value of investments in unquoted equity shares is estimated at their respective costs, since those companies do not have any significant operations and there has neither been any significant change in their performance since initial recognition nor there is any expectation of such changes in foreseeable future.
(iii) The Group enters into commodity contracts with financial institutions for hedging price risk of lead arising from its import and export. Fair values of such contracts are determined based on observable rates of the commodity for similar contracts for the remaining maturity on the balance sheet date.
(iv) There are no significant changes in value of level 3 investment measured at fair value through other comprehensive income.
B.2 Fair value of instruments measured at amortised cost Fair value of instruments measured at amortised cost for which fair value is disclosed is as follows, these
fair values are calculated using Level 3 inputs:
Particulars Note March 31, 2020 March 31, 2019Carrying
valueFair value Carrying
valueFair value
Non-current financial assetsInvestments 6 0.06 0.06 0.06 0.06 Security deposits 7 293.94 293.94 255.98 255.98 Deposits with bank (with remaining maturity more than 12 months)
8 1.26 1.26 1.26 1.26
Non-current financial liabilitiesBorrowings 16 4,290.27 4,290.27 2,845.75 2,845.75 Lease liabilities 17 454.01 454.01 - -
The management assessed that fair values of current loans, current financial assets, cash and cash equivalents, other bank balances, trade receivables, short term borrowings, trade payables , current lease liabilities and other current financial liabilities approximate their respective carrying amounts largely due to the short-term maturities of these instruments. The fair value of the financial assets and liabilities is disclosed at the amount at which the instrument could be exchanged in a current transaction between willing parties, other than in a forced or liquidation sale. The following methods and assumptions were used to estimate the fair values:
(i) Non-current loans and non-current financial liabilities are evaluated by the Group based on parameters such as interest rates, individual credit worthiness of the counterparty/borrower and other market risk factors.
(ii) The fair values of the Group’s fixed interest-bearing liabilities, loans and receivables are determined by applying discounted cash flows (‘DCF’) method, using discount rate that reflects the issuer’s borrowing rate as at the end of the reporting period. The own non-performance risk as at March 31, 2020 was assessed to be insignificant.
(iii) All the other long term borrowing facilities availed by the Group are variable rate facilities which are subject to changes in underlying interest rate indices. Further, the credit spread on these facilities are subject to change with changes in Group’s creditworthiness. The management believes that the current rate of interest on these loans are in close approximation from market rates applicable to the Group. Therefore, the management estimates that the fair value of these borrowings are approximate to their respective carrying values.
Summary of the significant accounting policies and other explanatory information (Contd.)For the year ended March 31, 2020 (All amounts in ` lacs, unless otherwise stated)

208
Corporate Overview Statutory Reports Financial Statements
Note 39 - Reconciliation of liabilities arising from financing activities
For financial year 2019-20
Particulars Non-current borrowing^
Current borrowing
Lease liabilities
As at March 31, 2019 3,857.54 21,170.01 1,189.03 Cash inflow 2,928.15 - -Cash outflow (785.57) (22.02) (318.07)Non-cash changes
- Amortisation of transaction costs 26.35 - -- Exchange loss - 80.97 -- Disposal of lease liabilities - - (276.15)- Interest accrued - - 80.52
As at March 31, 2020 6,026.47 21,228.96 675.33
^ Including current maturities
For financial year 2018-19
Particulars Non-current borrowing^
Current borrowing
As at March 31, 2018 2,176.70 21,075.11 Cash inflow 2,388.99 95.63 cash outflow (728.91) -Non-cash changes- Amortisation of transaction costs 20.76 -- Exchange (gain) on borrowing - (0.73)As at March 31, 2019 3,857.54 21,170.01
^ Including current maturities
Note 40 - Financial Risk Management
Risk Management
The Group’s activities expose it to market risk, liquidity risk and credit risk. The Group’s Board of Directors has overall responsibility for the establishment and oversight of the Group’s risk management framework. This note explains the sources of risk which the entity is exposed to and how the entity manages the risk and the related impact in the financial statements.
Risk Exposure arising from Measurement ManagementCredit risk Loans, Cash and cash equivalents, trade receivables,
derivative financial instruments and other financial assets measured at amortised cost
Ageing analysis, Credit ratings
Bank deposits, diversification of asset base, credit limits
Liquidity risk Borrowings and other liabilities Rolling cash flow forecasts
Availability of committed credit lines and borrowing
Market risk - foreign exchange
Recognised financial assets and liabilities not denominated in Indian rupee (INR)
Cash flow forecasting
Forward foreign exchange contracts
Market risk - interest rate
Long-term borrowings at variable rates Sensitivity analysis Negotiation of terms that reflect the market factors
The Group’s risk management is carried out by a central treasury department (of the Group) under policies approved by the board of directors. The board of directors provides written principles for overall risk management, as well as policies covering specific areas, such as foreign exchange risk, interest rate risk, credit risk and investment of excess liquidity.
C.1 Credit risk Credit risk is the risk that a counterparty fails to discharge its obligation to the Company. The Company’s exposure
to credit risk is influenced mainly by loans, cash and cash equivalents, trade receivables, derivative financial instruments and other financial assets measured at amortised cost. The Company continuously monitors defaults of customers and other counterparties and incorporates this information into its credit risk controls.
Summary of the significant accounting policies and other explanatory information (Contd.)For the year ended March 31, 2020 (All amounts in ` lacs, unless otherwise stated)

209
Annual Report2019-2020
(a) Credit risk management
The Group assesses and manages credit risk based on internal credit rating system. Internal credit rating is performed for each class of financial instruments with different characteristics. The Group assigns the following credit ratings to each class of financial assets based on the assumptions, inputs and factors specific to the class of financial assets.
(i) Low credit risk
(ii) Moderate credit risk
(iii) High credit risk
Based on business environment in which the Group operates, a default on a financial asset is considered when the counter party fails to make payments within the agreed time period as per contract. Loss rates reflecting defaults are based on actual credit loss experience and considering differences between current and historical economic conditions.
Assets are written off when there is no reasonable expectation of recovery, such as a debtor declaring bankruptcy or a litigation decided against the Group. The Group continues to engage with parties whose balances are written off and attempts to enforce repayment. Recoveries made are recognised in Statement of Profit and Loss.
The Group provides for expected credit loss based on the following:
Basis of categorisation
Asset class exposed to credit risk Provision for expected credit loss
Low credit risk Loans, trade receivables, cash and cash equivalents, derivative financial instruments, financial assets measured at amortised cost
12 month expected credit loss
High credit risk Trade receivables Life time expected credit loss or specific provision whichever is higher
Financial assets that expose the entity to credit risk*
Particulars Note As at March 31, 2020
As at March 31, 2019
Low credit riskLoans (including security deposits) 7 421.73 348.15 Trade receivables 11 6,752.55 9,646.41 Cash and cash equivalents 12 1,067.03 1,228.42 Other bank balances 13 965.27 958.60 Other financial assets (including derivative assets) 8 2,056.51 443.92
High credit riskTrade receivables 11 373.16 138.49
Total 11,636.25 12,763.99
*These represent carrying values of financial assets, without deduction for expected credit losses
Cash and cash equivalents and bank deposits
Credit risk related to cash and cash equivalents and bank deposits is managed by only accepting highly rated banks and diversifying bank deposits and accounts in different banks across the country.
Derivative financial instruments
Derivative financial instruments are considered to have low credit risk since the contracts are with reputable financial institutions.
Trade receivables
Trade receivables are generally unsecured and non-interest bearing. There is no significant concentration of credit risk. The Group’s credit risk management policy in relation to trade receivables involves periodically assessing the financial reliability of customers, taking into account their financial position, past experience and other factors. The utilization of credit limit is regularly monitored. The Group’s credit risk is mainly confined to the risk of customers defaulting against credit sales made. Outstanding trade receivables are regularly monitored by credit monitoring Group. The Group has
Summary of the significant accounting policies and other explanatory information (Contd.)For the year ended March 31, 2020 (All amounts in ` lacs, unless otherwise stated)

210
Corporate Overview Statutory Reports Financial Statements
also taken advances from its customers, which mitigate the credit risk to an extent. In respect of trade receivables, the Group recognises a impairement for lifetime expected credit losses after evaluating the individual probabilities of default of its customers which are duly based on the inputs received from the marketing teams of the Group.
Other financial assets measured at amortised costOther financial assets measured at amortised cost includes loans to related parties, loans to employees, security deposits and others. Credit risk related to these other financial assets is managed by monitoring the recoverability of such amounts continuously, while at the same time internal control system are in place ensure the amounts are within defined limits.
(b) Expected credit losses for financial assets (i) Financial assets (other than trade receivables) Group provides for expected credit losses on financial assets other than trade receivables by assessing individual
financial instruments for expectation of any credit losses.
- For cash & cash equivalents, other bank balances and derivative financial instruments - Since the Group deals with only high-rated banks and financial institutions, credit risk in respect of cash and cash equivalents, derivative financial instruments, other bank balances and bank deposits is evaluated as very low.
- For security deposits paid - Credit risk is considered low because the Group is in possession of the underlying asset
- For other financial assets - Credit risk is evaluated based on Group knowledge of the credit worthiness of those parties and loss allowance is measured. For such financial assets, the Group policy is to provide for 12 month expected credit losses upon initial recognition and provide for lifetime expected credit losses upon significant increase in credit risk.
March 31, 2020 Notes Gross carrying amount
Expected probability of
default
Expected creditlosses
Carrying amount net of impairment
provisionCash and cash equivalents 12 1,067.03 0.00% - 1,067.03 Other bank balances 13 965.27 0.00% - 965.27 Loans (including security deposits) 7 421.73 0.00% - 421.73 Other financial assets 8 2,056.51 0.00% - 2,056.51
March 31, 2019 Notes Gross carrying amount
Expected probability of
default
Expected creditlosses
Carrying amount net of
impairment provision
Cash and cash equivalents 12 1,228.42 0.00% - 1,228.42 Other bank balances 13 958.60 0.00% - 958.60 Loans (including security deposits) 7 348.15 0.00% - 348.15 Other financial assets 8 443.92 0.00% - 443.92
(ii) Expected credit loss for trade receivables under simplified approach
As at March 31, 2020 and March 31, 2019, the Group considered the individual probabilities of default of its financial assets (other than trade receivables) and determined that in respect of counterparties with low credit risk, no default events are considered to be possible within the 6 months after the reporting date. In respect of trade receivables, the Group measures the loss allowance at an amount equal to lifetime expected credit losses using a simplified approach.
March 31, 2020 Gross carrying amount
% of expected
credit losses
Allowance for expected credit losses
Net carrying amount of impairment
provisionAmount not yet due 4,827.53 0.00% - 4,827.53 Between one to six month overdue 2,075.79 7.26% 150.77 1,925.02 Greater than six month overdue 222.39 100.00% 222.39 -
Total 7,125.71 373.16 6,752.55
Summary of the significant accounting policies and other explanatory information (Contd.)For the year ended March 31, 2020 (All amounts in ` lacs, unless otherwise stated)
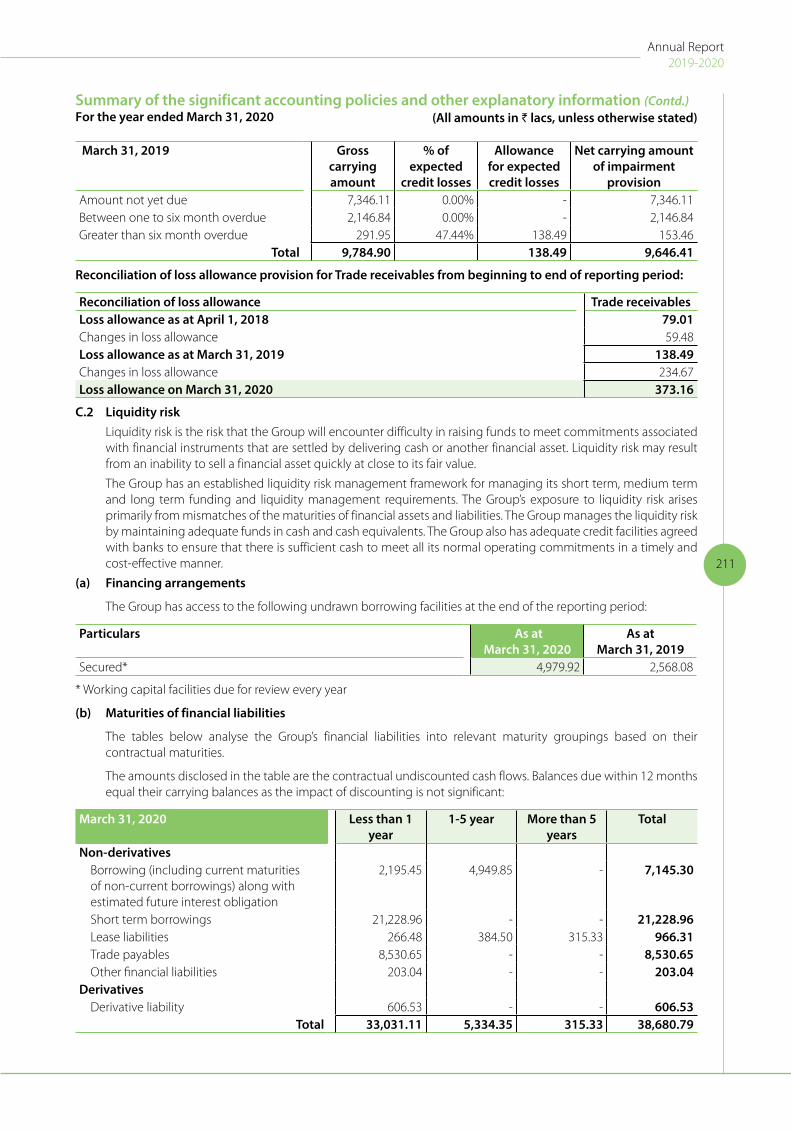
211
Annual Report2019-2020
March 31, 2019 Gross carrying amount
% of expected
credit losses
Allowance for expected credit losses
Net carrying amount of impairment
provisionAmount not yet due 7,346.11 0.00% - 7,346.11 Between one to six month overdue 2,146.84 0.00% - 2,146.84 Greater than six month overdue 291.95 47.44% 138.49 153.46
Total 9,784.90 138.49 9,646.41
Reconciliation of loss allowance provision for Trade receivables from beginning to end of reporting period:
Reconciliation of loss allowance Trade receivablesLoss allowance as at April 1, 2018 79.01 Changes in loss allowance 59.48 Loss allowance as at March 31, 2019 138.49 Changes in loss allowance 234.67 Loss allowance on March 31, 2020 373.16
C.2 Liquidity risk Liquidity risk is the risk that the Group will encounter difficulty in raising funds to meet commitments associated
with financial instruments that are settled by delivering cash or another financial asset. Liquidity risk may result from an inability to sell a financial asset quickly at close to its fair value.
The Group has an established liquidity risk management framework for managing its short term, medium term and long term funding and liquidity management requirements. The Group’s exposure to liquidity risk arises primarily from mismatches of the maturities of financial assets and liabilities. The Group manages the liquidity risk by maintaining adequate funds in cash and cash equivalents. The Group also has adequate credit facilities agreed with banks to ensure that there is sufficient cash to meet all its normal operating commitments in a timely and cost-effective manner.
(a) Financing arrangements
The Group has access to the following undrawn borrowing facilities at the end of the reporting period:
Particulars As at March 31, 2020
As atMarch 31, 2019
Secured* 4,979.92 2,568.08
* Working capital facilities due for review every year
(b) Maturities of financial liabilities
The tables below analyse the Group’s financial liabilities into relevant maturity groupings based on their contractual maturities.
The amounts disclosed in the table are the contractual undiscounted cash flows. Balances due within 12 months equal their carrying balances as the impact of discounting is not significant:
March 31, 2020 Less than 1 year
1-5 year More than 5 years
Total
Non-derivativesBorrowing (including current maturities of non-current borrowings) along with estimated future interest obligation
2,195.45 4,949.85 - 7,145.30
Short term borrowings 21,228.96 - - 21,228.96 Lease liabilities 266.48 384.50 315.33 966.31 Trade payables 8,530.65 - - 8,530.65 Other financial liabilities 203.04 - - 203.04
DerivativesDerivative liability 606.53 - - 606.53
Total 33,031.11 5,334.35 315.33 38,680.79
Summary of the significant accounting policies and other explanatory information (Contd.)For the year ended March 31, 2020 (All amounts in ` lacs, unless otherwise stated)

212
Corporate Overview Statutory Reports Financial Statements
Maturities of financial liabilities (continued)
March 31, 2019 Less than 1 year
1-5 year More than 5 years
Total
Non-derivativesBorrowing (including current maturities of non-current borrowings) along with estimated future interest obligation
1,246.71 3,342.37 - 4,589.08
Short term borrowings 21,170.01 - - 21,170.01 Trade payables 9,822.41 - - 9,822.41 Other financial liabilities 60.33 - - 60.33
Total 32,299.46 3,342.37 - 35,641.83
C.3 Market risk
(a) Foreign currency risk
The Group is exposed to foreign exchange risk in the normal course of its business. Multiple currency exposures arise from commercial transactions like sales, purchases, borrowings, recognized financial assets and liabilities (monetary items). Certain transactions of the Group act as natural hedge as a portion of both assets and liabilities are denominated in similar foreign currencies. For the remaining exposure to foreign exchange risk, the Group adapts the policy of selective hedging based on risk perception of management. Foreign exchange hedging contracts are carried at fair value. The Group’s exposure to foreign currency changes for all other currencies which are not stated below is not material. Foreign currency exposures that are not hedged by derivative instruments outstanding as on the balance sheet date are as under:
Particulars Financial assets Financial liabilitiesAs at
March 31, 2020As at
March 31, 2019As at
March 31, 2020As at
March 31, 2019USD 4,514.76 6,665.07 3,833.56 2,509.56 EURO - 13.88 - -
Foreign exchange risk sensitivity analysis has been performed on the foreign currency exposures in the Group’s financial assets and financial liabilities at the reporting date, net of derivative contracts for hedging those exposures. Reasonably possible changes are based on an analysis of historic currency volatility, together with any relevant assumptions regarding near-term future volatility.
The impact on the Group’s profit before tax and equity due to changes in the foreign currency exchange rates are given below:
Particulars For the Year ended March 31, 2020
For the Year ended March 31, 2019
USD SensitivityINR/USD - Increase by 5.45% (March 31, 2019 - 6.82%) 37.13 283.41 INR/USD - Decrease by 5.45% (March 31, 2019 - 6.82%) (37.13) (283.41)
Euro SensitivityINR/EURO - Increase by 7.57% (March 31, 2019 - 7.26%) - 1.01 INR/EURO - Decrease by 7.57% (March 31, 2019 - 7.26%) - (1.01)
Summary of the significant accounting policies and other explanatory information (Contd.)For the year ended March 31, 2020 (All amounts in ` lacs, unless otherwise stated)

213
Annual Report2019-2020
Foreign exchange derivative contracts
The Group uses derivative financial instruments exclusively for hedging financial risks that arise from its commercial business or financing activities. The Group’s Corporate Treasury team manages its foreign currency risk by hedging transactions that are expected to occur within of 12 to 15 months for hedges of forecasted sales, purchases and capital expenditures. When a derivative is entered into for the purpose of being a hedge, the Group negotiates the terms of those derivatives to match the terms of the hedged exposure. For hedges of forecast transactions the derivatives cover the period of exposure from the point the cash flows of the transactions are forecasted up to the point of settlement of the resulting receivable or payable that is denominated in the foreign currency. All identified exposures are managed as per the policy duly approved by the Board of Directors.
Outstanding contracts No. of deals Foreign currency (FCY) Nominal amountAs at
March 31, 2020
As at March 31,
2019
As at March 31,
2020
As at March 31,
2019
As at March 31,
2020
As at March 31,
2019USD / INR sell forward (2,000) - (2,000,000) - (150,771,800) -
USD / INR Buy forward - 550 - 550,000 - 39,351,125
(b) Interest rate risk
(i) Financial liabilities
The Group’s policy is to minimise interest rate cash flow risk exposures on external financing. At March 31, 2020 and March 31, 2019, the Group is exposed to changes in interest rates through bank borrowings carrying variable
interest rates. The Group’s investments in fixed deposits carry fixed interest rates.
Interest rate risk exposure
Below is the overall exposure of the Company to interest rate risk:
Particulars As atMarch 31, 2020
As atMarch 31, 2019
Variable rate borrowing 17,740.90 12,445.91 Fixed rate borrowing 9,514.53 12,581.64
Total borrowings 27,255.43 25,027.55
Sensitivity
Below is the sensitivity of profit or loss to changes in interest rates.
Particulars As atMarch 31, 2020
As atMarch 31, 2019
Interest sensitivity*Interest rates – increase by 100 basis points 177.41 124.46 Interest rates – decrease by 100 basis points (177.41) (124.46)
* Holding all other variables constant
(c) Price risk
Exposure
The Group exposure to price risk arises from investments held and classified in the balance sheet either as fair value through other comprehensive income or at fair value through profit or loss. To manage the price risk arising from investments, the Group diversifies its portfolio of assets. There are no investments held by the Group which are measured at fair value either through profit and loss or fair value through other comprehensive income, hence the Group is not exposed to price risk.
Summary of the significant accounting policies and other explanatory information (Contd.)For the year ended March 31, 2020 (All amounts in ` lacs, unless otherwise stated)

214
Corporate Overview Statutory Reports Financial Statements
Not
e 41
- D
iscl
osur
e of
eff
ects
of h
edge
acc
ount
ing
on fi
nanc
ial p
ositi
on(a
) D
iscl
osur
e of
eff
ects
of h
edge
acc
ount
ing
on fi
nanc
ial p
ositi
on
As
at M
arch
31,
202
0
Type
of h
edge
and
risk
sNo
min
al
valu
e in
USD
Carr
ying
am
ount
of
hedg
ing
inst
rum
ent
Mat
urity
dat
esHe
dge
ratio
Aver
age
strik
e pr
ice
Chan
ge in
fair
valu
e of
hed
ging
in
stru
men
t
Chan
ge in
the
valu
e of
hed
ged
item
use
d as
the
basi
s for
re
cogn
isin
g he
dge
effec
tiven
ess
Cash
flow
hed
gePr
e-sh
ipm
ent c
redi
t in
fore
ign
curr
ency
(PC
FCs)
28.0
0 2,
110.
71
May
15,
202
0 -
Sept
embe
r 16,
202
01:
1`
72.9
9/
USD
152.
64
152.
64
As
at M
arch
31,
201
9
Type
of h
edge
and
risk
sNo
min
al
valu
e in
USD
Carr
ying
am
ount
of
hedg
ing
inst
rum
ent
Mat
urity
dat
esHe
dge
ratio
Aver
age
strik
e pr
ice
Chan
ge in
fair
valu
e of
hed
ging
in
stru
men
t
Chan
ge in
the
valu
e of
hed
ged
item
use
d as
the
basi
s for
re
cogn
isin
g he
dge
effec
tiven
ess
Cash
flow
hed
gePr
e-sh
ipm
ent c
redi
t in
fore
ign
curr
ency
(PC
FCs)
83.
34
5,7
64.7
9 A
ugus
t 8, 2
019
- Se
ptem
ber 8
, 201
91:
1`
69.1
9/ U
SD 3
96.7
5 3
96.7
5
(b)
Dis
clos
ure
of e
ffec
ts o
f hed
ge a
ccou
ntin
g on
fina
ncia
l per
form
ance
For t
he y
ear e
nded
Mar
ch 3
1, 2
020
Type
of h
edge
and
risk
sCh
ange
in th
e va
lue
of
hedg
ing
inst
rum
ent i
n ot
her
com
preh
ensiv
e lo
ss (i
ncom
e)
Hedg
e in
effec
tiven
ess
reco
gnise
d in
pro
fit o
r lo
ss
Amou
nt re
clas
sified
from
cash
flo
w h
edgi
ng re
serv
e to
pro
fit
or lo
ss
Line
item
affe
cted
in st
atem
ent o
f pro
fit a
nd
loss
bec
ause
of r
ecla
ssifi
catio
n an
d he
dge
ineff
ectiv
enes
sCa
sh fl
ow h
edge
Pre-
ship
men
t cre
dit i
n fo
reig
n cu
rren
cy (P
CFC
s)80
.97
-71
.67
Fina
nce
cost
and
oth
er e
xpen
ses
For t
he y
ear e
nded
Mar
ch 3
1, 2
019
Type
of h
edge
and
risk
sCh
ange
in th
e va
lue
of
hedg
ing
inst
rum
ent i
n ot
her
com
preh
ensiv
e lo
ss (i
ncom
e)
Hedg
e in
effec
tiven
ess
reco
gnise
d in
pro
fit o
r lo
ss
Amou
nt re
clas
sified
from
cash
flo
w h
edgi
ng re
serv
e to
pro
fit
or lo
ss
Line
item
affe
cted
in st
atem
ent o
f pro
fit
and
loss
bec
ause
of r
ecla
ssifi
catio
n an
d he
dge
ineff
ectiv
enes
sCa
sh fl
ow h
edge
Pre-
ship
men
t cre
dit i
n fo
reig
n cu
rren
cy (P
CFC
s) (0
.73)
- 3
97.4
8 Fi
nanc
e co
st a
nd o
ther
exp
ense
s
Sum
mar
y of
the
sign
ifica
nt a
ccou
ntin
g po
licie
s an
d ot
her e
xpla
nato
ry in
form
atio
n (C
ontd
.)Fo
r the
yea
r end
ed M
arch
31,
202
0(A
ll am
ount
s in
` la
cs, u
nles
s ot
herw
ise
stat
ed)

215
Annual Report2019-2020
(c) Movements in cash flow hedging reserve
Particulars March 31, 2020 March 31, 2019 Amount at the beginning of the year (0.47) -Add: Changes in value of PCFCs 152.64 396.75 Less: Amount reclassified to profit or loss (71.67) (397.48)Less: Deferred tax relating to above (net) (28.29) 0.26 Amount at the end of the year 52.21 (0.47)
Note 42 - Employee share based payments
(a) Employee stock option plan, 2011
The members of the Holding Company at its Annual General Meeting held on July 27, 2011 had approved the issue of Stock Options to eligible employees/directors of the Holding Company and its subsidiaries. Accordingly, the Board at their meeting held on August 10, 2011 approved the “Gravita ESOP 2011” Scheme. A Compensation Committee was formed to govern the Gravita ESOP 2011 Scheme which has approved first, second, third and fourth grant of options on September 23, 2011, July 5, 2012, July 1, 2013 and April 1, 2015 respectively. Details are as follows:
Particulars First grant Second grant Third grant Fourth grantGrant Date September 23, 2011 July 5, 2012 July 1, 2013 April 1, 2015Grant effective from October 1, 2011 July 5, 2012 July 1, 2013 April 1, 2015Exercisable period 5 years 5 years 5 years 5 yearsOption Granted 400,380 31,000 368,500 500,000Exercise price ` 2 per share ` 2 per share ` 2 per share ` 2 per share
Fair value of share options granted during the year
The fair value of options granted is estimated using the Black Scholes Option Pricing Model after applying the key assumption which are tabulated below. The expected volatility has been calculated using the daily stock returns on NSE, based on expected life options of each vest. The expected life of share option is based on historical data and current expectation and not necessarily indicative of exercise pattern that may occur.
Inputs in the pricing model
Particulars First grant Second grant Third grant Fourth grantWeighted average fair Value of options 75.01 174.20 19.45 34.93 Weighted average share price 76.95 176.20 21.45 36.30 Exercise Price 2 2 2 2Expected Volatility 62.02% 62.34% 54.84% 66.19%Options Life 5 Yrs 5 Yrs 5 Yrs 5 YrsDividend Yield 0.65% 0.27% 1.38% 0.00%Risk Free Rate 7.16% 7.20% 7.40% 7.05%
Movement in stock options
For the year ended March 31, 2020
Particulars First grant Second grant Third grant Fourth grantOptions outstanding as at March 31, 2019 - - - 291,200 New options issued during the year - - - - Options exercised during the year - - - 291,200 Lapsed/ forfeited during the year - - - - Options outstanding as at March 31, 2020 - - - -
Summary of the significant accounting policies and other explanatory information (Contd.)For the year ended March 31, 2020 (All amounts in ` lacs, unless otherwise stated)
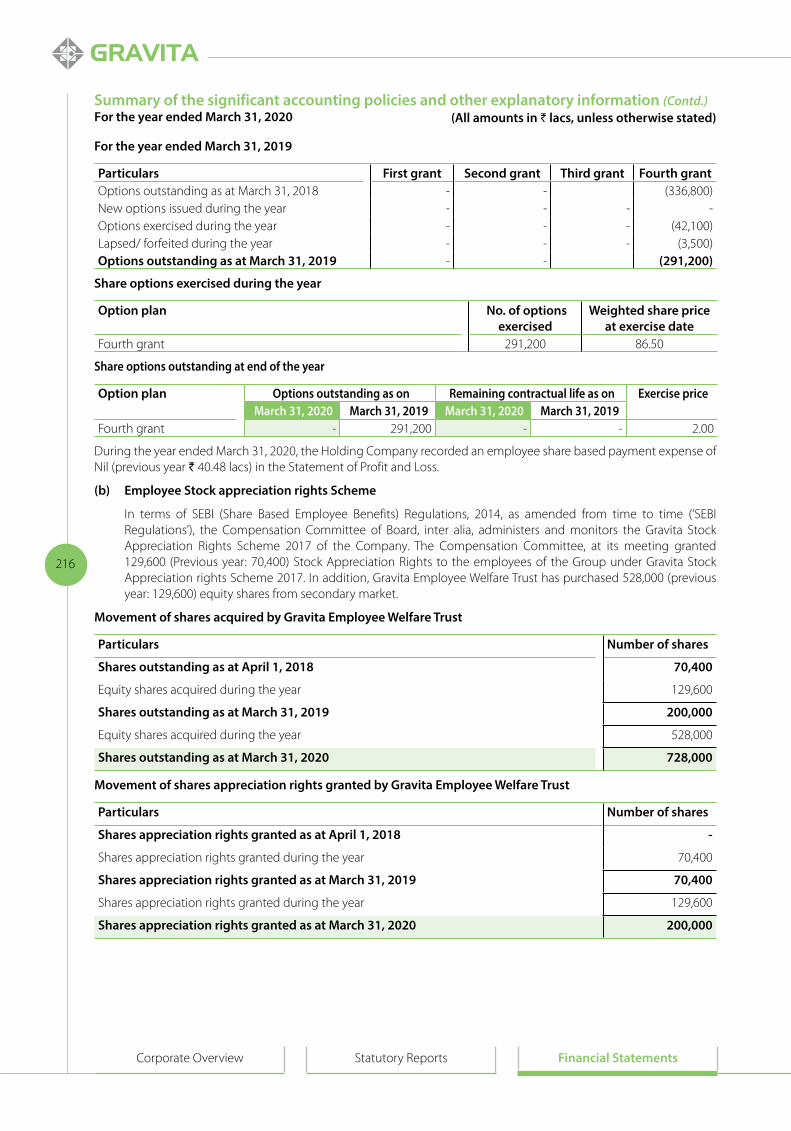
216
Corporate Overview Statutory Reports Financial Statements
For the year ended March 31, 2019
Particulars First grant Second grant Third grant Fourth grantOptions outstanding as at March 31, 2018 - - (336,800)New options issued during the year - - - - Options exercised during the year - - - (42,100)Lapsed/ forfeited during the year - - - (3,500)Options outstanding as at March 31, 2019 - - (291,200)
Share options exercised during the year
Option plan No. of options exercised
Weighted share price at exercise date
Fourth grant 291,200 86.50
Share options outstanding at end of the year
Option plan Options outstanding as on Remaining contractual life as on Exercise price March 31, 2020 March 31, 2019 March 31, 2020 March 31, 2019
Fourth grant - 291,200 - - 2.00
During the year ended March 31, 2020, the Holding Company recorded an employee share based payment expense of Nil (previous year ` 40.48 lacs) in the Statement of Profit and Loss.
(b) Employee Stock appreciation rights Scheme
In terms of SEBI (Share Based Employee Benefits) Regulations, 2014, as amended from time to time (‘SEBI Regulations’), the Compensation Committee of Board, inter alia, administers and monitors the Gravita Stock Appreciation Rights Scheme 2017 of the Company. The Compensation Committee, at its meeting granted 129,600 (Previous year: 70,400) Stock Appreciation Rights to the employees of the Group under Gravita Stock Appreciation rights Scheme 2017. In addition, Gravita Employee Welfare Trust has purchased 528,000 (previous year: 129,600) equity shares from secondary market.
Movement of shares acquired by Gravita Employee Welfare Trust
Particulars Number of shares
Shares outstanding as at April 1, 2018 70,400
Equity shares acquired during the year 129,600
Shares outstanding as at March 31, 2019 200,000
Equity shares acquired during the year 528,000
Shares outstanding as at March 31, 2020 728,000
Movement of shares appreciation rights granted by Gravita Employee Welfare Trust
Particulars Number of shares
Shares appreciation rights granted as at April 1, 2018 -
Shares appreciation rights granted during the year 70,400
Shares appreciation rights granted as at March 31, 2019 70,400
Shares appreciation rights granted during the year 129,600
Shares appreciation rights granted as at March 31, 2020 200,000
Summary of the significant accounting policies and other explanatory information (Contd.)For the year ended March 31, 2020 (All amounts in ` lacs, unless otherwise stated)

217
Annual Report2019-2020
Note 43 - Employee benefits plans
(i) Defined Contribution Plans
The Group makes contribution towards employees’ provident fund and employees’ deposit linked insurance scheme for qualifying employees. Under the schemes, the Group is required to contribute a specified percentage of payroll cost, as specified in the rules of the schemes, to these defined contribution schemes.
The Group has recognised for contributions to these plans in the statement of profit and loss as under:
Particulars For the year endedMarch 31, 2020 March 31, 2019
Employer's contribution to provident funds 147.31 143.14 Employer’s contribution to employee state insurance 81.87 82.34
There are numerous interpretive issues relating to the Hon’ble Supreme Court (SC) judgement dated February 28, 2019 on provident fund. The Group has started recognising such expenditure/liability on account of enhanced provident fund contributions prospectively. Pending further clarification on the applicability of such ruling, the management is of the view that such ruling is applicable prospectively.
(ii) Defined benefits plans
The employees’ gratuity fund scheme managed by a trust namely ‘Gravita India Limited Employees Gratuity Trust’ is defined benefit plan. The gratuity plan provides for a lump sum payment to the employees at the time of separation from the service on completion of vested year of employment i.e. five years. The liability of gratuity plan is determined based on actuarial valuation as at the end of each financial year using the Projected Unit Credit Method, which recognises each period of service as giving rise to additional unit of employees benefit entitlement and measures each unit separately to build up the final obligation.
Earned leaves – Long term leaves includes earned leaves. These have been provided on accrual basis, based on year end actuarial valuation.
These plans typically expose the company to actuarial risks such as investment risk, salary risk, interest rate risk and longevity risk.
Investment Risk - The probability or likelihood of occurrence of losses relative to the expected return on any particular investment.
Salary Risk - The present value of defined benefit plan is calculated with the assumption of salary increase rate of plan participants in future. Deviation in rate of increase in salary in future for plan participants from the rate of increase in salary used to determine the present value of obligation will have a bearing on the plan’s liability.
Interest Risk -The plan exposes the Company to the risk of fall in interest rates. A fall in interest rates will result in an increase in the ultimate cost of providing the above benefit and will thus result in an increase in value of the liability.
Longevity Risk -The present value of defined benefit plan liability is calculated by reference to the best estimate of the mortality of plan participants both during and after employment. An increase in the life expectancy of the plan participants will increase the plans liability.
Summary of the significant accounting policies and other explanatory information (Contd.)For the year ended March 31, 2020 (All amounts in ` lacs, unless otherwise stated)
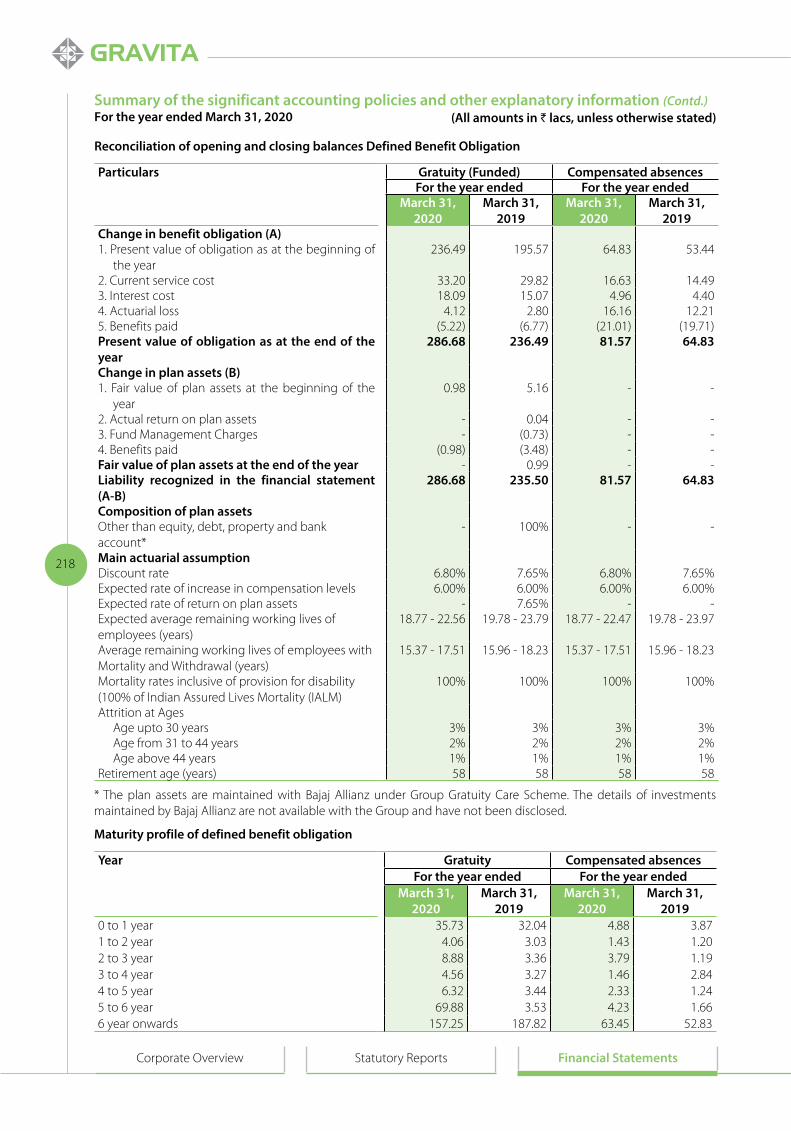
218
Corporate Overview Statutory Reports Financial Statements
Reconciliation of opening and closing balances Defined Benefit Obligation
Particulars Gratuity (Funded) Compensated absencesFor the year ended For the year ended
March 31, 2020
March 31, 2019
March 31, 2020
March 31, 2019
Change in benefit obligation (A)1. Present value of obligation as at the beginning of
the year 236.49 195.57 64.83 53.44
2. Current service cost 33.20 29.82 16.63 14.49 3. Interest cost 18.09 15.07 4.96 4.40 4. Actuarial loss 4.12 2.80 16.16 12.21 5. Benefits paid (5.22) (6.77) (21.01) (19.71)Present value of obligation as at the end of the year
286.68 236.49 81.57 64.83
Change in plan assets (B)1. Fair value of plan assets at the beginning of the
year 0.98 5.16 - -
2. Actual return on plan assets - 0.04 - - 3. Fund Management Charges - (0.73) - - 4. Benefits paid (0.98) (3.48) - - Fair value of plan assets at the end of the year - 0.99 - - Liability recognized in the financial statement (A-B)
286.68 235.50 81.57 64.83
Composition of plan assetsOther than equity, debt, property and bank account*
- 100% - -
Main actuarial assumption Discount rate 6.80% 7.65% 6.80% 7.65%Expected rate of increase in compensation levels 6.00% 6.00% 6.00% 6.00%Expected rate of return on plan assets - 7.65% - - Expected average remaining working lives of employees (years)
18.77 - 22.56 19.78 - 23.79 18.77 - 22.47 19.78 - 23.97
Average remaining working lives of employees with Mortality and Withdrawal (years)
15.37 - 17.51 15.96 - 18.23 15.37 - 17.51 15.96 - 18.23
Mortality rates inclusive of provision for disability (100% of Indian Assured Lives Mortality (IALM)
100% 100% 100% 100%
Attrition at AgesAge upto 30 years 3% 3% 3% 3%Age from 31 to 44 years 2% 2% 2% 2%Age above 44 years 1% 1% 1% 1%
Retirement age (years) 58 58 58 58
* The plan assets are maintained with Bajaj Allianz under Group Gratuity Care Scheme. The details of investments maintained by Bajaj Allianz are not available with the Group and have not been disclosed.
Maturity profile of defined benefit obligation
Year Gratuity Compensated absencesFor the year ended For the year ended
March 31, 2020
March 31, 2019
March 31, 2020
March 31, 2019
0 to 1 year 35.73 32.04 4.88 3.87 1 to 2 year 4.06 3.03 1.43 1.20 2 to 3 year 8.88 3.36 3.79 1.19 3 to 4 year 4.56 3.27 1.46 2.84 4 to 5 year 6.32 3.44 2.33 1.24 5 to 6 year 69.88 3.53 4.23 1.66 6 year onwards 157.25 187.82 63.45 52.83
Summary of the significant accounting policies and other explanatory information (Contd.)For the year ended March 31, 2020 (All amounts in ` lacs, unless otherwise stated)

219
Annual Report2019-2020
Particulars Gratuity Compensated absencesCurrent year Previous
yearCurrent year Previous
yearCost for the period1. Current service cost 33.20 29.82 16.63 14.49 2. Net interest cost 18.09 15.07 4.96 4.40 3. Actuarial loss - - 16.16 12.21 Total amount recognised in profit or loss 51.29 44.89 37.75 31.10 Re-measurements recognised in Other comprehensive income1. Actuarial gain / (loss) on plan assets 0.08 0.39 - - 2. Effect of changes in demographic assumptions (0.12) - - - 3. Effect of changes in financial assumptions 19.28 1.15 - - 4. Effect of experience adjustments (15.05) 1.63 - - Total re-measurements included in Other Comprehensive Income
4.19 3.17 - -
Total amount recognised in Statement of Profit and Loss
55.48 48.06 37.75 31.10
Sensitivity analysis of the defined benefit obligation
The significant actuarial assumption for the determination of defined benefit obligations are discount rate and expected salary increase. The sensitivity analysis below have been determined based on reasonably possible changes of the respective assumptions occurring at the end of reporting period, while holding all other assumptions constant.
Particulars Gratuity Compensated absencesFor the year ended For the year ended
March 31, 2020
March 31, 2019
March 31, 2020
March 31, 2019
Present value of Obligation at the end of the year 286.68 235.50 81.57 64.83 (a) Impact of the change in discount rate(i) Impact due to increase of 0.50% (11.74) (9.65) (4.51) (3.53)(ii) Impact due to decrease of 0.50% 12.67 10.39 4.91 3.83 (b) Impact of the change in salary increase(i) Impact due to increase of 0.50% 12.71 10.50 4.92 3.88 (ii) Impact due to decrease of 0.50% (11.88) (9.85) (4.56) (3.59)
Note 44 - Disclosure as per Section 186(4) of the Companies Act, 2013
Particulars March 31, 2020 March 31, 2019Amount
outstandingMaximum amount
outstanding during the year
Amount outstanding
Maximum amount outstanding during
the year
Investment in associate:Pearl Landcon Private Limited 0.50 0.50 0.50 0.50
Summary of the significant accounting policies and other explanatory information (Contd.)For the year ended March 31, 2020 (All amounts in ` lacs, unless otherwise stated)

220
Corporate Overview Statutory Reports Financial Statements
Note 45 - Segment information
Operating segments and principal activities:
Based on the guiding principles given in Ind AS - 108 ‘Operating segments’, the Board of Director of the Group is the Chief Operating Decision Maker (CODM) and for the purposes of resource allocation and assessment of segment performance the business of the Group is segregated in the segments below:
i) Lead processing
ii) Aluminium processing
iii) Turn-key solutions
iv) Plastic manufacturing
Lead processing includes smelting of lead battery scrap / Lead concentrate to produce secondary Lead metal, which is further transformed into Pure Lead, Specific Lead Alloy, Lead Oxides (Lead sub-oxide, Red Lead, and Litharge) and Lead products like Lead sheets, Lead powder, Lead shot etc.
In current year, Group has elected to change the composition of reportable segment to include Plastic as separate segment, therefore corresponding figures related to earlier periods have also been disclosed as per revised composition of reportable segment.
Aluminium processing includes trading of Taint Tabor and Tense aluminium scraps manufacturing of alloy from melting of aluminium scrap.
Turn key solution includes, complete supply of plant and machinery related to lead manufacturing plant. Further, since carton trading does not amounts to primary business activities, hence the same has been clubbed in others in segment reporting.
Segment revenue and results include the respective amounts identifiable to each of the segments. Other unallowable expenditure includes expenses incurred on finance cost, which are not directly identifiable to segments.
In addition to the significant accounting policies applicable to the business segments as set out in note 1, the accounting policies in relation to segment accounting are as under:
(a) Segment revenue and expenses:
Joint revenue and expenses of segments are allocated amongst them on a reasonable basis. All other segment revenue and expenses are directly attributable to the segments.
(b) Segment assets and liabilities:
Segment assets include all operating assets used by a segment and consist principally of operating cash, trade receivables, inventories and property, plant and equipment, net of allowances and provisions, which are reported as direct offsets in the balance sheet. Segment liabilities include all operating liabilities and consist principally of creditors and accrued liabilities and do not include deferred income taxes.
Geographical segments:
Information reported to the chief operating decision maker (CODM) for the purposes of resource allocation is mainly for two locations; (A) India (country of domicile) and (B) other than India (all countries other than India is considered by CODM as one geographical area).
The Group’s revenue from continuing operations from external customers by location of operations and information about its non-current assets* by location of assets has been given below:
*Non-current assets other than financial instruments, deferred tax assets, post-employment benefit assets, and rights arising under insurance contracts (i) located in the entity’s country of domicile and (ii) located in all foreign countries in total in which the entity holds assets.
Summary of the significant accounting policies and other explanatory information (Contd.)For the year ended March 31, 2020 (All amounts in ` lacs, unless otherwise stated)

221
Annual Report2019-2020
(i) Segment revenue and results
Particulars For the Year ended March 31, 2020
For the Year ended March 31, 2019
RevenueSegment revenue*Lead 119,915.59 105,697.05 Aluminium 8,045.86 11,269.40 Turnkey projects 985.18 1,759.17 Plastics 5,641.74 5,033.05 Others 191.66 414.16
Total 134,780.03 124,172.83 ResultsSegment results profit/(loss)
Lead 9,182.51 5,899.99 Aluminium 689.03 598.60 Turnkey projects 121.95 658.69 Plastics (346.77) (167.32)Others (18.24) (28.58)
Total Operating Profit 9,628.48 6,961.38 Less: Unallocated income/ expenses
Finance costs 2,817.23 2,299.99 Other income (99.42) (238.81)Other expenses 1,693.69 1,940.79 Share of loss of an associate 0.96 1.36 Exceptional item 522.94 -
Profit before tax 4,693.08 2,958.05 Less: Tax expenses 1,034.92 1,019.12 Profit after tax 3,658.16 1,938.93
* Segment revenue reported above represents revenue generated from external customers.
(ii) Other Information
Particulars As atMarch 31, 2020
As atMarch 31, 2019
Segment assetsLead 41,608.98 33,583.26 Aluminium 3,771.03 7,109.42 Turnkey projects 2,493.00 2,672.19 Plastics 4,589.79 4,574.29 Others 325.62 16.72
52,788.42 47,955.88 Unallocated assets 8,607.30 9,297.49
Total Assets 61,395.72 57,253.37 Segment Liabilities
Lead 9,598.70 10,886.78 Aluminium 361.75 707.08 Turnkey projects 142.32 264.59 Plastics 477.82 267.10 Others 22.51 112.56
10,603.10 12,238.11 Unallocated liabilities 27,754.50 24,616.44
Total Liabilities 38,357.60 36,854.55
Summary of the significant accounting policies and other explanatory information (Contd.)For the year ended March 31, 2020 (All amounts in ` lacs, unless otherwise stated)

222
Corporate Overview Statutory Reports Financial Statements
(iii) Additional information by geographies
(a) Revenue by geographical market
Particulars For the Year ended March 31, 2020
For the Year ended March 31, 2019
Within India 124,405.66 110,749.44
Outside India 10,374.37 13,423.39
Total 134,780.03 124,172.83
(b) Non-current assets by geographical market
Particulars As atMarch 31, 2020
As atMarch 31, 2019
Within India 13,205.01 13,685.64 Outside India 7,179.52 6,610.75
Total 20,384.53 20,296.39
(iv) Information about major customers
Sales of ` 26,053 lacs (March 31, 2019: ` 18,005 lacs), included in total Revenue, which arose from sales to the Group’s largest customers. No other single customers contributed 10% or more to the Group’s revenue in current year 2019-20 and previous year 2018-19.
Note 46 - Additional information as required by Paragraph 2 of the General Instructions for Preparation of Consolidated Financial Statements to Schedule III to the Companies Act, 2013
(I) Details of subsidiaries and associates
(a) Subsidiaries
Name of entity Country of incorporation
% of Holding as at March 31, 2020
% of Holding as at March 31, 2019
Gravita Infotech Limited India 100.00 100.00Noble Buildestate Private Limited India 100.00 100.00Gravita Ghana Limited Ghana 100.00 100.00Gravita Global Pte Limited Singapore 100.00 100.00Gravita Mozambique LDA Mozambique 100.00 100.00Navam Lanka Limited Srilanka 52.00 52.00Gravita Netherlands BV Netherlands 100.00 100.00Gravita Senegal SAU Senegal 100.00 100.00Gravita Nicaragua SA Nicaragua 100.00 100.00Gravita Jamaica Limited Jamaica 100.00 100.00Gravita Ventures Limited Tanzania 100.00 100.00Gravita USA Inc. USA 100.00 100.00Gravita Mali SA Mali 100.00 100.00Recyclers Gravita Costa Rica SA Costa Rica 100.00 100.00Gravita Tanzania Limited Tanzania 100.00 100.00Recyclers Ghana Limited Ghana 100.00 100.00Mozambique Recyclers LDA Mozambique 100.00 100.00Gravita Dominican SAS Dominican Republic 100.00 100.00Gravita Peru SAC Peru 100.00 100.00Gravita Cameroon Limited (upto February 25, 2020) Cameroon - 100.00Met Mauritania Recycling SARL (upto July 3, 2019) Mauritania - 100.00
Summary of the significant accounting policies and other explanatory information (Contd.)For the year ended March 31, 2020 (All amounts in ` lacs, unless otherwise stated)
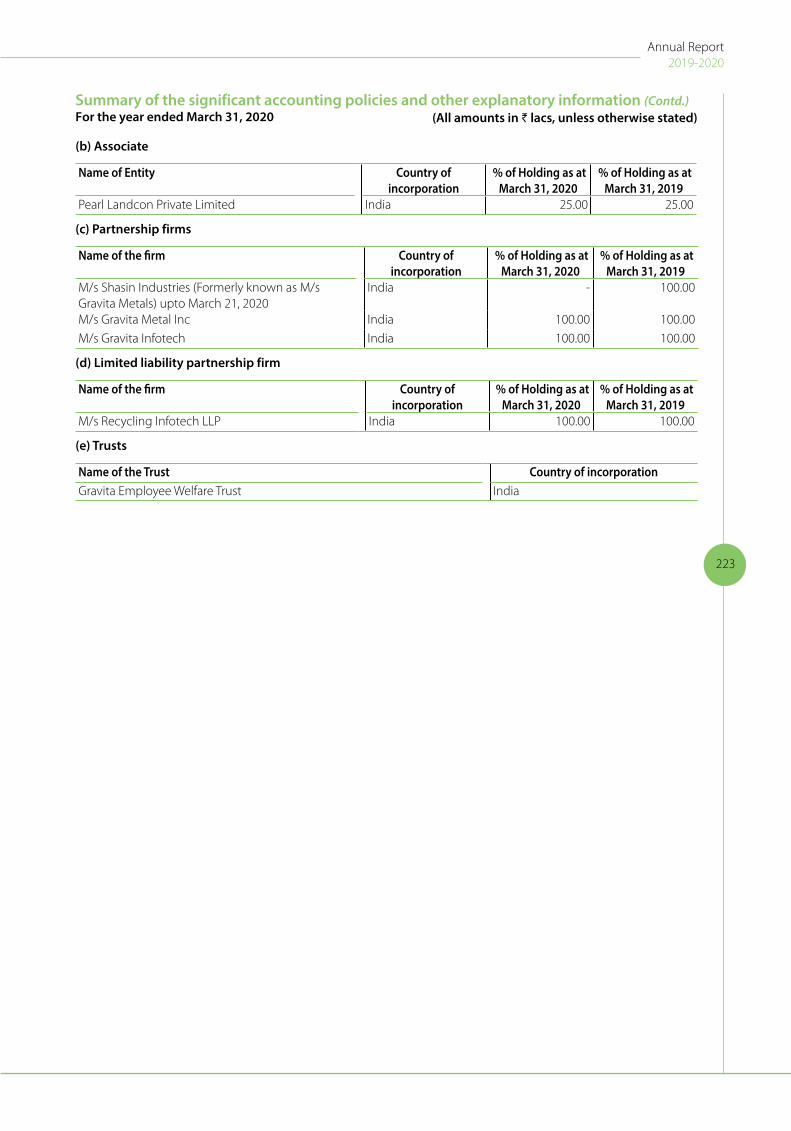
223
Annual Report2019-2020
(b) Associate
Name of Entity Country of incorporation
% of Holding as at March 31, 2020
% of Holding as at March 31, 2019
Pearl Landcon Private Limited India 25.00 25.00
(c) Partnership firms
Name of the firm Country of incorporation
% of Holding as at March 31, 2020
% of Holding as at March 31, 2019
M/s Shasin Industries (Formerly known as M/s Gravita Metals) upto March 21, 2020
India - 100.00
M/s Gravita Metal Inc India 100.00 100.00
M/s Gravita Infotech India 100.00 100.00
(d) Limited liability partnership firm
Name of the firm Country of incorporation
% of Holding as at March 31, 2020
% of Holding as at March 31, 2019
M/s Recycling Infotech LLP India 100.00 100.00
(e) Trusts
Name of the Trust Country of incorporationGravita Employee Welfare Trust India
Summary of the significant accounting policies and other explanatory information (Contd.)For the year ended March 31, 2020 (All amounts in ` lacs, unless otherwise stated)

224
Corporate Overview Statutory Reports Financial Statements
(II) Information about standalone subsidiaries/ entities consolidated
(i) For financial year 2019-20
Name of the entity Net assets (total asset less total
liabilities)
Share of profit or loss Share of OCI
Total comprehensive
incomeAs % of
totalAmount As % of
totalAmount As % of
totalAmount As % of
totalAmount
ParentGravita India Limited 72.90% 16,415.18 67.59% 2,243.15 (26.04%) (55.06) 61.98% 2,188.09
SubsidiariesIndian subsidiaries (including partnership firms and trust)Gravita Infotech Limited 1.13% 253.72 (0.57%) (18.87) - - (0.53%) (18.87)
M/s Gravita Infotech 0.03% 7.63 (0.03%) (1.09) - - (0.03%) (1.09)
Noble Buildestate Private Limited (0.69%) (156.48) (1.22%) (40.43) - - (1.15%) (40.43)
M/s Shasin Industries (Formerly known as M/s Gravita Metals) upto March 21, 2020
- - (1.97%) (65.47) - - (1.85%) (65.47)
M/s Gravita Metal Inc. 2.93% 658.70 2.42% 80.34 (0.17%) (0.35) 2.27% 79.99
M/s Recycling infotech LLP - 0.28 - (0.11) - - - (0.11)
Gravita Employee Welfare Trust (0.19%) (43.24) (0.71%) (23.51) - - (0.67%) (23.51)
Foreign subsidiariesGravita Ghana Limited 0.35% 79.03 (4.02%) (133.58) 9.71% 20.52 (3.2%) (113.06)
Gravita Netherlands BV 18.79% 4,232.12 11.19% 371.32 35.04% 74.08 12.62% 445.40
Gravita global Pte Limited 4.33% 973.96 (0.43%) (14.28) 7.31% 15.46 0.03% 1.18
Gravita Senegal SAU 7.89% 1,777.41 22.47% 745.87 33.36% 70.52 23.13% 816.39
Gravita Mali SA (1.04%) (234.54) (7.08%) (235.12) (5.4%) (11.41) (6.98%) (246.53)
Gravita Nicaragua SA (0.33%) (73.67) (8.09%) (268.51) 2.3% 4.87 (7.47%) (263.64)
MET Mauritania SARL (upto July 3, 2019) - - - - - - - -
Navam Lanka Limited 4.81% 1,083.27 21.28% 706.24 (0.22%) (0.46) 19.99% 705.78
Gravita Mozambique LDA 16.91% 3,806.82 23.34% 774.73 52.09% 110.12 25.06% 884.85
Gravita USA Inc 1.66% 373.19 4.45% 147.65 (7.4%) (15.65) 3.74% 132.00
Gravita Jamaica Limited (1.33%) (298.61) (5.12%) (169.88) (9.24%) (19.54) (5.37%) (189.42)
Gravita Ventures Limited (0.41%) (91.92) (0.77%) (25.61) (5.31%) (11.23) (1.04%) (36.84)
Gravita Cameroon Limited (upto February 25, 2020)
- - - - 1.28% 2.71 0.08% 2.71
Recyclers Gravita Costa Rica SA (0.83%) (186.08) (2.2%) (73.12) (7.6%) (16.07) (2.53%) (89.19)
Gravita Tanzania Limited 4.02% 905.97 23.33% 774.26 (21.41%) (45.26) 20.65% 729.00
Recyclers Ghana Limited 0.75% 168.82 (6.5%) (215.81) (30.79%) (65.10) (7.96%) (280.91)
Mozambique Recyclers LDA (0.25%) (57.34) (1.14%) (37.75) (1.58%) (3.35) (1.16%) (41.10)
Gravita Dominican SAS (0.1%) (21.84) (1.53%) (50.90) (0.33%) (0.70) (1.46%) (51.60)
Gravita Peru SAC 0.03% 7.10 - - 0.15% 0.32 0.01% 0.32
29,579.48 4,469.52 54.42 4,523.94 Adjustments arising out of consolidation (31.36%) (7,061.29) (34.67%) (1,150.61) 74.26% 157.00 (28.14%) (993.61)
Total (A) 100% 22,518.19 100% 3,318.91 100% 211.42 100% 3,530.33 Non-controlling interestsNavam Lanka Limited 519.93 340.21 (0.22) 339.99
Total (B) 519.93 340.21 (0.22) 339.99 AssociatesPearl Landcon Private Limited (0.96) - (0.96)
Total (C) (0.96) - (0.96)Total (A + B + C) 23,038.12 3,658.16 211.20 3,869.36
Summary of the significant accounting policies and other explanatory information (Contd.)For the year ended March 31, 2020 (All amounts in ` lacs, unless otherwise stated)

225
Annual Report2019-2020
(ii) For financial year 2018-19
Name of the entity Net assets Share of profit or loss
Share of OCI Total comprehensive income
As % of total
Amount As % of total
Amount As % of total
Amount As % of total
Amount
ParentGravita India Limited 74.96% 14,940.80 122.23% 1,895.29 (2.89%) (2.05) 116.75% 1,893.24
SubsidiariesIndian subsidiaries (including partnership firms and trust)Gravita Infotech Limited 1.39% 276.40 (1.02%) (15.74) - - (0.97%) (15.74)
M/s Gravita Infotech 0.05% 9.40 (.06%) (0.91) - - (0.06%) (0.91)
Noble Buildestate Private Limited (0.58%) (116.05) (.93%) (14.40) - - (0.89%) (14.40)
M/s Shasin Industries (Formerly known as M/s Gravita Metals) upto March 21, 2020
3.31% 660.17 (3.82%) (59.24) - - (3.65%) (59.24)
M/s Gravita Metal Inc. 3.81% 759.04 13.77% 213.59 0.42% 0.30 13.19% 213.89
M/s Recycling infotech LLP - 0.18 0.01% 0.21 - - 0.01% 0.21
Gravita Employee Welfare Trust (0.10%) (19.73) (1.04%) (16.20) - - (1.00%) (16.20)
Foreign subsidiariesGravita Ghana Limited 0.91% 181.07 (17.74%) (275.12) 107.30% 76.17 (12.27%) (198.95)
Gravita Netherlands BV 19.00% 3,786.73 42.52% 659.24 86.52% 61.42 44.44% 720.66
Gravita global Pte Limited 4.88% 972.79 (0.45%) (6.96) 16.34% 11.60 0.29% 4.64
Gravita Senegal SAU 6.83% 1,360.67 47.59% 737.85 (72.46%) (51.44) 42.33% 686.41
Gravita Mali SA 0.06% 12.00 0.00% - (2.54%) (1.80) (0.11%) (1.80)
Gravita Nicaragua SA 1.04% 207.25 (4.79%) (74.25) (18.34%) (13.02) (5.38%) (87.27)
MET Mauritania SARL (upto July 3, 2019)
(0.29%) (58.66) (4.09%) (63.43) 4.13% 2.93 (3.73%) (60.50)
Navam Lanka Limited 4.97% 989.78 52.36% 811.88 (42.20%) (29.96) 48.22% 781.92
Gravita Mozambique LDA 14.08% 2,807.20 40.40% 626.42 13.96% 9.91 39.24% 636.33
Gravita USA Inc 1.10% 219.42 2.24% 34.75 15.07% 10.70 2.80% 45.45
Gravita Jamaica Limited (0.55%) (109.19) (12.37%) (191.85) (14.51%) (10.30) (12.47%) (202.15)
Gravita Ventures Limited (0.28%) (55.09) 0.42% 6.48 (3.11%) (2.21) 0.26% 4.27
Gravita Cameroon Limited (upto February 25, 2020)
0.35% 69.48 - - (4.00%) (2.84) (0.18%) (2.84)
Recyclers Gravita Costa Rica SA (0.49%) (96.90) (11.30%) (175.22) 6.35% 4.51 (10.53%) (170.71)
Gravita Tanzania Limited 0.89% 176.97 - - (8.73%) (6.20) (0.38%) (6.20)
Recyclers Ghana Limited 2.26% 449.73 - - (55.60%) (39.47) (2.43%) (39.47)
Mozambique Recyclers LDA (0.06%) (12.77) (1.58%) (24.57) 7.58% 5.38 (1.18%) (19.19)
Gravita Dominician SAS 0.06% 12.41 - - (0.39%) (0.28) (0.02%) (0.28)
Gravita Peru SAC 0.03% 6.78 - - (0.79%) (0.56) (0.03%) (0.56)
27,429.88 4,067.82 22.79 4,090.61 Adjustments arising out of consolidation
(37.63%) (7,497.80) (162.34%) (2,517.23) 0.68% 48.20 (152.26%) (2,469.03)
Total (A) 100% 19,932.08 100% 1,550.59 100% 70.99 100% 1,621.58 Non-controlling interestsNavam Lanka Limited 466.74 389.70 (14.38) 375.32
Total (B) 466.74 389.70 (14.38) 375.32 AssociatePearl Landcon Private Limited (1.36) - (1.36)
Total (C) (1.36) - (1.36)Total (A + B + C) 20,398.82 1,938.93 56.61 1,995.54
Summary of the significant accounting policies and other explanatory information (Contd.)For the year ended March 31, 2020 (All amounts in ` lacs, unless otherwise stated)
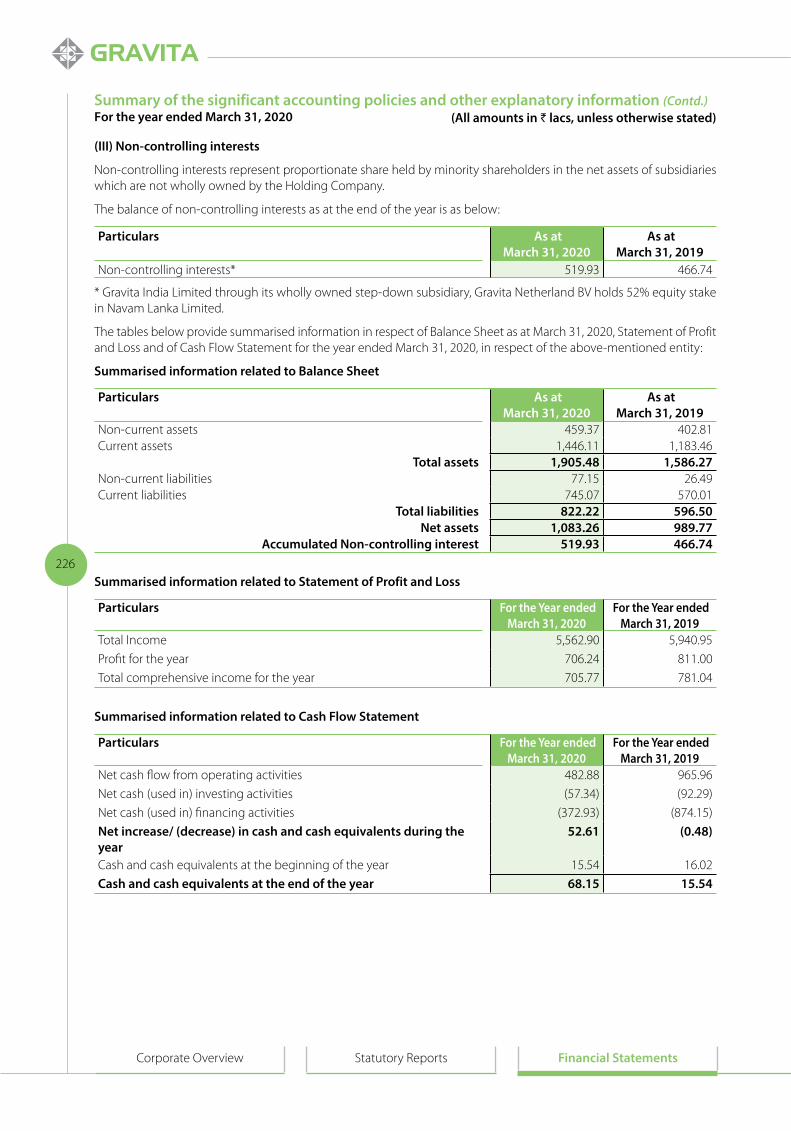
226
Corporate Overview Statutory Reports Financial Statements
(III) Non-controlling interests
Non-controlling interests represent proportionate share held by minority shareholders in the net assets of subsidiaries which are not wholly owned by the Holding Company.
The balance of non-controlling interests as at the end of the year is as below:
Particulars As atMarch 31, 2020
As atMarch 31, 2019
Non-controlling interests* 519.93 466.74
* Gravita India Limited through its wholly owned step-down subsidiary, Gravita Netherland BV holds 52% equity stake in Navam Lanka Limited.
The tables below provide summarised information in respect of Balance Sheet as at March 31, 2020, Statement of Profit and Loss and of Cash Flow Statement for the year ended March 31, 2020, in respect of the above-mentioned entity:
Summarised information related to Balance Sheet
Particulars As atMarch 31, 2020
As atMarch 31, 2019
Non-current assets 459.37 402.81 Current assets 1,446.11 1,183.46
Total assets 1,905.48 1,586.27 Non-current liabilities 77.15 26.49 Current liabilities 745.07 570.01
Total liabilities 822.22 596.50 Net assets 1,083.26 989.77
Accumulated Non-controlling interest 519.93 466.74
Summarised information related to Statement of Profit and Loss
Particulars For the Year ended March 31, 2020
For the Year ended March 31, 2019
Total Income 5,562.90 5,940.95
Profit for the year 706.24 811.00
Total comprehensive income for the year 705.77 781.04
Summarised information related to Cash Flow Statement
Particulars For the Year ended March 31, 2020
For the Year ended March 31, 2019
Net cash flow from operating activities 482.88 965.96
Net cash (used in) investing activities (57.34) (92.29)
Net cash (used in) financing activities (372.93) (874.15)
Net increase/ (decrease) in cash and cash equivalents during the year
52.61 (0.48)
Cash and cash equivalents at the beginning of the year 15.54 16.02
Cash and cash equivalents at the end of the year 68.15 15.54
Summary of the significant accounting policies and other explanatory information (Contd.)For the year ended March 31, 2020 (All amounts in ` lacs, unless otherwise stated)
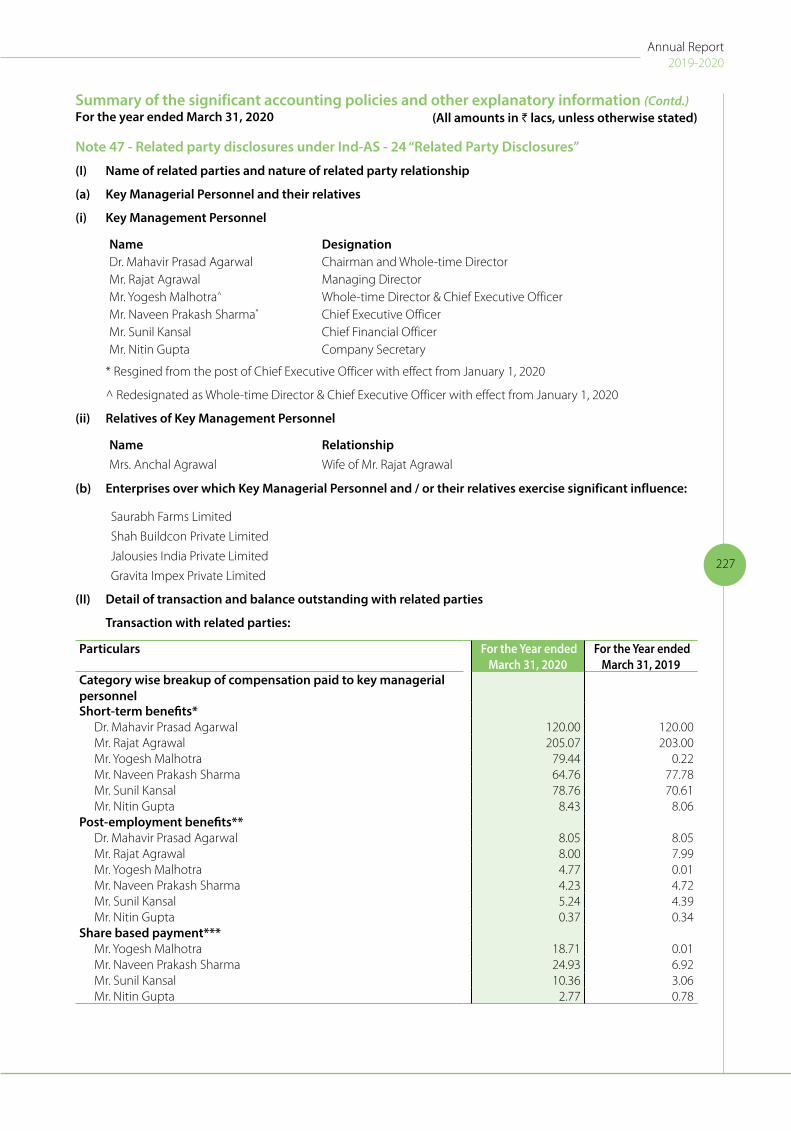
227
Annual Report2019-2020
Note 47 - Related party disclosures under Ind-AS - 24 “Related Party Disclosures”
(I) Name of related parties and nature of related party relationship
(a) Key Managerial Personnel and their relatives
(i) Key Management Personnel
Name DesignationDr. Mahavir Prasad Agarwal Chairman and Whole-time DirectorMr. Rajat Agrawal Managing DirectorMr. Yogesh Malhotra^ Whole-time Director & Chief Executive OfficerMr. Naveen Prakash Sharma* Chief Executive OfficerMr. Sunil Kansal Chief Financial OfficerMr. Nitin Gupta Company Secretary
* Resgined from the post of Chief Executive Officer with effect from January 1, 2020
^ Redesignated as Whole-time Director & Chief Executive Officer with effect from January 1, 2020
(ii) Relatives of Key Management Personnel
Name RelationshipMrs. Anchal Agrawal Wife of Mr. Rajat Agrawal
(b) Enterprises over which Key Managerial Personnel and / or their relatives exercise significant influence:
Saurabh Farms Limited
Shah Buildcon Private Limited
Jalousies India Private Limited
Gravita Impex Private Limited
(II) Detail of transaction and balance outstanding with related parties
Transaction with related parties:
Particulars For the Year ended March 31, 2020
For the Year ended March 31, 2019
Category wise breakup of compensation paid to key managerial personnelShort-term benefits*
Dr. Mahavir Prasad Agarwal 120.00 120.00 Mr. Rajat Agrawal 205.07 203.00 Mr. Yogesh Malhotra 79.44 0.22 Mr. Naveen Prakash Sharma 64.76 77.78 Mr. Sunil Kansal 78.76 70.61 Mr. Nitin Gupta 8.43 8.06
Post-employment benefits**Dr. Mahavir Prasad Agarwal 8.05 8.05 Mr. Rajat Agrawal 8.00 7.99 Mr. Yogesh Malhotra 4.77 0.01 Mr. Naveen Prakash Sharma 4.23 4.72 Mr. Sunil Kansal 5.24 4.39 Mr. Nitin Gupta 0.37 0.34
Share based payment***Mr. Yogesh Malhotra 18.71 0.01 Mr. Naveen Prakash Sharma 24.93 6.92 Mr. Sunil Kansal 10.36 3.06 Mr. Nitin Gupta 2.77 0.78
Summary of the significant accounting policies and other explanatory information (Contd.)For the year ended March 31, 2020 (All amounts in ` lacs, unless otherwise stated)

228
Corporate Overview Statutory Reports Financial Statements
Particulars For the Year ended March 31, 2020
For the Year ended March 31, 2019
Rent expensesKey management personnel
Mr. Rajat Agrawal 40.09 37.86 Relatives of key management personnel
Mrs. Anchal Agrawal 6.05 5.74 Enterprises having common key management personnel and/or their relatives
Saurabh Farms Limited 39.26 14.29 Shah Buildcon Private Limited 2.99 2.65 Jalousies India Private Limited 30.63 30.02
* Short-term benefits includes PAT incentive/ performance incentive, which is subject to Performance and target achievement.
** Post-employment benefits does not include provisions for incremental gratuity and compensated absences liabilities, since the provisions are based on actuarial valuations for the Holding Company as a whole.
*** Represent the value of options excercised and regarded as perquisite. However, it does not include the value of unvested options or options vested but not excercised.
Closing balances with related parties:
Particulars As atMarch 31, 2020
As atMarch 31, 2019
Corporate guarantee takenEnterprises having common key management personnel and/or their relatives
Gravita Impex Private Limited 19,415.72 19,619.17 Remuneration payable to Key managerial personnels
Dr. Mahavir Prasad Agrawal 6.33 6.15 Mr. Rajat Agrawal 12.06 11.92 Mr. Yogesh Malhotra 0.50 -Mr. Naveen Prakash Sharma - 0.74 Mr. Sunil kansal 1.85 2.89 Mr. Nitin Gupta 0.59 0.48
(i) Refer note 16(2) for personal guarantee given by Key managerial personnel.
Note 48 - The figures of the previous year have been regrouped/ reclassed to make them comparable with those of current year wherever considered necessary.
Summary of the significant accounting policies and other explanatory information (Contd.)For the year ended March 31, 2020 (All amounts in ` lacs, unless otherwise stated)
For Walker Chandiok & Co. Llp For And On Behalf Of The Board Of DirectorsChartered AccountantsFirm’s Registration No.: 001076N/N500013
Manish Agrawal Rajat Agrawal Yogesh Malhotra Dr. M. P. AgarwalPartner Managing Director Whole Time Director & Ceo ChairmanMembership No: 507000 Din: 00855284 Din: 05332393 Din: 00188179
Sunil Kansal Nitin GuptaDate: June 25, 2020 Chief Financial Officer Company SecretaryPlace : Ghaziabad Place : Jaipur Membership No: Fcs 9984
Transaction with related parties (Contd.)

Corporate Indentification Number (CIN): L29308RJ1992PLC006870
Board of Directors & KMPDr. Mahavir Prasad AgarwalChairman & Whole-time DirectorDIN: 00188179
Rajat AgrawalManaging DirectorDIN: 00855284
Yogesh Malhotra Whole-time Director & CEODIN: 05332393
Dinesh Kumar GovilIndependent DirectorDIN: 02402409
Arun Kumar GuptaIndependent DirectorDIN: 02749451
Chanchal Chadha PhandisIndependent DirectorDIN: 07133840
Sunil KansalChief Financial Officer
Nitin GuptaCompany SecretaryMembership No. : FCS 9984
Senior Management PersonnelVijendra Singh TanwarDirector (New Buisness Development)(Non Board Member)
Vijay Kumar PareekExecutive Director(Non- Board Member )
Naveen Prakash Sharma Executive Director (Non Board Member)
Rajeev SuranaExecutive Director(Non Board Member)
Sandeep ChoudharyVice President, Imports
Sanjay Singh BaidVice President, Plastic Division
Ajay ThapliyalVice President (Projects & HR)
Statutory AuditorsWalker Chandiok & Co. LLP1st Floor, L-41 Connaught Circus New Delhi 110 001, IndiaWebsite: www.walkerchandiok.in
Internal AuditorsM/s S. Bhandari & Co.P-7, Tilak Marg, C-Scheme,Jaipur – 302 005Rajasthan, IndiaWebsite: www.sbhandari.in
Cost AuditorsM/s K. G. Goyal & Associates289, Mahveer Nagar-II,Maharani Farms, DurgapuraJaipur-302018
Registrar & Share Transfer AgentKFin Technologies Private LimitedSelenium Building, Tower-B,Plot No 31 & 32,Financial District,Nanakramguda,Serilingampally, Hyderabad,Rangareddi, TelanganaWebsite: www.kfintech.com
BankersState Bank of IndiaPunjab National BankUCO BankUnion BankCanara BankJammu & Kashmir BankICICI BankBandhan BankTata Capital Financial Services Ltd.Bajaj Finance Ltd.
Corporate Office
402, Gravita Tower , A-27B, Shanti Path,Tilak Nagar, jaipur- 302 004, IndiaPh.No.: +91-141-262366, +91-141-2622697Fax: +91-141-2621491
Registered Office and Works
"Saurabh", Chittora Road, Harsulia Mod,Diggi- Malpura Road, Tehsil Phagi, Jaipur- 303 904Email: [email protected]@gravitaindia.com
Corporate Information
Other Plant Locations
Survey No. 233/15 to 233/30, Tiruthani Road, Village -Ananthapuram-Panchayat Narasingharayani Pettah - Post Chittoor, Andhra Pradesh-517419
Plot No. 322, Mithirohar Industrial Estate, Mithirohar, Taluka Gandhidham - 370205, Gujarat.
Plot No. PA-011-006, Mahindra SEZ, Village Kalwara, Tehsil Sanganer, Distt. Jaipur-302029 Rajasthan, India
Survey No. 43,Near National Highway No. 8a, Patri Gundala Road Village Moje Gundala Taluka Mundra Kutch, Gujarat, 370410
25-26, SICOP Industrial Area, Kathua-184102, Jammu & Kashmir, India

Gravita India Limited‘Saurabh’, Chittora Road, Harsulia Mod, Diggi- Malpura Road,Tehsil- Phagi, Jaipur - 303 904, Rajasthan, IndiaTel: 09928070682