recycling of waste brass and cast iron chips through metal
TRANSCRIPT

American Journal of Engineering Research (AJER) 2018
American Journal of Engineering Research (AJER)
e-ISSN: 2320-0847 p-ISSN : 2320-0936
Volume-7, Issue-5, pp-292-304
www.ajer.org Research Paper Open Access
w w w . a j e r . o r g
Page 292
Recycling Of Waste Brass And Cast Iron Chips Through Metal
Matrix Composite Material Production- Investigation Of
Mechanical Properties
1hakan Burak Karadağ,
2 İbrahim Aslan
1Konya Necmettin Erbakan University, Faculty of Engineeringand Architecture,
MetallurgicalandMaterialsEngineering, 42360, Konya, Turkey 2Konya Necmettin Erbakan University, Institute of Science, MechanicalEngineering, 42360, Konya, Türkiye
Corresponding Author: hakan Burak Karadağ
ABSTRACT:In this study, an alternative method to classical fusion process, which resembles the powder
metallurgy process, was used in recycling of waste metal chips produced abundantly as a result of machining
process. Firstly, ultrasonic cleaning process was carried out in order to grind andsift the waste metal chips and
then remove thedirt and oxides from their surfaces.GGG-40 cast iron chips with three different rates(30%, 40%
and 50%) by weight, were then reinforced into the brass matrix structure. Mixing process was applied for 15
minutes in order to distribute the components in the composite material structure homogeneously. The prepared
matrix-reinforced particles were pressed under 730 MPa pressure at room temperature in a cylindrical mould
and composite materials were produced after the sintering process at 942 ºC in atmosphere controlled furnace.
Compression and hardness test measurements were conducted after the density-porosity measurements of the
produced composite materials. For microstructural characterisation examinations of the composite materials,
optical and scanning electron microscope (SEM) was used in experimental studies. Thus, the effect of
reinforcement ratios on mechanical properties and microstructure of the composite material was investigated
and the produced composite materials were compared with industrial brass CuZn31Si1 alloy.
KEYWORDS –Brass,Metal chips, Metal matrixcomposite, powdermetallurgy, recycling
----------------------------------------------------------------------------------------------------------------------------- ----------
Date of Submission: 27-04-2018 Date of acceptance: 12-05-2018
----------------------------------------------------------------------------------------------------------------------------- ----------
I INTRODUCTION
In recent years, there has been a significant increase in the amount of waste chips produced from
machining process as a result of the mechanisation needincreasing depending on rapid growth in the
manufacturing sector. For this reason, recycling of metal chip wastes is of great importance nowadays due to
raw material and energy cost problems. The efficient recycling of these waste metal chips is very important for
both national economy and environmental reasons[1].The casting method which is one of the mostly used
recycling methods in Turkey and in the world is in the form of re-melting and forming processes of metal chips.
However, recycling the metal chips by melting is not an effective method because of the problems like high
melting losses, high energy cost, high corrosion content and gas emission that affect the environment negatively.
For this reason, studies for more effective recycling of metal chips have continued increasingly[2].
One of the methods that have emerged in recent years as alternative to traditional casting method is the
recyclingof metal particles through compressing and sintering process as similar to powder metallurgy
(PM).Yamanoğlu et al., investigated the effect of nickel addition into the copper and molybdenum alloy PM
steels on wear and mechanical properties of the material. While the porosity ratio varies depending on the nickel
density, hardness value of the material increases with the increasing nickel content[3]. Chen et al., investigated
the mechanical properties with addition of Zn into W-Cu composite material produced at low temperature by
using PM method.They emphasised that the Zn addition increased the material hardness and bending strength
values of the composite material and thus Zn addition was effective in terms of mechanical properties of the
material[4]. Hakan et al., investigated the effects of pressing and sintering on pore morphology and material
hardness in AA 2014 aluminium alloy by using the powder metallurgy method. They stated that the increased
sintering temperature increased porosity and made the pore shape irregular in the aluminiumalloy [5].By using

American Journal of Engineering Research (AJER) 2018
w w w . a j e r . o r g
Page 293
powder metallurgy method, it is aimed to produce metal matrix composite (MMC) materialshaving the desired
microstructure and mechanical properties in a very economical way due to the use of waste chips. Another
advantage of this method compared to the conventional casting method is that it is possible to combine
dissimilar metallic materials, which it is not possible to melt-alloy in the same pot, at macro level and to produce
porous MMC material when necessary. Owing to the porous structure of the composite materials produced by
using this method, it becomes possible to produce materials with superior tribological properties by means of the
impact absorbing material and solid lubricants which can be included into that material[6, 7].Pepelnjak et al.,
investigated the recycling of waste AlMgSi1 aluminium chips produced from machining process by using solid
state method. They stated that the shapes, dimensions, and especially fineness of the chips after the cold
pressing process were important for the end product[8]. Karadağ produced composite materials after cold
pressing and sintering by preparing waste steel and bronze chips, obtained as a result of machining process, in
different rates. Thus, he expressed that composite materials had more tough and ductile values compared to
industrially used mill CuSn10 bronze [9]. Aslanet al., produced MMC samples with hot pressing from waste
bronze and cast iron chips obtained from machining process. They explained that the MMC samples were more
strength and porous than pure CuSn10 bronze in terms of their microstructure and mechanical properties[10].
In the scope of this study, metal matrix composite materials were produced by mixing the chips of
waste brass and cast iron with spherical graphite in three rates by weight. The mechanical properties of the
produced MMC materials were investigated in accordance with ASTM (American Society for Testing and
Materials) standards. In addition, the mechanical properties of composite materials were compared with each
other and with the cast brass material which has widespread use in the industry.
II EXPERIMENTAL STUDIES
In this study, CuZn31Si1 brassand GGG-40 cast iron chips used as starting materials were obtained as a result of
machining cylindrical samples, produced by casting method, on a lathe.Figure 1 shows the images of the
obtained CuZn31Si1 brassand GGG-40 cast iron chips.
Figure 1.Images of starting chip materials; (a)CuZn31Si1-brassand(b)GGG-40 cast iron
It is known that the CuZn31Si1 starting material is used as a bearing element in the industry due to its
tribological properties. The reason for choosing CuZn31Si1 material is its high load strength. The chip type of
the material is continuous (Figure 1-a). It is known that GGG-40 material is used as a bearing elementin the
industry since it has satisfactory tribological properties due to the graphite carrying solid lubricant property. The
chip type of GGG-40 material is discontinuous (Figure 1-b).
Table1. Sieve analyses of CuZn31Si1 brassand GGG-40 starting chips

American Journal of Engineering Research (AJER) 2018
w w w . a j e r . o r g
Page 294
Table2.Chemical composition of CuZn31Si1 brassand GGG-40 materials (% by weight)
In order to bring the starting metal chips into the desired size range, they were milled in disc mill and
size distribution was determined by sieve analysis (Table 1). Additionally,Table 2 shows the chemical
compositions of the starting chip materials used in the production of metal matrix composite materials.
Ultrasonic cleaning process was performed to the brass and cast iron chips used as the starting material in the
first stage of producing metal matrix composite materials in order to remove the oil, dirt, and oxide layers on
their surfaces.Subsequently, the structure was prepared in the rates of 50 wt.% brass-50 wt.% cast iron, 60 wt.%
brass-40 wt.% cast iron and 70 wt.% brass- 30 wt.% cast iron and the production of composite materials was
performed in three rates. Table 3 shows the prepared mixture rates and the coding of the samples. The prepared
starting mixtures were held in saturated boric acid-ethyl alcohol mixture for 1 hour and placed in the furnace at
80°C and the ethyl alcohol was evaporated.
Table 3. Mixturerates of the composite material and coding of the samples
The amount of boric acid compound which precipitated/crystallized again on the metal chips was
measured with the help of a sensitive scale and was determined to represent 1% of the total mixture by weight.
Boric acid compound known to be used widely as flux in soldering process was used in this study for the same
purpose [11]. In this way, the negative effect of the metal oxides found on the metal chip surfaces on sintering
process was tried to be minimized. The metal components in the composition were then mixed in a cylindrical
mixer to get a homogeneous distributionwithin the structure. After this process, the mixtures prepared in three
different rates by weight were pressed under 730 MPa pressure at room temperature. The test samples were
prepared in ASTM (E9-89a) standard dimensions (Ø13-h25 mm).Figure 2 showsthe production process of
MMCmaterial after the pressing process and the prepared mixture.
Figure 2. Production process ofcomposite material; (a)Powder mixtures, (b)Compression sample sizes,
(c)Test samples after pressing
American Journal of Engineering Research (AJER) 2018
w w w . a j e r . o r g
Page 295
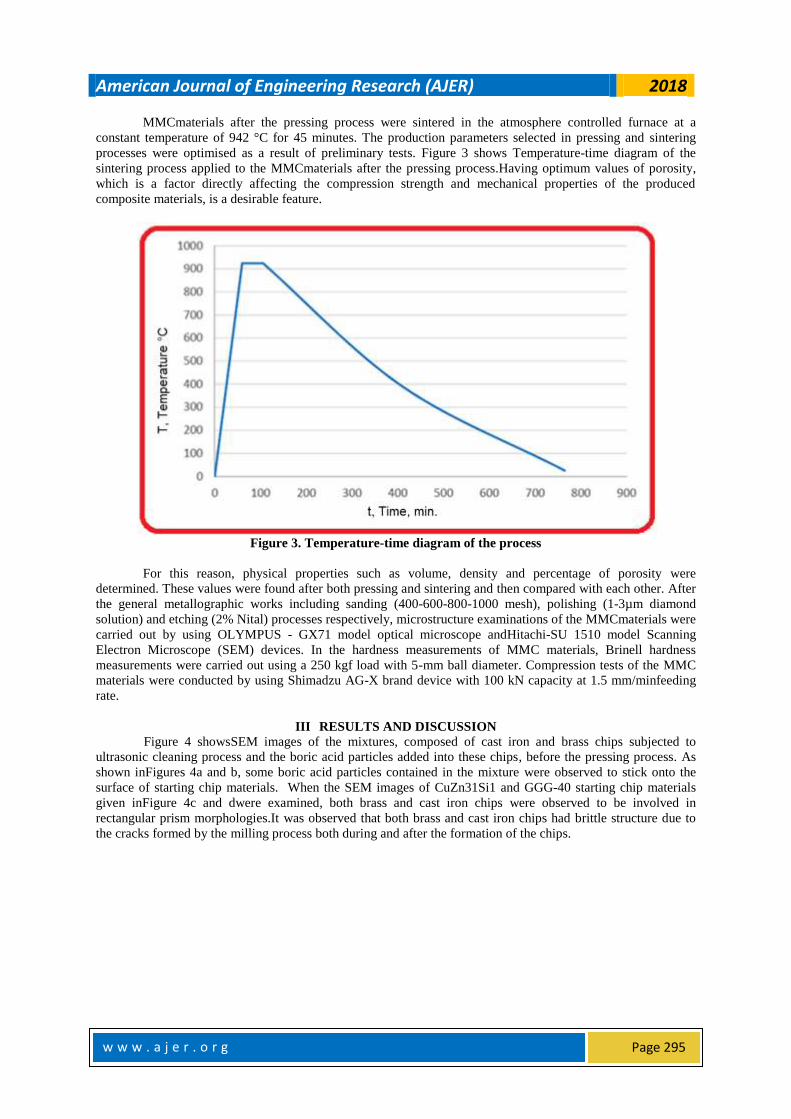
MMCmaterials after the pressing process were sintered in the atmosphere controlled furnace at a
constant temperature of 942 °C for 45 minutes. The production parameters selected in pressing and sintering
processes were optimised as a result of preliminary tests. Figure 3 shows Temperature-time diagram of the
sintering process applied to the MMCmaterials after the pressing process.Having optimum values of porosity,
which is a factor directly affecting the compression strength and mechanical properties of the produced
composite materials, is a desirable feature.
Figure 3. Temperature-time diagram of the process
For this reason, physical properties such as volume, density and percentage of porosity were
determined. These values were found after both pressing and sintering and then compared with each other. After
the general metallographic works including sanding (400-600-800-1000 mesh), polishing (1-3µm diamond
solution) and etching (2% Nital) processes respectively, microstructure examinations of the MMCmaterials were
carried out by using OLYMPUS - GX71 model optical microscope andHitachi-SU 1510 model Scanning
Electron Microscope (SEM) devices. In the hardness measurements of MMC materials, Brinell hardness
measurements were carried out using a 250 kgf load with 5-mm ball diameter. Compression tests of the MMC
materials were conducted by using Shimadzu AG-X brand device with 100 kN capacity at 1.5 mm/minfeeding
rate.
III RESULTS AND DISCUSSION
Figure 4 showsSEM images of the mixtures, composed of cast iron and brass chips subjected to
ultrasonic cleaning process and the boric acid particles added into these chips, before the pressing process. As
shown inFigures 4a and b, some boric acid particles contained in the mixture were observed to stick onto the
surface of starting chip materials. When the SEM images of CuZn31Si1 and GGG-40 starting chip materials
given inFigure 4c and dwere examined, both brass and cast iron chips were observed to be involved in
rectangular prism morphologies.It was observed that both brass and cast iron chips had brittle structure due to
the cracks formed by the milling process both during and after the formation of the chips.

American Journal of Engineering Research (AJER) 2018
w w w . a j e r . o r g
Page 296
Figure 4. SEM images of the starting chip materials;
(a)and(b)Matrix-reinforcement mixture, (c) CuZn31Si1, (d)GGG-40
In this study, the densities of the composite materials in three different rates were calculated before and
after the theoretical sintering in order to find the porosity rates, which affect directly the mechanical properties
and are a physical property, and the obtained values were given in Figure 5. It was found that the material with
the highest experimental density was p70d30 and the material with the lowest density was p50d50 in the
composite materials. Figure 6 showsthe total porosity percentages by volume of the composite materials found
before and after the sintering process. Among the composite materials, it was found that the sample having the
highest total porosity rate after the pressing processwas p50d50 with the rate of 28.51% and the sample with the
lowest total porosity ratio was p70d30 with the rate of 21.3%. It was found that the material having the highest
total porosity rate after the sintering process was p50d50 with the rate of 29.55% and the sample having the
lowest total porosity rate is p70d30 with the rate of 23.29%. The densities of all the produced composite
materials decreased after the sintering process compared to values obtained after the pressing process.
Figure 5.Density values of the produced composite materials

American Journal of Engineering Research (AJER) 2018
w w w . a j e r . o r g
Page 297
Figure 6.Total porosity values of the produced composite materials
The samplewith the highest increase in total porosity ratewas p70d30 with the rate of 9.34%. On the
other hand, the sample with the lowest increase in total porosity rate was p50d50 sample with the rate of 3.64%
(Figure 6). Swelling event can occur as a result of the separation of cast iron particles by the penetration of
copper found inthe brass from the components forming the composite materials into those particles during the
sintering process [12]. Thus, copper metals caused the separation of cast iron particles more in the composite
samples with higher brass ratio. Thus, this led post-sintering porosity rate to increase more compared to the
porosity ratio after the pressing.
Figure 7 shows the images of the fracture surfaces of the metal matrix composite materials after the
compression test. As a result of the compression tests, all composite samples showed ductile behaviour and a
fracture was observed in the direction of 45° which had the highest shear stress. In addition, barrelling was not
observed in the samples during the compression test. Components initially found in the structure showed
resistance to the force applied to the composite materials during the compression test. As the applied force
increased, the plastic deformation started in the material when the sliding movement started in the brass
component which was more ductile than the cast iron. In the meantime, the pores began to close and the
majority of these pores were then closed as the force increased to high levels.
Figure 7.The fracture surfaces of the produced composite materials
When the applied load reached the maximum point, the cast iron particles in the structure which are
harder and higher strength compared to brass were cracked and crushed, the sliding movement continued in
brass component, which is more ductile than the cast iron, and finally the fracture occurred in the composite
material in the direction of 45°which is the highest shear stress angle. Such occurrence of the fracture
strengthened the idea that the pores and components in the structure were homogeneously distributed. After the
applied compression test, the actual and engineering stress-deformation data of the produced metal matrix
composite materials compared to CuZn31Si1 brass material are shown in Figure 8. According to the
compression test results, it was observed that the actual stress-deformation values of all materials were higher
than the engineering stress-deformation values as a result of the compression test(Figure 8).After the
compression test applied to the materials(Figure 8), the material having the highest compressive strength (623
MPa) and the lowest unit deformation value (0.17%) compared to the composite materials was found as

American Journal of Engineering Research (AJER) 2018
w w w . a j e r . o r g
Page 298
CuZn31Si1. Among the composite materials, p70d30 material was determined to present the highest
compressive strength as 180 MPa.
Figure 8.Compressive test results of the materials
It was determined that compressive strength of this material was as much as 28.9% of CuZn31Si1
material and the most ductile material among the composite materials was p70d30 (0.39%). The lowest
compressive strength among the composite materials was determined as 134 MPa in p50d50 material.
Compressive strength of P60d40 material with 155 MPa compressive strength was 24.8% of the compression
strength and had 0.31% actual deformation value compared to CuZn31Si1. With the increase of CuZn31Si1
ratio in composite materials, compressive strength value and deformation values of the sample were found to
increase. This was thought to be caused by the fact that the brass used as the filler material in the structure acted
like a matrix as desired and an effective combination was obtained with the cast iron as the brass ratio increased
in the mixture. After the compression test data obtained from Figure 8, the comparative yield strength values of
the CuZn31Si1 brass and produced composite materials are given in Figure 9.According to the obtained results,
the material having the highest yield strength was CuZn31Si1 with 429 MPa value. In p70d30, p60d40,and
p50d50 metal matrix composite materials, decreasing yield strength values were determined as 95.9, 78.5,and
58.8 MPa, respectively.

American Journal of Engineering Research (AJER) 2018
w w w . a j e r . o r g
Page 299
Figure 9.The yield strength values of the test samples
This can be stated as the increase of material yield strength of brass ratio increasing in the composite
materials. In addition, it was also caused by the fact that the brass component involved as matrix format inside
the composite body surrounded the cast iron particles better compared to the other rates and minimised the
possibility of cast iron particles to be adjacent to each other. The resilience value refers to the energy stored
during the elastic deformation of the material [13]. Figure 10 shows the resilience value obtained in the
compression test and it was found that CuZn31Si1 matrix component produced by casting method had the
highest resilience value with the value of 7.65 J/mm3. The highest resilience among the composite materials was
found in p70d30 material with the value of 2.64 J/mm3and this value was found to be 34.7% of CuZn31Si1
material. The resilience results obtained from compression test showed that the resilience value decreased as the
cast iron ratio in the composite materials increased. This can be explained by the fact that the cast iron particles
are more strongly surrounded by the matrix by increasing ratio brass in matrix form in the structure. The fact
that all cast iron particles in the structure of p50d50 material having the richest cast iron component cannot be
surrounded by the matrix, thus the weakest ring of the composite material, namely cost iron particles in contact
with each other was thought to cause a decrease in resilience values as in other mechanical properties.
Figure 10.Resilience values of the materials
American Journal of Engineering Research (AJER) 2018
w w w . a j e r . o r g
Page 300
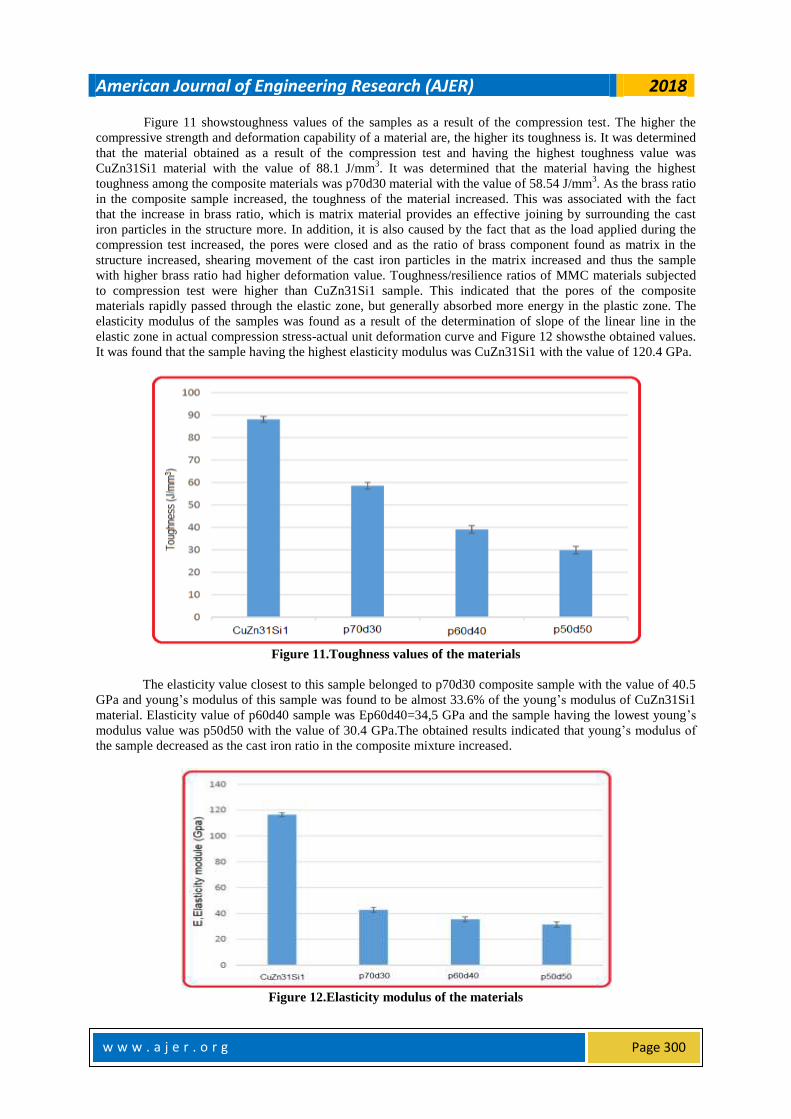
Figure 11 showstoughness values of the samples as a result of the compression test. The higher the
compressive strength and deformation capability of a material are, the higher its toughness is. It was determined
that the material obtained as a result of the compression test and having the highest toughness value was
CuZn31Si1 material with the value of 88.1 J/mm3. It was determined that the material having the highest
toughness among the composite materials was p70d30 material with the value of 58.54 J/mm3. As the brass ratio
in the composite sample increased, the toughness of the material increased. This was associated with the fact
that the increase in brass ratio, which is matrix material provides an effective joining by surrounding the cast
iron particles in the structure more. In addition, it is also caused by the fact that as the load applied during the
compression test increased, the pores were closed and as the ratio of brass component found as matrix in the
structure increased, shearing movement of the cast iron particles in the matrix increased and thus the sample
with higher brass ratio had higher deformation value. Toughness/resilience ratios of MMC materials subjected
to compression test were higher than CuZn31Si1 sample. This indicated that the pores of the composite
materials rapidly passed through the elastic zone, but generally absorbed more energy in the plastic zone. The
elasticity modulus of the samples was found as a result of the determination of slope of the linear line in the
elastic zone in actual compression stress-actual unit deformation curve and Figure 12 showsthe obtained values.
It was found that the sample having the highest elasticity modulus was CuZn31Si1 with the value of 120.4 GPa.
Figure 11.Toughness values of the materials
The elasticity value closest to this sample belonged to p70d30 composite sample with the value of 40.5
GPa and young’s modulus of this sample was found to be almost 33.6% of the young’s modulus of CuZn31Si1
material. Elasticity value of p60d40 sample was Ep60d40=34,5 GPa and the sample having the lowest young’s
modulus value was p50d50 with the value of 30.4 GPa.The obtained results indicated that young’s modulus of
the sample decreased as the cast iron ratio in the composite mixture increased.
Figure 12.Elasticity modulus of the materials

American Journal of Engineering Research (AJER) 2018
w w w . a j e r . o r g
Page 301
Table 4 showsBrinell hardness results (BSD) of the produced metal matrix composite materials, matrix
(CuZn31Si1) and reinforcement (GGG-40) components located in the composite body. After the applied
hardness test, the highest hardness of 59 HB and the lowest hardness of 37 HB in the produced composite
materials were determined in p50d50 and p70d30 materials, respectively. This resultwas thought to be caused by
the fact that cast iron hardness was higher than the brass material and p50d50 material had the highest spherical
graphite cast iron rate among the composite materials.
Table 4.Hardness values of the test samples
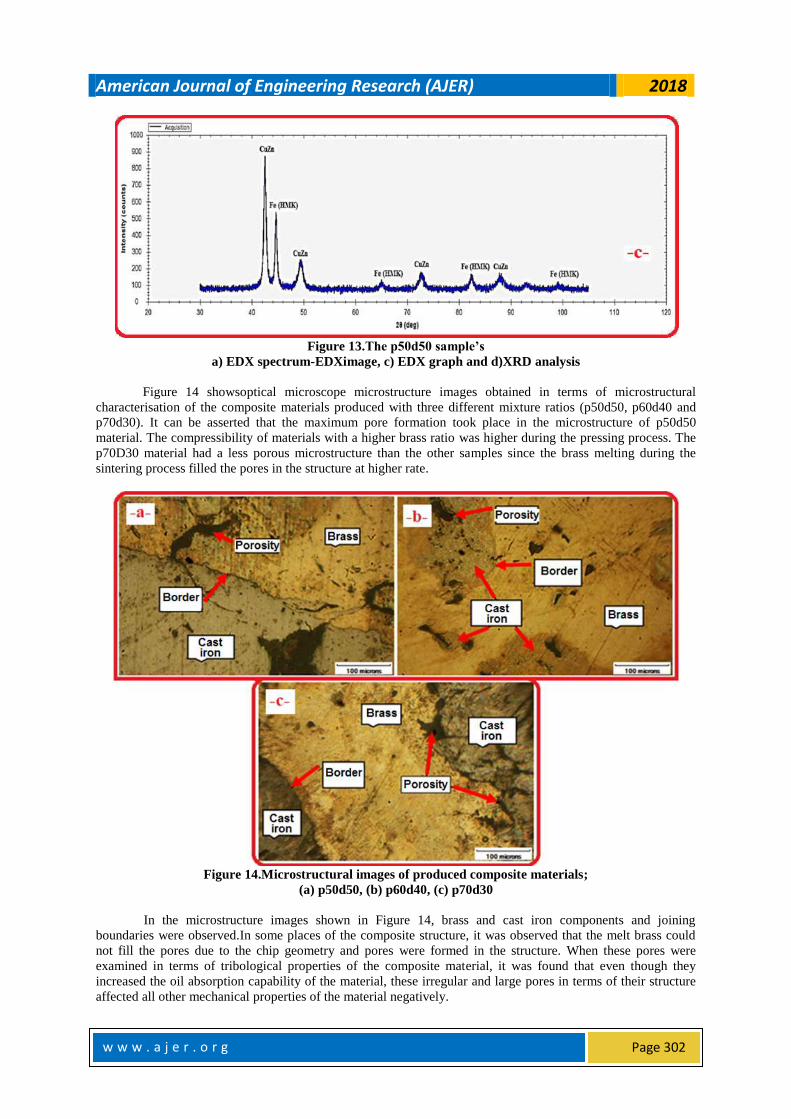
Figure 13 showsthe results of EDX spectra and XRD analysis applied to p50d50 material in metal
matrix composite materials.According to the EDX analysis SEM image of p50d50 material given in Figure 13-a,
the right side of the boundary was GGG 40 component and its left side wasCuZn31Si1 component. It was found
that as we went to the right side from the boundary, the iron ratio by weight increased and the copper and zinc
ratio was negligible on the right side of the boundary. It was found that as we went from the boundary to the
left side, the ratio of copper and zinc by weight increased but the iron ratio decreased(Figure 13-b). In other
words, it was found that iron was diffused into the CuZn31Si1 brass but the diffusion of zinc and copper into
GGG-40 cast iron was negligible. This can be expressed as the lack of dissolution of copper element withface-
centred cubic structure and zinc with simple hexagonal structure since they were in iron alloy having a body-
centred cubic structure namely in different crystal lattices [14, 15]. According to the XRD analysis of p50d50
material given in Figure 13-c, no intermetallic compound formation was observed between the cast iron and
brass metals forming the composite structure.
American Journal of Engineering Research (AJER) 2018
w w w . a j e r . o r g
Page 302
Figure 13.The p50d50 sample’s
a) EDX spectrum-EDXimage, c) EDX graph and d)XRD analysis
Figure 14 showsoptical microscope microstructure images obtained in terms of microstructural
characterisation of the composite materials produced with three different mixture ratios (p50d50, p60d40 and
p70d30). It can be asserted that the maximum pore formation took place in the microstructure of p50d50
material. The compressibility of materials with a higher brass ratio was higher during the pressing process. The
p70D30 material had a less porous microstructure than the other samples since the brass melting during the
sintering process filled the pores in the structure at higher rate.
Figure 14.Microstructural images of produced composite materials;
(a) p50d50, (b) p60d40, (c) p70d30
In the microstructure images shown in Figure 14, brass and cast iron components and joining
boundaries were observed.In some places of the composite structure, it was observed that the melt brass could
not fill the pores due to the chip geometry and pores were formed in the structure. When these pores were
examined in terms of tribological properties of the composite material, it was found that even though they
increased the oil absorption capability of the material, these irregular and large pores in terms of their structure
affected all other mechanical properties of the material negatively.
American Journal of Engineering Research (AJER) 2018
w w w . a j e r . o r g
Page 303
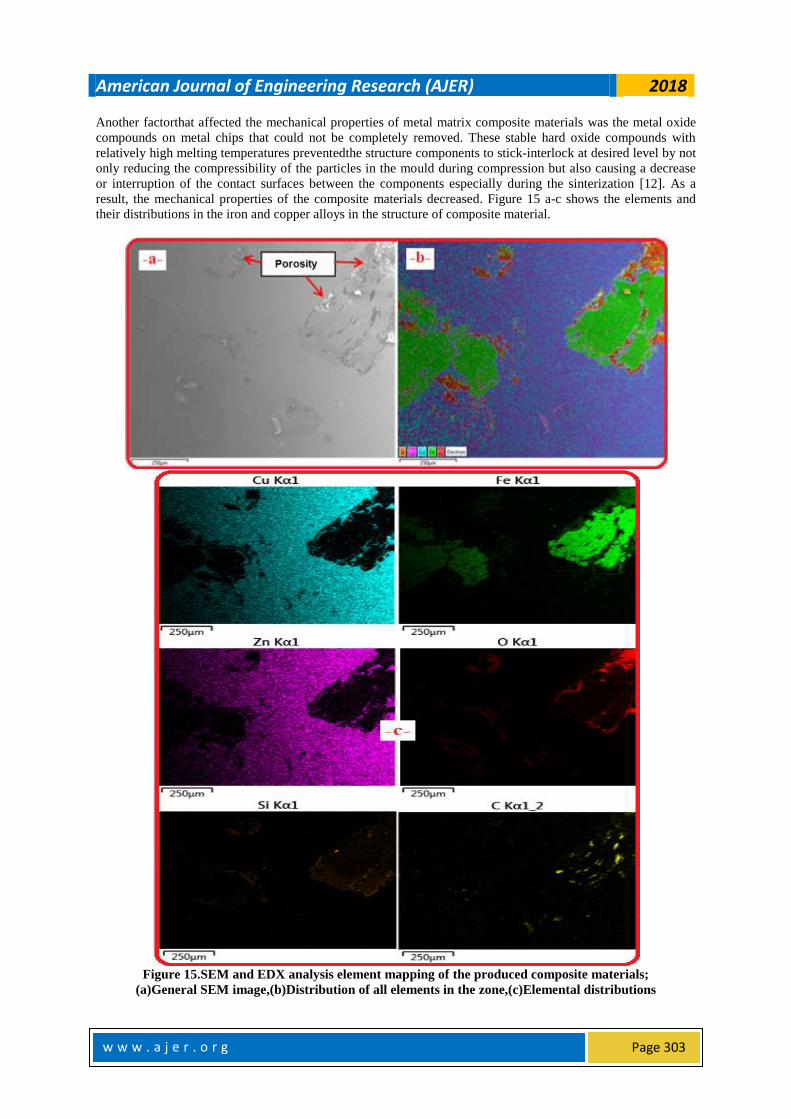
Another factorthat affected the mechanical properties of metal matrix composite materials was the metal oxide
compounds on metal chips that could not be completely removed. These stable hard oxide compounds with
relatively high melting temperatures preventedthe structure components to stick-interlock at desired level by not
only reducing the compressibility of the particles in the mould during compression but also causing a decrease
or interruption of the contact surfaces between the components especially during the sinterization [12]. As a
result, the mechanical properties of the composite materials decreased. Figure 15 a-c shows the elements and
their distributions in the iron and copper alloys in the structure of composite material.
Figure 15.SEM and EDX analysis element mapping of the produced composite materials;
(a)General SEM image,(b)Distribution of all elements in the zone,(c)Elemental distributions

American Journal of Engineering Research (AJER) 2018
w w w . a j e r . o r g
Page 304
It can be seen in the images that the copper was melt and partially entered and filled the capillary pores
and between the iron chips but pores preserved their presence in many joining regions. Figure 15-cshows
regions rich in oxygen element (red coloured) concentrated in the joining regions/interfaces and especially in the
pores of the chips which were the component of composite material. The presence and location of metal oxide
compounds which discontinued the contact between the particles and weakened the mechanical properties of the
composite materials in these regions were clearly observed.
IV CONCLUSIONS
In terms of their role in the production process of recycling, metal matrix composite material
production was conducted with powder metallurgy method using cast iron and brass material chips. The results
of the experimental studies are presented below;
It was determined that as the brass ratio increased in metal matrix composite materials, the
compressibility increased and total porosity ratio after sintering increased with the increase in cast iron ratio.
The highest and lowest total porosity rates of MMCmaterials after sintering were determined as 29.55% and
23.29% in p50d50 and p70d30 materials. It was determined that the compression strength of CuZn31Si1
material was higher than the produced composite materials. The highest compressive strength was found in
p70d30 material with the value of 180 MPa. The resilience and toughness of the industrial CuZn31Si1 alloy
were higher compared toMMCmaterials. The highest resilience and toughness values in composite materials
were found as 2.64 J/mm3 and 58.5 J/mm
3, respectively in p70d30.It was determined that the hardness of
MMCmaterials increased with increasing matrix cast iron ratio. In MMCmaterials, the highest hardness value
was measured as 59 HB in p50d50 material.
REFERANCE [1]. Aslan, İ., “Pirinç Ve Dökme Demir Talaşları İle Kompozit Malzeme Üretimi ve Mekanik Özelliklerin İncelenmesi”, Necmettin
Erbakan Üniversitesi Fen Bilimleri Enstitüsü, Yüksek Lisans Tezi, Konya, 2017.
[2]. Mindivan, H., “Eş kalıp ekstrüzyon yöntemi ile alüminyum-magnezyum makro kompozit imalatı ve karakterizasyonu”, Pamukkale Üniversitesi, Mühendislik Bilimleri Dergisi, 23(1), 12-14, 2017.
[3]. Yamanoğlu, R., Karakulak, E., Zeren, M., “MechanicalAndWearProperties of Pre-Alloyedmolybdenum P/M
SteelsWithNickelAddition”, J. Min. Metall. Sect. B-Metall, 48 (2), B.251–258, 2012. [4]. Chen, P.,Shen, Q.,Luo, G.,Li, M. Zhang, L., “TheMechanicalProperties of WCuCompositebyActivatedSintering”, International
Journal of RefractoryMetalsand Hard Materials, Volume 36 ,220-224, 2013.
[5]. Gökmeşe, H., Bostan, B., “AA 2014 Alaşımında Presleme ve Sinterlemenin Gözenek Morfolojisi ve Mikro yapısal Özelliklere Etkileri”, Gazi Üniversitesi Fen Bilimleri Dergisi Part C: Tasarım ve Teknoloji, 1(1): 1-8, 2013.
[6]. Pul, M., Şeker, U., “Metal Matrisli Kompozitlerin Tornalanmasında İlerleme Oranının Kesici Takım Aşınma Davranışlarına Etkisi”,
Politeknik Dergisi, Cilt:17 Sayı: 399-106, 2014. [7]. Erdem, Y, “Çelik Talaşı Silikon Kompozit Malzeme Üretimi ve Düşük Hızlı Darbe Özelliklerinin Deneysel Olarak İncelenmesi”,
Selçuk Üniversitesi Fen Bilimleri Enstitüsü, Yüksek Lisans Tezi, , Konya, 2010.
[8]. Pepelnjak, T.,Kuzman, K., Kačmarčik, I., Plančak, M., “Recycling of AlMgSi1 aluminiumchipsbycoldcompression”, Metalurgija, Volume 51(4), 509-512, 2012.
[9]. Karadağ, H. B., “Çelik / Bronz talaş kompozitin üretimi ve mekanik özellikleri”, Selçuk Üniversitesi Fen Bilimleri Enstitüsü,
Doktora Tezi, , Konya, 2012. [10]. Aslan, A., “Atık metal talaşların geri dönüştürülmesiyle metal matris kompozit malzeme üretimi ve mekanik özelliklerinin
araştırılması”, Selçuk Üniversitesi Fen Bilimleri Enstitüsü, Yüksek Lisans Tezi, Konya, 2014.
[11]. MaterialsHandbook, 14. Basım, 1996, McGraw-Hill; 14 edition, September 1, 1996.
[12]. German, R.M. (2007). Translatoreditors: S. Sarıtaş, M. Türker, N. Durlu, “Toz Metalürjisi ve Parçalıklı Malzemeler
İşlemleri” TTMD, Ankara, Türkiye, 2007.
[13]. M.A.Turchanin, P.G.Agraval, I.V.Nikolaenko, “Thermodynamics of alloysandphaseequilibria in theCopper-Ironsystem”, J.PhaseEquilib., 24: 307-319, 2003.
[14]. Q. Chen, Z.Jin, “The Fe-Cu system: A thermodynamicevaluation”, MetallurgicalandMaterialsTransactions A-
PhysicalMetallurgyandMaterialsScience, 26 A 417-426, 1995.
hakan Burak Karadağ. " Recycling Of Waste Brass And Cast Iron Chips Through Metal
Matrix Composite Material Production- Investigation Of Mechanical Properties”American
Journal of Engineering Research (AJER), vol. 7, no. 5, 2018, pp.292-304.