red lake watershed district monthly water quality report 6 jun… · rlwd and city staff met to ......
TRANSCRIPT

By Corey Hanson, Red Lake Watershed District Water Quality Coordinator. 10/2/2017.
District Monitoring
Stormwater Sampling
Stage/Flow Monitoring
Clearwater River Watershed Restoration and Protection Project
Red Lake Watershed District Long-Term Monitoring Program
The RLWD conducted stormwater sampling in 2017 to help with the Thief River Falls
Stormwater Assessment that is being conducted by the City of Thief River Falls, Pennington
County Soil and Water Conservation District, and a consultant. RLWD and city staff met to
identify the locations of priority stormwater outlets. A runoff event on June 13, 2017 provided an
opportunity for the Water Quality Assistant to collect stormwater samples at stormwater outlets
along the Red Lake River in Thief River Falls.


Stormwater samples were collected on June 13, 2017.
A stormwater outlet that discharges to a wetland along Pennington Avenue S, between
Greenwood Street and Parkview Street had high concentrations of total suspended solids
(41 mg/L), phosphorus (0.285 mg/L), and E. coli bacteria (>2,419.6 MPN/100ml).
The outlet of County Ditch 70 (which receives drainage from DigiKey and Artic Cat
parking lots, had a high concentration of total phosphorus (0.602 mg/L), but total
suspended solids and E. coli concentrations were okay.
The stormwater outlet in Hartz Park, upstream of the Greenwood Street Bridge, had a
high concentration of E. coli bacteria (>2,419.6) and total phosphorus (0.227 mg/l).
The Dewey Avenue crossing of the Chief’s Coulee stormwater drainage system had an
extremely high E. coli concentration of 7,701 MPN/100ml, high total suspended solids
concentration (30 mg/L), and high total phosphorus concentration (0.728 mg/L).
Stormwater samples were collected again on June 28, 2017.
The stormwater outlet along Pennington Avenue, between Greenwood and Parkview
Streets, once again had high total suspended solids (44 mg/L) and extremely high E. coli
(24,196 MPN/100ml).
The County Ditch 70 outlet near the Greenwood Street Bridge had high E. coli (161
MPN/100mL) and total phosphorus (0.526 mg/l) concentrations.
The stormwater outlet on the edge of Hartz Park had a high concentration of E. coli
bacteria (2,481 MPN/100ml) and total phosphorus (0.198).
A stormwater outlet along 3rd Street had very high concentrations of E. coli bacteria
(10,462 MPN/100ml), total suspended solids (61 mg/L), and total phosphorus (0.23
mg/L).
The Dewey Avenue crossing of the Chief’s Coulee drainage system had an extremely
high concentration of E. coli (>24,196 MPN/100ml) and a high concentration of total
phosphorus (0.511 mg/L).
Dissolved oxygen loggers were deployed in Cyr Creek, Pennington County Ditch 23, Hill River,
Burnham Creek, and the Clearwater River.
The Minnesota Pollution Control Agency (MPCA) and RLWD deployed dissolved oxygen
loggers for a special study of Cyr Creek to get a better understanding of what is causing low
dissolved oxygen levels in the stream. The creek stopped flowing by the end of June.
As flows subsided, beaver dams began appearing at monitoring sites, including the County Road
62 crossing of Polk County Ditch 2 and the Lost River upstream of Anderson Lake.
A full round of district monitoring was completed during the month of June.
High concentrations of total suspended solids (in excess of state water quality standards) were
found in:
Red Lake River at CSAH 7 (Smiley Bridge)
Red Lake River at Fisher

High concentrations of E. coli bacteria (>126 MPN/100ml) were found in:
Browns Creek at County Road 101
Burnham Creek at CSAH 48
Chief’s Coulee at Dewey Avenue
Clear Brook at CSAH 92
County Ditch 14 at CSAH 10 near the outlet of Maple Lake
Darrigan’s Creek at CSAH 23
Gentilly Creek at CSAH 11 in Gentilly
Grand Marais Creek at 130th Street NW
Heartsville Coulee at 13th Street SE
Hill River at 335th Ave
Hill River at CSAH 35, downstream (west) of Hill River Lake
Hill River at County Road 119, near Brooks
Judicial Ditch 73 at CSAH 10 at the inlet to Maple Lake
Kripple Creek at 180th Avenue SW
Lost River near the outlet of Pine Lake
Lost River at CSAH 8
Lost River in Oklee
Lower Badger Creek at 150th Ave SE
Nassett Brook
North Cormorant River at CSAH 36
Pennington County Ditch 21 at 135th Avenue NE
Polk County Ditch 1 at County Road 61
Polk County Ditch 2 at CSAH 20 (however, the E. coli concentration was okay further
downstream at County Road 62).
Poplar River at CSAH 30 near Fosston
Red Lake River at CSAH 13
Red Lake River at the Louis A. Murray Bridge in East Grand Forks
Ruffy Brook at CSAH 11
Silver Creek at 159th Ave, west of Clearbrook
Terrebonne Creek at CSAH 92
Thief River at 380th St. NE
Thief River at CSAH 7
High concentrations of total phosphorus that exceeded stream eutrophication standards were
found in:
Browns Creek at County Road 101
Burnham Creek at 320th Avenue SW
Chief’s Coulee at Dewey Avenue
Grand Marais Creek at 110th Street NW
Grand Marais Creek at 130th Street NW

Heartsville Coulee at 13th Street SE (mostly in the form of orthophosphorus)
Hill River at 335th Ave
Hill River at CSAH 35, downstream (west) of Hill River Lake
Lost River in Oklee
North Cormorant River at CSAH 36
O’ Briens Creek at Harvest Road NE
Pennington County Ditch 21 at 135th Avenue NE
Poplar River at County Road 118
Silver Creek at County Road 111
South Cormorant River at CSAH 37
There was a large difference between duplicate E. coli samples collected from Pennington
County Ditch 21 (131.7 vs >2,419.6). The concentration of total suspended solids was also
greater in the sample that had a higher concentration of E. coli bacteria.
Some notably good water quality monitoring results include:
The Red Lake River at Murray Bridge (near the pour point, normally very muddy) met
the total suspended solids water quality standard when it was sampled in June.
The Clearwater River at CSAH 14, downstream of Clearwater Lake, had a total
suspended solids concentration of <1 mg/L. It is very rare to see that low of a
concentration (too low to measure/report) in anything other than a blank sample (distilled
water).
Although high E. coli concentrations were found upstream in Clear Brook and at the
159th Avenue crossing of Silver Creek, the E. coli concentration at County Road 111 was
lower than the water quality standard.
Red Lake Watershed District Stream Gaging and Flow Monitoring
HOBO water level loggers are collecting water level measurements at 24 monitoring sites
throughout the Clearwater, Red Lake River, Thief River, and Grand Marais Creek watersheds.
The District’s flow monitoring records from the Red Lake River (8 sites), Thief River (5 sites),
and Clearwater River (17 sites) watersheds was compiled and shared with the RESPEC
consulting firm. RESPEC will be updating the HSPF models for those watersheds. The update
will expand the simulated period will from 1996-2009 to 1995-2016. MPCA staff provided
recent data from the state’s gauges in the Grand Marais Creek watershed. That data was
combined with past data and passed along to RESPEC.
River Watch
River Watch monitoring activity usually slows down during summer months because the kids
(and teachers) are on their summer breaks from school. Still, a couple of events in the area were
organized by the International Water Institute for River Watch students and teachers. RLWD and
International Water Institute staff kayaked the Clearwater River between CSAH 1 and CSAH 20

with the Red Lake County Central River Watch group down. The RLWD Natural Resources
Technician also participated in the Do-It-Yourself (DIY), Real-Time, Low Cost Environmental
Sensing Networks to Support Citizen Science and Primary and Secondary Education workshop
at the University of Minnesota, Crookston, in which participants assembled solar-powered
stream sensor stations. Photos from both events can be found online among the International
Water Institute’s albums on Flickr.com (https://www.flickr.com/photos/147177192@N06/).
Photo Credit: International Water Institute
Photo Credit:
International Water Institute

Clearwater River Watershed Restoration and Protection Strategy (WRAPS) Project
Objective 8 – Data analysis
o Flow data compilation for the Clearwater River at the Plummer USGS gauge
o Total suspended solids load duration curve for the Clearwater River at the
Plummer USGS gauge
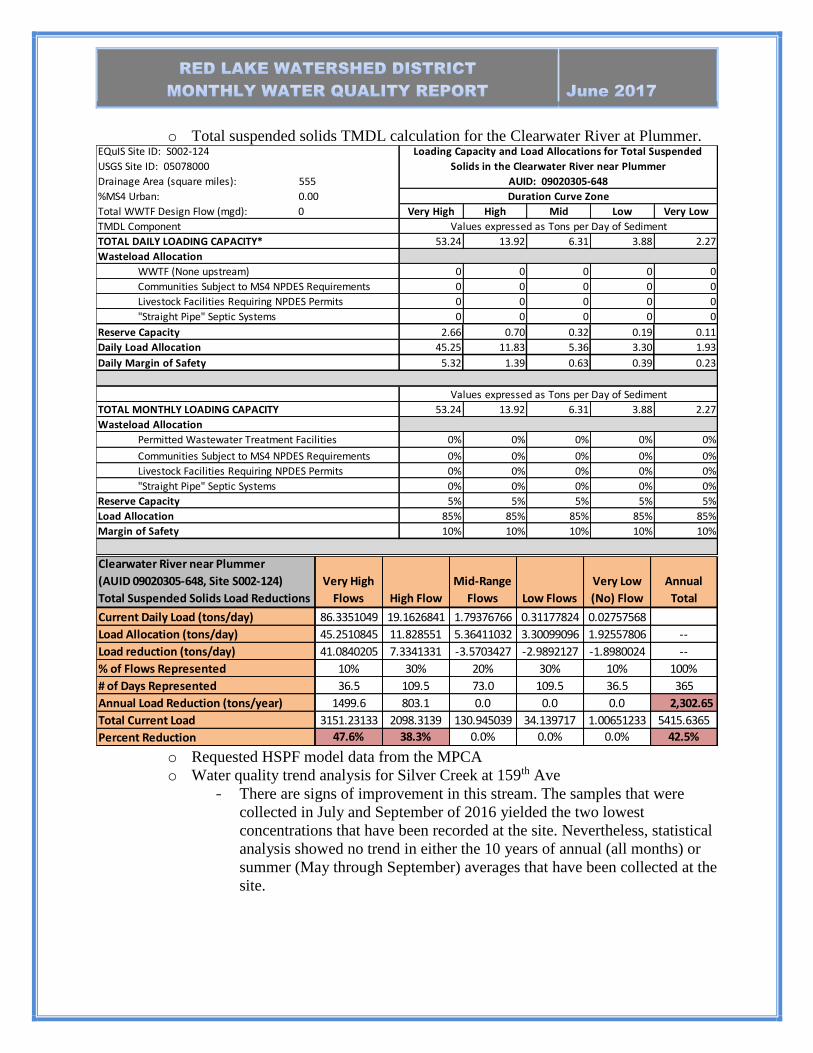
o Total suspended solids TMDL calculation for the Clearwater River at Plummer.
o Requested HSPF model data from the MPCA
o Water quality trend analysis for Silver Creek at 159th Ave
- There are signs of improvement in this stream. The samples that were
collected in July and September of 2016 yielded the two lowest
concentrations that have been recorded at the site. Nevertheless, statistical
analysis showed no trend in either the 10 years of annual (all months) or
summer (May through September) averages that have been collected at the
site.
Very High High Mid Low Very Low
TMDL Component
TOTAL DAILY LOADING CAPACITY* 53.24 13.92 6.31 3.88 2.27
Wasteload Allocation
WWTF (None upstream) 0 0 0 0 0
Communities Subject to MS4 NPDES Requirements 0 0 0 0 0
Livestock Facilities Requiring NPDES Permits 0 0 0 0 0
"Straight Pipe" Septic Systems 0 0 0 0 0
Reserve Capacity 2.66 0.70 0.32 0.19 0.11
Daily Load Allocation 45.25 11.83 5.36 3.30 1.93
Daily Margin of Safety 5.32 1.39 0.63 0.39 0.23
TOTAL MONTHLY LOADING CAPACITY 53.24 13.92 6.31 3.88 2.27
Wasteload Allocation
Permitted Wastewater Treatment Facilities 0% 0% 0% 0% 0%
Communities Subject to MS4 NPDES Requirements 0% 0% 0% 0% 0%
Livestock Facilities Requiring NPDES Permits 0% 0% 0% 0% 0%
"Straight Pipe" Septic Systems 0% 0% 0% 0% 0%
Reserve Capacity 5% 5% 5% 5% 5%
Load Allocation 85% 85% 85% 85% 85%
Margin of Safety 10% 10% 10% 10% 10%
EQuIS Site ID: S002-124
USGS Site ID: 05078000
Drainage Area (square miles): 555
%MS4 Urban: 0.00
Total WWTF Design Flow (mgd): 0
Loading Capacity and Load Allocations for Total Suspended
Solids in the Clearwater River near Plummer
AUID: 09020305-648
Duration Curve Zone
Values expressed as Tons per Day of Sediment
Values expressed as Tons per Day of Sediment
Clearwater River near Plummer
(AUID 09020305-648, Site S002-124)
Total Suspended Solids Load Reductions
Very High
Flows High Flow
Mid-Range
Flows Low Flows
Very Low
(No) Flow
Annual
Total
Current Daily Load (tons/day) 86.3351049 19.1626841 1.79376766 0.31177824 0.02757568
Load Allocation (tons/day) 45.2510845 11.828551 5.36411032 3.30099096 1.92557806 --
Load reduction (tons/day) 41.0840205 7.3341331 -3.5703427 -2.9892127 -1.8980024 --
% of Flows Represented 10% 30% 20% 30% 10% 100%
# of Days Represented 36.5 109.5 73.0 109.5 36.5 365
Annual Load Reduction (tons/year) 1499.6 803.1 0.0 0.0 0.0 2,302.65
Total Current Load 3151.23133 2098.3139 130.945039 34.139717 1.00651233 5415.6365
Percent Reduction 47.6% 38.3% 0.0% 0.0% 0.0% 42.5%
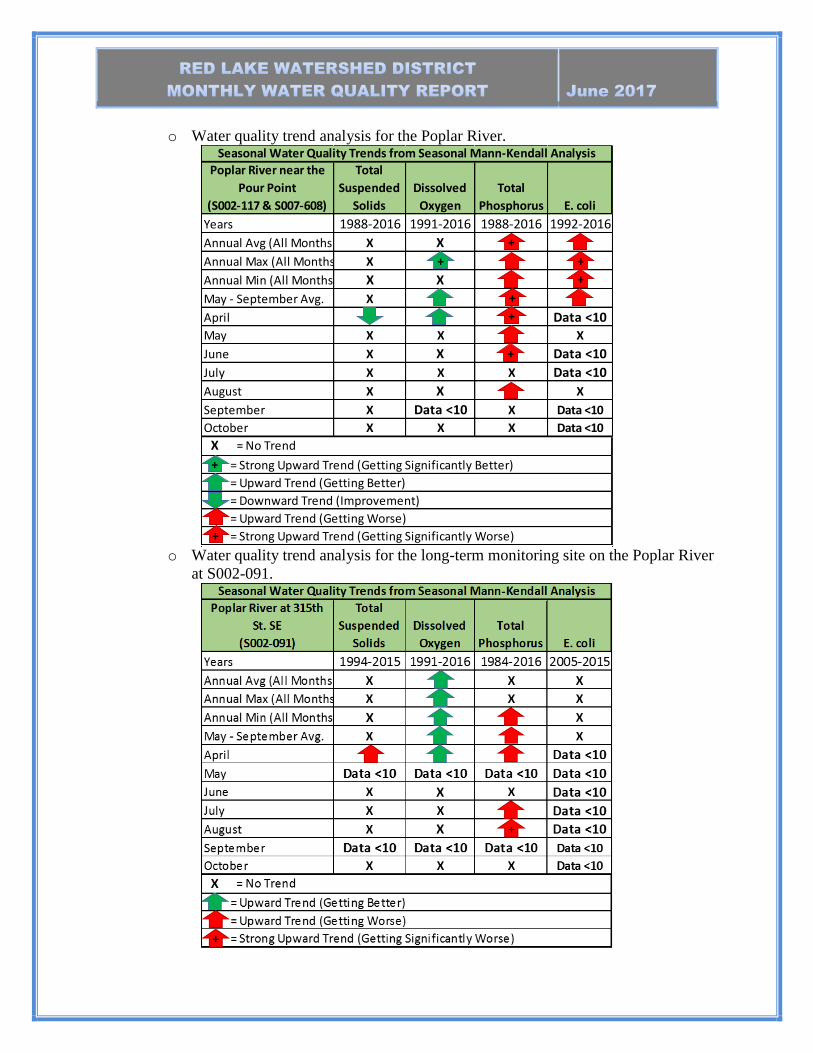
o Water quality trend analysis for the Poplar River.
o Water quality trend analysis for the long-term monitoring site on the Poplar River
at S002-091.
Poplar River near the
Pour Point
(S002-117 & S007-608)
Total
Suspended
Solids
Dissolved
Oxygen
Total
Phosphorus E. coli
Years 1988-2016 1991-2016 1988-2016 1992-2016
Annual Avg (All Months) X X
Annual Max (All Months) X
Annual Min (All Months) X X
May - September Avg. X
April Data <10
May X X X
June X X Data <10
July X X X Data <10
August X X X
September X Data <10 X Data <10
October X X X Data <10
= Upward Trend (Getting Worse)
= Downward Trend (Improvement)
Seasonal Water Quality Trends from Seasonal Mann-Kendall Analysis
X = No Trend
= Upward Trend (Getting Better)
= Strong Upward Trend (Getting Significantly Worse)
= Strong Upward Trend (Getting Significantly Better)
+
+
+
+
+
+
+
+
+

o Water quality trend analysis for the Hill River
o Water quality trend analysis for the Lost River at County Road 119, north of
Brooks.
Hill River at CR 119
(S002-134)
Total
Suspended
Solids
Dissolved
Oxygen
Total
Phosphorus E. coli
Years 1992-2016 1992-2016 1992-2016 2007-2016
Annual Avg (All Months) X X X
Annual Max (All Months) X X X
Annual Min (All Months) X X
May - September Avg. X X X
April Data <10 X Data <10 Data <10
May X Data <10
June X X X Data <10
July X X X Data <10
August X X Data <10
September Data <10 X Data <10 Data <10
October X x X Data <10
= Upward Trend (Getting Worse)
= Downward Trend (Improvement)
Seasonal Water Quality Trends from Seasonal Mann-Kendall Analysis
X = No Trend
= Upward Trend (Getting Better)
Lost River at CR 119
(S002-133)
Total
Suspended
Solids
Dissolved
Oxygen
Total
Phosphorus E. coli
Years 2002-2016 2001-2016 2001-2016 2005-2016
Annual Avg (All Months) X X X X
Annual Max (All Months) X X X
Annual Min (All Months) X X X X
May - September Avg. X X X
April Data <10 X Data <10 Data <10
May Data <10 Data <10 Data <10
June Data <10 X Data <10 Data <10
July Data <10 Data <10 Data <10
August Data <10 X Data <10 Data <10
September Data <10 X Data <10 Data <10
October X X Data <10 Data <10
Seasonal Water Quality Trends from Seasonal Mann-Kendall Analysis
X = No Trend
= Upward Trend (Getting Better)
= Strong Upward Trend (Getting Significantly Better)
+
+

o Water quality trends for the Lost River in Oklee
o Water quality trend analysis for the outlet of Pine Lake
Lost River at Oklee
(S001-131)
Total
Suspended
Solids
Dissolved
Oxygen
Total
Phosphorus E. coli
Years 2002-2016 2001-2016 2001-2016 2005-2016
Annual Avg (All Months) X
Annual Max (All Months)
Annual Min (All Months) X X
May - September Avg. X
April X Data <10
May Data <10 X X Data <10
June X X X Data <10
July X Data <10
August X Data <10
September Data <10 Data <10
October X X Data <10
Seasonal Water Quality Trends from Seasonal Mann-Kendall Analysis
X = No Trend
= Upward Trend (Getting Better)
= Strong Upward Trend (Getting Significantly Better)
= Strong Downward Trend (Getting Significantly Better)
= Downward Trend (Improvement)
+
+
+
+ +
+
+
+
+
+
+
+
Lost River near the
Pine Lake Outlet
(S001-007)
Total
Suspended
Solids
Dissolved
Oxygen
Total
Phosphorus E. coli
Years 1994-2016 1992-2016 1990-2016 1992-2016
Annual Avg (All Months) X X X Data <10
Annual Max (All Months) X X Data <10
Annual Min (All Months) X X Data <10
May - September Avg. X X Data <10
April Data <10 Data <10 Data <10 Data <10
May Data <10 X Data <10 Data <10
June Data <10 X Data <10 Data <10
July Data <10 X Data <10 Data <10
August Data <10 Data <10 Data <10 Data <10
September Data <10 Data <10 Data <10 Data <10
October X X X Data <10
Seasonal Water Quality Trends from Seasonal Mann-Kendall Analysis
X = No Trend
= Downward Trend (Improvement)
= Upward Trend (Getting Worse)

o Water quality trend analysis for the Lost River near the inlet to Pine Lake
o Water quality trend analysis for Clear Brook at Highway 92.
Lost River near the
Pine Lake Inlet
(S002-087 & S005-283)
Total
Suspended
Solids
Dissolved
Oxygen
Total
Phosphorus E. coli
Years 1994-2016 1992-2016 1992-2016 2005-2016
Annual Avg (All Months) X X X X
Annual Max (All Months) X X
Annual Min (All Months) X X X
May - September Avg. X X Data <10
April Data <10 X Data <10 Data <10
May Data <10 X Data <10 Data <10
June X X Data <10
July X X X Data <10
August Data <10 Data <10 Data <10
September Data <10 X Data <10 Data <10
October X X X Data <10
X = No Trend
= Strong Upward Trend (Getting Significantly Better)
= Downward Trend (Improvement)
= Upward Trend (Getting Worse)
= Downward Trend (Getting Worse)
+
+Clear Brook at CSAH 92
(S004-044)
Total
Suspended
Solids
Dissolved
Oxygen
Total
Phosphorus E. coli
Years 2004-2016 2004-2016 2004-2016 2007-2016
Annual Avg (All Months) X Data <10
Annual Max (All Months) X Data <10
Annual Min (All Months) X X Data <10
May - September Avg. X Data <10
April Data <10 Data <10 Data <10 Data <10
May Data <10 Data <10 Data <10 Data <10
June Data <10 Data <10 Data <10 Data <10
July Data <10 Data <10 Data <10 Data <10
August Data <10 Data <10 Data <10 Data <10
September Data <10 Data <10 Data <10 Data <10
October Data <10 Data <10 Data <10 Data <10
Seasonal Water Quality Trends from Seasonal Mann-Kendall Analysis
X = No Trend
= Upward Trend (Getting Better)
= Strong Upward Trend (Getting Significantly Better)
= Strong Downward Trend (Getting Significantly Better)
= Downward Trend (Improvement)
= Upward Trend (Getting Worse)
+
+
+
+

o Water quality trend analysis for Walker Brook at CSAH 19
o Water quality trend analysis for Maple Lake.
Walker Brook
at CSAH 19
(S002-122)
Total
Suspended
Solids
Dissolved
Oxygen
Total
Phosphorus E. coli
Years 1992-2002 1992-2016 1998-2008 1992, 2016
Annual Avg (All Months) Data <10 Data <10 Data <10
Annual Max (All Months) Data <10 Data <10 Data <10
Annual Min (All Months) Data <10 Data <10 Data <10
May - September Avg. Data <10 Data <10 Data <10
April Data <10 Data <10 Data <10
May Data <10 X Data <10 Data <10
June Data <10 Data <10 Data <10
July Data <10 Data <10 Data <10
August Data <10 Data <10 Data <10
September Data <10 Data <10 Data <10
October Data <10 X Data <10 Data <10
= Strong Downward Trend (Getting Significantly Worse)
Seasonal Water Quality Trends from Seasonal Mann-Kendall Analysis
X = No Trend
= Downward Trend (Getting Worse)+
+
+
+
Maple Lake
(60-0305-00, all sites)
Chlorophyl-
a
Secchi
Depth
Total
Phosphorus
Trophic
State
Years 1989-2016 1989-2016 1992-2016 1989-2016
Annual Avg (All Months) X
Annual Max (All Months) X X X
Annual Min (All Months) X X
May - September Avg. X
April X Data <10 Data <10 Data <10
May Data <10 X Data <10 X
June Data <10 Data <10 X
July Data <10 X
August X X X X
September Data <10 Data <10
October Data <10 X Data <10 Data <10
= Downward Trend (Improvement)
Trends of Seasonal Averages Using Seasonal Mann-Kendall Analysis
X = No Trend
= Upward Trend (Getting Better)
= Strong Upward Trend (Getting Significantly Better)
+
+
+

Maple Lake Outlet
(S002-130)
Total
Suspended
Solids
Dissolved
Oxygen
Total
Phosphorus E. coli
Years 1992-2016 1992-2016 1984-2016 2004-2016
Annual Avg (All Months) X X
Annual Max (All Months) X X X
Annual Min (All Months) X X X
May - September Avg. X X
April Data <10 X Data <10
May Data <10 X X Data <10
June X X Data <10
July X X Data <10
August X X X Data <10
September Data <10 X X Data <10
October X X Data <10
= Upward Trend (Getting Worse)
= Downward Trend (Improvement)
Seasonal Water Quality Trends from Seasonal Mann-Kendall Analysis
X = No Trend
= Strong Upward Trend (Getting Significantly Worse)
+
+
+
Maple Lake Inlet
(S002-075)
Total
Suspended
Solids
Dissolved
Oxygen
Total
Phosphorus E. coli
Years 1994-2016 1991-2016 1989-2016 2005-2016
Annual Avg (All Months) X X X
Annual Max (All Months) X X X
Annual Min (All Months) X X X X
May - September Avg. X X X
April Data <10 X X Data <10
May Data <10 X Data <10
June X X X Data <10
July X X Data <10
August X X Data <10
September X X Data <10
October X X Data <10
= Downward Trend (Getting Worse)
= Upward Trend (Getting Worse)
= Downward Trend (Improvement)
= Strong Downward Trend (Getting Significantly Better)
Seasonal Water Quality Trends from Seasonal Mann-Kendall Analysis
X = No Trend
= Strong Upward Trend (Getting Significantly Worse)
+
+
+

o Assessment statistics were ranked in order to prioritize the reaches of impaired
streams and rivers that are closest to meeting water quality standards and the
reaches of unimpaired waters that are closest to becoming impaired.
Stream AUID TSS E. coli DO F-IBI M-IBI Count Count/Avg
Poplar River 09020305-518 2 2 1 3 1.800
Clear Brook 09020305-526 1 1 1.000
Hill River 09020305-539 1 1 1.000
Nassett Creek 09020305-545 1 1 1.000
Lost River 09020305-645 1 3 2 1.000
Lost River 09020305-530 4 3 2 0.571
Clearwater River 09020305-647 2 5 2 0.571
Silver Creek 09020305-527 2 1 0.500
Brooks Creek 09020305-578 2 1 0.500
Clearwater River 09020305-511 3 1 0.333
Lost River 09020305-512 3 1 0.333
Beau Gerlot Creek 09020305-652 3 1 0.333
Lower Badger Creek 09020305-502 4 1 0.250
Lost River 09020305-529 4 1 0.250
Clearwater River 09020305-648 4 1 0.250
Clearwater R 09020305-501 5 1 0.200
Clearwater R 09020305-517 5 1 0.200Trib to Poplar R Diversion 09020305-561 5 1 0.200
Restore Impaired Waters that are Closest to Meeting State Water Quality Standards
(Rankings are based relative proximity to impairment thresholds in 2006-2015 assessment statistics)
Stream AUID TSS E. coli DO F-IBI M-IBI Count Count/Avg
Beau Gerlot Crk 09020305-652 1 1 2 2.000
CD14 - Maple L. Outlet 09020305-523 1 2 2 1.333
Poplar River 09020305-504 1 1 1.000
Hill River 09020305-539 1 1 1.000
Silver Creek 09020305-527 4 3 3 3 0.900
Lower Badger 09020305-502 3 3 2 0.667
Ruffy Brook 09020305-513 5 5 4 3 0.643
Lost River 09020305-646 2 5 2 0.571
Clearwater R 09020305-647 2 5 2 0.571
CD57 09020305-508 2 1 0.500
Terrebonne Creek 09020305-574 2 1 0.500
Clearwater R 09020305-653 4 5 2 0.444
Clearwater R 09020305-511 3 1 0.333
Hill River 09020305-656 4 1 0.250
Lost R 09020305-512 4 1 0.250
Clearwater R 09020305-517 5 1 0.200
JD73 09020305-550 5 1 0.200
Protect High-Quality Unimpaired Waters at Greatest Risk of Becoming Impaired
(Ranking are based on relative proximity to impairment thresholds in 2006-2015 assessment statistics)

Objective 10 – Reports
o The map of impairments was reviewed for accuracy
o Some time was spent on writing sections of the Clearwater River Watershed Total
Maximum Daily Load (TMDL) report.
o Some time was spent on writing sections of the Clearwater River Watershed
Restoration and Protection Strategy (WRAPS)
- PTMApp section
- Water quality trend analysis narrative
o The Clearwater River Watershed Monitoring and Assessment Report is now
available online: https://www.pca.state.mn.us/sites/default/files/wq-ws3-
09020305b.pdf
o The Clearwater River Watershed Stressor Identification Report is now available
online: https://www.pca.state.mn.us/sites/default/files/wq-ws5-09020305a.pdf
Thief River Watershed Restoration and Protection Strategy
A contract between the RLWD and the MPCA for editing the Thief River Watershed Total
Maximum Daily Load and Watershed Restoration and Protection Strategy documents throughout
the public notice process was executed on April 5, 2017. The RLWD will add a TMDL for the
Mud River E. coli impairment, applying edits based on current comments, and edit the
documents based on public comments. The Mud River E. coli impairment was proposed for
removal from the List of Impaired Waters. The river meets the standard at the long-term
monitoring site at Highway 89, but a site-specific impairment was discovered during recent
sampling within the town of Grygla. Editing of those documents will resume after a review by
MPCA has ben completed. Thief Ri
Red Lake River Watershed Restoration and Protection Strategy
A contract between the RLWD and the MPCA for editing the Red River Watershed Total
Maximum Daily Load and Watershed Restoration and Protection Strategy documents throughout
the public notice process was executed on April 14, 2017. Edits were made to the Red Lake
River WRAPS and TMDL in June. Comments from the MN DNR were incorporated into the
Red Lake River WRAPS and TMDL documents.
Grand Marais Creek Watershed Restoration and Protection Project
June 30, 2017 was the final day of the Grand Marais Creek contract.
Emmons and Olivier resources, Inc. (EOR) staff spent time in June working on civic engagement
(website changes), editing the Watershed Restoration and Protection Strategy (WRAPS) report,
and project coordination. Photos from the Grand Marais Creek watershed were compiled in a
Google Drive folder and shared with EOR for use in the TMDL and WRAPS documents. EOR
staff completed a new draft of the Grand Marais WRAPS report. RLWD staff completed a
review of the new draft WRAPS report.
RLWD staff added information to the Grand Marais Creek webpages.

RLWD staff completed Mann-Kendall trend analysis for long-term monitoring sites in the Grand
Marais Creek watershed.
Information about the Grand Marais Creek watershed and the Grand Marais Creek WRAPS is
available online at http://www.rlwdwatersheds.org.
Polk County Ditch 2
at CR 62
(S004-131)
Total
Suspended
Solids
Dissolved
Oxygen
Total
Phosphorus E. coli
Years 2006-2016 2006-2016 2006-2016 2008-2016
Annual Avg (All Months) X X X Data <10
Annual Max (All Months) X X Data <10
Annual Min (All Months) X X X Data <10
May - September Avg. X X X Data <10
April Data <10 Data <10 Data <10 Data <10
May X X X Data <10
June X X X Data <10
July Data <10 Data <10 Data <10 Data <10
August Data <10 Data <10 Data <10 Data <10
September Data <10 Data <10 Data <10 Data <10
October Data <10 Data <10 Data <10 Data <10
Seasonal Water Quality Trends from Seasonal Mann-Kendall Analysis
X = No Trend
= Upward Trend (Getting Worse)
Data <10 = There are fewer than 10 data points - not analyzed.
Grand Marais Creek
Pour Point
(S002-126, S008-904)
Total
Suspended
Solids
Dissolved
Oxygen pH
Total
Phosphorus
Years 2003-2016 2003-2016 2003-2016 2003-2016
Annual Avg (All Months)
Annual Max (All Months) X X
Annual Min (All Months) X X X X
May - September Avg. X X X
April X X
May X X
June X X
July X X X X
August Data <10 Data <10 Data <10 Data <10
September Data <10 Data <10 Data <10 Data <10
October Data <10 Data <10 Data <10 Data <10
Seasonal Water Quality Trends from Seasonal Mann-Kendall Analysis
X = No Trend
= Strong Downward Trend (Getting Significantly Better)
Data <10 = There are fewer than 10 data points - not analyzed.
= Downward Trend (Getting Worse)
= Downward Trend (Improvement)
+
+
+
+

Upper/Lower Red Lakes Watershed Restoration and Protection Strategy
RLWD staff reviewed and provided comments on the draft Upper/Lower Red Lakes
Watershed Stressor Identification Report
Other Notes
RLWD staff reviewed and provided comments on the Polk County Water Plan.
An April RLWD Water Quality Report was completed:
http://redlakewatershed.org/waterquality/MonthlyWQReport/2017%204%20April%20W
ater%20Quality%20Report.pdf
RLWD and USFWS staff worked together to identify some large, restorable wetlands in
the Thief River watershed (Mud River, more specifically) and Clearwater River
watersheds (particularly in the headwaters of Clearwater tributaries north of Highway 2).
RLWD staff reviewed the Thief River One Watershed One Plan scope of services
(description of the work that the contractor will be doing).
RLWD staff provided additional information about ongoing RLWD water quality
monitoring activity in the Upper/Lower Red Lakes watershed to MPCA stressor
identification staff.
The DNR has temporarily removed long stretches of the Lost River, Mud River, and
Clearwater River from the map of waters that are required to have buffers. Those are all
waterways that could benefit greatly from buffers.
There were high flows in the Clearwater River watershed after June runoff events.
A Thief River Falls angler caught a sturgeon downstream of the Thief River Falls dam. A
photo of the fish, shown below was posted in a Facebook group page. The walkway
below the dam was visible in the background.
RLWD Engineering Technician II, Nicholas
Olson, accepted a job opportunity with Houston
Engineering. RLWD staff held a going-away gathering for him before he left.

June 2017 Meetings and Events
June 1, 2017 – Red Lake River One Watershed One Plan planning group meeting at the
Pennington County Soil and Water Conservation District
o Come up with a list of project ideas before the end of the summer
o Focus on the Black River watershed, as well as the Red Lake River between Red
Lake Falls and Crookston
o There will be $4.875 million available from the Minnesota Board of Water and
Soil Resources (BWSR) for One Watershed One Plan implementation
o There will be less money available from BWSR for competitive grants than usual
($4-6 million).
o The Red Lake River PTMApp grant has been executed. There was discussion
about an amendment to the grant (extended to June 30, 2018) and a work plan
revision.
A user manual will be developed for PTMApp
A workshop will be held to train staff in the use of PTMApp
June 5, 2017 – Pennington County Water Resources Advisory Committee
o Grant funds are being used to help fix a failing septic system at a low-income
residence in the Chief’s Coulee drainage area.
o $5 million is going to landowners for Buffer Law implementation
o There should be more money available from BWSR for competitive grants next
year.
o Levy Bergstrom has been helping Polk County get started with their ditch
inventory.
o Two streambank stabilization projects were identified during the City of Thief
River Falls stormwater Assessment project, one by the Hartz Park pedestrian
bridge and one across from Oakland Park.
o The SWCD has been offering extra incentives for buffer implementation along
CD 96, CD 21, and CD 16. Unfortunately, there has been a lot of confusion
between this project and the Buffer Law.
o The SWCD received a Clean Water Fund Grant to use drones to analyze the
amount of erosion occurring at ditch outlets.
o Work is beginning on a Clean Water Fund grant that the SWCD received for the
development of a PTMApp modeling tool for the Thief River watershed.
o The Red Lake River One Watershed One Plan was officially approved by BWSR.
The project received an amendment and funds to re-run the PTMApp.
o A stakeholder advisory committee is being assembled for the Thief River One
Watershed One Plan project.
o The SWCD has completed the Green #5 streambank stabilization project at the
Golf Club.
o The SWCD has planted thousands of trees and put in weed barrier fabric.
o The SWCD has put a lot of effort into spreading knowledge about aquatic
invasive species (AIS) through MinnAqua, the Lions Club, and a booth at the
Pennington County Fair. A new invasive snail has been discovered in the Red
Lake River – the Chinese Mystery Snail. This snail displaces native species and
die in mass quantities.

o Two bridges on Pennington County Ditch 21 will be replaced this year, including
the bridge that had been providing roosting areas for pigeons – a source of high E.
coli concentrations that have been found in the ditch.
o The county highway department has plans to build a new bridge that would join
the road by Challenger Elementary (CSAH 8) with a road by the new hospital
(Mark Boulevard) in 2021.
o The city of Thief River Falls’ wastewater treatment projects are going well,
including the construction of new ponds that was starting the same week of this
meeting.
o Next meeting: September 11, 2017.
June 7, 2017 – Polk County Water Resources Advisory Committee
June 8, 2017 - Water quality related news from the Red Lake Watershed District Board
of Managers meeting:
o Bryan Malone, of the Pennington SWCD, informed the Board that the streambank
stabilization project on the Thief River Falls Golf Club Green #5 was recently
completed. The RLWD had contributed $12,500 in cost share for the project from
the RLWD’s 2015 Erosion Control Funds
o The Board reviewed correspondence from the U.S. Fish and Wildlife Service
(USFWS), requesting the District to partner with the USFWS, on a grant
application for potential wetland restoration in the Thief River Watershed and
other various locations throughout the District. The grant application could
require a small match from the District. Motion by Ose, seconded by Tiedemann,
to approve the submittal of a grant application with the U.S. Fish and Wildlife
Service for wetland restoration in the Thief River Watershed and other various
locations throughout the District. Motion carried.
o Administrator Jesme stated that he was informed that the Black River
Impoundment Project, RLWD Project No. 176 did not receive a Flood Hazard
Mitigation Grant through the MnDNR. Funding for the project will be from the
RRWMB and the District.
o Manager Page stated that the Red Lake River Corridor Enhancement, RLWD
Project No. 159, is applying for a $12,500 grant application through the NW MN
Foundation Grant to assist in public information. Matching funds are required for
the grant application. Motion by Page, seconded by Ose, to commit $500 per
year, for two years, to assist with a publication information grant through the Red
Lake River Corridor Enhancement Project, RLWD Project No. 159. Motion
carried.
June 22, 2017 - Water quality related news from the Red Lake Watershed District Board
of Managers meeting:
o The Board reviewed a Clean Water Fund One Watershed One Plan (1W1P)
Program Grant Agreement with the Board of Water and Soil Resources for the
Thief River 1W1P, RLWD Project No. 149A. Administrator Jesme stated that the
District is listed as the Fiscal Agent for the Thief River 1W1P. Motion by
Torgerson, seconded by Page, to authorize Administrator Jesme the authority to
sign as the Clean Water Fund 1W1P Program Grant with the Board of Water and
Soils Resources as the Fiscal Agent for the Thief River 1W1P, RLWD Project

No. 149A. Motion carried.
o Discussion was held on the Election of Jurisdiction of the Buffer Law.
Administrator Jesme stated that the District presently has jurisdiction of 279.01
miles of ditches, with the majority of the ditches not in compliance of the Buffer
Law located within Clearwater County. Discussion was held on funding the local
SWCD offices have received for assistance with buffer strip installation.
Red Lake Watershed District Monthly Water Quality Reports are available online:
http://www.redlakewatershed.org/monthwq.html.
Learn more about the Red Lake Watershed District at www.redlakewatershed.org.
Learn more about the watershed in which you live (Red Lake River, Thief River, Clearwater
River, Grand Marais Creek, or Upper/Lower Red Lakes) at www.rlwdwatersheds.org.
“Like” the Red Lake Watershed District on Facebook to stay up-to-date on RLWD reports and
activities.
Quote of the Month:
“Let’s not confuse hasty decisions with strength or intelligence. It’s important to be decisive - after giving consideration that reflects the time
you have and what’s at stake.”
- Bill Blackman