redalyc.a comprehensive comparison of … · masoud shakiba, nader ale ebrahim, mahmoud danaee,...
TRANSCRIPT
Revista de Gestão e Secretariado
E-ISSN: 2178-9010
Sindicato das Secretárias(os) do Estado
de São Paulo
Brasil
Shakiba, Masoud; Ebrahim, Nader Ale; Danaee, Mahmoud; Bakhtiyari, Kaveh;
Sundararajan, Elankovan
A COMPREHENSIVE COMPARISON OF EDUCATIONAL GROWTH WITHIN FOUR
DIFFERENT DEVELOPING COUNTRIES BETWEEN 1990 AND 2012
Revista de Gestão e Secretariado, vol. 6, núm. 3, septiembre-diciembre, 2015, pp. 152-
174
Sindicato das Secretárias(os) do Estado de São Paulo
São Paulo, Brasil
Available in: http://www.redalyc.org/articulo.oa?id=435645202009
How to cite
Complete issue
More information about this article
Journal's homepage in redalyc.org
Scientific Information System
Network of Scientific Journals from Latin America, the Caribbean, Spain and Portugal
Non-profit academic project, developed under the open access initiative

set./de.2015
estão e Secretariado -GeSec, São Paulo, v. 6, n.2, p0122, set./dez. 2015a de
GSecretariado -GeSec, São Paulo, . 6,n. 01-22, set./dez. 2015
Revista de Gestão e Secretariado - GeSeC
e-ISSN: 2178-9010
DOI: 10.7769/gesec.6i3.486
Organização: SINSESP
Editor Científico: Cibele Barsalini Martins
Avaliação: Double Blind Review pelo SEER/OJS
Revisão: Gramatical, normativa e de formatação
A COMPREHENSIVE COMPARISON OF EDUCATIONAL GROWTH WITHIN
FOUR DIFFERENT DEVELOPING COUNTRIES BETWEEN 1990 AND 2012
Masoud Shakiba School of Information Technology, Monash University, 47500 Bandar Sunway, Selangor, Malaysia.
E-mail: [email protected]
Nader Ale Ebrahim Research Support Unit, Centre of Research Services, Institute of Research Management and Monitoring (IPPP), University of
Malaya, Malaysia. E-mail: [email protected]
Mahmoud Danaee Faculty of Agriculture, Roudehen Branch, Islamic Azad University, Roudehen, Iran. E-mail: [email protected]
Kaveh Bakhtiyari Department of Computer & Cognitive Science, Facultyof Engineering, University of Duisburg-Essen, Duisburg, Germany. E-mail: [email protected]
Elankovan Sundararajan Center for Software Technology and Management, Faculty of Information Science and Technology, Universiti Kebangsaan Malaysia, 43600 UKM Bangi, Selangor, Malaysia. E-mail: [email protected]
Data de recebimento do artigo: 12/04/2015
Data de aceite do artigo: 25/09/2015

Masoud Shakiba, Nader Ale Ebrahim, Mahmoud Danaee,
Kaveh Bakhtiyari & Elankovan Sundararajan
Revista de Gestão e Secretariado - GeSec, São Paulo, v. 6, n. 3, p 152-174, set./dez. 2015.
153
A COMPREHENSIVE COMPARISON OF EDUCATIONAL GROWTH WITHIN
FOUR DIFFERENT DEVELOPING COUNTRIES BETWEEN 1990 AND 2012
ABSTRACT
Educational growth is a fundamental infrastructure factor required to achieve sustainable
development. Therefore, evaluation and measurement of educational growth is essential for
establishing a development road map. Because of this, there are many organizations and
databases that work to capture academic trends and provide the general view of institute
achievements. Web of Science and Scopus are the two most popular and scientific. In this
paper, we define the important effective factors in educational growth and discuss them; we
then compare these defined factors across four different developing countries: Brazil, Iran,
Malaysia, and Turkey. As well as the comparisons, this paper uses the Pearson product
moment correlation coefficient method to analyze the factors and the strong or weak
relationship between the factors is discussed. Through this research, the reader, especially the
decision maker will find the effect of the institute and research income to publication as well
as other educational growth.
Keywords: Educational growth; Developing countries; Publication; Impact factor; Web of
Science; Scopus.
A Comprehensive Comparison of Educational Growth Within four Different Developing
Countries Between 1990 and 2012
Revista de Gestão e Secretariado - GeSec, São Paulo, v. 6, n. 3, p 152-174, set./dez. 2015.
154
INTRODUCTION
Nowadays, one of the most important factors used to measure a country’s level of
development is its educational growth. In order to measure the educational growth of
organizations or governments, many significant elements need to be considered. These
factors, which measure the level of educational growth, are of particular interest to
universities. Because, they are also the fundamental criteria to rank universities. Factors such
as number of publications (Bas, Dayangac, Yaprak, Yuzer, & Tokat, 2011; Gholizadeh et al.,
2014; Zhao, 2005), citation number (Ale Ebrahim et al., 2013; Sweileh, Zyoud, Al-Jabi, &
Sawalha, 2014), international collaboration (Mohammadhassanzadeh et al., 2010; Zhai, Yan,
Shibchurn, & Song, 2014), the number of postgraduate students and researchers (Inglesi-Lotz
& Pouris, 2013; Moed & Glänzel, 2004), number of academic staff (De Filippo, Casani,
Garcia-Zorita, Efrain-Garcia, & Sanz-Casado, 2012; Ibanez, Larranaga, & Bielza, 2013) are
the most important ones. In this regard, Web of Science (WoS) and SCImago are the most
popular databases used to capture and measure the number and quality of academic
publications and provide strong databases to support this information (Aghaei Chadegani et
al., 2013; Basu, 2010; Chirici, 2012). For a long time now, bibliometric studies have been
widely applied to evaluate research papers (Rakhshandehroo, Yusof, Ale Ebrahim, Sharghi, &
Arabi, 2015). The field of bibliometrics is concerned with the analysis of citation indices in
order to identify highly cited authors, publications and the most productive countries as well
as institutions. This information is crucial because it highlights those who drive the trend in a
research field and provides information on what is topical (Eshraghi et al., 2012; Eugene
Garfield, 1955). Bibliometric studies have been widely applied in a variety of other research
areas and provided valuable insights (Eshraghi et al., 2012; Eugene Garfield, 1955; E.
Garfield & Welljamsdorof, 1992).
In this paper authors provide a comprehensive comparison of the different academic
variables of educational growth in four different developing countries. Brazil, Iran, Turkey,
and Malaysia are selected as four different developing countries and all the variables of these
countries are compared together and the correlation coefficients among the variables are
discussed in detail. Moreover, by applying bibliometrics analysis, the paper tried to overlook
to the world average scholar output and compare to for developing countries in order to give a
guideline to decision makers.
Below, we discuss academic variables and explain these significant elements one by
one.
Masoud Shakiba, Nader Ale Ebrahim, Mahmoud Danaee,
Kaveh Bakhtiyari & Elankovan Sundararajan
Revista de Gestão e Secretariado - GeSec, São Paulo, v. 6, n. 3, p 152-174, set./dez. 2015.
155
1.1 Number of Publications
The number of existing documents in the academic databases is a quantitative criterion
for measuring universities’ or countries’ activities in knowledge production. Here, we
compare the total number of documents in the WoS from 1990 until 2012 and existing
documents in Scopus from 1996 to 2011 for the four abovementioned different developing
countries.
1.2 Number of Citations
Number of citations (of any date) received by the documents published during the
source year, --i.e. citations in years X, X+1, X+2, X+3 etc to documents published during
year X. When referred to the period 1996-2012, all published documents during this period
are considered("The SCImago Journal & Country Rank," 2014).
1.3 Impact Factor
The Journal Citation Ranking (JCR) provides quantitative tools for ranking,
evaluating, categorizing, and comparing journals, organizations, or countries. The impact
factor is one of these; it is a measure of the frequency with which the “average article” in a
journal, organization, or country has been cited in a particular year or period. The annual JCR
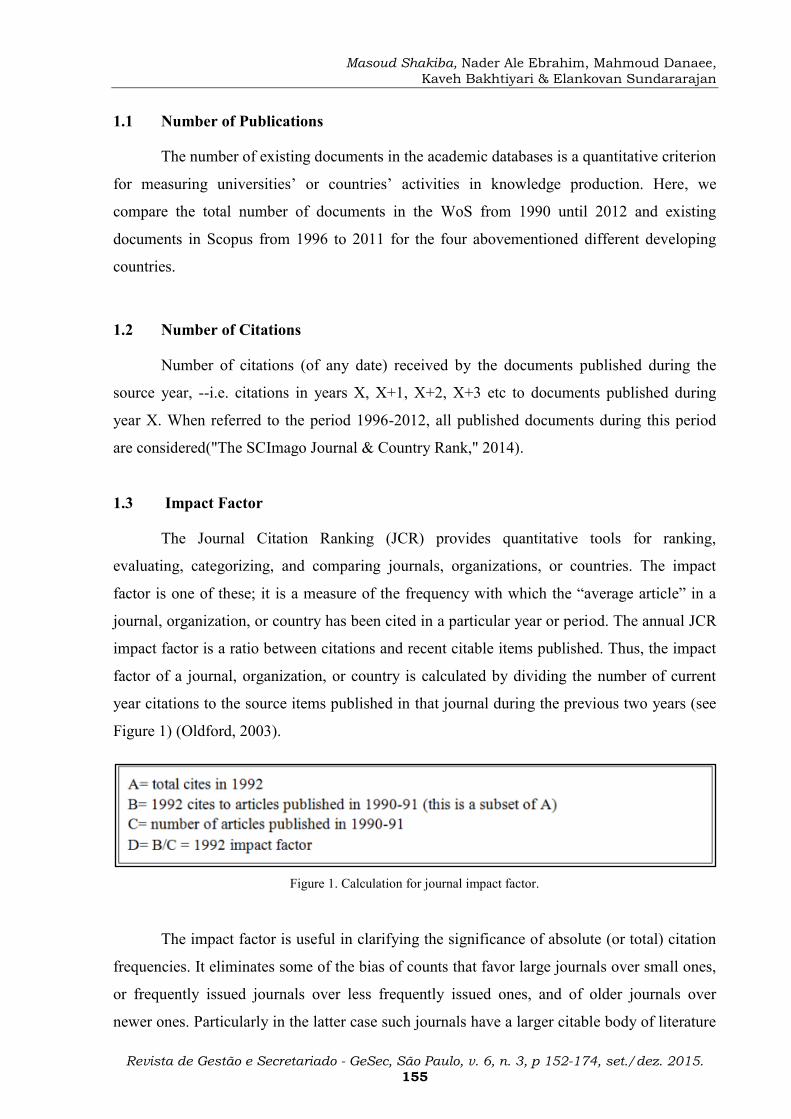
impact factor is a ratio between citations and recent citable items published. Thus, the impact
factor of a journal, organization, or country is calculated by dividing the number of current
year citations to the source items published in that journal during the previous two years (see
Figure 1) (Oldford, 2003).
Figure 1. Calculation for journal impact factor.
The impact factor is useful in clarifying the significance of absolute (or total) citation
frequencies. It eliminates some of the bias of counts that favor large journals over small ones,
or frequently issued journals over less frequently issued ones, and of older journals over
newer ones. Particularly in the latter case such journals have a larger citable body of literature
A Comprehensive Comparison of Educational Growth Within four Different Developing
Countries Between 1990 and 2012
Revista de Gestão e Secretariado - GeSec, São Paulo, v. 6, n. 3, p 152-174, set./dez. 2015.
156
than smaller or younger journals. All things being equal, the larger the number of previously
published articles, the more often a journal will be cited.
1.4 h-index
The h-index is a country’s number of articles (h) that have received at least h citations.
It quantifies both country scientific productivity and scientific impact and it is also applicable
to scientists, journals, etc("The SCImago Journal & Country Rank," 2014).
1.5 Number of Doctoral Degrees
The number of PhD students can have a significant influence on the amount of
research activities and innovations in universities. PhD candidates are involved in research
and contribute to the development of ideas and innovation those results in an increase in
publication and citations. Researchers need postgraduate students to carry out academic
projects; hence this element is important for increasing the institute’s income and developing
the university’s ranking.
1.6 Number of Academic and Research Staff
Human resource is an essential capital for any organization. As with PhD candidates,
academic and research staff are the big capital for universities due to all the publications,
developments, and innovations they carry out. Therefore it is important to consider the
number of academic and research staff when evaluating universities.
1.7 Institute Income and Research Income
Institute income and the amount of financial support for universities plays an
important role in motivating research development. Increase in the institute income results in
the employment of more researchers and research students, therefore causing a growth in
educational productions and more research outputs.
1.8 International Collaboration
In this study international collaboration applies to the document ratio whose affiliation
includes more than one country address. International collaboration refers to the exchange and
sharing of knowledge among different universities and institutes around the world.
Masoud Shakiba, Nader Ale Ebrahim, Mahmoud Danaee,
Kaveh Bakhtiyari & Elankovan Sundararajan
Revista de Gestão e Secretariado - GeSec, São Paulo, v. 6, n. 3, p 152-174, set./dez. 2015.
157
Researchers can reach the cutting edge in all fields of science by collaborating with other
institutes and exchanging their knowledge and technologies.
2 Research Questions
Bibliometrics is a statistical analysis of written publications, such as books or articles.
Bibliometric methods are frequently used to evaluate the researchers output within
scholars/instructions/countries. Bibliometric analysis is a power full tool to compare the trend
of educational growth within different countries. So, the current study aims to investigate the
critical affecting factors, consists of the number of publications, citations, citations per
document, the number of doctoral degrees, the number of academic staff, and international
collaboration on the educational growth of the developing countries based on the
bibliometrics study. The study also evaluates the correlation coefficient of the investigated
factors. These factors assist the decision makers to evaluate their researchers/institutions and
find the best investing area in order to get high impacts of research. Therefore, the main
research questions are:
Q1- What are the key affecting factors to the educational growth based on the number of
publications?
Q2- In what extent, the investigated factors are correlated to the educational growth?
3 Data Collection
In this study all data are captured from two popular academic databases, Web of
Science (InCites) and SCImago Journal and Country rank. In Web of Science we apply a
longer period of time from 1990 to 2012, while in SCImago we only use the span of 1996 to
2010.
InCites is a research evaluator and objective analyzer of people, programs, and peers
that is owned by the Thomson Reuters company. All data in InCites are reported by institutes.
The SCImago Journal & Country Rank is a portal that includes the journals and
country scientific indicators developed from the information contained in the Scopus database
(Elsevier B.V.). These indicators can be used to assess and analyze scientific domains.
As we already discussed, there are lots of important elements that have an effect on the
educational growth of countries and institutes. Some important elements were explained in the
A Comprehensive Comparison of Educational Growth Within four Different Developing
Countries Between 1990 and 2012
Revista de Gestão e Secretariado - GeSec, São Paulo, v. 6, n. 3, p 152-174, set./dez. 2015.
158
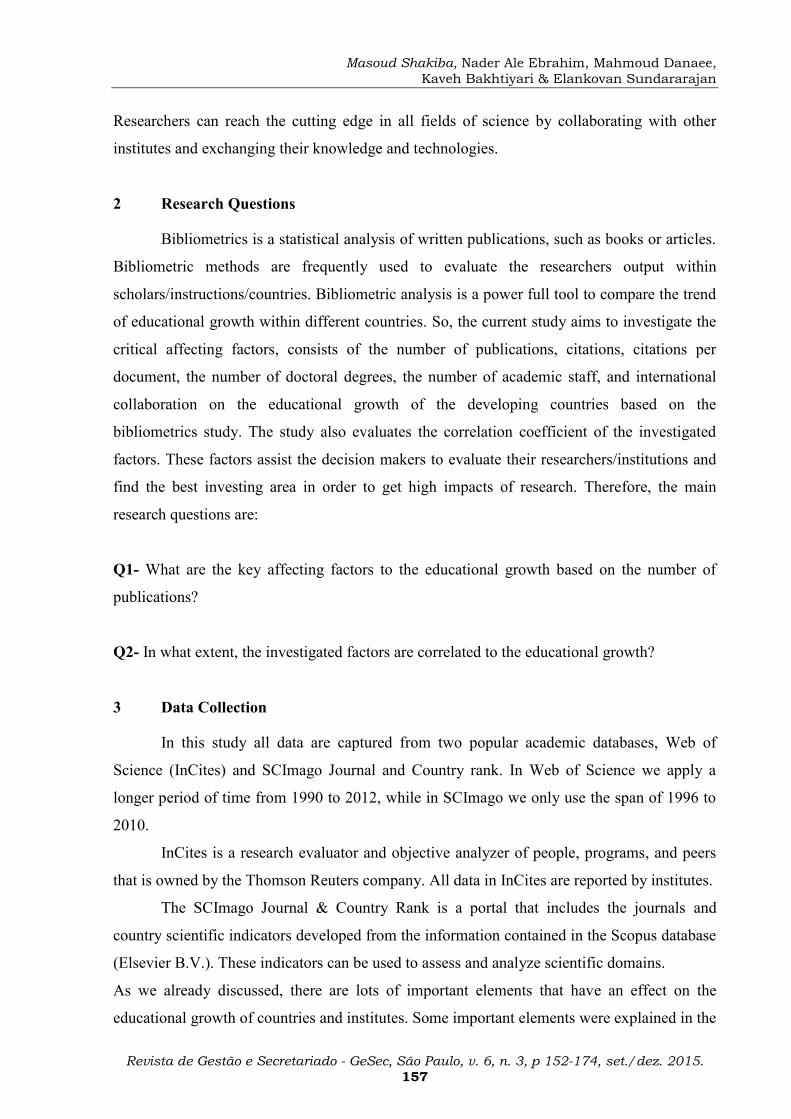
last section. To have a comprehensive comparison of the impact of these elements we selected
four different countries from developing countries: Brazil in South America, Iran in the
Middle East, Turkey in Europe, and Malaysia in Asia. Figure 2 presents a general overview of
the position and performance of the selected countries.
Figure 2. General overview of the position and performance of the selected countries.
4 Methodology
The researcher selected four different developing countries from South America, the
Middle East, Asia, and Europe. For each country we gathered some important academic
elements from two well-known databases: Web of Science (InCites) and Scopus (SCImago).
These academic elements include: the number of publications, citations, citations per
document, the number of doctoral degrees, the number of academic staff, international
collaboration, and so on. All the gathered data are comprehensively compared and discussed
together and also compared to the elements’ world average.
In addition, we apply the Pearson product moment correlation coefficient method, to
show that these collected data are correlated.
The quantity r, called the linear correlation coefficient, measures the strength and the
direction of a linear relationship between two variables. The linear correlation coefficient is
sometimes referred to as the Pearson product moment correlation coefficient in honor of its
developer Karl Pearson.

Masoud Shakiba, Nader Ale Ebrahim, Mahmoud Danaee,
Kaveh Bakhtiyari & Elankovan Sundararajan
Revista de Gestão e Secretariado - GeSec, São Paulo, v. 6, n. 3, p 152-174, set./dez. 2015.
159
The mathematical formula for computing r is:
𝑟 =𝑛 𝑥𝑦 − 𝑥 𝑦
𝑛 𝑥2 − 𝑥 2 𝑛 𝑦2 − 𝑦 2
where n is the number of pairs of data.
The value of r is such that -1 < r < +1. The + and – signs are used for positive linear
correlations and negative linear correlations, respectively. If x and y have a strong positive
linear correlation, r is close to +1. An r value of exactly +1 indicates a perfect positive fit.
Positive values indicate a relationship between x and a y variable such that as values
for x increase, values for y also increase. If x and y have a strong negative linear correlation, r
is close to -1. An r value of exactly -1 indicates a perfect negative fit. Negative values indicate
a relationship between x and y such that as values for x increase, values for y decrease, and
finally if there is no linear correlation or a weak linear correlation, r is close to 0. A value near
zero means that there is a random, nonlinear relationship between the two variables Note that
r is a dimensionless quantity; that is, it does not depend on the units employed.
A perfect correlation of ± 1 occurs only when the data points all lie exactly on a
straight line. If r = +1, the slope of this line is positive. If r = -1, the slope of this line is
negative. A correlation greater than 0.8 is generally described as strong, whereas a correlation
less than 0.5 is generally described as weak. These values can vary based upon the “type” of
data being examined.
5 Results and Discussion
5.1 Analysis on Countries’ Publication
As we mentioned before, one of the most important elements to evaluate the
knowledge growth of any country is the number of documents it produces and publishes.
Figure 3 and Figure 4 illustrate the number of existing documents in WoS from 1990 to 2012
and the number of documents in Scopes during 1996-2011. As shown in Figure 3 Brazil has
more publications and Malaysia is in the last rank.

A Comprehensive Comparison of Educational Growth Within four Different Developing
Countries Between 1990 and 2012
Revista de Gestão e Secretariado - GeSec, São Paulo, v. 6, n. 3, p 152-174, set./dez. 2015.
160
Figure 3. Web of Science number of documents from 1990 to 2012.
Figure 4 not only demonstrates a comparison among four different countries, but
shows the average SCImago publications in the world (all countries’ average publications).
As shown in Figure 4, all four selected countries have a higher number of publications in
comparison with the average. As with the figures from the WoS database, Brazil is found in
the top rank and Malaysia is last. The difference in these two databases is Iran, which is
located at the second rank in SCImago but at the third in WoS. Based on the Figure 4, Iran
has the higher ratio of growth in the number of publications among these selected countries.
Figure 4. Existing documents in SCImago from 1996 to 2011.

Masoud Shakiba, Nader Ale Ebrahim, Mahmoud Danaee,
Kaveh Bakhtiyari & Elankovan Sundararajan
Revista de Gestão e Secretariado - GeSec, São Paulo, v. 6, n. 3, p 152-174, set./dez. 2015.
161
Figure 5 presents the total number of Web of Science publications from 1990 to 2012.
As shown in Figure 5, Brazil is located in the first rank for total number of publications with a
high degree of difference among the other countries. The number of Malaysian publications is
almost seven times smaller than Brazil'’s.
Figure 5. Total number of Web of Science publications from 1990 to 2012.
Figure 6 presents the world percentage of Web of Science publications from 1990 to
2012 among Brazil, Iran, Malaysia, and Turkey. As shown in this figure, the highest
percentage of 2.37% belongs to Brazil and the lowest one to Malaysia (0.23%). Based on
Figure 6, Iran and Malaysia have contributed less than 1% to the total world publication
record in this specific duration of time.
Figure 6. Total world percent of Web of Science publications from 1990 to 2012.
A Comprehensive Comparison of Educational Growth Within four Different Developing
Countries Between 1990 and 2012
Revista de Gestão e Secretariado - GeSec, São Paulo, v. 6, n. 3, p 152-174, set./dez. 2015.
162
Number of publications is a way to quantitatively measure the academic activity of
any organization or country. To evaluate the quality of academic productions and
publications, citation has an important role. Citation shows other researchers’ interest in the
particular publication, therefore it is a helpful measurement of the quality and usability of
publications.
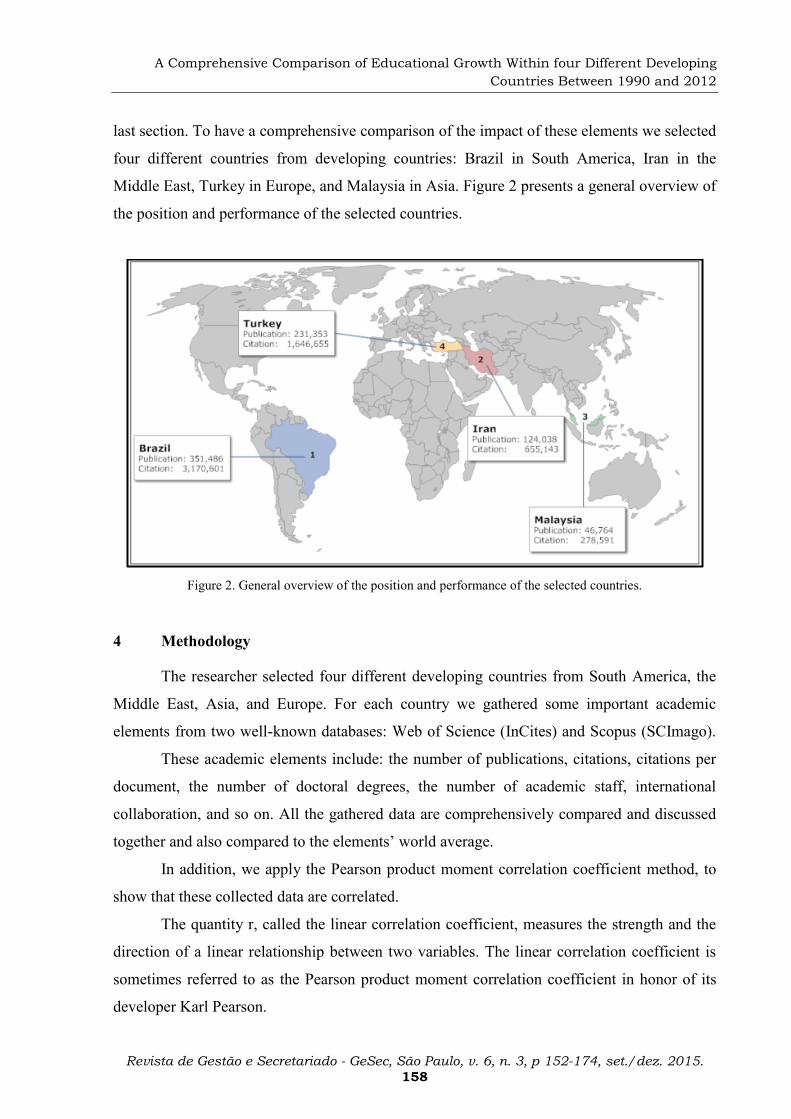
Figure 7 illustrates the Web of Science citations of all publications from 1990 to 2012.
In keeping with the number of publications, Brazil is at the top for number of citations.
Except Malaysia which has a smooth trend, all three other countries see a sharp increase in the
number of citations during this time.
Figure 7. Web of Science times cited from 1990 to 2012.
Figure 8 presents the same trend in the SCImago database from 1996 to 2011. In
comparison with the world average citation numbers, Malaysia has a lower ranking than
average, while Iran touches the average level in 2006 and prefers the higher than average after
that. Based on Figure 8, the quality of the Iran and Malaysia publications is lower than the
average quality of the world publications; this is something they need to consider if they aim
to reach the international academic standards.

Masoud Shakiba, Nader Ale Ebrahim, Mahmoud Danaee,
Kaveh Bakhtiyari & Elankovan Sundararajan
Revista de Gestão e Secretariado - GeSec, São Paulo, v. 6, n. 3, p 152-174, set./dez. 2015.
163
Figure 8. SCImago times cited from 1996 to 2011.
Total Web of Science citations from 1990 to 2012 for Brazil, Iran, Malaysia, and
Turkey is demonstrated in Figure 9. As with the other elements, in total citation Brazil again
achieved first ranking, followed by Turkey in second position, and Iran third. Based on the
Web of Science information, Malaysia has the lowest number of citations in total during these
years.
Figure 9. Total Web of Science citation from 1990 to 2012.
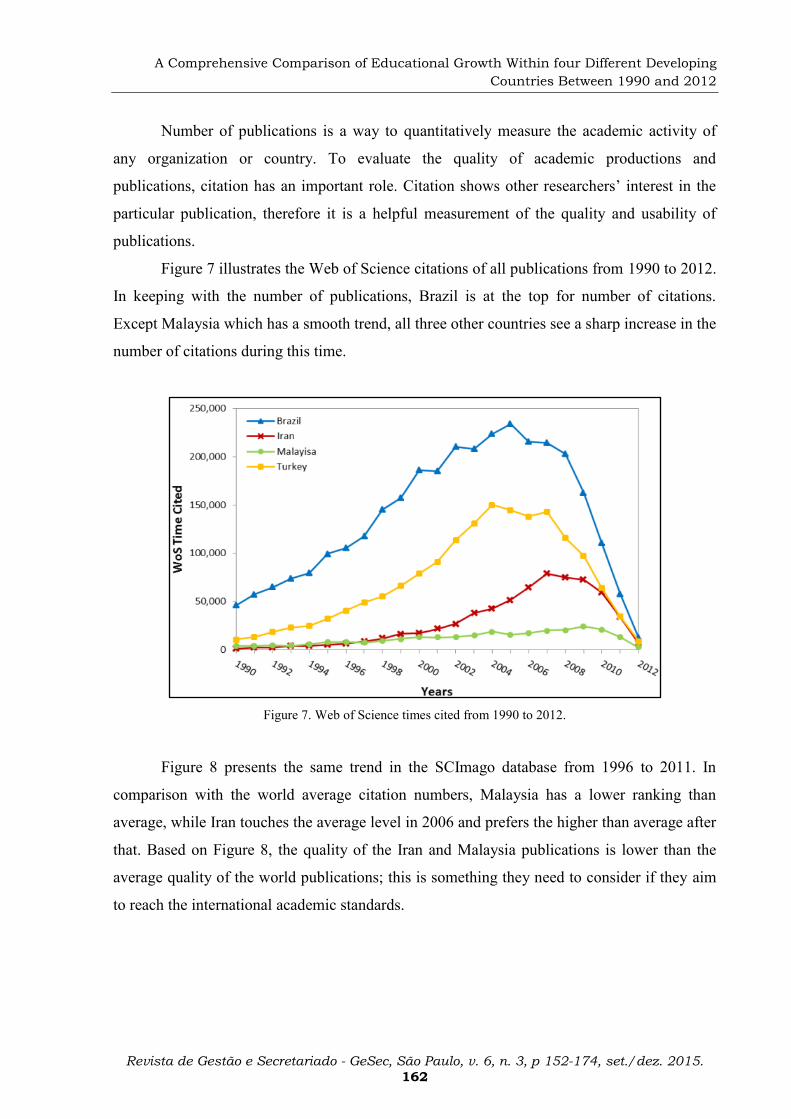
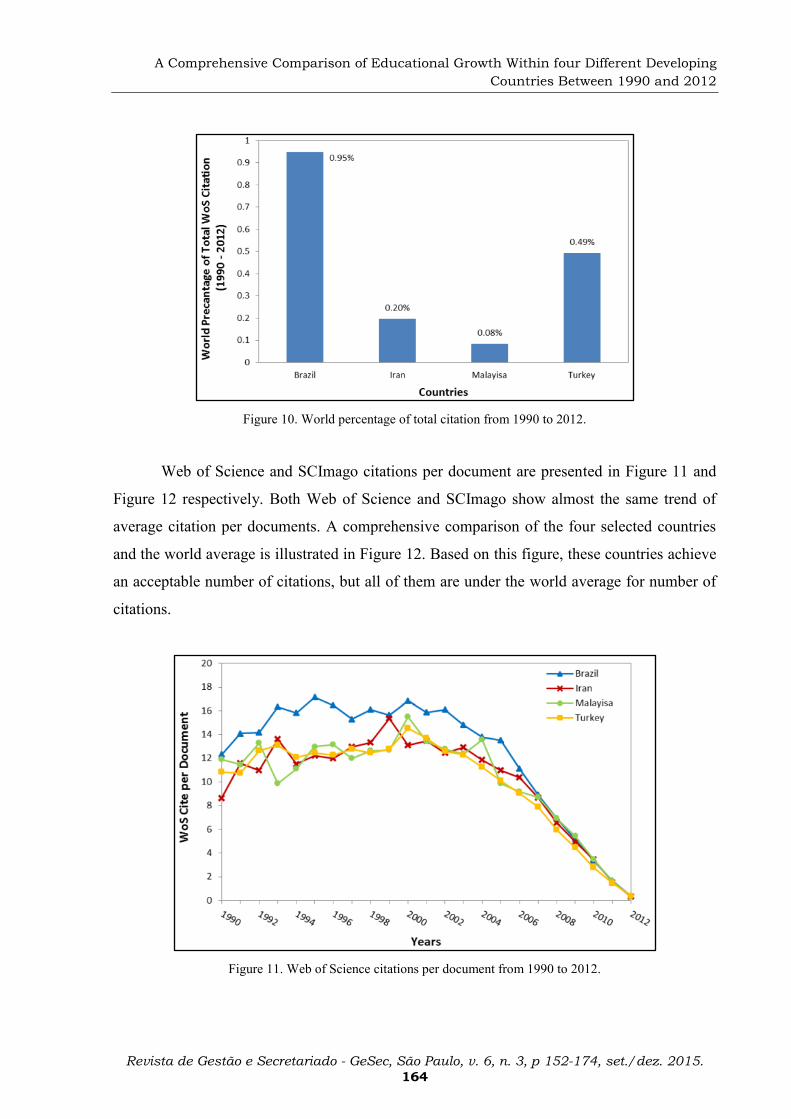
The total citation of these four countries as a percentage of the world total citation is
illustrated in Figure 10. Based on this figure, the percentage of total citation for Brazil,
Turkey, Iran, and Malaysia is approximately around 0.95%, 0.49%, 0.20%, and 0.08%
respectively.
A Comprehensive Comparison of Educational Growth Within four Different Developing
Countries Between 1990 and 2012
Revista de Gestão e Secretariado - GeSec, São Paulo, v. 6, n. 3, p 152-174, set./dez. 2015.
164
Figure 10. World percentage of total citation from 1990 to 2012.
Web of Science and SCImago citations per document are presented in Figure 11 and
Figure 12 respectively. Both Web of Science and SCImago show almost the same trend of
average citation per documents. A comprehensive comparison of the four selected countries
and the world average is illustrated in Figure 12. Based on this figure, these countries achieve
an acceptable number of citations, but all of them are under the world average for number of
citations.
Figure 11. Web of Science citations per document from 1990 to 2012.

Masoud Shakiba, Nader Ale Ebrahim, Mahmoud Danaee,
Kaveh Bakhtiyari & Elankovan Sundararajan
Revista de Gestão e Secretariado - GeSec, São Paulo, v. 6, n. 3, p 152-174, set./dez. 2015.
165
Figure 12. SCImago citations per document from 1996 to 2011.
The total Web of Science citations per document from 1990 to 2012 is presented
inFigure 13. As already shown in Figure5, the total number of published documents in Web
of Science, from 1990 till 2012, is 351486 (Brazil), 124038 (Iran), 46764 (Malaysia), and
231353 (Turkey). Figure 9 and Figure5 present the total number of citations in the same
duration of time: 3170601 (Brazil), 655143 (Iran), 278591 (Malaysia), and 1646655 (Turkey).
Based on this information, Figure 13, generated by Figure 5 and Figure 9, presents the
average number of citations per document from 1990 to 2012. As Figure 13 makes clear, there
is a big gap between the average numbers of citations for documents from the selected
countries in comparison with the world average number of citations per document.
Figure 13. Total citations per document of four selected countries in comparison with world impact factor.

A Comprehensive Comparison of Educational Growth Within four Different Developing
Countries Between 1990 and 2012
Revista de Gestão e Secretariado - GeSec, São Paulo, v. 6, n. 3, p 152-174, set./dez. 2015.
166
As previously defined, h-index is an important index that identifies the quality
measurement of published documents in an organization or country. Based on this definition
and as seen in Figure 14, Brazil, Iran, Malaysia, and Turkey’s h-indexes are 350, 135, 125,
and 210 respectively. This means, in the case of Brazil for example, that there are 350 papers
published by Brazil that achieve at last 350 citations. As with quantity, in the qualification
ranking Brazil is again located in the top rank, followed by Turkey, Iran, and Malaysia
respectively.
Figure 14. h-index of four different selected countries.
5.2 Analysis on Countries Academic Capabilities
The last twelve figures all relate to publications, which is the most important element
used to evaluate the academic ranking. Elements such as number of publications, citations,
citations per documents, impact factor, h-index and so on all relate to publication and they
evaluate publications both quantitatively and qualitatively. As already discussed in the
introduction, there are other important elements that help us evaluate the academic level of
organizations or countries, such as the number of doctoral degrees, the number of academic
staff, institute income, research income, and international collaboration by that organization
or country. In this section we discuss these issues in detail.
The number of doctoral degrees and the number of academic staff (those who do
research and other academic activities), is an important indicator that can be used to rank
universities and countries. Figure 15 presents the average number of doctoral degrees in
Brazil, Iran, Malaysia, and Turkey’s universities in comparison with the world average.

Masoud Shakiba, Nader Ale Ebrahim, Mahmoud Danaee,
Kaveh Bakhtiyari & Elankovan Sundararajan
Revista de Gestão e Secretariado - GeSec, São Paulo, v. 6, n. 3, p 152-174, set./dez. 2015.
167
Based on these figures Brazil, with around 972 doctoral degrees per university is
located in the top rank, with Iran placed second. Malaysia and Turkey, with around 293 and
202 doctoral degrees are in a lower place compared with the world average.
Figure 15. Average number of doctoral degree in different countries in comparison with world average.
Figure 16 shows the number of academic staff on average per university in our four
selected countries in comparison with the world average. Brazil, Malaysia, and Turkey are
located at the first, second, and third rank respectively, and only Iran is placed below the
world average. Based on Figure 16, on average there are around 1500 academic staff in any of
the universities around the world. The average number of active academic staff in Iran is
around 34% under the world average.
Figure 16. Average number of academic staff in different countries in comparison with world average.

A Comprehensive Comparison of Educational Growth Within four Different Developing
Countries Between 1990 and 2012
Revista de Gestão e Secretariado - GeSec, São Paulo, v. 6, n. 3, p 152-174, set./dez. 2015.
168
Institute income and research income are an important indicator of industrial and
commercial companies’ collaborations with universities and research institutes. Figure 17 and
Figure 18 show institute income and research income respectively, demonstrating government
and private companies’ investment in academic research activities. Research income is an
important incentive for all institutes and researchers and always plays an essential role in the
development of research areas and academic activities.
Based on Figure 17, only Brazil reaches the higher level of institute income in
comparison with the world average institute income. After Brazil, Malaysia, followed by Iran
are located at the next levels of institute income. Though Turkey reaches the second ranking
in the number of publications and citations, it achieves last position in the institute income.
Figure 17. Institute income in different countries from 2004 to 2010.
The research income of our four different countries, from 2004 to 2010, is shown in
Figure 18. Based on Figure 18, only Brazil has a higher research income than the world
average research income. Brazil has a sharp increase in 2009 and 2010 from 162 million US
dollars in 2008 to 457 and 518 US dollars in 2009 and 2010 respectively.

Masoud Shakiba, Nader Ale Ebrahim, Mahmoud Danaee,
Kaveh Bakhtiyari & Elankovan Sundararajan
Revista de Gestão e Secretariado - GeSec, São Paulo, v. 6, n. 3, p 152-174, set./dez. 2015.
169
Figure 18. Research income in different universities from 2004 to 2010.
The countries’ international collaboration is demonstrated in Figure 19. Malaysia has
the highest international collaboration in comparison with the other three selected countries; it
is followed by Brazil, then Iran, then Turkey.
Figure 19. International collaboration for different countries from 1996 to 2011.
5.3 Pearson Correlation Coefficient Analysis
As we already mentioned in the methodology, one method of expressing effect sizes is
in terms of strength of association. The most well-known example of this approach is the
Pearson correlation coefficient, r.Using Pearson r, effect sizes are always less than |1.0|,
varying between -1.0 and +1.0 with 0representing no effect and +1 or -1 the maximum effect.
A Comprehensive Comparison of Educational Growth Within four Different Developing
Countries Between 1990 and 2012
Revista de Gestão e Secretariado - GeSec, São Paulo, v. 6, n. 3, p 152-174, set./dez. 2015.
170
In the previous figures we compared some academic elements that have an essential
impact on academic growth of institutes and countries. Table 1 demonstrates the correlation
coefficients of the abovementioned elements. As shown in Table 1, both Web of Science’s
and SCImago’s number of documents have a strong correlation with the number of doctoral
degrees.
Institute income and research income both have a strong positive correlation with the
number of publications (paper) and their correlations are significant at the 0.01 level. It means
that by increasing the number of publications we expect an increase in both research and
institute income directly. Based on Table 1, research income has a strong correlation with the
institute income and they have a direct relationship with each other. Another strong
correlation among the variables exists between the number of academic staff and the number
of doctoral degrees with the r = 0.844 where their correlation is significant at the 0.01 level.
On the other hand, there are also some poor correlations among the selected variables.
For example the level of international collaboration with the number of doctoral degrees and
the number of publications (paper) have very weak correlations with the r = 0.005 and -0.006
respectively; it means there is almost no relationship between them.
An important interpretation of Table 1 is the poor correlation between the citation
number and impact factor on one side and both institute income and the number of academic
staff on the other. It means that there is a poor relationship between the institute income and
citations. In the same way there is almost no relation between the citations and the number of
academic staff and doctoral degrees.
Table 1. Correlation coefficient among variables

Masoud Shakiba, Nader Ale Ebrahim, Mahmoud Danaee,
Kaveh Bakhtiyari & Elankovan Sundararajan
Revista de Gestão e Secretariado - GeSec, São Paulo, v. 6, n. 3, p 152-174, set./dez. 2015.
171
**. Correlation is significant at the 0.01 level (2-tailed).
*. Correlation is significant at the 0.05 level (2-tailed).
Number of
Wos
Document
Time
Cited Impact
SCImago
Citation
SCImago
Cites/Doc
SCImago
Number of
Document
International
Collaboration
Institute
Income
Research
Income Academic
Staff Citations Papers
Time Cited .556**
Impact -.614** .168
SCImago Citation .181 .590** .271*
SCImago Cites/Doc -.529** .181 .981** .220
SCImago Document .986** .549** -.667** .157 -.621**
International
Collaboration -.365** -.150 .332** .546** .303* -.373**
Institute Income .601** .557** .047 .730** .048 .632** .433*
Research Income .716** .395* -.225 .338 -.183 .733** .143 .848**
Academic staff .486* .497** -.017 .324 .026 .496** .193 .574** .512**
Citations .465* .872** .434* .758** .518** .462* .206 .699** .378 .398*
Papers .810** .646** -.238 .464* -.149 .843** -.006 .880** .826** .413* .667**
Number of Doctoral
Degree .800** .744** -.108 .335 .024 .807** .005 .735** .738** .844** .600** .708**
A Comprehensive Comparison of Educational Growth Within four Different Developing Countries
Between 1990 and 2012
Revista de Gestão e Secretariado - GeSec, São Paulo, v. 6, n. 3, p 152-174, set./dez. 2015.
172
6 CONCLUSION
Based on the bibliometrics analysis, for comparing of educational growth within four
different developing countries, Brazil is located in the top rank in almost all factors; consists of the
number of publications, citations, citations per document, the number of doctoral degrees, and the
number of academic staff. In the international collaboration Malaysia take the Brazil place. The
Pearson product moment correlation coefficient analysis shows the positive strong relationship
between the numbers of publications (academic papers) and both the institute and research income.
This means that by increasing the number of publications, the institute and research income
could be expected to increase, and vice versa. There is also a weak relationship between the
citations per document (impact factor) and both institute income and the number of academic staff,
meaning that by increasing the income or the number of academic staff we cannot necessarily
expect a significant change in the number of publications. In this research, firstly, the research
questions were answered and the key affecting factors to the educational growth based on the
number of publications proposed. Next, a comparisons between four developing countries and
world average research outcome, carried out. Finally the decision makers are able to develop a right
strategy for their institutions in order to get the best research impact with investing in the proper
factors to achieve the higher educational growth. In summary: academic decision makers should
invest to increase the number of publications per staff. By increasing the number of academic staff
per nonacademic staff alone, we would not be able to achieve the targeted publications. We should
consider all factors that effecting to the educational growth and make a balance between them.
References
Aghaei Chadegani, A., Salehi, H., Yunus, M. M., Farhadi, H., Fooladi, M., Farhadi, M., et al.
(2013). A Comparison between Two Main Academic Literature Collections: Web of Science and
Scopus Databases. Asian Social Science, 9(5), 18-26.
Ale Ebrahim, N., Salehi, H., Embi, M. A., Habibi Tanha, F., Gholizadeh, H., Motahar, S. M., et
al. (2013). Effective Strategies for Increasing Citation Frequency. International Education Studies,
6(11), 93-99.
Bas, K., Dayangac, M., Yaprak, O., Yuzer, Y., & Tokat, Y. (2011). International Collaboration
of Turkey in Liver Transplantation Research: A Bibliometric Analysis. [Article]. Transplantation
Proceedings, 43(10), 3796-3801.

Masoud Shakiba, Nader Ale Ebrahim, Mahmoud Danaee,
Kaveh Bakhtiyari & Elankovan Sundararajan
Revista de Gestão e Secretariado - GeSec, São Paulo, v. 6, n. 3, p 152-174, set./dez. 2015.
173
Basu, A. (2010). Does a country's scientific 'productivity' depend critically on the number of
country journals indexed? [Article; Proceedings Paper]. Scientometrics, 82(3), 507-516.
Chirici, G. (2012). Assessing the scientific productivity of Italian forest researchers using the
Web of Science, SCOPUS and SCIMAGO databases. [Article]. Iforest-Biogeosciences and
Forestry, 5, 101-107.
De Filippo, D., Casani, F., Garcia-Zorita, C., Efrain-Garcia, P., & Sanz-Casado, E. (2012).
Visibility in international rankings. Strategies for enhancing the competitiveness of Spanish
universities. [Article]. Scientometrics, 93(3), 949-966.
Eshraghi, A., Abu Osman, N. A., Karimi, M. T., Gholizadeh, H., Ali, S., & Wan Abas, W. A. B.
(2012). Quantitative and Qualitative Comparison of a New Prosthetic Suspension System with Two
Existing Suspension Systems for Lower Limb Amputees. American Journal Of Physical Medicine
& Rehabilitation Publish Ahead of Print, 10.1097/PHM.1090b1013e318269d318282a.
Garfield, E. (1955). Citation indexes for science - new dimension in documentation through
association of ideas. Science, 122, 108 - 111.
Garfield, E., & Welljamsdorof, A. (1992). Citation Data - Their Use As Quantitative Indicators
For Science And Technology Evaluation And Policy-Making (Reprinted From Science And Public-
Policy, Vol 19, PG 321-327, 1992). [Reprint]. Current Contents, 49, 5-13.
Gholizadeh, H., Salehi, H., Embi, M. A., Danaee, M., Ordi, A., HabibiTanha, F., et al. (2014).
Economic Growth and Internet Usage Impact on Publication Productivity among ASEAN’s and
World’s Best Universities. Modern Applied Science, 8(5), 169-178.
Ibanez, A., Larranaga, P., & Bielza, C. (2013). Cluster methods for assessing research
performance: exploring Spanish computer science. [Article]. Scientometrics, 97(3), 571-600.
Inglesi-Lotz, R., & Pouris, A. (2013). The influence of scientific research output of academics on
economic growth in South Africa: an autoregressive distributed lag (ARDL) application. [Article].
Scientometrics, 95(1), 129-139.
Moed, H. F., & Glänzel, W. (2004). Handbook of Quantitative Science and Technology
Research: The Use of Publication and Patent Statistics in Studies of S&T Systems. Dordrecht:
Kluwer Academic Publishers.
Mohammadhassanzadeh, H., Samadikuchaksaraei, A., Shokraneh, F., Valinejad, A.,
Abolghasem-Gorji, H., & Yue, C. (2010). A Bibliometric Overview of 30 Years of Medical
Sciences Productivity in Iran. [Article]. Archives of Iranian Medicine, 13(4), 313-317.
Oldford, R. W. (2003). Editorial: Statistics and computing: Having an impact. Statistics and
Computing, 13(2), 87-89.

A Comprehensive Comparison of Educational Growth Within four Different Developing Countries
Between 1990 and 2012
Revista de Gestão e Secretariado - GeSec, São Paulo, v. 6, n. 3, p 152-174, set./dez. 2015.
174
Rakhshandehroo, M., Yusof, M. J. M., Ale Ebrahim, N., Sharghi, A., & Arabi, R. (2015). 100
Most Cited Articles in Urban Green and Open Spaces: A Bibliometric Analysis. Current World
Environment, 10(2), 445-455.
The SCImago Journal & Country Rank. (2014). Retrieved 14 November, 2014, from
http://www.scimagojr.com/help.php
Sweileh, W., Zyoud, S. e., Al-Jabi, S., & Sawalha, A. (2014). Bibliometric analysis of diabetes
mellitus research output from Middle Eastern Arab countries during the period (1996–2012).
Scientometrics, 101(1), 819-832.
Zhai, L., Yan, X., Shibchurn, J., & Song, X. (2014). Evolutionary analysis of international
collaboration network of Chinese scholars in management research. Scientometrics, 98(2), 1435-
1454.
Zhao, D. (2005). Challenges of scholarly publications on the web to the evaluation of science - A
comparison of author visibility on the web and in print journals. Inf Process Manage, 41, 1403 -
1418.