redefining america: key findings from the 2006 latino national survey
TRANSCRIPT
Redefining America: Key Findings from the 2006 Latino National Survey

Latino Diversity
44 million Latinos in the US
Census Bureau (American Community Survey, Released August 2006)
Mexican 63.9%Puerto Rican 9%Cuban 3.5%Salvadoran 2.9%Dominican 2.7%Guatemalan 1.7%Colombian 1.8%ALL OTHERS 14.3%
Native-born (not Island-born): 35.4%
Foreign-born 61%Island-born PR 3.6%No high school diploma 43%College graduate 11.1%
Latino National Survey (unweighted N) Summer 2006
*Mexican 66.1% (5704)*Puerto Rican 9.5% (822)*Cuban 4.9% (420)*Salvadoran 4.7% (407)*Dominican 3.9% (335)*Guatemalan 1.7% (149)*Colombian 1.6% (139)*All Others 7.6%
*Native-born 28.4% (2450)Foreign-born (adults)
66.2% (5717)*Island-born PR 5.4% (467)*No high school diploma 37%*College graduate 16.2%

A Multiplicity of Identities
• Simultaneous strong sense of pan-ethnic identity, national origin identity, and American-ness Puerto Ricans illustrate best
that identities are not mutually exclusive
Cuban pan-ethnicity surprisingly high
Mexican sense of American-ness high considering the share foreign born
AmericanAmericanNational National OriginOrigin
Pan-Pan-EthnicEthnic
MexicanMexican 61.761.7 84.084.0 87.487.4
CubanCuban 77.877.8 82.182.1 81.681.6
Puerto Puerto RicanRican 83.783.7 90.790.7 89.389.3
AllAll 65.065.0 84.084.0 87.287.2
Cells are percent expressing Cells are percent expressing “somewhat” or “very strongly”“somewhat” or “very strongly”
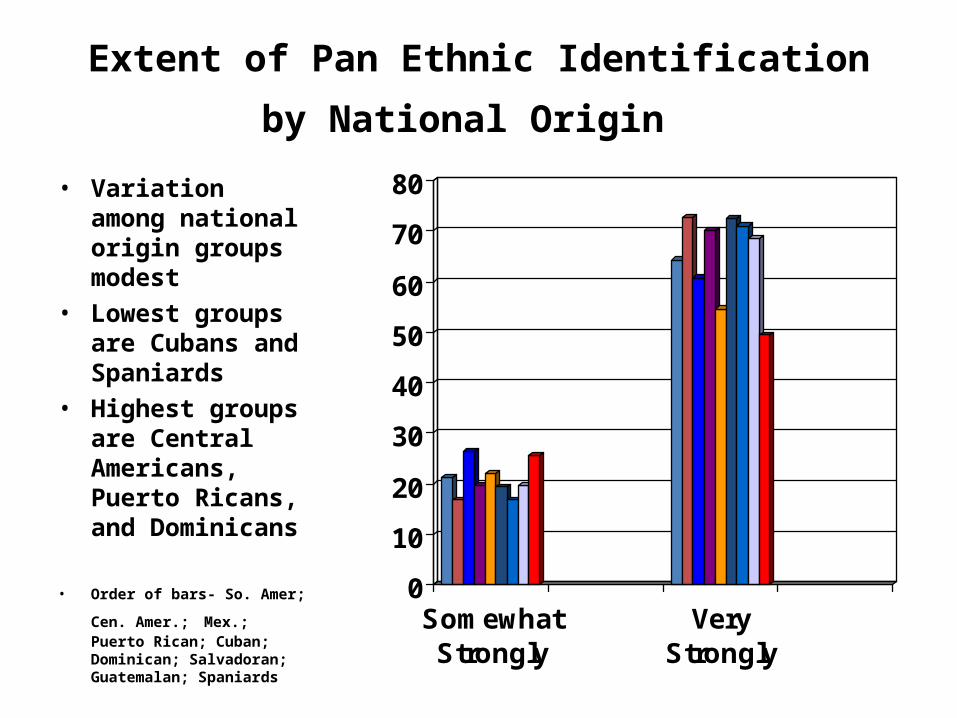
Extent of Pan Ethnic Identification
by National Origin • Variation among
national origin groups modest
• Lowest groups are Cubans and Spaniards
• Highest groups are Central Americans, Puerto Ricans, and Dominicans
• Order of bars- So. Amer; Cen.
Amer.; Mex.; Puerto Rican; Cuban; Dominican; Salvadoran; Guatemalan; Spaniards
0
10
20
30
40
50
60
70
80
SomewhatStrongly
VeryStrongly

Forced Choice: Boxing in Latinos
• However, forced choice reveals more traditional patterns: American-ness suffers among
foreign-born but improves greatly across generations
Puerto Ricans least “Latino” and most stand alone as a group
Share of Mexicans choosing pan-ethnicity equals share choosing national origin
• We caution that this is an artificial choice, one not required of people in the real world
• Preference for pan-ethnicity still more than double what was found in LNPS 1989
Distribution of Single-Identity Preference by National Origin Group
AmericanNational
OriginPan-
Ethnic
Mexican 16.1 38.9 39.0
Cuban 27.7 36.8 26.7
Puerto Rican 21.2 43.9 27.9
All 17.0 38.5 38.0
Cells are percent of group choosing that identity
Latinos and Racial IdentificationLatinos and Racial Identification

•More complex than previously understoodwith confounding notions of phenotype and skin-tone.
•Self-identification distribution among LNS respondents: 67.2% some other race22.8% white .8% black
•Fully 51% of respondents say Latino/Hispanic is a different race!
•But… is Race the same as Skin-tone?
Racial Identification

Determinants of Racial Self-identification
• Racial identification doesn’t obviously vary by citizenship or generation in US.
• With one exception, no obvious differences by national origin or state of residence. – Cubans (and Floridians) are outliers (25% difference with six other major
Latino ethnic groups).– As previously documented, Cuban Americans are more likely than other
Latinos to self-identify as white.
• But…. Even Cuban response is a big shift from LNPS in 1989.
Cuban Distribution white other1989 92.5 3.82006 49.9 43.0
BBuutt
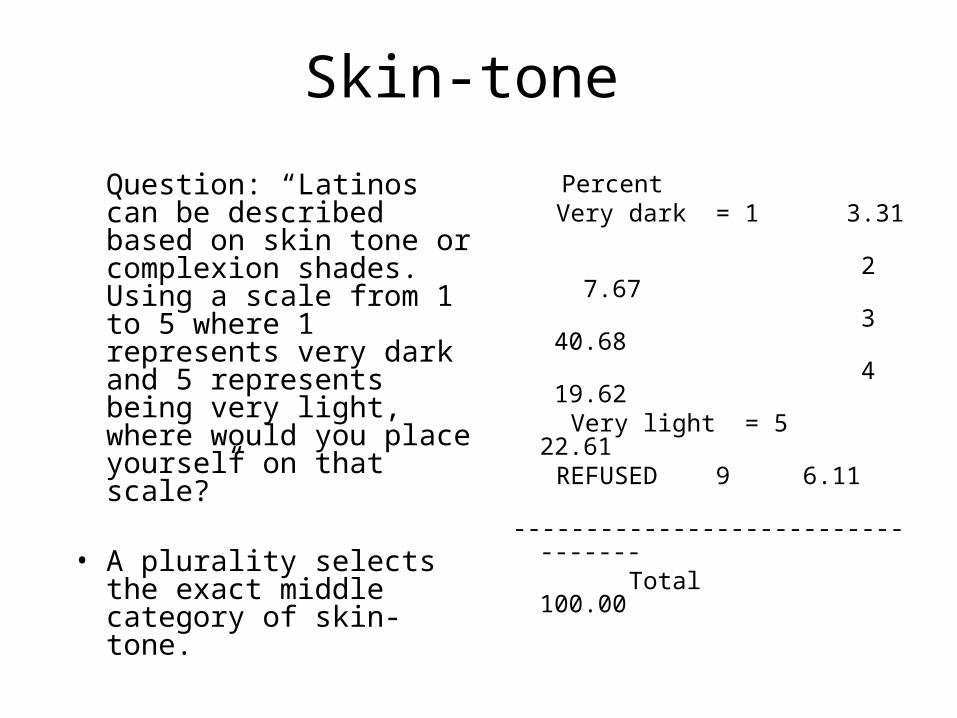
Skin-tone
Question: “Latinos can be described based on skin tone or complexion shades. Using a scale from 1 to 5 where 1 represents very dark and 5 represents being very light, where would you place yourself on that scale?”
• A plurality selects the exact middle category of skin-tone.
Percent Very dark = 1 3.31 2 7.67 3 40.68 4 19.62 Very light = 5 22.61 REFUSED 9 6.11 ---------------------------------- Total 100.00

• Cuban responses for skin-tone is not significantly different from other groups:– 9 % answering ‘dark’ or ‘very dark,’ compared to 10-11% of other
national origin groups.
• Darker skin-tone is associated with lower outcomes in income and home ownership but NOT with employment or education.
• Darker skin-tone also associated with more negative incidents with police, obtaining housing, and service in restaurants.
A Closer Look at Skin-tone
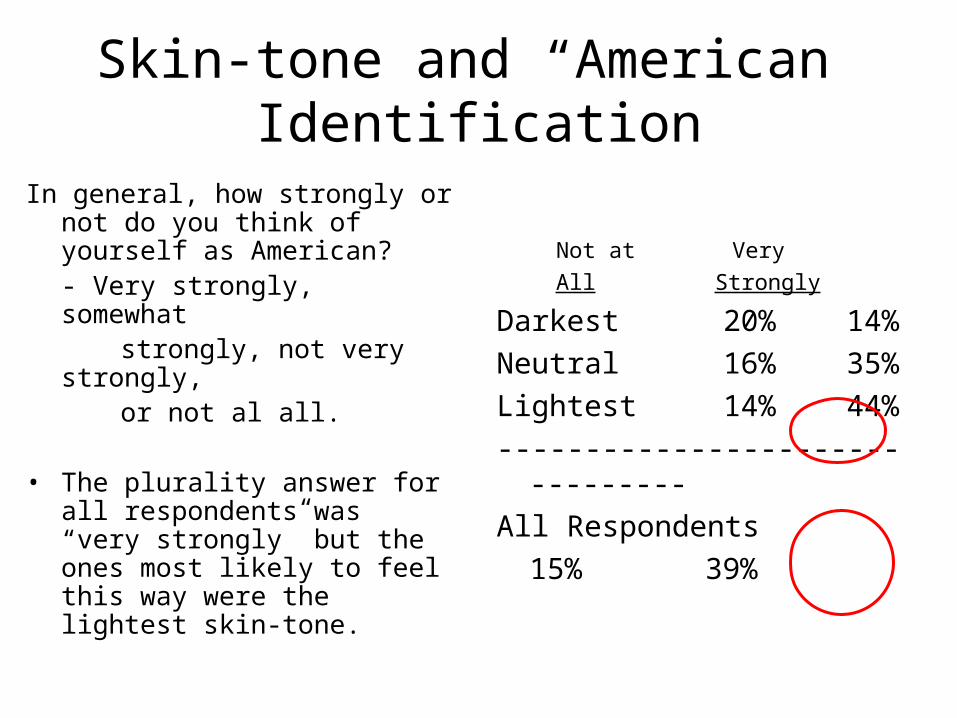
Skin-tone and “American” Identification
In general, how strongly or not do you think of yourself as American?- Very strongly, somewhat
strongly, not very strongly, or not al all.
• The plurality answer for all respondents was “very strongly” but the ones most likely to feel this way were the lightest skin-tone.
Not at Very All Strongly
Darkest 20% 14%Neutral 16% 35%Lightest 14% 44%--------------------------------All Respondents
15% 39%

THE DECLINE OF TRANSNATIONALISM

Plans to Return Permanently to Country of Origin, among First Generation Latinos, by Years in US
Cases weighted by WT_NATIO
Years in US
4946434037343128252219161310741
Inte
nti
on t
o R
eturn
Perm
anen
tly
.5
.4
.3
.2
.1
0.0
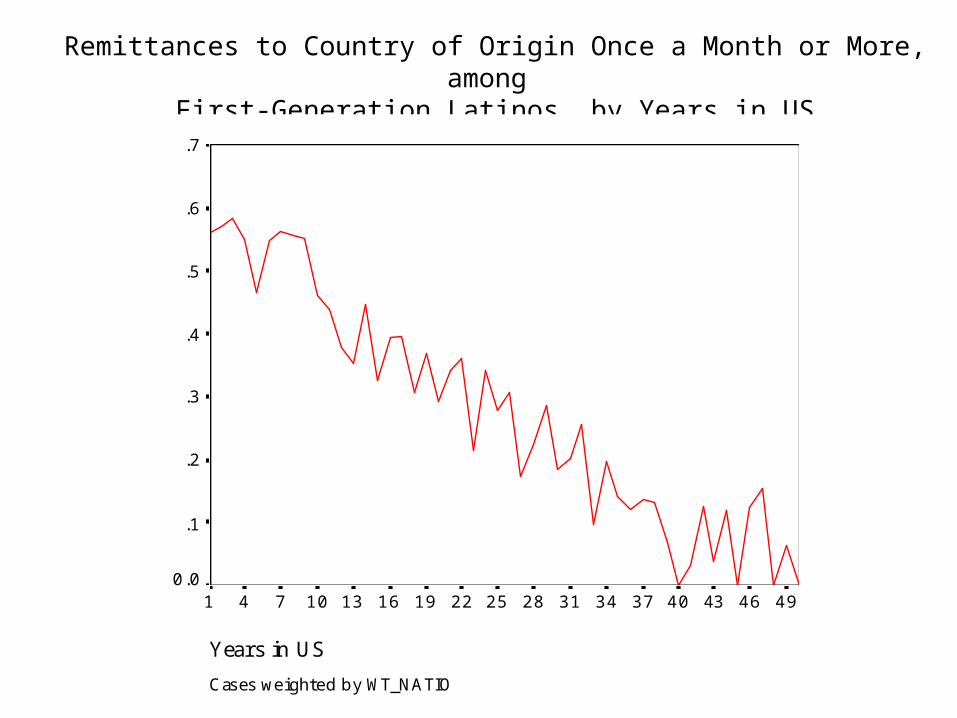
Remittances to Country of Origin Once a Month or More, among First-Generation Latinos, by Years in US
Cases weighted by WT_NATIO
Years in US
4946434037343128252219161310741
Send R
emit
tance
s O
nce
a M
onth
or
More
.7
.6
.5
.4
.3
.2
.1
0.0

Frequent Contact (more than once a month) with Family in Country of Origin, among First-Generation Latinos,
by Years in US
Cases weighted by WT_NATIO
Years in US
4946434037343128252219161310741
Conta
ct O
nce
a M
onth
or
More
1.2
1.0
.8
.6
.4
.2
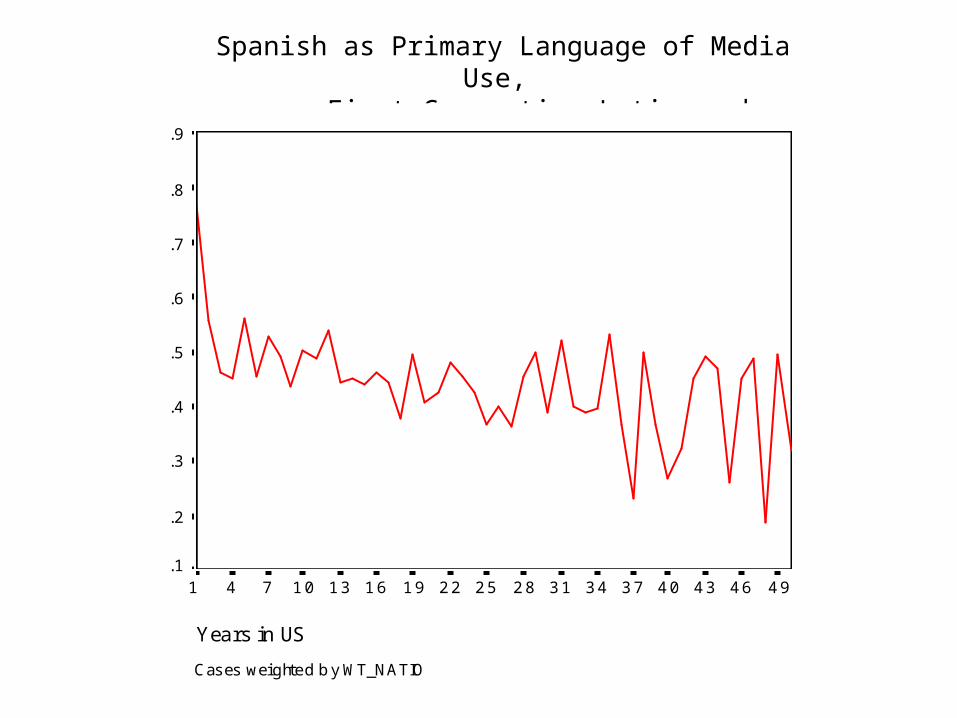
Spanish as Primary Language of Media Use, among First-Generation Latinos, by Years in US
Cases weighted by WT_NATIO
Years in US
4946434037343128252219161310741
Spanis
h a
s P
rim
ary
Langu
age o
f M
edia
Use
.9
.8
.7
.6
.5
.4
.3
.2
.1

Contact with Friends and Family in Country of Origin Once a Month or More, among Latinos in the US, by Generation
Cases weighted by WT_NATIO
Generation in the US
4321
Mean o
f C
onta
ct O
nce
or
More
Per
Month
.9
.8
.7
.6
.5
.4
.3
.2
.1

Remittances to Country of Origin Once a Month or More, among Latinos in the US, by Generation
Cases weighted by WT_NATIO
Generation in US
4321
Mean R
em
itta
nce
Once
a M
onth
or
More
.5
.4
.3
.2
.1
0.0

Spanish as Primary Language of Media Use, among Latinos in the US, by Generation
Cases weighted by WT_NATIO
Generation in US
4321
Mean P
rim
ary
Spanis
h M
edia
.5
.4
.3
.2
.1

Follow Politics in Country of Origin a Lot, among Latinos in the US, by Generation
Cases weighted by WT_NATIO
Generation in US
4321
Mean F
ollo
w P
oliti
cs in C
ountr
y of
Ori
gin
A L
ot
.16
.14
.12
.10
.08
.06
.04

BEING AMERICAN
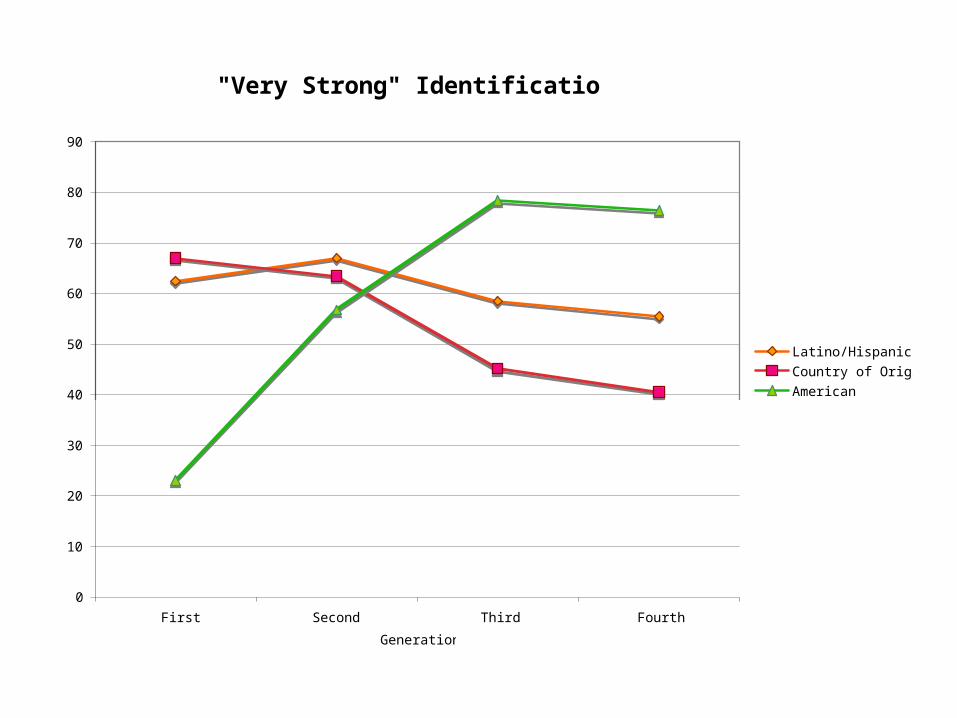
"Very Strong" Identification
0
10
20
30
40
50
60
70
80
90
First Second Third Fourth
Generation
Perc
en
t Latino/Hispanic
Country of Origin
American

Choice of Primary Identifier, by Generation
0
10
20
30
40
50
60
First Second Third Fourth
Percent
Gen
era
tion
in
US
Latino/Hispanic
Country or Origin
American
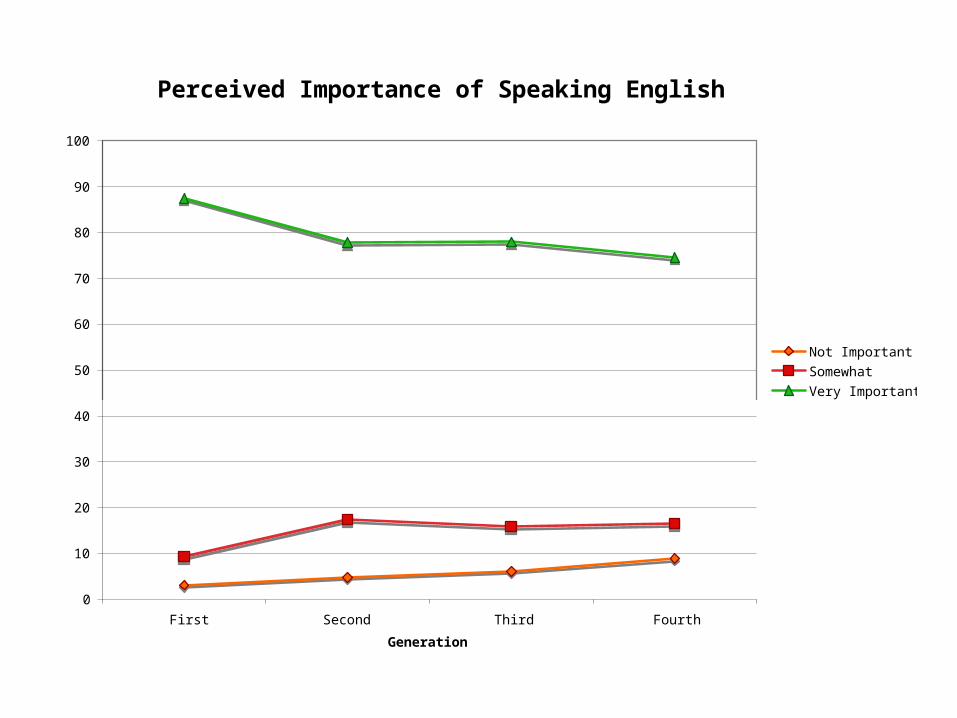
Perceived Importance of Speaking English
0
10
20
30
40
50
60
70
80
90
100
First Second Third Fourth
Generation
Perc
en
t w
ith
in G
en
era
tion
Not Important
Somewhat
Very Important
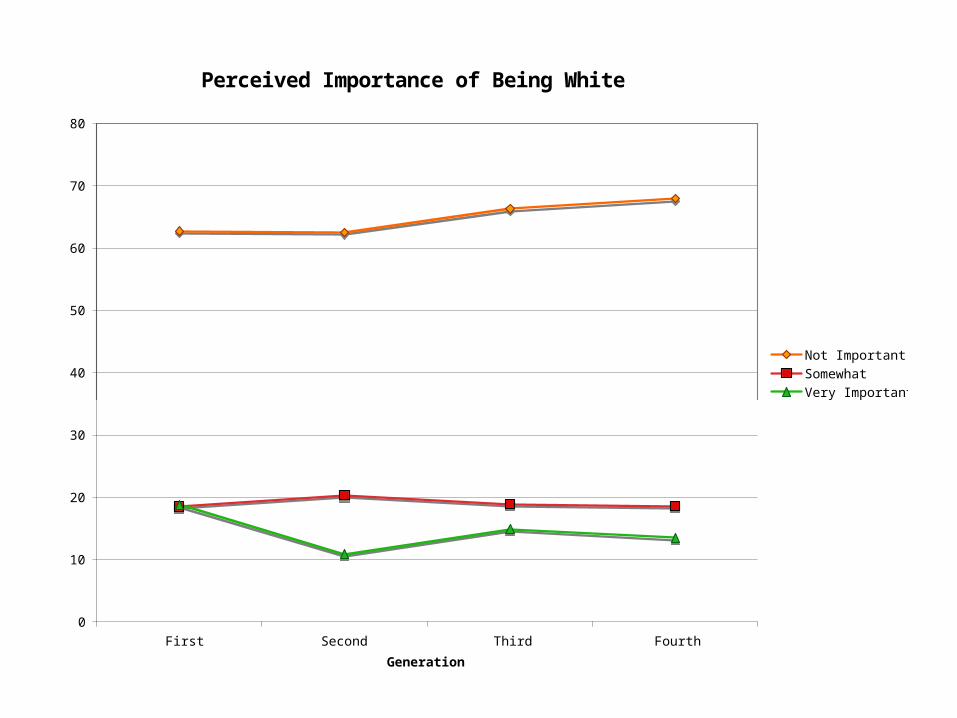
Perceived Importance of Being White
0
10
20
30
40
50
60
70
80
First Second Third Fourth
Generation
Perc
en
t w
ith
in G
en
era
tion
Not ImportantSomewhatVery Important

Perceived Importance of Being Christian
0
5
10
15
20
25
30
35
40
45
50
First Second Third Fourth
Generation
Perc
en
t w
ith
in G
en
era
tion
Not Important
Somewhat
Very Important