redefining data networking
TRANSCRIPT

Redefining data networking.
Annual Report 2003

Transforming into a comprehensive networking solutions providerRevenue/Product Diversification
FY ’01$1.6 billion
FY ’02$361 million
FY ’03$283 million
Core Networking
Metro Networking
Data Networking
Service/Tech Support
Solutions & Software
CIENA Corporation delivers innovative networking solutions to the world’s largest service providersand enterprises, increasing the cost-efficiency of current voice and data services while enabling the creation of new carrier-class data services built upon the existing network infrastructure.
Transforming into a comprehensive networking solutions providerRevenue/Product Diversification

During another difficult year in the telecommunications equip-
ment industry, CIENA held firm to the course we set at the onset
of the telecom downturn, and as a result, we made meaningful
strides toward profitability.
When CIENA’s service provider customers began to dramati-
cally reduce their capital spending three years ago, we embarked
on a strategy designed to increase our addressable market
through a combination of internal development, acquisitions
and strategic alliances. Simultaneously, we also began to take
steps to stabilize and improve our gross margin, as well as
to reduce our operating expenses and align our continued
investment in our business with emerging market opportunities.
We continue to believe that it is the combination of these
actions, as opposed to any one action alone, that will restore
long-term, sustained profitability to our business.
Let’s review our progress:
Driving Future Revenue GrowthWhile CIENA had revenue of $283 million for its fiscal year
ended October 31, 2003, a decrease of 22% when compared
with fiscal 2002 revenue of $361 million, we believe we have
taken significant steps to set the stage for future revenue
growth, including winning new customers, selling more prod-
ucts to existing customers and entering new markets.
• For the year, we recorded revenue from sales to a total of
110 customers representing an increase of more than 42%
over 2002’s customer base of 77.
• Among the new customers added were incumbent carriers
such as BT, SBC and SingTel. In all, we can point to 15 new
product wins in our tier one accounts, which builds our presence
with the kind of important customers that will drive industry
recovery and CIENA’s future growth.
• As a result of the acquisitions of WaveSmith Networks and
Akara Corporation, and our strategic partnerships with Laurel
Networks and Luminous Networks, we estimate we have
increased our addressable market by $3.8 billion, bringing our
total addressable market in 2005 to an estimated $11.6 billion.
• The combination of the two acquisitions and two strategic
partnerships added nine new products to our arsenal, expanding
our portfolio to 20 products.
• As a result of a broader product set, we were able to expand
our reach within key existing accounts, and we sold new or addi-
tional products to 40% more customers than in the previous year.
• We also expanded our sales channels beyond direct sales to
service providers, developing a growing number of partnerships
and other strategic relationships that target enterprise and gov-
ernment customers. During the year, we added 22 new world-
wide channel partners, enabling us to address new geographic
regions and market segments.
Improving Gross MarginsWe successfully improved our gross margin from 13.8% in the
fourth quarter of fiscal 2002 to 31.2% in the fourth quarter of
fiscal 2003. This improvement came as a result of:
• Significantly reducing our fixed cost overhead as a result of
increased outsourcing;
• Adding more profitable product platforms to our portfolio;
• Meaningfully improving the profitability of our services
business; and
• An ongoing focus on product cost reductions.
Reducing CostsIn parallel with the steps to increase our addressable market,
and to improve our gross margin, we also have executed a
program to reduce and restructure our costs, better aligning
them with our market opportunities and changing product mix.
• Since the fourth quarter of fiscal 2001, we have reduced
our quarterly research and development, selling and market-
ing, and general and administrative expenses (exclusive of
deferred stock compensation) by 37%, from $127.2 million
to $79.9 million.
• In the last year, these expenses have declined 25%, despite
the addition of costs associated with two acquisitions.
Additionally, we’ve announced our intention to reduce our
ongoing operating expenses further still in fiscal 2004. Given
our expanded market and product focus, cost reduction must
happen simultaneously with steps to ensure we are spending
strategically, and in line with market and revenue opportunities.
Preserving Balance Sheet StrengthIn addition to the steps we’ve taken to restore profitability to
our business, during 2003 we also took steps to improve an
already-strong balance sheet, reducing our long-term debt by
$113.2 million. Since the end of the fiscal year, we have taken
steps to reduce long-term debt by an additional $48 million with
the redemption of the 5% convertible notes originally issued by
ONI Systems. As a result, we continue to have a stronger net
cash position than many of our peers and competitors.
CIENA’s TransformationWe have taken deliberate steps to evolve from a company that,
just two years ago, derived more than 80% of its revenue from
a single product line into a comprehensive network solutions
provider—one that can offer a wider range of customer solu-
tions that span from the optical core of the network to the edge
where services are created and delivered. As a result, our reve-
nues have diversified significantly, with more than 50% of our
2003 revenue coming from sources outside our historic focus
of core networking.
CIENA Corporation / 2003
Fellow Shareholders:

Many of the new solutions we’ve added to our portfolio in
the last year are focused on data applications and the network
edge. As a result, we’ve grown our revenues in these areas from
zero to 7% year over year. For 2004, our goal is for data/edge
products to contribute more than 30% of total revenues.
This transformation is about more than product and revenue
diversification. In fact, it extends to every facet of our business,
from the products we sell to how we sell them to the way we
receive and process orders to the way we prioritize and spend
R&D dollars.
This transformation is not an option. If CIENA is going to
thrive in today’s telecom environment, we believe that we
cannot simply cost-cut our way back to sustained profitability.
We believe restoring long-term growth and profitability to our
business requires the combination of expanding our address-
able markets while simultaneously reducing and realigning
our investment with the opportunities we see emerging.
We have made solid progress thus far, but there is more
to be done.
The Data ChallengeThe major challenge service providers face is evolving their
networks to process efficiently and deliver profitably a growing
range of data services. The networks of most carriers were
designed to carry voice traffic and deliver voice services. As
the demand for data services grew, these carriers built sepa-
rate data networks and operated them concurrently with their
existing voice networks. Revenue from data services continues
to grow, but in most cases not nearly as fast as data traffic.
It is estimated that in 1999 data services represented 13%
of network traffic and accounted for 13% of revenue. In con-
trast, analysts estimate data services will represent 54% of
network traffic in 2004 but will generate only 16% of revenue.
Moreover, data services are, in general, less profitable than
traditional voice services.
With data surpassing voice as the dominant network traffic
but lagging in terms of profitability, carriers are looking for more
cost-effective and efficient ways to deliver the range of voice
and data services that their customers are demanding. Most
have concluded that the only way to offer advanced voice,
data, video and other services profitably is to consolidate their
separate voice and data networks onto a single converged net-
work, one that is capable of delivering multiple services over
a single infrastructure.
While this vision of eventual network convergence is
widely shared, there are divergent perceptions regarding how
it will come about. Some equipment vendors envision that the
converged network will be based on a completely new network
infrastructure. We believe, however, that the transition to a
converged all-service network will be an evolutionary process,
one in which carriers will leverage the reliability and investment
in their existing networks.
Going ForwardIn the last year, we have substantially increased CIENA’s
addressable market and, we believe, our future revenue and
earnings potential by entering new markets where we antici-
pate growth, predominantly as a result of the demand for this
emerging, all-service network. Going forward, we will look for
additional opportunities to expand our solution portfolio and
increase our addressable market further still through both
additional partnerships and acquisitions. We also will remain
focused on following through on the steps that are necessary
to restore long-term profitability and positive operating cash
flow to our business.
Our team is confident that, as the market continues to
stabilize over the course of 2004, the opportunities are there
for CIENA. On behalf of myself and all the employees of
CIENA, I thank our customers and our shareholders for their
continued support.
GARY B. SMITHPresident, Chief Executive Officer and Director
2003 / CIENA Corporation

FORM 10-K
CIENA Corporation / 2003

UNITED STATES SECURITIES AND EXCHANGE COMMISSIONWashington, D.C. 20549
FORM 10-K
(Mark One)
Annual Report pursuant to Section 13 or 15(d) of the Securities Exchange Act of 1934For the fiscal year ended October 31, 2003
OR
Transition Report pursuant to Section 13 or 15(d) of the Securities Exchange Act of 1934For the transition period from _________ to __________
Commission file number 0–21969
CIENA Corporation(Exact name of registrant as specified in its charter)
(State or other jurisdiction of incorporation or organization) Delaware
(I.R.S. Employer Identification No.) 23–2725311
(Address of principal executive offices) 1201 Winterson Road, Linthicum, MD
(Zip Code) 21090–2205
(Registrant’s telephone number, including area code) (410) 865–8500
Securities registered pursuant to Section 12(b) of the Act: None
Securities registered pursuant to Section 12(g) of the Act: Common Stock
Indicate by check mark whether the registrant: (1) has filed all reports required to be filed by Section 13 or 15(d) of the Securities Exchange Act of 1934 during the preceding 12 months (or for such shorter period that the registrant was required to file such reports), and (2) has been subject to such filing requirements for the past 90 days.
Indicate by check mark if disclosure of delinquent filers pursuant to Item 405 of Regulation S-K is not contained herein, and will not be contained, to the best of registrant’s knowledge, in definitive proxy or information statements incorporated by reference in Part III of this Form 10-K or any amendment to this Form 10-K.
Indicate by check mark whether the registrant is an accelerated filer (as defined in Exchange Act Rule 12b-2).
The aggregate market value of the Registrant’s Common Stock held by non-affiliates of the Registrant was $2,287,132,422, based on the closing price of the Common Stock on the Nasdaq Stock Market on May 2, 2003.
The number of shares of Registrant’s Common Stock, par value $0.01 outstanding as of December 9, 2003 was 473,795,871.
Documents Incorporated by ReferencePart III of the Form 10-K incorporates by reference certain portions of the Registrant’s proxy statement for its 2004 annual meeting of stockholders to be filed with the Commission not later than 120 days after the end of the fiscal year covered by this report.
CIENA Corporation 10-K / 1
Yes
No
Yes
No

The information in this Form 10-K contains certain forward-looking statements, including statements related to
markets for the Company’s products and trends in its business that involve risks and uncertainties. The
Company’s actual results may differ materially from the results discussed in the forward-looking statements.
Factors that might cause such a difference include those discussed in “Management’s Discussion and Analysis
of Financial Condition and Results of Operations—Risk Factors” and “Business” as well as those discussed else-
where in this Form 10-K.
Item 1. Business
GeneralOverviewCIENA is a leading global provider of innovative network solutions to telecommunications service providers andenterprises worldwide. Our customers include long distance carriers, local exchange carriers, cable operators,Internet service providers, wireless and wholesale carriers, resellers, governments, large businesses and non-profit institutions.
CIENA was incorporated in Delaware in November 1992, and we completed our initial public offering on February 7,1997. CIENA’s principal executive offices are located at 1201 Winterson Road, Linthicum, Maryland 21090. Our tele-phone number is (410) 865-8500, and our web site address is www.ciena.com. We make our annual reports onForm 10-K, quarterly reports on Form 10-Q, current reports on Form 8-K, and amendments to those reports availablefree of charge on our web site as soon as reasonably practicable after we file these reports with the Securities andExchange Commission.
In fiscal 2001, CIENA’s annual revenue reached $1.6 billion, based largely on the success of a single product line,long-distance optical transport. In early 2001, the telecommunications industry began a severe decline, which hasaffected almost all of its participants, including equipment suppliers like CIENA. This decline caused the market fornetworking equipment to shrink substantially, with a resulting adverse impact on our revenue and profitability. Inresponse, we embarked upon a strategy designed to increase our addressable market through a combination of inter-nal development, acquisitions and strategic alliances. Since 2001, we have entered new markets by expanding ournetwork solution offerings and worked to increase our market share by adding new features to our existing products.We also have taken steps to expand our sales channels beyond direct sales to service providers, developing a grow-ing number of partnerships and other strategic relationships that target enterprise and government customers. Weplan to continue this strategy, with particular emphasis on offering products to enable delivery of data communica-tions services, because we expect a large portion of capital spending to occur in this area over the next few years. Ingeneral, our intent is to continue to evolve from a vendor of optical networking equipment into a strategic provider ofnetworking solutions.
During fiscal 2003, as part of our efforts to implement our strategy, we completed the acquisitions of WaveSmithNetworks, Inc. and Akara Corporation. WaveSmith was a privately held corporation offering a multi-service switchingproduct designed to be deployed at the edge of carrier networks. Akara was a privately held corporation providingSONET/SDH-based extended storage solutions.
CIENA had revenue of $283 million for its fiscal year ended October 31, 2003, a decrease of 22% when comparedwith fiscal 2002 revenue of $361 million. CIENA recorded a net loss of $387 million in fiscal 2003 compared with a netloss of $1.6 billion for fiscal 2002. For the fiscal year ended October 31, 2003, CIENA recorded revenue from sales to atotal of 110 customers. This represents an increase of more than 42% over 2002’s customer base of 77. During fiscal2003, AT&T and Qwest each represented more than 10% of CIENA’s total revenue.
Over the last two years, in parallel with the steps to increase our addressable market, we have also executed a pro-gram to reduce and restructure our costs, aligning them better with our market opportunities and changing product mix.Since the fourth quarter of fiscal 2001, we have reduced our quarterly research and development, selling and marketing,and general and administrative expenses (exclusive of deferred stock compensation) by 37%, from $127.2 million to
2 / CIENA Corporation 10-K
PART I

$79.9 million. Consistent with our overall strategy, we plan to reduce these expenses further in fiscal 2004, in orderto strike an appropriate balance between ongoing strategic investment in our business and careful expense control andprudent cash management.
The matters discussed in this section should be read in conjunction with the Consolidated Financial Statementsfound under Part II, Item 8 of this Annual Report on Form 10-K.
Industry BackgroundGeneralDeregulation in the United States and privatization in many other countries during the 1990’s began a transition from atelecommunications industry characterized by a small number of heavily regulated large service providers to one inwhich numerous new competitors began to emerge. Rapid traffic growth and readily available capital further fueled thegrowth in the number of service providers, as emerging carriers built networks and fought to take market share fromthe incumbent carriers. The rapid adoption of the Internet prompted service providers and enterprises to construct large-scale data networks as overlays to existing legacy voice networks. During this time, CIENA’s revenue grew to $1.6 bil-lion in fiscal 2001, predominantly from the sale of a single product category, long-distance optical transport equipment.
Beginning in late 2000, capital markets tightened. Service providers responded by curtailing network build-outs anddramatically reducing their overall capital spending, significantly affecting the revenue and profitability of equipmentproviders like CIENA. In addition, many carriers found that they had built networks in anticipation of demand that failedto materialize, and the industry, as a whole, faced a market in which there was significant over-capacity. Some carriers,with inadequate revenue and no access to additional capital, failed. Others reorganized or are still in the process of work-ing through restructurings, leading to a climate of uncertainty.
After several years of significantly lower capital spending, most service providers’ operating costs remain high whiletheir revenue is growing slowly, if at all. In the United States, the incumbent local exchange carriers (ILECs) are losingrevenue to wireless and cable substitution, and interexchange carriers (IXCs) are losing long-distance revenue to ILECsand wireless carriers. Overseas, incumbent carriers, mostly former post, telephone and telegraph enterprises (PTTs), areexperiencing intense price pressure from new players in the their respective markets. As a result of this environment,we expect most service providers to strive to hold aggregate capital spending flat for the next several years and focuson reducing overall network ownership costs and on generating new, higher margin data services.
The Data ChallengeCurrently, the major challenge service providers face is evolving their networks to process efficiently and deliver profitablya growing range of data services. The networks of most ILECs, IXCs and PTTs were designed to carry voice traffic and todeliver voice services. As the demand for data services grew, these carriers built separate data networks and operatedthem concurrently with their existing voice networks. Revenue from data services continues to grow, but in most casesnot nearly as fast as data traffic. It is estimated that in 1999 data services represented 13% of network traffic and accountedfor 13% of revenue. In contrast, analysts estimate data services will represent 54% of network traffic in 2004 but willgenerate only 16% of revenue. Moreover, data services are, in general, less profitable than traditional voice services.
With data surpassing voice as the dominant network traffic but lagging in terms of profitability, carriers are lookingfor more cost-effective and efficient ways to deliver the range of voice and data services that their customers aredemanding. Most have concluded that the only way to offer advanced voice, data, video and other services profitably isto consolidate their separate voice and data networks onto a single converged network, one that is capable of deliver-ing multiple services over a single infrastructure.
While this vision of eventual network convergence is widely shared, there are divergent perceptions regarding howit will come about. Some equipment vendors envision that the converged network will be based on a completely newnetwork infrastructure. We believe, however, that the transition to a converged all-service network will be an evolution-ary process, one in which carriers will leverage their existing network investment. The majority of our strategic initia-tives, partnerships and investments are intended to capitalize on this evolution.
CIENA Corporation 10-K / 3

StrategyIn fiscal 2001, nearly 80% of CIENA’s revenue came from a single product category, long-haul optical transport. Sincethen, through internal development, acquisition and partnerships, we have significantly diversified our product portfo-lio and with it, our customer base. Our strategy is based on leveraging our key strengths to capitalize on serviceproviders’ focus on operational savings and on their move toward converged voice and data networks. We see thesestrengths as:
• A solid base of major customers;
• A position as an industry technology leader; and
• Our experience in successfully introducing economically-driven network innovation.Since the decline in the telecommunications equipment market began, our strategy has been to enhance our com-
petitive position by continuing to invest in our business. This strategy entails taking steps to:
• Expand our addressable market by adding new data-focused products to our portfolio through internal development,acquisition and partnerships.
• Increase our market share within our existing markets by enhancing the features and functions of current productsand focusing on product cost reductions.
• Expand our customer base by directing increased sales efforts toward incumbent carriers, developing new saleschannels and increasing our sales efforts with enterprises and government customers.
• Increase sales to existing customers by leveraging our new features, products and partnerships to establish CIENAas a strategic and attractive supplier.We believe restoring sustained profitability to CIENA requires simultaneous revenue growth and an internal trans-
formation of our business and processes. Our efforts toward this transformation are well underway and will continue.They include:
• Balancing continued strategic investment with careful cost control and prudent cash management;
• Closely aligning investment with opportunity;
• Reducing costs through outsourcing;
• Improving gross margin by adding products with higher software content to the product portfolio;
• Expanding our service offerings and delivering them more profitably;
• Managing our cash prudently; and
• Modifying our business processes to match the demands of our evolving customer base and product portfolio.
CIENA’s SolutionsCIENA’s solutions harness innovation to deliver improved network economics. Our intelligent networking solutions aredesigned to enable service providers to transition from inefficient, legacy, voice-centric networks to more efficient, data-friendly networks. CIENA’s systems and their intelligent networking software address the network scalability and capi-tal spending challenges and the escalating operational costs faced by service providers.
• CIENA’s equipment can replace multiple legacy network elements with fewer, more intelligent network elements,thereby simplifying the network and lowering carriers’ initial capital costs and ongoing operating expenses.
• The software functionality of CIENA’s equipment creates a network environment in which distributed intelligence—intelligence at the network element level—takes the place of centralized network intelligence. As a result, CIENAnetworks can “think” for themselves, making dynamic decisions without human intervention thereby facilitatingprovisioning and protection capabilities and lowering associated operating costs.
• CIENA’s equipment is designed to reduce network operating costs by enabling carriers to manage network trafficand network bandwidth more efficiently.
• CIENA’s equipment is designed to enable carriers to shorten the time it takes to provision services, in some casesfrom months to nearly real-time, thereby accelerating revenue generation.
• In addition to capital and operational cost savings, CIENA’s equipment and network management software isdesigned to enable carriers to offer new, revenue-generating and service-differentiating services.
4 / CIENA Corporation 10-K

Our networking product portfolio, which is targeted at the critical areas of our customers’ networks, includes thefollowing solutions:
Core NetworkingCIENA’s suite of core networking systems helps service providers extract maximum value from their currentSONET/SDH network architectures, while minimizing the risk and cost of integrating new services. Our solutions offerthe switching functionality and long-haul transport capabilities service providers need to enable the creation of newcarrier-class data services.
Core TransportCIENA’s core transport solutions provide a flexible platform with a menu of options that allows service providers to cost-effectively implement long-haul and ultra long-haul dense wavelength division multiplexing (DWDM) applications withina single platform. The core transport family features the following products:
• CoreStream™ Long-Haul Optical Transmission System
• MultiWave Sentry® 4000 Transport System
• MultiWave Sentry® 1600 Transport System
• CoreStream™ System Optical Add/Drop Multiplexers (OADMs)
Core SwitchingCIENA’s core switching solutions support differentiable carrier service offerings by combining, in a single combinedswitching and transport platform, many different protection options and flexible bandwidth management capabilities.The core switching family features the CoreDirector® family of intelligent optical core switches.
Metropolitan NetworkingCIENA’s suite of metropolitan networking systems helps service providers and enterprises collapse and stream-line multiple layers of the network to deliver efficient networking across the metropolitan area for data voice andvideo services.
Metropolitan TransportCIENA’s metropolitan transport solutions target both service provider and enterprise requirements.
• ONLINE Metro™ Multiservice DWDM Transport Platform—provides customers a variety of managed services overa single optical infrastructure
• ONLINE Edge™ Multiservice CWDM Platform—provides a platform to offer high-bandwidth services over a singleoptical infrastructure
• CN 2000™ Storage Extension Platform—customer premise device for extending data and storage applications overdistance to meet business continuance/disaster recovery goals
• MultiWave Metro® Transmission System—DWDM optical transport system designed for use in metropolitan ring applications
• MultiWave Metro One™ Transmission System—part of the MultiWave Metro™ family of DWDM optical networking systems designed for customer premise applications
Metropolitan SwitchingCIENA’s metropolitan switching solution, the MetroDirector K2™ Multiservice Platform, provides a platform to aggre-gate, groom and add or drop services to maximize bandwidth efficiency throughout a carrier’s metro network—fromaccess to core. The MetroDirector K2 offers a comprehensive package of options to support TDM, ATM, and Ethernetswitching capabilities, which help enterprise and service providers generate revenue from traditional private line serv-ices. It also enables new revenue streams from emerging switched data services.
CIENA Corporation 10-K / 5

Multiservice NetworkingCIENA delivers market-leading platforms for metropolitan network multiservice aggregation. CIENA’s DN multiser-vice edge switching platform enhances bandwidth efficiency, provisioning, and scalability by converging traditionaland emerging data services such as ATM, DSL, Frame Relay, TDM/CES, and IP/MPLS in the network core and atthe edge. The platform also offers a safe migration path to IP/MPLS, while simultaneously supporting existinglegacy services.
LightWorks ON-Center® Management SuiteCIENA’s next-generation intelligent optical network management system allows service providers to rapidly provisionand continuously monitor new revenue generating optical services, while increasing the efficiency of existing or newnetworks. The management suite consists of an integrated network manager, a service layer management tool, elementmanagement systems for each product and planning tools.
PartnershipsIn addition to those products developed internally or added through acquisition, CIENA has executed reseller agreementswith both Laurel Networks and Luminous Networks. Under the agreement with Laurel, which is exclusive as to certaindesignated customers, CIENA markets, sells and supports Laurel Networks’ ST200™ Service Edge Router to serviceproviders worldwide. Under the agreement with Luminous, CIENA markets, sells and supports Luminous Networks’entire PacketWave™ family of products.
ServicesCIENA provides a comprehensive portfolio of service and support offerings for its products. Our offerings include:
• Deployment services including network design, product installation, network integration testing and accept-ance testing;
• Maintenance services including parts exchange, engineering dispatch, advanced technical support and hardwareand software warranty extensions; and
• Training and documentation services including product training, service partner training and documenta-tion services.
Product DevelopmentWe believe that to be successful, we must continue to enhance our existing products, maintain our technological com-petitiveness and develop new products that meet our customers’ evolving needs. As a result, CIENA has continued topursue strategic investment in our products and their feature sets despite the downturn in the communications indus-try. Research and development expenses (exclusive of stock compensation cost of $12.8, $15.7 and $17.8 million) were$199.7 million, $239.6 million and $235.8 million for fiscal 2003, 2002 and 2001, respectively. For more informationregarding our research and development expenses, see Item 7. “Management’s Discussion and Analysis of FinancialConditions and Results of Operations.”
We plan to continue to make investments in research and development on enhancements of our existing productsthat we believe will enable service providers and enterprises to increase revenue or improve operating costs. We alsohave engineering efforts underway focused on cost reductions for our products. In addition, we plan to continue to investin the development of new products, especially products that operate at the edge of the network and products thatenable sophisticated services beyond transport and switching.
Our product development process is driven by market demand and a close collaboration among our marketing, salesand product development organizations. We also incorporate feedback from our customers in the product developmentprocess. In some cases, we will work with and invest in partners to develop new or modify existing products. In addi-tion, we participate in industry and standards organizations where appropriate and incorporate information from thesecontacts throughout the product development process.
6 / CIENA Corporation 10-K

Marketing and DistributionWe are focused on selling our innovative network solutions by building long-term relationships with service providers,enterprises, governments and other customers through our direct sales efforts and channel partnerships. We maintaina direct sales presence in locations throughout the United States, Latin America, Canada, Europe and Asia. Throughthese offices we sell and support our network solutions to service provider, enterprise and government customers. Wealso maintain a channel program with a dedicated team that works with resellers, systems integrators and serviceproviders to sell and market our solutions to service providers, enterprises and governments.
In support of its worldwide sales efforts, CIENA conducts marketing communications programs intended to posi-tion and promote its products within the telecommunications industry. Marketing personnel also coordinate our partici-pation in trade shows and conduct media relations activities with trade and general business publications.
ManufacturingCIENA relies on contract manufacturers to assemble and test most of its products. We work closely with these manufac-turers to manage quality, cost and delivery times. We continue to perform much of the assembly and testing of our coretransport products, but outsource all of the printed circuit board assembly and some of the optical assembly and modulefunctional testing. We manufacture in-house all the in-fiber Bragg gratings used in our core transport products. All prod-ucts undergo a final system test performed by us in our Maryland facility. We will continue to evaluate the extent to whichthird party manufacturers can do even more of our manufacturing and testing on a reliable and cost-effective basis.
CompetitionCompetition in the telecommunications equipment industry is intense, and became increasingly so as the market forcommunications networking equipment declined. CIENA’s competition is dominated by a small number of very large,usually multi-national, vertically integrated companies each of which has substantially greater financial, technical andmarketing resources, and greater manufacturing capacity as well as better established relationships with the incumbentcarriers than CIENA. Included among CIENA’s competitors are: Alcatel, Cisco Systems, Inc. (“Cisco”), Fujitsu Group(“Fujitsu”), Hitachi Ltd. (“Hitachi”), Huawei Technologies Co. Ltd (“Huawei”), Lucent Technologies Inc. (“Lucent”),Marconi Corporation (“Marconi”), NEC Corporation (“NEC”), Nortel Networks (“Nortel”), Siemens AG (“Siemens”),Telefon AB LM Ericsson (“Ericsson”), and Tellabs, Inc. (“Tellabs”). There are also several smaller, but established com-panies, such as ADVA AG Optical Networking, and Sycamore Networks, Inc., that offer one or more products that com-pete directly or indirectly with our offerings. In addition, there are a variety of earlier-stage companies with productstargeted at the communications networking market in some stage of development or deployment, most of thememploying advanced technology that could offer advantages over products offered by CIENA.
Patents and Other Intellectual Property RightsAs of November 30, 2003, CIENA had received 154 United States patents and had pending 260 U.S. patent applications.We also have a number of foreign patents and patent applications. Of the United States patents that have been issuedto CIENA, the earliest any will expire is 2015. In addition, CIENA has licensed patents from third parties. CIENA alsolicenses from third parties certain software components for its network management products. These licenses are per-petual but will generally terminate after an uncured breach of the agreement by CIENA. CIENA also relies on contractualrights, trade secrets and copyrights to establish and protect its proprietary rights in its products.
CIENA enforces its intellectual property rights vigorously against infringement or misappropriation. CIENA’s practiceis to require its employees and consultants to execute non-disclosure and proprietary rights agreements upon com-mencement of employment or consulting arrangements with CIENA. These agreements acknowledge CIENA’s exclu-sive ownership of all intellectual property developed by the individual during the course of his or her work with CIENA,and require that all proprietary information disclosed to the individual will remain confidential. CIENA’s employees gen-erally also sign agreements not to compete, in jurisdictions where these agreements are enforceable, with CIENA for aperiod of twelve months following any termination of employment.
CIENA Corporation 10-K / 7

We are currently engaged in two patent lawsuits. See Item 3. “Legal Proceedings.” In addition, parties who claimthat we may be infringing one or more of their patents approach us from time to time demanding that we take a licensefrom them. We are currently engaged in several discussions regarding such assertions. As part of a settlement of a suitbrought by Nortel, we have agreed to attempt to negotiate a patent cross-license agreement with it.
EmployeesAs of October 31, 2003, CIENA and its subsidiaries employed 1,816 persons, of whom 787 were primarily engaged inresearch and development activities, 265 in manufacturing, 198 in installation services and customer support, 354 insales and marketing related activities, and 212 in administration. None of CIENA’s employees are currently representedby a labor union. CIENA considers its relations with its employees to be good.
Directors and Executive OfficersThe table below sets forth certain information concerning each of the directors and executive officers of CIENA:Name Age PositionPatrick H. Nettles, Ph.D.(1) 60 Executive Chairman of the Board of Directors
Gary B. Smith(1) 43 President, Chief Executive Officer and Director
Stephen B. Alexander 44 Senior Vice President, Chief Technology Officer
Steve W. Chaddick 52 Senior Vice President, Corporate Strategy and Marketing
Joseph R. Chinnici 49 Senior Vice President, Finance and Chief Financial Officer
James F. Collier III 45 Senior Vice President, Corporate Development
Nicholas S. Jeffery 35 Senior Vice President, World Wide Sales
Jesús León 59 Senior Vice President, Chief Development Officer
Edward A. Ogonek 41 Senior Vice President, General Manager of Metro and Enterprise Solutions
Robert A. O’Neil 45 Senior Vice President, General Manager of Data Networking
Arthur Smith, Ph.D. 37 Senior Vice President, Global Operations
Russell B. Stevenson, Jr. 62 Senior Vice President, General Counsel and Secretary
Andrew C. Petrik 40 Vice President, Controller and Treasurer
Stephen P. Bradley, Ph.D.(1)(3)(4) 62 Director
Harvey B. Cash(1)(2)(4) 65 Director
Don H. Davis, Jr.(1)(2) 64 Director
John R. Dillon(1)(3) 62 Director
Lawton W. Fitt(1)(3) 50 Director
Judith M. O’Brien(1)(2)(4) 53 Director
Gerald H. Taylor(1)(2) 62 Director
(1) The Company’s Directors hold staggered terms of office, expiring as follows: Ms. O’Brien and Messrs Cash and Smith in 2005; Ms. Fitt and Messrs.Dillon and Nettles in 2004; Messrs. Bradley, Davis and Taylor in 2006
(2) Member of the Compensation Committee
(3) Member of the Audit Committee
(4) Member of the Governance and Nominations Committee
Patrick H. Nettles, Ph.D. has served as Executive Chairman of the Board of Directors since May 2001. FromOctober 2000 to May 2001, Dr. Nettles was Chairman of the Board and Chief Executive Officer, and he was President,Chief Executive Officer and Director from April 1994 to October 2000. Dr. Nettles serves as a Trustee for the CaliforniaInstitute of Technology and also serves on the Advisory Board to the President at Georgia Institute of Technology.Dr. Nettles also serves on the board of directors of Axcelis Technologies, Inc.
Gary B. Smith has served as Chief Executive Officer since May 2001; President, Chief Operating Officer andDirector since October 2000; and Senior Vice President, Chief Operating Officer from August 1999 to October 2000.
8 / CIENA Corporation 10-K

Mr. Smith served as Senior Vice President, Worldwide Sales from September 1998 to August 1999, and was previ-ously Vice President of International Sales since joining the Company in November 1997. He currently serves onthe board of directors for the American Electronics Association and as a commissioner for Global InformationInfrastructure Commission.
Stephen B. Alexander has served as Senior Vice President and Chief Technology Officer of CIENA since January2000. He served as CIENA’s Vice President and Chief Technology Officer from September 1998 to January 2000.
Steve W. Chaddick was appointed CIENA’s Chief Strategy Officer in May 2001, in addition to his existing responsibili-ties as Senior Vice President, Systems and Technology, a role he has held since February 2000. Between July 1999 andFebruary 2000, Mr. Chaddick served as President of CIENA’s Core Switching Division. From August 1998 to July 1999, heserved as the Company’s Senior Vice President, Strategy and Corporate Development.
Joseph R. Chinnici has served as CIENA’s Senior Vice President, Finance and Chief Financial Officer sinceAugust 1997. From May 1995 to August 1997, Mr. Chinnici served as the Company’s Vice President, Finance andChief Financial Officer. Mr. Chinnici joined CIENA in September 1994 as its Controller. Mr. Chinnici serves on theboard of directors for Guilford Pharmaceuticals Inc.
James F. Collier III has served as Senior Vice President, Corporate Development since June 2003. He served asCIENA’s Vice President, North American Sales between May 2002 and May 2003. Prior to joining CIENA, Mr. Collier wasemployed by Nortel as Vice President of Major Accounts between April 2001 and April 2002 and Vice President ofBusiness Management, Wireless Networks Division from January 1997 to April 2001.
Nicholas S. Jeffery has served as Senior Vice President, World Wide Sales since November 2003. He servedas CIENA’s Vice President, International Sales from September 2003 to November 2003 and Managing Director andVice President, Europe, Middle East and Africa from June 2003 to September 23. Prior to joining CIENA, Mr. Jefferyfounded and was director of Microfone UK Ltd., a reseller of voice services, from January 2003 to June 2003.Mr. Jeffery remains a director of Microfone. From April 2003 to January 2003, Mr. Jeffery was the Chief ExecutiveOfficer of the Markets Group of Cable & Wireless Global. Prior to holding this position, Mr. Jeffery served in a vari-ety of other senior sales and management positions with Cable & Wireless Global and other Cable & WirelessGroup Companies.
Jesús León has served as Senior Vice President, Chief Development Officer since August 2002. Mr. León servedas Senior Vice President, Metro Transport and Metro Switching from August 2001 to August 2002, Senior Vice President,Metro Transport from May 2001 to August 2001, Senior Vice President, Products and Technology between March 1999and May 2001, and Vice President, Products and Technology between September 1998 and March 1999.
Edward A. Ogonek has served as Senior Vice President, General Manager of Metro and Enterprise Solutionssince November 2003. He served as Senior Vice President, General Manager of Enterprise Solutions for CIENAbetween August 2003 and November 2003. From November 2000 until he joined CIENA, Mr. Ogonek served asPresident and Chief Executive Officer of Akara Corporation, which was acquired by CIENA in August 2003. Beforejoining Akara, Mr. Ogonek was employed by Alcatel, serving as Senior Vice President and General Manager, Edge DataNetworks from May 2000 to November 2000. From May 1997 to May 2000, Mr. Ogonek served in a variety of seniormanagement positions with Newbridge Networks and Alcatel.
Robert A. O’Neil has served as Senior Vice President, General Manager of Data Networking since November 2003.He served as Vice President of Data Networking for CIENA between June 2003 and November 2003. From November2002 until he joined CIENA, Mr. O’Neil served as Vice President of Sales of WaveSmith Networks, which was acquiredby CIENA in June 2003. From January 2001 to November 2002, Mr. O’Neil was a Venture Partner of Bessemer VenturePartners, a venture capital firm. From April 1998 to December 2002, Mr. O’Neil served as the Vice President of Sales,Network Access Division of Nortel.
Arthur Smith, Ph.D. has served as Senior Vice President, Global Operations since September 2003. Previously,Dr. Smith served as Senior Vice President, Worldwide Customer Services and Support from June 2002 to September2003 and as Senior Vice President, Core Transport Division from May 2001 through June 2002. Prior to May 2001, heheld engineering management positions in CIENA’s Transport Division since joining the company in May 1997.
CIENA Corporation 10-K / 9

Russell B. Stevenson, Jr. has served as Senior Vice President, General Counsel and Secretary since joining CIENAin August 2001. From March 2000 to August 2001, he was Executive Vice President, General Counsel and Secretary ofARBROS Communications, Inc., an integrated communications provider. From 1996 to 2000, Mr. Stevenson wasExecutive Vice President and General Counsel of CyberCash, Inc.
Andrew C. Petrik has served as Vice President, Controller and Treasurer of CIENA since August 1997.Stephen P. Bradley, Ph.D. has served as Director of the Company since April 1998. Professor Bradley is the William
Ziegler Professor of Business Administration and the Chairman of the Program for Management Development at theHarvard Business School. A member of the Harvard faculty since 1968, Professor Bradley is also Chairman of Harvard’sExecutive Program in Competition and Strategy.
Harvey B. Cash has served as Director of the Company since April 1994. Mr. Cash is a general partner of InterWestPartners, a venture capital firm in Menlo Park, California that he joined in 1985. Mr. Cash serves on the board of direc-tors of i2 Technologies Inc., Silicon Laboratories, Inc., Microtune, Inc., Liberté Investors Inc., and Airspan Networks, Inc.In addition, he is a member of the boards of several private corporations.
Don H. Davis, Jr. has served as Director of the Company since March 2002. Mr. Davis has been Chairman and CEOof Rockwell Automation, Inc. since 1998. (Rockwell International Corporation changed its name to Rockwell Automation,Inc. on June 29, 2001.) He previously served as Executive Vice President and Chief Operating Officer with responsibilityfor Rockwell International’s automation and former semiconductor systems and automotive components businesses. Inaddition to the Rockwell Automation board, Mr. Davis serves on the boards of Illinois Tool Works, Inc. and ApogentTechnologies Inc. He is also a member of the Business Council, the Business Roundtable, and The Conference Board. Heis also a past chairman of the Board of Governors of the National Electrical Manufacturers Association, Washington, DC.
John R. Dillon has served as Director of the Company since October 1999. Mr. Dillon has served in a variety ofpositions at The Coca-Cola Company, Scientific-Atlanta, Inc. and Fuqua National. Mr. Dillon joined Cox Enterprises in1980 and, until his retirement in 1996, served as Senior Vice President, Chief Financial Officer and director.
Lawton W. Fitt has served as Director of the Company since November 2000. Ms. Fitt was appointedSecretary (Chief Executive) of the Royal Academy of Arts in London in October 2002. Responsible for the day-to-day operation of the Royal Academy, she is the first woman and the first American to have been appointedSecretary in the Academy’s history. Prior to her appointment, Ms. Fitt was an investment banker with GoldmanSachs & Co. from 1979 to October 2002, where she was a partner from 1994 and a managing director from 1996to October 2002. Ms. Fitt is a trustee of the Darden School Foundation.
Judith M. O’Brien has served as Director of the Company since July 2000. Since February 2001, Ms. O’Brien hasbeen a Managing Director at INCUBIC L.L.C., a venture capital firm in Mountain View, California. From 1984 until 2001,she was a partner with Wilson Sonsini Goodrich & Rosati, where she specialized in corporate finance, mergers and acqui-sitions and general corporate matters.
Gerald H. Taylor has served as Director of the Company since January 2000. Mr. Taylor serves as a ManagingMember of MortonsGroup, LLC and serves on the board of directors of Lafarge North America Inc. From 1996 to 1998,Mr. Taylor was Chief Executive Officer of MCI Communications Corporation.
Trademarks“CIENA,” “MultiWave” and “MultiWave Sentry” are registered trademarks of CIENA. “CoreDirector,” “CoreDirector CI,”“CoreStream,” “Fastmesh,” “Fastpath,” “Flexible Concatenation,” “JEM,” “LightWorks,” “LightWorks OS,” “LightWorksONCenter,” “LightWorks Toolkit,” “MultiWave CoreDirector,” “MultiWave CoreStream,” “MultiWave Metro,” “MultiWaveMetro One,” “ONCenter,” “OSRP,” “SmartSpan,” “SmartSupport,” “SmartTools,” “VLSR,” “ONLINE,” “OPTX,” and“ONWAVE” are trademarks of CIENA under federal and state law.
Item 2. PropertiesAs of October 31, 2003, all of CIENA’s properties are leased. CIENA’s principal executive offices are located in Linthicum,Maryland. We lease nine facilities related to ongoing operations, including the five buildings located at various sites near
10 / CIENA Corporation 10-K

Linthicum, Maryland, one as an engineering facility, three as manufacturing facilities, and one as an administrative andsales facility. The Company also has engineering and/or service facilities located in Alpharetta, Georgia; San Jose,California; Durham, North Carolina; Acton, Massachusetts; and Ottawa, Ontario. The Company also leases various smalloffices in the United States and abroad to support its sales and services. We believe the facilities we are now using areadequate and suitable for business requirements.
CIENA leases a number of properties that we no longer occupy. As part of its restructuring costs, CIENA provides forthe estimated cost of the net lease expense for these facilities. The cost is based on the future minimum lease paymentsunder contractual obligations offset by estimated future sublease payments. As of October 31, 2003, CIENA’s accruedrestructuring liability related to these properties was $63.7 million. If actual market conditions are less favorable than thoseprojected by management, additional restructuring costs associated with these facilities may be required. For additionalinformation regarding the Company’s lease obligations, See Item 8. “Financial Statements and Supplementary Data.”
Item 3. Legal ProceedingsOn October 3, 2000, Stanford University and Litton Systems filed a complaint in the United States District Court for theCentral District of California alleging that optical fiber amplifiers incorporated into CIENA’s products infringe U.S. PatentNo. 4,859,016 (the “016 Patent”). The complaint seeks injunctive relief, royalties and damages. We believe that wehave valid defenses to the lawsuit and intend to defend it vigorously. On October 10, 2003, the court stayed the casepending final resolution of matters before the U.S. Patent and Trademark Office (the “PTO”), including a request for anddisposition of a reexamination of the 016 Patent. On October 16, 2003, the PTO granted reexamination of the 016Patent, thus resulting in a continuation of the stay of the case.
On July 19, 2000, CIENA and CIENA Properties, Inc., a wholly owned subsidiary of CIENA, filed a complaint in theUnited States District Court for the District of Delaware requesting damages and injunctive relief against CorvisCorporation (“Corvis”). The suit charged Corvis with infringing four patents relating to CIENA’s optical networking com-munication systems and technology. A jury trial to determine whether Corvis is infringing these patents commenced onFebruary 10, 2003. On February 24, 2003, the jury decided that Corvis was infringing one of the patents and not infring-ing two others. The jury was deadlocked with respect to infringement on the fourth patent. This trial was immediatelyfollowed by a trial on Corvis’ affirmative defenses based on the validity of two of the patents. On February 28, 2003, thejury in this trial determined that the patents were valid. In April 2003, following a third trial, another jury decided thatCorvis had infringed the fourth patent on which the previous jury had deadlocked. Based on these favorable verdicts col-lectively holding that Corvis is infringing two valid CIENA patents, CIENA has moved for an injunction to prohibit the saleby Corvis of the infringing products. The court has not yet ruled on this motion.
As a result of the merger with ONI Systems Corp. (“ONI”), we became a defendant in a securities class action law-suit. Beginning in August 2001, a number of substantially identical class action complaints alleging violations of the fed-eral securities laws were filed in the United States District Court for the Southern District of New York. These complaintsname ONI, Hugh C. Martin, ONI’s former chairman, president and chief executive officer; Chris A. Davis, ONI’s formerexecutive vice president, chief financial officer and administrative officer; and certain underwriters of ONI’s initial publicoffering as defendants. The complaints were consolidated into a single action, and a consolidated amended complaintwas filed on April 24, 2002. The amended complaint alleges, among other things, that the underwriter defendants vio-lated the securities laws by failing to disclose alleged compensation arrangements (such as undisclosed commissionsor stock stabilization practices) in the initial public offering’s registration statement and by engaging in manipulative prac-tices to artificially inflate the price of our common stock after the initial public offering. The amended complaint alsoalleges that ONI and the named former officers violated the securities laws on the basis of an alleged failure to disclosethe underwriters’ alleged compensation arrangements and manipulative practices. No specific amount of damages hasbeen claimed. Similar complaints have been filed against more than 300 other issuers that have had initial public offer-ings since 1998, and all of these actions have been included in a single coordinated proceeding. Mr. Martin and Ms. Davishave been dismissed from the action without prejudice pursuant to a tolling agreement. In July 2002, ONI and otherissuers in the consolidated cases filed motions to dismiss the amended complaint for failure to state a claim, which was
CIENA Corporation 10-K / 11

denied as to ONI on February 19, 2003. CIENA has participated, together with the other issuer defendants in thesecases, in mediated settlement negotiations that have led to a preliminary agreement among the plaintiffs, the issuerdefendants and their insurers. The settlement, which is subject to court approval, would result in the dismissal of theplaintiffs’ cases against the issuers. CIENA has agreed in principle to the terms of this settlement. Draft settlement docu-ments were circulated for preliminary review in October 2003.
As a result of the merger with ONI, we also became a defendant in two substantially identical purported classactions on behalf of ONI security holders originally brought against ONI and members of its board of directors. The com-plaints allege that the director defendants breached their fiduciary duties to ONI in approving the merger with CIENA andseek declaratory, injunctive and other relief permitted by equity. The plaintiffs failed to obtain an injunction against com-pletion of the merger. The first of these cases was filed on February 20, 2002, in the Superior Court of the State ofCalifornia, County of San Mateo, and is encaptioned K.W. Sams, On Behalf of Himself and All Others Similarly Situatedv. ONI Systems Corporation, et al. The second case was brought on March 19, 2002, in the Superior Court of the Stateof California, County of Santa Clara, and is encaptioned Steven Myeary, On Behalf of Himself and All Others SimilarlySituated v. ONI Systems Corporation. On April 14, 2003, the plaintiffs in these cases filed a consolidated amended com-plaint and named four additional defendants: CIENA Corporation, James F. Jordan, Kleiner Perkins Caufield & Byers andMohr Davidow Ventures. CIENA and the other defendants subsequently filed a demurrer and served a motion for sanc-tions on plaintiffs based on factual inaccuracies in the consolidated amended complaint. In response, the plaintiffs fileda corrected consolidated amended complaint, the demurrer to which is scheduled to be heard by the court in December2003. We believe that these lawsuits are without merit and will continue to defend them vigorously.
Item 4. Submission of Matters to a Vote of Security HoldersNo matters were submitted to a vote of security holders in the fourth quarter of fiscal 2003.
12 / CIENA Corporation 10-K

Item 5. Market for Registrant’s Common Stock and Related Stockholder Matters
CIENA’s Common Stock is traded on the NASDAQ National Market under the symbol CIEN. The following table setsforth for the fiscal periods indicated the high and low sales prices of the Common Stock, as reported on the NASDAQNational Market.
Price Range of Common StockHigh Low
Fiscal Year 2002
First Quarter ended January 31 $21.71 $12.60
Second Quarter ended April 30 $12.95 $ 7.03
Third Quarter ended July 31 $ 7.53 $ 3.60
Fourth Quarter ended October 31 $ 4.90 $ 2.41
Fiscal Year 2003
First Quarter ended January 31 $ 7.74 $ 3.49
Second Quarter ended April 30 $ 6.12 $ 4.19
Third Quarter ended July 31 $ 6.74 $ 4.80
Fourth Quarter ended October 31 $ 7.45 $ 5.10
The market price of CIENA’s Common Stock has fluctuated significantly and may be subject to significant fluctuationsin the future. See Item 7. “Management’s Discussion and Analysis of Financial Condition and Results of Operations.”
As of December 9, 2003, there were approximately 2,473 holders of record of CIENA’s Common Stock and473,795,871 shares of Common Stock outstanding.
CIENA has never paid cash dividends on its capital stock. If and when we return to profitability, we intend to retainearnings for use in our business, and we do not anticipate paying any cash dividends in the foreseeable future.
On August 29, 2003, we issued 2,343,015 shares of CIENA common stock to stockholders of Akara Corporationas partial consideration for all outstanding shares of Akara. Our issuance of these shares was exempt from registrationpursuant to Rule 506 promulgated under the Securities Act of 1933, and/or Section 4(2) of the Securities Act.
Item 6. Selected Consolidated Financial DataThe following selected consolidated financial data should be read in conjunction with Item 7. “Management’s Discussionand Analysis of Financial Condition and Results of Operations” and the consolidated financial statements and the notesthereto included in Item 8. “Financial Statements and Supplementary Data.” CIENA has a 52 or 53 week fiscal year,which ends on the Saturday nearest to the last day of October in each year. For purposes of financial statement pres-entation, each fiscal year is described as having ended on October 31. Fiscal 1999, 2000, 2002 and 2003 comprised52 weeks and fiscal 2001 comprised 53 weeks.
As of October 31,(in thousands) 1999 2000 2001 2002 2003Balance Sheet Data:Cash, cash equivalents, short-term
and long-term investments $262,396 $ 238,318 $1,795,141 $2,078,464 $1,626,218
Total assets 677,835 1,027,201 3,317,301 2,751,022 2,378,165
Long-term obligations, excluding current portion 4,881 4,882 869,865 999,935 861,149
Stockholders’ equity $530,473 $ 809,835 $2,128,982 $1,527,269 $1,330,817
CIENA Corporation 10-K / 13
PART II

Year Ended October 31,(in thousands, except per share data) 1999 2000 2001 2002 2003Statement of Operations Data:Revenue $482,085 $858,750 $ 1,603,229 $ 361,155 $ 283,136
Excess and obsolete inventory costs (benefit) 6,534 15,022 68,411 286,475 (5,296)
Cost of goods sold 293,235 462,371 836,138 309,559 215,387
Gross profit (loss) 182,316 381,357 698,680 (234,879) 73,045
Operating expenses:
Research and development 101,006 125,434 235,831 239,619 199,699
Selling and marketing 61,603 90,922 146,949 130,276 103,193
General and administrative 22,696 33,960 57,865 52,612 38,478
Settlement of accrued contract obligation — (8,538) — — —
Deferred stock compensation costs:
Research and development — — 17,783 15,672 12,824
Selling and marketing — — 8,378 3,560 2,728
General and administrative 40 40 15,206 1,092 1,225
Amortization of goodwill 3,197 3,197 177,786 — —
Amortization of intangible assets 438 438 4,413 8,972 17,870
In-process research and development — — 45,900 — 2,800
Restructuring costs — — 15,439 225,429 31,155
Goodwill and intangible impairment — — 1,719,426 557,286 29,596
Merger related costs 13,021 — — — —
Provision (benefit) for doubtful accounts 250 28,010 (6,579) 14,813 —
Total operating expenses 202,251 273,463 2,438,397 1,249,331 439,568
Income (loss) from operations (19,935) 107,894 (1,739,717) (1,484,210) (366,523)
Interest and other income, net 14,448 13,020 63,579 61,145 42,959
Interest expense (504) (340) (30,591) (45,339) (36,331)
Loss on equity investments, net — — — (15,677) (4,760)
Loss on extinguishment of debt — — — (2,683) (20,606)
Income (loss) before income taxes (5,991) 120,574 (1,706,729) (1,486,764) (385,261)
Provision (benefit) for income taxes (2,067) 39,187 87,333 110,735 1,256
Net income (loss) $ (3,924) $ 81,387 $(1,794,062) $(1,597,499) $(386,517)
Basic net income (loss) per common share $ (0.01) $ 0.29 $ (5.75) $ (4.37) $ (0.87)
Diluted net income (loss) per common
and dilutive potential common share $ (0.01) $ 0.27 $ (5.75) $ (4.37) $ (0.87)
Weighted average basic common shares outstanding 267,042 281,621 311,815 365,202 446,696
Weighted average basic common and
dilutive potential common shares outstanding 267,042 299,662 311,815 365,202 446,696
14 / CIENA Corporation 10-K

Item 7. Management’s Discussion and Analysis of Financial Condition and Results of Operations
The following discussion and analysis should be read in conjunction with “Selected Consolidated Financial Data” and theCompany’s consolidated financial statements and notes thereto included elsewhere in this report on Form 10-K.
OverviewCIENA is a leading global provider of innovative network solutions to service providers and enterprises worldwide. Ourcustomers include long-distance carriers, local exchange carriers, cable operators, Internet service providers, wirelessand wholesale carriers, resellers, governments, large businesses and non-profit institutions.
For several years, the market for our equipment was influenced by the entry of a substantial number of new com-panies into the communications services business. In the United States, this was largely due to changes in the regula-tory environment, in particular those brought about by the Telecommunications Act of 1996. These new companiesraised billions of dollars in capital, much of which they invested in capital improvements, causing acceleration in thegrowth of the market for telecommunications equipment.
The last three years have seen a reversal of this trend, including the failure of a large number of the new entrantsand a sharp contraction of the availability of capital to the industry. Several of the more established carriers also haveexperienced significant financial distress. These developments have caused a substantial reduction in demand fortelecommunications equipment, including our products. This industry trend was compounded by the slowing not only ofthe United States economy, but the economies in virtually all of the countries in which we are marketing our products.The combination of factors caused our customers to become more conservative in their capital investment plans andmore uncertain about their future purchases. As a consequence, we are facing a market that is both reduced in size andmore difficult to predict and plan for.
These trends have had a number of significant effects on our business during fiscal 2003 and 2002, including thereduction of revenue by $1,320.1 million since fiscal 2001, the incurrence of $286.5 million of costs related to obsoleteinventory and excess purchase commitments during fiscal 2002, restructuring charges of $31.2 million and $225.4 mil-lion during fiscal 2003 and 2002, respectively, goodwill and intangible asset impairment charges of $29.6 million and$557.3 million during fiscal 2003 and 2002, respectively, provisions for bad debt expense of $14.8 million during fiscal2002, $4.8 million and $15.7 million in losses on equity investments during fiscal 2003 and 2002, respectively, and a netincome tax charge of approximately $110.7 million during fiscal 2002 to establish a valuation allowance against ourdeferred tax assets. Our net losses of $386.5 million and $1,597.5 million, in fiscal 2003 and 2002, respectively, wereprimarily attributable to the factors listed above.
In response to the deterioration of our market, we have, since 2001, entered new markets by expanding our net-work solution offerings and worked to increase our market share by adding new features to our existing products. Wealso have taken steps to expand our sales channels beyond direct sales to service providers to include partnerships andother strategic relationships targeting enterprise and government customers. We plan to continue to pursue this strat-egy by adding new products and features to our portfolio, primarily targeting delivery of data communications servicesbecause we expect a large portion of carrier spending to occur in this area over the next few years.
As part of our efforts to implement our strategy, during fiscal 2003, we completed the acquisitions of WaveSmithNetworks, Inc. and Akara Corporation. WaveSmith was a privately held corporation offering a multi-service switchingproduct designed to be deployed at the edge of carrier networks. Akara was a privately held corporation providingSONET/SDH-based extended storage solutions.
As of October 31, 2003, CIENA and its subsidiaries employed approximately 1,816 persons, which was a net reduc-tion of 302 persons from the approximate 2,118 employed on October 31, 2002.
Critical Accounting Policies and EstimatesThe preparation of consolidated financial statements requires CIENA to make estimates and judgments that affect thereported amounts of assets, liabilities, revenue and expenses, and related disclosure of contingent assets and liabilities.
CIENA Corporation 10-K / 15

On an ongoing basis, CIENA re-evaluates its estimates, including those related to bad debts, inventories, investments,intangible assets, goodwill, income taxes, warranty obligations, restructuring, contingencies and litigation. CIENA basesits estimates on historical experience and on various other assumptions that we believe to be reasonable under the cir-cumstances. Among other things, these estimates form the basis for judgments about the carrying values of assets andliabilities that are not readily apparent from other sources. Actual results may differ from these estimates under differ-ent assumptions or conditions. CIENA believes the following critical accounting policies affect its more significant judg-ments and estimates used in the preparation of its consolidated financial statements.
Revenue RecognitionCIENA recognizes product revenue in accordance with the terms of the contract of sale and where collection is reasonablyassured. For transactions in which sales are not complete until the customer has accepted the product, revenue is not rec-ognized until the terms of acceptance are satisfied. Revenue for installation services is recognized as the services are per-formed unless the terms of the supply contract combine product acceptance with installation, in which case, revenue frominstallation services is recognized when the terms of acceptance are satisfied and installation is completed. Amountsreceived in excess of revenue recognized are included as deferred revenue in the balance sheet. For transactions involvingthe sale of software, revenue is recognized in accordance with Statement of Position No. 97-2 (“SOP 97-2”), “SoftwareRevenue Recognition,” including deferral of revenue recognition in instances where vendor specific objective evidencefor undelivered elements is not determinable. For distributor sales where risks of ownership have not transferred, CIENArecognizes revenue when the product is shipped through to the end user.
Allowances for Doubtful AccountsCIENA maintains allowances for doubtful accounts for estimated losses resulting from the inability of its customers tomake required payments. If the financial condition of CIENA’s customers were to deteriorate, resulting in an impairmentof their ability to make payments, additional allowances may be required. As of October 31, 2003, our accounts receiv-able balance, net of allowances for doubtful accounts of $1.5 million, was $43.6 million, which included three customersthat accounted for 23.6%, 12.5%, and 10.1% of the net trade accounts receivable.
WarrantiesCIENA provides for the estimated cost of product warranties at the time revenue is recognized. CIENA engages in exten-sive product quality programs and processes including actively monitoring and evaluating the quality of its componentsuppliers and third-party contractors. CIENA’s warranty obligation is affected by product failure rates and material usageand service delivery costs incurred in correcting a product failure. Should actual product failure rates, material usage orservice delivery costs differ from CIENA’s estimates, revisions to the estimated warranty liability would be required.
Reserve for Inventory ObsolescenceCIENA writes down its inventory for estimated obsolescence or unmarketable inventory equal to the difference betweenthe cost of inventory and the estimated market value based on assumptions about future demand and market conditions.During the fiscal year ended October 31, 2003, CIENA recorded a benefit for inventory reserves of $5.3 million primarilyrelated to the realization of sales from previously reserved excess inventory. If actual market conditions differ from thoseCIENA has projected, CIENA may be required to take additional inventory write-downs or to record additional benefits.
RestructuringAs part of its restructuring costs, CIENA provides for the estimated cost of the net lease expense for facilities that areno longer being utilized. The provision is equal to the future minimum lease payments under contractual obligations off-set by estimated future sublease payments. As of the end of fiscal 2003, CIENA’s accrued restructuring liability relatedto net consolidation of excess facilities is $63.7 million. If actual market conditions are less favorable than those CIENAhas projected, CIENA may be required to recognize additional restructuring costs associated with these facilities.
16 / CIENA Corporation 10-K

Minority InvestmentsCIENA holds minority interests in several companies having operations or technology in areas within its strategic focus.As of October 31, 2003, $21.3 million of these investments are included in other long-term assets. CIENA records aninvestment impairment charge when it believes an investment has experienced a decline in value that is other than tem-porary. During fiscal 2003, CIENA recorded a charge of $4.8 million associated with the impairment of one of theseinvestments. Future adverse changes in market conditions or poor operating results of underlying investments couldresult in losses or an inability to recover the carrying value of the investments that may not be reflected in an investment’scurrent carrying value, thereby possibly requiring an impairment charge in the future.
Impairment of Goodwill and Other Long-Lived AssetsEffective November 1, 2001, CIENA adopted Statement of Financial Accounting Standard No. 142, “Goodwill and OtherIntangible Assets” (“SFAS 142”) and ceased to amortize goodwill. As of October 31, 2003, CIENA’s assets include$336.0 million related to goodwill. SFAS 142 requires that we cease to amortize goodwill and to test it for impairmenton an annual basis, and between annual tests if an event occurs or circumstances change that would, more likely thannot, reduce the fair value of CIENA below its carrying value. Since no event occurred or circumstances changed duringfiscal 2003 that would, more likely than not, reduce the fair value of CIENA below its carrying value, no impairment wasrecorded in fiscal 2003. If actual market conditions are less favorable than those we have projected or if an event occursor circumstances change that would, more likely than not, reduce the fair value of CIENA below its carrying value, wemay be required to recognize additional goodwill impairment charges.
As part of CIENA’s review of financial results for fiscal 2003, CIENA performed an assessment of the carrying valueof the Company’s long-lived assets, including other intangible assets. The assessment was performed pursuant toStatement of Financial Accounting Standards No. 144 “Accounting for the Impairment or Disposal of Long-Lived Assets”(SFAS 144). As a result, CIENA recorded a charge of $29.6 million during fiscal 2003, related to the impairment ofMetroDirector K2 technology acquired in the Cyras transaction. This charge was based on the amount by which thecarrying amount of the developed technology exceeded its fair value. Fair value was determined based on discountedfuture cash flows derived from the developed technology, which had separately identifiable cash flows. The assumptionssupporting the estimated future cash flows, including the discount rate reflect management’s best estimates. If actualmarket conditions are less favorable than those we have projected or if an event occurs or circumstances change thatwould, more likely than not, reduce the fair value of our long-lived assets below their carrying value, we may be requiredto recognize additional impairment charges.
Deferred Tax Valuation AllowanceAs of October 31, 2003, CIENA has recorded a valuation allowance of $894.2 million against our gross deferred taxassets of $894.2 million. We calculated the valuation allowance in accordance with the provisions of Statement ofFinancial Accounting Standard No. 109, “Accounting for Income Taxes” (“SFAS 109”) which requires an assessment ofboth positive and negative evidence when measuring the need for a valuation allowance. Positive evidence, such asoperating results during the most recent three-year period, is given more weight when due to our current lack of visibil-ity, there is a greater degree of uncertainty that the level of future profitability needed to record the deferred assets willbe achieved. Our results over the most recent three-year period were heavily affected by our recent deliberate andplanned business restructuring activities. Our cumulative loss in the most recent three-year period represents sufficientnegative evidence to require a valuation allowance under the provisions of SFAS 109. We intend to maintain a valuationallowance until sufficient positive evidence exists to support its reversal.
Accounting for Stock OptionsIn October 1995, the Financial Accounting Standards Board issued SFAS 123, “Accounting for Stock-BasedCompensation.” SFAS 123 allows companies to account for stock-based compensation either under the new provisionsof SFAS 123 or using the intrinsic value method provided by Accounting Principles Board Opinion No. 25 (“APB 25”),
CIENA Corporation 10-K / 17
“Accounting for Stock Issued to Employees,” but requires pro forma disclosure in the footnotes to the financial state-ments as if the measurement provisions of SFAS 123 had been adopted.
In December 2002, the Financial Accounting Standards Board issued Statement of Financial Accounting StandardNo. 148, “Accounting for Stock-Based Compensation—Transition and Disclosure” (“SFAS 148”). SFAS 148 amendsSFAS 123, to provide alternative methods of transition for a voluntary change to the fair value based method of account-ing for stock-based employee compensation. In addition, SFAS 148 amends the disclosure requirements of SFAS 123to require prominent disclosures in both annual and interim financial statements about the method of accounting forstock-based employee compensation and the effect of the method used on reported results. SFAS 148 is effective forfinancial statements for fiscal years ending after December 15, 2002.
We have elected to continue to account for stock-based compensation in accordance with the provisions of APB 25as interpreted by FASB Interpretation No. 44, “Accounting for Certain Transactions Involving Stock Compensation, anInterpretation of APB Opinion No. 25,” (“FIN 44”) and present the pro forma disclosures required by SFAS 123 asamended by SFAS 148.
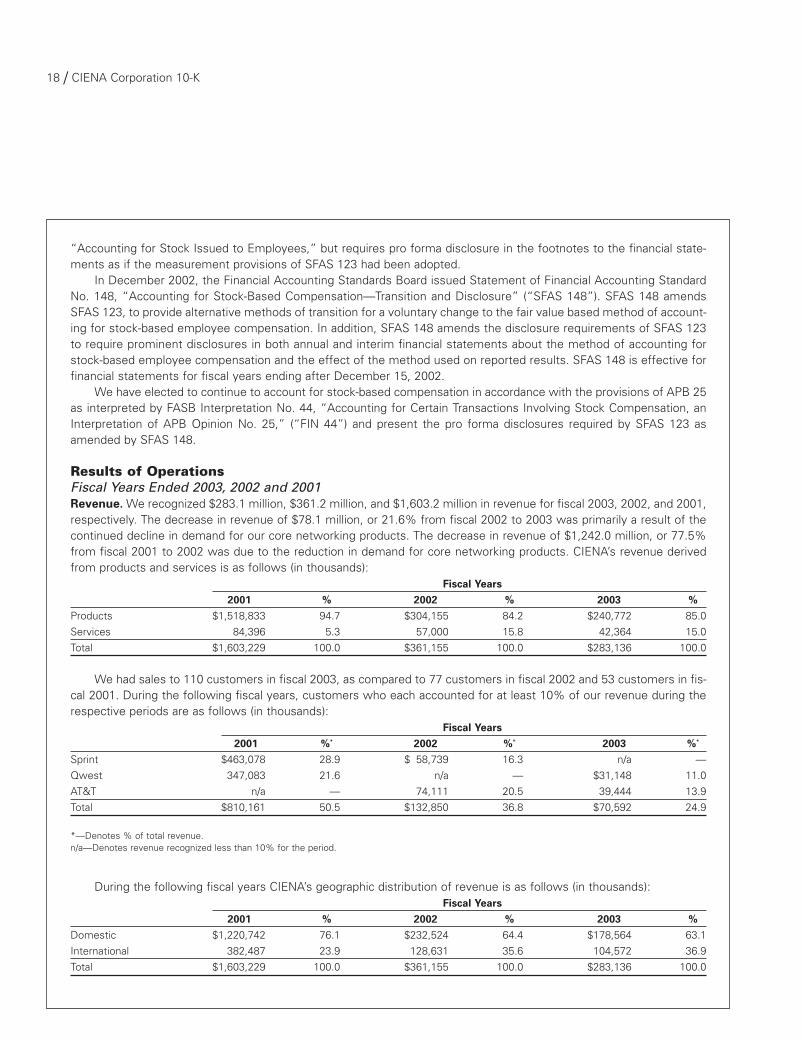
Results of OperationsFiscal Years Ended 2003, 2002 and 2001Revenue. We recognized $283.1 million, $361.2 million, and $1,603.2 million in revenue for fiscal 2003, 2002, and 2001,respectively. The decrease in revenue of $78.1 million, or 21.6% from fiscal 2002 to 2003 was primarily a result of thecontinued decline in demand for our core networking products. The decrease in revenue of $1,242.0 million, or 77.5%from fiscal 2001 to 2002 was due to the reduction in demand for core networking products. CIENA’s revenue derivedfrom products and services is as follows (in thousands):
Fiscal Years2001 % 2002 % 2003 %
Products $1,518,833 94.7 $304,155 84.2 $240,772 85.0
Services 84,396 5.3 57,000 15.8 42,364 15.0
Total $1,603,229 100.0 $361,155 100.0 $283,136 100.0
We had sales to 110 customers in fiscal 2003, as compared to 77 customers in fiscal 2002 and 53 customers in fis-cal 2001. During the following fiscal years, customers who each accounted for at least 10% of our revenue during therespective periods are as follows (in thousands):
Fiscal Years2001 %* 2002 %* 2003 %*
Sprint $463,078 28.9 $ 58,739 16.3 n/a —
Qwest 347,083 21.6 n/a — $31,148 11.0
AT&T n/a — 74,111 20.5 39,444 13.9
Total $810,161 50.5 $132,850 36.8 $70,592 24.9
*—Denotes % of total revenue.n/a—Denotes revenue recognized less than 10% for the period.
During the following fiscal years CIENA’s geographic distribution of revenue is as follows (in thousands):Fiscal Years
2001 % 2002 % 2003 %Domestic $1,220,742 76.1 $232,524 64.4 $178,564 63.1
International 382,487 23.9 128,631 35.6 104,572 36.9
Total $1,603,229 100.0 $361,155 100.0 $283,136 100.0
18 / CIENA Corporation 10-K

Gross Profit (Loss). Cost of goods sold consists of component costs, direct compensation costs, warranty andother contractual obligations, royalties, license fees, direct technical support costs, cost of excess and obsolete inven-tory and overhead related to manufacturing, technical support and engineering, furnishing and installation (“EF&I”)operations. Gross profit (loss) was $73.0 million, ($234.9) million, and $698.7 million for fiscal 2003, 2002, and 2001,respectively. The $307.9 million increase in fiscal 2003 compared to fiscal 2002 was primarily the result of a $291.8 mil-lion decrease in inventory obsolescence cost. The $933.6 million decrease in gross profit in fiscal 2002 compared to fis-cal 2001 was the result of decreased revenue and an increase in excess and obsolete inventory charges. This increasein excess and obsolete inventory charges was a result of the decline in capital spending by our customers and a declinein forecasted revenue of existing products and accordingly, we recorded a provision for inventory, including purchasecommitments, of approximately $286.5 million in fiscal 2002.
Gross profit (loss), as a percentage of total revenue, was 25.8%, (65.0%) and 43.6% for fiscal 2003, 2002 and 2001,respectively. The increase from fiscal 2002 to fiscal 2003 was largely attributable to decreases in inventory obsolescencecosts, increases in manufacturing efficiencies, higher margin product mix and improvements in margin from installation andtechnical support services. The decrease from fiscal 2001 compared to fiscal 2002 was largely attributable to increases ininventory obsolescence costs, lower manufacturing volumes resulting in reduced manufacturing efficiencies, and changesin product mix resulting in sales of higher proportion of revenue from lower margin installation and tech support services.
Gross profit on products, as a percentage of product revenue, was 34.0%, 25.0% and 52.5% for fiscal 2003, 2002and 2001, respectively. The improvement from fiscal 2002 to fiscal 2003 was largely attributable to increases in manu-facturing efficiencies and higher margin product mix. The reduction from fiscal 2001 to fiscal 2002 was primarily attrib-utable to lower manufacturing volumes resulting in reduced manufacturing efficiencies.
Gross loss on services, as a percentage of services revenue, was 33.3%, 43.0% and 36.6% for fiscal 2003, 2002 and2001, respectively. The improvement from fiscal 2002 to fiscal 2003 was largely attributable to reductions in services over-head costs. The reduction from fiscal 2001 to fiscal 2002 was primarily the result of increased technical support costs.
Research and Development Expenses. Research and development expenses (exclusive of stock compensationcosts of $12.8, $15.7 and $17.8 million) were $199.7 million, $239.6 million and $235.8 million for fiscal 2003, 2002 and2001, respectively. During fiscal 2003, 2002 and 2001, research and development expenses were 70.5%, 66.3% and14.7% of revenue, respectively. The $39.9 million, or 16.7% decrease, from fiscal 2002 to fiscal 2003 was the result ofdecreased employee related expenses, prototype costs, consulting expenses, and depreciation expense. The $3.8 mil-lion, or 1.6% increase, from fiscal 2001 to fiscal 2002 was primarily related to increases in depreciation expense thatwere partially offset by reductions in prototype parts and employee related costs. CIENA has expensed research anddevelopment costs as incurred.
Selling and Marketing Expenses. Selling and marketing expenses (exclusive of stock compensation of $2.7, $3.6and $8.4 million) were $103.2 million, $130.3 million and $146.9 million for fiscal 2003, 2002 and 2001, respectively.During fiscal 2003, 2002 and 2001, selling and marketing expenses were 36.5%, 36.1% and 9.2% of revenue, respec-tively. The $27.1 million, or 20.8% decrease, from fiscal 2002 to fiscal 2003 was the result of reduced levels of salesstaff, advertising costs, outside consultants, facility costs and depreciation expense. The $16.6 million, or 11.3%decrease, from fiscal 2002 to 2001 was primarily the result of decreases in staffing levels, commissions earned, tradeshow participation and promotional costs.
General and Administrative Expenses. General and administrative expenses (exclusive of stock compensation of$1.2, $1.1 and $15.2 million) were $38.5 million, $52.6 million and $57.9 million for fiscal 2003, 2002 and 2001, respec-tively. During fiscal 2003, 2002 and 2001 general and administrative expenses were 13.6%, 14.6% and 3.6% of revenue,respectively. The $14.1 million, or 26.8% decrease, from fiscal 2002 to fiscal 2003 was primarily the result of decreasesin staffing levels, outside consultants and facility costs. Fiscal 2003 general and administrative expenses also includecosts of $2.5 million related to the settlement of litigation with Nortel. The $5.3 million, or 9.2% decrease, from fiscal2001 to 2002 was primarily due to decreases in employee-related costs. Fiscal 2002 general and administrativeexpenses also include costs of $1.8 million related to the settlement of litigation with Pirelli.
CIENA Corporation 10-K / 19

Deferred Stock Compensation Costs. The cumulative deferred stock compensation costs related to research anddevelopment, selling and marketing and general and administrative employees assumed as part of our merger andacquisition activity were $16.8 million, $20.3 million and $41.4 million during fiscal 2003, 2002 and 2001 respectively.As part of our acquisition of WaveSmith, ONI, and Cyras we recorded $7.4 million, $8.8 million and $98.5 million ofdeferred stock compensation relating to the unvested stock options and restricted stock assumed on the acquisition,respectively. Deferred stock compensation is presented as a reduction of stockholders’ equity and is amortized overthe remaining vesting period of the applicable options. As of October 31, 2003, the balance of deferred stock compen-sation was $9.7 million.
Amortization of Goodwill. Amortization of goodwill was $0.0, $0.0, and $177.8 million for fiscal 2003, 2002 and2001, respectively. The Company adopted SFAS 142 effective November 1, 2001 and upon adoption ceased to amor-tize goodwill.
Amortization of Intangible Assets. Amortization of intangible assets (exclusive of $3.3 million, $0.0 and $0.0included in costs of goods sold related to certain technology licenses) was $17.9 million, $9.0 million and $4.4 million forfiscal 2003, 2002 and 2001, respectively. In purchasing companies, we have acquired intangible assets such as certaindeveloped technology, patents and covenants not to compete. As part of our acquisition of Akara, WaveSmith, ONI, andCyras we recorded $14.5 million, $59.7 million, $15.1 million and $47.7 million worth of intangibles, respectively. Thevarious intangible assets will be amortized over periods ranging from 2 months to eight years.
In-Process Research and Development. In-process research and development was $2.8 million, $0.0 and $45.9 mil-lion for fiscal 2003, 2002 and 2001, respectively. In connection with our fiscal 2003 acquisitions of Akara and WaveSmith,we recorded charges of $1.3 million and $1.5 million, respectively, related to in-process research and development. Thisgenerally represents the estimated value of purchased in-process technology that had not yet reached technologicalfeasibility and had no alternative future use at the time of the acquisitions. In connection with our March 2001 acquisi-tion of Cyras, we recorded a $45.9 million charge for in-process research and development. This represents the esti-mated value of purchased in-process technology related to Cyras’ K2 product development that had not yet reachedtechnological feasibility and had no alternative future use at the time of the acquisition. The amount of the purchaseprices for Akara, WaveSmith and Cyras allocated to in-process research and development was determined using thediscounted cash flow method. This method consisted of estimating future net cash flows attributable to the in-processtechnology for a discrete projection period and discounting the net cash flows back to their present value.
Restructuring Costs. During fiscal 2003, we recorded a restructuring charge of $32.0 million associated with work-force reductions and the write-down of certain property and equipment. This was offset by a credit of $0.8 million relatedto the adjustment of previously estimated restructuring charges. The restructuring charge included $12.2 million associ-ated with work force reductions, $2.3 million primarily related to lease terminations and non-cancelable lease costs anda $17.5 million write-down related to property and equipment consisting primarily of leasehold improvements, produc-tion equipment and research test equipment. See Note 3.
During fiscal 2002, we incurred $225.4 million in restructuring charges associated with our ongoing efforts to alignour operations with the current telecommunications industry environment. The restructuring charges included $32.9 mil-lion related to work force reductions of approximately 1,946 employees, $70.3 million primarily related to lease termina-tions and non-cancelable lease costs and an $122.2 million write-down related to property and equipment consistingprimarily of leasehold improvements, production equipment and research test equipment.
During fiscal 2001, we recorded $15.4 million in restructuring charges related to the consolidation of excessfacilities. The consolidation included the closure of certain manufacturing warehouse facilities and the consolida-tion of certain operational centers related to business activities that have been restructured. The chargesincluded $7.0 million primarily related to lease terminations and non-cancelable lease costs and also included an$8.4 million write-down related to property and equipment consisting primarily of leasehold improvements andproduction equipment.
We expect to incur additional restructuring charges over the next several quarters as a result of our ongoing pro-gram to restructure our business.
20 / CIENA Corporation 10-K

Goodwill and Other Intangible Impairment. Goodwill and other intangible impairment was $29.6 million,$557.3 million and $1.7 billion for fiscal 2003, 2002 and 2001, respectively. During fiscal 2003, we recorded a chargeof $29.6 million related to the impairment of MetroDirector K2 technology acquired in the Cyras transaction. Thischarge was determined in accordance with SFAS 144, which requires CIENA to perform an assessment on the carry-ing value of its developed technology intangible assets.
In fiscal 2002 and 2001 we recorded charges of $557.3 million and $1.7 billion, respectively. The fiscal 2002 chargewas determined in accordance with SFAS 142, which requires annual testing to determine and measure goodwill impair-ment on a reporting unit basis. The fiscal 2001 charge was determined in accordance with SFAS 121, which requiredCIENA to perform an assessment of the carrying value of its long-lived assets including significant amounts of goodwilland other intangible assets.
Provision for Doubtful Accounts. CIENA performs ongoing credit evaluations of its customers and generally doesnot require collateral or other forms of security from its customers. CIENA maintains an allowance for potential losseswhen a particular problem with the collectibility of a receivable is identified. Provision for doubtful accounts expenseswere $0.0, $14.8 million and ($6.6) million for fiscal 2003, 2002 and 2001, respectively. In fiscal 2001, we received pay-ment for $15.4 million of the gross outstanding accounts receivable balance due from iaxis Limited primarily through oursales agreement with Dynegy. Accordingly, we recognized a reduction of $6.6 million in the provision for doubtfulaccounts during fiscal 2001. We recorded a provision for doubtful accounts of approximately $14.8 million during fiscal2002. This provision related to the estimated losses of $18.1 million from three customers, each of whom filed for bank-ruptcy protection during fiscal 2002, offset by $3.3 million of the gross outstanding accounts receivable balance due fromiaxis Limited through our sales agreement with Dynegy. CIENA did not record any additional provision for doubtfulaccounts during fiscal 2003.
Interest and Other Income, Net. Interest and other income, net were $43.0 million, $61.1 million and $63.6 millionfor fiscal 2003, 2002 and 2001, respectively. Interest and other income, net, consists of interest income earned on our cash,cash equivalents and available-for-sale short and long-term investments. The $18.1 million decrease from fiscal 2002 tofiscal 2003 was attributable to the impact of lower average interest rates and lower average cash and invested balances.The $2.5 million decrease from fiscal 2001 to fiscal 2002 was attributable to the impact of lower average interest rates.
Interest Expense. Interest expenses were $36.3 million, $45.3 million and $30.6 million for fiscal 2003, 2002 and2001, respectively. The $9.0 million, or 19.9% decrease, from fiscal 2002 to fiscal 2003 was attributable to the decreasein our debt obligations. The $14.7 million, or 48.0% increase, from fiscal 2001 to fiscal 2002 was attributable to the acqui-sition of debt obligations related to ONI.
Loss on Equity Investments, Net. The $4.8 million loss on equity investments in fiscal 2003 related to the declinein value of non-public equity investments that were determined to be other than temporary. Loss on equity investments,net was $15.7 million for fiscal 2002. We realized a loss of $1.9 million from the sale of a public equity investment anda loss of $16.6 million from a decline in the fair value of certain equity investments that were determined to be other thantemporary. On November 16, 2001, CIENA sold 80.1% of its ownership in ATI International Investments, Inc., the par-ent company of ATI Telecom International Ltd. (“Alta”), which resulted in a gain of $2.8 million. CIENA retains a 19.9%ownership in ATI International Investments, Inc.
Loss on Extinguishment of Debt. Losses on extinguishment of debt were $20.6 million, $2.7 million and $0.0 forfiscal 2003, 2002 and 2001, respectively. On June 21, 2002, we assumed the outstanding ONI 5.00% convertible subor-dinated notes, due October 15, 2005, in an aggregate principal amount of $300 million. The notes were initially recordedat a value of $218.0 million based upon the present value of the outstanding notes at the time of the acquisition. We areaccreting the difference between $218.0 million and $300.0 million over the remaining period to October 15, 2005, suchthat the carrying value of the outstanding notes equals the principal value at the time the notes become due. During fiscal2003, we conducted a tender offer for the ONI notes, which resulted in our purchasing $154.7 in principal amount of notesfor $140.3 million. Since the notes had an accreted value of $119.7 million, the purchase resulted in a non-cash loss of$20.6 million. During fiscal 2002, we purchased on the open market $97.1 million in principal amount of notes for $75.2 million.Since the notes had an accreted value of $72.5 million, the purchase resulted in a non-cash loss of $2.7 million.
CIENA Corporation 10-K / 21

Provision for Income Taxes. Our income tax expenses were 0.3%, 7.4% and 5.1% of pre-tax loss for fiscal 2003,2002 and 2001, respectively. The income tax provision for fiscal 2003 was $1.3 million. This provision was primarily attrib-utable to foreign taxes related to our foreign operations. We did not record a tax benefit for our domestic losses duringfiscal 2003. We intend to maintain a valuation allowance against our deferred tax assets until sufficient positive evi-dences exists to support its reversal. The income tax provision for 2002 was $110.7 million. Our income tax provisionfor 2002 differed from the expected statutory benefit of 35% primarily due to the establishment of a valuation allowanceagainst our deferred tax assets and the non-deductibility of the goodwill impairment. The income tax provision for 2001differed from the expected 35% benefit primarily due to the non-deductibility of the goodwill impairment, and in-processresearch and development.
Net Loss. Our net losses were $386.5 million, $1,597.5 million and $1,794.1 million for fiscal 2003, 2002 and2001, respectively.
Liquidity and Capital ResourcesAt October 31, 2003, our principal source of liquidity was cash and cash equivalents, short-term investments and long-term investments. We had $309.7 million in cash and cash equivalents, $796.8 million in short-term investments and$519.7 million in long-term investments.
Our operating activities consumed net cash of $241.2 million and $28.0 million in fiscal 2003 and 2002, respectivelyand provided net cash of $163.2 million in fiscal 2001. Cash used in operating activities during fiscal 2003 was primarilyattributable to the net loss, the reduction in accrued liabilities and an increase in accounts receivable. This was offset bythe non-cash charges for early extinguishment of debt, restructuring charges and related asset write-downs, deprecia-tion, amortization and impairment of intangibles. Cash used in operating activities during fiscal 2002 was primarily attrib-utable to the net loss, offset by non-cash charges related to goodwill impairment, amortization of other intangibles,deferred stock compensation and debt issuance costs, non-cash portion of restructuring charges, depreciation expense,provision for inventory excess and obsolescence, decrease in deferred income tax asset and decrease in accountsreceivable. Cash provided by operating activities during fiscal 2001 was primarily attributable to decreases in accountsreceivable and inventories offset by non-cash charges related to goodwill impairment, amortization of other intangibles,deferred stock compensation and debt issuance costs, non-cash portion of restructuring charges, depreciation expense,provision for inventory excess and obsolescence, and increases in deferred revenue and other obligations.
Our investment activities provided net cash of $302.6 million and $239.1 million in fiscal 2003 and 2002 respectively,and used net cash of $1,490.6 million in fiscal 2001. Investment activities included the net redemption of $364.8 millionand $26.0 million of short and long-term investments during fiscal 2003 and 2002, respectively and the net purchase of$1,293.2 million of short and long-term investments during fiscal 2001. Investment activities also included approximately$15.0 million, $10.0 million and $13.0 million of equity investments in private companies, accounted for under the costmethod, during fiscal 2003, 2002 and 2001, respectively. Also included in investment activities were additions to capitalequipment and leasehold improvements in fiscal 2003, 2002, and 2001 of $29.5 million, $66.3 million and $238.5 mil-lion, respectively. The capital equipment expenditures were primarily for customer demonstration systems, test sys-tems, manufacturing equipment, computer equipment and leasehold improvements. In fiscal 2003 we used cash of$26.7 million, net of expenditures, in connection with our acquisition of Akara and WaveSmith. In fiscal 2002, weacquired cash of $286.9 million, net of expenditures, in connection with our acquisition of ONI. In fiscal 2001, weacquired cash of $54.1 million, net of expenditures, in connection with our acquisition of Cyras.
Our financing activities used net cash of $128.9 million and $231.8 million in fiscal 2003 and 2002, respectively andprovided net cash of $1,582.2 million in fiscal 2001. During fiscal 2003 the primary use was related to the purchase of$154.7 million of the remaining $202.9 million outstanding ONI convertible subordinated notes. We paid $139.2 millionfor the notes and fees of $1.1 million related to the purchase. Also, during fiscal 2003, we received $13.8 million from theexercise of stock options and $1.9 million from the repayment of notes receivable from stockholders. The primary use ofcash during fiscal 2002 related to the redemption of all outstanding Cyras Systems LLC 4.5% convertible subordinatednotes for $178.4 million and the purchase of ONI 5.0% convertible subordinated notes with a cumulative accreted book
22 / CIENA Corporation 10-K

value of $72.5 million. Also during fiscal 2002, we received $15.1 million from the exercise of stock options and the saleof stock through our employee stock purchase plan and $5.0 million from the repayment of notes receivable from stock-holders. During fiscal 2001, we completed a public offering of 11,000,000 shares of common stock at a price of $83.50per share less underwriters’ discounts and commissions. Concurrent with the offering of common stock, we completeda public offering of 3.75% convertible notes with an aggregate principal amount of $690 million. Net proceeds from theseofferings were approximately $1,547.8 million, after deducting underwriting discounts, commissions and offeringexpenses. During fiscal 2001, we also received $31.9 million from the exercise of stock options and the sale of stockthrough our employee stock purchase plan and $4.6 million for the repayment of notes receivable from stockholders.
The following is a summary of our future minimum payments under contractual obligations as of October 31, 2003(in thousands):
Less than One to Four toTotal One Year Three Years Five Years Thereafter
Convertible notes(1)(2) $ 859,542 $28,289 $102,441 $728,812 $ —
Operating leases 251,005 37,810 72,128 56,071 84,996
Purchase obligations(3) 33,270 33,270 — — —
Total $1,143,817 $99,369 $174,569 $784,883 $84,996
(1) The terms of our convertible notes with a principal value of $690.0 million include interest at 3.75% payable on a semi-annual basis on February 1 andAugust 1 of each year; the notes are due February 1, 2008. The terms of the ONI convertible subordinated notes with a principal value of $48.3 millioninclude interest at 5.00% payable on a semi-annual basis on April 15 and October 15 of each year; the notes are due October 15, 2005.
(2) On November 18, 2003, CIENA announced a full redemption of all of the outstanding ONI 5.00% convertible subordinated notes due October 15, 2005.The principal amount of the notes outstanding is $48.3 million. On the redemption date of December 19, 2003, CIENA will pay holders 102% of theoutstanding principal amount of the notes plus accrued interest.
(3) Purchase commitments related to amounts we are obligated to pay to our contract manufacturers and component suppliers for inventory.
Some of our commercial commitments, including some of the future minimum payments set forth above, aresecured by standby letters of credit. The following is a summary of our commercial commitments secured by standbyletters of credit by commitment expiration date as of October 31, 2003 (in thousands):
Less than One to Four toTotal One Year Three Years Five Years Thereafter
Standby letters of credit $11,351 $10,741 $360 $250 $—
CIENA does not engage in any off-balance sheet financing arrangements. In particular, we do not have any interestin so-called limited purpose entities, which include special purpose entities (SPEs) and structured finance entities.
Based on past performance and current expectations, we believe that our cash and cash equivalents, short-terminvestments, and cash generated from operations will satisfy our working capital needs, capital expenditures, invest-ment requirements, full redemption of the ONI 5% convertible subordinated notes, and other liquidity requirementsassociated with our existing operations through at least the next 12 months.
Effects of Recent Accounting PronouncementsIn November 2002, the FASB issued FASB Interpretation No. 45 (“FIN 45”), “Guarantor’s Accounting and DisclosureRequirements for Guarantees, Including Indirect Guarantees of Indebtedness of Others.” FIN 45 requires that a liabilitybe recorded in the guarantor’s balance sheet upon issuance of a guarantee. In addition, FIN 45 requires disclosures aboutthe guarantees that an entity has issued, including a reconciliation of changes in the entity’s product warranty liabilities.The initial recognition and initial measurement provisions of FIN 45 are applicable on a prospective basis to guaranteesissued or modified after December 31, 2002, irrespective of the guarantor’s fiscal year end. The disclosure requirementsof FIN 45 are effective for financial statements of interim or annual periods ending after December 15, 2002. The adop-tion of this standard did not have a material impact on CIENA’s financial statements.
CIENA Corporation 10-K / 23

In November 2002, the Emerging Issues Task Force (“EITF”) reached a consensus on Issue No. 00-21, “RevenueArrangements with Multiple Deliverables.” EITF Issue No. 00-21 provides guidance on how to account for arrangementsthat involve the delivery or performance of multiple products, services and/or rights to use assets. The provisions of EITFIssue No. 00-21 applied to revenue arrangements entered into in fiscal periods beginning after June 15, 2003.
In January 2003, the FASB issued FASB Interpretation No. 46 (“FIN 46”), “Consolidation of Variable Interest Entities,an Interpretation of Accounting Research Bulletin No. 51.” FIN 46 requires certain variable interest entities to be consoli-dated by the primary beneficiary of the entity if the equity investors in the entity do not have the characteristics of a con-trolling financial interest or do not have sufficient equity at risk for the entity to finance its activities without additionalsubordinated financial support from other parties. FIN 46 is effective for all new variable interest entities created oracquired after January 31, 2003. For variable interest entities created or acquired prior to February 1, 2003, the provi-sions of FIN 46 must be applied for the first interim or annual period beginning after December 15, 2003. The Companybelieves that the adoption of this standard will have no material impact on its financial statements.
In April 2003, the FASB issued SFAS 149, “Amendment of Statement 133 on Derivative Instruments and HedgingActivities.” SFAS 149 amends and clarifies accounting for derivative instruments, including certain derivative instrumentsembedded in other contracts, and for hedging activities under SFAS 133. The statement requires that contracts withcomparable characteristics be accounted for similarly and clarifies when a derivative contains a financing component thatwarrants special reporting in the statement of cash flows. SFAS 149 is effective for contracts entered into or modifiedafter June 30, 2003, except in certain circumstances, and for hedging relationships designated after June 30, 2003. TheCompany does not expect that the adoption of this standard will have a material effect on its financial position or resultsof operations.
In May 2003, the FASB issued SFAS 150, “Accounting for Certain Financial Instruments with Characteristics of BothLiabilities and Equity.” This Statement establishes standards for how an issuer classifies and measures in its statementof financial position certain financial instruments with characteristics of both liabilities and equity. It requires that anissuer classify a financial instrument that is within its scope as a liability (or an asset in some circumstances) becausethat financial instrument embodies an obligation of the issuer. This Statement is effective for financial instrumentsentered into or modified after May 31, 2003, and otherwise is effective at the beginning of the first interim period begin-ning after June 15, 2003, except for mandatory redeemable financial instruments of nonpublic entities. The FASB hasdefined implementation of SFAS 150 indefinitely for certain non-controlling interests, the provisions of which are cur-rently not applicable to the Company. The Company does not expect that the adoption of this standard will have a mate-rial effect on its financial position or results of operations.
24 / CIENA Corporation 10-K

Quarterly Results of OperationsThe tables below (in thousands, except per share data) set forth the operating results and percentage of revenue repre-sented by certain items in CIENA’s statements of operations for each of the eight quarters in the period ended October 31,2003. This information is unaudited, but in our opinion reflects all adjustments (consisting only of normal recurring adjust-ments) that we consider necessary for a fair presentation of such information in accordance with generally acceptedaccounting principles. The results for any quarter are not necessarily indicative of results for any future period.
Jan. 31, Apr. 30, Jul. 31, Oct. 31, Jan. 31, Apr. 30, Jul. 31, Oct. 31, 2002 2002 2002 2002 2003 2003 2003 2003
Revenue:Products $ 139,935 $ 73,465 $ 41,029 $ 49,726 $ 61,221 $ 63,399 $ 59,294 $ 56,858Services 22,221 13,588 8,999 12,192 9,253 10,141 9,184 13,786
Total revenue 162,156 87,053 50,028 61,918 70,474 73,540 68,478 70,644Costs:
Products 90,964 63,181 37,450 36,479 42,234 41,852 39,249 35,563Services 28,309 24,344 13,510 15,322 14,632 14,919 12,749 14,189Excess and obsolete inventory costs 20,414 223,277 41,192 1,592 (2,657) (1,446) (55) (1,138)
Total cost of goods sold 139,687 310,802 92,152 53,393 54,209 55,325 51,943 48,614Gross profit (loss) 22,469 (223,749) (42,124) 8,525 16,265 18,215 16,535 22,030
Operating expenses:Research and development 64,756 59,558 53,950 61,355 53,734 52,193 47,963 45,809Selling and marketing 37,600 29,835 30,829 32,012 26,605 25,663 24,536 26,389General and administrative(1) 13,655 13,276 10,798 14,883 14,706 8,066 7,969 7,737Deferred stock compensation costs:Research and development 3,951 3,465 3,860 4,396 3,798 3,406 2,932 2,688Selling and marketing 956 851 842 911 759 676 687 606General and administrative 227 176 256 433 374 346 312 193
Amortization of intangible assets 1,813 1,813 2,343 3,003 3,554 3,421 4,479 6,416In-process research and development — — — — — — 1,500 1,300
Restructuring costs 6,828 121,348 18,562 78,691 — 2,724 15,527 12,904Goodwill and intangible impairment — — — 557,286 — — — 29,596Provision for doubtful accounts — 16,055 (1,242) — — — — —
Total operating expenses 129,786 246,377 120,198 752,970 103,530 96,495 105,905 133,638Loss from operations (107,317) (470,126) (162,322) (744,445) (87,265) (78,280) (89,370) (111,608)Interest and other income, net 16,172 15,045 13,558 16,370 13,301 11,131 8,865 9,662Interest expense (10,505) (8,637) (10,614) (15,583) (12,203) (8,061) (8,070) (7,997)Loss on equity investments, net (5,306) (434) — (9,937) (10) — — (4,750)Loss on extinguishment of debt — — — (2,683) (20,606) — — —Loss before income taxes (106,956) (464,152) (159,378) (756,278) (106,783) (75,210) (88,575) (114,693)Provision (benefit) for income tax (36,365) 148,001 607 (1,508) 359 251 299 347Net loss $ (70,591) $(612,153) $(159,985) $(754,770) $(107,142) $ (75,461) $ (88,874) $(115,040)Basic and diluted net loss percommon share and dilutivepotential common share $ (0.22) $ (1.86) $ (0.42) $ (1.75) $ (0.25) $ (0.17) $ (0.20) $ (0.24)
Weighted average basic common and dilutive potential common share 327,620 328,764 376,548 431,257 432,572 433,932 451,009 470,244
(1) During the quarter ended October 31, 2002 includes $1,792 of costs related to Pirelli litigation. During the quarter ended January 31, 2003 includes$2,500 related to Nortel settlement costs.
CIENA Corporation 10-K / 25
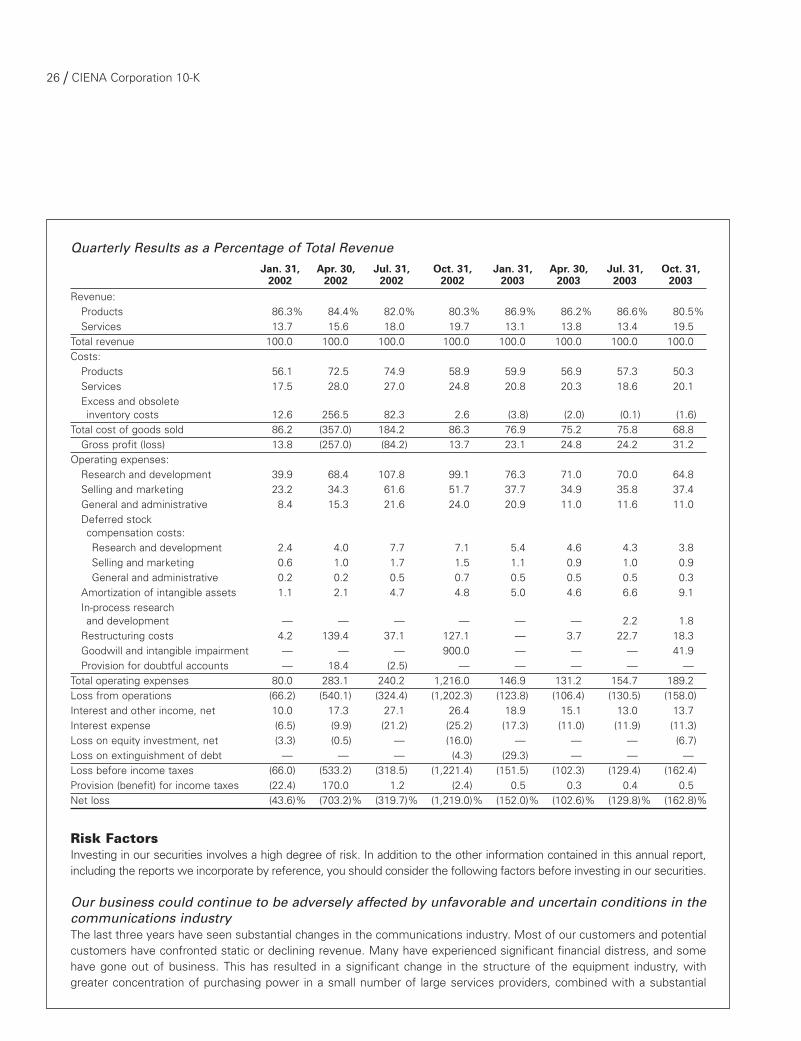
Quarterly Results as a Percentage of Total RevenueJan. 31, Apr. 30, Jul. 31, Oct. 31, Jan. 31, Apr. 30, Jul. 31, Oct. 31,
2002 2002 2002 2002 2003 2003 2003 2003Revenue:
Products 86.3% 84.4% 82.0% 80.3% 86.9% 86.2% 86.6% 80.5%Services 13.7 15.6 18.0 19.7 13.1 13.8 13.4 19.5
Total revenue 100.0 100.0 100.0 100.0 100.0 100.0 100.0 100.0Costs:
Products 56.1 72.5 74.9 58.9 59.9 56.9 57.3 50.3Services 17.5 28.0 27.0 24.8 20.8 20.3 18.6 20.1Excess and obsolete inventory costs 12.6 256.5 82.3 2.6 (3.8) (2.0) (0.1) (1.6)
Total cost of goods sold 86.2 (357.0) 184.2 86.3 76.9 75.2 75.8 68.8Gross profit (loss) 13.8 (257.0) (84.2) 13.7 23.1 24.8 24.2 31.2
Operating expenses:Research and development 39.9 68.4 107.8 99.1 76.3 71.0 70.0 64.8Selling and marketing 23.2 34.3 61.6 51.7 37.7 34.9 35.8 37.4General and administrative 8.4 15.3 21.6 24.0 20.9 11.0 11.6 11.0Deferred stock compensation costs:Research and development 2.4 4.0 7.7 7.1 5.4 4.6 4.3 3.8Selling and marketing 0.6 1.0 1.7 1.5 1.1 0.9 1.0 0.9General and administrative 0.2 0.2 0.5 0.7 0.5 0.5 0.5 0.3
Amortization of intangible assets 1.1 2.1 4.7 4.8 5.0 4.6 6.6 9.1In-process research and development — — — — — — 2.2 1.8
Restructuring costs 4.2 139.4 37.1 127.1 — 3.7 22.7 18.3Goodwill and intangible impairment — — — 900.0 — — — 41.9Provision for doubtful accounts — 18.4 (2.5) — — — — —
Total operating expenses 80.0 283.1 240.2 1,216.0 146.9 131.2 154.7 189.2Loss from operations (66.2) (540.1) (324.4) (1,202.3) (123.8) (106.4) (130.5) (158.0)Interest and other income, net 10.0 17.3 27.1 26.4 18.9 15.1 13.0 13.7Interest expense (6.5) (9.9) (21.2) (25.2) (17.3) (11.0) (11.9) (11.3)Loss on equity investment, net (3.3) (0.5) — (16.0) — — — (6.7)Loss on extinguishment of debt — — — (4.3) (29.3) — — —Loss before income taxes (66.0) (533.2) (318.5) (1,221.4) (151.5) (102.3) (129.4) (162.4)Provision (benefit) for income taxes (22.4) 170.0 1.2 (2.4) 0.5 0.3 0.4 0.5Net loss (43.6)% (703.2)% (319.7)% (1,219.0)% (152.0)% (102.6)% (129.8)% (162.8)%
Risk FactorsInvesting in our securities involves a high degree of risk. In addition to the other information contained in this annual report,including the reports we incorporate by reference, you should consider the following factors before investing in our securities.
Our business could continue to be adversely affected by unfavorable and uncertain conditions in thecommunications industryThe last three years have seen substantial changes in the communications industry. Most of our customers and potentialcustomers have confronted static or declining revenue. Many have experienced significant financial distress, and somehave gone out of business. This has resulted in a significant change in the structure of the equipment industry, withgreater concentration of purchasing power in a small number of large services providers, combined with a substantial
26 / CIENA Corporation 10-K

reduction in overall demand. Together these factors have adversely affected our revenue and operating results. In addi-tion, most of our customers have become more conservative and uncertain about their future purchases which has mademanaging our business difficult.
We expect the factors described above to continue to affect our business for an indeterminate period, in severalsignificant ways:
• capital expenditures by many of our customers may be flat or reduced;
• we will continue to have only limited ability to forecast the volume and product mix of our sales;
• managing our expenditures will be difficult in light of the uncertainties surrounding our business;
• increased competition resulting from reduced demand will put substantial downward pressures on the pricing of ourproducts, tending to reduce our profit margins;
• increased competition will enable customers to insist on more favorable terms and conditions for sales, includingextended payment terms or other financing assistance, as a condition of procuring their business; and
• the bankruptcies or weakened financial condition of some of our customers may require us to write off amountsdue to us from prior sales.The result of any one or a combination of these factors could lead to further reduced revenue and increased oper-
ating losses.
We face intense competition that could hurt our sales and profitabilityThe market for networking solutions is extremely competitive. Competition in this market is based on varying combi-nations of price, functionality, manufacturing capability, installation, services, scalability and the ability of the systemsolutions to meet customers’ immediate and future network requirements. A small number of very large companies,including Alcatel, Cisco, Fujitsu, Hitachi, Huawei, Lucent, Marconi, NEC, Nortel, Siemens, Ericsson, and Tellabs havehistorically dominated the telecommunications equipment industry. They all have greater financial, marketing, manufac-turing and intellectual property resources than CIENA. They also often have existing relationships with our customersand potential customers. We also compete with a number of smaller companies that provide significant competition.
Because we sell systems that compete directly with product offerings of these companies, and in some cases displaceor replace their equipment, we represent a competitive threat. The decline in the market for communications networkingproducts has resulted in even greater competitive pressures. We expect that the aggressive tactics we have confrontedon the part of many of these competitors will continue, and perhaps become more severe. These tactics include:
• intense price competition in sales of new equipment, resulting in lower profit margins;
• discounting resulting from sales of used equipment or inventory that a competitor has written down or written off;
• early announcements of competing products and other marketing efforts;
• “one-stop shopping” options;
• customer financing assistance;
• marketing and advertising assistance; and
• intellectual property disputes.Tactics such as those described above can be particularly effective in a concentrated customer base like ours. Our cus-
tomers are under increasing competitive pressure to deliver their services at the lowest possible cost. This pressure may resultin the pricing of communications networking systems becoming a more important factor in customer decisions. This may favorlarger competitors that can spread the effect of price discounts across a larger array of products and services and across a largercustomer base than ours. If we are unable to offset any reductions in the average sales price for our products by a reductionin the cost of our products, our gross profit margins will be adversely affected. Our inability to compete successfully againstour competitors and maintain our gross profit margins would harm our business, financial condition and results of operations.
New competitors continue to emerge to compete with our products. They often base their products on the latestavailable technology. They may achieve commercial availability of their products more quickly due to the narrower focusof their efforts. Our inability to compete successfully against these companies would harm our business, financial con-dition and results of operations.
CIENA Corporation 10-K / 27

The success of our strategy depends on our ability to increase our revenue substantiallyWe have deliberately chosen to continue to spend on research and development, sales and marketing, and other oper-ating expenses at levels that will not permit us to return to profitability unless we can increase our revenue substantially.In order to do so, we plan both to continue to maintain and enhance our existing products and to expand and diversifyour product portfolio. In addition we believe we must continue to maintain a significant sales presence in our principlemarkets and to spend on marketing our products and services. We are implementing this strategy through a combina-tion of internal development, acquisitions of smaller companies, and strategic alliances with other vendors. If we fail toexecute this strategy effectively, or it does not produce substantial revenue growth, we will be required to modify thestrategy, which would likely have an adverse effect on our financial condition.
Our future success will depend on our ability to sell our products to our existing incumbent carriercustomers and add additional incumbent carriers as new customersHistorically, a large percentage of our sales were made to emerging carriers, many of which no longer exist orhave experienced severe financial difficulties and have reduced their equipment purchases. We expect that oursales to emerging carriers will continue to be at a lower level than they were at one time. Consequently, our futuresuccess will depend, to a large extent, on our ability to increase our sales to large domestic and internationalincumbent carriers.
We have limited experience in selling to incumbent carriers relative to many of our larger competitors. Many ofthem have long-standing relationships with incumbent carriers, which present additional challenges to the salesprocess. The sales cycles for these larger customers is often substantially longer than for sales to smaller customers;and they often require extensive testing of products before deciding to purchase them. In addition, even after a prod-uct has been selected for an incumbent carrier’s network and a contract has been signed, we are typically unable torecognize revenue until final network certification tests are completed satisfactorily, a process that is often lengthyand difficult. Complying with these certification requirements may involve unanticipated delays that could adverselyaffect our ability to sell to larger carriers or the timing of recognition of revenue. If we do not succeed in increasingour sales to our existing incumbent carrier customers and adding additional incumbent carriers as customers, our busi-ness will suffer.
We may not be successful in selling our products through new channels or to government customersWe believe that, in order to succeed, we must enter new markets and build a larger and more diverse customerbase. Therefore, we are beginning to sell some of our products to large enterprises and federal, state and local gov-ernments. To succeed in these markets, we believe we must develop and manage new sales channels throughresellers, distributors and systems integrators for sales of those of our products that are suitable for those markets.Since we have only limited experience in developing and managing such channels, it is uncertain to what extent wewill be successful.
Sales to federal, state and local governments often require compliance with complex procurement rules and regu-lations with which we have little experience. We may be unable to compete for government opportunities if we cannotcomply with these rules and regulations.
Our failure either to develop and manage new sales channels or to sell to government customers would adverselyaffect our ability to achieve our planned levels of revenue, which would adversely affect our profitability.
Our strategy involves pursuing strategic acquisitions and investments that may not be successfulOur business strategy includes acquiring or making strategic investments in other companies to expand our portfolio ofproducts and services and to acquire or accelerate the development of new or improved products. To do so, we mayuse cash, issue equity that would dilute our current shareholders’ ownership, incur debt or assume indebtedness. Inaddition, we may incur significant amortization expenses related to intangible assets. In the fourth quarter fiscal 2001and fourth quarter fiscal 2002, we incurred a significant write-off of goodwill associated with our previous acquisitions.
28 / CIENA Corporation 10-K

Strategic investments and acquisitions involve numerous risks, including:
• potential large cash expenditures;
• difficulties in integrating the operations, technologies and products of the acquired companies;
• diversion of management’s attention;
• potential difficulties in completing projects of the acquired company;
• the potential loss of key employees of the acquired company;
• dependence on unfamiliar or relatively small supply partners; and
• exposure to unanticipated liabilities.In addition, acquisitions and strategic investments may involve risks of entering markets in which we have little or
no prior experience and competitors have stronger market positions.
Product performance problems could limit our sales prospectsThe development and production of new products with high technology content often involves problems with software,components and manufacturing methods. If significant reliability, quality or network monitoring problems develop,including those due to defects in software or faulty components, a number of negative effects on our business couldresult, including:
• costs associated with fixing software or hardware defects;
• high service and warranty expenses;
• payment of liquidated damages for performance failures;
• high inventory obsolescence expense;
• high levels of product returns;
• delays in collecting accounts receivable;
• reduced orders from existing customers; and
• declining interest from potential customers.Although we maintain accruals for product warranties, actual costs could exceed these amounts. From time to time,
there will be interruptions or delays in the activation of our products at a customer’s site. These interruptions or delaysmay result from product performance problems or from issues with installation and activation, some of which are out-side our control. If we experience significant interruptions or delays that we cannot promptly resolve, confidence in ourproducts could be undermined, which could cause us to lose customers or otherwise harm our business.
Economic conditions require us to reduce the size of our business furtherSince November 2001, we have taken several steps, including reductions in force and dispositions of assets to reducethe size of our operations to better match the reduced sales of our products and services. Weakness in the telecommu-nications equipment market continues to affect our business. Accordingly, during the next twelve months we believethat we will be required to reduce our costs further. This could cause disruption in our business and require us to takeaccounting charges. If we fail to execute effectively on a program of cost reductions, our profitability could suffer.
Selling our products requires substantial investments of our resources that may not produce antici-pated benefitsIn order to sell our products to both potential and existing customers, we must invest in financial, engineering, manu-facturing and logistics support resources, even though we are unsure of the volume, duration or timing of customer pur-chases. Our customers are generally technically sophisticated and demanding. Consequently, we may incur substantialexpenses and devote resources to potential relationships that never materialize or fulfill our expectations, in which eventour investment may largely be lost. For example, we often provide equipment and services to our customers, free ofcharge, for the purpose of performing laboratory testing. In the quarter ended October 31, 2003, inventory increased asa result of providing a large amount of test equipment to a potential customer. If we are unsuccessful in winning thiscontract, we may be required to take a charge for the write down or write off of this inventory.
CIENA Corporation 10-K / 29

Our results can fluctuate unpredictablyPurchases by many of our potential and existing customers can be unpredictable, sporadic and subject to unanticipatedchanges. Our results, in turn, can fluctuate unpredictably. A decision to purchase our products requires a significantinvestment and commitment of resources by our customers. As a result, the sales cycles for many of our products arelong, often as much as a year or two between initial contact with a potential customer and the recognition of revenuefrom sales to the customer. Further, purchases by our existing customers tend to be large and sporadic, depending upontheir need to build a customer base, their plans for expanding their networks, the availability of financing, and the effectsof regulatory and business conditions in the countries in which they operate. Current economic and market conditionshave made it even more difficult to make reliable estimates of future revenue.
Fluctuations in our revenue can lead to even greater fluctuations in our operating profits. Our budgeted expense lev-els depend in part on our expectations of long-term future revenue. Any substantial adjustment to expenses to accountfor lower levels of revenue is difficult and takes time. Consequently, if our revenue does decline, our levels of inventory,operating expenses and general overhead would be high relative to our revenue, resulting in additional operating losses.
Other factors can also contribute to fluctuations in our revenue and operating results, including:
• variations and the mix between higher and lower margin products and services;
• fluctuations in demand for our products;
• changes in our pricing policies or the pricing policies of our competitors;
• the timing and size of orders from customers;
• changes in customers’ requirements, including changes or cancellations to orders from customers;
• the introduction of new products by us or our competitors;
• changes in the price or availability of components for our products;
• readiness of customer sites for installation;
• satisfaction of contractual customer acceptance criteria and related revenue recognition issues;
• manufacturing and shipment delays and deferrals;
• increased service, installation, warranty or repair costs;
• the timing and amount of employer payroll tax to be paid on employee gains on stock options exercised; and
• changes in general economic conditions as well as those specific to the telecommunications industry.
We may not be successful in enhancing and upgrading our productsThe market for communications networking solutions is characterized by rapid technological change, frequent introductions of newproducts, and recurring changes in customer requirements. To succeed in this market, we must continue to develop new prod-ucts and new features for existing products. Doing so is difficult and costly, and there is no assurance that we will continue tobe successful. In addition, we must be able to identify and gain access to promising new technologies. Failure to keep pace withtechnological advances would impair the competitiveness of our products and sooner or later do serious harm to our business.
Our products are based on complex technology that could result in unanticipated delays in developing, improving,manufacturing or deploying them. Modifying our products to enable customers to integrate them into a new type of net-work architecture entails similar development risks.
Certain enhancements to our products are in the development phase and are not yet ready for commercial manu-facturing or deployment. The maturing process from laboratory prototype to customer trials, and subsequently togeneral availability, involves a number of steps, including:
• completion of product development;
• the qualification and multiple sourcing of critical components;
• validation of manufacturing methods and processes;
• extensive quality assurance and reliability testing, and staffing of testing infrastructure;
• validation of software; and
• establishment of systems integration and systems test validation requirements.
30 / CIENA Corporation 10-K

Each of these steps, in turn, presents serious risks of failure, rework or delay, any one of which could decrease thespeed and scope of product introduction and marketplace acceptance of the product. Specialized application specificintegrated circuits (“ASICs”) and intensive software testing and validation are key to the timely introduction of enhance-ments to several of our products, and schedule delays are common in the final validation phase, as well as in the man-ufacture of specialized ASICs. In addition, unexpected intellectual property disputes, failure of critical design elements,and a host of other execution risks may delay or even prevent the introduction of these products. If we do not developand successfully introduce these products in a timely manner, our business, financial condition and results of operationswould be harmed.
We depend on a limited number of suppliers, and for some items we do not have a substitute supplierWe depend on a limited number of suppliers for components of our products, as well as for equipment used tomanufacture and test our products. Our products include several high-performance components for which reliable,high-volume suppliers are particularly limited. Furthermore, some key optical and electronic components we use inour products are currently available only from sole or limited sources, and in some cases, that source also is a com-petitor. Any delay in component availability for any of our products could result in delays in deployment of theseproducts and in our ability to recognize revenue. These delays could also harm our customer relationships and ourresults of operations.
Furthermore, the market for optical components has recently been consolidated resulting in reduced competition,which could lead to higher prices. In addition, the loss of a source of supply of key components could require us tore-engineer products that use those components, which would increase our costs.
On occasion, we have experienced delays in receipt of components and have received components that do not per-form according to their specifications. Any future difficulty in obtaining sufficient and timely delivery of components couldresult in delays or reductions in product shipments, which, in turn, could harm our business.
Any delays in component availability for any of our products or test equipment could result in delays in deploymentof these products and in our ability to recognize revenue from them. These delays could also harm our customer rela-tionships and our results of operations.
We rely on contract manufacturers for our productsWe rely on a small number of contract manufacturers to perform the majority of the manufacturing operations for ourproducts. The qualification of these manufacturers is an expensive and time-consuming process, and these contractmanufacturers build modules for other companies, including our competitors. In addition, we do not have contracts inplace with some of these manufacturers. We may not be able to effectively manage our relationships with our manu-facturers and we cannot be certain that they will be able to fill our orders in a timely manner. If we underestimate ourfuture product requirements, the contract manufacturers may not have enough product to meet our customer require-ments, and this could result in delays in the shipment of our products and our ability to recognize revenue. If we over-estimate product requirements, we may have to write off excess inventory.
We rely on service delivery partnersWe rely on a number of service delivery partners, both domestic and international, to complement CIENA’s global serv-ice and support resources. The certification of these partners incurs costs and is time-consuming, and these partnersservice products for other companies, including our competitors. We may not be able to effectively manage our relation-ships with our partners and we cannot be certain that they will be able to deliver our services in the manner or timerequired. If our service partners are unsuccessful in delivering services,
• we may compromise the relevant services revenue; and
• we may suffer delays in recognizing product revenues in cases where revenue recognition is dependent upon prod-uct installation, testing and acceptance.
CIENA Corporation 10-K / 31

Our ability to compete could be harmed if we are unable to protect and enforce our intellectual prop-erty rights or if we infringe on intellectual property rights of othersWe share our proprietary information and intellectual property, including our source code, with other parties as neces-sary to meet the needs of our business. We rely on a combination of patent, copyright, trademark and trade secret lawsand restrictions on disclosure to protect our intellectual property rights. We enter into non-disclosure and proprietaryrights agreements with our employees and consultants, license agreements with our corporate partners, and we con-trol access to and distribution of our products, documentation and other proprietary information. Despite our efforts toprotect our proprietary rights, unauthorized parties may attempt to copy or otherwise obtain and use our products ortechnology. This is likely to become an increasing issue as we expand our operations and sales into countries that pro-vide a lower level of protection for intellectual property.
Monitoring unauthorized use of our products is difficult, and we cannot be certain that the steps we have taken willprevent unauthorized use of our technology. If competitors are able to use our technology, our ability to compete effec-tively could be harmed. We have filed a patent infringement lawsuit to enforce our intellectual property right, and maybecome involved with additional disputes in the future. Such lawsuits can be costly and may significantly divert the timeand attention of our personnel.
We have been subject to several claims of patent infringement, which in some cases have required us to pay thepatent holders substantial sums or enter into license agreements requiring ongoing royalty payments. The frequency ofassertions of patent infringement in the field of telecommunications networking solutions is increasing as patent hold-ers seek alternative sources of revenue. There is a possibility that we may again find ourselves required to take patentlicenses or to redesign or stop selling products that allegedly infringe patents belonging to others. If we are sued forinfringement and are unsuccessful in defending the suit, we could be subject to significant damages, and our businessand customer relationships could be adversely affected.
We face risks associated with our international operationsWe market, sell and service our products globally. We have established offices around the world, including in NorthAmerica, Europe, Latin America and the Asia Pacific region. We will continue to expand our international operations andenter new international markets. This expansion will require significant management attention and financial resources todevelop successfully direct and indirect international sales and support channels. In some countries, our success willdepend in part on our ability to form relationships with local partners. We cannot be sure that we will be able to identifyappropriate partners or reach mutually satisfactory arrangements with them for sales of our products. There is a risk thatwe may sometimes choose the wrong partner. For these reasons, we may not be able to maintain or increase interna-tional market demand for our products.
International operations are subject to inherent risks, and our future results could be adversely affected by a varietyof uncontrollable and changing factors. These include:
• greater difficulty in collecting accounts receivable and longer collection periods;
• difficulties and costs of staffing and managing foreign operations;
• the impact of recessions in economies outside the United States;
• unexpected changes in regulatory requirements;
• certification requirements;
• reduced protection for intellectual property rights in some countries;
• potentially adverse tax consequences;
• political and economic instability;
• trade protection measures and other regulatory requirements;
• service provider and government spending patterns; and
• natural disasters and epidemics.Such factors could have a material adverse impact on our operating results and financial condition.
32 / CIENA Corporation 10-K
We face risks in reselling the products of other companiesWe have recently entered into agreements that permit us to distribute the products of other companies and may enterinto other agreements in the future. To the extent we succeed in reselling the products of these companies, we may berequired by customers to assume warranty and service obligations. While these suppliers have agreed to support us withrespect to those obligations, they are relatively small companies with limited financial resources. If they should beunable, for any reason, to provide the required support, we may have to expend our own resources on doing so. Thisrisk is amplified by the fact that the equipment has been designed and manufactured by others, and is thus subject towarranty claims whose magnitude we are currently unable to evaluate fully.
If we are unable to retain and attract qualified personnel, we may be unable to effectively manageour businessIf we are unable to retain and motivate our existing employees and attract qualified personnel to fill key positions, wemay be unable to effectively develop our existing products, make timely product introductions and increase sales. Sincewe generally do not have employment contracts with our employees, we must rely upon providing competitive compen-sation packages and a dynamic work environment to retain and motivate employees. In response to the decline in ourrevenue and weakness in the telecommunications equipment market, we have not increased salaries for or paidbonuses to most of our employees since the end of fiscal 2001. Since our compensation packages include equity-basedincentives, pressure on our stock price could affect our ability to continue to offer competitive compensation packagesto our employees. In addition to these compensation issues, we must continue to motivate employees to execute ourstrategies and achieve our goals, which may be difficult due to morale challenges posed by the workforce reductionsand uncertainty in our industry and the economy in general.
If we lose members of our management team or other key personnel, it may be difficult to replace them. Even inthe current economic downturn, competition for highly skilled technical and other personnel can be intense. As a result,we may not be successful in identifying, recruiting and hiring qualified engineers and other key personnel.
We are exposed to the credit risk of our customersIndustry and economic conditions have weakened the financial position of some of our customers. To sell to some ofthese customers, we may be required to take risks of uncollectible accounts. While we monitor these situations care-fully and attempt to take appropriate measures to protect ourselves, it is possible that we may have to write down orwrite off doubtful accounts. Such write-downs or write-offs, if large, could have a material adverse effect on our operat-ing results and financial condition.
Our stock price is volatileOur common stock price has experienced substantial volatility in the past, and is likely to remain volatile in the future.Volatility can arise as a result of divergence between our actual or anticipated financial results and published expecta-tions of analysts, and announcements that we, our competitors, or our customers may make.
Divergence between our actual results and our anticipated results, analyst estimates and public announcements byus, our competitors, or by customers will occur from time to time in the future, with resulting stock price volatility, irre-spective of our overall year-to-year performance or long-term prospects. As long as we continue to depend on a limitedcustomer base, and particularly when a substantial majority of their purchases consist of newly introduced products,there is substantial chance that our quarterly results will vary widely.
CIENA Corporation 10-K / 33

Forward-looking statementsSome of the statements contained, or incorporated by reference, in this annual report discuss future expectations, containprojections of results of operations or financial condition or state other “forward-looking” information. Those statementsare subject to known and unknown risks, uncertainties and other factors that could cause the actual results to differmaterially from those contemplated by the statements. The “forward-looking” information is based on various factorsand was derived using numerous assumptions. In some cases, you can identify these so-called “forward-looking state-ments” by words like “may,” “will,” “should,” “expects,” “plans,” “anticipates,” “believes,” “estimates,” “predicts,”“potential” or “continue” or the negative of those words and other comparable words. You should be aware that thosestatements only reflect our predictions. Actual events or results may differ substantially. Important factors that couldcause our actual results to be materially different from the forward-looking statements are disclosed throughout thisreport, particularly under the heading “Risk Factors” above.
Item 7A. Quantitative and Qualitative Disclosures about Market RiskThe following discussion about the Company’s market risk disclosures involves forward-looking statements. Actualresults could differ materially from those projected in the forward-looking statements. The Company is exposed to mar-ket risk related to changes in interest rates and foreign currency exchange rates. The Company does not use derivativefinancial instruments for speculative or trading purposes.
Interest Rate Sensitivity. The Company maintains a short-term and long-term investment portfolio. These avail-able-for-sale securities are subject to interest rate risk and will fall in value if market interest rates increase. If marketinterest rates were to increase immediately and uniformly by 10 percent from levels at October 31, 2003, the fair valueof the portfolio would decline by approximately $112.2 million.
Foreign Currency Exchange Risk. As a global concern, the Company faces exposure to adverse movements in for-eign currency exchange rates. These exposures may change over time as business practices evolve and if our exposureincreases, adverse movement in foreign currency exchange rates could have a material adverse impact on theCompany’s financial results. The Company’s primary exposures are related to non-dollar denominated operatingexpenses in Canada, Latin America, Europe and Asia where the Company sells primarily in U.S. dollars. The Company isprepared to hedge against fluctuations in foreign currency if this exposure becomes material. As of October 31, 2003,the assets and liabilities of the Company related to non-dollar denominated currencies were not material. Therefore wedo not expect an increase or decrease of 10% in the foreign exchange rate would have a material impact on theCompany’s financial position.
Item 8. Financial Statements and Supplementary DataThe following is an index to the consolidated financial statements and supplementary data:
Page Number
Report of Independent Auditors 35
Consolidated Balance Sheets 36
Consolidated Statements of Operations 37
Consolidated Statements of Changes in Stockholders’ Equity 38
Consolidated Statements of Cash Flows 39
Notes to Consolidated Financial Statements 40
34 / CIENA Corporation 10-K

Report of Independent Auditors
To the Board of Directors and Shareholders of CIENA Corporation:
In our opinion, the accompanying consolidated balance sheets and the related consolidated statements of income, share-holders’ equity and cash flows present fairly, in all material respects, the financial position of CIENA Corporation and itssubsidiaries at October 31, 2003 and October 31, 2002, and the results of their operations and their cash flows for eachof the three years in the period ended October 31, 2003 in conformity with accounting principles generally accepted inthe United States of America. These financial statements are the responsibility of the Company’s management; ourresponsibility is to express an opinion on these financial statements based on our audits. We conducted our audits ofthese statements in accordance with auditing standards generally accepted in the United States of America, whichrequire that we plan and perform the audit to obtain reasonable assurance about whether the financial statements arefree of material misstatement. An audit includes examining, on a test basis, evidence supporting the amounts and dis-closures in the financial statements, assessing the accounting principles used and significant estimates made by man-agement, and evaluating the overall financial statement presentation. We believe that our audits provide a reasonablebasis for our opinion.
As discussed with Note 1 to the financial statements, the Company ceased amortizing certain goodwill and intangi-bles as a result of the adoption of Statement of Financial Accounting Standards No. 142, “Goodwill and Other IntangibleAssets,” effective on first day of its 2002 fiscal year.
PricewaterhouseCoopers LLPMcLean, VADecember 9, 2003
CIENA Corporation 10-K / 35

CIENA Corporation
Consolidated Balance SheetsOctober 31,
(in thousands, except share data) 2002 2003ASSETSCurrent assets:
Cash and cash equivalents $ 377,189 $ 309,665
Short-term investments 1,130,414 796,809
Accounts receivable, net 28,680 43,600
Inventories, net 47,023 44,995
Prepaid expenses and other 54,351 34,334
Total current assets 1,637,657 1,229,403
Long-term investments 570,861 519,744
Equipment, furniture and fixtures, net 196,951 114,930
Goodwill 212,500 336,039
Other intangible assets, net 62,457 108,408
Other long-term assets 70,596 69,641
Total assets $ 2,751,022 $ 2,378,165
LIABILITIES AND STOCKHOLDERS’ EQUITYCurrent liabilities:
Accounts payable $ 39,841 $ 44,402
Accrued liabilities 132,588 98,926
Restructuring liabilities 27,423 14,378
Unfavorable lease commitments 7,630 9,380
Income taxes payable — 4,640
Deferred revenue 15,388 14,473
Other current obligations 948 —
Total current liabilities 223,818 186,199
Long-term deferred revenue 15,444 14,547
Long-term restructuring liabilities 65,742 52,164
Long-term unfavorable lease commitments 70,124 61,312
Other long-term obligations 5,009 2,698
Convertible notes payable 843,616 730,428
Total liabilities 1,223,753 1,047,348
Commitments and contingencies
Stockholders’ equity:Preferred stock—par value $0.01; 20,000,000 shares authorized;
zero shares issued and outstanding — —
Common stock—par value $0.01; 980,000,000 shares authorized;
432,842,481 and 473,214,856 shares issued and outstanding 4,328 4,732
Additional paid-in capital 4,683,865 4,861,182
Deferred stock compensation (24,983) (9,664)
Notes receivable from stockholders (3,866) (448)
Accumulated other comprehensive income 8,840 2,447
Accumulated deficit (3,140,915) (3,527,432)
Total stockholders’ equity 1,527,269 1,330,817
Total liabilities and stockholders’ equity $ 2,751,022 $ 2,378,165
The accompanying notes are an integral part of these consolidated financial statements.
36 / CIENA Corporation 10-K

CIENA Corporation
Consolidated Statements of OperationsYear Ended October 31,
(in thousands, except per share data) 2001 2002 2003Revenue:
Products $ 1,518,833 $ 304,155 $ 240,772
Services 84,396 57,000 42,364
Total revenue 1,603,229 361,155 283,136
Costs:
Products 720,874 228,074 158,898
Services 115,264 81,485 56,489
Excess and obsolete inventory costs (benefit) 68,411 286,475 (5,296)
Total cost of goods sold 904,549 596,034 210,091
Gross profit (loss) 698,680 (234,879) 73,045
Operating expenses:
Research and development 235,831 239,619 199,699
Selling and marketing 146,949 130,276 103,193
General and administrative 57,865 52,612 38,478
Deferred stock compensation costs:
Research and development 17,783 15,672 12,824
Selling and marketing 8,378 3,560 2,728
General and administrative 15,206 1,092 1,225
Amortization of goodwill 177,786 — —
Amortization of intangible assets 4,413 8,972 17,870
In-process research and development 45,900 — 2,800
Restructuring costs 15,439 225,429 31,155
Goodwill and intangible impairment 1,719,426 557,286 29,596
Provision for doubtful accounts (6,579) 14,813 —
Total operating expenses 2,438,397 1,249,331 439,568
Loss from operations (1,739,717) (1,484,210) (366,523)
Interest and other income (expense), net 63,579 61,145 42,959
Interest expense (30,591) (45,339) (36,331)
Loss on equity investments, net — (15,677) (4,760)
Loss on extinguishment of debt — (2,683) (20,606)
Loss before income taxes (1,706,729) (1,486,764) (385,261)
Provision for income taxes 87,333 110,735 1,256
Net loss $(1,794,062) $(1,597,499) $(386,517)
Basic and diluted net loss per common share and dilutive potential common share $ (5.75) $ (4.37) $ (0.87)
Weighted average basic common and dilutive potential common shares outstanding 311,815 365,202 446,696
The accompanying notes are an integral part of these consolidated financial statements.
CIENA Corporation 10-K / 37

CIENA Corporation
Consolidated Statements of Changes in Stockholders’ EquityAccumu-
Notes latedDeferred Receivable Other Total
Additional Stock from Compre- Retained Stockholders’ Common Stock Paid-in- Compen- Stock- hensive Earnings Equity
(dollars in thousands) Shares Amount Capital sation holders Income (Deficit) (Deficit)
Balance at October 31, 2000 286,530,631 $2,865 $ 541,030 $ 16,227 $ (30) $ (903) $ 250,646 $ 809,835Net loss — — — — — — (1,794,062) (1,794,062)Changes in unrealized gains on investments, net — — — — — 5,804 — 5,804
Translation adjustment — — — — — (59) — (59)Comprehensive loss $(1,788,317)Exercise of stock options 4,373,093 44 35,343 — — — — 35,387Unearned stock compensation — — — (98,456) — — — (98,456)Deferred stock compensation costs — — — 41,367 — — — 41,367Forfeiture of unearned stock compensation — — (3,489) 3,489 — — — —
Issuance of common stock, net of issuance costs 37,118,540 371 3,060,396 — (7,785) — — 3,052,982
Tax benefit from the exercise of stock options — — 71,605 — — — — 71,605
Repayment of receivables from stockholders — — — — 4,579 — — 4,579
Balance at October 31, 2001 328,022,264 $3,280 $3,704,885 $(37,373) $(3,236) $ 4,842 $(1,543,416) $ 2,128,982Net loss — — — — — — (1,597,499) $(1,597,499)Changes in unrealized gains on investments, net — — — — — 3,731 — 3,731
Translation adjustment — — — — — 267 — 267Comprehensive loss $(1,593,501)Exercise of stock options 3,699,493 37 15,103 — — — — 15,140Unearned stock compensation — — — (8,826) — — — (8,826)Deferred stock compensation costs — — — 21,216 — — — 21,216Issuance of common stock, net of issuance costs 101,120,724 1,011 963,877 — (5,673) — — 959,215
Repayment of receivables from stockholders — — — — 5,043 — — 5,043
Balance at October 31, 2002 432,842,481 $4,328 $4,683,865 $(24,983) $(3,866) $ 8,840 $(3,140,915) $ 1,527,269Net loss — — — — — — (386,517) (386,517)Changes in unrealized gains on investments, net —- —- — — — (6,743) — (6,743)
Translation adjustment — — — — — 350 — 350Comprehensive loss $ (392,910)Exercise of stock options 4,608,143 46 13,752 — — — — 13,798Unearned stock compensation — — — (7,385) — — — (7,385)Deferred stock compensation costs — — — 17,093 — — — 17,093Forfeiture of unearnedstock compensation — — (5,611) 5,611 — — — —
Issuance of common stock, net of issuance costs 35,764,232 358 169,176 — — — — 169,534
Repayment of receivables from stockholders — — — — 3,418 — — 3,418
Balance at October 31, 2003 473,214,856 $4,732 $4,861,182 $ (9,664) $ (448) $ 2,447 $(3,527,432) $ 1,330,817
The accompanying notes are an integral part of these consolidated financial statements.
38 / CIENA Corporation 10-K

CIENA Corporation
Consolidated Statements of Cash FlowsYear Ended October 31,
(in thousands) 2001 2002 2003Cash flows from operating activities:
Net loss $(1,794,062) $(1,597,499) $ (386,517)Adjustments to reconcile net loss to net cash provided by (used in) operating activities:Early extinguishment of debt — — 20,606Tax benefit related to exercise of stock options and warrants 71,605 — —Non-cash impairment from equity transactions — 13,823 4,760Non-cash portion of restructuring charges and related asset write-downs — 113,596 37,828Effect of accumulated translation adjustment (59) 267 350Accretion of convertible notes payable 6,183 12,693 6,432In-process research and development 45,900 — 2,800Depreciation 100,882 122,048 75,834Amortization of goodwill, goodwill impairment, other intangibles, deferred stock compensation and debt issuance costs 1,948,740 589,610 70,554
Provision for doubtful accounts (6,579) 14,813 —Provision for inventory excess and obsolescence 68,411 250,457 (5,296)Provision for warranty and other contractual obligations 33,073 13,271 9,301Changes in assets and liabilities:
Accounts receivable (139,534) 358,493 (14,187)Inventories (177,482) (27,807) 9,216Deferred income tax asset (6,631) 186,861 —Prepaid expenses and other (35,640) (12,625) 3,977Accounts payable and accruals 8,648 6,275 (78,753)Income taxes payable (834) (7,170) 4,626Deferred revenue and other obligations 40,522 (65,079) (2,689)
Net cash provided by (used in) operating activities 163,173 (27,973) (241,158)Cash flows from investing activities:
Additions to equipment, furniture and fixtures (238,544) (66,330) (29,544)Purchase of available for sale securities (1,714,077) (1,521,479) (1,049,993)Maturities of available for sale securities 420,885 1,547,516 1,414,808Marketable securities (discount) premium amortization — 2,469 11,948Acquisition of business, inclusive of intellectual property and other intangibles, net of cash acquired 54,101 286,899 (29,668)
Minority equity investments (13,005) (10,000) (15,000)Net cash (used in) provided by investing activities (1,490,640) 239,075 302,551
Cash flows from financing activities:Net proceeds from (repayment of) other obligations 1,265 (1,015) (4,370)Proceeds from (repayment of) convertible notes payable 669,300 (250,971) (140,261)Proceeds from issuance of common stock and warrants 907,026 15,140 13,798Repayment of notes receivable from stockholders 4,579 5,043 1,916
Net cash provided by (used in) financing activities 1,582,170 (231,803) (128,917)Net increase (decrease) in cash and cash equivalents 254,703 (20,701) (67,524)
Cash and cash equivalents at beginning of period 143,187 397,890 377,189Cash and cash equivalents at end of period $ 397,890 $ 377,189 $ 309,665Supplemental disclosure of cash flow information:
Cash paid during the period for:Interest $ 16,051 $ 36,776 $ 30,287Income taxes $ 1,007 $ 485 $ 1,780
Issuance of common stock for notes receivable from stockholders $ — $ — $ —
The accompanying notes are an integral part of these consolidated financial statements.
CIENA Corporation 10-K / 39

CIENA Corporation
Notes to Consolidated Financial Statements
(1) The Company and Significant Accounting Policies and EstimatesDescription of BusinessCIENA is a leading global provider of innovative network solutions to service providers and enterprises worldwide. Ourcustomers include long distance carriers, local exchange carriers, cable operators, Internet service providers, wirelessand wholesale carriers, resellers, governments, large businesses and non-profit institutions.
CIENA was incorporated in Delaware in November 1992, and completed its initial public offering on February 7,1997. CIENA’s principal executive offices are located at 1201 Winterson Road, Linthicum, Maryland 21090.
Principles of ConsolidationCIENA has 25 wholly owned U.S. and international subsidiaries, which have been consolidated in the accompany-ing financial statements. On August 29, 2003, CIENA acquired all of the outstanding capital stock of AkaraCorporation (“Akara”), a Delaware company based in Ottawa, Ontario. On June 16, 2003, CIENA acquired bymerger WaveSmith Networks, Inc. (“WaveSmith”), a Delaware company based in Acton, Massachusetts. On June 21,2002, CIENA acquired by merger ONI Systems Corp. (“ONI”), a Delaware Company, listed on NASDAQ, which washeadquartered in San Jose, California. On March 29, 2001, CIENA acquired all of the outstanding capital stock CyrasSystems, Inc. (“Cyras”), a Delaware company based in Fremont, California. The Akara, WaveSmith, ONI and Cyrastransactions were all accomplished as tax-free reorganizations, all of which were recorded using the purchaseaccounting method.
The accompanying consolidated financial statements include the accounts of CIENA and its wholly owned sub-sidiaries. All material intercompany accounts and transactions have been eliminated in consolidation.
Fiscal YearThe Company has a 52 or 53 week fiscal year, which ends on the Saturday nearest to the last day of October in eachyear (November 1, 2003, November 2, 2002, and November 3, 2001). For purposes of financial statement presentation,each fiscal year is described as having ended on October 31. Fiscal 2001 was comprised of 53 weeks. Fiscal 2002 and2003 were comprised of 52 weeks.
Use of EstimatesThe preparation of financial statements in conformity with generally accepted accounting principles requires theCompany to make estimates, judgments and assumptions that affect the reported amounts of assets, liabilities, revenueand expenses, together with amounts disclosed in the related notes to the financial statements. Actual results could dif-fer from the recorded estimates.
Cash and Cash EquivalentsThe Company considers all highly liquid investments purchased with expected original maturities of three months or lessto be cash equivalents.
InvestmentsCIENA’s short-term and long-term investments are classified as available-for-sale and are reported at fair value, with unre-alized gains and losses, net of tax, recorded in accumulated other comprehensive income. Realized gains or losses anddeclines in value determined to be other than temporary, if any, on available-for-sale securities will be reported in otherincome or expense as incurred.
40 / CIENA Corporation 10-K

CIENA also has certain other minority equity investments in non-publicly traded companies. These investments aregenerally carried at cost as CIENA owns less than 20% of the voting equity and does not have the ability to exercise sig-nificant influence over these companies. As of October 31, 2002 and October 31, 2003, $16.1 million and $21.3 millionof these investments are included in other long-term assets, respectively. These investments are inherently high risk asthe market for technologies or product manufactured by these companies are usually early stage at the time of theinvestment by CIENA and such markets may never be significant. CIENA could lose its entire investment in some or allof these companies. CIENA monitors these investments for impairment and makes appropriate reductions in carryingvalues when necessary. During fiscal 2003 and 2002, CIENA recorded a charge of $4.8 million and $16.6 million, respec-tively, from a decline in the fair values of certain equity investments that were determined to be other than temporary.No write-downs were recorded during fiscal 2001.
InventoriesInventories are stated at the lower of cost or market, with cost determined on the first-in, first-out basis. The Companyrecords a provision for excess and obsolete inventory whenever such an impairment has been identified.
Equipment, Furniture and FixturesEquipment, furniture and fixtures are recorded at cost. Depreciation and amortization are computed using thestraight-line method over useful lives of 2–5 years for equipment, furniture and fixtures and 2–10 years for lease-hold improvements.
Internal use software and web site development costs are capitalized in accordance with Statement of Position(SOP) No. 98-1, “Accounting for the Costs of Computer Software Developed or Obtained for Internal Use,” andEmerging Issues Task Force (“EITF”) Issue No. 00-02, “Accounting for Web Site Development Costs.” Qualifying costsincurred during the application development stage, which consist primarily of outside services and purchased softwarelicense costs, are capitalized and amortized over the estimated useful life of the asset.
Goodwill and Purchased Intangible AssetsThe Company has recorded goodwill and purchased intangible assets as a result of several acquisitions. See Note 2.Purchased intangible assets are carried at cost less accumulated amortization. Amortization is computed using thestraight-line method over the economic lives of the respective assets, generally three to seven years. It is the Company’spolicy to assess periodically the carrying amount of its purchased intangible assets to determine if there has been animpairment to their carrying value. Impairments of other intangibles assets are determined in accordance with StatementFinancial Accounting Standards No. 144 “Accounting for the Impairment or disposal of Long-Lived Assets” (“SFAS 144”).This statement is effective for fiscal 2003 and supersedes Statement of Financial Accounting Standard No. 121,“Accounting for the Impairment of Long-Lived Assets and for Long-Lived Assets to Be Disposed Of” (“SFAS 121”).
In July 2001, the Financial Accounting Standards Board issued Statement of Financial Accounting Standards No. 141 “Business Combinations” (“SFAS 141”) and Statement of Financial Accounting Standards No. 142 “Goodwill andOther Intangible Assets” (“SFAS 142”). SFAS 141 addresses financial accounting and reporting for business combinations.This statement requires the purchase method of accounting to be used for all business combinations, and prohibits thepooling-of-interests method of accounting. It is effective for all business combinations initiated after June 30, 2001 andsupersedes APB Opinion No. 16, “Business Combinations” as well as Financial Accounting Standards Board Statementof Financial Accounting Standards No. 38, “Accounting for Preacquisition Contingencies of Purchased Enterprises.”
SFAS 142 addresses how intangible assets acquired individually or with a group of other assets should be accountedfor in financial statements upon their acquisition. This statement requires goodwill amortization to cease and for goodwillto be periodically reviewed for impairment for fiscal years beginning after October 31, 2001. SFAS 142 supersedes APBOpinion No. 17, “Intangible Assets.” The Company adopted the provisions of this standard for its first quarter of fiscal 2002.
CIENA Corporation 10-K / 41

The following table presents the impact of SFAS 142 on net loss and net loss per share had SFAS 142 been in effectfor fiscal 2001, 2002 and 2003 (in thousands except per share data):
Fiscal Year Ended October 31,2001 2002 2003
Net loss $(1,794,062) $(1,597,499) $(386,517)
Adjustments:
Amortization of goodwill 177,786 — —
Adjusted net loss $(1,616,276) $(1,597,499) $(386,517)
Weighted average shares—basic and diluted 311,815 365,202 446,696
Adjusted basic and diluted EPS $ (5.18) $ (4.37) $ (0.87)
Reported basic and diluted EPS $ (5.75) $ (4.37) $ (0.87)
ConcentrationsSubstantially all of CIENA’s cash and cash equivalents, short-term and long-term investments, are custodied at threemajor U.S. financial institutions. The majority of CIENA’s cash equivalents consist of money market funds and overnightrepurchase agreements. Deposits held with banks may exceed the amount of insurance provided on such deposits.Generally these deposits may be redeemed upon demand and, therefore, bear minimal risk.
Historically, CIENA has relied on a limited number of customers for a substantial portion of the Company’s revenue.During fiscal 2003 Qwest and AT&T each accounted for at least 10% of CIENA’s revenue and combined accounted for24.9%. During fiscal 2002, Sprint and AT&T each accounted for at least 10% of CIENA’s revenue and combined accountedfor 36.8%. During fiscal 2001, Sprint and Qwest Communications each accounted for at least 10% of CIENA’s revenue and,combined, accounted for 50.5%. CIENA expects that a significant portion of the Company’s future revenue will continueto be generated by a limited number of customers. The loss of any one of these customers or any substantial reductionin orders by any one of these customers could materially adversely affect CIENA’s financial condition or operating results.
Additionally, CIENA’s access to certain raw materials is dependent upon single and sole source suppliers. The inabil-ity of any supplier to fulfill supply requirements of CIENA could affect future results. CIENA relies on a small number ofcontract manufacturers to perform the majority of the manufacturing operations for its products. If CIENA cannot effec-tively manage these manufacturers and forecast future demand, or of they fail to deliver products or components ontime, CIENA’s business may suffer.
Revenue RecognitionCIENA recognizes product revenue in accordance with the terms of the sales contract and where collection is reason-ably assured. For transactions where CIENA has yet to obtain customer acceptance, revenue is not recognized until theterms of acceptance are satisfied. Revenue for installation services is recognized as the services are performed unlessthe terms of the supply contract combine product acceptance with installation, in which case, revenue from installationservices are recognized when the terms of acceptance are satisfied and installation is completed. Amounts received inexcess of revenue recognized are included as deferred revenue in the accompanying balance sheet. For transactionsinvolving the sale of software, revenue is recognized in accordance with Statement of Position No. 97-2 (“SOP 97-2”),“Software Revenue Recognition,” including deferral of revenue recognition in instances where vendor specific objectiveevidence for undelivered elements is not determinable. For distributor sales where risks of ownership have not trans-ferred, CIENA recognizes revenue when the product is shipped through to the end user.
Revenue-Related AccrualsThe Company provides for the estimated costs to fulfill customer warranty and other contractual obligations upon therecognition of the related revenue. Such reserves are determined based upon actual warranty cost experience, esti-mates of component failure rates, and management’s industry experience. The Company’s sales contracts generally donot permit the right of return of product by the customer after the product has been accepted.
42 / CIENA Corporation 10-K

Research and DevelopmentThe Company charges all research and development costs to expense as incurred.
Advertising CostsThe Company expenses all advertising costs as incurred.
Income TaxesThe Company accounts for income taxes in accordance with Statement of Financial Accounting Standards No. 109(“SFAS 109”), “Accounting for Income Taxes.” SFAS 109 is an asset and liability approach that requires the recognitionof deferred tax assets and liabilities for the expected future tax consequences attributable to differences between thecarrying amounts of assets and liabilities for financial reporting purposes and their respective tax bases, and for operat-ing loss and tax credit carry forwards. In estimating future tax consequences, SFAS 109 generally considers all expectedfuture events other than the enactment of changes in tax laws or rates. Valuation allowances are provided if, based uponthe weight of the available evidence, it is more likely than not that some or all of the deferred tax assets will not be real-ized. Tax savings resulting from deductions associated with stock options and certain stock warrants are credited directlyto additional paid in capital when realization of such benefit is fully assured. See Note 13.
Fair Value of Financial InstrumentsThe carrying amounts of the Company’s financial instruments, which include short-term and long-term investments, accountsreceivable, accounts payable, and other accrued expenses, approximate their fair values due to their short maturities.
Foreign Currency TranslationThe majority of the Company’s foreign branches and subsidiaries use the U.S. dollar as their functional currency, as theU.S. parent exclusively funds the branches and subsidiaries’ operations with U.S. dollars. For those subsidiaries usingthe local currency as their functional currency, assets and liabilities are translated at exchange rates in effect at the bal-ance sheet date. Resulting translation adjustments are recorded directly to a separate component of stockholders’equity. Where the U.S. dollar is the functional currency, translation adjustments are recorded in other income. The netgain (loss) on foreign currency re-measurement and exchange rate changes for fiscal 2001, 2002 and 2003 was imma-terial for separate financial statement presentation.
Computation of Basic Net Income (Loss) per Common Share and Diluted Net Income (Loss) perCommon and Dilutive Potential Common ShareThe Company calculates earnings per share in accordance with the Statement of Financial Accounting Standards No. 128,“Earnings per Share” (“SFAS 128”). SFAS 128 simplifies the earnings per share (“EPS”) computation and replaces thepresentation of primary EPS with a presentation of basic EPS. This statement also requires dual presentation of basic anddiluted EPS on the face of the income statement for entities with a complex capital structure and requires a reconciliationof the numerator and denominator used for the basic and diluted EPS computations. See Note 11.
Software Development CostsStatement of Financial Accounting Standards No. 86, “Accounting for the Costs of Computer Software to be Sold,Leased or Otherwise Marketed” (“SFAS 86”), requires the capitalization of certain software development costsincurred subsequent to the date technological feasibility is established and prior to the date the product is generallyavailable for sale. The capitalized cost is then amortized over the estimated product life. The Company defines techno-logical feasibility as being attained at the time a working model is completed. To date, the period between achievingtechnological feasibility and the general availability of such software has been short, and software development costsqualifying for capitalization have been insignificant. Accordingly, the Company has not capitalized any software devel-opment costs.
CIENA Corporation 10-K / 43

Accounting for Stock OptionsIn October 1995, the Financial Accounting Standards Board issued Statement of Financial Accounting Standard No. 123(“SFAS 123”), “Accounting for Stock-Based Compensation.” SFAS 123 allows companies to account for stock-basedcompensation either under the new provisions of SFAS 123 or using the intrinsic value method provided by AccountingPrinciples Board Opinion No. 25 (“APB 25”), “Accounting for Stock Issued to Employees,” but requires pro forma dis-closure in the footnotes to the financial statements as if the measurement provisions of SFAS 123 had been adopted.
In December 2002, the Financial Accounting Standards Board issued Statement of Financial Accounting StandardNo. 148, “Accounting for Stock-Based Compensation-Transition and Disclosure” (“SFAS 148”). SFAS 148 amendsSFAS 123, to provide alternative methods of transition for a voluntary change to the fair value based method of accountingfor stock-based employee compensation. In addition, SFAS 148 amends the disclosure requirements of SFAS 123 torequire prominent disclosures in both annual and interim financial statements about the method of accounting for stock-based employee compensation and the effect of the method used on reported results. SFAS 148 is effective for financialstatements for fiscal years ending after December 15, 2002.
The Company has elected to continue to account for its stock-based compensation in accordance with the provi-sions of APB 25 as interpreted by FASB Interpretation No. 44, “Accounting for Certain Transactions Involving StockCompensation, an Interpretation of APB Opinion No. 25,” (“FIN 44”) and present the pro forma disclosures required bySFAS 123 as amended by SFAS 148. See Note 14.
Segment ReportingIn June 1997, the Financial Accounting Standards Board issued Statement of Financial Accounting Standards No. 131(“SFAS 131”), “Disclosures about Segments of an Enterprise and Related Information.” SFAS 131 establishes annualand interim reporting standards for operating segments of a company. It also requires entity-wide disclosures about theproducts and services an entity provides, the material countries in which it holds assets and reports revenue, and itsmajor customers. The Company is not organized by multiple operating segments for the purpose of making operatingdecisions or assessing performance. Accordingly, the Company operates in one operating segment and reports only cer-tain enterprise-wide disclosures. See Note 16.
Newly Issued Accounting StandardsIn November 2002, the FASB issued FASB Interpretation No. 45 (“FIN 45”), “Guarantor’s Accounting and DisclosureRequirements for Guarantees, Including Indirect Guarantees of Indebtedness of Others.” FIN 45 requires that a liabilitybe recorded in the guarantor’s balance sheet upon issuance of a guarantee. In addition, FIN 45 requires disclosures aboutthe guarantees that an entity has issued, including a reconciliation of changes in the entity’s product warranty liabilities.The initial recognition and initial measurement provisions of FIN 45 are applicable on a prospective basis to guaranteesissued or modified after December 31, 2002, irrespective of the guarantor’s fiscal year end. The disclosure requirementsof FIN 45 are effective for financial statements of interim or annual periods ending after December 15, 2002. The adop-tion of this standard did not have a material impact on CIENA’s financial statements.
In November 2002, the Emerging Issues Task Force (“EITF”) reached a consensus on Issue No. 00-21, “RevenueArrangements with Multiple Deliverables.” EITF Issue No. 00-21 provides guidance on how to account for arrangementsthat involve the delivery or performance of multiple products, services and/or rights to use assets. The provisions of EITFIssue No. 00-21 will apply to revenue arrangements entered into in fiscal periods beginning after June 15, 2003. TheCompany does not expect that the adoption of this standard will have a material effect on its financial position or resultsof operations.
In January 2003, the FASB issued FASB Interpretation No. 46 (“FIN 46”), “Consolidation of Variable InterestEntities, an Interpretation of Accounting Research Bulletin No. 51.” FIN 46 requires certain variable interest entities tobe consolidated by the primary beneficiary of the entity if the equity investors in the entity do not have the characteristics
44 / CIENA Corporation 10-K

of a controlling financial interest or do not have sufficient equity at risk for the entity to finance its activities withoutadditional subordinated financial support from other parties. FIN 46 is effective for all new variable interest entities cre-ated or acquired after January 31, 2003. For variable interest entities created or acquired prior to February 1, 2003, theprovisions of FIN 46 must be applied for the first interim or annual period beginning after December 15, 2003. TheCompany does not expect that the adoption of this standard will have a material effect on its financial position or resultsof operations.
In April 2003, the FASB issued Statement of Financial Accounting Standard No. 149 (“SFAS 149”), “Amendmentof Statement 133 on Derivative Instruments and Hedging Activities.” SFAS 149 amends and clarifies accounting forderivative instruments, including certain derivative instruments embedded in other contracts, and for hedging activitiesunder SFAS 133. The statement requires that contracts with comparable characteristics be accounted for similarly andclarifies when a derivative contains a financing component that warrants special reporting in the statement of cashflows. SFAS 149 is effective for contracts entered into or modified after June 30, 2003, except in certain circumstances,and for hedging relationships designated after June 30, 2003. The Company does not expect that the adoption of thisstandard will have a material effect on its financial position or results of operations.
In May 2003, the FASB issued Statement of Financial Accounting Standard No. 150 (“SFAS 150”), “Accounting forCertain Financial Instruments with Characteristics of both Liabilities and Equity.” This Statement establishes standardsfor how an issuer classifies and measures in its statement of financial position certain financial instruments with charac-teristics of both liabilities and equity. It requires that an issuer classify a financial instrument that is within its scope asa liability (or an asset in some circumstances) because that financial instrument embodies an obligation of the issuer.This Statement is effective for financial instruments entered into or modified after May 31, 2003, and otherwise iseffective at the beginning of the first interim period beginning after June 15, 2003, except for mandatory redeemablefinancial instruments of nonpublic entities. The FASB has defined implementation of SFAS 150 indefinitely for certainnon-controlling interests, the provisions of which are currently not applicable to the Company. The Company does notexpect that the adoption of this standard will have a material effect on its financial position or results of operations.
ReclassificationCertain prior year amounts have been reclassified to conform to current year consolidated financial statement presentation.
(2) Business CombinationsIn fiscal 2003, the Company acquired Akara and WaveSmith. In fiscal 2002, and 2001, the Company acquired ONI andCyras, respectively. As a result of these acquisitions, the Company, has recorded charges for in-process research anddevelopment and recorded intangible assets related to existing technology.
In-process research and development represents in-process technology that, as of the date of the acquisition, hasnot reached technological feasibility and has no alternative future use. Based on valuation assessments, the value ofthese projects is determined by estimating the resulting net cash flows from the sale of the products resulting from thecompletion of the projects, reduced by the portion of the revenue attributable to developed technology and the percent-age of completion of the project. The resulting cash flows are then discounted back to their present values at appropri-ate discount rates.
Existing technology represents purchased technology for which development had been completed as of the date ofacquisition. This amount is determined using the income approach. This method consisted of estimating future net cashflows attributable to existing technology for a discrete projection period and discounting the net cash flows to their pres-ent value. The existing technology will be amortized its useful life.
The purchase price for the Company’s acquisitions have been based on the average closing price of CIENA’scommon stock for two trading days prior to, the date of, and the two trading days after the announcement of the acquisition.
CIENA Corporation 10-K / 45

The following table summarizes the estimated fair values of the assets acquired and liabilities assumed at the dateof the acquisitions (in thousands):
Akara at WaveSmith ONI at Cyras at August 29, at June 16, June 21, March 29,
2003 2003 2002 2001Cash, cash equivalents, long and short-term investments $ 1,232 $ 4,159 $ 623,559 $ 68,891
Inventory 909 983 14,705 4,618
Equipment, furniture and fixtures 282 793 40,759 4,597
Other tangible assets 1,542 472 25,847 47,591
Existing technology 9,300 54,300 13,000 47,700
Non-compete agreements 3,100 — 1,000 11,600
Contracts and purchase orders 2,100 5,400 1,100 —
Goodwill 34,275 89,264 590,895 2,059,899
Deferred stock compensation — 7,385 8,826 98,456
Other assumed liabilities (2,658) (2,405) (43,336) (35,914)
CIENA initial investment — (5,000) — —
Unfavorable lease commitments (541) — (80,183) —
Promissory notes and loans (6,099) — — —
Convertible subordinated notes payable — — (218,013) (167,700)
In-process research and development 1,300 1,500 — 45,900
Total purchase price $44,742 $156,851 $ 978,159 $2,185,638
Akara CorporationOn August 29, 2003, CIENA completed the acquisition by merger of Akara Corporation, a privately held corporationheadquartered in Ottawa, Ontario that provides SONET/SDH based storage extension devices for storage area net-works. Pursuant to the terms of the acquisition agreement, Akara became a wholly owned subsidiary of CIENA, andthe outstanding shares of Akara common and preferred stock were exchanged for $30.6 million in cash and approxi-mately 2,343,015 shares of CIENA common stock. The aggregate purchase price was $44.7 million, which includedCIENA common stock valued at $13.8 million, and transaction costs of $0.3 million.
The $2.1 million assigned to the contracts and purchase orders will be amortized over five years. The $6.1 millionassigned to the value of the promissory notes and loans was based upon the present value of the notes at the time ofthe acquisition. CIENA paid $3.1 million of these obligations in full during the fourth quarter of fiscal 2003, and theremaining $3.0 million payable to CIENA was eliminated during the consolidation.
The amount of goodwill allocated to the purchase price was $34.3 million and is not deductible for tax purposes. TheCompany operates in one operating segment and reports only certain enterprise-wide disclosures. Accordingly, the good-will from this transaction is not part of a reportable segment. The operations of Akara are not material to the consolidatedfinancial statements of the Company and, accordingly, separate pro forma financial information has not been presented.
WaveSmith NetworksOn June 16, 2003, CIENA completed the acquisition by merger of WaveSmith, a privately held corporation headquar-tered in Acton, Massachusetts that is a leading innovator of multiservice switching equipment. Pursuant to the termsof the acquisition agreement, WaveSmith merged into CIENA, and the outstanding shares of WaveSmith commonand preferred stock were exchanged for approximately 33,421,217 shares of CIENA common stock. The aggregatepurchase price was $156.8 million, which included CIENA common stock valued at $142.7 million, CIENA options,warrants and restricted stock valued at $7.9 million, transaction costs of $1.2 million and an initial CIENA investmentof $5.0 million.
The $5.4 million assigned to the contracts and purchase orders will be amortized over a range of two months tofive years.
46 / CIENA Corporation 10-K

The amount of goodwill allocated to the purchase price was $89.3 million and is not deductible for tax purposes.The Company operates in one operating segment and reports only certain enterprise-wide disclosures. Accordingly, thegoodwill from this transaction is not part of a reportable segment. The operations of WaveSmith are not material to theconsolidated financial statements of the Company and, accordingly, separate pro forma financial information has notbeen presented.
ONI SystemsOn June 21, 2002, CIENA completed the acquisition by merger of ONI Systems Corp. (“ONI”), a NASDAQ-listed corpo-ration headquartered in San Jose, California. ONI is a provider of optical networking equipment specifically designed toaddress bandwidth and service limitations of regional and metropolitan networks. Under the terms of the agreement,each outstanding share of capital stock of ONI was exchanged for 0.7104 shares of CIENA common stock, and CIENAassumed all ONI outstanding options and warrants as well as the ONI outstanding convertible debt. The stockholdersof ONI received 101,120,724 shares of CIENA common stock of which 1,039,429 shares are restricted and subject to repurchase.
Additionally, CIENA converted options and warrants to purchase approximately 18,193,345 ONI shares into optionsand warrants to purchase 12,924,552 shares of CIENA common stock. The aggregate purchase price was $978.2 mil-lion, including CIENA common stock valued at $875.7 million, CIENA options, warrants and restricted stock valued at$89.2 million and transaction costs of $13.3 million.
The $2.1 million assigned to the other intangible assets, non-compete agreements and contracts, will be amortizedover a range of two months to one year.
During the quarter ended July 31, 2002, CIENA and ONI reduced their combined workforce by approximately283 employees. Approximately $3.8 million of costs associated with the ONI workforce reduction qualify for treatmentunder EITF 95-3 “Recognition of Liabilities in Connection with a Purchase Combination” and were recorded as an ele-ment of the acquisition.
The $80.2 million assigned to the value of the unfavorable lease commitments was based upon the present valueof the assumed lease obligations based upon current rental rates at the time of the acquisition. These unfavorable leasecommitments will be paid over the respective lease terms through fiscal 2011. The $218.0 million assigned to the valueof the ONI $300.0 million principal amount of 5.0% convertible subordinated notes due October 15, 2005 was basedupon the present value of the notes at the time of the acquisition. CIENA is accreting the difference between the pres-ent value of the notes and the outstanding principal value over the remaining period to October 15, 2005, such that thecarrying value of the notes equals the principal value at the time the notes become due.
The amount of goodwill allocated to the purchase price was $590.9 million and is not deductible for tax purposes.The Company operates in one operating segment and reports only certain enterprise-wide disclosures. Accordingly, thegoodwill from this transaction is not part of a reportable segment.
The following unaudited pro forma data summarizes the results of operations for the period indicated as if the ONIacquisition had been completed as of the beginning of the periods presented. The unaudited pro forma data gives effectto actual operating results prior to the June 21, 2002 acquisition, adjusted to include the pro forma effect of amortiza-tion of intangibles, deferred stock compensation costs, and the tax effects to the pro forma adjustments. These proforma amounts do not purport to be indicative of the results that would have actually been obtained if the acquisitionoccurred as of the beginning of the periods presented or that may be obtained in the future (in thousands, except pershare data).
Year Ended October 31,2001 2002
Revenue $ 1,798,909 $ 431,495
Net loss $(2,157,621) $(1,702,866)
Diluted net loss per common share
and dilutive potential common share $ (5.14) $ (3.93)
CIENA Corporation 10-K / 47

CyrasOn March 29, 2001, CIENA acquired all of the outstanding capital stock, and assumed the options of Cyras Systems,Inc. (“Cyras”), a privately held provider of next-generation optical networking systems based in Fremont, California. Thepurchase price was approximately $2.2 billion and consisted of the issuance of approximately 26.1 million shares ofCIENA common stock, the assumption of stock options of approximately 1.9 million shares and the indirect assumptionof $150 million principal amount of Cyras’ convertible subordinated indebtedness.
The amortization period for the goodwill and intangibles, based on management’s estimate of the useful life of theacquired technology, was three to seven years. As a result of the issuance of SFAS 142, amortization related to good-will will no longer be recorded in subsequent fiscal years.
The following unaudited pro forma data summarizes the results of operations for the period indicated as if the Cyrasacquisition had been completed as of the beginning of the periods presented. The unaudited pro forma data gives effectto actual operating results prior to the acquisition, adjusted to include the pro forma effect of amortization of intangibles,deferred stock compensation costs, the elimination of the charge for acquired in-process research and development, thetax effects to the pro forma adjustments and the recognition of the tax benefits arising from Cyras’ net operating losscarry forwards. These pro forma amounts do not purport to be indicative of the results that would have actually beenobtained if the acquisition occurred as of the beginning of the periods presented or that may be obtained in the future(in thousands, except per share data).
Year Ended October 31,2000 2001
Revenue $ 858,750 $ 1,603,229
Net loss $(274,330) $(1,890,627)
Diluted net loss per common share
and dilutive potential common share $ (0.90) $ (6.06)
48 / CIENA Corporation 10-K

(3) Restructuring Costs and Impairment ChargesRestructuringThe following table displays the activity and balances of the restructuring reserve account for the year ended October 31,2003 (in thousands):
Liabilities RecordedConsolidation in Connection
Workforce of Excess with Purchase Reduction Facilities Combination Total
Balance at October 31, 2001 $ — $ 15,439(a) $ — $ 15,439
Additional reserve recorded 32,929(b) 192,500(b) 3,792(c) 229,221
Non-cash charges (893) (113,596) — (114,489)
Cash payments (26,837) (6,498) (3,671) (37,006)
Balance at October 31, 2002 5,199 87,845 121 93,165
Additional reserve recorded 12,240(d) 19,748(d) 430(e) 32,418
Adjustment to previous estimates (523)(d) (310)(d) — (833)
Non-cash charges (1,913) (28,485) — (30,398)
Cash payments (12,154) (15,105) (551) (27,810)
Balance at October 31, 2003 $ 2,849 $ 63,693 $ — $ 66,542
Current restructuring liabilities $ 2,849 $ 11,529 $ — $ 14,378
Non-current restructuring liabilities $ — $ 52,164 $ — $ 52,164
(a) During the fourth quarter of fiscal year 2001, CIENA recorded a restructuring charge of $15.4 million relating to consolidation of excess facilities. Theconsolidation of excess facilities included the closure of certain manufacturing warehouse facilities and the consolidation of certain operational cen-ters related to business activities that were restructured. The charge included $7.0 million primarily related to lease terminations and non-cancelablelease costs and also included an $8.4 million write-down related to property and equipment consisting primarily of leasehold improvements and pro-duction equipment.
(b) During the first quarter of fiscal 2002, CIENA had a workforce reduction of approximately 380 employees concentrated in manufacturing operationsstaff. CIENA recorded a restructuring charge of $6.8 million associated with this action.
During the second quarter of fiscal 2002, CIENA had a workforce reduction of approximately 400 employees largely concentrated in manufacturingoperations and research and development activities associated with the closure of CIENA’s Marlborough, Massachusetts research and developmentfacility. On March 26, 2002, CIENA had a company-wide workforce reduction of approximately 650 employees. CIENA recorded a restructuring chargeof $121.4 million associated with the workforce reductions, lease terminations, non-cancelable lease costs and the write-down of certain property,equipment and leasehold improvements associated with this action.
As a result of the CIENA and ONI Systems Corp. integration and restructuring activities, CIENA recorded a charge of $11.0 million during the third quar-ter of fiscal 2002 associated with workforce reductions of approximately 66 employees, lease terminations, non-cancelable lease costs and the write-down of certain property, equipment and leasehold improvements. Also during the third quarter of fiscal 2002, CIENA recorded an additionalrestructuring charge of approximately $7.6 million to increase the estimated cost of the net lease expense for previously restructured facilities.
During the fourth quarter of fiscal 2002, CIENA had a company-wide workforce reduction of approximately 450 employees. CIENA recorded a restruc-turing charge of $78.7 million associated with the workforce reductions, lease terminations, non-cancelable lease costs and the write-down of certainproperty, equipment and leasehold improvements associated with this action.
(c) During the third quarter of fiscal 2002, CIENA and ONI Systems Corp. reduced their combined workforce by approximately 283 employees.Approximately $3.8 million of costs associated with the ONI workforce reduction qualify for treatment under EITF 95-3 “Recognition of Liabilities inConnection with a Purchase Combination” and were recorded as an element of the acquisition.
(d) During the second quarter of fiscal 2003, CIENA reduced its workforce by approximately 75 employees. CIENA recorded a restructuring charge of$2.7 million associated with the workforce reduction.
During the third quarter of fiscal 2003, CIENA recorded a restructuring charge of $15.5 million associated with a workforce reduction of approximately84 employees, lease terminations, non-cancelable lease costs and the write-down of certain property, equipment and leasehold improvements.
During the fourth quarter of fiscal 2003, CIENA recorded a restructuring charge of $12.9 million associated with a workforce reduction of approximately231 employees, lease termination, non-cancelable lease costs and the write-down of certain property, equipment and leasehold improvements.
(e) During the third quarter of fiscal 2003, CIENA and WaveSmith reduced their combined workforce by 8 employees. Approximately $0.4 million of costassociated with the WaveSmith workforce reduction qualify for treatment under EITF 95-3 “Recognition of Liabilities in Connection with a PurchaseCombination” and were recorded as an element of the acquisition.
CIENA Corporation 10-K / 49

Goodwill Impairment ChargesThe Company adopted SFAS 142 effective November 1, 2001 and upon adoption ceased to amortize goodwill. On adop-tion of SFAS 142, the Company determined that its operations represent a single reporting unit. The Company completedan impairment review of the goodwill associated with its reporting unit during the three months ended January 31, 2002.The Company compared the fair value of its reporting unit at November 1, 2001 to the carrying value including goodwillfor the unit at November 1, 2001, and determined that the carrying value, including goodwill, did not exceed the unit’sfair value. As a result, no impairment charge was required on adoption.
In accordance with SFAS 142, which requires annual testing to determine and measure goodwill impairment on areporting unit basis, and with the assistance from independent valuation experts management performed an assess-ment of the fair value of the Company’s single reporting unit and its intangible assets as of September 30, 2003 and2002, respectively. The Company compared its fair value to its carrying value including goodwill and determined that itscarrying value, including goodwill, did not exceed fair value as of September 30, 2003 but did exceed fair value as ofSeptember 30, 2002. As a result, during fiscal 2002 the Company assessed the fair value of its assets, including identi-fied intangible assets, and liabilities and derived an implied fair value for its goodwill. Since the carrying amount of good-will was greater than its implied fair value, an impairment loss of $557.3 million was recognized in fiscal 2002.
During fiscal 2003 the fair value of the Company was determined using the average market price of the Company’s com-mon stock over a 10-day period before and after September 27, 2003 and a control premium of 25%. During fiscal 2002 fairvalue of the Company was determined using the average market price of the Company’s common stock over a 10-day periodbefore and after September 27, 2002 and a control premium of 25%. The Company determined the estimated fair value ofidentified intangible assets and non-goodwill intangible assets and liabilities using discounted cash flows. The cash flow peri-ods used were eight years, applying annual growth rates of 10% to 86%. The Company used discount rates of 10% to 32%based of the specific risks and circumstances associated with the identified intangible asset or other non-goodwill assets orliability being evaluated. The assumptions supporting the estimated cash flows for identified intangible assets and other non-goodwill assets and liabilities, including the discount rate, reflects management’s estimates. The discount rate was basedupon the Company’s weighted average cost of capital as adjusted for the risks associated with its operations.
The changes in the carrying amount of goodwill for fiscal 2002 and 2003 are as follows (in thousands):
Balance as of November 1, 2002 $ 178,891
Goodwill acquired during fiscal 2002 590,895
Impairment losses (557,286)
Balance as of October 31, 2002 212,500
Goodwill acquired during fiscal 2003 123,539
Balance as of October 31, 2003 $ 336,039
As part of CIENA’s review of financial results for fiscal 2001, CIENA performed an assessment of the carrying value of theCompany’s long-lived assets including significant amounts of goodwill and other intangible assets recorded in connection withthe acquisition of Cyras. The assessment was performed pursuant to SFAS 121 because of the significant negative industryand economic trends affecting both the Company’s current operations and expected future sales of MetroDirector K2 as wellas the general decline of technology valuations. The conclusion of that assessment was that the decline in market conditionswithin the Company’s industry was significant and other than temporary. As a result, the Company recorded a charge of$1.7 billion to reduce goodwill during the fourth quarter of 2001 based on the amount by which the carrying amount of theseassets exceeded their fair value. The write down is related to the goodwill associated with the Cyras transaction. Fair value wasdetermined based on discounted future cash flows for the operating entity, which had separately identifiable cash flows. Thecash flow periods used were six years, applying annual growth rates of 25% to 100%. The discount rate used was 11.3%, andthe terminal value was estimated based upon terminal growth rates of 4%. The assumptions supporting the estimatedfuture cash flows, including the discount rate and estimated terminal values reflect management’s best estimates. The discountrate was based upon the Company’s weighted average cost of capital as adjusted for the risks associated with its operations.
50 / CIENA Corporation 10-K
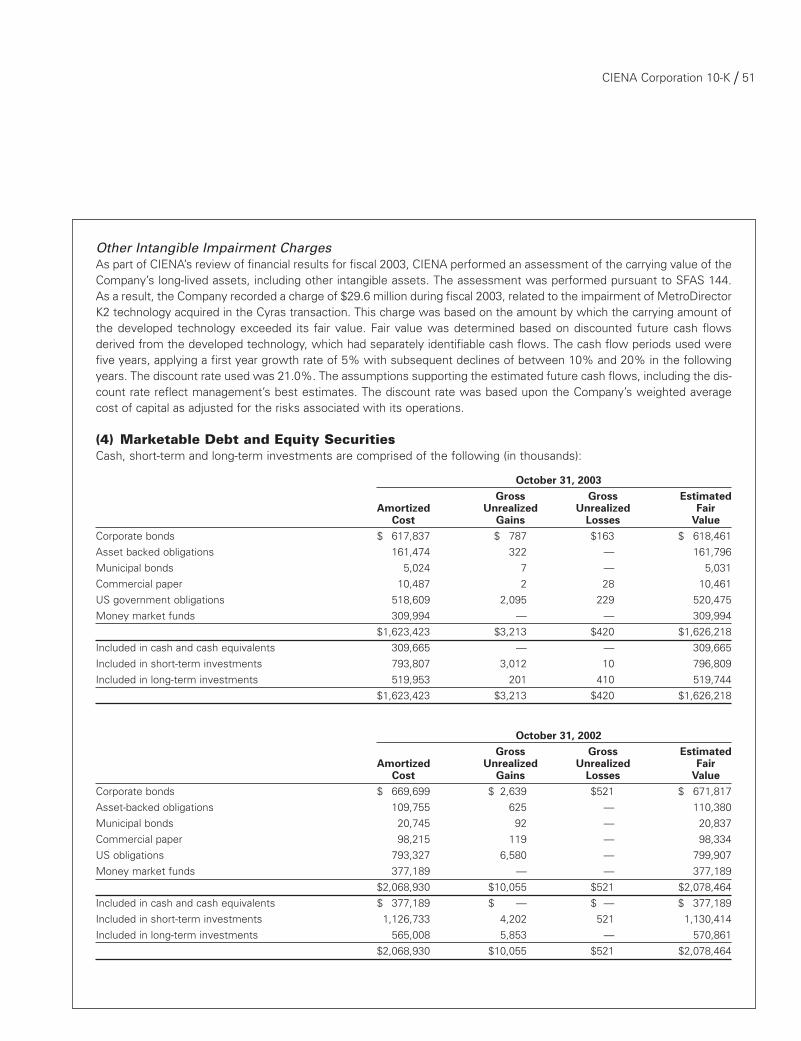
Other Intangible Impairment ChargesAs part of CIENA’s review of financial results for fiscal 2003, CIENA performed an assessment of the carrying value of theCompany’s long-lived assets, including other intangible assets. The assessment was performed pursuant to SFAS 144.As a result, the Company recorded a charge of $29.6 million during fiscal 2003, related to the impairment of MetroDirectorK2 technology acquired in the Cyras transaction. This charge was based on the amount by which the carrying amount ofthe developed technology exceeded its fair value. Fair value was determined based on discounted future cash flowsderived from the developed technology, which had separately identifiable cash flows. The cash flow periods used werefive years, applying a first year growth rate of 5% with subsequent declines of between 10% and 20% in the followingyears. The discount rate used was 21.0%. The assumptions supporting the estimated future cash flows, including the dis-count rate reflect management’s best estimates. The discount rate was based upon the Company’s weighted averagecost of capital as adjusted for the risks associated with its operations.
(4) Marketable Debt and Equity SecuritiesCash, short-term and long-term investments are comprised of the following (in thousands):
October 31, 2003Gross Gross Estimated
Amortized Unrealized Unrealized FairCost Gains Losses Value
Corporate bonds $ 617,837 $ 787 $163 $ 618,461
Asset backed obligations 161,474 322 — 161,796
Municipal bonds 5,024 7 — 5,031
Commercial paper 10,487 2 28 10,461
US government obligations 518,609 2,095 229 520,475
Money market funds 309,994 — — 309,994
$1,623,423 $3,213 $420 $1,626,218
Included in cash and cash equivalents 309,665 — — 309,665
Included in short-term investments 793,807 3,012 10 796,809
Included in long-term investments 519,953 201 410 519,744
$1,623,423 $3,213 $420 $1,626,218
October 31, 2002Gross Gross Estimated
Amortized Unrealized Unrealized FairCost Gains Losses Value
Corporate bonds $ 669,699 $ 2,639 $521 $ 671,817
Asset-backed obligations 109,755 625 — 110,380
Municipal bonds 20,745 92 — 20,837
Commercial paper 98,215 119 — 98,334
US obligations 793,327 6,580 — 799,907
Money market funds 377,189 — — 377,189
$2,068,930 $10,055 $521 $2,078,464
Included in cash and cash equivalents $ 377,189 $ — $ — $ 377,189
Included in short-term investments 1,126,733 4,202 521 1,130,414
Included in long-term investments 565,008 5,853 — 570,861
$2,068,930 $10,055 $521 $2,078,464
CIENA Corporation 10-K / 51

The following table summarizes maturities of debt investments (including restricted investments) at October 31,2003 (in thousands):
Amortized EstimatedCost Fair Value
Less than one year $ 793,807 $ 796,809
Due in 1–2 years 467,262 466,962
Due in 2–5 years 52,691 52,782
$1,313,760 $1,316,553
(5) Accounts ReceivableAs of October 31, 2003, the trade accounts receivable, net of allowance for doubtful accounts, included three customerswho each accounted for 23.6%, 12.5%, and 10.1% of the net trade accounts receivable, respectively. As of October 31,2002, the trade accounts receivable, net of allowance for doubtful accounts, included three customers who eachaccounted for 19.3%, 15.0%, and 12.8% of the net trade accounts receivable, respectively.
CIENA performs ongoing credit evaluations of its customers and generally has not required collateral or other formsof security from its customers. CIENA maintains an allowance for potential losses on a specific identification basis.CIENA’s allowance for doubtful accounts as of October 31, 2003 and October 31, 2002 was $1.5 million and $9.5 mil-lion, respectively. In fiscal 2001, CIENA received payment for approximately $15.4 million of the gross outstandingaccounts receivable balance due from iaxis Limited primarily through the Company’s sales agreement with Dynegy.Accordingly, CIENA recognized a reduction in the provision for doubtful accounts of $6.6 million during fiscal year 2001.CIENA recorded a provision for doubtful accounts of approximately $14.8 million during fiscal 2002. This provision relatesto the estimated losses of $18.1 million from three customers, each of whom filed for bankruptcy protection during fis-cal 2002, offset by a payment of $3.3 million of the gross outstanding accounts receivable balance due from iaxis Limitedthrough the Company’s sales agreement with Dynegy. CIENA did not record any additional provision for doubtfulaccounts during fiscal 2003.
The following table summarizes the activity in the Company’s allowance for doubtful accounts (in thousands):
Year Ended Balance at Balance at October 31 Beginning of Period Provisions Deductions End of Period
2001 $29,581 $ (6,579) $21,511 $1,491
2002 $ 1,491 $14,813 $ 6,831 $9,473
2003 $ 9,473 $ — $ 7,975 $1,498
(6) InventoriesInventories are comprised of the following (in thousands):
October 31,2002 2003
Raw materials $ 34,025 $ 16,121
Work-in-process 12,658 5,904
Finished goods 48,485 46,063
95,168 68,088
Reserve for excess and obsolescence (48,145) (23,093)
$ 47,023 $ 44,995
The Company writes down its inventory for estimated obsolescence or unmarketable inventory equal to the dif-ference between the cost of inventory and the estimated market value based on assumptions about future demandand market conditions. As a result of the decline in capital spending by the Company’s customers and a further decline
52 / CIENA Corporation 10-K

in forecasted revenue of existing products in fiscal 2002, the Company recorded a provision for excess inventory andpurchase commitments of $286.5 million, which included charges of $250.5 million for excess inventory and obsoles-cence and $36.0 million for excess inventory purchase commitments. During fiscal 2003, the Company recorded abenefit for excess inventory of $5.3 million, primarily related to the realization of sales from previously reservedexcess inventory.
The following table summarizes the activity in the Company’s reserve for excess and obsolete inventory (in thousands):
Year Ended Balance at Provisions Balance atOctober 31 Beginning of Period (Benefits) Deductions End of Period
2001 $18,238 $ 68,411 $ 32,845 $53,804
2002 $53,804 $250,457 $256,116 $48,145
2003 $48,145 $ (5,296) $ 19,756 $23,093
(7) Equipment, Furniture and FixturesEquipment, furniture and fixtures are comprised of the following (in thousands):
October 31,2002 2003
Equipment, furniture and fixtures $ 380,316 $ 332,843
Leasehold improvements 78,761 70,145
459,077 402,988
Accumulated depreciation and amortization (266,501) (288,170)
Construction-in-progress 4,375 112
$ 196,951 $ 114,930
(8) Other Intangible AssetsOther intangible assets are comprised of the following (in thousands):
2002 2003Gross Accumulated Net Gross Accumulated Net
Intangible Amortization Intangible Intangible Amortization IntangibleDeveloped technology $60,700 $(11,409) $49,291 $ 94,704 $(22,975) $ 71,729
Patents and licenses 14,155 (1,989) 12,166 36,655 (8,984) 27,671
Covenants not to compete,
outstanding purchase
orders and contracts 2,100 (1,100) 1,000 12,700 (3,692) 9,008
$76,955 $62,457 $144,059 $108,408
In January 2003, CIENA reached a settlement agreement with Nortel. Under the agreement, CIENA made a one-time payment of $25 million to Nortel, and Nortel granted CIENA a license under the patents in suit and certain relatedpatents. CIENA accounted for the $25.0 million liability by recording an expense of $2.5 million in first quarter 2003related to the settlement of the litigation, and recording the remaining $22.5 million as an intangible asset that will beamortized over eight years based upon the expected life of the patent rights acquired in the settlement.
As a result of the WaveSmith acquisition, we recorded $54.3 million in developed technology and $5.4 million inother intangibles related to contracts and outstanding purchase orders. As a result of the Akara acquisition, we recorded$9.3 million in developed technology and $5.2 million in other intangibles related to noncompete agreements and cus-tomer relationships.
As a result of the impairment of intangible assets, we recorded a charge against gross developed technology of$29.6 million.
CIENA Corporation 10-K / 53

The aggregate amortization expense of other intangible assets was $21.2 million, $9.0 million and $4.4 million for fis-cal 2003, 2002 and 2001, respectively. Expected future amortization of other intangible assets is as follows (in thousands):Year Ended October 31,2004 $ 17,452
2005 17,453
2006 17,452
2007 17,453
2008 16,107
Thereafter 22,491
$108,408
(9) Other Balance Sheet DetailsOther long-term assets (in thousands):
October 31,2002 2003
Maintenance spares inventory, net $27,170 $26,206
Deferred debt issuance costs 15,897 12,869
Investments in privately held companies 16,052 21,292
Other 11,477 9,274
$70,596 $69,641
Accrued liabilities (in thousands):October 31,
2002 2003Warranty and other contractual obligations $ 45,498 $37,380
Accrued compensation, payroll related tax and benefits 37,466 33,206
Accrued excess inventory purchase commitments 1,892 1,405
Accrued interest payable 6,981 6,583
Accrued Pirelli settlement 11,000 —
Other 29,751 20,352
$132,588 $98,926
The following table summarizes the activity in the Company’s accrued warranty and other contractual obligations (in thousands):
Year Ended Balance at Balance at October 31 Beginning of Period Provisions Settlements End of Period
2001 $27,605 $33,073 $(20,832) $39,846
2002 $39,846 $13,271 $ (7,619) $45,498
2003 $45,498 $ 9,301 $(17,419) $37,380
Deferred revenue (in thousands):October 31,
2002 2003Products $ 8,175 $ 4,772
Services 22,657 24,248
30,832 29,020
Less current portion (15,388) (14,473)
Long-term deferred revenue $ 15,444 $ 14,547
54 / CIENA Corporation 10-K

(10) Convertible Notes PayableOn February 9, 2001, CIENA completed a public offering of 3.75% convertible notes, in an aggregate principal amountof $690 million, due February 1, 2008. Interest is payable on February 1 and August 1 of each year beginning August 1,2001. The notes may be converted into shares of CIENA’s common stock at any time before their maturity or their priorredemption or repurchase by CIENA. The conversion rate is 9.5808 shares per each $1,000 principal amount of notes,subject to adjustment in certain circumstances. On or after the third business day after February 1, 2004, CIENA has theoption to redeem all or a portion of the notes that have not been previously converted at the following redemption prices(expressed as percentage of principle amount):
Redemption Period PriceBeginning on the third business day after
February 1, 2004 and ending on January 31, 2005 102.143%
Beginning on February 1, 2005 and ending on January 31, 2006 101.607%
Beginning on February 1, 2006 and ending on January 31, 2007 101.071%
Beginning on February 1, 2007 and ending on January 31, 2008 100.536%
On June 21, 2002, CIENA assumed the outstanding ONI 5.00% convertible subordinated notes, in an aggregateprincipal amount of $300 million, due October 15, 2005. Interest is payable on April 15 and October 15 of each year. TheONI convertible subordinated notes were initially recorded at a value of $218.0 million based upon the fair value of theoutstanding notes at the time of the acquisition.
During the fourth quarter fiscal 2002, CIENA purchased on the open market $97.1 million of the $300 million out-standing ONI convertible subordinated notes. The Company paid $75.2 million for notes with a cumulative accreted bookvalue of $72.5 million, which resulted in a loss on early extinguishment of debt of $2.7 million.
During the first quarter fiscal 2003, CIENA purchased $154.7 million of the remaining $202.9 million outstanding ONIconvertible subordinated notes pursuant to a tender offer. The Company paid $140.3 million related to the tender offerfor notes with a cumulative accreted book value of $119.7 million, which resulted in a loss on early extinguishment ofdebt of $20.6 million.
The remaining outstanding ONI convertible subordinated notes have a carrying value of $40.4 million and a facevalue of $48.3 million. CIENA is accreting the difference between the values over the remaining period to October 15,2005, such that the carrying value of the outstanding notes equals the principal value at the time the notes become due.Accretion of the principal was $8.2 million for the period of June 21, 2002 to October 31, 2002. Accretion of the princi-pal was $6.4 million for fiscal 2003.
The remaining ONI convertible subordinated notes may be converted into shares of CIENA’s common stock at anytime before their maturity. The conversion rate is 7.7525 shares per each $1,000 principal amount of notes, subject toadjustment in certain circumstances. On or after October 16, 2003, CIENA has the option to redeem all or a portion ofthe notes that have not been previously converted at the following redemption prices (expressed as percentage of prin-cipal amount):
Redemption Period PriceOctober 16, 2003 102%
October 15, 2004 101%
On November 18, 2003, CIENA announced a full redemption of all of the outstanding ONI 5.00% convertible sub-ordinated notes due October 15, 2005. See note 17.
CIENA Corporation 10-K / 55

(11) Earnings (Loss) Per Share CalculationBasic EPS is computed using the weighted average number of common shares outstanding. Diluted EPS is computedusing the weighted average number of common shares outstanding, stock options and warrants using the treasury stockmethod. Approximately 34.6 million, 41.5 million and 16.4 million options and restricted stock were outstanding duringfiscal 2003, 2002, and 2001 respectively, but were not included in the computation of diluted EPS as the effect wouldbe anti-dilutive.
(12) Stockholders’ EquityAuthorized SharesOn March 12, 2001, the shareholders of the Company approved an increase to the number of authorized shares of com-mon stock from 460 million to 980 million shares.
Stockholder Rights PlanIn December 1997, the Company’s Board of Directors adopted a Stockholder Rights Plan. This plan is designed to deterany potential coercive or unfair takeover tactics in the event of an unsolicited takeover attempt. It is not intended to pre-vent a takeover of the Company on terms that are favorable and fair to all shareholders and will not interfere with amerger approved by the Board of Directors. Each right entitles shareholders to buy a “unit” equal to one one-thousandthof a share of Preferred Stock of the Company. The rights will be exercisable only if a person or a group acquires orannounces a tender or exchange offer to acquire 15% or more of the Company’s common stock or if the Companyenters into certain other business combination transactions not approved by the Board of Directors.
In the event the rights become exercisable, the rights plan allows for CIENA shareholders to acquire stock of thesurviving corporation, whether or not CIENA is the surviving corporation, having a value twice that of the exercise priceof the rights. The rights were distributed to shareholders of record in January 1998. The rights will expire in December2007 and are redeemable for $0.001 per right at the approval of the Company’s Board of Directors.
Public OfferingsOn February 9, 2001, CIENA completed a public offering of 11,000,000 shares of common stock at a price of $83.50 pershare less underwriters’ discounts and commissions. Net proceeds from the public offering were approximately$878.5 million, after deducting underwriting discounts, commissions and offering expenses. Pending use of the netproceeds, the Company has invested them in interest bearing, investment grade securities.
Accumulated Comprehensive IncomeThe components of accumulated comprehensive income (loss) are as follows (in thousands):
October 31,2001 2002 2003
Net loss $(1,794,062) $(1,597,499) $(386,517)
Changes in net unrealized gains on investments 5,804 3,731 (6,743)
Change in accumulated translation adjustments (59) 267 350
Total comprehensive loss $(1,788,317) $(1,593,501) $(392,910)
56 / CIENA Corporation 10-K

(13) Income TaxesLoss before income taxes and the provision for income taxes consists of the following (in thousands):
October 31,2001 2002 2003
Loss before income taxes $(1,706,729) $(1,486,764) $(385,261)
Provision (benefit) for income taxes:
Current:
Federal 77,705 (16,168) —
State (500) — —
Foreign 133 989 1,256
Total current 77,338 (15,179) 1,256
Deferred:
Federal 9,595 116,802 —
State 400 9,112 —
Foreign — — —
Total deferred 9,995 125,914 1,256
Provision for income taxes $ 87,333 $ 110,735 $ 1,256
The tax provision reconciles to the amount computed by multiplying income before income taxes by the U.S. fed-eral statutory rate of 35% as follows:
October 31,2001 2002 2003
Provision at statutory rate 35.0% 35.0% 35.0%
Non-deductible purchased research and development (0.9) — (0.3)
Research and development credit 0.3 0.4 1.3
Foreign sales corporation benefit 0.2 — —
Non-deductible goodwill and other (39.7) (13.6) (1.6)
Valuation allowance — (29.2) (34.7)
(5.1)% (7.4)% (0.3)%
The significant components of deferred tax assets and liabilities were as follows (in thousands):October 31,
2002 2003Deferred tax assets:
Reserves and accrued liabilities $ 118,817 $ 84,530
Depreciation and amortization 15,715 1,371
NOL and credit carryforward 616,178 803,407
Convertible notes (18,068) (2,875)
Other 6,976 7,765
Gross deferred tax assets 739,618 894,198
Valuation allowance (739,618) (894,198)
Net deferred tax asset $ — $ —
Deferred tax liabilities: $ — $ —
Depreciation and other — —
Deferred long-term tax liabilities $ — $ —
CIENA Corporation 10-K / 57

During fiscal 2002, the Company established a valuation allowance against its deferred tax assets. The Companyintends to maintain a valuation allowance until sufficient positive evidence exists to support its reversal.
As of October 31, 2003, the Company had a $2.0 billion net operating loss carry forward and a $68.4 million incometax credit carry forward which begin to expire in fiscal year 2020 and 2012 respectively. The Company’s ability to use netoperating losses and credit carry forwards may be subject to limitations pursuant to the ownership change rules of theInternal Revenue Code Section 382.
The income tax provision does not reflect the tax savings resulting from deductions associated with the Company’sstock. The tax benefit on deductions of approximately $92.6 million associated with the Company’s stock will be cred-ited to additional paid-in capital when realized.
Approximately $184.1 million of the valuation allowance as of October 31, 2003 was attributable to deferred taxassets associated with the acquisitions of ONI, WaveSmith and Akara, that when realized, will first reduce goodwill, thenother non-current intangibles of the acquired companies, and then income tax expense.
The IRS is currently examining the Company’s federal income tax returns for fiscal 1999 through fiscal 2002.Management does not expect the outcome of these examinations to have a material effect on the Company’s consoli-dated financial position, results of operations or cash flow.
(14) Employee Benefit PlansActive Equity Incentive PlansThe Company maintains four active equity incentive plans under which it grants stock options, restricted stock, or otherforms of equity-based compensation: the 1999 Non-Officer Incentive Stock Plan (the “1999 Plan”); the Third Amendedand Restated 1994 Stock Option Plan (the “1994 Plan”); the 1996 Outside Directors Stock Option Plan (the “1996 Plan”);and the CIENA Corporation 2000 Equity Incentive Plan (the “2000 Plan”).
The 1999 Plan authorizes the issuance of non-qualified options to employees of the Company who are not execu-tive officers or directors. The exercise price for each option is established by the Board of Directors at not less than 85%of fair market value of the Common Stock at the time of grant. Options issued under the plan vest over four years. Asof October 31, 2003, there were 57,175,278 shares in the plan.
The 1994 Plan authorizes the issuance of either qualified or non-qualified options to directors, employees or consult-ants. In general, the Company uses the 1994 Plan to grant options to executive officers. The exercise price for optionsunder the plan is established by the Board of Directors at not less than the fair market value of the Common Stock atthe time of grant. The Board determines the terms of vesting of options issued under the plan. The Company’s currentpractice is for options to vest over a four-year period. As of October 31, 2003, there were 55,354,872 shares in the plan.Under the terms of the plan, this number will increase by 0.75% of the number of issued and outstanding shares of thecommon stock on the last day of fiscal 2004.
The 1996 Plan provides for the issuance of non-qualified options to non-employee directors of the Company. Theplan provides automatic grants of (i) an initial option at the time of a director’s election to the Board and (ii) annual optionson the day following the Company’s annual meeting of shareholders. The exercise price is equal to the fair market valueof the stock at the time of grant. Initial options vest over three years, and annual options vest after one year. As ofOctober 31, 2003, there were 1,500,000 shares in the plan.
The 2000 Plan was assumed by the Company as a result of its merger with ONI. It authorizes the issuance of stockoptions, restricted stock, and stock bonuses to employees, officers, directors, consultants, independent contractors andadvisors. The terms of awards under the plan are established by the Board of Directors or its Compensation Committee.The exercise price of options may not be less than 85% of the fair market value of the stock at the date of grant (100%of the fair market value for qualified options). The Board of Directors (or the Compensation Committee) has broad dis-cretion to establish the terms and conditions for grants of restricted stock and stock bonuses. As of October 31, 2003,there were 45,211,839 shares in the plan. Under the terms of the plan, this number will increase by 5.0% of the num-ber of issued and outstanding shares of the company each January 1st, unless the Compensation Committee reducesthe amount of the increase in any year. By action of the Compensation Committee, the amount of the increase on
58 / CIENA Corporation 10-K

January 1, 2004 will be only 2.0% of the issued and outstanding shares of the Company. In addition, any shares subjectto options or other awards under the ONI 1997 Stock Plan, ONI 1998 Equity Incentive Plan, or ONI 1999 Equity IncentivePlan that are forfeited upon cancellation of the option or award are available for grant and issuance under the 2000 Plan.
Other Equity Incentive PlansAs a result of its acquisitions of Lightera, Omnia, Cyras, ONI, WaveSmith and Akara, the Company has assumed obliga-tions under various equity incentive plans previously maintained by those companies, including the obligation to honorgrants made under these plans prior to the acquisitions. The Company will issue CIENA Common Stock upon the exer-cise of options outstanding under these plans, and restricted stock issued under these plans has been converted intorestricted shares of CIENA Common Stock. The Company does not intend to issue any further grants under these plans.
These inactive plans include:
• The WaveSmith 2000 Stock Option and Incentive Plan
• The ONI 1997 Stock Option Plan
• The ONI 1998 Equity Incentive Plan
• The ONI 1999 Equity Incentive Plan
• The Cyras 1998 Stock Plan
• The Omnia 1997 Stock Plan
• The Lightera 1998 Stock Plan
Stock Option ActivityThe following table is a summary of the Company’s stock option activity (shares in thousands):
Weighted Average Shares Exercise Price
Balance at October 31, 2000 30,721 $44.72
Granted and assumed 23,715 41.35
Exercised (3,987) 6.07
Canceled (3,517) 54.62
Balance at October 31, 2001 46,932 45.56
Granted and assumed 26,620 12.07
Exercised (2,118) 2.30
Canceled (28,959) 56.63
Balance as of October 31, 2002 42,475 19.20
Granted and assumed 22,382 4.83
Exercised (2,004) 1.75
Canceled (13,995) 30.17
Balance as of October 31, 2003 48,858 $10.10
At October 31, 2003, approximately 1.3 million shares of Common Stock subject to repurchase by the Company hadbeen issued upon the exercise of options and restricted stock purchase agreements, and 22.6 million of the total out-standing options were vested and not subject to repurchase by the Company upon exercise. As of October 31, 2003,approximately 83.3 million shares are available for issuance under these plans.
In May 2002, CIENA commenced a registered exchange offer pursuant to which it offered eligible employees theopportunity to exchange outstanding certain stock options for new options with an exercise price to be established inNovember 2002. The stock options included in the offer had an exercise price greater than $12.00 per share and wereoutstanding under the 1994 Plan, the 1999 Plan or the Cyras Systems, Inc. 1998 Plan (“the Cyras Plan”). New optionsexchanged for options issued under the 1994 Plan and the 1999 Plan were to be issued under the 1999 Plan, and the newoptions exchanged for options tendered under the Cyras Plan were to be issued under the Cyras Plan. Except for options
CIENA Corporation 10-K / 59

issued after October 16, 2001, the new options were to be exercisable for one half the number of shares covered by theold options tendered for exchange. With respect to options issued after October 16, 2001, the new options were to beexercised for the same number of shares as the old options tendered for exchange. Eligible employees tendered forexchange in the offer options to purchase a total of 15.1 million shares. On November 19, 2002, CIENA completed theexchange offer and issued new options for approximately 6.4 million shares at an exercise price of $4.53 per share.
The following table summarizes information with respect to stock options outstanding at October 31, 2003 (sharesin thousands):
Vested Options Not SubjectOptions Outstanding to Repurchase upon Exercise
Weighted Average Weighted Weighted Number Remaining Average Average
Outstanding Contractual Exercise Number Exercise Range of Exercise Price at Oct. 31, 2003 Life (Years) Price at Oct. 31, 2003 Price$ 0.01–$ 3.92 5,101 4.30 $ 1.01 4,817 $ 0.97
$ 3.93–$ 4.50 3,924 8.75 4.30 1,173 4.30
$ 4.51–$ 4.53 12,754 9.05 4.53 1,734 4.53
$ 4.54–$ 6.97 9,038 8.89 6.08 2,573 6.65
$ 6.98–$ 11.88 5,065 7.41 9.58 3,164 9.38
$11.89–$ 16.13 3,469 6.04 14.94 3,372 14.97
$16.14–$ 19.88 7,267 7.86 16.55 3,970 16.59
$19.88–$149.50 2,240 6.88 61.54 1,782 60.09
$ 0.01–$149.50 48,858 7.84 $10.10 22,585 $12.74
Employee Stock Purchase PlanIn March 1998, the shareholders approved the Corporation’s 1998 Employee Stock Purchase Plan (“1998 ESPP”) underwhich 5.0 million shares of common stock had been reserved for issuance. Eligible employees may purchase a limitednumber of shares of the Company’s stock at 85% of the market value at certain plan-defined dates. Approximately1,339,000, 1,927,000 and 424,000 shares of common stock have been issued for $4.7 million, $10.0 million, and$7.8 million during fiscal 2003, 2002 and 2001, respectively. In March 2003 the 1998 ESPP terminated by its own termsdue to the issuance all remaining shares of the Company’s common stock available for issuance under this plan.
In March 2003, the shareholders approved the Corporation’s 2003 Employee Stock Purchase plan (“2003 ESPP”)under which 20.0 million shares of common stock had been reserved for issuance. Eligible employees may purchase alimited number of shares of the Company’s stock at 85% of the market value at certain plan-defined dates.Approximately 1,487,000 shares of common stock have been issued for $6.2 million during fiscal 2003. As of October 31,2003 approximately 18.5 million shares are available for issuance under this plan.
60 / CIENA Corporation 10-K

Pro Forma Stock-Based CompensationHad compensation cost for the Company’s stock option plans and employee stock purchase plan been determined basedon the fair value at the grant date for awards in fiscal years 2003, 2002 and 2001 consistent with the provisions of SFAS123 as amended by SFAS 148, the Company’s net loss and net loss per share for fiscal 2003 and 2001 would haveincreased and the Company’s net loss and net loss per share for fiscal 2002 would have decreased to the pro formaamounts indicated below (in thousands, except per share):
The below pro forma disclosures are not necessarily representative of the effects on reported net income or lossfor future years.
The weighted average fair value of each option granted under the various stock option plans for 2001, 2002 and2003 is $27.92, $4.88 and $3.32 respectively. The fair value of each option grant is estimated on the date of grant usingthe Black-Scholes Option Pricing Model with the following weighted average assumptions for fiscal years 2001, 2002and 2003:
Employee Stock Option Plans Employee Stock Purchase Plan October 31, October 31,
2001 2002 2003 2001 2002 2003Expected volatility 131% 92% 71% 131% 92% 71%
Risk-free interest rate 3.6% 2.6% 3.2% 3.6% 1.3% 1.3%
Expected life (years) 2.6 4.5 4.5 0.5 0.5 0.5
Expected dividend yield 0.0% 0.0% 0.0% 0.0% 0.0% 0.0%
October 31,2001 2002 2003
Net loss applicable to common stockholders as reported $(1,794,062) $(1,597,499) $(386,517)
Compensation (expense) benefit, net of tax (324,660) 40,068 (22,776)
Net loss applicable to common stockholders pro forma $(2,118,722) $(1,557,431) $(409,293)
Basic and diluted net loss per share—as reported $ (5.75) $ (4.37) $ (0.87)
Basic and diluted net loss per share—pro forma $ (6.79) $ (4.26) $ (0.92)
The Black-Scholes option-pricing model was developed for use in estimating the fair value of traded options thathave no vesting restrictions and are fully transferable. In addition, option-pricing models require the input of highly sub-jective assumptions including the expected stock price volatility. The Company uses projected volatility rates, which arebased upon historical volatility rates, trended into future years. Because the Company’s employee stock options havecharacteristics significantly different from those of traded options, and because changes in the subjective input assump-tions can materially affect the fair value estimate, in management’s opinion, existing models, including the Black-Scholesoption-pricing model, do not necessarily provide a reliable single measure of the fair value of the Company’s options.
Employee 401(k) PlanThe Company has a 401(k) defined contribution profit sharing plan. The plan covers all full-time employees who are notcovered by a collective bargaining agreement where retirement benefits are subject to good faith bargaining. Participantsmay contribute up to 60% of pre-tax compensation, subject to certain limitations. The Company may make discretionaryannual profit sharing contributions of up to the lesser of $30,000 or 25% of each participant’s compensation. TheCompany has made no profit sharing contributions to date. The plan also includes an employer matching contributionequal to 50% of the first 3% of participating employee contributions each pay period. During fiscal 2003, 2002, and 2001the Company made matching contributions of approximately $2.0 million, $4.1 million and $3.7 million respectively.
CIENA Corporation 10-K / 61

(15) Commitments and ContingenciesOperating Lease CommitmentsThe Company has certain minimum obligations under non-cancelable operating leases expiring on various dates through2019 for equipment and facilities. Future annual minimum rental commitments under non-cancelable operating leasesat October 31, 2003 are as follows (in thousands):
Year Ended October 31,2004 $ 37,810
2005 36,902
2006 35,226
2007 28,982
2008 27,089
Thereafter 84,996
$251,005
Rental expense for fiscal 2003, 2002, and 2001 was approximately $16.6 million, $24.7 million and $19.5 million,respectively. In addition the Company paid approximately $22.7, $7.2 and $0.0 million during fiscal 2003, 2002 and 2001,respectively, related to rent costs for restructured facilities and unfavorable lease commitments, which was offsetagainst the Company’s restructuring liabilities and unfavorable lease obligations, respectively.
Purchase Commitments with Contract Manufacturers and SuppliersThe Company relies on a small number of contract manufacturers to perform the majority of the manufacturing opera-tions for its products. In order to reduce lead times and ensure adequate component supply, the Company enters intoagreements with these suppliers that allow them to procure inventory for the Company’s forecasted future demands.As of October 31, 2003, the Company has purchase commitments of $33.3 million.
LitigationOn October 3, 2000, Stanford University and Litton Systems filed a complaint in the United States District Court for theCentral District of California alleging that optical fiber amplifiers incorporated into CIENA’s products infringe U.S. PatentNo. 4,859,016 (the “016 Patent”). The complaint seeks injunctive relief, royalties and damages. We believe that wehave valid defenses to the lawsuit and intend to defend it vigorously. On October 10, 2003, the court stayed the casepending final resolution of matters before the U.S. Patent and Trademark Office (the “PTO”), including a request for anddisposition of a reexamination of the 016 Patent. On October 16, 2003, the PTO granted reexamination of the 016Patent, thus resulting in a continuation of the stay of the case.
On July 19, 2000, CIENA and CIENA Properties, Inc., a wholly owned subsidiary of CIENA, filed a complaint in theUnited States District Court for the District of Delaware requesting damages and injunctive relief against CorvisCorporation (“Corvis”). The suit charged Corvis with infringing four patents relating to CIENA’s optical networking com-munication systems and technology. A jury trial to determine whether Corvis is infringing these patents commenced onFebruary 10, 2003. On February 24, 2003, the jury decided that Corvis was infringing one of the patents and not infring-ing two others. The jury was deadlocked with respect to infringement on the fourth patent. This trial was immediatelyfollowed by a trial on Corvis’ affirmative defenses based on the validity of two of the patents. On February 28, 2003, thejury in this trial determined that the patents were valid. In April 2003, following a third trial, another jury decided thatCorvis had infringed the fourth patent on which the previous jury had deadlocked. Based on these favorable verdicts col-lectively holding that Corvis is infringing two valid CIENA patents, CIENA has moved for an injunction to prohibit the saleby Corvis of the infringing products. The court has not yet ruled on this motion.
62 / CIENA Corporation 10-K

As a result of the merger with ONI, we became a defendant in a securities class action lawsuit. Beginning in August2001, a number of substantially identical class action complaints alleging violations of the federal securities laws were filedin the United States District Court for the Southern District of New York. These complaints name ONI, Hugh C. Martin,ONI’s former chairman, president and chief executive officer; Chris A. Davis, ONI’s former executive vice president, chieffinancial officer and administrative officer; and certain underwriters of ONI’s initial public offering as defendants. The com-plaints were consolidated into a single action, and a consolidated amended complaint was filed on April 24, 2002. Theamended complaint alleges, among other things, that the underwriter defendants violated the securities laws by failingto disclose alleged compensation arrangements (such as undisclosed commissions or stock stabilization practices) in theinitial public offering’s registration statement and by engaging in manipulative practices to artificially inflate the price ofour common stock after the initial public offering. The amended complaint also alleges that ONI and the named formerofficers violated the securities laws on the basis of an alleged failure to disclose the underwriters’ alleged compensationarrangements and manipulative practices. No specific amount of damages has been claimed. Similar complaints havebeen filed against more than 300 other issuers that have had initial public offerings since 1998, and all of these actionshave been included in a single coordinated proceeding. Mr. Martin and Ms. Davis have been dismissed from the actionwithout prejudice pursuant to a tolling agreement. In July 2002, ONI and other issuers in the consolidated cases filedmotions to dismiss the amended complaint for failure to state a claim, which was denied as to ONI on February 19, 2003.CIENA has participated, together with the other issuer defendants in these cases, in mediated settlement negotiationsthat have led to a preliminary agreement among the plaintiffs, the issuer defendants and their insurers. The settlement,which is subject to court approval, would result in the dismissal of the plaintiffs’ cases against the issuers. CIENA hasagreed in principle to the terms of this settlement. Draft settlement documents were circulated for preliminary reviewin October 2003.
As a result of the merger with ONI, we also became a defendant in two substantially identical purported classactions on behalf of ONI security holders originally brought against ONI and members of its board of directors. The com-plaints allege that the director defendants breached their fiduciary duties to ONI in approving the merger with CIENAand seek declaratory, injunctive and other relief permitted by equity. The plaintiffs failed to obtain an injunction againstcompletion of the merger. The first of these cases was filed on February 20, 2002, in the Superior Court of the Stateof California, County of San Mateo, and is encaptioned K.W. Sams, On Behalf of Himself and All Others SimilarlySituated v. ONI Systems Corporation, et al. The second case was brought on March 19, 2002, in the Superior Court ofthe State of California, County of Santa Clara, and is encaptioned Steven Myeary, On Behalf of Himself and All OthersSimilarly Situated v. ONI Systems Corporation. On April 14, 2003, the plaintiffs in these cases filed a consolidatedamended complaint and named four additional defendants: CIENA Corporation, James F. Jordan, Kleiner PerkinsCaufield & Byers and Mohr Davidow Ventures. CIENA and the other defendants subsequently filed a demurrer andserved a motion for sanctions on plaintiffs based on factual inaccuracies in the consolidated amended complaint. Inresponse, the plaintiffs filed a corrected consolidated amended complaint, the demurrer to which is scheduled to beheard by the court in December 2003. We believe that these lawsuits are without merit and will continue to defendthem vigorously.
(16) Segment ReportingIn June 1997, the Financial Accounting Standards Board issued Statement of Financial Accounting Standards No. 131(SFAS 131), “Disclosures about Segments of an Enterprise and Related Information.” SFAS 131 establishes annual andinterim reporting standards for operating segments of a company. It also requires entity-wide disclosures about the prod-ucts and services an entity provides, the material countries in which it holds assets and reports revenue, and its majorcustomers. The Company is not organized by multiple operating segments for the purpose of making operating deci-sions or assessing performance. Accordingly, the Company operates in one operating segment and reports only certainenterprise-wide disclosures.
CIENA Corporation 10-K / 63

CIENA’s geographic distributions of revenue are the following (in thousands):Fiscal Years
2001 % 2002 % 2003 %Domestic $1,220,742 76.1 $232,524 64.4 $178,564 63.1
International 382,487 23.9 128,631 35.6 104,572 36.9
Total $1,603,229 100.0 $361,155 100.0 $283,136 100.0
CIENA’s revenue derived from products and services are the following (in thousands):Fiscal Years
2001 % 2002 % 2003 %Products $1,518,833 94.7 $304,155 84.2 $240,772 85.0
Services 84,396 5.3 57,000 15.8 42,364 15.0
Total $1,603,229 100.0 $361,155 100.0 $283,136 100.0
Historically, CIENA has relied upon on a limited number of customers for a majority of the Company’s revenue.During the following fiscal years customers who each accounted for at least 10% of CIENA’s revenue during the respec-tive periods are as follows (in thousands):
Fiscal Years2001 %* 2002 %* 2003 %*
Sprint $463,078 28.9 $ 58,739 16.3 $ n/a —
Qwest 347,083 21.6 n/a — 31,148 11.0
AT&T n/a — 74,111 20.5 39,444 13.9
Total $810,161 50.5 $132,850 36.8 $70,592 24.9
*—Denotes % of total revenue.n/a —-Denotes revenue recognized less than 10% for the period.
(17) Subsequent EventsOn November 18, 2003, CIENA announced a full redemption of all of the outstanding ONI 5.00% convertible subordi-nated notes due October 15, 2005. The principal amount of the notes outstanding is $48.3 million. On the redemptiondate of December 19, 2003, CIENA will pay holders 102% of the outstanding principal amount of the notes plusaccrued interest.
Item 9. Changes in and Disagreements with Accountants on Accounting and Financial Disclosure
None.
Item 9A. Controls and ProceduresThe Chief Executive Officer and Chief Financial Officer of CIENA have evaluated the effectiveness of the disclosure con-trols and procedures (as defined in Rules 13a-15(e) and 15d-15(e) under the Securities Exchange Act of 1934, as amended(the “Exchange Act”), as required by paragraph (b) of Rules 13a-15 and 15d-15 under the Exchange Act, and have con-cluded that as of the end of the period covered by this report the disclosure controls and procedures were effective.
There was no change in CIENA’s internal control over financial reporting identified in connection with the evaluationrequired by paragraph (d) of Rules 13a-15 and 15d-15 under the Exchange Act during CIENA’s last fiscal quarter thatmaterially affected, or is reasonably likely to materially affect, CIENA’s internal control over financial reporting.
64 / CIENA Corporation 10-K

Item 10. Directors and Executive Officers of the RegistrantInformation relating to the directors and executive officers of the Company is set forth in Part I of this report under thecaption Item 1. “Business—Directors and Executive Officers.”
Additional information on compliance with Section 16(a) of the Exchange Act is incorporated herein by reference tothe Company’s definitive 2004 Proxy Statement.
As part of our system of corporate governance, our board of directors has adopted a code of ethics that is specifi-cally applicable to our chief executive officer and senior financial officers. This code of ethics is available on our web siteat http://www.ciena.com/investors/corpgovernance.htm.
Item 11. Executive CompensationThe information is incorporated herein by reference to the Company’s definitive 2004 Proxy Statement.
Item 12. Security Ownership of Certain Beneficial Owners and Management
The information is incorporated herein by reference to the Company’s definitive 2004 Proxy Statement.
Item 13. Certain Relationships and Related TransactionsThe information is incorporated herein by reference to the Company’s definitive 2004 Proxy Statement.
Item 14. Principal Accounting Fees and ServicesThe information is incorporated herein by reference to the Company’s definitive 2004 Proxy Statement.
CIENA Corporation 10-K / 65
PART III

66 / CIENA Corporation 10-K
Item 15. Exhibits, Financial Statement Schedules and Reports on Form 8-K
(a) 1. The information required by this item is included in Item 8 of Part II of this Form 10-K.2. The information required by this item is included in Item 8 of Part II of this Form 10-K.3. Exhibits: See Index to Exhibits on page 68. The Exhibits listed in the accompanying Index to Exhibits are filed
or incorporated by reference as part of this report.
(b) Reports on Form 8-K:Form 8-K (Item 5 and Item 7 reported) filed on August 21, 2003.Form 8-K (Item 5 and Item 7 reported) filed on September 3, 2003.Form 8-K (Item 5 and Item 7 reported) filed on November 18, 2003.Form 8-K (Item 12 reported) filed on December 11, 2003.
PART IV

CIENA Corporation 10-K / 67
Pursuant to the requirements of Section 13 or 15(d) of the Securities Exchange Act of 1934, the Registrant has dulycaused this report to be signed on its behalf by the undersigned, thereunto duly authorized, in the City of Linthicum,County of Anne Arundel, State of Maryland, on the 11th day of December 2003.
CIENA CORPORATIONBy: /s/ Gary B. SmithGary B. SmithPresident, Chief Executive Officerand Director
Pursuant to the requirements of the Securities Exchange Act of 1934, this report has been signed below by the fol-lowing persons on behalf of the Registrant and in the capacities and on the date indicated.Signatures Title Date/s/ Patrick H. Nettles, Ph.D. Executive Chairman December 11, 2003 Patrick H. Nettles, Ph.D. of the Board of Directors
/s/ Gary B. Smith President, Chief Executive Officer December 11, 2003 Gary B. Smith and Director (Principal Executive Officer)
/s/ Joseph R. Chinnici Sr. Vice President, Finance December 11, 2003 Joseph R. Chinnici and Chief Financial Officer (Principal Financial Officer)
/s/ Andrew C. Petrik Vice President, Controller December 11, 2003 Andrew C. Petrik and Treasurer (Principal Accounting Officer)
/s/ Stephen P. Bradley, Ph.D. Director December 11, 2003 Stephen P. Bradley, Ph.D.
/s/ Harvey B. Cash Director December 11, 2003 Harvey B. Cash
/s/ Don H. Davis, Jr. Director December 11, 2003 Don H. Davis, Jr.
/s/ John R. Dillon Director December 11, 2003 John R. Dillon
/s/ Lawton W. Fitt Director December 11, 2003 Lawton W. Fitt
/s/ Judith M. O’Brien Director December 11, 2003 Judith M. O’Brien
/s/ Gerald H. Taylor Director December 11, 2003 Gerald H. Taylor
SIGNATURES

68 / CIENA Corporation 10-K
ExhibitNumber Description3.1(1) Certificate of Amendment to Third Restated Certificate of Incorporation
3.2(1) Third Restated Certificate of Incorporation
3.3(1) Amended and Restated Bylaws
3.5(10) Certificate of Amendment to Third Restated Certificate of Incorporation dated March 23, 1998
3.6(10) Certificate of Amendment to Third Restated Certificate of Incorporation dated March 16, 2000
3.7(13) Certificate of Amendment to Third Restated Certificate of Incorporation dated March 13, 2001
4.1(1) Specimen Stock Certificate
4.2(3) Rights Agreement dated December 29, 1997
4.3(17) Amendment to Rights Agreement dated June 2, 1998
4.4(11) Amendment No. 2 to Rights Agreement dated September 13, 1998
4.5(4) Amendment No. 3 to Rights Agreement dated October 19, 1998
4.6(12) Indenture dated February 9, 2001 between CIENA Corporation and First Union National Bank for 3.75% convertible sub-
ordinated notes due February 1, 2008
4.11(18) Indenture dated October 27, 2000 between ONI Systems Corp. and State Street Bank and Trust Company for 5% con-
vertible notes due October 15, 2005
4.12(21) First Supplemental Indenture dated June 21, 2002 to the Indenture dated October 27, 2000 between ONI Systems Corp.
and State Street Bank and Trust Company for 5% convertible subordinated notes due October 15, 2005
10.1(1) Form of Indemnification Agreement for Directors and Officers
10.2(14) Third Amended and Restated 1994 Stock Option Plan
10.3(1) Form of Employee Stock Option Agreements
10.4(1) 1996 Outside Directors Stock Option Plan
10.5(1) Forms of 1996 Outside Directors Stock Option Agreement
10.13(1) Employment Agreement dated April 9, 1994 between the Company and Patrick Nettles
10.18(5) Form of Transfer of Control/Severance Agreement
10.19(6) Lightera 1998 Stock Option Plan and Form of Stock Option Agreement
10.20(7) Omnia Communications, Inc. 1997 Stock Plan and Form of Agreements
10.21(9) Employment Agreement dated August 18, 1999 between the Company and Gary B. Smith
10.22(9) 1999 Non-Officer Stock Option Plan and Form of Stock Option Agreement
10.24(13) Cyras Systems, Inc. 1998 Stock Plan as amended and Form of Stock Option Agreement
10.25(15) Amendment No. 1 to 1999 Non-Officer Stock Option Plan
10.26(16) Form of Amendment 1 to Transfer of Control/Severance Agreement for named executive officers (other than Gary B. Smith)
10.27(16) Transfer of Control/Severance Agreement between CIENA Corporation and Gary B. Smith
10.28(19) ONI 1997 Stock Plan
10.29(19) ONI 1998 Equity Incentive Plan
10.30(19) ONI 1999 Equity Incentive Plan
10.34(22) CIENA Corporation 2003 Employee Stock Purchase Plan
INDEX TO EXHIBITS

CIENA Corporation 10-K / 69
ExhibitNumber Description10.35(23) CIENA Corporation Nonqualified Management Deferred Compensation Plan
10.36(24) WaveSmith Networks, Inc. 2000 Stock Option and Incentive Plan
10.37(25) CIENA Corporation 2000 Equity Incentive Plan (Amended and Restated ONI Systems Corp. 2000 Equity Incentive Plan)
(Filed herewith)
21 Subsidiaries of registrant (filed herewith)
23.1 Consent of Independent Accountants (filed herewith)
31.1 Certification of Chief Executive Officer Pursuant to Rule 13a-14(a) under the Securities Exchange Act of 1934 as Adopted
Pursuant to Section 302 of the Sarbanes-Oxley Act of 2002 (filed herewith)
31.2 Certification of Chief Financial Officer Pursuant to Rule 13a-14(a) under the Securities Exchange Act of 1934 as Adopted
Pursuant to Section 302 of the Sarbanes-Oxley Act of 2002 (filed herewith)
32.1 Certification of Chief Executive Officer Pursuant to 18 U.S.C. Section 1350 as Adopted Pursuant to Section 906 of the
Sarbanes-Oxley Act of 2002 (filed herewith)
32.2 Certification of Chief Financial Officer Pursuant to 18 U.S.C. Section 1350 as Adopted Pursuant to Section 906 of the
Sarbanes-Oxley Act of 2002 (filed herewith)
(1) Incorporated by reference from the Company’s Registration Statement on Form S-1 (333-17729).
(3) Incorporated by reference from the Company’s Form 8-K filed December 29, 1997.
(4) Incorporated by reference from the Company’s Form 8-K filed October 19, 1998.
(5) Incorporated by reference from the Company’s Form 10-K filed December 10, 1998.
(6) Incorporated by reference from the Company’s Form 10-Q filed May 21, 1999.
(7) Incorporated by reference from the Company’s Form 10-Q filed August 19, 1999.
(9) Incorporated by reference from the Company’s Form 10-K filed December 10, 1999.
(10) Incorporated by reference from the Company’s Form 10-Q filed May 18, 2000.
(11) Incorporated by reference from the Company’s Form 8-K filed September 14, 1998.
(12) Incorporated by reference from the Company’s Form 10-Q filed February 15, 2001.
(13) Incorporated by reference from the Company’s Form 10-Q filed May 17, 2001.
(14) Incorporated by reference from the Company’s Form S-8 filed October 30, 2001.
(15) Incorporated by reference from the Company’s Form 10-K filed December 13, 2001.
(16) Incorporated by reference from the Company’s Form 10-Q filed February 21, 2002.
(17) Incorporated by reference from the Company’s Form 8-K filed June 3, 1998.
(18) Incorporated by reference from ONI Systems Corp.’s Form 10-Q filed November 14, 2000.
(19) Incorporated by reference from ONI Systems Corp.’s Form S-1 filed March 10, 2000 (333-32104).
(21) Incorporated by reference from the Company’s Form 10-K filed December 12, 2002.
(22) Incorporated by reference from the Company’s Form S-8 filed February 19, 2003.
(23) Incorporated by reference from the Company’s Form 10-Q filed February 20, 2003.
(24) Incorporated by reference from the Company’s Form 10-Q filed August 21, 2003.
(25) Effective August 19, 2003, the Company’s compensation committee of the board of directors amended the ONI 2000 Equity Incentive Plan tochange the name of this plan to the CIENA Corporation 2000 Equity Incentive Plan.

Corporate HeadquartersCIENA Corporation1201 Winterson RoadLinthicum, MD 21090-2205Telephone: (800) 921-1144 or (410) 865-8500www.CIENA.com
Annual MeetingCIENA’s annual shareholder meeting will be held at 3:00 p.m. on Wednesday, March 10, 2004, at the BWI Airport Sheraton Hotel, Baltimore, MD.
Independent Certified Public AccountantsPricewaterhouseCoopers LLPMcLean, VA
General CounselHogan & HartsonBaltimore, MD
Transfer AgentEquiServe Trust Company, NA P.O. Box 43023Providence, RI 02940-3023Shareholder Inquiries: (781) 575-4593www.EquiServe.com
Common Stock Market DataSince its initial public offering on February 7, 1997, the Company’s Common Stock has traded on the Nasdaq Stock Market under the symbol CIEN and appears in most daily newspaper stock tables as CIEN. As of January 20, 2004, there were approximately 2,422 shareholders of record and 476,185,987 shares of Common Stock Outstanding.
Investor RelationsFor additional copies of this report or other financial information, contact:Investor RelationsCIENA Corporation1201 Winterson RoadLinthicum, MD 21090-2205IR Hotline: (888) 243-6223 or(410) 865-8500
Additional information is available on CIENA’s website at www.CIENA.com
Executive OfficersPATRICK H. NETTLES, PH.D.Executive Chairman of the Board of Directors
GARY B. SMITHPresident, Chief Executive Officer and Director
STEPHEN B. ALEXANDERSenior Vice President, Chief Technology Officer
STEVE W. CHADDICKSenior Vice President, Corporate Strategy and Marketing
JOSEPH R. CHINNICISenior Vice President, Finance and Chief Financial Officer
JAMES F. COLLIER IIISenior Vice President, Corporate Development
NICHOLAS S. JEFFERYSenior Vice President, World Wide Sales
JESÚS LEÓNSenior Vice President, Chief Development Officer
EDWARD A. OGONEKSenior Vice President, General Manager of Metro and Enterprise Solutions
ROBERT A. O’NEILSenior Vice President, General Manager of Data Networking
ARTHUR SMITH, PH.D.Senior Vice President, Global Operations
RUSSELL B. STEVENSON, JR.Senior Vice President, General Counsel and Secretary
ANDREW C. PETRIKVice President, Controller and Treasurer
Outside Board MembersPROFESSOR STEPHEN P. BRADLEYWilliam Ziegler Professor of Business AdministrationHarvard Business School
HARVEY B. CASHGeneral PartnerInterWest Partners
DON H. DAVIS, JR.Chairman of the BoardRockwell Automation
JOHN R. DILLONRetired CFOCox Enterprises
LAWTON W. FITTSecretary (Chief Executive)Royal Academy of Arts
JUDITH M. O’BRIENManaging DirectorINCUBIC L.L.C.
GERALD H. TAYLOR Independent Communications Consultant
CORPORATE INFORMATION
70 / CIENA Corporation 10-K

www.CIENA.com
©20
04 C
IEN
A C
orp
ora
tio
n
Des
ign:
Fin
anci
al C
om
mun
icat
ions
Inc
.
Bet
hesd
a, M
D
ww
w.f
cicr
eati
ve.c
om

CIENA Corporation 1201 Winterson Road, Linthicum, Maryland 21090-2205
410.865.8500 800.921.1144 www.CIENA.com
CIE-AR-04