redesign foundation of crown project cikarang with …
TRANSCRIPT

FINAL PROJECT (RC14-1501)
REDESIGN FOUNDATION OF CROWN PROJECT CIKARANG WITH PRECAST PRESTRESSED SLAB ON GROUND AND MACHINE FOUNDATION
NATALIA INDAH PERMATA PUTRI
NRP 3111 100 155
Advisors:
Prof. Tavio, ST., MT., PhD
Ir. Ananta Sigit Sidharta, MSc., PhD
CIVIL ENGINEERING DEPARTMENT
Faculty of Civil and Planning Engineering
Institut Teknologi Sepuluh Nopember
Surabaya 2015


iii
REDESIGN FOUNDATION OF CROWN PROJECT CIKARANG WITH PRECAST PRESTRESSED SLAB
ON GORUND AND MACHINE FOUNDATION
Name : Natalia Indah Permata Putri NRP : 3111100155 Advisor I : Prof. Tavio, ST., MT., PhD Advisor II : Ir. Ananta Sigit Sidharta, MSc., PhD
ABSTRACT
This Crown Factory project is located in a good soil.
Therefore, it will be easier to design with precast
prestressed slabs on grade. The design includes the
thickness of slabs and the needed prestressed post-tensioned
tendon and reinforcement. The precast panel will be
evaluated partly; it means each panel won’t influence
another panel. So, every panel will be connected with
contraction joint and silien as a glue connector. Because of
that, this slab is considered as secondary structure. Hence,
it’s a needed to design structural foundation as part of
resisting external forces such as earthquake, wind, and rain.
The structural foundation includes reinforcement pile cap
and pile.
Not only the design, this final thesis project also
identifies the appropriate precast erection method,
especially for slab, and calculating the loss of prestressed
that occurs from the erection.
Furthermore, this thesis will be analyzed the
foundation of machine that considered as dynamic
foundation. The design will includes calculating of pile cap
and pile.

iv
Keywords: Soil investigation, slabs on grade, SAFE
software, prestressed, post-tensioned,
reinforcement, erection method, dynamic
foundation, pile.

v
FOREWORD
First of all the writer would like to thank God, Jesus
Christ-the most inspiration, that the writer can finish this final
project report of ”Redesign Foundation of Crown Project with
Precast Prestressed Slab on Ground and Machine Foundation”.
The writer herself cannot finish this report without any support
and assistance from others. I would like to say thank for
everyone, especially for:
1. Both of my parents, mom and dad, and my brother, Daniel,
who will be a pilot soon, and my twin as well, Natasha, who
always take an adventure with me. Thanks for the support,
your pray, and love
2. Prof. Tavio as my first advisor who gave big support and
encouraged me to write this final project in English although I
made many mistakes.
3. Mr. Ananta as my second advisor who gave many
contributions, experiences, and knowledge.
4. Prof Raka as my guidance from the first I studied in this
university who always give me the wise advices.
5. PT. TeamworX Indonesia, company that I had internship
before, who gave me data and knowledge, especially Mr.
Marangkup Manik, Mr. Eko, and others.
6. All of my lovely best friends in this university, “Perkebunan”
and “Basecamp 57” who always help me and be there in my
sad and happy, especially Teja and Emil.
7. All of my best friends from kindergarten till now who
couldn’t I say one by one. Thanks for every moment.
8. All other people that the writer cannot mention here one by
one that helped him finishing this project.
The writer realizes that this report still needs to be
improved. However, the writer hopes that this report will be
useful for whom it may concern.
Surabaya, July 2015
Natalia Indah Permata Putri

vi
“This page is purposely blank”

vii
Table of Contents ABSTRACT ..................................................................... iii
FOREWORD ...................................................................... v
TABLE OF CONTENT .................................................. vii
FIGURE LIST .................................................................. ix
TABLE LIST .................................................................... xi
CHAPTER 1 INTRODUCTION ...................................... 1
1.1 Background ................................................................ 1
1.2 Statements of Problem .................................................. 1
1.3 Objectives ..................................................................... 1
1.4 Scopes of Work ............................................................ 1
CHAPTER 2 LITERATURE REVIEW ........................... 3
2.1 Soil Investigation .......................................................... 3
2.1.1 N-SPT .......................................................... 3
2.1.2Pile Foundation ............................................... 3
2.2 Precast Slab Concrete ................................................... 7
2.2.1 Slab Thickness ............................................. 7
2.2.2 Decking Concrete ........................................ 7
2.3 Prestressing ................................................................... 7
2.3.1 ACI Maximum Permissible Stresses in
Concrete and Reinforcement ...................... 8
2.3.2 Prestressing System and Anchorage ............ 9
2.3.3 Loss of Prestress ........................................ 10
2.4 Mild-Steel Reinforcement .......................................... 16
CHAPTER 3 METHODOLOGY ................................... 19
3.1 Flow Chart .................................................................. 19
3.2 Collecting Data ........................................................... 24
3.2.1 Soil Investigation ....................................... 24
3.2.2 Upper Structure.......................................... 24
3.3 Slab on Ground Design .............................................. 27
3.4 Machine Foundation ................................................... 28
CHAPTER 4 SLAB ON GROUND DESIGN ............... 31

viii
4.1 Preliminary Design ..................................................... 31
4.1.1 Slab Thickness ........................................... 32
4.1.2Design Planning of Slab ............................... 33
4.1.3 Prestress Product ....................................... 34
4.2 Erection Precast .......................................................... 36
4.3 Load and Load Combination ...................................... 36
4.4 Element Forces ........................................................... 38
4.4.1 X Direction ................................................ 39
4.4.2 Y Direction ................................................ 40
4.5 Permissible Stress and Initial Force (Fo) ................... 42
4.5.1 Maximum Permissible Stresses in
Concrete and Reinforcement .................... 42
4.5.2 Initial Force............................................... 43
4.6 Loss of Prestress ......................................................... 43
4.6.1 Friction Loss .............................................. 43
4.6.2 Elastic Shortening ...................................... 44
4.6.3 Loss due to Anchorage Take Up ............... 45
4.6.4 Loss due to Steel Relaxation ..................... 45
4.6.5 Loss due to Creep of Concrete .................. 46
4.6.6 Loss due to Shrinkage Concrete ................ 46
4.7 Control Prestress ......................................................... 47
4.8 Total Tendon Requirement ......................................... 52
4.9 Design Control (Punching Shear) ............................... 53
4.10 Mild-Steel Reinforcement ........................................ 54
4.10.1 Design Specification ................................. 54
4.10.2 Stress Occurred ......................................... 55
4.10.3 Reinforcement Needed Calculation .......... 55
CHAPTER 5 MACHINE FOUNDATION .................... 59
5.1 Soil Investigation Analysis ......................................... 59
5.2 Allowable Bearing Capacity ...................................... 61
5.3 Load and Load Combinations .................................... 66
5.3.1 Loading ...................................................... 66

ix
5.3.2 Load Combination ..................................... 67
5.3.3 Static Load Analysis .................................. 68
5.3.4 Dynamic Load Analysis ............................ 69
5.4 Pile Analysis ............................................................... 72
5.5 Control
5.5.1 Lateral Force Analysis ....................................... 76
5.5.2 Buckling Check ................................................. 80
5.6 Pile Cap ..................................................................... 82
5.6.1 Punching Shear Control ..................................... 83
5.6.2 Design Specification .......................................... 84
5.6.3 Stress Occurred .................................................. 85
5.6.4 Reinforcement Needed Calculation ................... 86
CHAPTER 6 COLUMN FOUNDATION ..................... 91
6.1 Soil Investigation Analysis ......................................... 91
6.2 Allowable Bearing Capacity ...................................... 93
6.3 Stress Distribution of Columns .................................. 98
6.4 Load and Load Combinations .................................. 100
6.4.1 Interior Column ....................................... 100
6.4.2 Exterior Column ...................................... 104
6.5 Pile Analysis ............................................................. 109
6.5.1 Interior Column ....................................... 109
6.5.2 Exterior Column ...................................... 116
6.6 Pile Cap .................................................................... 123
6.5.1 Pile Cap Reincorcement .......................... 123
6.5.2 Interior Column Pilecap ........................... 123
6.5.3 Exterior Column Pilecap ......................... 128
CHAPTER 7 CONCLUSION ...................................... 133
7.1 Conclusion ................................................................ 133
7.2 Suggestion ................................................................ 133
REFFERENCE ............................................................... xiv
WRITER’S PROFILE

x
“This page is purposely blank”

Table List Table 2.1 Maximum Span-to-Depth Ratios for Post-Tensioned
Flat Slabs (Post Tensioning Institute) ......................................... 9
Table 2.2 Tolerance of d ............................................................. 9
Table2.3 Types of Prestress Loss ............................................. 13
Table 2.4 Values of C ............................................................... 15
Table2.5 Values of Ksh for Post-Tensioned MembersTable 2.6
Wooble and Curvature Friction Coefficients ........................... 17
Table 4.1 Maximum Span-to-Depth Ratios for Post-Tensioned
Flat Slab (Post Tensioning Institute) ........................................ 34
Table 4.2 Dimension of Anchorage .......................................... 37
Table 4.3 Characteristic of Strands .......................................... 37
Table 4.4 Element Forces in X Direction ................................. 44
Table 4.5 Element Forces in Y Direction ................................. 44
Table 4.6 Friction loss tendon .................................................. 46
Table 4.7 Precast prestress specification .................................. 46
Table 4.8 Elastic shortening for each tendon ........................... 47
Table 4.9 Values of Ksh for post-tensioned members .............. 49
Table 4.10 Total Loss for every tendon: ................................... 49
Table 4.11 Top fiber control ..................................................... 53
Table 4.12 Bottom fiber control ............................................... 53
Table 4.13 Element Forces in X Direction ............................... 57
Table 5.1 NSPT Used Calculation ............................................ 62
Table 5.2 Q allowable of Pile (diameter 30cm) ........................ 63
Table 5.3 Q allowable of Pile (diameter 40cm) ........................ 64
Table 5.4 Q allowable of Pile (S = 25cm) ................................ 65
Table 5.5 Load Combination of Static Load ............................ 69
Table 5.6 Load Combination of Dynamic Load (Both of
Machine Work in the Same Direction) ..................................... 70
Table 5.7 Load Combination of Dynamic Load (One of
Machine Work) ......................................................................... 72
Table 5.8 Q allowable (Qgroup)(B = 10.4m) ........................... 74
Table 5.9 P max and Q allowable Comparing for Static Load . 75
Table 5.10 P max and Q allowable Comparing for
Static+Dynamic Load ............................................................... 75

Table 5.11 Element forces of slab with envelope combination 77
Table 6.1 Soil Investigation and N used of BH-13 ................... 94
Table 6.2 Allowable Bearing Capacity of Pile D-25cm ........... 96
Table 6.3 Allowable Bearing Capacity of Pile D-30cm ........... 98
Table 6.4 Output Forces of Interior Column .......................... 103
Table 6.5 The Used Loads for Design Foundation of Interior
Column ................................................................................... 104
Table 6.6(a) Load Combination 1 .......................................... 104
Table 6.6(b) Load Combination 2 .......................................... 104
Table 6.6(c) Load Combination 3 .......................................... 105
Table 6.6(d) Load Combination 4 .......................................... 105
Table 6.6(e) Load Combination 5 .......................................... 105
Table 6.6(f) Load Combination 6 ........................................... 106
Table 6.6(g) Load Combination 7 .......................................... 106
Table 6.7 Output Forces of Exterior Column ......................... 107
Table 6.8 The Used Loads for Design Foundation of Exterior
Column ................................................................................... 108
Table 6.9(a) Load Combination 1 .......................................... 108
Table 6.9(b) Load Combination 2 .......................................... 108
Table 6.9(c) Load Combination 3 .......................................... 109
Table 6.9(d) Load Combination 4 .......................................... 109
Table 6.9(e) Load Combination 5 .......................................... 109
Table 6.9(f) Load Combination 6 ........................................... 110
Table 6.9(g) Load Combination 7 .......................................... 110
Table 6.10 Checking of P max and Q allowable for Interior
Column ................................................................................... 113
Table 6.11 Checking of P max and Q allowable for Exterior
Column ................................................................................... 120
Table 6.12 Element Forces in Interior Pile Cap ..................... 126
Table 6.13 Element Forces in Exterior Pile Cap .................... 130

ix
Figure List Figure 2.1 Forces that work on poimt bearing piles ................... 7
Figure 4.1 Side Plan of Precast ................................................ 33
Figure 4.2 Precast slab design .................................................. 34
Figure 4.3 Precast slab thicknesses .......................................... 35
Figure 4.4 Eccentricity of prestress .......................................... 35
Figure 4.5 Anchorage of Prestress ........................................... 36
Figure 4.5 Cross Section of Anchorage .................................... 37
Figure 4.6 Erection Point Pick-up of Precast ........................... 38
Figure 4.7 Anchorage prestress tendon .................................... 40
Figure 4.8 Punching shear area ................................................ 41
Figure 4.9 Cross section of X direction .................................... 41
Figure 5.1 Graphic of Allowable Bearing Capacity vs Depth .. 66
Figure 5.2 Plan Side Machine Foundation ............................... 67
Figure 5.3Cross Section A-A of Machine Foundation ............. 67
Figure 5.4 Piling location of machine foundation .................... 83
Figure 5.5 Punching shear ....................................................... 84
Figure 5.6 M11 for reinforcement Direction ............................ 86
Figure 5.7 M11 for reainforcement .......................................... 86
Table 5.8 Q allowable (Qgroup)(B = 10.4m) ........................... 74
Table 5.9 P max and Q allowable Comparing for Static Load . 75
Table 5.10 P max and Q allowable Comparing for
Static+Dynamic Load ............................................................... 75
Table 5.11 Brochure Pile of WIKA .......................................... 77
Figure 6.1 Graphic of Allowable Bearing Capacity Pile D-25cm
.................................................................................................. 97
Figure 6.2 Graphic of Allowable Bearing Capacity Pile D-30cm
.................................................................................................. 99
Figure 6.3 Estimation of Stress Distribution from Precast ..... 100
Figure 6.4 Graphic I factor for distributed area load .............. 101
Figure 6.5 Pile Cap for Interior Column ................................ 104
Figure 6.6 Pile Cap for Exterior Column ............................... 104
Figure 6.7 Stress Occurred in Interior Column ...................... 107
Figure 6.8 Stress Occurred in Exterior Column ..................... 108

x
“This page is purposely blank”

1
CHAPTER 1 INTRODUCTION
1.1 Background Based on the book of an old theory of architect, there are
three primary criteria of a good building (Virtruvius, 2006) –
durability,convenience, andaesthetics. The three of them have an
equal weight, none is more important than the others. In other
words, a good structure meets the demands of durability that
depend on the strength or stability, convenience means
functionality or usefulness, and esthetic. But, that cost will
determine the continuityof the construction. Will it stops or
continues?Therefore, this thesis will explain one of the
recenttechnologiesin civil engineering that willhelp to solve
issues in construction world. PrecastPrestressed Slab on
Gradefor example.Prestressedconcrete is too expensive for most
people, because of the high quality material, such as high strength
steel and high strength concrete, whereas, many advantages of
prestressedcan cover the high cost of prestressed concrete.
Prestressed concrete is no longer a strange type of design.
It is rather an extension and modification ofreinforcement
concrete with high strength steel and concrete (Lin and Burns,
1981).By prestressing and anchoring the steel against the
concrete, we produce desirable stresses and strains in both
materials.As a result, it has the ability to resist the more load or
crack. Beside of the material, curing is also an important thing to
make a durable concrete. Curing in precast is much easier and
better control then cast in situ.
High costs of prestressed concrete is probably the most
common viewpoint among engineers, whereas, the cost will be
reduced with some points. First, reducingthe thickness of floor or
slab can reduce theoverall building height (especially for high rise
building, to avoid the strong of wind load). Second, using precast
construction can reduce the total weight of the structure
resultingpile can be reduced too.Third, reducing the formwork

2
cost (as long as we use the same dimension of precast). Fourth,
lower construction costs. Construct with precast save much time
than concrete in-situ. Last, it considerable lower costs of
maintenance because of the longer service life.
1.2 Statements of Problem 1. How to design one-way-slab with prestress?
2. How to erect the precast from fabricated area to project
area?
3. How to control prestressed concrete strength with
occurred load?
4. How to design machine foundation? )Both pile cap and
pile)
1.3 Objectives 1. To design the dimension of precast
2. To analyze the post tensioned prestressed
3. To analyze the loss of prestressed
4. To design the appropriate foundation of machine
5. To design the appropriate foundation of each column
1.4 Scopes of Work 1. Soil bearing capacity will be calculated based on soil
investigation report that had been investigated by
Suryacipta Industrial Estate.
2. The upper structural calculating had been done by the
vendor, PT. Bluescope Buildings.
3. The frequency of machine is supposed not disturbing, so
there is no calculating of machine amplitude.
4. The previous designs of steel columns are supposed being
able to resist earthquake moment. There is no analysis of
steel strength.
5. Precast panel are analyzed as partly panel, so there are no
joints calculating.
6. There is no comparative study between the previous and
recently designin economic aspect.

3
CHAPTER 2 LITERATURE REVIEW
2.1 Soil Investigation 2.1.1 N-SPT
With N correction:
1. Toward Groundwater (N’) according to Terzaghi& Peck
N’ = 15+0.5(N-15), for N>15 (1-1)
N’ = 1.25 for gravel or sandy gravel
2. Toward Soil Overburden Pressure (N2):
N2 = 4.N1
1+(0.4 .0)if
0≤ 7.5 𝑡𝑜𝑛/𝑚2 (1-2)
N2 = 4.N1
3.25+(1.4× 0 ) if
0≥ 7.5 𝑡𝑜𝑛/𝑚2 (1-3)
0 = vertical soil pressure at a depth which is reviewed. N2
value is should be ≤ 2N1, if the correction is obtained
that N2> 2N1, use N2 = N1 (o = t x h)
2.1.2 Pile Foundation Piles are structural members that are made of steel,
concrete, or timber. They are used to build pile foundations,
which are deep and which cost more than shallow foundations.
Despite the cost, the use of piles often is necessary to ensure
structural safety (Das, Seventh Edition, 2007).
2.1.2.1 Estimating Pile Length Piles can be divided into three major categories,
depending on their lengths and mechanism of load transfer to the
soil:
1. Point bearing piles
2. Friction piles

4
3. Compaction piles
1. Point bearing piles
If soil-boring records establish the presence of bedrock or
rocklike material at a site within the reasonable depth, pile can be
extended to the rock surface. In this case, the ultimate capacity of
the piles depends on the load bearing capacity of the under-lying
material. This piles are called point bearing capacity.
Piles with pedestals can be constructed on the bed of the
hard stratum, and the ultimate pile load may be expressed as
Qu = Qp + Qs (1-4)
where :
Qp = load carried at the pile point
= qp x Ap
= α x Np x K x Ap (1-5)
qp=point stress pile
Ap = section area pile
Np = SPT average for 4B upper till 4B bellow pile (B is pile
diameter)
K =Soil characteristic coefficient
Qs= load carried by skin friction developed at the side of the
pile (caused by shearing resistance between the soil and
the pile)
= qs x As
= 𝛽 × (Ns
3+ 1) × As (1-6)
β = Shaft coefficient intermediate soils for driven pile = 1
Ns = SPT average for planted pile, boundary 3 ≤ N ≤ 50
As = Luasselimuttiangtertanam
qs=Teganganakibatgesertiang

5
Figure 2.1 Forces that work on poimt bearing piles
2. Friction piles
When no layer of rocklike material is present at a
reasonable depth at a site, point bearing piles become very long
and uneconomical. These piles are called friction piles, because
the most of their resistance is derived from skin friction.
Qu = Qs
The length of friction piles depend on the shear strength
of the soil, the applied load, and the pile size.
3. Compaction Piles
Under certain circumstances, piles are driven in granular
soils to achieve proper compaction of soil close to the ground
surface. These piles are called compaction piles. The compaction
length depends on factors such as; the relative density of the soil
before compaction, the desired relative density of the soil after
compaction, and the requires depth of compaction.
L
Qp
u
Qu
u
Qs
u

6
2.1.2.3 Maximum Load of Every Pile To calculate or check how many pile will be needed,
analyzing the strength of each pile is a must. As the formula
bellow
𝑃𝑚𝑎𝑥 =V
n+
Mx×Ymax
Y2+
My×Xmax
X2 (1-7)
Where:
Pmax = Maximum load for one pile
Σ P = Total axial load occurred
Mx = Moment in X direction
My = Moment in Y direction
Xmax = Absistiangpancangterjauhterhadapgaris
beratkelilingtiang
Ymax = Ordinattiangpancangterjauhterhadapgaris
beratkelilingtiang
X2 = Jumlahkuadratabsistiangpancangterhadap
garisberatkelompoktiang
Y2 = Jumlahkuadratordinattiangpancangterhadap
garisberatkelompoktiang
n = total of pile = 48
2.1.2.3 Group Efficiency In most cases, piles are used in groups to transmit the
structural load to the soil. A pile cap is constructed over group
piles. The cap can be contacted with the ground or well above the
ground.
The efficiency of the load-bearing capacity of the group
pile may be defined as
= √Qb2
Qb2+nQ12 (1-8)

7
2.2 Precast Slab Concrete All slab dimension are based on SNI 7833:2012, Tata
Cara
PerancanganBetonPracetakdanBetonPrateganguntukBangunanGe
dung.
2.2.1 Slab Thickness Slam thickness will be considered base on their type and
dimension. PTI has had the standard of thickness
Table 2.1 Maximum Span-to-Depth Ratios for Post-Tensioned Flat Slabs
(Post Tensioning Institute)
One-way slab 48
Two-way slab 45
Two-way slab with drop panel 50
Two way-slab with two-way beams 55
Waffle (5 x 5 grid) 35
Beams b=h/3 20
Beams b=3h 30
2.2.2 Decking Concrete (d) According to SNI 7843:2012 chap. 4.6.2.3.3, tolerance of
concrete decking is based on the thickness of slab
Table 2.2 Tolerance of d
Slab thickness Tolerance of d
d ≤ 200mm ±10mm
d ≥ 200mm ± 13mm
2.3 Prestressing Because of high creep and shrinkage losses in concrete,
effective prestressing can be achieved by using very high strength
steels in the range of 1,862 MPa or higher. Such high strength
steels are able to counterbalance these losses in the surrounding

8
concrete and have adequate leftover stress levels to sustain the
required prestressing force.
Prestressing reinforcement can be in the form of single
wires, strands composed of several wires twisted to form a single
element, and high strength bars.
2.3.1 ACI Maximum Permissible Stresses in Concrete and Reinforcement Following are definitions of some important
mathematical term used in calculating.
fpy = specified yield strength of prestressing tendons (MPa)
fy = specified yield strength of non-prestressed
reinforcement(MPa)
fpu = specified tensile strength of prestressing tendons (MPa)
f’c = specified compressive strength of concrete (MPa)
f’ci = compressive strength of concrete at time of initial
prestress
2.3.1.1 Concrete Stresses in Flexure Stresses in concrete immediately after prestress transfer
(before time dependent prestress losses) shall not exceed the
following:
a) Extreme fiber stress in comparison 0.60f’ci
b) Extreme fiber stress in tension except as permitted in (c)
3√𝑓’𝑐𝑖 c) Extreme fiber stress in tension at ends of simply
Where computed tensile stresses exceed these values,
bonded auxiliary reinforcement (non-prestresses or prestressed)
shaal be provided in the tensile zone to resist the total tensile
force in concrete computed under the assumption of an uncracked
section.
Stresses in concrete at service loads (after allowance for
all prestress losses) shall not exceed the following:
a) Extreme fiber stress in compression due to prestress
plus sustained load, where sustained dead load and

9
live load are a large part of the total service load
0.45f’c
b) Extreme fiber stress in compression due to prestress
plus total load, id the live load is transient 0.60f’ci
c) Extreme fiber stress in tension in precompressed
tensile zone 6√𝑓’𝑐
d) Extreme fiber stress in tension inprecompressed tensile
zone of member (except way slab systems), where
analysis based on transformed cracked section and on
bilinear moment-deflection relationship shows that
immediate and long-time deflection comply with the
ACI definition requirements and mimimum concrete
cover requirements 12√𝑓’𝑐
2.3.1.2 Prestressing Steel Stresses Tensile stress in prestressing tendons shall not exceed the
following:
a) Due to jacking force 0.94fpy, but not greater than the
lesser of 0.80fpu and the maximum value
recomendedby the manufacturer of prestressing
tendons or anchorages. b) Immidiately after prestress transfer 0.82fpy, but not
greater than of 0.74fpu c) Post-tensioning tendons, at anchorages and couplers,
immediately after tendon anchorage 0.70fpu
2.3.2 Prestressing System and Anchorage 2.3.2.1 Pretensioning Prestressing steel is pretensioned against independent
anchorages prior to the placement of concrete around it. Such
anchorages are supported by large and stable bullheads to support
the exceedingly high concentrated forces applied to the individual
tendons. Prestressing can be accomplished by prestressing
individual strands, or all the strands at one jacking operation.

10
2.3.2.2 Post Tensioning In post-tensioning, the strands, wires, or bars are
tensioned after hardening of the concrete. The strands are placed
in the longitudinal ducts within the precast concrete element. The
prestressing force is transferred through end anchorages. The
tendons of strands should not be bonded or grouted prior to full
prestressing.
2.3.2.3 Jacking System One of fundamental components of a prestressing
operation is the jacking system applied, i.e., the manner in which
the prestressing force is transferred to the steel tendons.
2.3.3 Loss of Prestress It is a well established fact that the initial prestressing
force applied to the concrete element undergoes a progressive
process over a period of approximately five years. Consequently,
it is important to determine the level of prestressing force at each
loading stage, from the stage of transfer of the prestressing force
to the concrete to the various stages of prestressing available at
the service load, up to the ultimate. Essentially, the reduction in
the prestressing force can be grouped into two categories:
Immediate elastic loss during the fabrication or construction
process, including elastic shorthening, anchorage loasses, and
frictional losses.
Time dependent losses such as creep, shrinkage, and those
due to temperature effects and steel relaxation, all of which
are determinable at the service load limit stage of stress in the
prestressed concrete element.
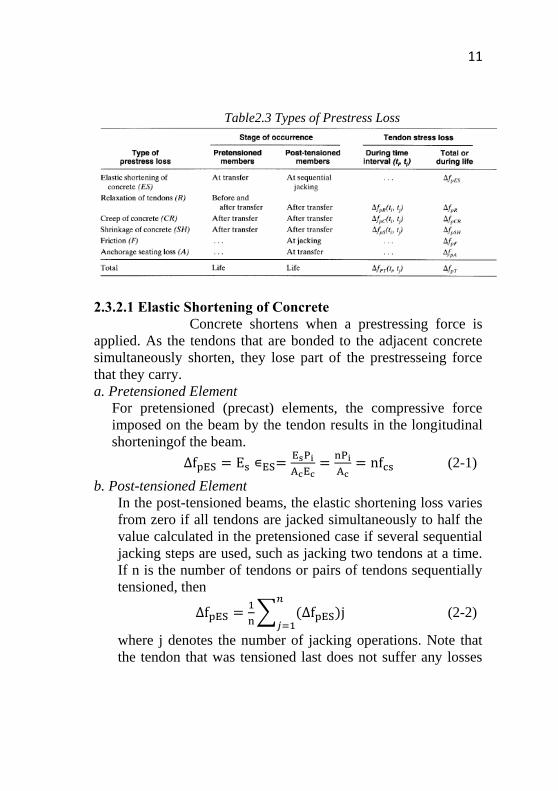
A summary of the sources of the separate prestressing
losses and the stagesof their occurance is given in Table 2.3.
From this table, the total loss in prestress can be calculated for
pretemsioned and post-tensioned members as follows:
11
Table2.3 Types of Prestress Loss
2.3.2.1 Elastic Shortening of Concrete Concrete shortens when a prestressing force is
applied. As the tendons that are bonded to the adjacent concrete
simultaneously shorten, they lose part of the prestresseing force
that they carry.
a. Pretensioned Element
For pretensioned (precast) elements, the compressive force
imposed on the beam by the tendon results in the longitudinal
shorteningof the beam.
∆fpES = Es ∊ES=EsPi
AcEc=
nPi
Ac= nfcs (2-1)
b. Post-tensioned Element
In the post-tensioned beams, the elastic shortening loss varies
from zero if all tendons are jacked simultaneously to half the
value calculated in the pretensioned case if several sequential
jacking steps are used, such as jacking two tendons at a time.
If n is the number of tendons or pairs of tendons sequentially
tensioned, then
∆fpES =1
n∑ (∆fpES)j
𝑛
𝑗=1 (2-2)
where j denotes the number of jacking operations. Note that
the tendon that was tensioned last does not suffer any losses

12
due to elastic shortening, while the tendon that was tensioned
first suffers the maximum amount of loss.
2.3.2.2 Steel Stress Relaxation (R) Stress relieved tendons suffer loss in the prestressing
force due to constant elongation with time. The magnitude of the
decrease in the prestress depends not only the duration of the
sustained prestressing force, but also on the ratio fpi/fpyof the initial
prestress to the yield strength if the reinforcement. Such a loss in
stress is termed stress relaxation.
The ACI 318-05 Code limits the tensile stressin the
prestressing tendons to the following:
a) For stresses due to the tendon jacking force, fpJ = 0.94fpy,
but not greater than the lesserof 0.80fpu and the maximum
value recommended by the manufacturer of the tendons
and anchorages.
b) Immediately after prestress transfer, fpi = 0.82fpy but not
greater than 0.74fpu
c) In the post-tensioned tendons, at the anchorages and
couplers immediately after the force transfer = 0.74fpu
The range of values of fpy is given by the following:
Prestressing bars: fpy = 0.8fpu
Stress relieved tendons: fpy = 0.85fpu
Low relaxation tendons: fpy = 0.9fpu
The ACi method use the separate contributions of elastic
shortening, creep, and shrinkage in the evaluation of the steel
stress relaxation loss by means of the equation
∆fpR = Kre − J∆(fpES + fpCR + fpSH × C (2-3)
The values of Kre, J, and C are given in Table 2.4

13
Table 2.4 Values of C

14
Table 2.4 Values of C
2.3.2.2 Creep Loss (CR) Experimental work over the past half century indicates
that flow in materials occurs with time when load or stress exists.
This lateral flow or deformation due to the longitudinal stress is
termed creep.
The ACI-ASCE Committee expression for evaluating
creep loss has essentially the same format as bellow:
∆fpCR = nKCR(fcs − fcsd) (2-4)
where :
KCR = 2.0 for pretensioned members
= 1.6 for post-tensioned members
fcs = stress in concrete at level of steel cgs
immediately after transfer
fcsd = stress in concrete at level of steel cgs due to all
superimposed dead loads applied after
prestressing is accomplished
n = modular ratio = Eps
Ec
2.3.2.2 Shrinkage Loss (SH) As with concrete creep, the magnitude of the shrinkage of
concrete is affected by several factors. Size and shape of the
member also effect shrinkage. Approximately 80% of shrinkage
takes place in the first year of life of the structure.

15
For post-tensioned members, the loss in prestressing due
to shrinkage is somewhat less since some shrinkage has already
taken place before post-tensioning. If the relative humidity is
taken as a percent value and the V/S ratio effect is considered, the
PCI general expression for loss in prestressing due to shrinkage
becomes
∆fpSH = 8.2 × 10⁻⁶KSHEps(1 − 0.006V
S )(100 − RH) (2-5)
where the KSH is shown in Table 2.5
Table2.5 Values of Ksh for Post-Tensioned Members
2.3.2.2 Loss due to Friction (F) Loss of prestressing occurs in post-tensioning members
due to friction between the tendons and the surrounding concrete
ducts. it is influenced by:
a) Curvature effect = Tendon form or alignment
b) Wooble effect = The local deviations in the alignment
Assuming that the prestress force between the start of the
curved portion and its end is small, it is sufficient accurate to use
the initial tension for the entire curve, and can be simplified to
yield:
∆𝑓𝑝𝑓 = −𝑓1(𝜇𝛼 + 𝐾𝐿) (2-6)

16
Table 2.6 Wooble and Curvature Friction Coefficients
`2.3.2.2 Anchorage Seating Losses (A) Anchorage seating losses occur in post-tensiones
members due to the seating of wedges in the anchors when the
jacking force is transferred to the anchorage. ∆fpA =
∆A
LEps (2-7)
2.4 Mild Steel Reinforcement Mild-steel reinforcement will be design to resist moment.
The top reinforcement will resist negative moment from erection,
and the bottom reinforcement will resist positive moment from
service load.
There are some variables will be needed to calculate mild
steel reinforcement:
(based SNI 2847:2013 chap. 10.2.7.3)
1
= 0.85 − 0.05(fc−28
7) (2-8)
(based on Appendix B.8.4.2 SNI 2847:2013)
b = 0,85×𝛽1×𝑓𝑐
′
400× (
600
600+𝑓𝑦) (2-9)

17
(based on Appendix B.10.3.3 SNI 2847:2013)
max = 0.75b
(based on SNI 2847:2013 chap. 10.5.1)
min1 =0,25×√𝑓𝑐
′
𝑓𝑦 (2-10)
min2 = 1.4
fy (2-11)
(based on SNI 2847:2013 chap. 7.12.2.1)
shrinkage = 0.002
(based on SNI 2857:2013 chap. 7.12.2.1)
reduction factor for flexural reinforcement, ϕ= 0.9

18
“This page is purposely blank”

31
CHAPTER 4 SLAB ON GROUND DESIGN
4.1 Preliminary Design Crown project has a building that is used to be office, storage room, and production place. Because of the wide area (almost 3,500m2), it will be faster to design the foundation with precast slab-on-ground. Figure 4.1 shows the side plan of precast that will be constructed.
Figure 4.1 Side Plan of Precast
Warehouse and office rooms are planned to be constructed with precast as working floor, they just receive dead load and live load, while the earthquake load will be received by

32
column towards by deep foundation (pile cap and pile), while, for canmaker machine foundation, it will be designed by dynamic foundation.
4.1.1 Slab Thickness
Figure 4.2 Precast slab design
Slab thickness will be considered based on their type and dimension. PTI has had the standard of thickness as shown in Table 4.1.
Table 4.1Maximum Span-to-Depth Ratios for Post-Tensioned Flat Slabs (Post Tensioning Institute)
One-way slab 48 Two-way slab 45 Two-way slab with drop panel 50 Two way-slab with two-way beams 55 Waffle (5 x 5 grid) 35 Beams b=h/3 20 Beams b=3h 30
Slab thickness, h =600cm
48= 12.5cm ≈ 25cm
Thickness of slab will design 25 cm considered to the room for tendon and mild-steel reinforcement
y = 3m
x = 6m

33
Figure 4.3 Precast slab thicknesses
4.1.2 Design Planning of Slab A = b x h = 3 x 0.25 = 1.5 m2 =750,000 mm2
I = 1
4bh3
=1
4× 3,000 × 2503
= 1.172 x 1010mm2 Yt = top boundary = 125 mm Yb = bottom boundary = 125 mm E = 200,000 MPa
Wt = I
yt=
1.172 x 10¹⁰
125= 93.75 × 10⁶
Wb = I
yb=
1.172 x 10¹⁰
125= 93.75 × 10⁶
d = concrete cover = 25mm There is no eccentricity (e=0) in this case, to prevent slab deflection right after installation and before service load.
`
Figure 4.4 Eccentricity of prestress
6m
25cm
mild-steel
reinforcement tendon

34
4.1.3 Prestress Product:
Freyssinetprestress will be used with characteristics and specifications bellow: F range anchor, intended for the prestressing of thin
elements (slab, concrete floor, etc.) Bonded internal prestressing Multi strand units 5F/13
Figure 4.5Anchorage of Prestress

35
Figure 4.5 Cross Section of Anchorage
Table 4.2 Dimension of Anchorage
Table 4.3 Characteristic of Strands
- Nominal Diameter of Strand = 15.7 mm - Nominal Steel Area of Strand = 150 mm2 - Breaking Strength, fpu = 1770 MPa

36
- Yielding Strength, fpy = 0.7 x fpu = 1239 MPa - Elasticity Modulus = 200,000 MPa 4.2 Erection Precast When the slab is erected, it is supposed as simple beam. It will be lifted up by 4 points. These points are planted in the precast in distance of 0.207L from the edge of slab. fc’ = 50 MPa = 500 kg/m2 fy = 410 MPa = 4000 kg/m2
b = 6 m; a = 3 m
Figure 4.6 Erection Point Pick-up of Precast
4.3 Load and Load Combinations Precast accommodates dead load and live load occur on the slab on ground.
Dead Load (DL) = slab weight that adjusted to the slab thickness, occurred in jacking and erection = 2400kg/m3 x 0.25 m x 3m = 1800 kg/m

37
Jacking condition (X direction):
Erection Condition (X direction):
Erection Condition (Y direction):
Figure 4.6 Dead Load
Live Load (LL) = vehicle, human, and another load that were approximated by consultant
A B
6m
q = 1800 kg/m
q = 1800 kg/m
a = 3m
0.586a 0.586a
A B
0.207a
b = 6m
0.104b 0.207b 0.207b 0.207b 0.104b
q = 1800 kg/m

38
= 25kN/m2x 3m = 75 kN/m2 = 7500 kg/m Sevice condition (X direction):
Service condition (Y direction):
Figure 4.7 Live Load
Load combinations: (SNI 1726-2012 Tata caraperencanaanketahanangempauntukstrukturbangunangedungdan non-gedung), using ultimate stress combination:
a. 1.4D b. 1.2D + 1.6L+0.5(Lr or R) c. 1.2D + 1.6(Lr or R)+(L or 0.5W) d. 1.2D+1.0W+L+0.5(Lr or R) e. 1.2D+1.0E+L f. 0.9D+1.0W g. 0.9D+1.0E
4.4 Element Forces There are two longitudinal section those will be observed, XZ direction and YZ direction. Element forces in XZ direction will be resisted by tendon and element forces in YZ direction will
A B
3m
q = 7500 kg/m
A B
6m
q = 7500 kg/m

39
be resisted by mild steel reinforcement. There are three kinds of condition those will be observed:
1. Precast in fabric before erection (influenced by dead load of self weight) – Condition A
2. Precast when erected (dead load with erected point) – Condition B
3. Precast at service load (dead load and live load) – Condition C
4.4.1 X direction This sub-chapter shows any kinds of element forces (shear and moment) that occurred in slab both in X direction at jacking, erection and service condition.
Figure 4.8 Shear Forces in Condition A (X Direction)
Figure 4.9 Moment Forces in Condition A (X Direction)
Figure 4.10 Shear Forces in Condition B (X Direction)

40
Figure 4.11Moment Forces in Condition B (X Direction)
Figure 4.12 Shear Forces in Condition C (X Direction)
Figure 4.13Moment Forces in Condition C (X Direction)
4.4.2 Y direction This sub-chapter shows any kinds of element forces (shear and moment) that occurred in slab both in X direction at jacking, erection and service condition.
Figure 4.14 Shear Forces in Condition A (Y Direction)

41
Figure 4.15Moment Forces in Condition A (Y Direction)
Figure 4.16 Shear Forces in Condition B (Y Direction)
Figure 4.17Moment Forces in Condition B (Y Direction)
Figure 4.18Shear Forces in Condition C (Y Direction)
Figure 4.19Moment Forces in Condition C (X Direction)

42
Table 4.4 Element Forces in X Direction
Table 4.5 Element Forces in Y Direction
4.5 Permissible Stress andInitial Force (Fo) 4.5.1 Maximum Permissible Stresses in Concrete and Reinforcement According to SNI 7833:2012 chap. 6.4, there are some permissible stresses in concrete and reinforcement. In this book, compression stress will be considered as minus, while tension stress will be considered as plus. 1. Transfer/jacking/erection condition: Compression (c1) = -0.6 fc’ = -0.6 x 50 = -30 MPa Tension (t1) = 0.5 x √fc′ = 0.5 x √50 = 3.536 MPa 2.Service: Compression (c2) = -0.45 fc’ = -0.45 x 50 = -22.5 MPa Tension (t2) = 0.25√fci′ = 0.25√50 = 1.768 MPa
XZ Shear (kg)Moment
(kgm)
Moment
(Nmm)
DL 5400 8100 81000000
D erection 1587.16 330.88 3308800
DL+LL 39960 59940 599400000
M+ M-
DL 2700 2025 -
D erection 1582.2 348.3 347.08
DL+LL 19980 14985 -
YZ Shear (kg)Moment (kg/m2)

43
4.5.2 Initial Forces (Fo) Initital force before loss prestress can be approximated (Lin and Burn). The using moment is from the critical moment with envelope combination.
Fo =M
0.65h=
599.4kNm
0.65 × 0.25= 3,688.62kN
4.6 Loss of Prestress The stresses of the distinctive feature of structural system may be tailored to the desired level to assure satisfactory performance. Hence, it is noted that the prestress force used in making the stress computation will not remain constant time. The actual materials and individual circumstances (time elapsed, exposure conditions, dimension, and size of member) must be considered as the time goes by which influence the amount of loss prestresss(Lin, T.H, Third Edition). There are two kinds of prestress losses as mentioned bellow: Short term or stressing losses – These are losses that occurs
during and immediately after the post-tensioning operations and are caused by: 1. Loss due to friction between the tendons and the ducts 2. Elastic shortening 3. Seating of anchors 4. Loss due to steel relaxation
Long term losses – These types of losses happen over time and also may be referred to as time dependant losses: 1. Loss due to creep of concrete 2. Loss due to shrinkage of concrete
4.6.1 Friction Loss It is known that there is some friction in the jacking and anchorage system, so that the stress existing in the tendon is less than indicated by the pressure gage.

44
∆fpf = e(−μα−KL) where:
𝛼 =8y
x=
8 × 40
6000= 0.05333
andwooble coefficient (K) and curvature coefficient (μ) are
determined by Freyssinet: K = 0.007 μ = 0.05 L = 6 m
Table 4.6 Friction loss tendon
4.6.2 Elastic Shortening of Concrete (ES) As the prestress is transferred to the concrete, the member shortens and the prestressedsteel shortens with it. Hence, there is a loss of prestress in the steel. Loss of prestress in steel is:
ES = ∆fs = Esδ =EsF0
AcEc=
𝑛𝐹0
𝐴𝑐
Table 4.7 Precast prestress specification
Segment L KL α μα KL+μα -KL-μα e^(-KL-μα) %
AB 6 0.042 0.0667 0.00333 0.04533 -0.045333 0.9557 4.4321
Fo 3688615 Nd strand 15 mmn strand 25n tendon 5A concrete 750000 mm2A anchorage 28000 mm2E steel 200000 N/mm2E concrete 33234.01872 N/mm2
Precast Prestress Specification

45
From the data of precast prestress specification, the loss of prestress due to elastic shortening can be calculated:
Table 4.8 Elastic shortening for each tendon
4.6.3 Loss Due to Anchorage Take Up Losses occur due to slip of wires during anchoring or due to strain anchorage is of important in case of post-tensioned system. For any anchoring system, slip is roughly constant. In case of Freyssinet cones, the slip is 6mm for 5mm wires and 9mm for 7mm wires. Considering the release of strain due to slip ∆s, as uniform throughout the length L of the wire, the loss of prestress ∆fs, is given by:
∆fs= Es =∆s
L
But Freyssinet has had determined the loss of slip anchorage is 3% 4.6.4 Loss Due to Steel Relaxation Test of prestressing steel with constant elongation maintained over a period of time have shown that the prestress force will decrease depends on both time duration and the ration (fpi/fpy). The loss of prestress is called relaxation. The ACI-ASCE Committee uses the equation bellow to calculate the relaxation loss:
RE = (Kre – J (SH+CR+ES)) C
Tendon n Fo (N)Ac
(mm2)
∆fs
(N/mm2)Kumulatif Total (%)
1 6.01793 3,688,615 750000 29.5971 118.3884 6.6886
2 6.01793 3,688,615 750000 29.5971 88.7913 5.0165
3 6.01793 3,688,615 750000 29.5971 59.1942 3.3443
4 6.01793 3,688,615 750000 29.5971 29.5971 1.6722
5 6.01793 3,688,615 750000 29.5971 0 0

46
But Freyssinet had determined the maximum elongation at 1,000 hours under 0.7 fpk for all strands is ≤ 2.5% (5 tendons), 0.5% for 1 tendon. 4.6.5 Loss due to Creep of Concrete Creep is assumed to occur with the superimposed permanent dead load added to the member after it has been prestressed. Part of the initial compressive strain induced in the concrete immediately after transfer is reduced by the tensile strain resulting from the superimposed permanent dead load. For unbonded tendons the average compressive stress is used to evaluate losses due to elastic shortening and creep of concrete losses. The losses in the unbounded tendon are related to the average member strain rather than strain at the point of maximum moment. Thus:
CR = Kcr
Es
Ecfcpa
Kcr = 1.6 for post-tensioned members fcpa = 3.33 N/mm2
CR = 1.6200000
332343.33 = 32 N/mm2 (for 5 tendons)
CR = 6.5 N/mm2 = 0.36% (for 1 tendon)
4.6.6 Loss due to Shrinkage of Concrete Shrinkage of concrete is influenced by many factors which are most important: volume-to-surface ratio (V/S), relative humidity (RH), and time from end of moist curing to application of prestress. The factors can be seen bellow, as they influenced the product of the effective shrinkage, Esh:
Esh = 8.2 × 10⁻⁶ (1 − 0.06V
S) (100 − RH)

47
Shrinkage loss will be influenced by only other, it’s the
coefficient Ksh which reflects the fact that the post-tensioned members benefit from the shrinkage which occurs prior to the post-tensioning.
SH = 8.2 × 10⁻⁶KshEs (1 − 0.06V
S) (100 − RH)
Table 4.9 Values of Ksh for post-tensioned members
Ksh = 0.60 (concrete 28 days) Es = 200000 N/mm2 V = 4.5m3 S = 0.75 m2 RH = 70% So, it is calculated as bellow:
SH = 8.2 × 10−6 × 0.6 × 200000 (1 − 0.064.5
0.75) (100 − 70)
SH = 18.9% (for 5 tendons) = 3.78% (for 1 tendon)
Table 4.10 Total Loss for every tendon:
4.7 Control Prestress 4.7.1 Control PrestressForceafter Loss (Fi & Fe) Prestress Forces will be control in three conditions:
1. Transfer condition (right after jacking)
Time after end of moist curing to
application of prestress, days1 3 5 7 10 20 30 60
Ksh 0.92 0.85 0.8 0.77 0.73 0.64 0.58 0.45
Tendon ES (%) CR (%) SH (%) RE (%) FS (%) FL (%) Total Loss (%)
1 6.6886 0.3623 3.78 0.5 3 4.3684 18.6993
2 5.0165 0.3623 3.78 0.5 3 4.3684 17.0271
3 3.3443 0.3623 3.78 0.5 3 4.3684 15.3550
4 1.6722 0.3623 3.78 0.5 3 4.3684 13.6828
5 0 0.3623 3.78 0.5 3 4.3684 12.0107

48
Elastic shortening and anchorage take-up loss will be occurred in this condition. Hence, Fo will be reduced by elastic shortening and slip anchorage loss.
2. Erection condition Fo value is same as Fo in jacking condition but with different moment as consequent of erection precast. Shock factor (1.2) impacts Fo that occurred.
3. Service condition All kind of load on slab work that makes some load combination, using moment in envelope combination. All losses include time dependent loss, use total loss of prestress to calculate Fo. Because of total loss is around 20%: = Fo x 120% = 3,688,800 N x 120% = 4,425,600 N
1. Transfer/jacking/initial condition: Fi = Fo x (1- (ES + FS+FL)) = 4,425,600 x (1-(0.07+0.03+4.4)) = 3,803,543N M = 8,100,000Nmm a. Top fiber stress: ft ≥ fc1
𝑓𝑡 =Fi
A±
M×yt
I
𝑓𝑡 = −3,803,543
7.5×10⁵ −8,100,000 ×125
1.17 x 10¹⁰
𝑓𝑡 = −5.071 − 0.864 𝑓𝑡 = −5.935 𝑀𝑃𝑎 ≥ fc1 = −30 MPa (OK) b. Bottom fiber stress: fb≤ ft1
𝑓𝑏 =Fi
A±
M×yb
I
𝑓𝑏 = −3,803,543
7.5×10⁵ +8,100,000 ×125
1.17 x 10¹⁰
𝑓𝑏 = −5.071 + 0.864

49
𝑓𝑏 = −4.207 𝑀𝑃𝑎 ≤ ft1 = 3.536MPa (OK) 2. Erection condition: Fi = Fo x (1- (ES + FS)) = 4,425,600 x (1-(0.67+0.3)) = 3,803,543kN M = 3,308,800Nmm a. Top fiber stress: ft ≥ fc1
𝑓𝑡 =Fi
A±
M×yt
I
𝑓𝑡 = −3,803,543
7.5×10⁵ −3,308,800×125
1.17 x 10¹⁰
𝑓𝑡 = −5.071 − 0.0353 𝑓𝑡 = −5.107 𝑀𝑃𝑎 ≤ fc1 = −30 MPa (OK) b. Bottom fiber stress: fb≤ ft1
𝑓𝑏 =Fi
A±
M×yb
I
𝑓𝑏 =3,803,543
7.5×10⁵ +3,308,800×125
1.17 x 10¹⁰
𝑓𝑏 = −5.730 + 0.864 𝑓𝑏 = −5.036 𝑀𝑃𝑎 ≤ ft1 = 3.536 MPa (OK) 3. Service condition: Fe = Fo x (1- (Total Loss)) = 4,425,600x (1-(0.187)) = 3,598,094kN M = 599,400,000 Nmm a. Top fiber stress: 𝑓𝑡 ≥ fc2
𝑓𝑡 =Fe
A±
M×yt
I
𝑓𝑡 =3,598,094
7.5×10⁵ −599,400,000×125
1.17 x 10¹⁰
𝑓𝑡 = −4.797 − 6.3936 𝑓𝑡 = −11.191𝑀𝑃𝑎 ≥ fc2 = −22.5 MPa (OK)
50
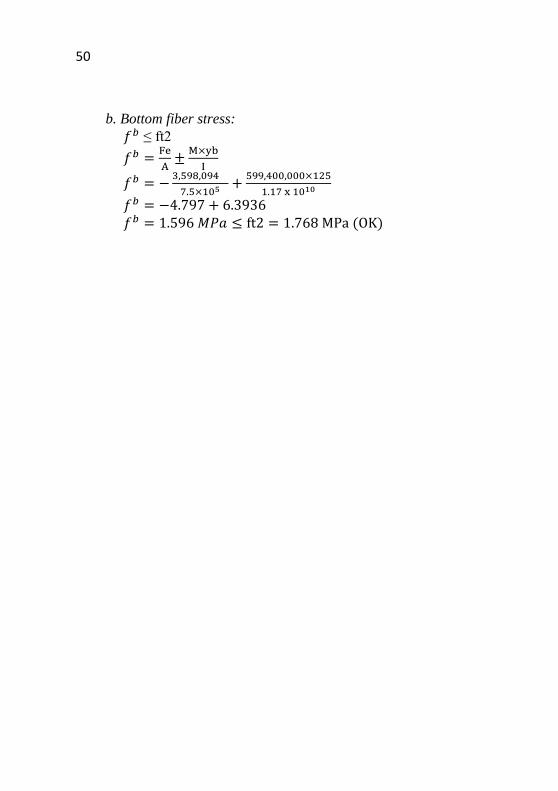
b. Bottom fiber stress: 𝑓𝑏 ≤ ft2
𝑓𝑏 =Fe
A±
M×yb
I
𝑓𝑏 = −3,598,094
7.5×10⁵ +599,400,000×125
1.17 x 10¹⁰
𝑓𝑏 = −4.797 + 6.3936 𝑓𝑏 = 1.596 𝑀𝑃𝑎 ≤ ft2 = 1.768 MPa (OK)

51 Top fiber
Table 4.11 Top fiber control
Bottom fiber
Table 4.12 Bottom fiber control
Condition Tendon Fo (N) Losses Fi or FeFo/A
(N/mm2)
My/I
(N/mm2)f top Permissible fc Permissible
Transfer Top 4,425,600 0.141 3,803,543 -5.071 -0.864 -5.935 -30 ft>fc1
Erection Top 4,425,600 0.141 3,803,543 -5.071 -0.0353 -5.107 -30 ft>fc1
Service Top 4,425,600 0.187 3,598,094 -4.797 -6.3936 -11.191 -22.5 ft>fc2
Condition Tendon Fo (N) Losses Fi or FeFo/A
(N/mm2)
My/I
(N/mm2)f bottom Permissible ft Permissible
Transfer Bottom 4,425,600 0.141 3,803,543 -5.071 0.864 -4.207 3.536 fb<ft1
Erection Bottom 4,425,600 0.141 3,803,543 -5.071 0.0353 -5.036 4 fb<ft1
Service Bottom 4,425,600 0.187 3,598,094 -4.797 6.3936 1.596 1.768 fb<ft2

52
4.8 Total Tendon Requirement Use the minimum Fo = 4,425,600N
Total strand (n) = F
%jacking ×𝑓𝑝𝑢×𝐴
= 4,425,600
0.8 ×1770×176.715
= 20.83 strands
≈ 25 strands
Total tendon (1 tendon = 5 strands) n = 25/5= 5 tendons
Distance between tendon = 300cm / 6 = 50cm
Figure 4.7Anchorage prestresstendon

53
4.9 Design Control 4.9.1 Punching Shear
As consequences of forklift: Slab = 3m x 6m Forklift = MHE MFD (Diesel) = Wheelbase = 2.25m x 2.25m = Load capacity = 8,160kg Critical area = 3.375m x 3.375m
Figure 4.8 Punching shear area
Shear ultimate: Vu = V x SF = 8,160kg x 1.5 = 12,240 kg Permissible shear: (basedon SNI 2847:2013 chap. 11.11.2.2)
Vc = (p
λ√f ′c + 0.3fpc) b0d + Vp
Pilecap
200cmx 200cm
Critical area
100cm x 100cm
critical area 3.375m x 3.375m wheel-base forklift 2.25m x 2.25m
slab 3m x 6m

54
where :
= Lx
Ly=
2
2= 1
λ = 1 (for normal weight concrete) bo = 4.s = 4 x 337.5 = 1350cm2 d = 15cm – 2.cover = 15-2(2.5) = 10 cm Vp = 39,960kg fpc = 47.97MPa
Vc = (1. √5000 + (0.3 × 47.97)1350 . 10 + 39.960
= 212,141 kg
Shear forces requirements ϕVc> Vu 0.75 (291,528) >12,240
218,646 kg> 12,240kg (OK) 4.10 Mild-Steel Reinforcement Moment in YZ direction will be resisted by mild-steel reinforcement while moment in XZ is resisted by prestresstendon. 4.10.1 Design Specification Concrete strength, f’c = 50 MPa Yield strength, fy = 420 MPa Slab thickness, hf = 250 mm Decking concrete, d = 25mm (based on SNI 2847:2013 chap 7.72, decking concrete d = 25mm)
Reinf.diameter, = 12 mm Lx = 6000 mm Ly = 3000 mmm dy = hf – d-1/2D = 250 – 25-1/2.12

55
= 219 mm
4.10.2 Stress Occurred Table 4.13 Element Forces in X Direction
Mild-steel reinforcement will be design to resist moment. The top reinforcement will resist negative moment from erection, and the bottom reinforcement will resist positive moment from service load.
4.10.3 Reinforcement Needed Calculation
Asϕ = 1
4× × D2 =
1
4× × 122 = 113.1mm2
(based on SNI 2857:2013 chap. 7.12.2.1) shrinkage = 0.0018 (for slab) (based on SNI 2857:2013 chap. 7.12.2.1) reduction factor for flexural reinforcement, ϕ = 0.9 4. 10.3.1 Reinforcement for Service (bottom) Mu = 14,985 kgm
Mn = Mu
ϕ=
14,985
0.9= 16,665kgm
Rn = Mn
1m×dy2 =16,665
1m×0.2192 = 3.472 × 10⁵ kg/m2
= 3.472 N/mm2
M+ M-
DL 2700 2025 -
D erection 1582.2 348.3 347.08
DL+LL 19980 14985 -
YZ Shear (kg)Moment (kg/m2)

56
perlu = 0.85×fc
fy(1 − √1 −
2𝑅𝑛
0.85×𝑓𝑐 )
= 0.85×50
350(1 − √1 −
2×3,472
0.85×50 )
= 9.912 x 10⁻⁷ (use min)
Asneed = shrinkage x 1m x dy = 0.0018 x 1m x 0.219m = 3.942 x 10⁻⁴ m2 = 3942 mm2 Total reinforcement:
n = Asneed
Asϕ=
394.2
113.1= 3.485
use 4 reinforcements Space of reinforcements:
n = 1m
4= 250𝑚𝑚
useD12 - 250mm 4. 9.3.2 Reinforcement for Erection (top)
Mu = 347.08 kgm
Mn = Mu
ϕ=
347.08
0.9= 385.644 kgm
Rn = Mn
1m×dy2 =385.644
1m×0.2192 = 8.041 × 10³ kg/m2
= 0.08041 N/mm2
perlu = 0.85×fc
fy(1 − √1 −
2𝑅𝑛
0.85×𝑓𝑐 )

57
= 0.85×50
350(1 − √1 −
2×0.08041
0.85×50 )
= 8.493 x 10⁻⁵ (use min)
Asneed = shrinkage x 1m x dy = 0.0018 x 1m x 0.219m = 3.942 x 10⁻⁴ m2 = 3942 mm2 Total reinforcement:
n = Asneed
Asϕ=
394.2
113.1= 3.485
use 4 reinforcements Space of reinforcements:
n = 1m
4= 250𝑚𝑚
useD12 - 250mm
Figure 4.9 Cross section of X direction
6m
125m
m
125m
m
D12 - 250mm
25mm
25mm

58
“This page is purposely blank”

59
CHAPTER 5 MACHINE FOUNDATION
5.1 Soil Investigation Analysis Soil investigation analysis was calculated based on data from Geotechnical Investigation Report.
With N correction: 1. Toward Groundwater (N’) according to Terzaghi& Peck : N’ = 15+0.5(N-15), for N>15 N’ = 1.25 for gravel or sandy gravel 2. Toward Soil Overburden Pressure (N2):
N2 = 4.N1
1+(0.4 .0) if
0≤ 7.5 𝑡𝑜𝑛/𝑚2
N2 = 4.N1
3.25+(1.4× 0 ) if
0≥ 7.5 𝑡𝑜𝑛/𝑚2
0 = vertical soil pressure at a depth which is reviewed. N2 value is should be ≤ 2N1, if the correction is obtained that N2> 2N1, use N2 = N1 (o = t x h)/m2 for silty clay 25 t/m2 for sandy silt 40 t/m2 for sand qp = Tegangandiujungtiang Ap = Section area pile Qs = qs x As
=𝛽 × (Ns
3+ 1) × As
Where: β = Shaft coefficient intermediate soils for driven pile = 1 Ns = SPT average for planted pile, boundary 3 ≤ N ≤ 50 As = Luasselimuttiangtertanam qs = Teganganakibatgesertiang Type of Pile:
Type d Ap
spunpile 0.3 0.070686
spunpile 0.4 0.125664
drivenpile 0.25 0.0625

60
Figure 5.1 Graphic of Allowable Bearing Capacity vs Depth
DEEP NSPTSPT
correctionSoil Discription Gs t (t/m3) ' o N2 N used
0.5 1 1 2.51 1.6 0.6 0.8 3.0303 1
1 2 2 2.51 1.6 0.6 1.6 4.87805 2
1.5 3 3 2.51 1.6 0.6 2.4 6.12245 3
2 4 4 2.51 1.6 0.6 3.2 7.01754 4
2.5 3.75 3.75 2.51 1.6 0.6 4 5.76923 3.75
3 3.5 3.5 2.51 1.6 0.6 4.8 4.79452 3.5
3.5 3.25 3.25 2.51 1.6 0.6 5.6 4.01235 3.25
4 3 3 2.51 1.6 0.6 6.4 3.37079 3
4.5 5 5 2.51 1.6 0.6 7.2 5.15464 5
5 7 7 2.51 1.6 0.6 8 6.66667 6.67
5.5 9 9 2.51 1.6 0.6 8.8 7.9646 7.96
6 11 11 2.51 1.6 0.6 9.6 9.09091 9.09
6.5 12 12 2.51 1.6 0.6 10.4 9.30233 9.30
7 13 13 2.51 1.6 0.6 11.2 9.48905 9.49
7.5 14 14 2.51 1.6 0.6 12 9.65517 9.66
8 16 15.5 2.51 1.6 0.6 12.8 10.4575 10.46
8.5 16.25 15.625 2.64 1.83 0.83 13.6 10.0932 10.09
9 16.5 15.75 2.64 1.83 0.83 14.4 9.76331 9.76
9.5 16.75 15.875 2.64 1.83 0.83 15.2 9.46328 9.46
10 17 16 2.64 1.83 0.83 16 9.18919 9.19
10.5 17.25 16.125 2.64 1.83 0.83 16.8 8.93782 8.94
11 17.5 16.25 2.64 1.83 0.83 17.6 8.70647 8.71
11.5 17.75 16.375 2.64 1.83 0.83 18.4 8.49282 8.49
12 18 16.5 2.64 1.83 0.83 19.2 8.29493 8.29
CLAY, greyish red spot while, soft,
medium plasticity
CLAY, brown spot white, soft
CLAY, yellowish brown, stiff,
medium plasticity
CLAY, grey spot yellow, very stiff.
Medium plasticity
CLAY, grey, hard
61
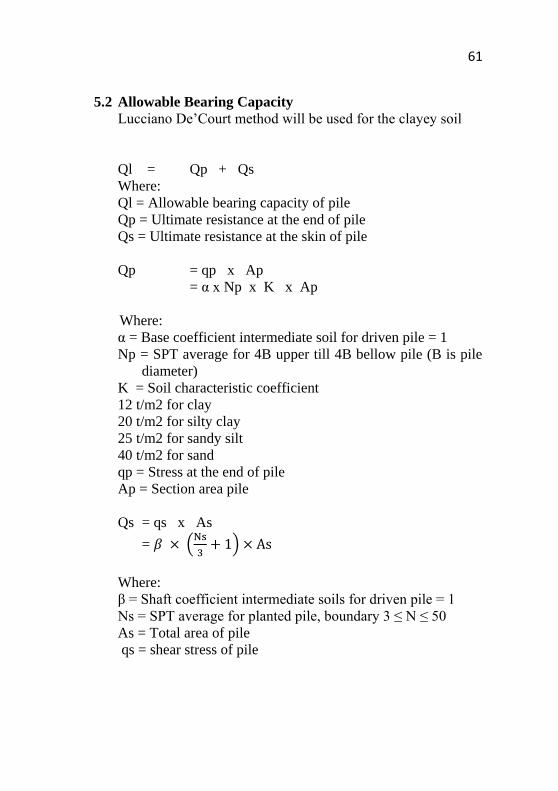
5.2 Allowable Bearing Capacity Lucciano De’Court method will be used for the clayey soil
Ql = Qp + Qs Where: Ql = Allowable bearing capacity of pile Qp = Ultimate resistance at the end of pile Qs = Ultimate resistance at the skin of pile
Qp = qp x Ap = α x Np x K x Ap Where: α = Base coefficient intermediate soil for driven pile = 1 Np = SPT average for 4B upper till 4B bellow pile (B is pile
diameter) K = Soil characteristic coefficient 12 t/m2 for clay 20 t/m2 for silty clay 25 t/m2 for sandy silt 40 t/m2 for sand qp = Stress at the end of pile Ap = Section area pile Qs = qs x As
= 𝛽 × (Ns
3+ 1) × As
Where: β = Shaft coefficient intermediate soils for driven pile = 1 Ns = SPT average for planted pile, boundary 3 ≤ N ≤ 50 As = Total area of pile qs = shear stress of pile

62
Table 5.2 Q allowable of Pile (diameter 30cm) D 0.3 m
Deep (m) NSPT N used Soil Discription K Np qp Qp (ton) Ns qs As Qs (ton) QL (ton) Qall (ton)
0 0 0 0 0 0 0 0 0 0 0 0 0 0
0.5 1 1 1.5 18 1.272 1 1.333 0.471 0.628 1.901 0.634
1 2 2 2.5 30 2.121 2 1.667 0.942 1.571 3.691 1.230
1.5 3 3 3.188 38.25 2.704 3 2.000 1.414 2.827 5.531 1.844
2 4 4 3.25 39 2.757 3.5 2.167 1.885 4.084 6.841 2.280
2.5 3.75 3.75 3.5 42 2.969 3.625 2.208 2.356 5.203 8.172 2.724
3 3.5 3.5 3.625 43.5 3.075 3.563 2.188 2.827 6.185 9.260 3.087
3.5 3.25 3.25 3.7 44.4 3.138 3.406 2.135 3.299 7.044 10.182 3.394
4 3 3 3.7 44.4 3.138 3.203 2.068 3.770 7.795 10.934 3.645
4.5 5 5 4.479 53.75 3.799 4.102 2.367 4.241 10.040 13.839 4.613
5 7 6.67 6.344 158.6109 11.212 5.384 2.795 4.712 13.170 24.381 8.127
5.5 9 7.96 7.605 190.1225 13.439 6.674 3.225 5.184 16.716 30.155 10.052
6 11 9.09 7.919 197.9731 13.994 7.883 3.628 5.655 20.513 34.507 11.502
6.5 12 9.30 9.1 227.5103 16.082 8.592 3.864 6.126 23.672 39.754 13.251
7 13 9.49 9.599 239.9749 16.963 9.041 4.014 6.597 26.479 43.442 14.481
7.5 14 9.66 9.799 391.9779 27.707 9.348 4.116 7.069 29.094 56.801 18.934
8 16 10.46 9.924 396.9491 28.059 9.903 4.301 7.540 32.428 60.487 20.162
8.5 16.25 10.09 9.886 395.4596 27.953 9.998 4.333 8.011 34.709 62.663 20.888
9 16.5 9.76 9.793 391.7317 27.690 9.881 4.294 8.482 36.419 64.109 21.370
9.5 16.75 9.46 9.489 379.5742 26.831 9.672 4.224 8.954 37.820 64.650 21.550
10 17 9.19 9.359 374.3549 26.462 9.431 4.144 9.425 39.052 65.513 21.838
10.5 17.25 8.94 8.958 358.3166 25.328 9.184 4.061 9.896 40.192 65.520 21.840
11 17.5 8.71 8.724 348.9699 24.667 8.945 3.982 10.367 41.280 65.947 21.982
11.5 17.75 8.49 8.608 344.3205 24.339 8.719 3.906 10.838 42.339 66.678 22.226
12 18 8.29 8.498 339.923 24.028 8.507 3.836 11.310 43.380 67.408 22.469
CLAY, greyish red spot while,
soft, medium plasticity
CLAY, brown spot white, soft
CLAY, yellowish brown, stiff,
medium plasticity
CLAY, grey spot yellow, very stiff.
Medium plasticity
CLAY, grey, hard
12
12
25
40
40

63
Table 5.3 Q allowable of Pile (diameter 40cm)
D 0.4 m
Deep (m) NSPT 15.66265 Soil Discription K Np qp Qp (ton) Ns qs As Qs (ton) QL (ton) Qall (ton)
0 0 0 0 0 0 0 0 0 0 0 0 0 0
0.5 1 1 1.5 18 2.262 1 1.333 0.628 0.838 3.100 1.033
1 2 2 2.292 27.5 3.456 2 1.667 1.257 2.094 5.550 1.850
1.5 3 3 2.464 29.571 3.716 3 2 1.885 3.770 7.486 2.495
2 4 4 2.929 35.143 4.416 3.5 2.167 2.513 5.445 9.862 3.287
2.5 3.75 3.75 3.214 38.571 4.847 3.625 2.208 3.142 6.938 11.785 3.928
3 3.5 3.5 3.643 43.714 5.493 3.563 2.188 3.770 8.247 13.740 4.580
3.5 3.25 3.25 4.167 50 6.283 3.406 2.135 4.398 9.392 15.675 5.225
4 3 3 4.733 56.796 7.137 3.203 2.068 5.027 10.393 17.531 5.844
4.5 5 5 5.496 65.952 8.288 4.102 2.367 5.655 13.386 21.674 7.225
5 7 6.67 6.325 158.123 19.870 5.384 2.795 6.283 17.560 37.430 12.477
5.5 9 7.96 7.216 180.406 22.670 6.674 3.225 6.912 22.288 44.959 14.986
6 11 9.09 8.695 217.370 27.315 7.883 3.628 7.540 27.351 54.667 18.222
6.5 12 9.30 8.947 223.665 28.107 8.592 3.864 8.168 31.563 59.670 19.890
7 13 9.49 9.436 235.903 29.644 9.041 4.014 8.796 35.305 64.950 21.650
7.5 14 9.66 9.477 379.080 47.637 9.348 4.116 9.425 38.792 86.429 28.810
8 16 10.46 9.746 389.850 48.990 9.903 4.301 10.053 43.238 92.228 30.743
8.5 16.25 10.09 9.677 387.065 48.640 9.998 4.333 10.681 46.279 94.919 31.640
9 16.5 9.76 9.651 386.054 48.513 9.881 4.294 11.310 48.559 97.072 32.357
9.5 16.75 9.46 9.516 380.633 47.832 9.672 4.224 11.938 50.426 98.258 32.753
10 17 9.19 9.235 369.406 46.421 9.431 4.144 12.566 52.069 98.490 32.830
10.5 17.25 8.94 8.978 359.130 45.130 9.184 4.061 13.195 53.589 98.719 32.906
11 17.5 8.71 8.847 353.8967 44.472 8.945 3.982 13.823 55.040 99.512 33.171
11.5 17.75 8.49 8.724 348.9699 43.853 8.719 3.906 14.451 56.452 100.305 33.435
12 18 8.29 8.608 344.320 43.269 8.507 3.836 15.080 57.841 101.109 33.703
CLAY, grey spot yellow, very stiff.
Medium plasticity40
CLAY, grey, hard 40
CLAY, greyish red spot while,
soft, medium plasticity12
CLAY, brown spot white, soft 12
CLAY, yellowish brown, stiff,
medium plasticity25

64
Table 5.4 Q allowable of Pile (S = 25cm)
S 0.25 m
Deep (m) NSPT 5.919662 Soil Discription K Np qp Qp (ton) Ns qs As Qs (ton) QL (ton) Qall (ton)
0 0 0 0 0 0 0 0 0 0 0 0 0 0
0.5 1 1 1.5 18 1.125 1 1.333 0.5 0.667 1.792 0.597
1 2 2 2.292 27.500 1.719 2 1.667 1 1.667 3.385 1.128
1.5 3 3 2.464 29.571 1.848 3 2 1.5 3 4.848 1.616
2 4 4 2.929 35.143 2.196 3.5 2.166667 2 4.333 6.530 2.177
2.5 3.75 3.75 3.214 38.571 2.411 3.625 2.208 2.5 5.521 7.932 2.644
3 3.5 3.5 3.643 43.714 2.732 3.563 2.188 3 6.563 9.295 3.098
3.5 3.25 3.25 4.167 50 3.125 3.406 2.135 3.5 7.474 10.599 3.533
4 3 3 4.733 56.796 3.550 3.203 2.068 4 8.271 11.821 3.940
4.5 5 5 5.496 65.952 4.122 4.102 2.367 4.5 10.652 14.774 4.925
5 7 6.666667 6.325 158.123 9.883 5.384 2.795 5 13.974 23.856 7.952
5.5 9 7.964602 7.216 180.406 11.275 6.674 3.225 5.5 17.736 29.012 9.671
6 11 9.090909 8.695 217.370 13.586 7.883 3.628 6 21.765 35.351 11.784
6.5 12 9.302326 8.947 223.665 13.979 8.592 3.864 6.5 25.117 39.096 13.032
7 13 9.489051 9.436 235.903 14.744 9.041 4.014 7 28.095 42.839 14.280
7.5 14 9.655172 9.477 379.080 23.693 9.348 4.116 7.5 30.870 54.562 18.187
8 16 10.45752 9.746 389.850 24.366 9.903 4.301 8 34.407 58.773 19.591
8.5 16.25 10.09317 9.677 387.065 24.192 9.998 4.333 8.5 36.828 61.019 20.340
9 16.5 9.763314 9.651 386.054 24.128 9.881 4.294 9 38.642 62.770 20.923
9.5 16.75 9.463277 9.516 380.633 23.790 9.672 4.224 9.5 40.128 63.917 21.306
10 17 9.189189 9.235 369.406 23.088 9.431 4.144 10 41.435 64.523 21.508
10.5 17.25 8.937824 8.978 359.130 22.446 9.184 4.061 10.5 42.645 65.090 21.697
11 17.5 8.706468 8.847 353.897 22.119 8.945 3.982 11 43.800 65.918 21.973
11.5 17.75 8.492823 8.724 348.970 21.811 8.719 3.906 11.5 44.923 66.734 22.245
12 18 8.294931 8.608 344.320 21.520 8.507 3.836 12 46.028 67.548 22.516
CLAY, greyish red spot while,
soft, medium plasticity
CLAY, brown spot white, soft
CLAY, yellowish brown, stiff,
medium plasticity
CLAY, grey spot yellow, very stiff.
Medium plasticity
CLAY, grey, hard
12
12
25
40
40

65
Figure 5.1 Graphic of Allowable Bearing Capacity vs Depth
0
20
40
60
80
100
120
0 0,5
1 1,5
2 2,5
3 3,5
4 4,5
5 5,5
6 6,5
7 7,5
8 8,5
9 9,5
10
10
,5
11
11
,5
12
Allo
wab
le B
ear
ing
Cap
acit
y (t
on
)
Deep (m)
Allowable Bearing Capacity vs Deep
QL (0.4)
QL (0.3)
Qs (0.4)
Qs (0.3)
Qall (0.3)
Qall (0.4)
Qs (0.25)
QL (0.25)
Qall (0.25)

66
5.3 Load and Load Combinations 5.3.1 Loading
Figure 5.2 Plan Side Machine Foundation
Dynamic forces work in section A-A
Figure 5.3 Cross Section A-A of Machine Foundation
A
A

67
a. Death Load - Concrete selfweight = 24kN/m3 x 24m x 12m x 1m = 6,912 kN
b. Live Load - Live Load = 25kN/m2 x 12m x 6m = 1,800kN c. Machine Load 1 & 2 - Machine self weight (V) = 110 kN - Horizontal Force (Hy) = 66 kN - Vertical Force (Hz) = 144 kN
5.3.2 Load Combination According to there are various approach to analyze load combinations, the normal operations will be used in this section (based on ACI 351 3R-04, Foundation for Dynamic Equipment).
1. Dead Load 2. Dead load + thermal load + machine forces + live loads +
wind + snow (thermal andsnow load are supposed to be zero, while wind load will be resisted by upper structure)
3. Dead load + thermal load + machine forces + seismic load + snow (thermal and snow load are supposed to be zero, seismic load will be resisted by upper structure)

68
5.3.3 Static Load Analysis
Table 5.5 Load Combination of Static Load
kN ton
Dead Load (D) 6912 691.2
Live Load (L) 1800 180
Machine Force (F1) 110 11
Machine Force (F2) 110 11
LoadingV
Combination 1 = D
FORCES (ton) DISTANCE (m) MOMENT (ton.m)
V Y Mx
Dead Load 1 691.2
691.2 0
Combination 2 = D+L+F
FORCES (ton) DISTANCE (m) MOMENT (ton.m)
V Y Mx
Dead Load 1 691.2
Live Load 1 180
Machine Force (F1) 1 11 3 33
Machine Force (F2) 1 11 -3 -33
893.2 0
Combination 3 = D+F
FORCES (ton) DISTANCE (m) MOMENT (ton.m)
V Y Mx
Dead Load 1 691.2
Machine Force (F1) 1 11 3 33
Machine Force (F2) 1 11 -3 -33
702.2 0
Total
Total
LOAD FACTOR
LOAD FACTOR
LOAD FACTOR
Total

69
5.3.4 Dynamic Load Analysis
Table 5.6 Load Combination of Dynamic Load (Both of Machine Work in the Same Direction)
kN ton kN ton kN ton
Dead Load (D) 6912 691.2
Live Load (L) 1800 180
Machine Force 1 (F1) 110 11 144 14.4 66 6.6
Machine Force 2 (F2) 110 11 144 14.4 66 6.6
LoadingV Hz Hy
Both of Machine Work ( in the same direction)
Combination 1 = D
V Hz Hy X Y Z Mx My
Dead Load 1 691.2
691.2 0 0
MOMENTFACTORLOAD
FORCES (ton)
Total
DISTANCE

70
Combination 2 = D+L+F
V Hz Hy X Y Z Mx My
Dead Load 1 691.2
Live Load (L) 1 180
Machine Force 1 (F1) 1 11 14.4 6.6 0 3 2 89.4
Machine Force 2 (F2) 1 11 14.4 6.6 0 -3 2 -63
893.2 28.8 13.2 26.4
Combination 3 = D+F
V Hz Hy X Y Z Mx My
Dead Load 1 691.2
Machine Force 1 (F1) 1 11 14.4 6.6 0 3 2 89.4 0
Machine Force 2 (F2) 1 11 14.4 6.6 0 -3 2 -63 0
713.2 28.8 13.2 26.4 0
MOMENT
LOAD FACTORFORCES (ton) MOMENT
LOAD FACTORFORCES (ton) DISTANCE
Total
Total
DISTANCE

71
Table 5.7 Load Combination of Dynamic Load (One of Machine Work)
One of Machine Works
Combination 1 = D
V Hz Hy X Y Z Mx My
Dead Load 1 691.2
691.2
Combination 2 = D+L+F
V Hz Hy X Y Z Mx My
Dead Load 1 691.2
Live Load (L) 1 180
Machine Force 1 (F1) 1 11 14.4 6.6 0 3 2 89.4 0
Machine Force 2 (F2) 1 11 0 0 0 -3 2 -33 0
893.2 28.8 13.2 56.4 0
Combination 3 = D+F
V Hz Hy X Y Z Mx My
Dead Load 1 691.2
Machine Force 1 (F1) 1 11 14.4 6.6 0 3 2 89.4 0
Machine Force 2 (F2) 1 11 0 0 0 -3 2 -33 0
713.2 28.8 13.2 26.4 0
DISTANCE
DISTANCE MOMENTFACTOR
MOMENT
Total
LOAD FACTORFORCES (ton) MOMENT
LOADFORCES (ton)
LOAD FACTORFORCES (ton)
DISTANCE
Total
Total

72
5.4 Pile Analysis a. Maximum load for every pile
𝑃𝑚𝑎𝑥 =V
n+
Mx×Ymax
Y2+
My×Xmax
X2
Where: Pmax = Maximum load for one pile Σ P = Total axial load occurred Mx = Moment in X direction My = Moment in Y direction Xmax = Absistiangpancangterjauhterhadapgaris beratkelilingtiang = 9.6 m Ymax = Ordinattiangpancangterjauhterhadapgaris beratkelilingtiang = 4 m X2
= Jumlahkuadratabsistiangpancangterhadap garisberatkelompoktiang = (8x2.42) + (8x4.82) + (8x7.22) + (8x9.62) = 1382.4m2 Y2 = Jumlahkuadratordinattiangpancangterhadap garisberatkelompoktiang = (18x22) + (18x42) = 360m2 n = total of pile = 48
b. Efficiency number:: Pb = 29,974.219 ton P1 = 33.703 ton Equation for efficiency:
= √Pb2
Pb2+nP12
= √29,974.2192
29,974.2192+(48×33.703)2
= 0.9985

73
Table 5.8 Q allowable (Qgroup)(B = 10.4m) Q group (B=10.4 m, L=21.4 m)
Deep (m) NSPT N used Soil Discription K Np qp Ap Qp Ns qs As Qs QL Qall
0 0 0 0 0 0 0 222.56 0 0 0 0 0 0 0
0.5 1 1 12 6.695 80.334 222.56 17879.19 1 1.333 31.8 42.400 17921.594 5973.865
1 2 2 12 6.836 82.034 222.56 18257.4 2 1.667 63.6 106.000 18363.402 6121.134
1.5 3 3 12 7.233 86.794 222.56 19316.89 3 2.000 95.4 190.800 19507.695 6502.565
2 4 4 12 7.233 86.794 222.56 19316.89 3.5 2.167 127.2 275.600 19592.495 6530.832
2.5 3.75 3.75 12 7.233 86.794 222.56 19316.89 3.625 2.208 159 351.125 19668.020 6556.007
3 3.5 3.5 12 7.503 90.034 222.56 20037.99 3.563 2.188 190.8 417.375 20455.362 6818.454
3.5 3.25 3.25 12 8.049 96.585 222.56 21496.02 3.406 2.135 222.6 475.344 21971.366 7323.789
4 3 3 12 8.489 101.869 222.56 22671.9 3.203 2.068 254.4 526.025 23197.923 7732.641
4.5 5 5 12 8.489 101.869 222.56 22671.9 4.102 2.367 286.2 677.489 23349.387 7783.129
5 7 6.666667 25 10.666 266.660 222.56 59347.85 5.384 2.795 318 888.716 60236.568 20078.856
5.5 9 7.964602 25 8.669 216.715 222.56 48232.17 6.674 3.225 349.8 1128.030 49360.204 16453.401
6 11 9.090909 25 8.922 223.043 222.56 49640.55 7.883 3.628 381.6 1384.271 51024.820 17008.273
6.5 12 9.302326 25 9.109 227.735 222.56 50684.74 8.592 3.864 413.4 1597.444 52282.188 17427.396
7 13 9.489051 25 9.109 227.735 222.56 50684.74 9.041 4.014 445.2 1786.850 52471.594 17490.531
7.5 14 9.655172 40 9.109 364.376 222.56 81095.59 9.348 4.116 477 1963.327 83058.918 27686.306
8 16 10.45752 40 9.183 367.326 222.56 81752.11 9.903 4.301 508.8 2188.305 83940.411 27980.137
8.5 16.25 10.09317 40 9.298 371.900 222.56 82770.13 9.998 4.333 540.6 2342.232 85112.364 28370.788
9 16.5 9.763314 40 9.375 375.007 222.56 83461.56 9.881 4.294 572.4 2457.625 85919.180 28639.727
9.5 16.75 9.463277 40 9.375 375.007 222.56 83461.56 9.672 4.224 604.2 2552.132 86013.687 28671.229
10 17 9.189189 40 9.375 375.007 222.56 83461.56 9.431 4.144 636 2635.281 86096.837 28698.946
10.5 17.25 8.937824 40 9.396 375.839 222.56 83646.84 9.184 4.061 667.8 2712.203 86359.041 28786.347
11 17.5 8.706468 40 9.609 384.379 222.56 85547.44 8.945 3.982 699.6 2785.652 88333.087 29444.362
11.5 17.75 8.492823 40 9.599 383.976 222.56 85457.71 8.719 3.906 731.4 2857.111 88314.820 29438.273
12 18 8.294931 40 9.772 390.885 222.56 86995.27 8.507 3.836 763.2 2927.382 89922.657 29974.219
CLAY, grey spot yellow, very stiff.
Medium plasticity
CLAY, grey, hard
CLAY, greyish red spot while, soft,
medium plasticity
CLAY, brown spot white, soft
CLAY, yellowish brown, stiff,
medium plasticity

74
Static Load Q allowable = QL pile x efficiency x 0.6 (reducing factor for static load)
Table 5.9 P max and Q allowable Comparing for Static Load
FORCES (ton)
V Mx My
Combination 1 691.2 0 0 14.400 0 0 14.400 20.1924
Combination 2 893.2 0 0 18.608 0 0 18.608 20.1924
Combination 3 702.2 0 0 14.629 0 0 14.629 20.1924
Q allowable
(D-0.4m)COMBO
MOMENT Pmax
(ton)ΣP/n
(Mx x Ymax) /
ΣY2
(My x Xmax) /
ΣX2

75
Static+Dynamic Load
Q allowable = QL pile x efficiency x 0.8 (reducing factor for static+dynamic load)
Table 5.10 P max and Q allowable Comparing for Static+Dynamic Load
Both of Machine Work (in the same direction)
Q allowable
V Hz Hy Mx My (D-0.4m)
Combination 1 691.2 0 0 0 0 14.40 0 0 14.40 26.9232
Combination 2 893.2 28.8 13.2 26.4 0 18.608 0.236 0 18.84 26.9232
Combination 3 713.2 28.8 13.2 26.4 0 14.858 0 0 15.09 26.9232
(My x Xmax)
/ ΣX2Pmax (ton)COMBO
FORCES (ton) MOMENTΣP/n
(Mx x Ymax)
/ ΣY2
One of Machine Works
Q allowable
V Hx Hy Mx My (D-0.4m)
Combination 1 691.2 0 0 0 0 14.40 0 0 14.40 26.9232
Combination 2 893.2 28.8 13.2 56.4 0 18.61 0.5036 0 19.1119 26.9232
Combination 3 713.2 28.8 13.2 26.4 0 14.86 0.2357 0 15.0940 26.9232
Pmax (ton)COMBOFORCES (ton) MOMENT
ΣP/n(Mx x Ymax)
/ ΣY2
(My x Xmax)
/ ΣX2

76
5.5 Control 5.5.1 Lateral Forces Analysis
Table 5.11 Brochure Pile of WIKA
Modulus subgrade reaction of lateral forces:
ks = 2 ×0.65
B√
EsB4
EpIp
12
×Es
1 − v2
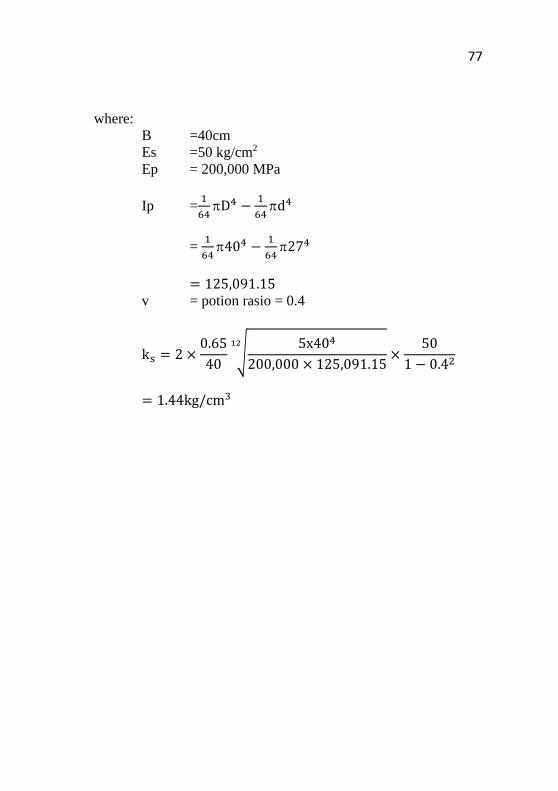
77
where:
B =40cm Es =50 kg/cm2 Ep = 200,000 MPa
Ip =1
64D4 −
1
64d4
= 1
64404 −
1
64274
= 125,091.15 v = potion rasio = 0.4
ks = 2 ×0.65
40√
5x404
200,000 × 125,091.15
12
×50
1 − 0.42
= 1.44kg/cm3

78
1 2 3 4 5 6 7 8
9 10 11 12 13 14 15 16
17 18 19 20 21 22 23 24
25 26 27 28 29 30 31 32
33 34 35 36 37 38 39 40
41 42 43 44 45 46 47 48

79
Lateral forces efficiency/reduction
nh = ks × = 1.44 x 0.64 = 0.9216cm3
where:
ks = 1.44
= efficiency/reduction modulus of pile group
= Total cumulative efficiency
n×Qall
= 1041.424
48×33.703= 0.64
= 64%
PileLatitude
Pile (%)P 1 pile
1 77.5 26.120
2 77.5 26.120
3 77.5 26.120
4 77.5 26.120
5 77.5 26.120
6 77.5 26.120
7 77.5 26.120
8 77.5 26.120
9 77.5 26.120
10 55 18.537
11 55 18.537
12 55 18.537
13 55 18.537
14 55 18.537
15 55 18.537
16 55 18.537
17 77.5 26.120
18 55 18.537
19 55 18.537
20 55 18.537
21 55 18.537
22 55 18.537
23 55 18.537
24 55 18.537
25 77.5 26.120
26 55 18.537
27 55 18.537
28 55 18.537
29 55 18.537
30 55 18.537
31 55 18.537
32 55 18.537
33 77.5 26.120
34 55 18.537
35 55 18.537
36 55 18.537
37 55 18.537
38 55 18.537
39 55 18.537
40 55 18.537
41 77.5 26.120
42 77.5 26.120
43 77.5 26.120
44 77.5 26.120
45 77.5 26.120
46 77.5 26.120
47 77.5 26.120
48 77.5 26.120

80
T = √Ep. Ip
nh
5
where: Ep = 200,000 MPa Ip =125,091.15cm4 nh =0.9216
T = √200,000 × 125,091.15
0.9216
5
= 122.1cm
M = (Am-0.93Bm) .Qq . T
where: Am = Table 6-2 (PondasiBebanDinamis chap VI) = 1 (right on surface) Bm = Table 6-1 (PondasiBebanDinamis chap VI) =1 (right on surface) Qq = 6ton + 6ton = 12 ton T = 122.1cm=1.22cm M = (Am-0.93Bm) .Qq . T = (1-(0.93x0)) x 12 x 1.22 = 1.025 tm
Compare moment: Mpile = 6.3 tm >Mlateral= 1.025 tm (OK) The value of M lateral is really small because it’s just machine
force without earthquake force. 5.5.2 Buckling check:
Ip
A2>
max2
4. nh. d. Ep

81
Ip = 125,091.15cm4
A = 1
4D2 =
1
4402 = 2,010,619cm2
max2 = (
P
A)2 = (
129000
.202 )2 = 10538kg.cm
nh = 0.9216 kg/cm3
d = 40cm Ep = 200,000 MPa
125,091.15
2,010,6192>
10,538
4 × 0.9216 × 40 × 200,000
0.0622 > 0.000357 (OK)
Because 0.0622 > 0.000357, the buckling will not happen

82
5.6 Pile Cap
Figure 5.4 Piling location of machine foundation

83
5.6.1 Punching Shear Control Punching shear of slab will be checked with thickness hf = 1m as consequence of pile loacation previous design. With the permissible stress: Punching Shear (as a consequence of pile)
Figure 5.5 Punching shear Shear ultimate: Vu = Qall x SF = 33.703 ton x 1.5 = 50.55 ton = 50,550 kg Permissible shear: (based on SNI 2847:2013 chap. 11.11.2.1)
Vc = 0.17( 1 + 2
𝛽 ) λ (√f′c)bod or
Vc = 0.33𝜆√𝑓′𝑐𝑏𝑜 𝑑
where,
= Lx
Ly=
24
12= 2
Critical area D=80cm
Pile d=40cm
12m
24m

84
λ = 1 (for normal weight concrete) bo= D2 = . 80=251.33cm2 d = 1m = 100cm
Vc = 0.17( 1 + 2
2 ) √5000 251.33 . 90
= 543,814 kg
Vc = 0.33√5000 251.33 . 90
= 527,819 kg Shear forces requirements ϕVc> Vu 0.75 (527,819) > 50,550 395.864 kg > 50,550kg (OK)
5.6.2 Design Specification Concrete strength, f’c = 30 MPa Yield strength, fy = 350 MPa Slab thickness, hf = 1m Decking concrete, d = 50mm (based on SNI 2847:2013 chap.7.7.3, d = 50 mm) Reinf.diameter, D = 25 mm Lx = 12m Ly = 24m dx = hf – d-(1/2)D = 1000 – 50-(1/2).25 = 938mm dy = hf – d –(3/2)D = 1000 – 50 – (3/2).25 = 913 mm

85
5.6.3 Stress Occurred
Figure 5.6 M11 for reinforcement
Figure 5.7 M11 for reainforcement

86
Table 5.11 Element forces of slab with envelope combination
5.6.4 Reinforcement Needed Calculation
AsD = 1
4× × D2 =
1
4× × 252 = 490.9mm2
(based SNI 2847:2013 chap. 10.2.7.3) (based on SNI 2857:2013 chap. 7.12.2.1) shrinkage = 0.0018 (based on SNI 2857:2013 chap. 7.12.2.1) reduction factor of reinforcement, ϕ = 0.9 5.6.4.1 Reinforcement for X direction (M11) a. Positive Moment (Top) Mu = 2,043.31kgm
Mn = Mu
ϕ=
2,043.31
0.9= 2,279 kgm
Rn = Mn
1m×dx2 =2,279
1m×0.9382 = 2.583 × 10³ kg/m2
= 0.02583 N/mm2
M11 M22 V13 V23
Envelope -7648.71 -1573.07 -3155.61 -398
Envelope -7498.45 -768.88 -3155.92 -398
Envelope -3737.92 -768.76 -1542.14 -194.5
Envelope -3664.49 -375.75 -1542.3 -194.5
Envelope 924.68 118.45 -3155.61 -398.19
Envelope 998.57 511.64 -3155.92 -398.19
Envelope 1892.12 242.38 -1542.14 -194.59
Envelope 2043.31 1046.94 -1542.3 -194.59
CombinationMoment (kgm) Shear (kg)

87
perlu = 0.85×fc
fy(1 − √1 −
2𝑅𝑛
0.85×𝑓𝑐 )
= 0.85×30
350(1 − √1 −
2×0.02583
0.85×30 )
= 7.384 x 10⁻⁵ (use min)
Asneed = susut x 1m x dx = 0.0018 x 1m x 0.938m = 1.688 x 10⁻³ m2 = 1688 mm2 Total reinforcement:
n = Asneed
AsD=
1688
490.9= 3.438 (use 4 reinf.)
s = 1m
n= 250mm
useD25-250mm b. Negative Moment(bottom) Mu = 7,648.71 kgm
Mn = Mu
ϕ=
7.648.71
0.9= 8,499 kgm
Rn = Mn
1m×dx2 =8,499
1m×0.92 = 1.049 × 10⁴ kg/m2
= 0.01049 N/mm2
perlu = 0.85×fc
fy(1 − √1 −
2𝑅𝑛
0.85×𝑓𝑐 )
= 0.85×30
350(1 − √1 −
2×0.01049
0.85×30 )
= 3.066 x 10⁻⁴ (use min)
Asneed = susut x 1m x dx = 0.0018 x 1m x 0.938m = 1.688 x 10⁻³ m2

88
= 1688 mm2 Total reinforcement:
n = Asneed
AsD=
1688
490.9= 3.438 (use 4 reinf.)
s = 1m
n= 250mm
useD25-250mm 5.6.4.2 Reinforcement for Y direction (M22) a. Positive Moment (Top) Mu = 1,046.94kgm
Mn = Mu
ϕ=
1,046.94
0.9= 1,163kgm
Rn = Mn
1m×dy2 =1,163
1m×0.9132 = 1.387 × 10³ kg/m2
= 0.001387/mm2
perlu = 0.85×fc
fy(1 − √1 −
2𝑅𝑛
0.85×𝑓𝑐 )
= 0.85×30
350(1 − √1 −
2×0.00161
0.85×30 )
= 4.591 x 10⁻⁵(use min)
Asneed = susut x 1m x dx = 0.0018 x 1m x 0.913m = 1.642 x 10⁻³ m2 = 1642 mm2 Total reinforcement:
n = Asneed
AsD=
1642
490.9= 3.346 (use 4 reinf.)
s = 1m
n= 250mm
useD25-250mm

89
b. Negative Moment(bottom) Mu = 1,573.07kgm
Mn = Mu
ϕ=
1,573.07
0.9= 1748 kgm
Rn = Mn
1m×dy2 =1748
1m×0.852 = 2.158 × 10³ kg/m2
= 0.02158 N/mm2
perlu = 0.85×fc
fy(1 − √1 −
2𝑅𝑛
0.85×𝑓𝑐 )
= 0.85×30
350(1 − √1 −
2×0.002158
0.85×30 )
= 0.00004375 (use min)
Asneed = susut x 1m x dx = 0.0018 x 1m x 0.913m = 1.642 x 10⁻³ m2 = 1642 mm2 Total reinforcement:
n = Asneed
AsD=
1642
490.9= 3.346 (use 4 reinf.)
s = 1m
n= 250mm
useD25-250mm

90
“This page is purposely blank”

91
91
CHAPTER 6 COLUMN FOUNDATION
6.1. Soil Investigation Analysis Soil investigation analysis was calculated based on data from Geotechnical Investigation Report.
With N correction: 1. Toward Groundwater (N’) according to Terzaghi& Peck : N’ = 15+0.5(N-15), for N>15 N’ = 1.25 for gravel or sandy gravel 2. Toward Soil Overburden Pressure (N2):
N2 = 4.N1
1+(0.4 .0) if
0≤ 7.5 𝑡𝑜𝑛/𝑚2
N2 = 4.N1
3.25+(1.4× 0 ) if
0≥ 7.5 𝑡𝑜𝑛/𝑚2
0 = vertical soil pressure at a depth which is reviewed. N2 value is should be ≤ 2N1, if the correction is obtained that N2> 2N1, use N2 = N1 (o = t x h)/m2 for silty clay 25 t/m2 for sandy silt 40 t/m2 for sand qp = Tegangandiujungtiang Ap = Section area pile Qs = qs x As
=𝛽 × (Ns
3+ 1) × As
Where: β = Shaft coefficient intermediate soils for driven pile = 1 Ns = SPT average for planted pile, boundary 3 ≤ N ≤ 50 As = Luasselimuttiangtertanam qs = Teganganakibatgesertiang

92
Table 6.1 Soil Investigation and N used of BH-13 DEEP NSPT N1 Soil Discription Gs t (t/m3) ' o N2 N used
0.5 5 5 2.54 1.8 0.8 0.9 14.706 5
1 7 7 2.54 1.8 0.8 1.8 16.279 7
1.5 9 9 2.54 1.8 0.8 2.7 17.308 9
2 12 12 2.54 1.8 0.8 3.6 19.672 12
2.5 13 13 2.54 1.8 0.8 4.5 18.571 13
3 14 14 2.54 1.8 0.8 5.4 17.722 14
3.5 15 15 2.54 1.8 0.8 6.3 17.045 15
4 16 15.5 2.54 1.8 0.8 7.2 16.495 15.5
4.5 16 15.5 2.54 1.8 0.8 8.1 15.094 15.094
5 16 15.5 2.54 1.8 0.8 9 13.913 13.91
5.5 17 16 2.54 1.8 0.8 9.9 13.710 13.71
6 17 16 2.54 1.8 0.8 10.8 12.782 12.78
6.5 19 17 2.53 1.81 0.81 11.7 13.380 13.38
7 20 17.5 2.53 1.81 0.81 12.6 13.245 13.25
7.5 22 18.5 2.53 1.81 0.81 13.5 13.750 13.75
8 24 19.5 2.53 1.81 0.81 14.4 14.201 14.20
8.5 20 17.5 2.53 1.81 0.81 15.3 11.236 11.24
9 18 16.5 2.53 1.81 0.81 16.2 9.626 9.63
9.5 15 15 2.53 1.81 0.81 17.1 7.653 7.65
10 13 14 2.53 1.81 0.81 18 6.341 6.34
10.5 12 13.5 2.53 1.81 0.81 18.9 5.607 5.61
11 11 13 2.53 1.81 0.81 19.8 4.933 4.93
11.5 10 12.5 2.53 1.81 0.81 20.7 4.310 4.31
12 9 12 2.53 1.81 0.81 21.6 3.734 3.73
12.5 12 13.5 2.53 1.81 0.81 22.5 4.800 4.80
13 14 14.5 2.53 1.81 0.81 23.4 5.405 5.41
13.5 16 15.5 2.53 1.81 0.81 24.3 5.970 5.97
14 19 17 2.53 1.81 0.81 25.2 6.859 6.86
CLAY, grey, stiff, high plasticity
CLAY, yellowish grey red stiff
Silty SAND with gravel, greyish brown,
medium, dense
Sandy CLAY, brownish yellow grey, very
stiff

93
6.2. Allowable Bearing Capacity of Pile LuccianoDe’Court method will be used for the clayey soil
Ql = Qp + Qs where: Qp = qp x Ap = α x Np x K x Ap Qs = qs x As
= 𝛽 × (Ns
3+ 1) × As
There are some diameters pile will be used for column foundation for interior and exterior column. Table 6.2 and Table 6.3shows the allowable bearing capacity of pile with diameter 20cm and 30cm. And there are graphics that illustrate comparison of shear, end bearing capacity and maximum force that can be resisted. Diameter and end-bearing area of pile:
Type D (m) Ap
spunpile 0.2 0.031416
spunpile 0.3 0.070686

94
Table 6.2 Allowable Bearing Capacity of Pile D-25cm
DEEP NSPT N used Soil Discription K Np qp Qp Ns qs As Qs QL Qall
0 0 0 0 0 0 0 0 0 0 0 0 0
0.5 5 5 12 4 48 1.508 5 2.667 0.314 0.838 2.346 0.782
1 7 7 12 8 96 3.016 6 3.000 0.628 1.885 4.901 1.634
1.5 9 9 12 10.25 123 3.864 7.5 3.500 0.942 3.299 7.163 2.388
2 12 12 25 12.000 300 9.425 9.75 4.250 1.257 5.341 14.765 4.922
2.5 13 13 25 12.6 315 9.896 11.375 4.792 1.571 7.527 17.423 5.808
3 14 14 25 13.9 347.5 10.917 12.6875 5.229 1.885 9.857 20.774 6.925
3.5 15 15 25 14.375 359.375 11.290 13.84375 5.615 2.199 12.347 23.637 7.879
4 16 15.5 40 14.70148 588.0591 18.474 14.67188 5.891 2.513 14.805 33.279 11.093
4.5 16 15.09434 40 14.70148 588.0591 18.474 14.88311 5.961 2.827 16.854 35.329 11.776
5 16 13.91304 40 14.554 582.1706 18.289 14.39808 5.799 3.142 18.219 36.509 12.170
5.5 17 13.71 40 13.776 551.0344 17.311 14.05388 5.685 3.456 19.645 36.956 12.319
6 17 12.78 40 13.406 536.2399 16.846 13.41792 5.473 3.770 20.631 37.478 12.493
6.5 19 13.38 40 13.463 538.5333 16.919 13.3991 5.466 4.084 22.325 39.244 13.081
7 20 13.25 40 13.5 538.8676 16.929 13.32207 5.441 4.398 23.929 40.858 13.619
7.5 22 13.75 40 13.162 526.4996 16.540 13.53603 5.512 4.712 25.975 42.515 14.172
8 24 14.20 40 12.412 496.4627 15.597 13.86861 5.623 5.027 28.264 43.860 14.620
8.5 20 11.24 40 12.203 488.1281 15.335 12.55228 5.184 5.341 27.687 43.022 14.341
9 18 9.63 40 9.811 392.4587 12.329 11.08898 4.696 5.655 26.557 38.887 12.962
9.5 15 7.65 25 8.093 202.3181 6.356 9.371018 4.124 5.969 24.614 30.970 10.323
10 13 6.34 25 6.832 170.802 5.366 7.856241 3.619 6.283 22.737 28.103 9.368
10.5 12 5.61 25 6.412 160.2948 5.036 6.731859 3.244 6.597 21.401 26.437 8.812
11 11 4.93 25 4.985 124.6323 3.915 5.832297 2.944 6.912 20.348 24.264 8.088
11.5 10 4.31 25 4.677 116.925 3.673 5.071321 2.690 7.226 19.440 23.114 7.705
12 9 3.73 25 4.444 111.1095 3.491 4.40288 2.468 7.540 18.605 22.096 7.365
12.5 12 4.80 25 4.844 121.1017 3.805 4.60144 2.534 7.854 19.901 23.705 7.902
13 14 5.405405 25 5.354 133.846 4.205 5.003423 2.668 8.168 21.791 25.996 8.665
13.5 16 5.970149 40 5.354 214.1536 6.728 5.486786 2.829 8.482 23.996 30.724 10.241
14 19 6.859206 40 5.354 214.1536 6.728 6.172996 3.058 8.796 26.897 33.624 11.208
CLAY, yellowish grey red stiff
Silty SAND with gravel,
greyish brown, medium,
dense
Sandy CLAY, brownish yellow
grey, very stiff
CLAY, grey, stiff, high
plasticity

95
Figure 6.1 Graphic of Allowable Bearing Capacity Pile D-25cm

96
Table 6.3 Allowable Bearing Capacity of Pile D-30cm
DEEP NSPT N used Soil Discription K Np qp Qp Ns qs As Qs QL Qall
0 0 0 0 0 0 0 0 0 0 0 0 0
0.5 5 5 12 4 48 3.393 5 2.667 0.314 0.838 4.231 1.410
1 7 7 12 8 96 6.786 7 3.333 0.628 2.094 8.880 2.960
1.5 9 9 12 10.25 123 8.694 9 4.000 0.942 3.770 12.464 4.155
2 12 12 25 12.000 300 21.206 12 5.000 1.257 6.283 27.489 9.163
2.5 13 13 25 12.6 315 22.266 13 5.333 1.571 8.378 30.644 10.215
3 14 14 25 13.9 347.5 24.563 14 5.667 1.885 10.681 35.245 11.748
3.5 15 15 25 14.375 359.375 25.403 15 6.000 2.199 13.195 38.597 12.866
4 16 15.5 40 14.70148 588.0591 41.567 15.5 6.167 2.513 15.499 57.066 19.022
4.5 16 15.09434 40 14.70148 588.0591 41.567 15.09434 6.031 2.827 17.054 58.621 19.540
5 16 13.91304 40 14.554 582.1706 41.151 13.91304 5.638 3.142 17.711 58.863 19.621
5.5 17 13.71 40 13.776 551.0344 38.950 13.70968 5.570 3.456 19.248 58.198 19.399
6 17 12.78 40 13.406 536.2399 37.905 12.78195 5.261 3.770 19.832 57.737 19.246
6.5 19 13.38 40 13.463 538.5333 38.067 13.38028 5.460 4.084 22.299 60.366 20.122
7 20 13.25 40 13.5 538.8676 38.090 13.24503 5.415 4.398 23.816 61.907 20.636
7.5 22 13.75 40 13.162 526.4996 37.216 13.75 5.583 4.712 26.311 63.527 21.176
8 24 14.20 40 12.412 496.4627 35.093 14.20118 5.734 5.027 28.821 63.914 21.305
8.5 20 11.24 40 12.203 488.1281 34.504 11.23596 4.745 5.341 25.343 59.847 19.949
9 18 9.63 40 9.811 392.4587 27.741 9.625668 4.209 5.655 23.799 51.540 17.180
9.5 15 7.65 25 8.093 202.3181 14.301 7.653061 3.551 5.969 21.196 35.497 11.832
10 13 6.34 25 6.832 170.802 12.073 6.341463 3.114 6.283 19.565 31.638 10.546
10.5 12 5.61 25 6.412 160.2948 11.331 5.607477 2.869 6.597 18.929 30.259 10.086
11 11 4.93 25 4.985 124.6323 8.810 4.932735 2.644 6.912 18.276 27.085 9.028
11.5 10 4.31 25 4.677 116.925 8.265 4.310345 2.437 7.226 17.607 25.872 8.624
12 9 3.73 25 4.444 111.1095 7.854 3.73444 2.245 7.540 16.925 24.779 8.260
12.5 12 4.80 25 4.282 107.0399 7.566 4.8 2.600 7.854 20.420 27.987 9.329
13 14 5.405405 25 5.354 133.846 9.461 5.405405 2.802 8.168 22.886 32.347 10.782
13.5 16 5.970149 40 5.354 214.1536 15.138 5.970149 2.990 8.482 25.362 40.500 13.500
14 19 6.859206 40 5.354 214.1536 15.138 6.859206 3.286 8.796 28.909 44.046 14.682
Silty SAND with gravel,
greyish brown, medium,
dense
Sandy CLAY, brownish yellow
grey, very stiff
CLAY, grey, stiff, high
plasticity
CLAY, yellowish grey red stiff

97
Figure 6.2 Graphic of Allowable Bearing Capacity Pile D-30cm

98
6.3. Stress Distribution of Column Stress distribution should be analyzed to get part of the floor dead load of precast that will be resisted by pile cap.
Figure 6.3 Estimation of Stress Distribution from Precast
From the picture, coordinate of stress precast was gotten: x = 1.5 m; y = 3 m z = 0.5 m (thickness of pile cap)
m = x
z=
1.5
0.5= 3 ; n =
y
z=
3
0.5= 6

99
Figure 6.4 Graphic I factor for distributed area load

100
From the graphic, faktorpengaruh I is gotten = 0.155, because there are 4 precast, so I total = I x 4 = 0.155*4 = 0.62 Finally, the floor dead load could be calculated:
FD = Itotal × V × concrete
FD = 0.62 × (6 × 3 × 0.25) × 2400
FD = 6696 kN = 6.696 ton 6.4. Load and Load Combination Analyzing of load and load combination are differences by two types of column, interior and exterior column. The columns are steel structure with the internal forces that had been calculated by consultant. The foundation, include pile cap and pile, will be calculated without approximating the strength of steel, steel strength is supposed strong enough to resist forces without failed. There are some load combinations according to SNI, but the factor won’t be used to calculate the pile:
1. D 2. D+L+R 3. D+R+W 4. D+W+L+R 5. D+E+R 6. D+W 7. D+E
6.4.1. Interior Column Theinterior column that will be analyzed is column in grid E-10 as shown in Table 6.4.

101
Table 6.4 Output Forces of Interior Column
Not all loads will be used from Table 6.4. Some loading (with yellow line) will be needed for calculating, because not all forces will happen at the same time.
Load Type Desc. Hx Vy
D Frm 0.55 65.05
FD Frm -0.13 -0.22
CG Frm 1.12 73.18
W1> Frm -4.54 -43.22
<W1 Frm 6.15 -22.15
W2> Frm -0.83 -37.98
<W2 Frm -0.83 -37.98
CU Frm - -
R Frm -0.18 53
L Frm -0.18 -0.31
WP Frm - -
WB1> Brc - -0.09
<WB1 Brc - -
WB2> Brc - -0.14
<WB2 Brc - -
E> Frm -25.8 -37.64
EG+ Frm - 23.78
<E Frm 25.73 37.52
EG- Frm - -23.78
EB> Brc -0.16 -0.1
<EB Brc 0.09 -0.14
Anchor Rod Qty/Diam. (mm)
Column Base Elev.
Interior Column
96435
E-10
330 X 330
20
4 - 24.0
-425
Type
X-Loc
Grid1 - Grid2
Base Plate W x L (mm)
Base Plate Thickness (mm)

102
Table 6.5 The Used Loads for Design Foundation of Interior Column
Table 6.6(a) Load Combination 1
Table 6.6(b) Load Combination 2
kN ton kN ton
Dead Load (D) 65.05 6.505 7.37 0.737
Floor Dead Load (FD) 66.96 6.696
Live Load (L) 0.31 0.031 0.18 0.018
Rain Load ( R) 53 5.3 0.18 0.018
Wind Load (W) 0.14 0.014
Earthquake Load (E) 37.64 3.764 25.8 2.58
LoadingV Hx
Combination 1 = D
DISTANCE MOMENT
V Hx Y Mx
Dead Load 1 6.505 0.737 0.5 0.3685
Floor Dead Load (FD) 1 6.696
13.201 0.3685
LOAD FACTOR
Total
FORCES (ton)
Combination 2 = D+L+R
DISTANCE MOMENT
V Hx Y Mx
Dead Load 1 6.505 0.737 0.5 0.3685
Floor Dead Load (FD) 1 6.696
Live Load 1 0.031
Rain Load 1 5.3 0.018 0.5 0.009
18.532 0.755 0.009
FORCES (ton)LOAD FACTOR
Total

103
Table 6.6(c) Load Combination 3
Table 6.6(d) Load Combination 4
Table 6.6(e) Load Combination 5
Combination 3 = D+R+W
DISTANCE MOMENT
V Hx Y Mx
Dead Load 1 6.505 0.737 0.5 0.3685
Floor Dead Load (FD) 1 6.696
Rain Load 1 5.3 0.018 0.5 0.009
Wind Load 1 0.014
18.515 0.755 0.3775
FORCES (ton)FACTOR
Total
LOAD
Combination 4 = D+W+L+R
DISTANCE MOMENT
V Hx Y Mx
Dead Load 1 6.505 0.737 0.5 0.3685
Floor Dead Load 1 6.696
Wind Load 1 0.014
Live Load 1 0.031
Rain Load 1 5.3 0.018 0.5 0.009
18.546 0.755 0.3775
FORCES (ton)
Total
LOAD FACTOR
Combination 5 = D+E+L
DISTANCE MOMENT
V Hx Y Mx
Dead Load 1 6.505 0.737 0.5 0.3685
Floor Dead Load (FD) 1 6.696
Earthquake 1 3.764 2.58 0.5 1.29
Live Load 1 0.031
16.996 3.317 1.6585
FORCES (ton)
Total
LOAD FACTOR

104
Table 6.6(f) Load Combination 6
Table 6.6(g) Load Combination 7
6.4.2. Exterior Column The exterior column that will be analyzed is column in grid E-10 as shown in Table 6.7.
Combination 6 = D+W
DISTANCE MOMENT
V Hx Y Mx
Dead Load 1 6.505 0.737 0.5 0.3685
Floor Dead Load (FD) 1 6.696
Wind Load 1 0.014
13.215 0.737 0.3685
FORCES (ton)
Total
LOAD FACTOR
Combination 7 = D+E
DISTANCE MOMENT
V Hx Y Mx
Dead Load 1 6.505 0.737 0.5 0.3685
Floor Dead Load (FD) 1 6.696
Earthquake 1 3.764 2.58 0.5 1.29
16.965 3.317 1.6585
FORCES (ton)
Total
LOAD FACTOR

105
Table 6.7Output Forces of Exterior Column
Load Type Desc. Hx Vy
D Frm 5.82 22.03
FD Frm - -
CG Frm 26.65 80.3
W1> Frm -10.5 -9.61
<W1 Frm 3.08 -5.65
W2> Frm -0.89 -8.68
<W2 Frm -0.89 -8.68
CU Frm - -
R Frm 4.22 12.49
L Frm - -
WP Frm - -
WB1> Brc -0.2 18.41
<WB1 Brc 0.3 -18.05
WB2> Brc -0.32 29.09
<WB2 Brc 0.51 -30.14
E> Frm -38.24 -26.44
EG+ Frm 5.19 16.16
<E Frm 38.11 26.42
EG- Frm -5.19 -16.16
EB> Brc -1.79 164.2
<EB Brc 2.72 -161.08
Type
X-Loc
Grid1 - Grid2
Base Plate W x L (mm)
Base Plate Thickness (mm)
Anchor Rod Qty/Diam. (mm)
Column Base Elev.
Exterior Column
0
L-2
280 X 431
20
4 - 24.0
-425
Hz
-
-
-
-
-
-
-
-
-
-
-
-
8.64
-
14.41
-
-
-
-
-0.13
77.31

106
It’s same as the previous loading. Some loading (with yellow line) will be needed for calculating, because not all forces will happen at the same time as shown in Table 6.8. The load combination will be shown in Table 6.9(a) till Table 6.9(g).
Table 6.8 The Used Loads for Design Foundation of Exterior Column
Table 6.9(a) Load Combination 1
Table 6.9(b) Load Combination 2
kN ton kN ton kN ton
Dead Load (D) 22.03 2.203 5.82 0.582
Floor Dead Load (FD) 66.96 6.696
Live Load (L) 0 0
Rain Load ( R) 12.49 1.249 12.49 1.249
Wind Load (W) 30.14 3.014 0.51 0.051 14.41 1.441
Earthquake Load (E) 161.08 16.108 2.72 0.272 77.31 7.731
LoadingV Hx Hz
Combination 1 = D
DISTANCE MOMENT
V Hx Hz Y Mx
Dead Load 1 2.203 0.582 0.5 0.291
Floor Dead Load 1 6.696
8.899 0.291
FORCES (ton)LOAD FACTOR
Total
Combination 2 = D+L+R
DISTANCE MOMENT
V Hx Hz Y Mx
Dead Load 1 2.203 0.582 0.5 0.291
Floor Dead Load 1 6.696
Live Load 1 0
Rain Load 1 1.249 1.249 0.5 0.6245
10.148 1.831 0.6245
LOAD FACTOR
Total
FORCES (ton)

107
Table 6.9(c) Load Combination 3
Table 6.9(d) Load Combination 4
Table 6.9(e) Load Combination 5
Combination 3 = D+R+W
DISTANCE MOMENT
V Hx Hz Y Mx
Dead Load 1 2.203 0.582 0.5 0.291
Floor Dead Load 1 6.696
Rain Load 1 1.249 1.249 0.5 0.6245
Wind Load 1 3.014 0.051 1.441 0.5 0.746
13.162 1.882 1.441 1.6615
LOAD FACTORFORCES (ton)
Total
Combination 4 = D+W+L+R
DISTANCE MOMENT
V Hx Hz Y Mx
Dead Load 1 2.203 0.582 0.5 0.291
Floor Dead Load 1 6.696
Wind Load 1 3.014 0.051 1.441 0.5 0.746
Live Load 1 0
Rain Load 1 1.249 1.249 0.5 0.6245
13.162 1.882 1.441 1.6615
FORCES (ton)LOAD FACTOR
Total
Combination 5 = D+E+L
DISTANCE MOMENT
V Hx Hz Y Mx
Dead Load 1 2.203 0.582 0.5 0.291
Floor Dead Load 1 6.696
Earthquake 1 16.108 0.272 1.441 0.5 0.8565
Live Load 1 0
25.007 0.854 1.441 1.1475
LOAD FACTORFORCES (ton)
Total
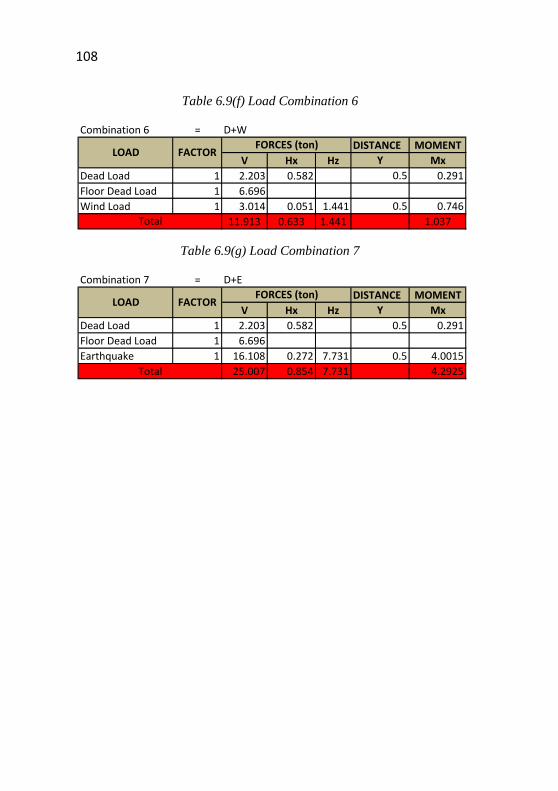
108
Table 6.9(f) Load Combination 6
Table 6.9(g) Load Combination 7
Combination 6 = D+W
DISTANCE MOMENT
V Hx Hz Y Mx
Dead Load 1 2.203 0.582 0.5 0.291
Floor Dead Load 1 6.696
Wind Load 1 3.014 0.051 1.441 0.5 0.746
11.913 0.633 1.441 1.037
FORCES (ton)LOAD FACTOR
Total
Combination 7 = D+E
DISTANCE MOMENT
V Hx Hz Y Mx
Dead Load 1 2.203 0.582 0.5 0.291
Floor Dead Load 1 6.696
Earthquake 1 16.108 0.272 7.731 0.5 4.0015
25.007 0.854 7.731 4.2925
FORCES (ton)
Total
LOAD FACTOR

109
6.5 Pile Analysis Pile analysis differences by interior and exterior column. The design of both pile are different based on the loading as seen in Figure 6.5 and Figure 6.6. The comparison between the real load and the design are checked in Table 6.10 and Table 6.11. 6.5.1 Interior Column For the interior column, pile with diameter, d = 25cm will be used.
Figure 6.5 Pile Cap for Interior Column
pile cap = 2m x 2m t pile cap = 50 cm type pile = spun pile d pile = 25cm
a. Load of one pile:
𝑃𝑚𝑎𝑥 =V
n+
Mx×Ymax
Y2+
My×Xmax
X2
Where: Pmax = Maximum load for one pile Σ P = Total axial load occurred Mx = Moment in X direction My = Moment in Y direction Xmax = 0.5 m Ymax = 0.5 m
2m
2m
0.5m
0.5m
0.5m
0.5m
Pile cap, D = 25cm

110
X2 = 4 x 0.52= 1 m2 Y2 = 4 x 0.52 = 1 m2 n = total of pile = 4
b. Efficiency: Efficiency of pile considered as the previous chapter based on the good soil condition. = 0.9
Q allowable = Q allowable pile x x 0.6 (static factor for static pile)

111
Checking: Q allowable > P max
Table 6.10 Checking of P max and Q allowable for Interior Column
Q allowable
V Hz Hy Mx My (D-25cm)
Combination 1 8.899 0 0 0.291 0 2.22 0 0 2.370 7.944
Combination 2 18.532 0.755 0 0.009 0 4.63 0.005 0 4.638 7.944
Combination 3 18.515 0.755 0 0.378 0 4.63 0.189 0 4.818 7.944
Combination 4 18.546 0.755 0 0.378 0 4.64 0.189 0 4.825 7.944
Combination 5 16.996 3.317 0 1.659 0 4.25 0.829 0 5.078 7.944
Combination 6 13.215 0.737 0 0.369 0 3.30 0.184 0 3.488 7.944
Combination 7 16.965 3.317 0 1.659 0 4.24 0.829 0 5.071 7.944
(My x Xmax)
/ ΣX2
Pmax
(ton)COMBO
FORCES (ton) MOMENTΣP/n
(Mx x Ymax)
/ ΣY2
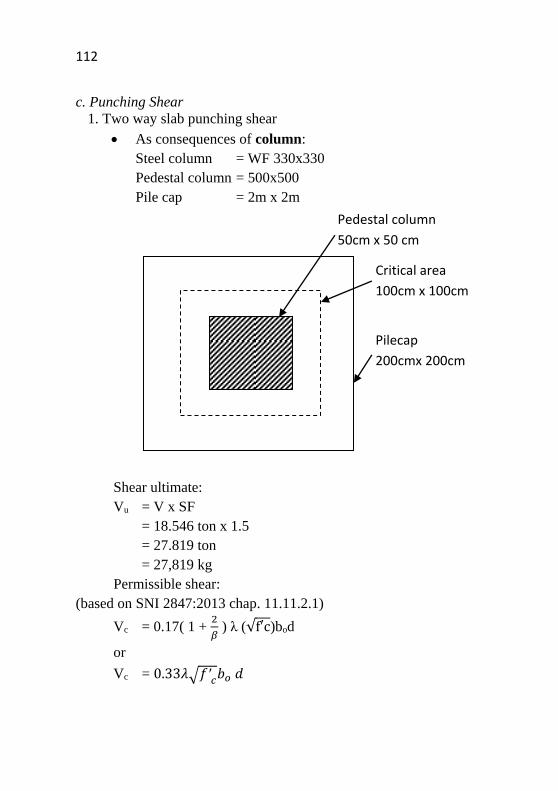
112
c. Punching Shear 1. Two way slab punching shear
As consequences of column: Steel column = WF 330x330 Pedestal column = 500x500 Pile cap = 2m x 2m
Shear ultimate: Vu = V x SF = 18.546 ton x 1.5 = 27.819 ton = 27,819 kg Permissible shear:
(based on SNI 2847:2013 chap. 11.11.2.1)
Vc = 0.17( 1 + 2
𝛽 ) λ (√f′c)bod
or
Vc = 0.33𝜆√𝑓′𝑐𝑏𝑜 𝑑
Critical area
100cm x 100cm
Pedestal column
50cm x 50 cm
Pilecap
200cmx 200cm

113
where:
= Lx
Ly=
2
2= 1
λ = 1 (for normal weight concrete) bo= 4.s = 4 x 100 = 400cm2 d = 80cm
Vc = 0.17( 1 + 2
1 ) (√3000400 . 80
= 893,883 kg
Vc = 0.33√3000 400 . 80
= 583,653 kg
Shear forces requirements ϕVc> Vu 0.75 (583,653) > 50,550
8,795,948kg > 50,550kg (OK
As consequences of pile: Shear ultimate:
Vu = Qall x SF = 11.208 ton x 1.5 = 16.812 ton
= 16,812 kg Permissible shear: (based on SNI 2847:2013 chap. 11.11.2.1)
Vc = 0.17( 1 + 2
𝛽 ) λ (√f′c)bod
or
Vc = 0.33𝜆√𝑓′𝑐𝑏𝑜 𝑑

114
where,
= Lx
Ly=
2
2= 1
λ = 1 (for normal weight concrete) bo= D = . 50=157.08cm2 d = 80cm
Vc = 0.17( 1 + 2
1 ) (√3000) 157.08 . 80
= 351,027 kg
Vc = 0.33√3000 157.08 . 80
= 229.200 kg
Shear forces requirements ϕVc> Vu 0.75 (229.200) >16,812 kg
171,900kg >16,812 kg (OK)
2. One way slab punching shear:
Pile location is out of critical area of punching shear, so it should be check: (based on SNI 2847:2013 chap 11.11.2.1)

115
Vc = 0.083 (αs.d
bo+ 2) 𝜆√𝑓′𝑐 . 𝑏𝑜 . 𝑑
where
αs = 40 (for interior column)
bo = 50+100+2(83.82) = 317.63
Vc = 0.083 (40.80
317.63+ 2) √3000 .317.63 .80
= 1,394.837 kg
Shear forces requirements ϕVc> Vu 0.75 (1,394.837) > 16,812 kg
1,046,127 kg > 16,812 kg (OK)

116
6.5.2 Exterior Column For the exterior column, pile with diameter, d = 30cm will be used.
Figure 6.6 Pile Cap for Exterior Column pile cap = 3m x 3m t pile cap = 50 cm tupe pile = spun pile d pile = 30cm a. Load of one pile:
𝑃𝑚𝑎𝑥 =V
n+
Mx×Ymax
Y2+
My×Xmax
X2
Where: Pmax = Maximum load for one pile Σ P = Total axial load occurred Mx = Moment in X direction My = Moment in Y direction Xmax = 0.75 m Ymax = 0.75 m X2 = 4 x 0.752 = 2.25 m2 Y2 = 4 x 0.752 = 2.25 m2 n = total of pile = 4
3m
3m Pile cap, D = 30cm
0.75m
0.75m
0.75m
0.75m

117
b. Efficiency: Efficiency of pile considered as the previous chapter based on the good soil condition. = 0.9
Q allowable = Q allowable pile x x 0.6 (static factor for static pile)

118
Checking:
Q allowable > P max
Table 6.11 Checking of P max and Q allowable for Exterior Column
Q allowable
V Hz Hz Mx My (D-30cm)
Combination 1 8.899 0 0 0.291 0 2.2248 0 0 2.3218 9.2292
Combination 2 10.148 1.831 0 0.625 0 2.5370 0.208 0 2.7452 9.2292
Combination 3 13.162 1.882 1.441 1.662 0 3.2905 0.554 0 3.8443 9.2292
Combination 4 13.162 1.882 1.441 1.662 0 3.2905 0.554 0 3.8443 9.2292
Combination 5 25.007 0.854 1.441 1.148 0 6.2518 0.383 0 6.6343 9.2292
Combination 6 11.913 0.633 1.441 1.037 0 2.9783 0.346 0 3.3239 9.2292
Combination 7 25.007 0.854 7.731 4.293 0 6.2518 1.431 0 7.6826 9.2292
(My x Xmax)
/ ΣX2
Pmax
(ton)COMBO
FORCES (ton) MOMENTΣP/n
(Mx x Ymax) /
ΣY2

119
6.6 Control Punching Shear
1. Two way slab punching shear
As consequences of column: Steel column = WF 280x431 Pedestal column = 70cmx100cm Pile cap = 3m x 3m
Shear ultimate: Vu = V x SF = 25.007 ton x 1.5 = 37.511 ton = 37,511 kg Permissible shear: (based on SNI 2847:2013 chap. 11.11.2.1)
Vc = 0.17( 1 + 2
𝛽 ) λ (√f′c)bod
Pilecap
300cmx 300cm
Critical area
140cm x 200cm
Pedestal column
70cm x 100cm
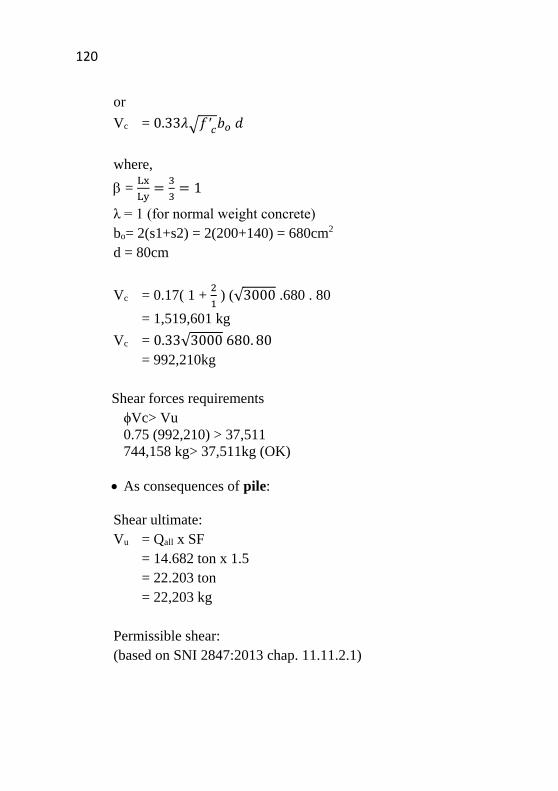
120
or
Vc = 0.33𝜆√𝑓′𝑐𝑏𝑜 𝑑
where,
= Lx
Ly=
3
3= 1
λ = 1 (for normal weight concrete) bo= 2(s1+s2) = 2(200+140) = 680cm2 d = 80cm
Vc = 0.17( 1 + 2
1 ) (√3000 .680 . 80
= 1,519,601 kg
Vc = 0.33√3000 680. 80
= 992,210kg Shear forces requirements
ϕVc> Vu 0.75 (992,210) > 37,511
744,158 kg> 37,511kg (OK) As consequences of pile:
Shear ultimate: Vu = Qall x SF = 14.682 ton x 1.5 = 22.203 ton = 22,203 kg Permissible shear: (based on SNI 2847:2013 chap. 11.11.2.1)

121
Vc = 0.17( 1 + 2
𝛽 ) λ (√f′c)bod
or
Vc = 0.33𝜆√𝑓′𝑐𝑏𝑜 𝑑
where,
= Lx
Ly=
3
3= 1
λ = 1 (for normal weight concrete) bo= D = . 60=188.5cm2 d = 80cm
Vc = 0.17( 1 + 2
1 ) (√3000) 188.5 . 80
= 421.33 kg
Vc = 0.33√3000 .188.5 . 80
= 275,040 kg Shear forces requirements
ϕVc> Vu 0.75 (275,040) >22.023kg
206.280kg >22.023kg (OK)
2. One way slab punching shear:

122
Pile location is out of critical area of punching shear, so it should be check: (based on SNI 2847:2013 chap 11.11.2.1)
Vc = 0.083 (αs.d
bo+ 2) 𝜆√𝑓′𝑐 . 𝑏𝑜 . 𝑑
where αs = 20 (for corner column) bo = 70+140+2(87.32) = 384.64
Vc = 0.083 (20.80
384.64+ 2) √3000 .384.64 .80
= 861,678 kg Shear forces requirements
ϕVc> Vu 0.75 (861,678) > 22.023kg
646,258 kg > 22.023kg 6.7 Pile-Cap Reinforcement Pile cap will be reinforced in two direction, x and y. The critical moment
5.5.2 Interior Column Pilecap Concrete strength, f’c = 30 MPa Yield strength, fy = 420 MPa Slab thickness, hf = 80cm Decking concrete, d = 50mm (based on SNI 2847:2013 chap.7.7.3, d = ± 20 mm) Reinf.diameter, D = 20 mm Lx = 2 m Ly = 2 m dx = hf – d-(1/2D) = 800 –50-(1/2.20) = 725 mm dy = hf – d-(3/2D) = 800 – 50 –(3/2.20) = 660 mm

123
5.5.3Stress Occurred
M11 for reinforcement Direction
M22 for reinforcement Direction
Figure 6.7 Stress Occurred in Interior Column
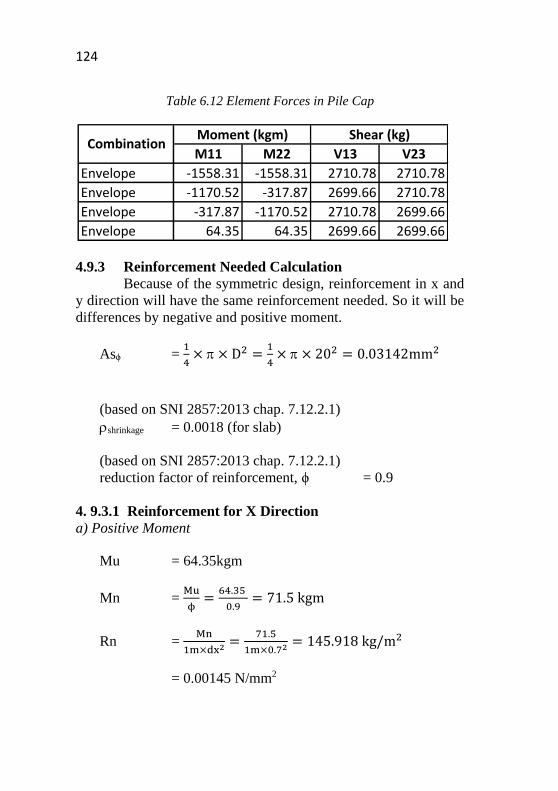
124
Table 6.12 Element Forces in Pile Cap
4.9.3 Reinforcement Needed Calculation Because of the symmetric design, reinforcement in x and y direction will have the same reinforcement needed. So it will be differences by negative and positive moment.
Asϕ = 1
4× × D2 =
1
4× × 202 = 0.03142mm2
(based on SNI 2857:2013 chap. 7.12.2.1) shrinkage = 0.0018 (for slab) (based on SNI 2857:2013 chap. 7.12.2.1) reduction factor of reinforcement, ϕ = 0.9 4. 9.3.1 Reinforcement for X Direction a) Positive Moment
Mu = 64.35kgm
Mn = Mu
ϕ=
64.35
0.9= 71.5 kgm
Rn = Mn
1m×dx2 =71.5
1m×0.72 = 145.918 kg/m2
= 0.00145 N/mm2
M11 M22 V13 V23
Envelope -1558.31 -1558.31 2710.78 2710.78
Envelope -1170.52 -317.87 2699.66 2710.78
Envelope -317.87 -1170.52 2710.78 2699.66
Envelope 64.35 64.35 2699.66 2699.66
CombinationMoment (kgm) Shear (kg)

125
perlu = 0.85×fc
fy(1 − √1 −
2𝑅𝑛
0.85×𝑓𝑐 )
= 0.85×50
350(1 − √1 −
2×0.00145
0.85×30 )
= 4.169 x 10⁻⁵ (use min) Asneed = shrinkage x 1m x dx = 0.0018 x 1m x 0.7m = 1.26 x 10⁻³ m2 = 1260 mm2 Total reinforcement:
n = Asneed
Asϕ=
1260
314.2= 4.011 (use 5 reinf.)
s = 1m
n= 200mm
useD20-200mm b) Negative Moment
Mu = 1,558.31 kgm
Mn = Mu
ϕ=
= 1,558.31
0.9= 1.731 × 10³ kgm
Rn = Mn
1m×dx2 =1.731×10³
1m×0.72 = 3.534 × 10³ kg/m2
= 0.03534 N/mm2
perlu = 0.85×fc
fy(1 − √1 −
2𝑅𝑛
0.85×𝑓𝑐 )
= 0.85×50
350(1 − √1 −
2×0.03534
0.85×30 )
= 1.016 x 10⁻³ (use shrinkage)

126
Asneed = shrinkage x 1m x dx = 0.0018 x 1m x 0.7m = 1.26 x 10⁻³ m2 = 1260 mm2 Total reinforcement:
n = Asneed
Asϕ=
1260
314.2= 4.011 (use 5 reinf.)
s = 1m
n= 200mm
useD20-200mm 4. 9.3.2 Reinforcement for Y direction a) Positive Moment Mu = 64.35 kgm
Mn = Mu
ϕ=
64.35
0.9= 71.5 kgm
Rn = Mn
1m×dy2 =71.5
1m×0.662 = 164.141 kg/m2
= 0.0164 N/mm2
perlu = 0.85×fc
fy(1 − √1 −
2𝑅𝑛
0.85×𝑓𝑐 )
= 0.85×50
350(1 − √1 −
2×0.0164
0.85×30 )
= 4.664 x 10⁻⁵ (use min) Asneed = shrinkaget x 1m x dy = 0.0018 x 1m x 0.66m = 1.12 x 10⁻³ m2 = 1120 mm2 Total reinforcement:
n = Asneed
Asϕ=
1120
314.2= 3.782 (use 4 reinf.)
s = 1m
n= 250mm
useD20 - 250mm

127
b) Negative Moment Mu = 1,558.31 kgm
Mn = Mu
ϕ=
= 1,558.31
0.9= 1.731 × 10³ kgm
Rn = Mn
1m×dy2 =1.731×10³
1m×0.662 = 3.975 × 10³kg/m2
= 0.03975 N/mm2
perlu = 0.85×fc
fy(1 − √1 −
2𝑅𝑛
0.85×𝑓𝑐 )
= 0.85×50
350(1 − √1 −
2×0.03975
0.85×30 )
= 1.142 x 10⁻³ (use min) Asneed = shrinkage x 1m x dy = 0.0018 x 1m x 0.66m = 1.12 x 10⁻³ m2 = 1120 mm2 Total reinforcement:
n = Asneed
Asϕ=
1120
314.2= 3.782 (use 4 reinf.)
s = 1m
n= 250mm
useD20 - 250mm 5.5.2 Exterior Column Pilecap Concrete strength, f’c = 30 MPa Yield strength, fy = 420 MPa Slab thickness, hf = 80cm Decking concrete, d = 50mm (based on SNI 2847:2013 chap.7.7.3, d = ± 20 mm) Reinf.diameter, D = 20 mm Lx = 3 m Ly = 3 m dx = hf – 2d

128
= 800 - 2.50 = 800mm dy = hf – 2d –2D = 250 – 2.50 – 2.20 = 660mm 5.5.3 Stress Occurred
M11 for reinforcement Direction
M22 for reinforcement Direction
Figure 6.8Stress Occurred in Exterior Column
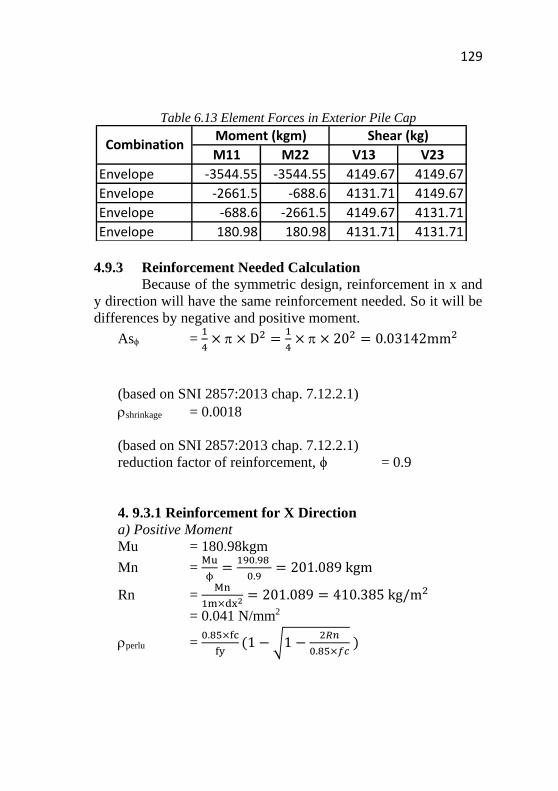
129
Table 6.13 Element Forces in Exterior Pile Cap
4.9.3 Reinforcement Needed Calculation Because of the symmetric design, reinforcement in x and y direction will have the same reinforcement needed. So it will be differences by negative and positive moment.
Asϕ = 1
4× × D2 =
1
4× × 202 = 0.03142mm2
(based on SNI 2857:2013 chap. 7.12.2.1) shrinkage = 0.0018 (based on SNI 2857:2013 chap. 7.12.2.1) reduction factor of reinforcement, ϕ = 0.9 4. 9.3.1 Reinforcement for X Direction a) Positive Moment Mu = 180.98kgm
Mn = Mu
ϕ=
190.98
0.9= 201.089 kgm
Rn = Mn
1m×dx2 = 201.089 = 410.385 kg/m2
= 0.041 N/mm2
perlu = 0.85×fc
fy(1 − √1 −
2𝑅𝑛
0.85×𝑓𝑐 )
M11 M22 V13 V23
Envelope -3544.55 -3544.55 4149.67 4149.67
Envelope -2661.5 -688.6 4131.71 4149.67
Envelope -688.6 -2661.5 4149.67 4131.71
Envelope 180.98 180.98 4131.71 4131.71
CombinationMoment (kgm) Shear (kg)

130
= 0.85×30
350(1 − √1 −
2×0.041
0.85×30 )
= 1.174 x 10⁻⁴ (use shrinkage) Asneed = shrinkage x 1m x dx = 0.0018 x 1m x 0.7m = 1.26 x 10⁻³ m2 = 1260 mm2 Total reinforcement:
n = Asneed
Asϕ=
1260
314.2= 4.011 (use 5reinf.)
s = 1m
n= 200mm
useD20-200mm b) Negative Moment Mu = 3,544.55kgm
Mn = Mu
ϕ=
=3,544.55
0.9= 3.938 × 10³ kgm
Rn = Mn
1m×dx2 =3.938×10³
1m×0.72 = 8.038 × 10³ kg/m2
= 0.08038 N/mm2
perlu = 0.85×fc
fy(1 − √1 −
2𝑅𝑛
0.85×𝑓𝑐 )
= 0.85×30
350(1 − √1 −
2×0.08038
0.85×30 )
= 2.989 x 10⁻³ (use min) Asneed = shrinkage x 1m x dx = 0.0018 x 1m x 0.7m = 1.26 x 10⁻³ m2 = 1260 mm2 Total reinforcement:
n = Asneed
Asϕ=
1260
314.2= 4.011 (use 5reinf.)

131
s = 1m
n= 200mm
useD20-200mm 4. 9.3.2 Reinforcement for Y direction a) Positive Moment Mu = 180.98 kgm
Mn = Mu
ϕ=
190.98
0.9= 201.089 kgm
Rn = Mn
1m×dy2 = 201.089 = 461.637 kg/m2
= 0.0461 N/mm2
perlu = 0.85×fc
fy(1 − √1 −
2𝑅𝑛
0.85×𝑓𝑐 )
= 0.85×30
350(1 − √1 −
2×0.0461
0.85×30 )
= 1.313 x 10⁻⁴ (use shrinakge) Asneed = shrinkage x 1m x dy = 0.0018 x 1m x 0.66m = 1.2 x 10³ m2 = 1200 mm2 Total reinforcement:
n = Asneed
Asϕ=
1200
314.2= 3.782 (use 4reinf.)
s = 1m
n= 250mm
useD20-250mm b) Negative Moment Mu = 3,544.55 kgm
Mn = Mu
ϕ=
=3,544.55
0.9= 3.938 × 10³ kgm
Rn = Mn
1m×dy2 =3.938×10³
1m×0.662 = 9.041 × 10³ kg/m2
= 0.09041 N/mm2
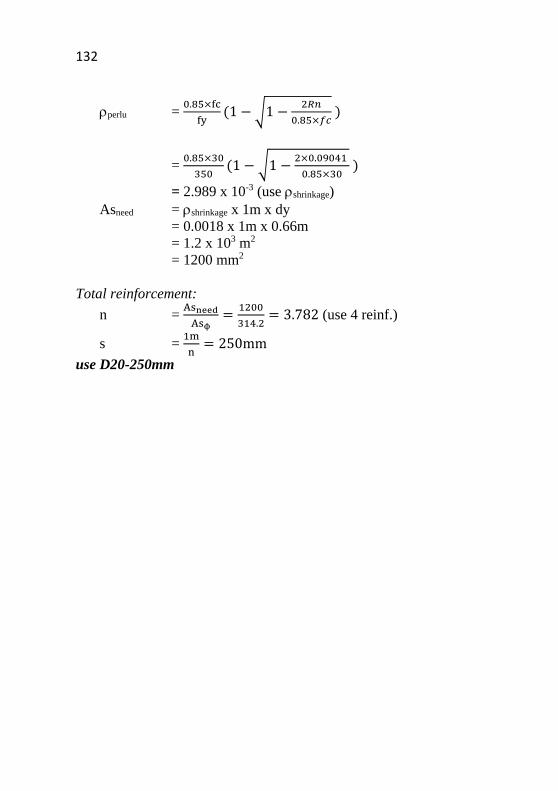
132
perlu = 0.85×fc
fy(1 − √1 −
2𝑅𝑛
0.85×𝑓𝑐 )
= 0.85×30
350(1 − √1 −
2×0.09041
0.85×30 )
= 2.989 x 10⁻³ (use shrinkage) Asneed = shrinkage x 1m x dy = 0.0018 x 1m x 0.66m = 1.2 x 10³ m2 = 1200 mm2 Total reinforcement:
n = Asneed
Asϕ=
1200
314.2= 3.782 (use 4 reinf.)
s = 1m
n= 250mm
use D20-250mm

133
CHAPTER 7 CONCLUSION
7.1. Conclusion Conclusion from the analysis and calculating of this final
project are:
1. Precast prestress slab on ground
- Dimension : 3m x 6m
- Thickness : 25 cm
- Reinforcement : tendon, mild-steel reinf.
- Tendon : Freyssinet, Type F, 5 strands
- Mild-reinforcement : D12-250mm
2. Machine foundation
- Dimension : 12m x 24m
- Thickness : 1m
- Reinforcement : D25-250mm
3. Interior column pilecap
- Dimension : 2m x 2m
- Thickness : 80cm
- Reinforcement : D20-200mm
4. Exterior column pilecap
- Dimension : 3m x 3m
- Thickness : 80cm
- Reinforcement : D20-200mm
7.2. Suggestion Furthermore learning of upper structure will be needed to
analyze the exact real condition, hence, the calculating of
foundation could be more detailed.

134
“This page is purposely blank”

xiv
REFERENCE
ACI Committee 360, 2009, Design of Slabs on Ground, ACI
360R-06, America.
American Concrete Institute, 2004, Concrete Slabs on
Ground, USA.
Bluescope Buildings, 2014, Structural Design Data,
Indonesia
Farmy, James A., 2001, Concrete Floors on Ground, EB075,
Portland Cement Association, USA.
Naaman, Antoine, 2004, Prestress Concrete Analysis and Design-2nd Edition, USA
Ringo, Anderson, R, 1994, Designing Floor Slabs on Grade,
USA.
Suryacipta Industrial Estate, 2014, Geothechnical
Investigation Report, Indonesia.
The Occupational Safety and Health Service of the
Department of Labour, 2002, The Safe Handling,
Transportation and Erection of Precast Concrete,
New Zealand.
.
Victor, Ralph L., 2008, Load Carrying Capacity, Structure
Magazine, USA.

xv
“This page is purposely blank”

xiv
WRITER’S BIODATA
The writer was born in Jakarta,
December 17th 1993. She is the second
daughter with an older brother and a
twin. She studied in Mardi Yuana
Elementary and Junior High School
then continued in SMAN 1 Serang in
2009 and graduated in 2011. She
attended University in Surabaya,
Institut Teknologi Sepuluh Nopember,
and took Bachelor Degree Program in
Civil Engineering.
Writer was also active in some organizations and community in
campus and out of the campus. For example, a social
organization, Civillage, that build a library in a remote area as
material and human resources engineer, took a role in Christian
community in university, and joint some volunteering works in
International Church. She had also joined some internship in
WIKA Building in 2013 and PT. Teamworx Indonesia as
structural engineer in 2014.
The writer is really interested in structural engineering and
property business. She hope with this final project she can reach
her dream to get a Bachelor Degree title and continue her study in
Master Degree.