redesigning health care from the bottom up … · redesigning health care from the bottom up...
TRANSCRIPT
REDESIGNING HEALTH CAREFROM THE BOTTOM UP
INSTEAD OF FROM THE TOP DOWN
Better Care at Lower Costs Through Patient-Centered Payment
Harold D. MillerPresident and CEO
Center for Healthcare Quality and Payment Reform
www.CHQPR.org
There is one thing(and maybe only one thing)
we have in common in America today…
…We’re all spendingtoo much on healthcare

3© Center for Healthcare Quality and Payment Reform www.CHQPR.org
Healthcare Spending is the
Biggest Driver of Federal Deficits
Medicare
SocialSecurity
DiscretionarySpending
Other Mandatory
94% Increase($1 Trillion)
25% Increase($400 Billion)
85% Increase($770 Billion)
Source:
CBO
4© Center for Healthcare Quality and Payment Reform www.CHQPR.org
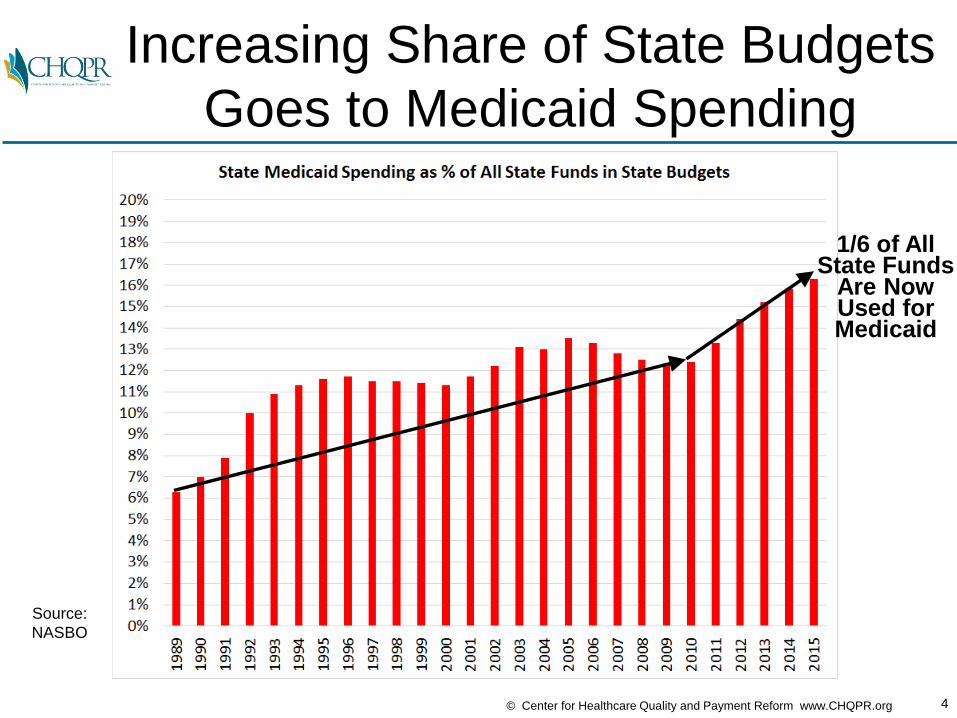
Increasing Share of State Budgets
Goes to Medicaid Spending
Source:
NASBO
1/6 of AllState Funds
Are NowUsed forMedicaid

5© Center for Healthcare Quality and Payment Reform www.CHQPR.org
U.S. Premiums Increased 73%
More Than Inflation Since 2002
FamilyPremiums
$6,164Higher Than
Inflation
Source:
Medical
Expenditure
Panel Survey &
Bureau of
Labor Statistics
6© Center for Healthcare Quality and Payment Reform www.CHQPR.org
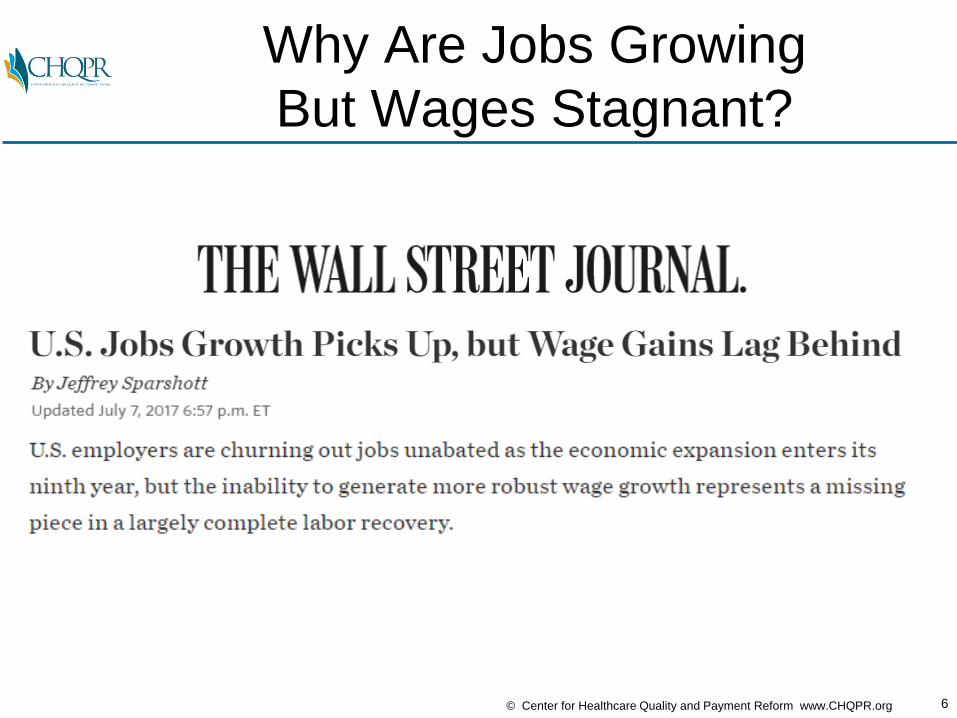
Why Are Jobs Growing
But Wages Stagnant?
7© Center for Healthcare Quality and Payment Reform www.CHQPR.org
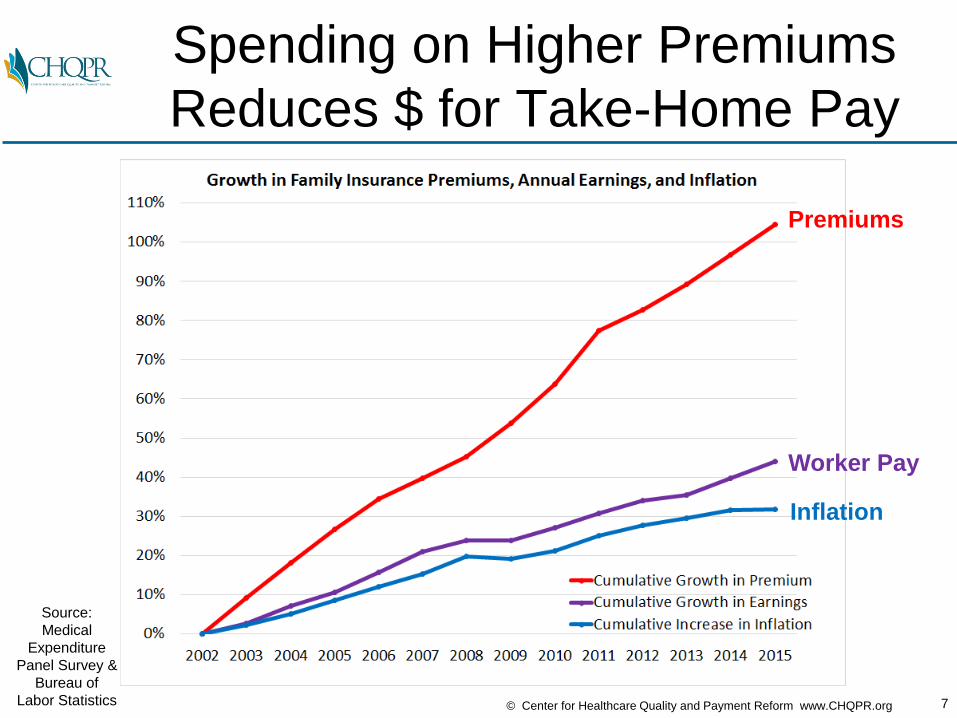
Spending on Higher Premiums
Reduces $ for Take-Home Pay
Source:
Medical
Expenditure
Panel Survey &
Bureau of
Labor Statistics
Premiums
Worker Pay
Inflation
8© Center for Healthcare Quality and Payment Reform www.CHQPR.org
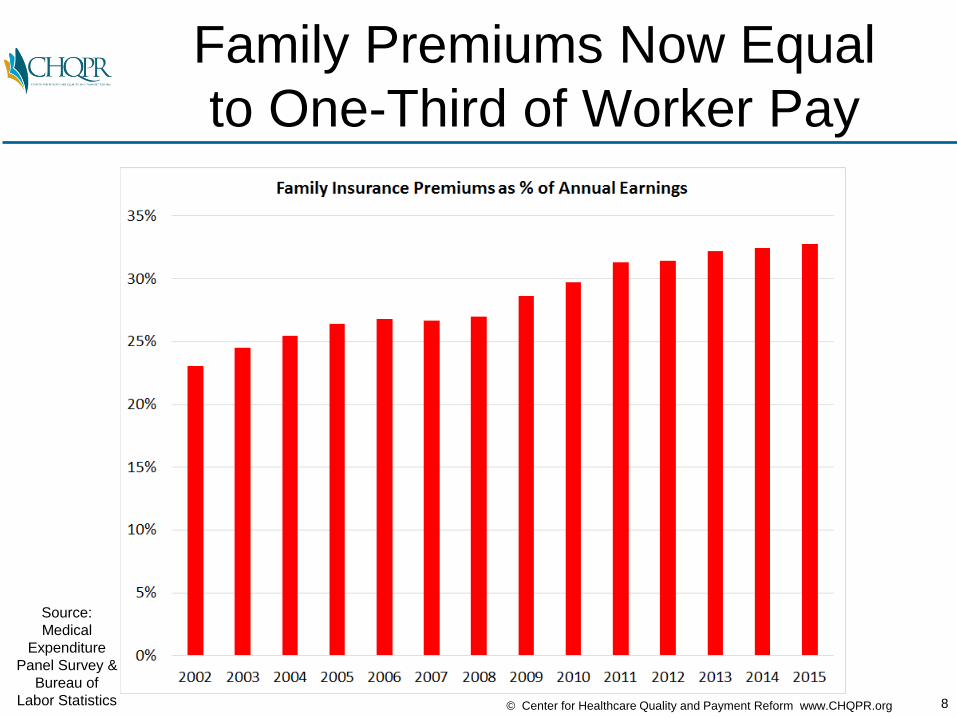
Family Premiums Now Equal
to One-Third of Worker Pay
Source:
Medical
Expenditure
Panel Survey &
Bureau of
Labor Statistics

9© Center for Healthcare Quality and Payment Reform www.CHQPR.org
What’s Causing the Increase in
U.S. Insurance Premiums?
29%Increase
inSpending
$240BillionSource:
CMS National
Health
Expenditures

10© Center for Healthcare Quality and Payment Reform www.CHQPR.org
Biggest Causes are Hospitals
& Insurance Administration/Profit
Hospitals
Insurance
Phys/Clin.DrugsOther
Hospitals
Physician& ClinicalServices
Drugs
OtherServices
InsuranceAdmin.
Source:
CMS National
Health
Expenditures

11© Center for Healthcare Quality and Payment Reform www.CHQPR.org
Half of Growth in Private Spending
Has Been for Hospital Services
Hospital Svcs41% Increase 49% of Total
Physician &Clinical Services
19% Increase18% of Total
Drugs20% Increase 10% of Total
Other Svcs24% Increase 11% of Total
Insurance Admin30% Increase 12% of Total
Source:
CMS National
Health
Expenditures

12© Center for Healthcare Quality and Payment Reform www.CHQPR.org
Similar Pattern for Total Spending;
>1/3 of Growth Due to Hospitals
Hospital Svcs33% Increase 37% of Total
Physician &Clinical Services
27% Increase20% of Total
Drugs28% Increase 10% of Total
Other Svcs22% Increase 10% of Total
Insurance Admin51% Increase 12% of Total
Source:
CMS National
Health
Expenditures

13© Center for Healthcare Quality and Payment Reform www.CHQPR.org
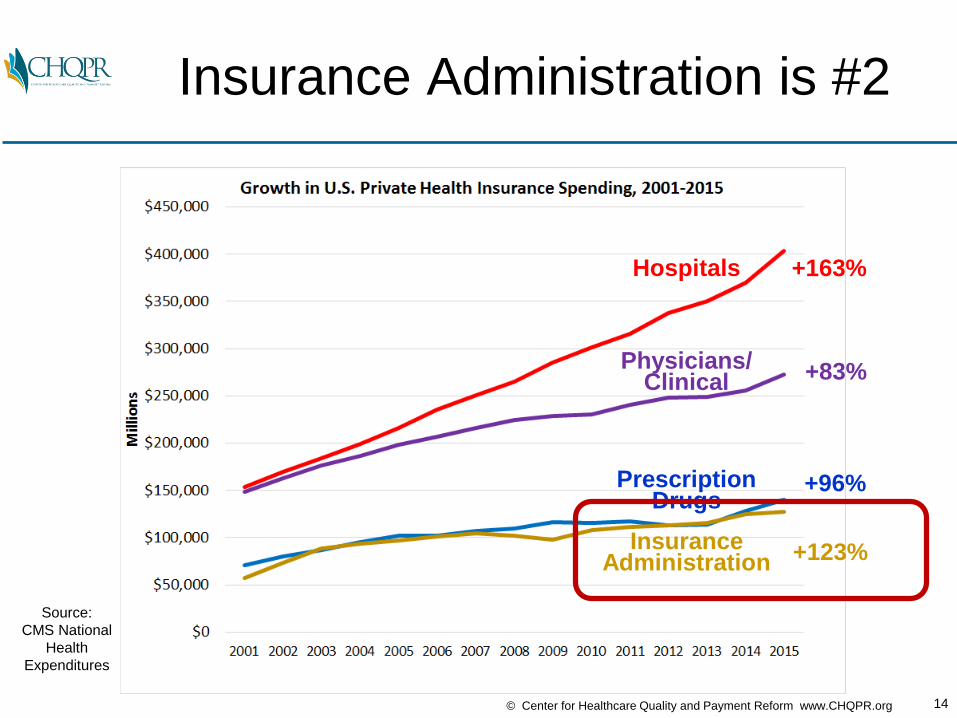
Hospitals Are Biggest Contributor
to Growth for Two Decades
Source:
CMS National
Health
Expenditures
Hospitals
Physicians/Clinical
InsuranceAdministration
PrescriptionDrugs
+163%
+83%
+96%
+123%
14© Center for Healthcare Quality and Payment Reform www.CHQPR.org
Insurance Administration is #2
Source:
CMS National
Health
Expenditures
Hospitals
Physicians/Clinical
InsuranceAdministration
PrescriptionDrugs
+163%
+83%
+96%
+123%

15© Center for Healthcare Quality and Payment Reform www.CHQPR.org
As Much Private Insurance $ Goes
to Insurer Admin as to Drugs
Source:
CMS National
Health
Expenditures
Hospitals
Physicians/Clinical
InsuranceAdministration
PrescriptionDrugs
16© Center for Healthcare Quality and Payment Reform www.CHQPR.org
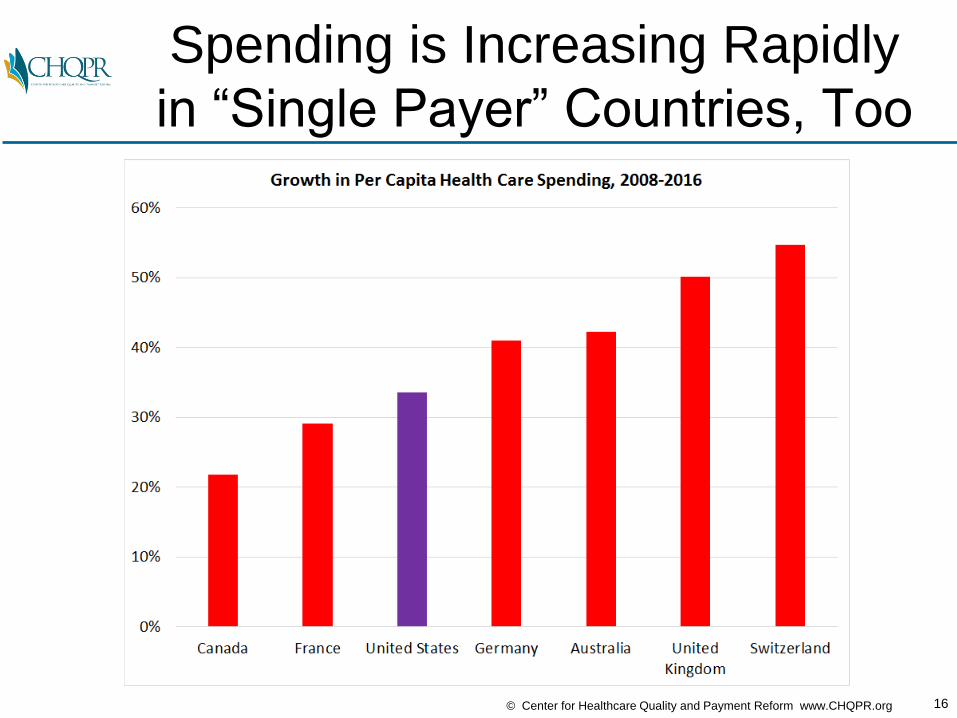
Spending is Increasing Rapidly
in “Single Payer” Countries, Too
17© Center for Healthcare Quality and Payment Reform www.CHQPR.org
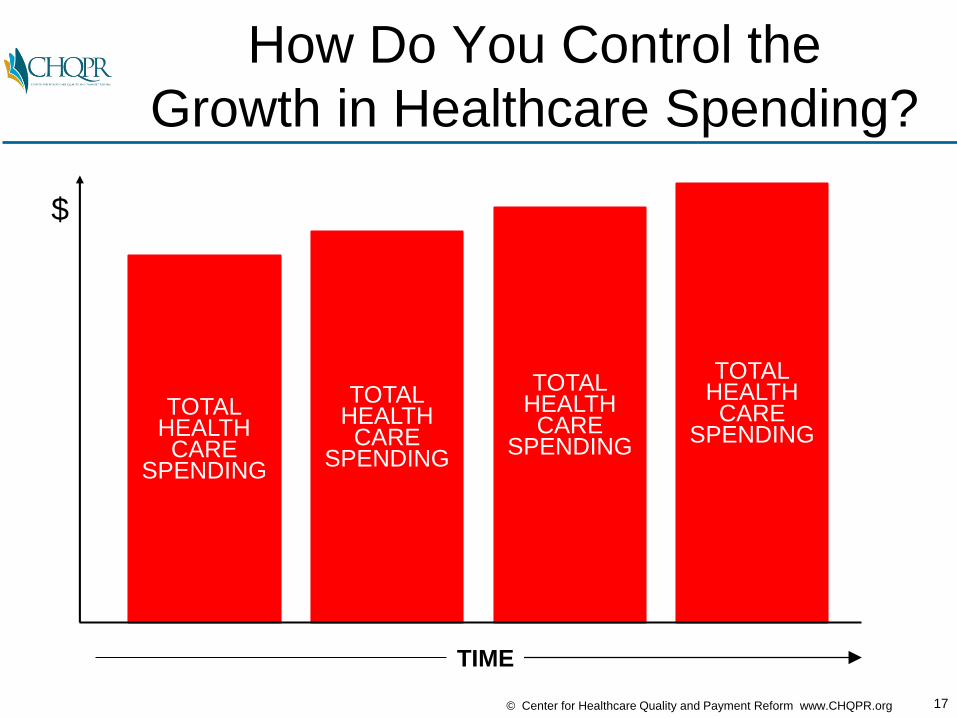
How Do You Control the
Growth in Healthcare Spending?
TOTALHEALTHCARE
SPENDING
TOTALHEALTHCARE
SPENDING
TOTALHEALTHCARE
SPENDING
TOTALHEALTHCARE
SPENDING
$
TIME
18© Center for Healthcare Quality and Payment Reform www.CHQPR.org
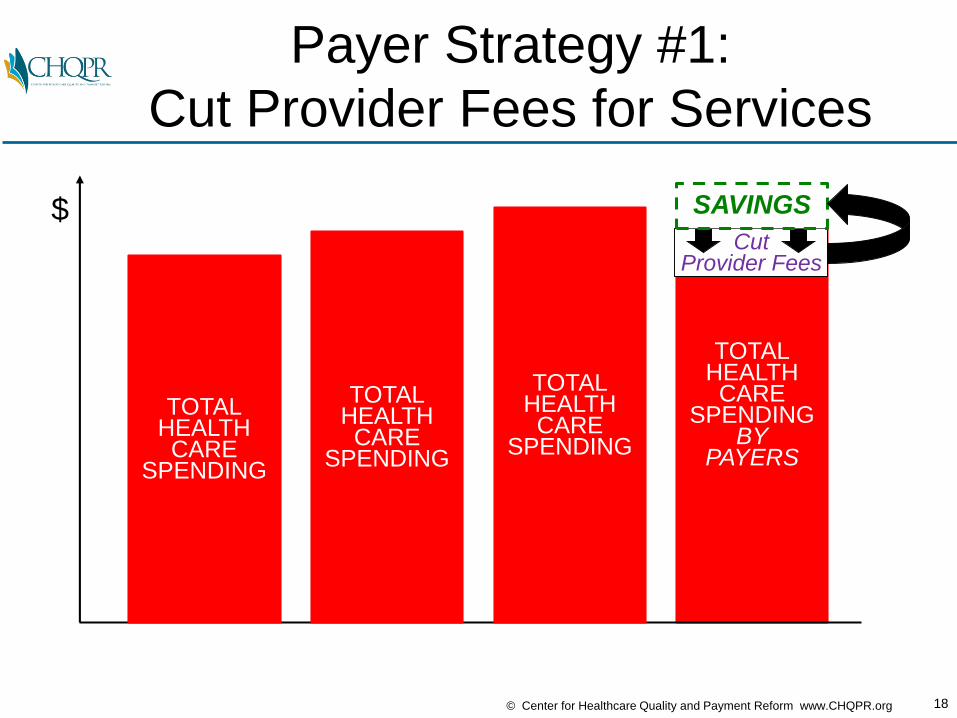
TOTALHEALTHCARE
SPENDINGBY
PAYERS
Payer Strategy #1:
Cut Provider Fees for Services
$Cut
Provider Fees
SAVINGS
TOTALHEALTHCARE
SPENDING
TOTALHEALTHCARE
SPENDING
TOTALHEALTHCARE
SPENDING
19© Center for Healthcare Quality and Payment Reform www.CHQPR.org
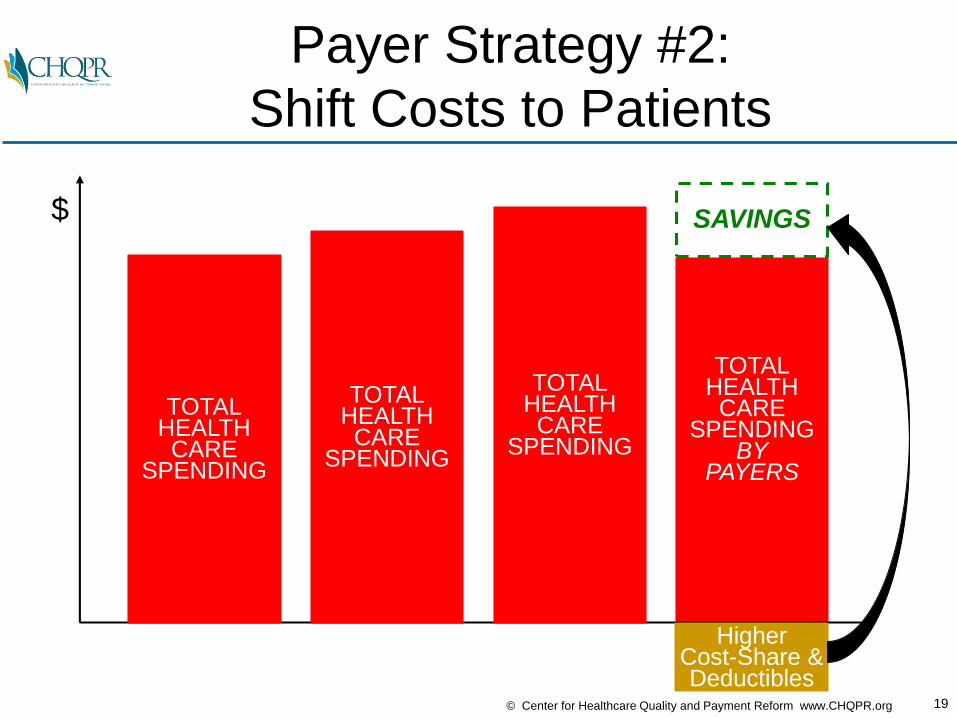
TOTALHEALTHCARE
SPENDINGBY
PAYERS
Payer Strategy #2:
Shift Costs to Patients
$ SAVINGS
HigherCost-Share &Deductibles
TOTALHEALTHCARE
SPENDING
TOTALHEALTHCARE
SPENDING
TOTALHEALTHCARE
SPENDING
20© Center for Healthcare Quality and Payment Reform www.CHQPR.org
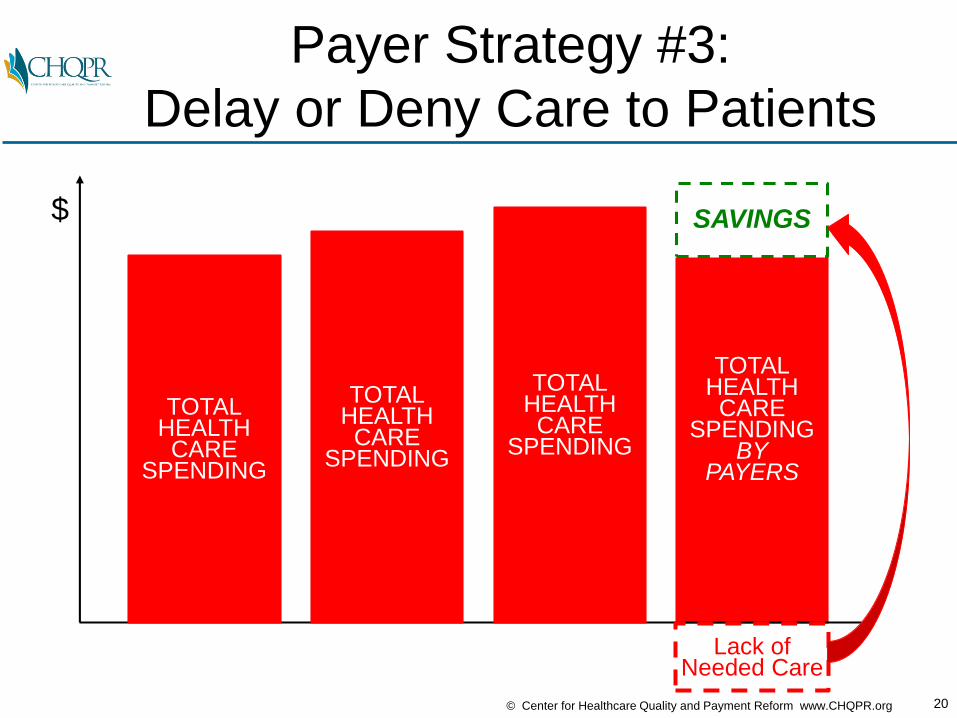
TOTALHEALTHCARE
SPENDINGBY
PAYERS
Payer Strategy #3:
Delay or Deny Care to Patients
$ SAVINGS
Lack of Needed Care
TOTALHEALTHCARE
SPENDING
TOTALHEALTHCARE
SPENDING
TOTALHEALTHCARE
SPENDING
21© Center for Healthcare Quality and Payment Reform www.CHQPR.org
Results of Typical Strategies
• Patients don’t get the care they need and costs increase in the future
• Small physician practices and hospitals are forced out of business
• Health insurance premiums continue to rise and access to insurance coverage decreases

22© Center for Healthcare Quality and Payment Reform www.CHQPR.org
Results of Typical Strategies
• Patients don’t get the care they need and costs increase in the future
• Small physician practices and hospitals are forced out of business
• Health insurance premiums continue to rise and access to insurance coverage decreases
IS THERE A BETTER WAY?

23© Center for Healthcare Quality and Payment Reform www.CHQPR.org
The Right Focus: Spending
That is Unnecessary or Avoidable
AVOIDABLESPENDING
AVOIDABLESPENDING
AVOIDABLESPENDING
NECESSARYSPENDING
AVOIDABLESPENDING
NECESSARYSPENDING
NECESSARYSPENDING
NECESSARYSPENDING
$
TIME
24© Center for Healthcare Quality and Payment Reform www.CHQPR.org
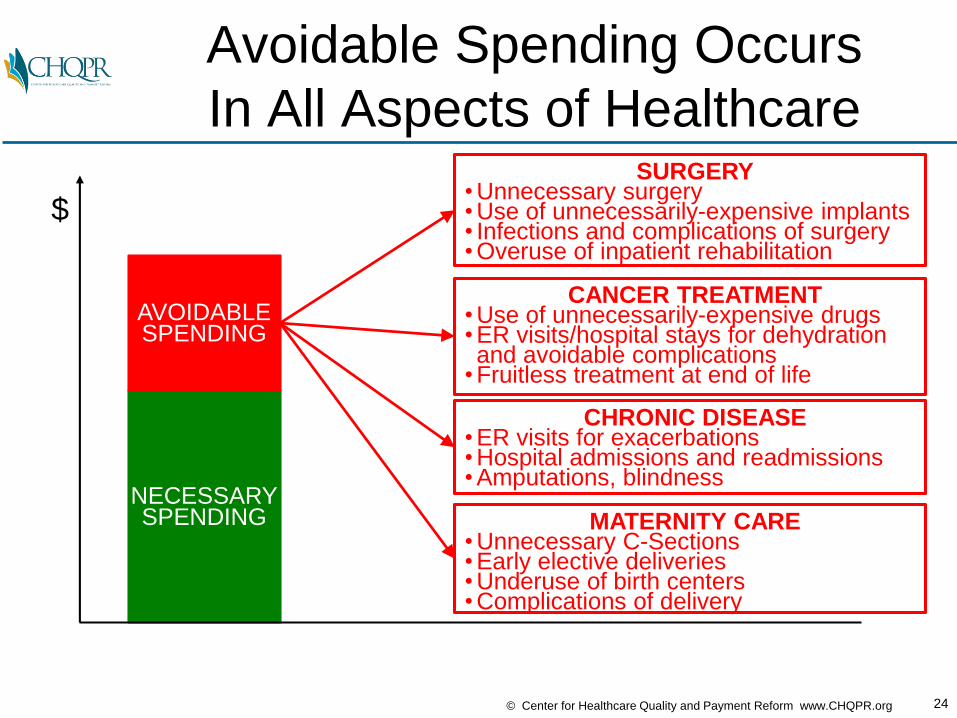
Avoidable Spending Occurs
In All Aspects of Healthcare
NECESSARYSPENDING
AVOIDABLESPENDING
$
CANCER TREATMENT• Use of unnecessarily-expensive drugs• ER visits/hospital stays for dehydration and avoidable complications
• Fruitless treatment at end of life
SURGERY• Unnecessary surgery• Use of unnecessarily-expensive implants• Infections and complications of surgery• Overuse of inpatient rehabilitation
CHRONIC DISEASE• ER visits for exacerbations• Hospital admissions and readmissions• Amputations, blindness
MATERNITY CARE• Unnecessary C-Sections• Early elective deliveries• Underuse of birth centers• Complications of delivery
25© Center for Healthcare Quality and Payment Reform www.CHQPR.org
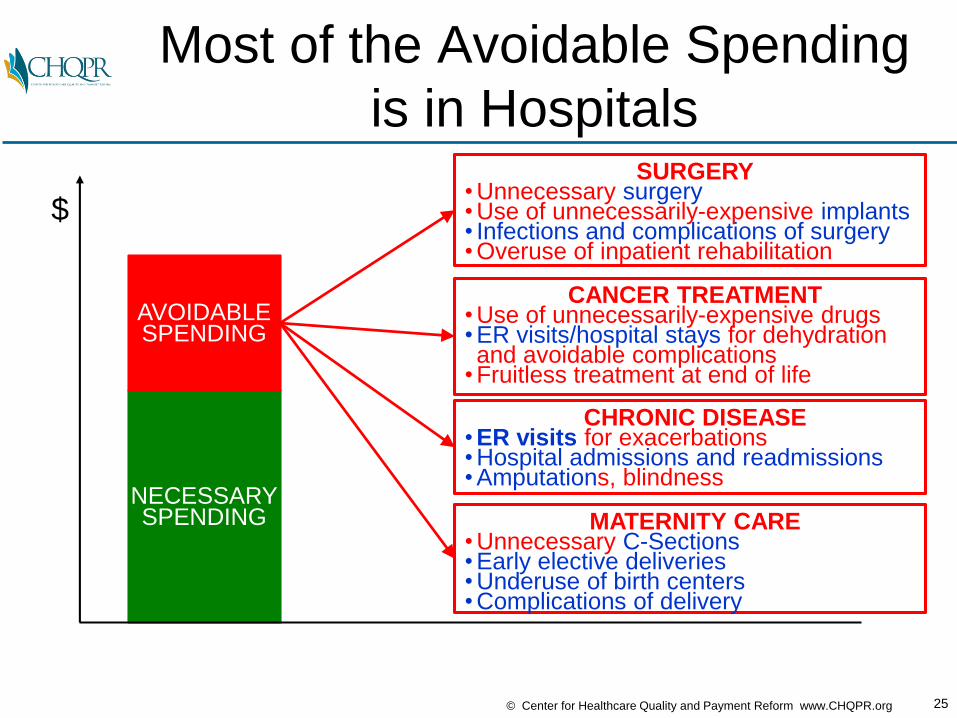
Most of the Avoidable Spending
is in Hospitals
NECESSARYSPENDING
AVOIDABLESPENDING
$
CANCER TREATMENT• Use of unnecessarily-expensive drugs• ER visits/hospital stays for dehydration and avoidable complications
• Fruitless treatment at end of life
SURGERY• Unnecessary surgery• Use of unnecessarily-expensive implants• Infections and complications of surgery• Overuse of inpatient rehabilitation
CHRONIC DISEASE• ER visits for exacerbations• Hospital admissions and readmissions• Amputations, blindness
MATERNITY CARE• Unnecessary C-Sections• Early elective deliveries• Underuse of birth centers• Complications of delivery
26© Center for Healthcare Quality and Payment Reform www.CHQPR.org
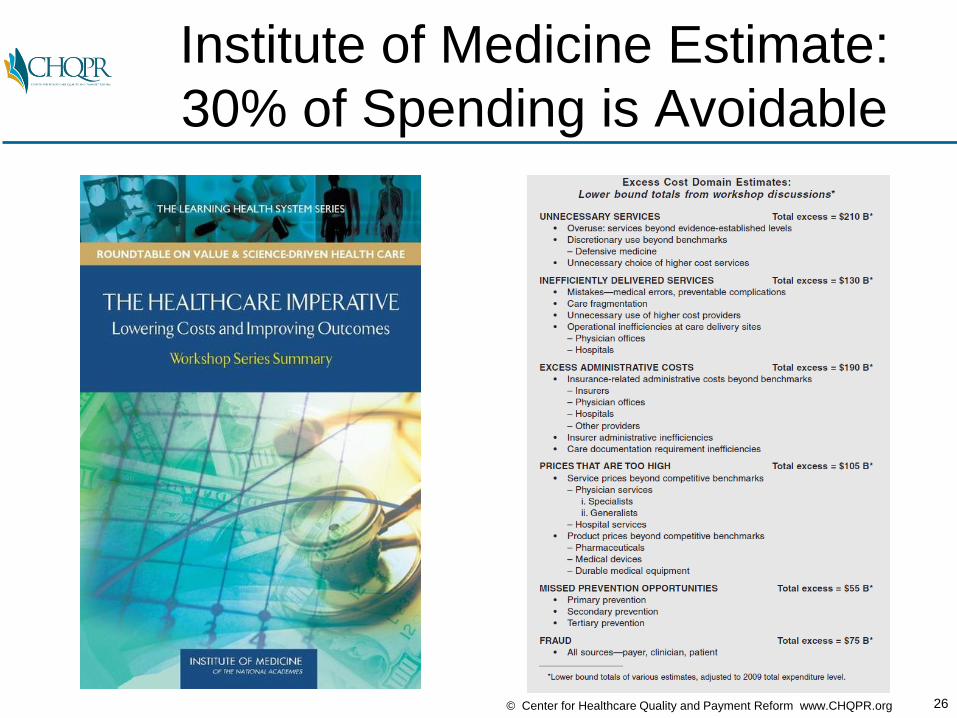
Institute of Medicine Estimate:
30% of Spending is Avoidable

27© Center for Healthcare Quality and Payment Reform www.CHQPR.org
25% of Avoidable Spending
is Excess Administrative Costs

28© Center for Healthcare Quality and Payment Reform www.CHQPR.org
The Right Goal: Less Avoidable $,
NECESSARYSPENDING
AVOIDABLESPENDING
$
TIME
AVOIDABLESPENDING
AVOIDABLESPENDING
AVOIDABLESPENDING

29© Center for Healthcare Quality and Payment Reform www.CHQPR.org
The Right Goal: Less Avoidable $,
More Necessary $
NECESSARYSPENDING
AVOIDABLESPENDING
NECESSARYSPENDING
NECESSARYSPENDING
NECESSARYSPENDING
$
TIME
AVOIDABLESPENDING
AVOIDABLESPENDING
AVOIDABLESPENDING

30© Center for Healthcare Quality and Payment Reform www.CHQPR.org
Win-Win for Patients & Payers
NECESSARYSPENDING
AVOIDABLESPENDING
NECESSARYSPENDING
NECESSARYSPENDING
NECESSARYSPENDING
$
TIME
SAVINGSSAVINGS SAVINGS
AVOIDABLESPENDING
AVOIDABLESPENDING
AVOIDABLESPENDING
BetterCarefor
Patients
LowerSpending
forPayers
31© Center for Healthcare Quality and Payment Reform www.CHQPR.org
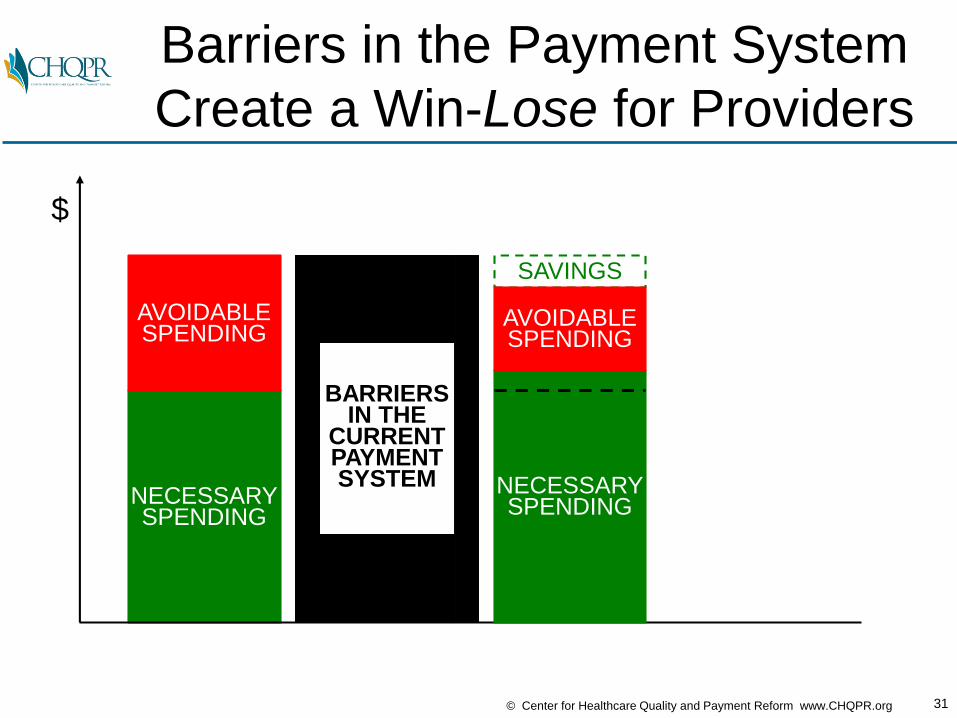
Barriers in the Payment System
Create a Win-Lose for Providers
NECESSARYSPENDING
AVOIDABLESPENDING
$
BARRIERSIN THE
CURRENTPAYMENTSYSTEM NECESSARY
SPENDING
SAVINGS
AVOIDABLESPENDING
32© Center for Healthcare Quality and Payment Reform www.CHQPR.org
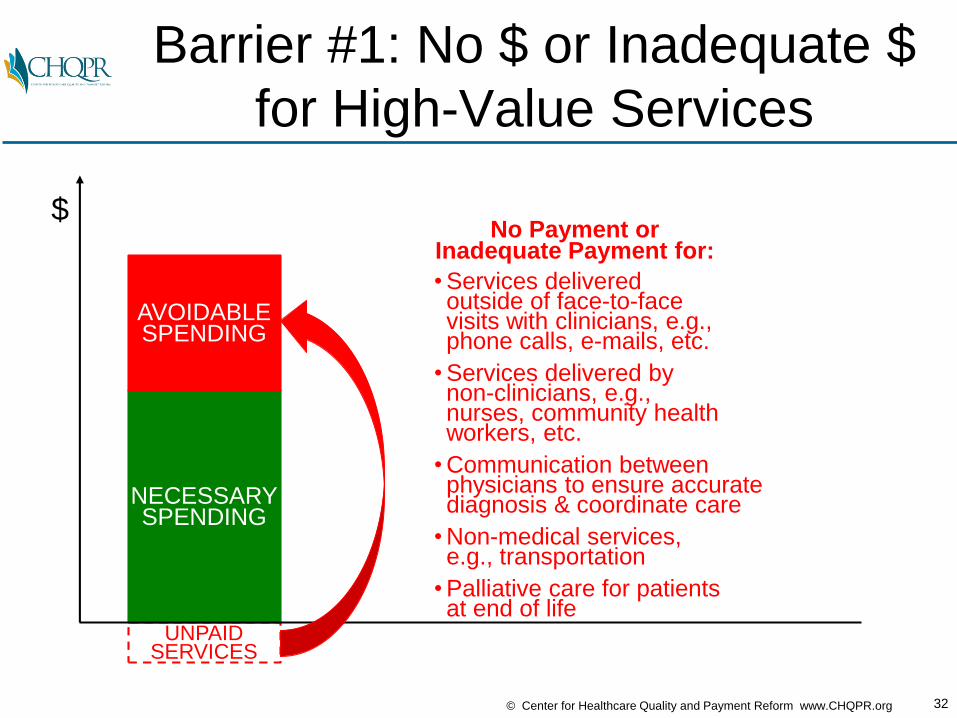
Barrier #1: No $ or Inadequate $
for High-Value Services
NECESSARYSPENDING
AVOIDABLESPENDING
UNPAIDSERVICES
$No Payment or
Inadequate Payment for:
• Services deliveredoutside of face-to-facevisits with clinicians, e.g.,phone calls, e-mails, etc.
• Services delivered bynon-clinicians, e.g., nurses, community healthworkers, etc.
• Communication betweenphysicians to ensure accuratediagnosis & coordinate care
• Non-medical services,e.g., transportation
• Palliative care for patientsat end of life
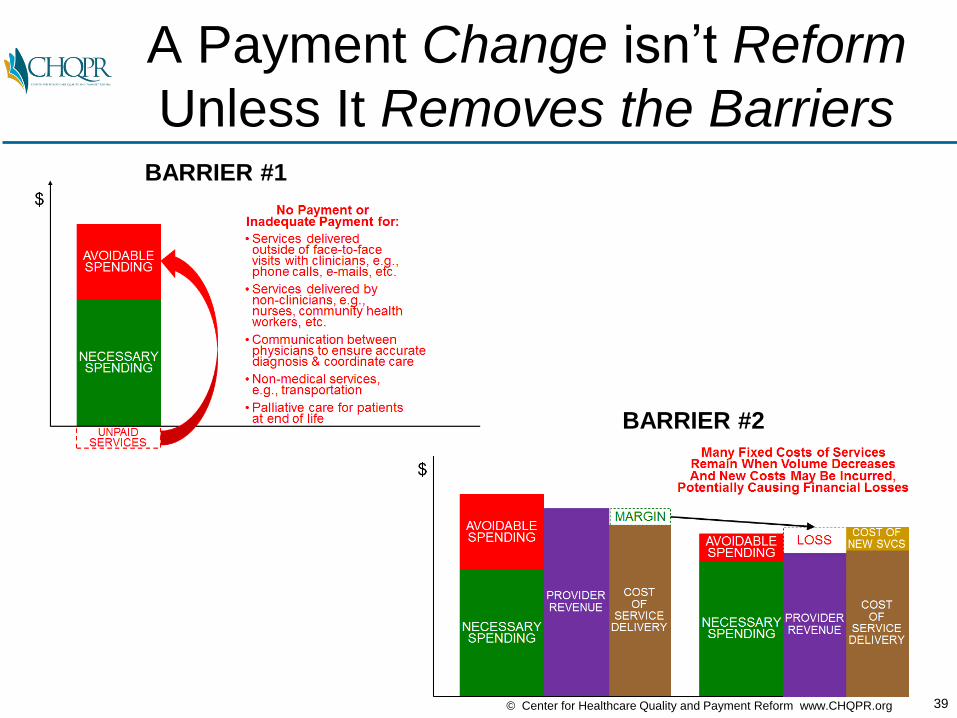
33© Center for Healthcare Quality and Payment Reform www.CHQPR.org
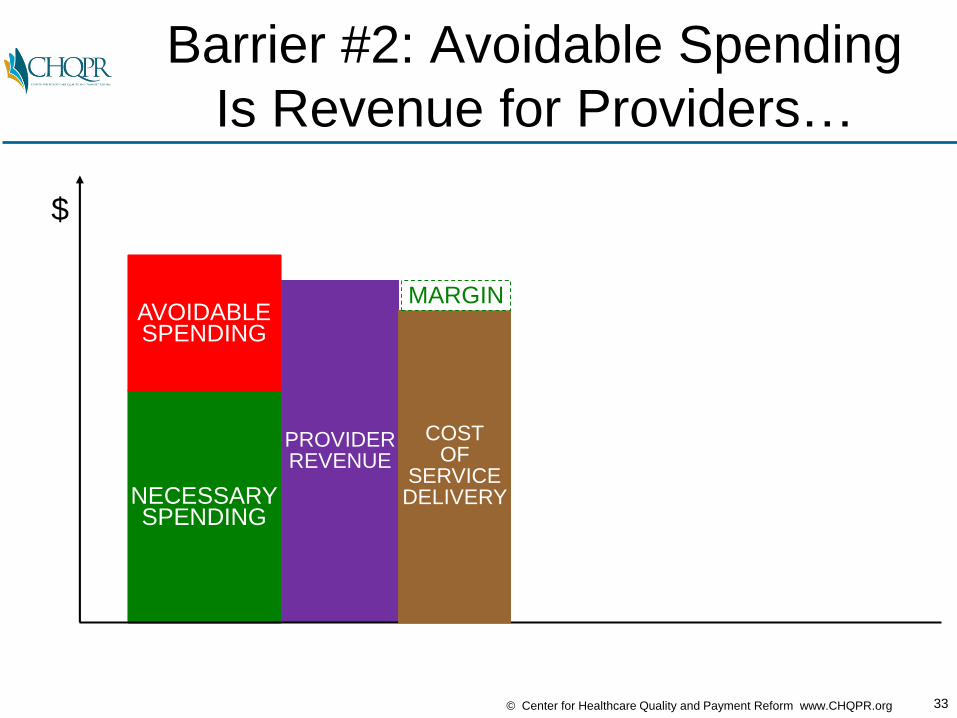
Barrier #2: Avoidable Spending
Is Revenue for Providers…
NECESSARYSPENDING
AVOIDABLESPENDING
$
PROVIDERREVENUE
COSTOF
SERVICEDELIVERY
MARGIN

34© Center for Healthcare Quality and Payment Reform www.CHQPR.org
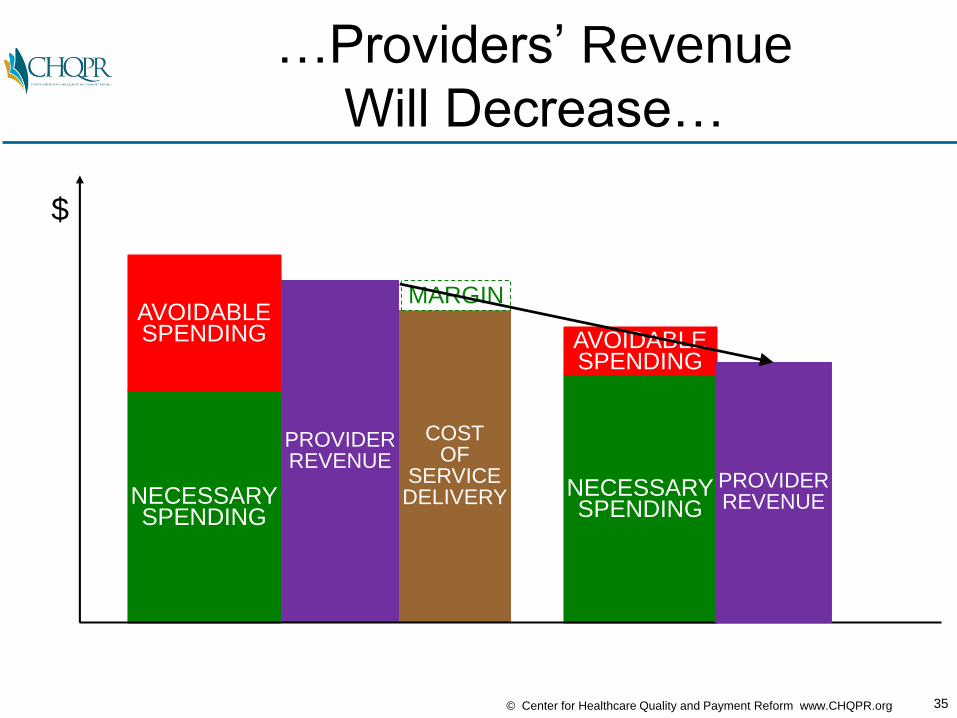
…And When Avoidable Services
Aren’t Delivered…
NECESSARYSPENDING
AVOIDABLESPENDING
$
NECESSARYSPENDING
AVOIDABLESPENDING
COSTOF
SERVICEDELIVERY
MARGIN
PROVIDERREVENUE
35© Center for Healthcare Quality and Payment Reform www.CHQPR.org
…Providers’ Revenue
Will Decrease…
NECESSARYSPENDING
AVOIDABLESPENDING
$
NECESSARYSPENDING
AVOIDABLESPENDING
COSTOF
SERVICEDELIVERY
MARGIN
PROVIDERREVENUE
PROVIDERREVENUE
36© Center for Healthcare Quality and Payment Reform www.CHQPR.org
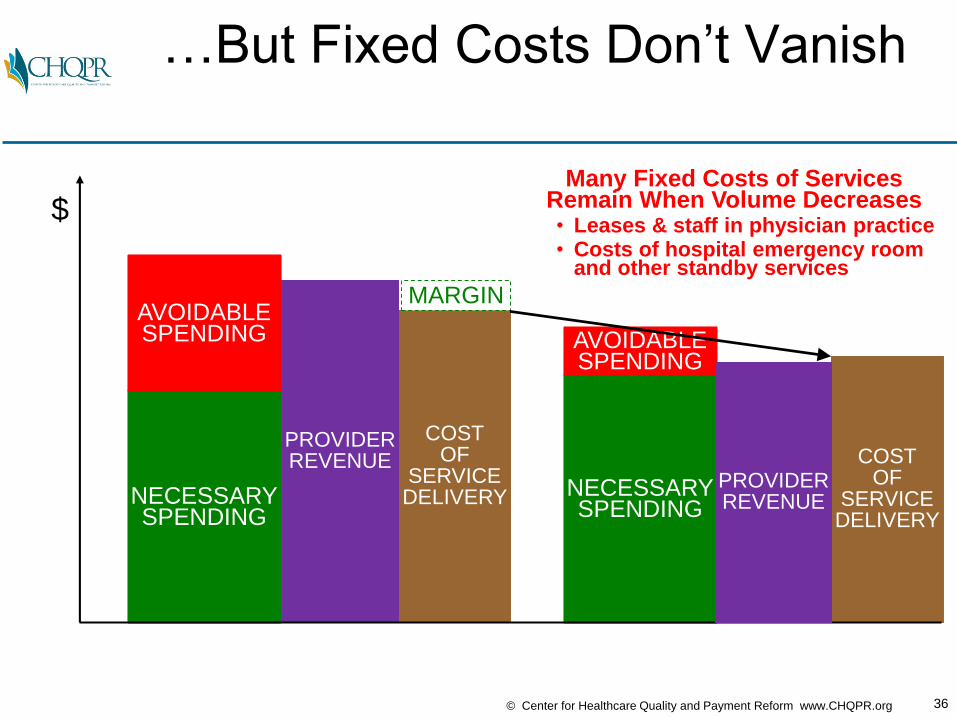
…But Fixed Costs Don’t Vanish
NECESSARYSPENDING
AVOIDABLESPENDING
$
NECESSARYSPENDING
AVOIDABLESPENDING
COSTOF
SERVICEDELIVERY
MARGIN
PROVIDERREVENUE COST
OFSERVICEDELIVERY
PROVIDERREVENUE
Many Fixed Costs of ServicesRemain When Volume Decreases• Leases & staff in physician practice• Costs of hospital emergency room
and other standby services

37© Center for Healthcare Quality and Payment Reform www.CHQPR.org
…But Fixed Costs Don’t Vanish
and New Costs May Be Added…
NECESSARYSPENDING
AVOIDABLESPENDING
$
NECESSARYSPENDING
AVOIDABLESPENDING
COSTOF
SERVICEDELIVERY
MARGIN
PROVIDERREVENUE COST
OFSERVICEDELIVERY
PROVIDERREVENUE
COST OFNEW SVCS
Many Fixed Costs of ServicesRemain When Volume DecreasesAnd New Costs May Be Incurred,• Costs of nurse care managers• Costs of unpaid physician services• Costs of collecting quality data

38© Center for Healthcare Quality and Payment Reform www.CHQPR.org
…Leaving Providers With Losses
(or Bigger Losses Than Today)
NECESSARYSPENDING
AVOIDABLESPENDING
$
NECESSARYSPENDING
AVOIDABLESPENDING
COSTOF
SERVICEDELIVERY
MARGIN
LOSS
PROVIDERREVENUE
PROVIDERREVENUE
Many Fixed Costs of ServicesRemain When Volume DecreasesAnd New Costs May Be Incurred,
Potentially Causing Financial Losses
COSTOF
SERVICEDELIVERY
COST OFNEW SVCS
39© Center for Healthcare Quality and Payment Reform www.CHQPR.org
A Payment Change isn’t Reform
Unless It Removes the BarriersBARRIER #1
BARRIER #2

So Why Haven’t We Fixed This??

In Healthcare,
Payers Are From Mars,
Providers Are From Venus

43© Center for Healthcare Quality and Payment Reform www.CHQPR.org
Provider Approach: Pay Us More…
NECESSARYSPENDING
AVOIDABLESPENDING
UNPAIDSERVICES
NECESSARYSPENDING
NEWLY PAIDSERVICES
$
PROVIDERSOLUTION:

44© Center for Healthcare Quality and Payment Reform www.CHQPR.org
Provider Approach: Pay Us More…
…and “Trust Us” on Savings
NECESSARYSPENDING
AVOIDABLESPENDING
UNPAIDSERVICES
NECESSARYSPENDING
NEWLY PAIDSERVICES
SAVINGS
$
PROVIDERSOLUTION:
Provider to Payer:“Paying for the services
saved money in a demonstration project,
so you can safely assume that you will
also save money if you pay all providers to deliver the services
for all patients”
AVOIDABLESPENDING

45© Center for Healthcare Quality and Payment Reform www.CHQPR.org
NECESSARYSPENDING
AVOIDABLESPENDING
NEWLY PAIDSERVICES
Payer Concern: No Accountability
to Reduce Avoidable Spending
NECESSARYSPENDING
AVOIDABLESPENDING
UNPAIDSERVICES
NECESSARYSPENDING
NEWLY PAIDSERVICES
SAVINGS
$
PROVIDERSOLUTION:
PAYER FEAR:
AVOIDABLESPENDING

46© Center for Healthcare Quality and Payment Reform www.CHQPR.org
Example: Accreditation Programs
• Hospitals and physician practices want to be paid more if they are certified as delivering care the right way by an accrediting agency
47© Center for Healthcare Quality and Payment Reform www.CHQPR.org
Does Accreditation
Assure High-Value Care?
• Thanks to Joint Commission hospital accreditation, there are no longer any infections or patient safety problems in hospitals

48© Center for Healthcare Quality and Payment Reform www.CHQPR.org
Accreditation ≠ High Quality

49© Center for Healthcare Quality and Payment Reform www.CHQPR.org
Does Accreditation
Assure High-Value Care?
• Thanks to Joint Commission hospital accreditation, there are no longer any infections or patient safety problems in hospitals
• Thanks to the Certification Commission for Health Information Technology (CCHIT), every EHR works effectively to support good patient care
50© Center for Healthcare Quality and Payment Reform www.CHQPR.org
Does Accreditation
Assure High-Value Care?
• Thanks to Joint Commission hospital accreditation, there are no longer any infections or patient safety problems in hospitals
• Thanks to the Certification Commission for Health Information Technology (CCHIT), every EHR works effectively to support good patient care
• Thanks to college accreditation organizations, every parent who sends their child to college knows they will get a good education and a good job after graduation
51© Center for Healthcare Quality and Payment Reform www.CHQPR.org
Does Accreditation
Assure High-Value Care?
• Thanks to Joint Commission hospital accreditation, there are no longer any infections or patient safety problems in hospitals
• Thanks to the Certification Commission for Health Information Technology (CCHIT), every EHR works effectively to support good patient care
• Thanks to college accreditation organizations, every parent who sends their child to college knows they will get a good education and a good job after graduation
Why Do We Waste Time and $
on Accreditation Programs
That Don’t Work?

In Healthcare,
Payers Are From Mars,
Providers Are From Venus
53© Center for Healthcare Quality and Payment Reform www.CHQPR.org
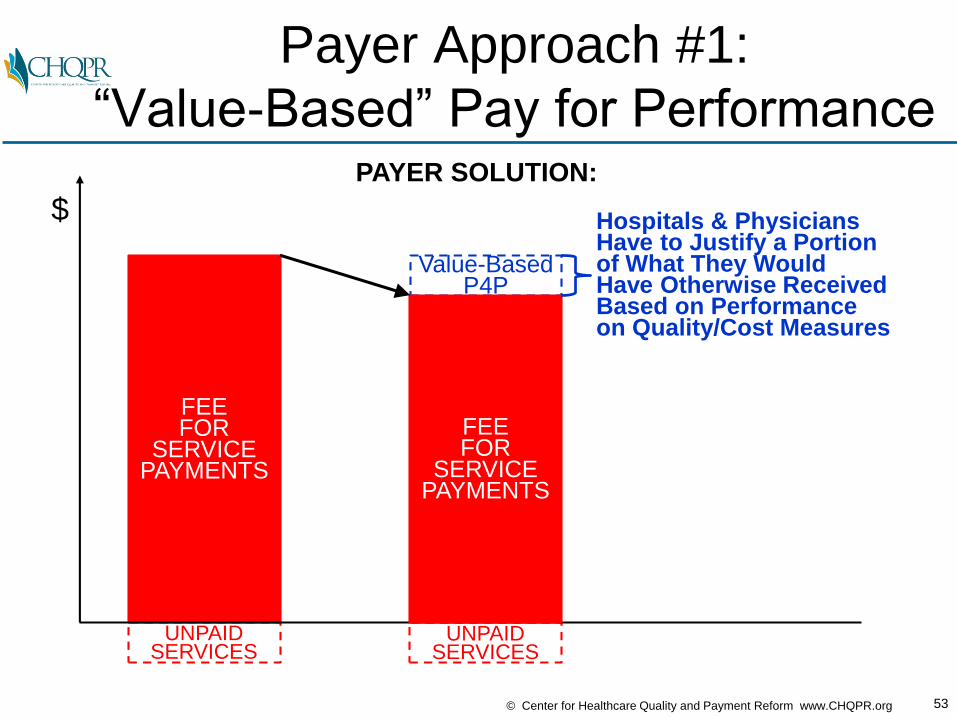
Payer Approach #1:
“Value-Based” Pay for Performance
FEE FOR
SERVICEPAYMENTS
UNPAIDSERVICES
Value-Based P4P
UNPAIDSERVICES
$
PAYER SOLUTION:
FEEFOR
SERVICEPAYMENTS
Hospitals & PhysiciansHave to Justify a Portionof What They WouldHave Otherwise ReceivedBased on Performanceon Quality/Cost Measures

54© Center for Healthcare Quality and Payment Reform www.CHQPR.org
“Incentives” for Providers
Don’t Overcome the FFS Barriers
FEE FOR
SERVICEPAYMENTS
UNPAIDSERVICES
UNPAIDSERVICES
$
PAYER SOLUTION:
FEEFOR
SERVICEPAYMENTS
LOSS OFREVENUE
• Small P4P bonuses may not be enough to pay for the added costs of improving quality
• P4P $ may not be enough to pay the costs of collecting and reporting the data
• Small P4P bonuses are less than the loss of fee-for-service revenuefrom lower utilization
Value-Based P4P
55© Center for Healthcare Quality and Payment Reform www.CHQPR.org
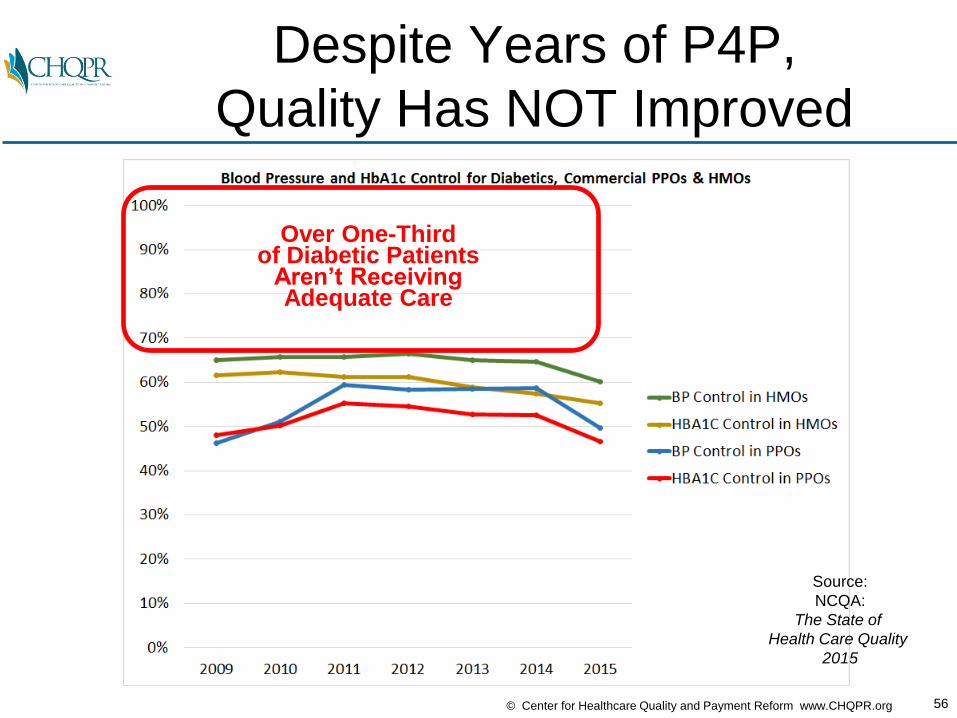
Despite Years of P4P,
Quality Has NOT Improved
Source:
NCQA:
The State of
Health Care Quality
2015
56© Center for Healthcare Quality and Payment Reform www.CHQPR.org
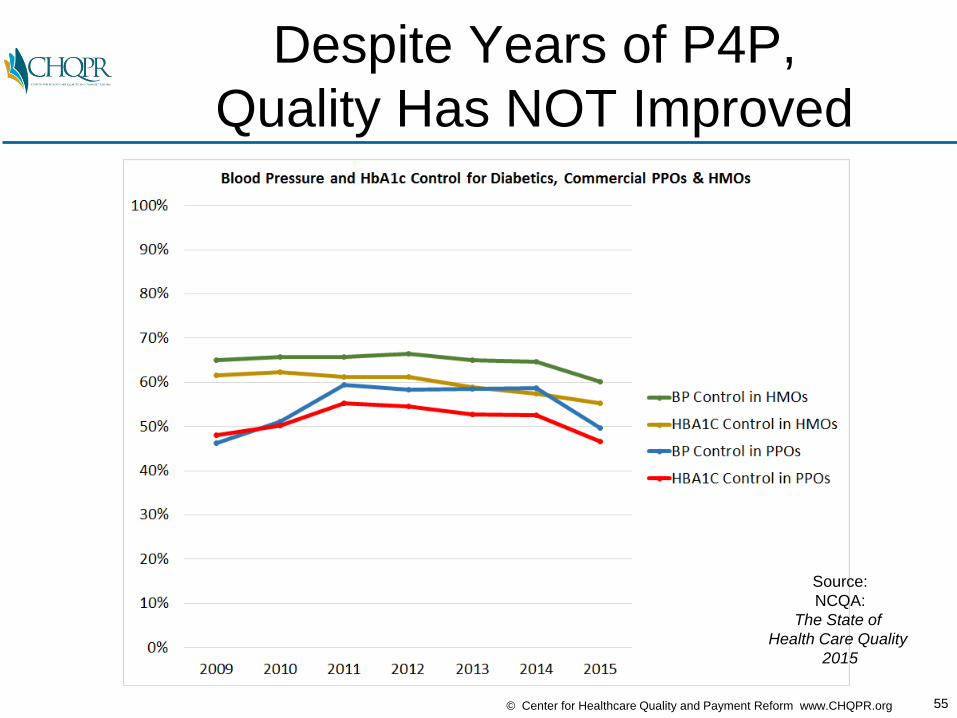
Despite Years of P4P,
Quality Has NOT Improved
Source:
NCQA:
The State of
Health Care Quality
2015
Over One-Thirdof Diabetic Patients
Aren’t ReceivingAdequate Care

57© Center for Healthcare Quality and Payment Reform www.CHQPR.org
Over-Emphasis on Narrow Quality
Measures Can Harm Patients
Hypoglycemia
1 Yr Mortality: 19.9%
30 Day Readmits: 16.3%
Hyperglycemia
1 Yr Mortality: 17.1%
30 Day Readmits: 15.3%
Source: National Trends in US Hospital Admissions for Hyperglycemia and HypoglycemiaAmong Medicare Beneficiaries, 1999 to 2011 JAMA Internal Medicine May 17, 2014
58© Center for Healthcare Quality and Payment Reform www.CHQPR.org
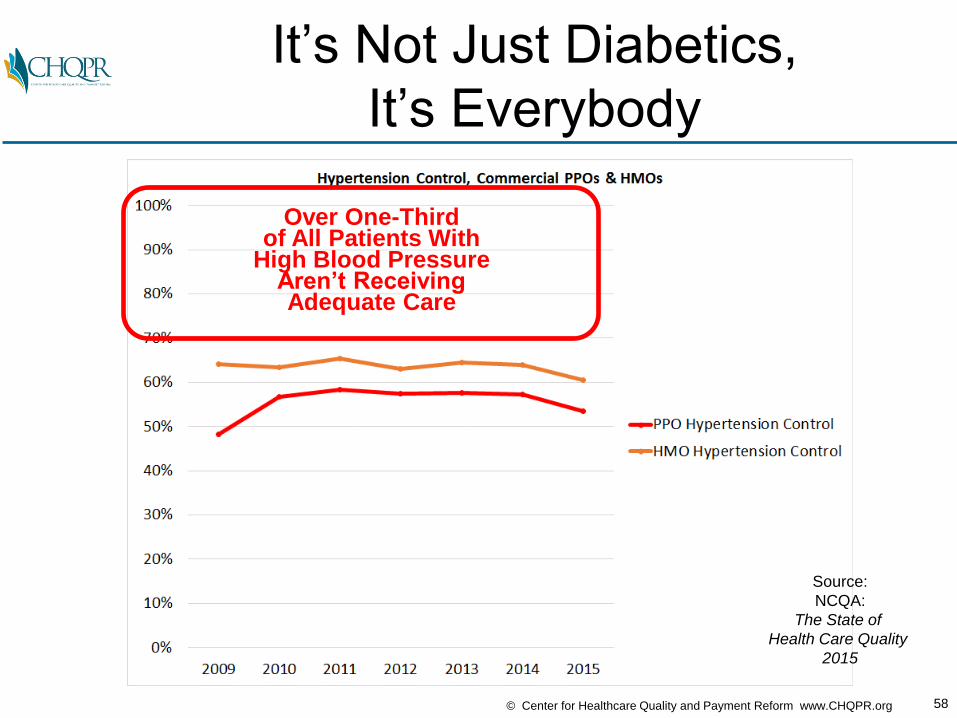
It’s Not Just Diabetics,
It’s Everybody
Source:
NCQA:
The State of
Health Care Quality
2015
Over One-Thirdof All Patients With
High Blood PressureAren’t ReceivingAdequate Care
59© Center for Healthcare Quality and Payment Reform www.CHQPR.org
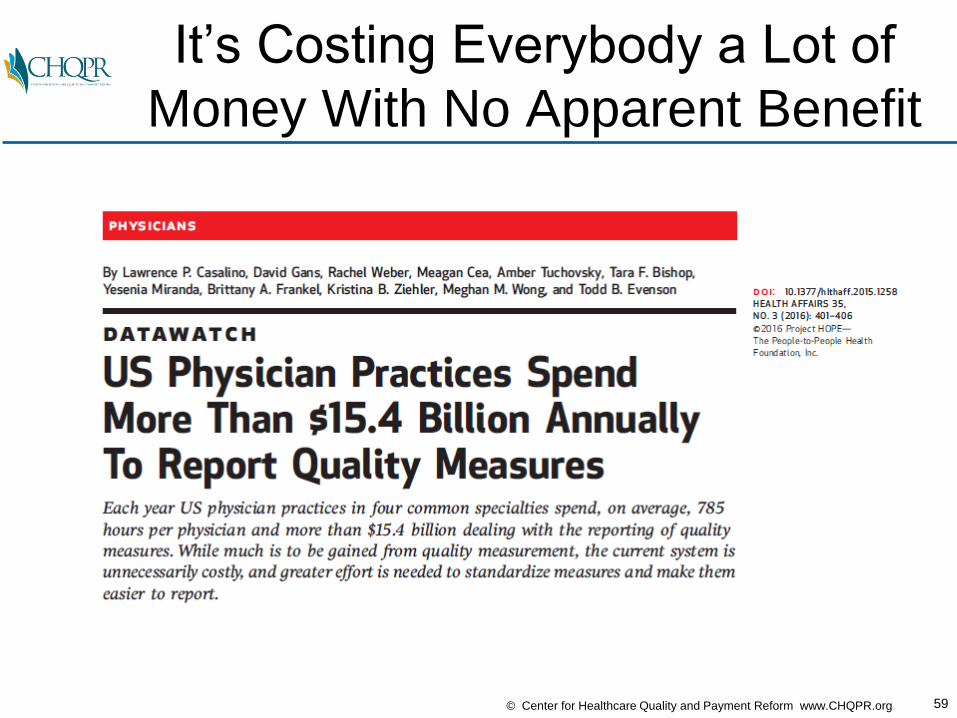
It’s Costing Everybody a Lot of
Money With No Apparent Benefit

60© Center for Healthcare Quality and Payment Reform www.CHQPR.org
P4P Has Been Studied to Death
&…

61© Center for Healthcare Quality and Payment Reform www.CHQPR.org
P4P Has Been Studied to Death
& It Doesn’t Work…
62© Center for Healthcare Quality and Payment Reform www.CHQPR.org
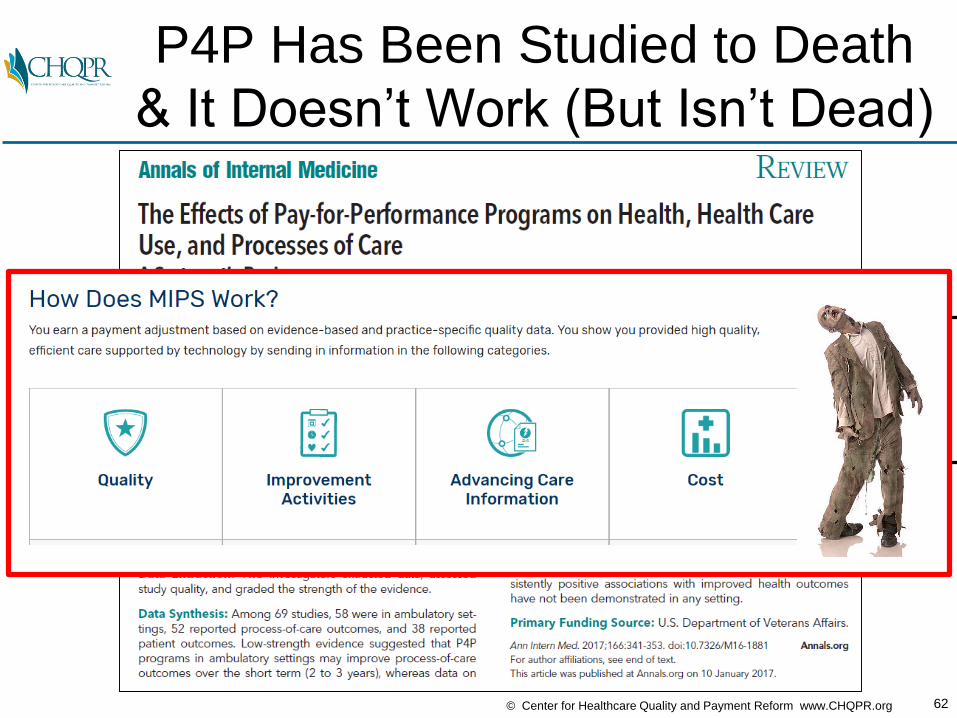
P4P Has Been Studied to Death
& It Doesn’t Work (But Isn’t Dead)
63© Center for Healthcare Quality and Payment Reform www.CHQPR.org
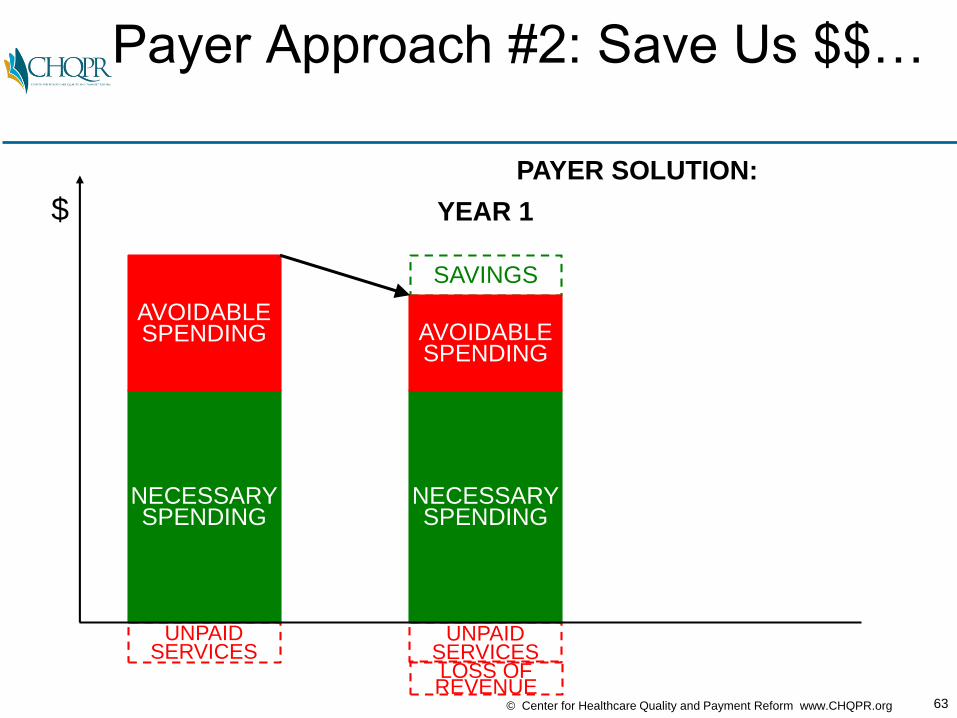
Payer Approach #2: Save Us $$…
NECESSARYSPENDING
AVOIDABLESPENDING
UNPAIDSERVICES
NECESSARYSPENDING
SAVINGS
UNPAIDSERVICES
$
PAYER SOLUTION:
YEAR 1
AVOIDABLESPENDING
LOSS OFREVENUE

64© Center for Healthcare Quality and Payment Reform www.CHQPR.org
NECESSARYSPENDING
Shared Svgs
Payer Approach #2: Save Us $$ &
(Maybe) We’ll Pay More Next Year
NECESSARYSPENDING
AVOIDABLESPENDING
UNPAIDSERVICES
NECESSARYSPENDING
SAVINGS
UNPAIDSERVICES
UNPAIDSERVICES
SAVINGS
AVOIDABLESPENDING
$
PAYER SOLUTION:
YEAR 1 YEAR 2
AVOIDABLESPENDING
LOSS OFREVENUE
LOSS OFREVENUE
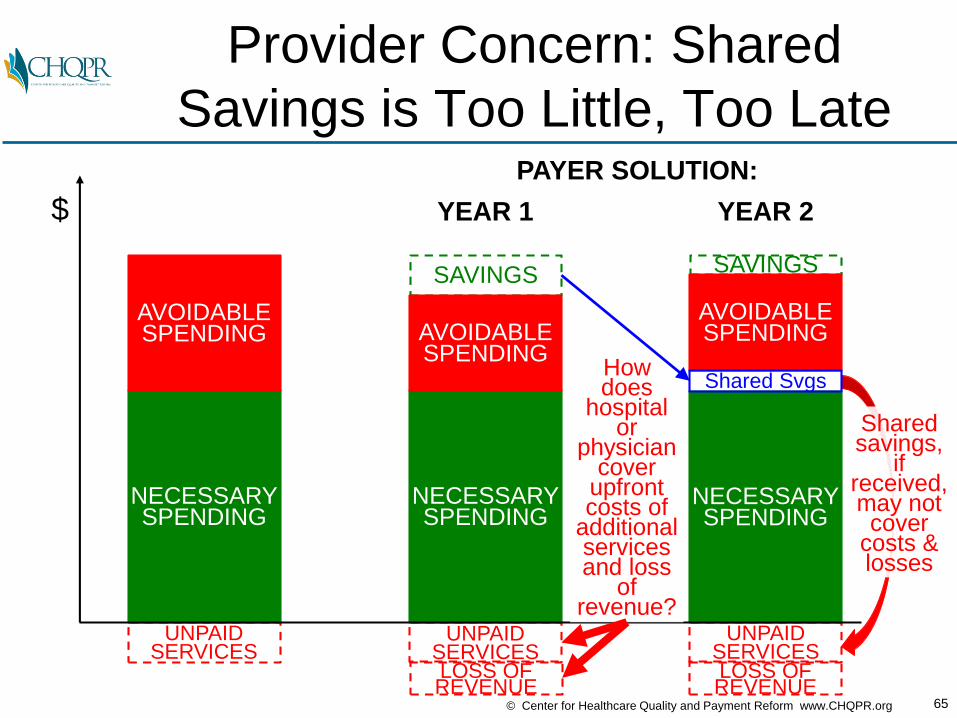
65© Center for Healthcare Quality and Payment Reform www.CHQPR.org
NECESSARYSPENDING
Provider Concern: Shared
Savings is Too Little, Too Late
NECESSARYSPENDING
AVOIDABLESPENDING
UNPAIDSERVICES
NECESSARYSPENDING
SAVINGS
UNPAIDSERVICES
UNPAIDSERVICES
SAVINGS
AVOIDABLESPENDING
Sharedsavings,
ifreceived,may not
covercosts &losses
$
PAYER SOLUTION:
YEAR 1 YEAR 2
Howdoes
hospitalor
physiciancover
upfrontcosts of
additionalservicesand loss
of revenue?
AVOIDABLESPENDING
LOSS OFREVENUE
LOSS OFREVENUE
Shared Svgs
66© Center for Healthcare Quality and Payment Reform www.CHQPR.org
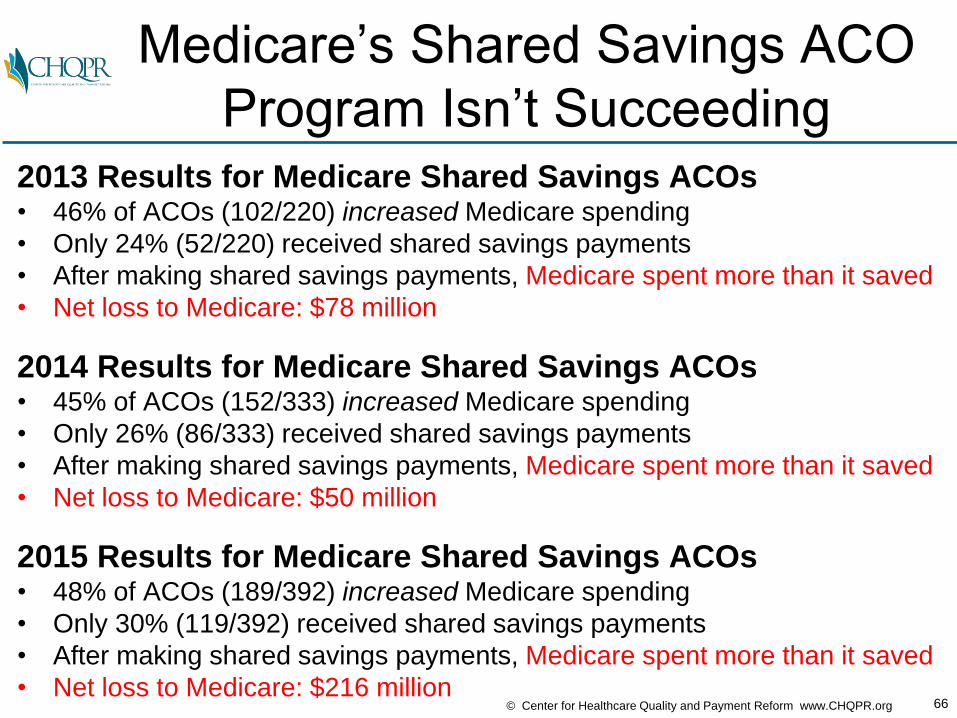
Medicare’s Shared Savings ACO
Program Isn’t Succeeding2013 Results for Medicare Shared Savings ACOs• 46% of ACOs (102/220) increased Medicare spending
• Only 24% (52/220) received shared savings payments
• After making shared savings payments, Medicare spent more than it saved
• Net loss to Medicare: $78 million
2014 Results for Medicare Shared Savings ACOs• 45% of ACOs (152/333) increased Medicare spending
• Only 26% (86/333) received shared savings payments
• After making shared savings payments, Medicare spent more than it saved
• Net loss to Medicare: $50 million
2015 Results for Medicare Shared Savings ACOs• 48% of ACOs (189/392) increased Medicare spending
• Only 30% (119/392) received shared savings payments
• After making shared savings payments, Medicare spent more than it saved
• Net loss to Medicare: $216 million
67© Center for Healthcare Quality and Payment Reform www.CHQPR.org
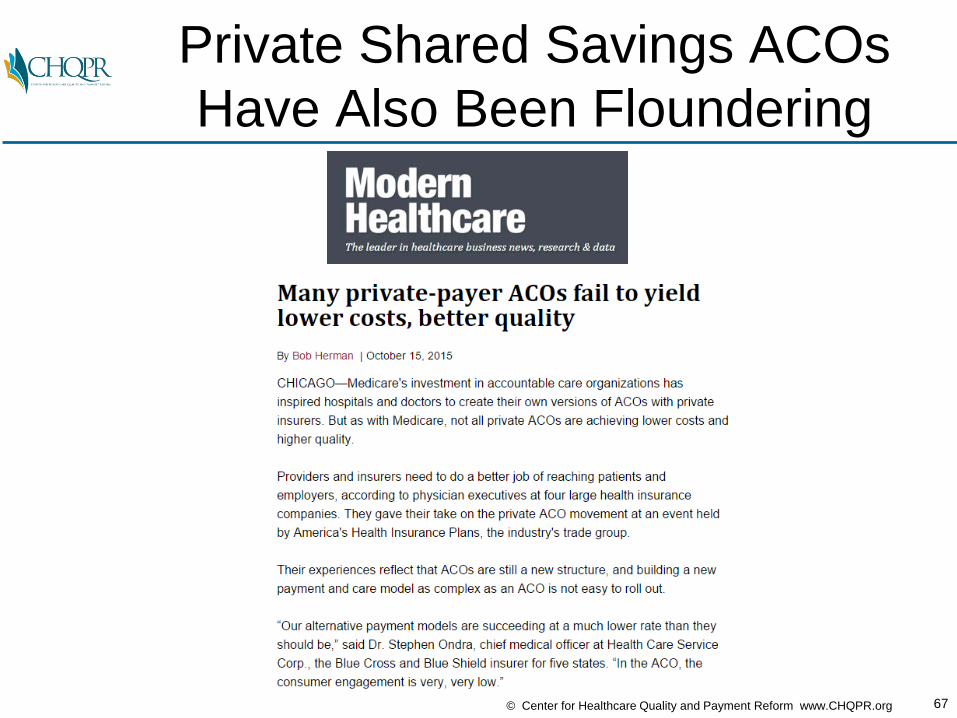
Private Shared Savings ACOs
Have Also Been Floundering

68© Center for Healthcare Quality and Payment Reform www.CHQPR.org
Primary
CareNeurosurgery OB/GYN
Why Aren’t ACOs Succeeding?
Cardiology
Heart
Disease
Cancer
Back Pain
PATIENTS
Pregnancy
Oncology
ACO
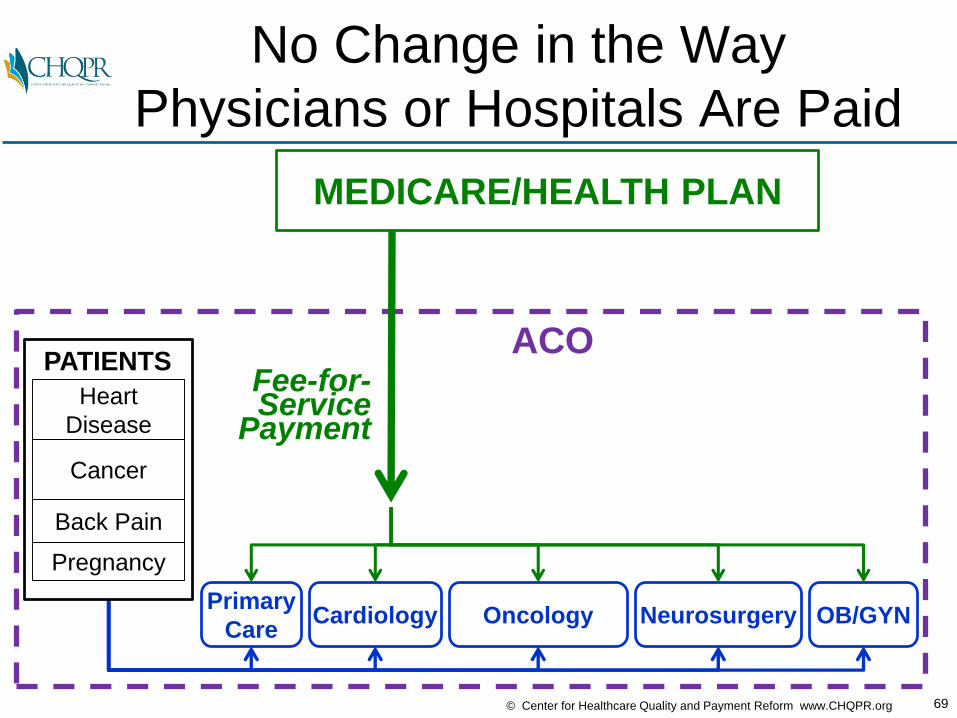
69© Center for Healthcare Quality and Payment Reform www.CHQPR.org
MEDICARE/HEALTH PLAN
Primary
CareNeurosurgery OB/GYN
No Change in the Way
Physicians or Hospitals Are Paid
Cardiology
Heart
Disease
Cancer
Back Pain
PATIENTS
Pregnancy
Oncology
Fee-for-Service
Payment
ACO
70© Center for Healthcare Quality and Payment Reform www.CHQPR.org
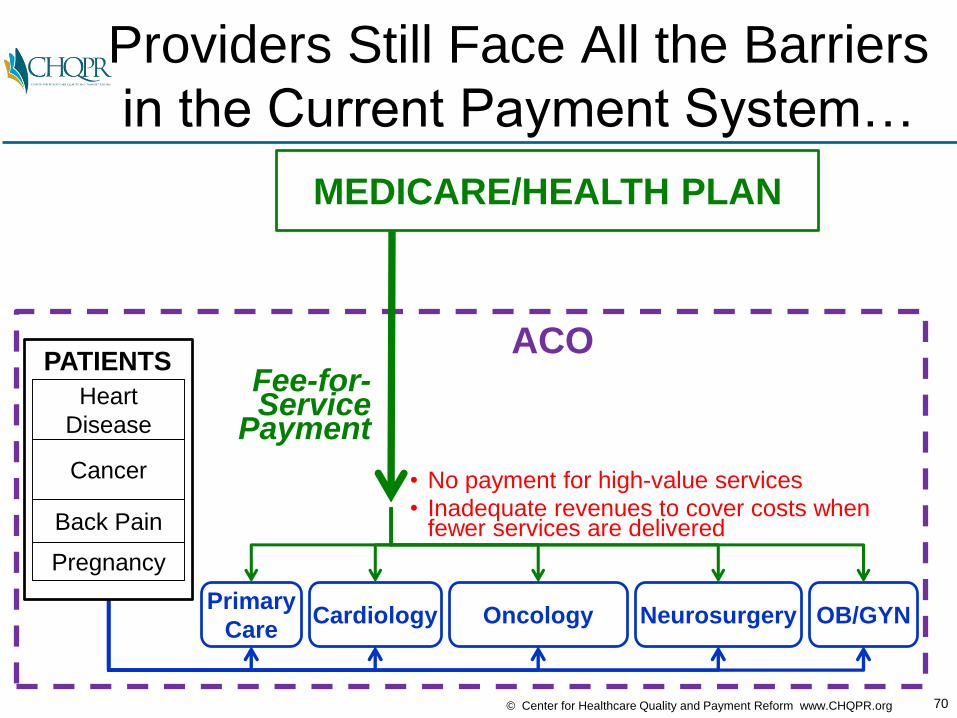
MEDICARE/HEALTH PLAN
Primary
CareNeurosurgery OB/GYN
Providers Still Face All the Barriers
in the Current Payment System…
Cardiology
Heart
Disease
Cancer
Back Pain
PATIENTS
Pregnancy
Oncology
• No payment for high-value services• Inadequate revenues to cover costs when
fewer services are delivered
Fee-for-Service
Payment
ACO

71© Center for Healthcare Quality and Payment Reform www.CHQPR.org
MEDICARE/HEALTH PLAN
Primary
CareNeurosurgery OB/GYN
…With Only the Potential for
Receiving Future “Shared Savings”
Cardiology
Heart
Disease
Cancer
Back Pain
PATIENTS
Pregnancy
Oncology
• No payment for high-value services• Inadequate revenues to cover costs when
fewer services are delivered
Fee-for-Service
Payment
ACO
Shared SavingsPayment Next Year???
72© Center for Healthcare Quality and Payment Reform www.CHQPR.org
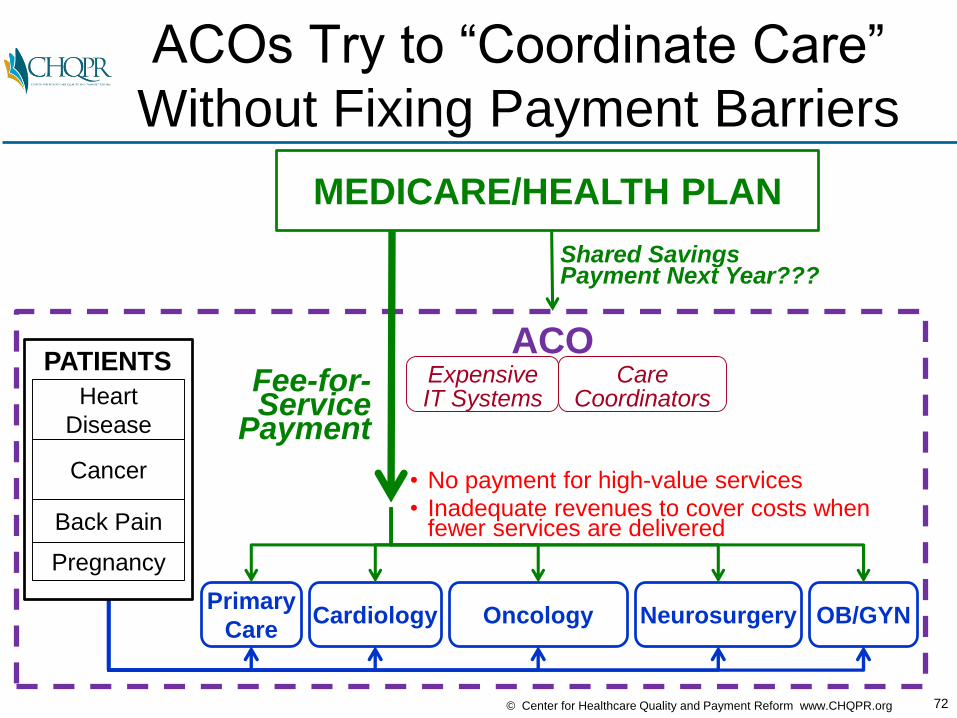
MEDICARE/HEALTH PLAN
Primary
Care
ACO
Neurosurgery OB/GYN
ACOs Try to “Coordinate Care”
Without Fixing Payment Barriers
Expensive IT Systems
Cardiology
CareCoordinatorsHeart
Disease
Cancer
Back Pain
PATIENTS
Pregnancy
Oncology
• No payment for high-value services• Inadequate revenues to cover costs when
fewer services are delivered
Fee-for-Service
Payment
Shared SavingsPayment Next Year???
73© Center for Healthcare Quality and Payment Reform www.CHQPR.org
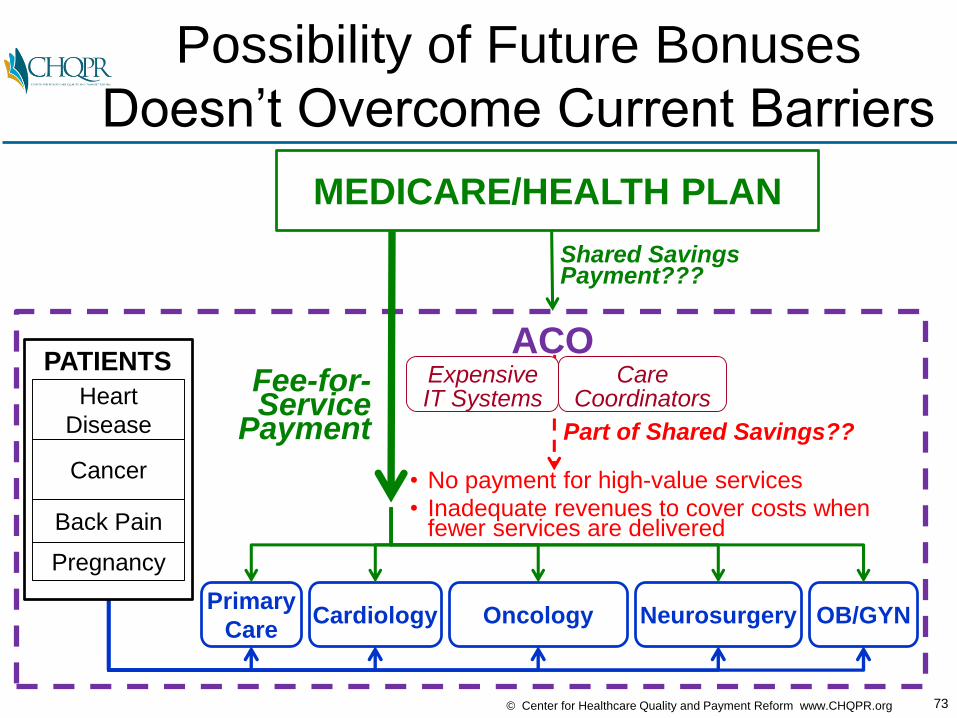
MEDICARE/HEALTH PLAN
Primary
Care
ACO
Neurosurgery OB/GYN
Possibility of Future Bonuses
Doesn’t Overcome Current Barriers
Expensive IT Systems
Cardiology
CareCoordinators
Shared SavingsPayment???
Part of Shared Savings??
Heart
Disease
Cancer
Back Pain
PATIENTS
Pregnancy
Oncology
• No payment for high-value services• Inadequate revenues to cover costs when
fewer services are delivered
Fee-for-Service
Payment

74© Center for Healthcare Quality and Payment Reform www.CHQPR.org
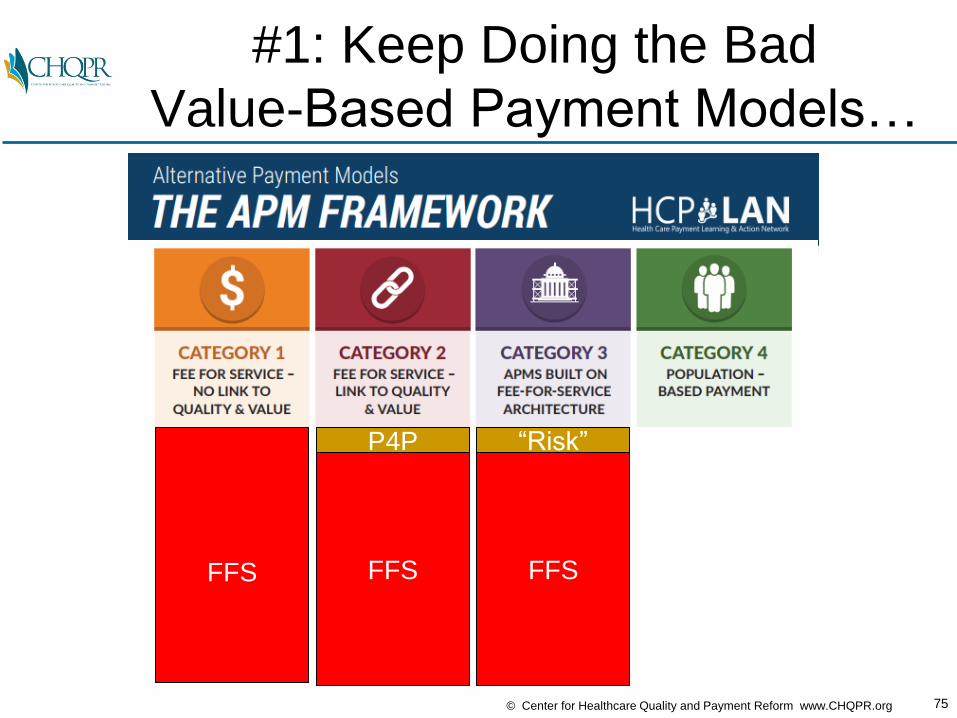
What Do Medicare, Health Plans,
and Big Systems Recommend?
75© Center for Healthcare Quality and Payment Reform www.CHQPR.org
#1: Keep Doing the Bad
Value-Based Payment Models…
FFS FFS
P4P
FFS
“Risk”

76© Center for Healthcare Quality and Payment Reform www.CHQPR.org
…Or #2: Implement
“Population-Based Payment”
Capitation/InsuranceRisk for
IntegratedDeliverySystems
FFS FFS
P4P
FFS
“Risk”

77© Center for Healthcare Quality and Payment Reform www.CHQPR.org
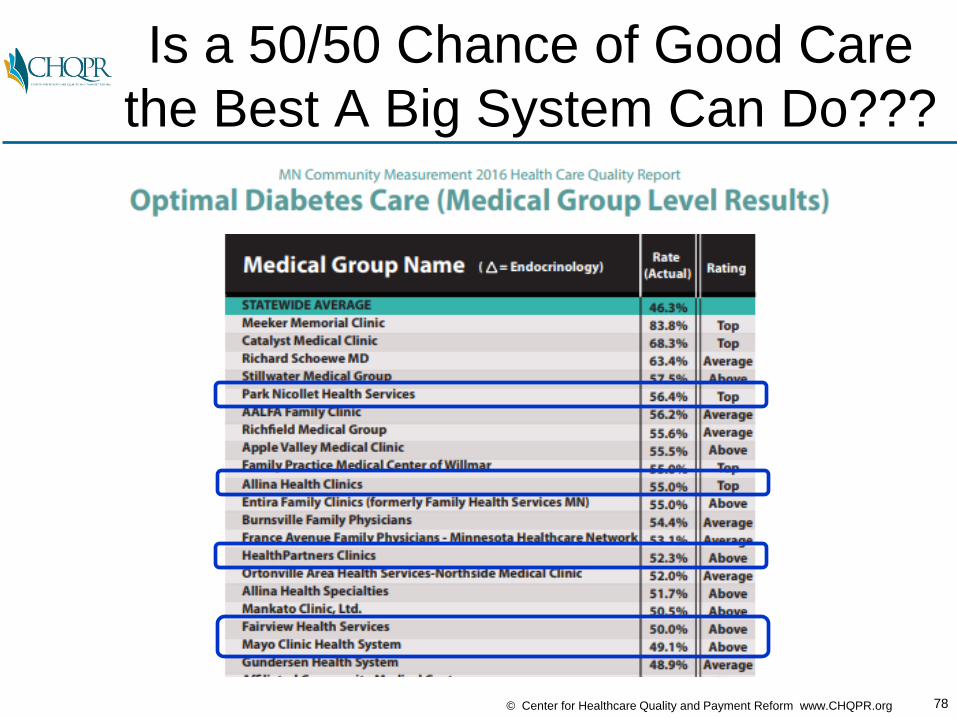
Capitation Has Not Transformed
Care Where It’s Being Used
Over One-Third
of Diabeticsin California
Aren’t GettingAdequate Care
HealthInsurancePremiums
inCalifornia
AreHigherThan
The U.S.Average
78© Center for Healthcare Quality and Payment Reform www.CHQPR.org
Is a 50/50 Chance of Good Care
the Best A Big System Can Do???

79© Center for Healthcare Quality and Payment Reform www.CHQPR.org
MEDICARE/HEALTH PLAN
Primary
Care
ACO/Integrated Delivery System
Neurosurgery OB/GYN
After the ACO/IDN Gets Capitation,
How It Will Pay Docs & Hospitals??
Expensive IT Systems
Cardiology
CareCoordinators
Heart
Disease
Cancer
Back Pain
PATIENTS
Pregnancy
Oncology
“Population-Based Payment”AKA Capitation“DOWNSIDE RISK”
FFSFFSFFSFFSPMPM
80© Center for Healthcare Quality and Payment Reform www.CHQPR.org
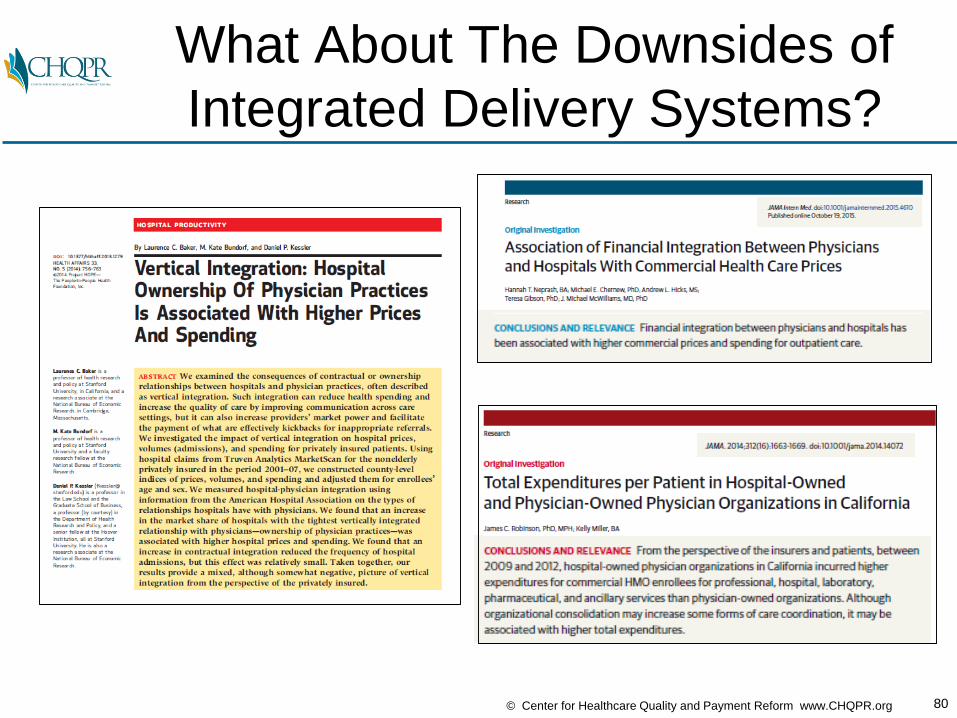
What About The Downsides of
Integrated Delivery Systems?

81© Center for Healthcare Quality and Payment Reform www.CHQPR.org
And What About the Advantages
of Small, Independent Practices?

82© Center for Healthcare Quality and Payment Reform www.CHQPR.org
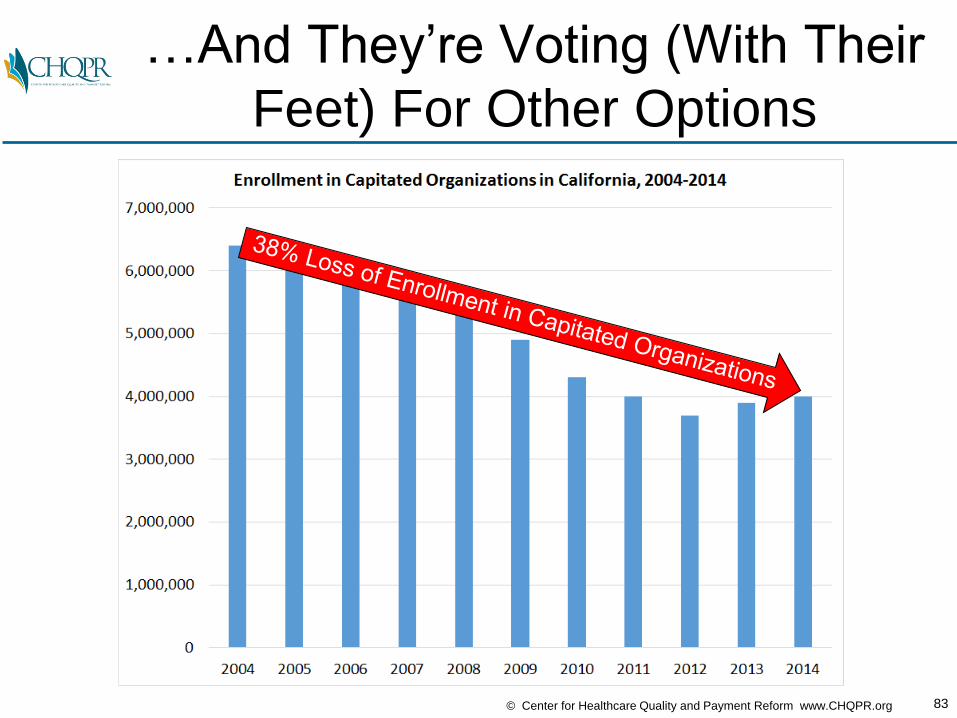
Patients Don’t See the Benefits of
Big Systems and Capitation…
83© Center for Healthcare Quality and Payment Reform www.CHQPR.org
…And They’re Voting (With Their
Feet) For Other Options
84© Center for Healthcare Quality and Payment Reform www.CHQPR.org
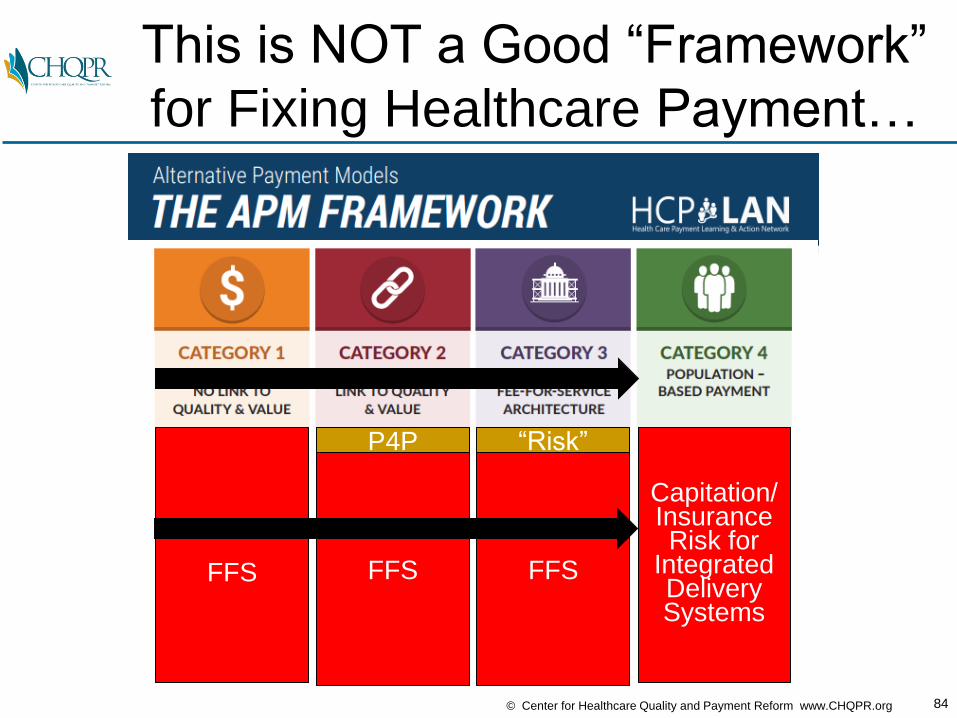
This is NOT a Good “Framework”
for Fixing Healthcare Payment…
Capitation/InsuranceRisk for
IntegratedDeliverySystems
FFS FFS
P4P
FFS
“Risk”
85© Center for Healthcare Quality and Payment Reform www.CHQPR.org
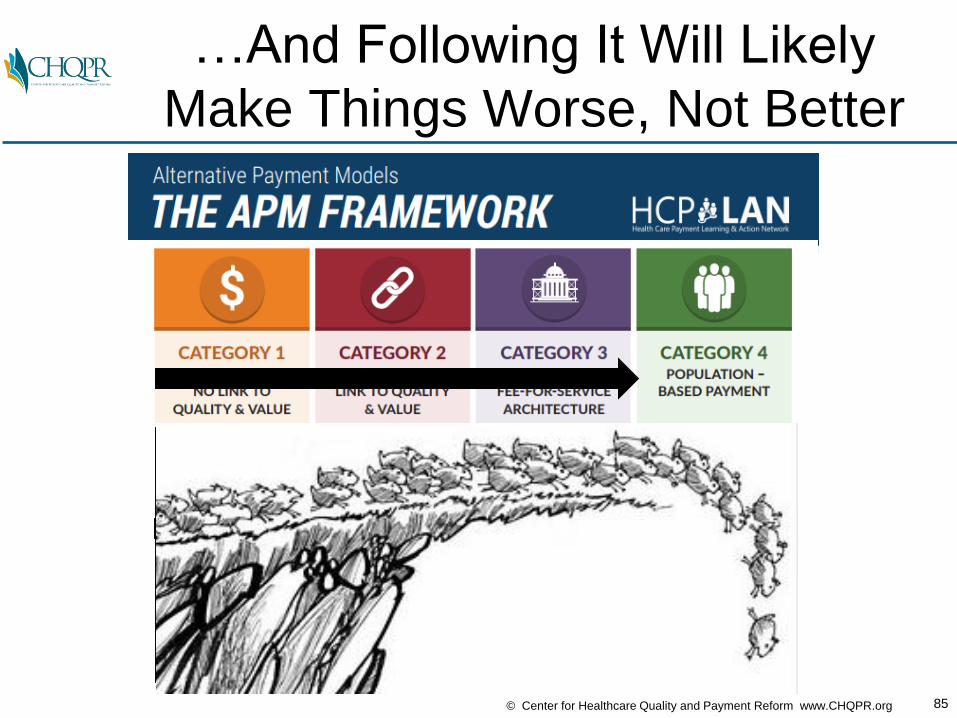
…And Following It Will Likely
Make Things Worse, Not Better
Capitation/InsuranceRisk for
IntegratedDeliverySystems
FFS FFS
P4P
FFS
“Risk”
86© Center for Healthcare Quality and Payment Reform www.CHQPR.org
Value-Based Payment Is Being
Designed the Wrong Way Today

87© Center for Healthcare Quality and Payment Reform www.CHQPR.org
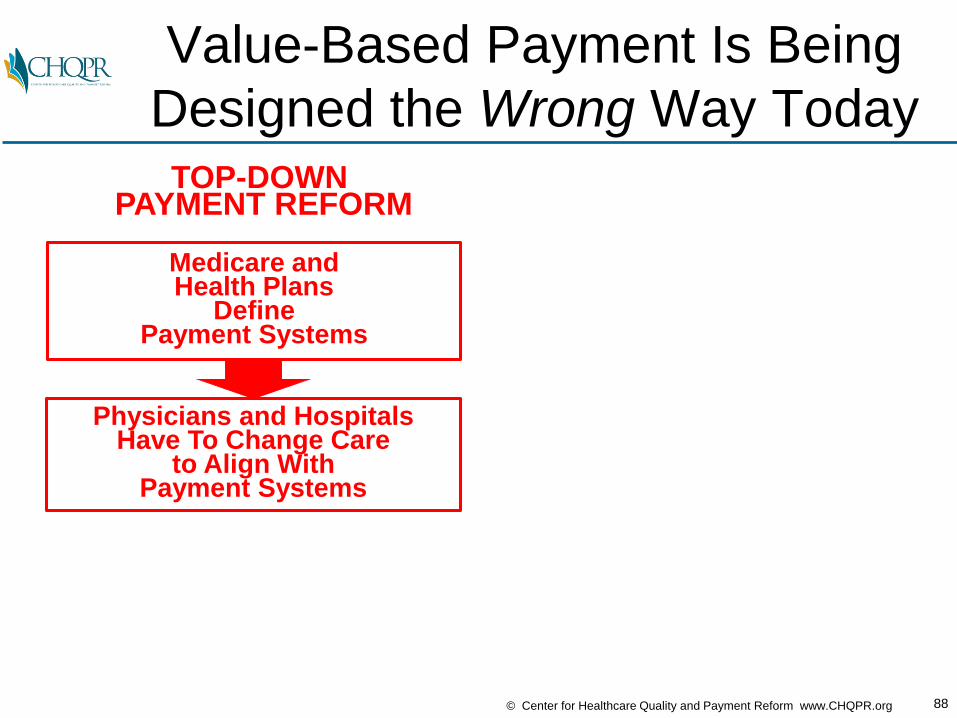
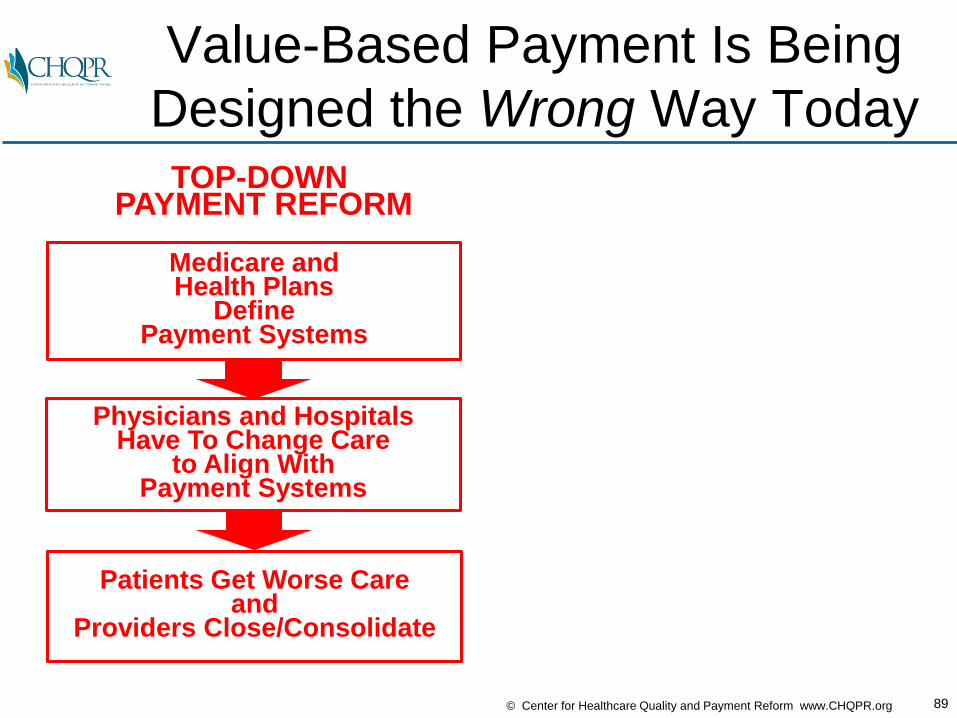
Value-Based Payment Is Being
Designed the Wrong Way Today
Medicare andHealth Plans
DefinePayment Systems
TOP-DOWN PAYMENT REFORM
88© Center for Healthcare Quality and Payment Reform www.CHQPR.org
Value-Based Payment Is Being
Designed the Wrong Way Today
Medicare andHealth Plans
DefinePayment Systems
Physicians and HospitalsHave To Change Care
to Align WithPayment Systems
TOP-DOWN PAYMENT REFORM
89© Center for Healthcare Quality and Payment Reform www.CHQPR.org
Patients Get Worse Careand
Providers Close/Consolidate
Value-Based Payment Is Being
Designed the Wrong Way Today
Medicare andHealth Plans
DefinePayment Systems
Physicians and HospitalsHave To Change Care
to Align WithPayment Systems
TOP-DOWN PAYMENT REFORM

90© Center for Healthcare Quality and Payment Reform www.CHQPR.org
Patients Get Worse Careand
Providers Close/Consolidate
Is There a Better Way?
Medicare andHealth Plans
DefinePayment Systems
Physicians and HospitalsHave To Change Care
to Align WithPayment Systems
TOP-DOWN PAYMENT REFORM
91© Center for Healthcare Quality and Payment Reform www.CHQPR.org
Patients Get Worse Careand
Providers Close/Consolidate
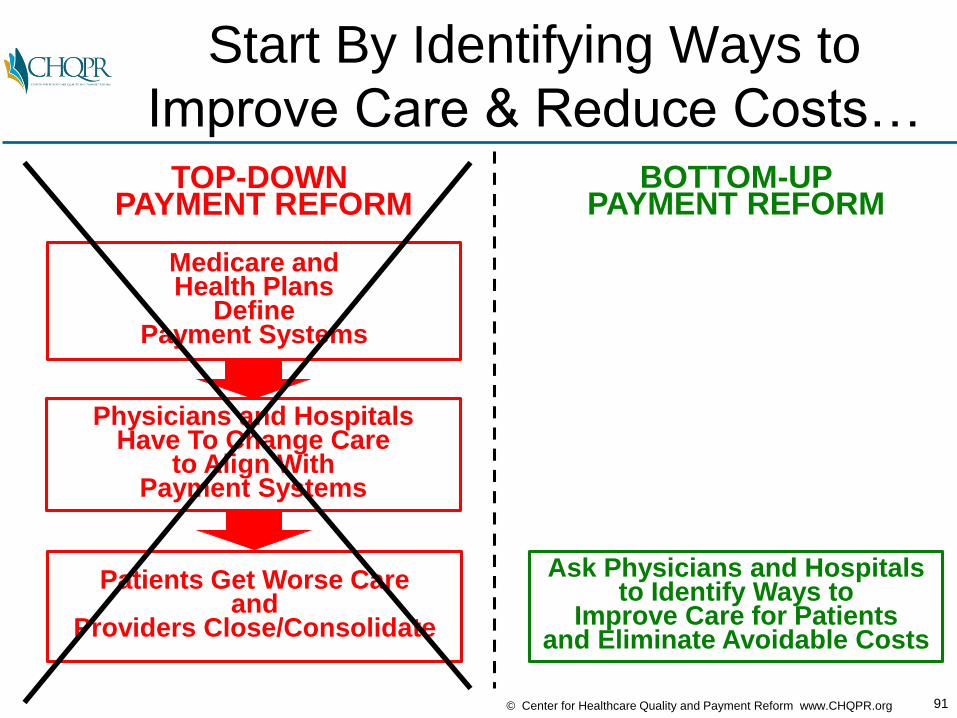
Start By Identifying Ways to
Improve Care & Reduce Costs…
Medicare andHealth Plans
DefinePayment Systems
Physicians and HospitalsHave To Change Care
to Align WithPayment Systems
TOP-DOWN PAYMENT REFORM
BOTTOM-UPPAYMENT REFORM
Ask Physicians and Hospitalsto Identify Ways to
Improve Care for Patients and Eliminate Avoidable Costs

92© Center for Healthcare Quality and Payment Reform www.CHQPR.org
Patients Get Worse Careand
Providers Close/Consolidate
…Pay Adequately & Expect
Accountability for Outcomes…
Medicare andHealth Plans
DefinePayment Systems
Physicians and HospitalsHave To Change Care
to Align WithPayment Systems
TOP-DOWN PAYMENT REFORM
BOTTOM-UPPAYMENT REFORM
Ask Physicians and Hospitalsto Identify Ways to
Improve Care for Patients and Eliminate Avoidable Costs
Payers Provide Adequate Payment for Quality Care &
Providers Take Accountabilityfor Quality & Efficiency

93© Center for Healthcare Quality and Payment Reform www.CHQPR.org
Patients Get Worse Careand
Providers Close/Consolidate
…So the Result is Better,
More Affordable Patient Care
Medicare andHealth Plans
DefinePayment Systems
Physicians and HospitalsHave To Change Care
to Align WithPayment Systems
TOP-DOWN PAYMENT REFORM
BOTTOM-UPPAYMENT REFORM
Ask Physicians and Hospitalsto Identify Ways to
Improve Care for Patients and Eliminate Avoidable Costs
Patients Get Good Careat an Affordable Cost and
Independent Providers Remain Financially Viable
Payers Provide Adequate Payment for Quality Care &
Providers Take Accountabilityfor Quality & Efficiency
What Happens When You Design Care Delivery
and Payment From the Bottom Up
Instead of From the Top Down?

95© Center for Healthcare Quality and Payment Reform www.CHQPR.org
Better Care at Lower Cost for
Total Joint ReplacementPHYSICIAN LEADER: Stephen J. Zabinski, MD
Director, Division of Orthopaedic Surgery, Shore Medical Ctr

96© Center for Healthcare Quality and Payment Reform www.CHQPR.org
Better Care at Lower Cost for
Total Joint Replacement
OPPORTUNITIESTO IMPROVE CARE AND LOWER COSTS
• Reduce surgical complications by reducing patient risk factors prior to surgery
• Obtain lower prices for implants from vendors
• Match implants to patient needs
• Return patients home as quickly as possible
• Use lower cost settings for surgery and rehabilitation
PHYSICIAN LEADER: Stephen J. Zabinski, MDDirector, Division of Orthopaedic Surgery, Shore Medical Ctr

97© Center for Healthcare Quality and Payment Reform www.CHQPR.org
Better Care at Lower Cost for
Total Joint Replacement
OPPORTUNITIESTO IMPROVE CARE AND LOWER COSTS
BARRIERS IN THE CURRENT
PAYMENT SYSTEM
• Reduce surgical complications by reducing patient risk factors prior to surgery
• Obtain lower prices for implants from vendors
• Match implants to patient needs
• Return patients home as quickly as possible
• Use lower cost settings for surgery and rehabilitation
• No payment for pre-operative patient risk reduction programs
• No payment for care coordination throughout surgical episode
• Separate payments to hospital and physician
• No data on costs of facilities
PHYSICIAN LEADER: Stephen J. Zabinski, MDDirector, Division of Orthopaedic Surgery, Shore Medical Ctr

98© Center for Healthcare Quality and Payment Reform www.CHQPR.org
Better Care at Lower Cost for
Total Joint Replacement
OPPORTUNITIESTO IMPROVE CARE AND LOWER COSTS
BARRIERS IN THE CURRENT
PAYMENT SYSTEM
RESULTS WITHADEQUATE PAYMENTFOR BETTER CARE
• Reduce surgical complications by reducing patient risk factors prior to surgery
• Obtain lower prices for implants from vendors
• Match implants to patient needs
• Return patients home as quickly as possible
• Use lower cost settings for surgery and rehabilitation
• No payment for pre-operative patient risk reduction programs
• No payment for care coordination throughout surgical episode
• Separate payments to hospital and physician
• No data on costs of facilities
• Average length of stayTKR: 3.3 1.8 daysTHR: 2.9 1.6 days
• Average device cost$6,301 $4,242
• Discharges to home34% 78%
• Readmission rate3.2% 2.7%
• Total Episode SpendingTKR: $25,365 $19,597THR: $26,580 $20,636
PHYSICIAN LEADER: Stephen J. Zabinski, MDDirector, Division of Orthopaedic Surgery, Shore Medical Ctr

99© Center for Healthcare Quality and Payment Reform www.CHQPR.org
Better Care at Lower Cost for
CancerPHYSICIAN LEADER: Barbara McAneny, MD
CEO, New Mexico Cancer Center
100© Center for Healthcare Quality and Payment Reform www.CHQPR.org
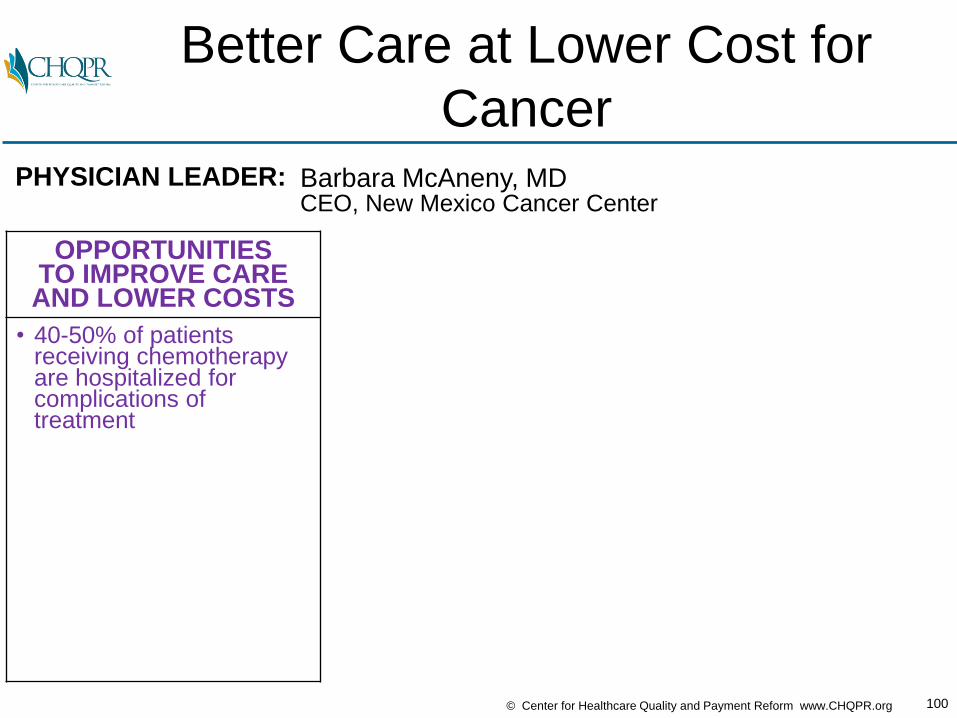
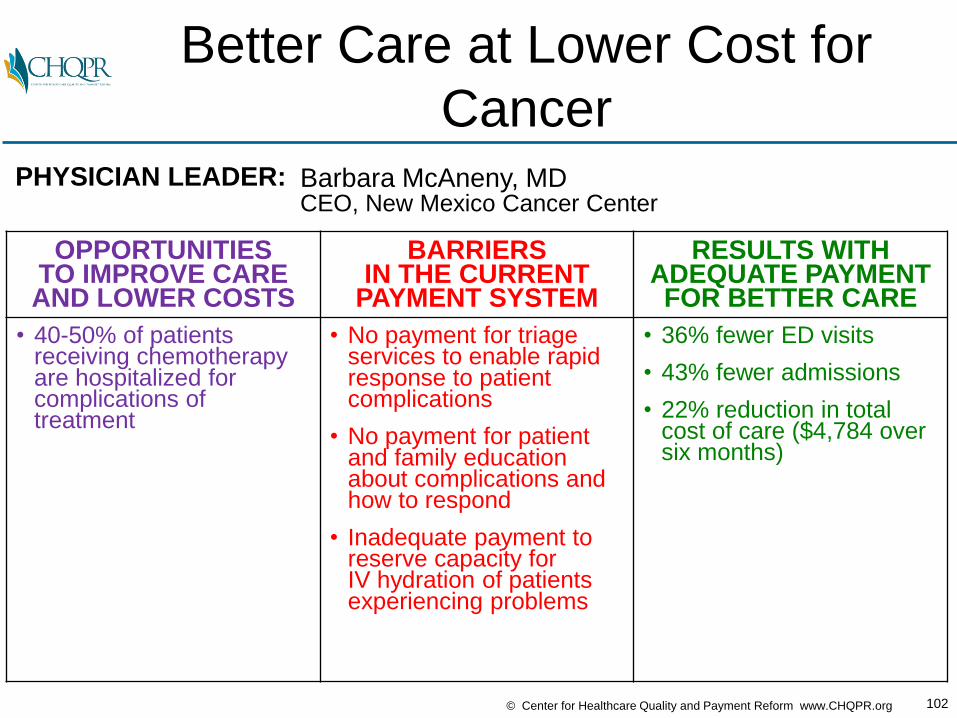
Better Care at Lower Cost for
Cancer
OPPORTUNITIESTO IMPROVE CARE AND LOWER COSTS
• 40-50% of patients receiving chemotherapyare hospitalized for complications of treatment
PHYSICIAN LEADER: Barbara McAneny, MDCEO, New Mexico Cancer Center

101© Center for Healthcare Quality and Payment Reform www.CHQPR.org
Better Care at Lower Cost for
Cancer
OPPORTUNITIESTO IMPROVE CARE AND LOWER COSTS
BARRIERS IN THE CURRENT
PAYMENT SYSTEM
• 40-50% of patients receiving chemotherapyare hospitalized for complications of treatment
• No payment for triage services to enable rapid response to patient complications
• No payment for patient and family education about complications and how to respond
• Inadequate payment to reserve capacity for IV hydration of patientsexperiencing problems
PHYSICIAN LEADER: Barbara McAneny, MDCEO, New Mexico Cancer Center
102© Center for Healthcare Quality and Payment Reform www.CHQPR.org
Better Care at Lower Cost for
Cancer
OPPORTUNITIESTO IMPROVE CARE AND LOWER COSTS
BARRIERS IN THE CURRENT
PAYMENT SYSTEM
RESULTS WITHADEQUATE PAYMENTFOR BETTER CARE
• 40-50% of patients receiving chemotherapyare hospitalized for complications of treatment
• No payment for triage services to enable rapid response to patient complications
• No payment for patient and family education about complications and how to respond
• Inadequate payment to reserve capacity for IV hydration of patientsexperiencing problems
• 36% fewer ED visits
• 43% fewer admissions
• 22% reduction in total cost of care ($4,784 over six months)
PHYSICIAN LEADER: Barbara McAneny, MDCEO, New Mexico Cancer Center
103© Center for Healthcare Quality and Payment Reform www.CHQPR.org
Better Care at Lower Cost for
Crohn’s DiseasePHYSICIAN LEADER: Lawrence R. Kosinski, MD
Managing Partner, Illinois Gastroenterology Group
104© Center for Healthcare Quality and Payment Reform www.CHQPR.org
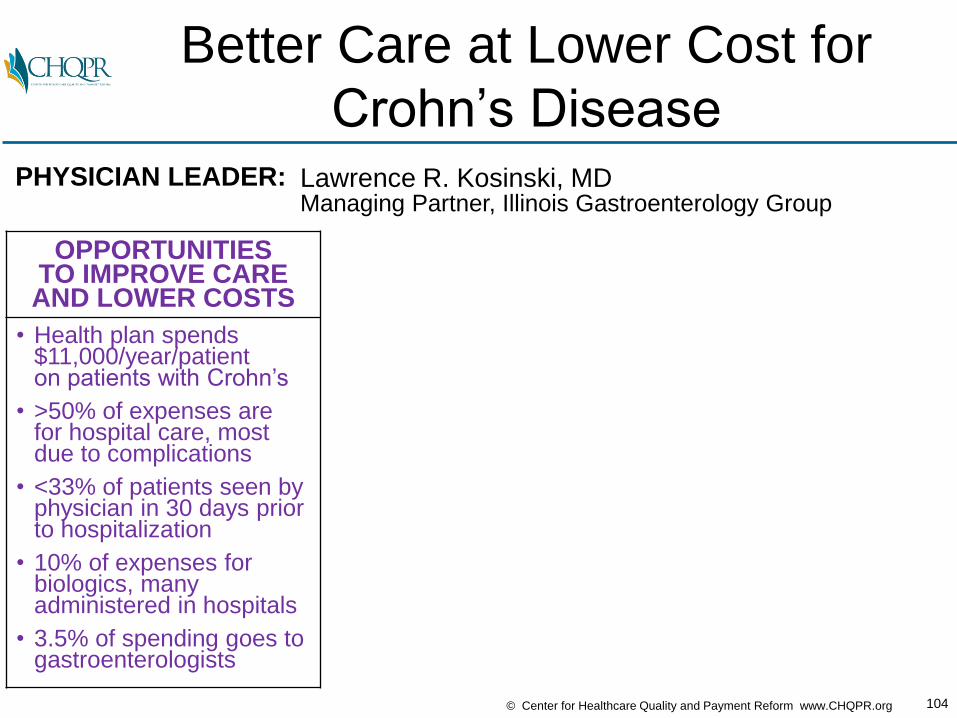
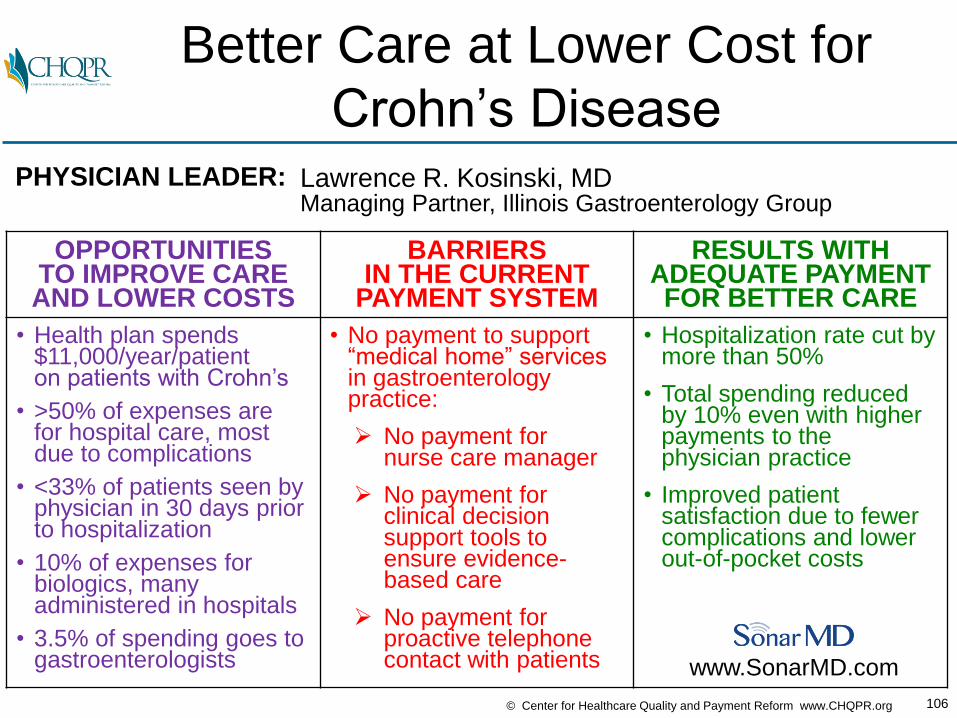
Better Care at Lower Cost for
Crohn’s Disease
OPPORTUNITIESTO IMPROVE CARE AND LOWER COSTS
• Health plan spends $11,000/year/patienton patients with Crohn’s
• >50% of expenses arefor hospital care, mostdue to complications
• <33% of patients seen by physician in 30 days prior to hospitalization
• 10% of expenses for biologics, many administered in hospitals
• 3.5% of spending goes to gastroenterologists
PHYSICIAN LEADER: Lawrence R. Kosinski, MDManaging Partner, Illinois Gastroenterology Group
105© Center for Healthcare Quality and Payment Reform www.CHQPR.org
Better Care at Lower Cost for
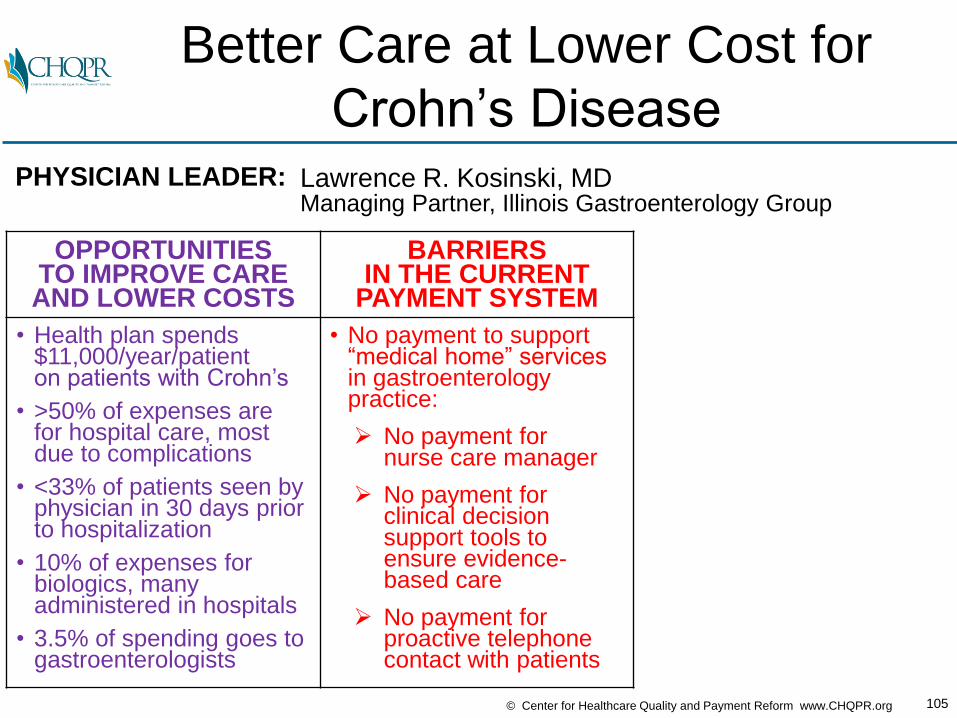
Crohn’s Disease
OPPORTUNITIESTO IMPROVE CARE AND LOWER COSTS
BARRIERS IN THE CURRENT
PAYMENT SYSTEM
• Health plan spends $11,000/year/patienton patients with Crohn’s
• >50% of expenses arefor hospital care, mostdue to complications
• <33% of patients seen by physician in 30 days prior to hospitalization
• 10% of expenses for biologics, many administered in hospitals
• 3.5% of spending goes to gastroenterologists
• No payment to support“medical home” services in gastroenterology practice:
No payment for nurse care manager
No payment for clinical decision support tools to ensure evidence-based care
No payment for proactive telephone contact with patients
PHYSICIAN LEADER: Lawrence R. Kosinski, MDManaging Partner, Illinois Gastroenterology Group
106© Center for Healthcare Quality and Payment Reform www.CHQPR.org
Better Care at Lower Cost for
Crohn’s Disease
OPPORTUNITIESTO IMPROVE CARE AND LOWER COSTS
BARRIERS IN THE CURRENT
PAYMENT SYSTEM
RESULTS WITHADEQUATE PAYMENTFOR BETTER CARE
• Health plan spends $11,000/year/patienton patients with Crohn’s
• >50% of expenses arefor hospital care, mostdue to complications
• <33% of patients seen by physician in 30 days prior to hospitalization
• 10% of expenses for biologics, many administered in hospitals
• 3.5% of spending goes to gastroenterologists
• No payment to support“medical home” services in gastroenterology practice:
No payment for nurse care manager
No payment for clinical decision support tools to ensure evidence-based care
No payment for proactive telephone contact with patients
• Hospitalization rate cut by more than 50%
• Total spending reduced by 10% even with higher payments to the physician practice
• Improved patient satisfaction due to fewer complications and lower out-of-pocket costs
PHYSICIAN LEADER: Lawrence R. Kosinski, MDManaging Partner, Illinois Gastroenterology Group
www.SonarMD.com

How Do You Define
a Physician-Focused
Alternative Payment Model?

108© Center for Healthcare Quality and Payment Reform www.CHQPR.org
FFSPayments to
PhysicianPractice
OPPORTUNITIES TO REDUCE SPENDING
THAT PHYSICIANS CAN CONTROL
• Reduce Avoidable Hospital Admissions
• Reduce Unnecessary Tests and Treatments
• Use Lower-Cost Tests and Treatments
• Deliver Services More Efficiently
• Use Lower-Cost Sites of Service
• Reduce Preventable Complications
• Prevent Serious Conditions From Occurring
$
PhysicianPracticeRevenue
Avoidable Spending
Payments toOther
Providersfor
RelatedServices
Step 1: Identify Opportunities to
Reduce Related SpendingFee-for-ServicePayment (FFS)
TotalSpendingRelevant
to thePhysician’s
Services
109© Center for Healthcare Quality and Payment Reform www.CHQPR.org
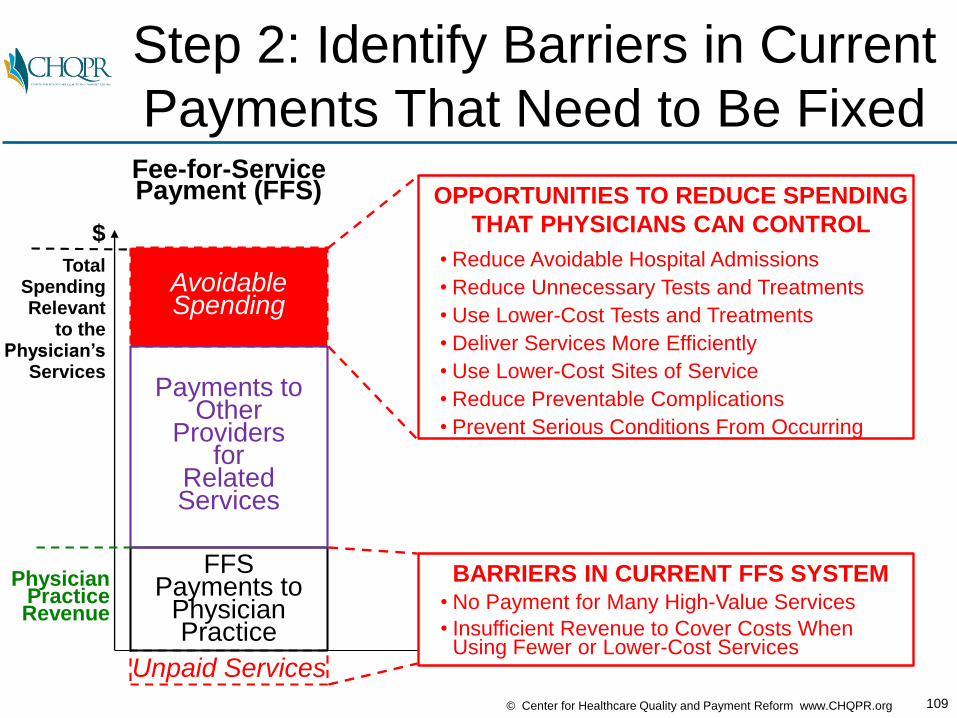
Unpaid Services
FFSPayments to
PhysicianPractice
BARRIERS IN CURRENT FFS SYSTEM• No Payment for Many High-Value Services
• Insufficient Revenue to Cover Costs WhenUsing Fewer or Lower-Cost Services
$
PhysicianPracticeRevenue
Avoidable Spending
Payments toOther
Providersfor
RelatedServices
Step 2: Identify Barriers in Current
Payments That Need to Be FixedFee-for-ServicePayment (FFS)
TotalSpendingRelevant
to thePhysician’s
Services
OPPORTUNITIES TO REDUCE SPENDING
THAT PHYSICIANS CAN CONTROL
• Reduce Avoidable Hospital Admissions
• Reduce Unnecessary Tests and Treatments
• Use Lower-Cost Tests and Treatments
• Deliver Services More Efficiently
• Use Lower-Cost Sites of Service
• Reduce Preventable Complications
• Prevent Serious Conditions From Occurring

110© Center for Healthcare Quality and Payment Reform www.CHQPR.org
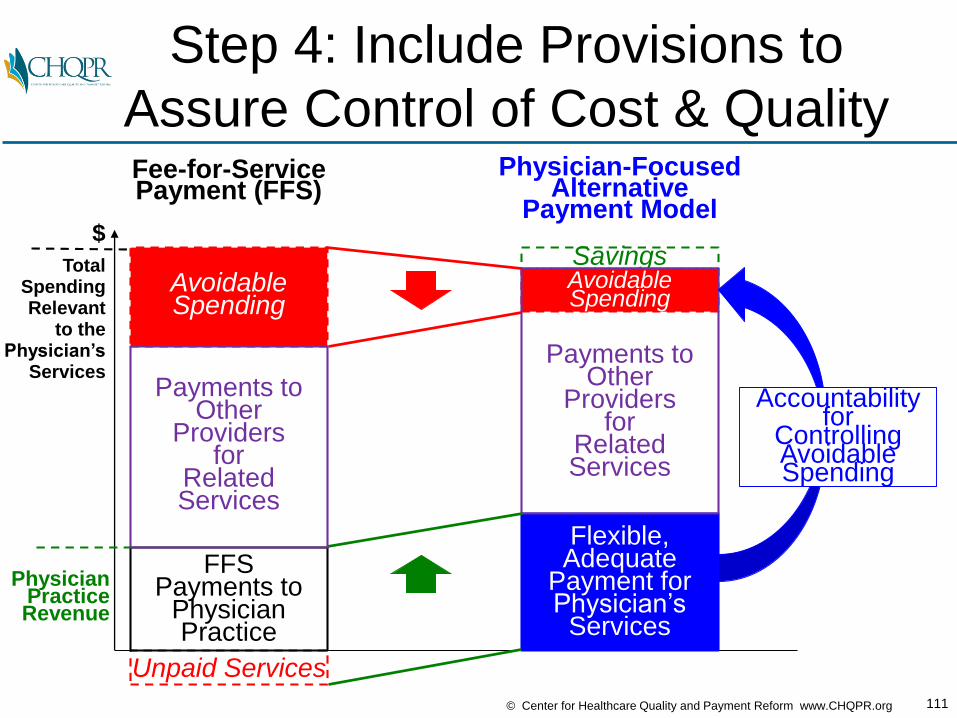
Fee-for-ServicePayment (FFS)
Physician-FocusedAlternative
Payment Model
Flexible,Adequate
Payment forPhysician’s
Services
$
PhysicianPracticeRevenue
Step 3: Design an APM That
Removes the Payment Barriers
Unpaid Services
FFSPayments to
PhysicianPractice
Avoidable Spending
Payments toOther
Providersfor
RelatedServices
TotalSpendingRelevant
to thePhysician’s
Services
111© Center for Healthcare Quality and Payment Reform www.CHQPR.org
Fee-for-ServicePayment (FFS)
Physician-FocusedAlternative
Payment Model
Savings
Flexible,Adequate
Payment forPhysician’s
Services
AvoidableSpending
Payments toOther
Providersfor
RelatedServices
Accountabilityfor
ControllingAvoidableSpending
$
PhysicianPracticeRevenue
Step 4: Include Provisions to
Assure Control of Cost & Quality
Unpaid Services
FFSPayments to
PhysicianPractice
Avoidable Spending
Payments toOther
Providersfor
RelatedServices
TotalSpendingRelevant
to thePhysician’s
Services
112© Center for Healthcare Quality and Payment Reform www.CHQPR.org
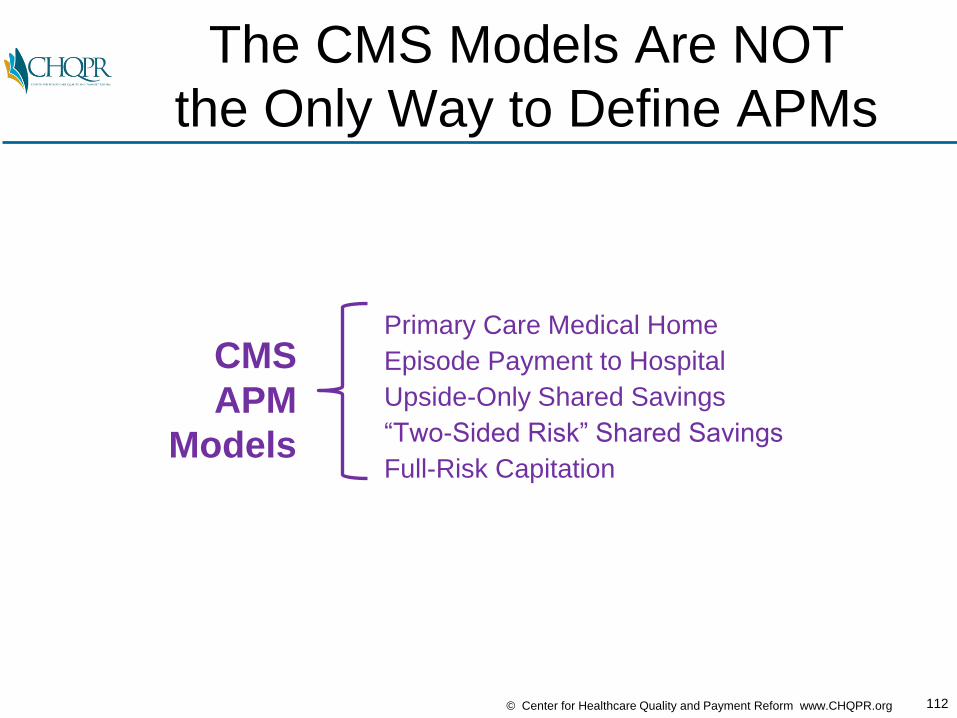
The CMS Models Are NOT
the Only Way to Define APMs
Primary Care Medical Home
Episode Payment to Hospital
Upside-Only Shared Savings
“Two-Sided Risk” Shared Savings
Full-Risk Capitation
CMS
APM
Models
113© Center for Healthcare Quality and Payment Reform www.CHQPR.org
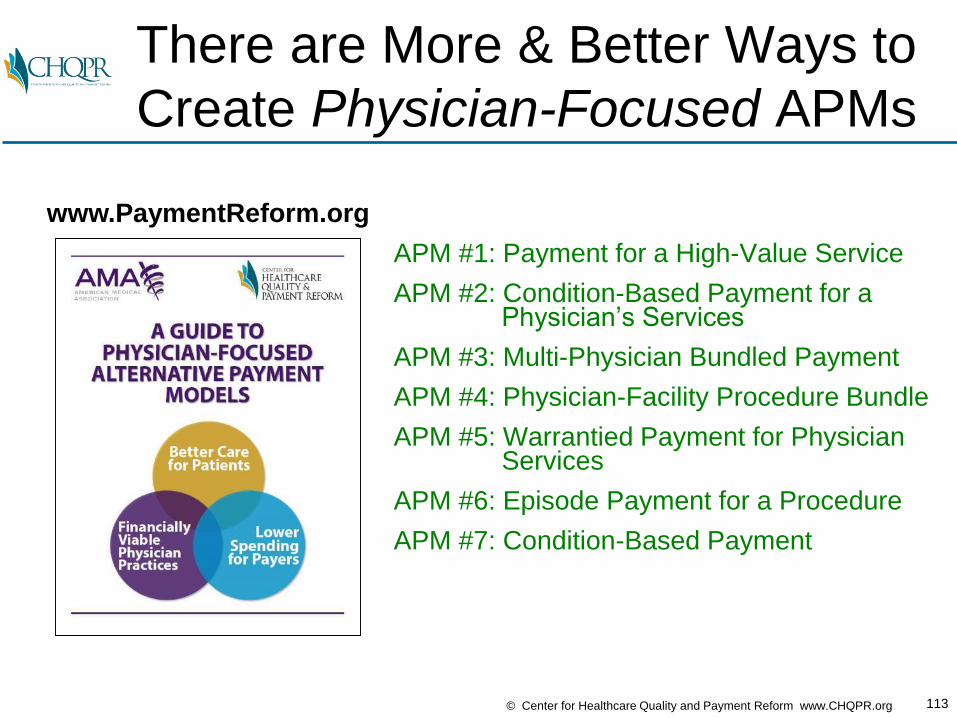
There are More & Better Ways to
Create Physician-Focused APMs
APM #1: Payment for a High-Value Service
APM #2: Condition-Based Payment for a Physician’s Services
APM #3: Multi-Physician Bundled Payment
APM #4: Physician-Facility Procedure Bundle
APM #5: Warrantied Payment for Physician Services
APM #6: Episode Payment for a Procedure
APM #7: Condition-Based Payment
www.PaymentReform.org
114© Center for Healthcare Quality and Payment Reform www.CHQPR.org
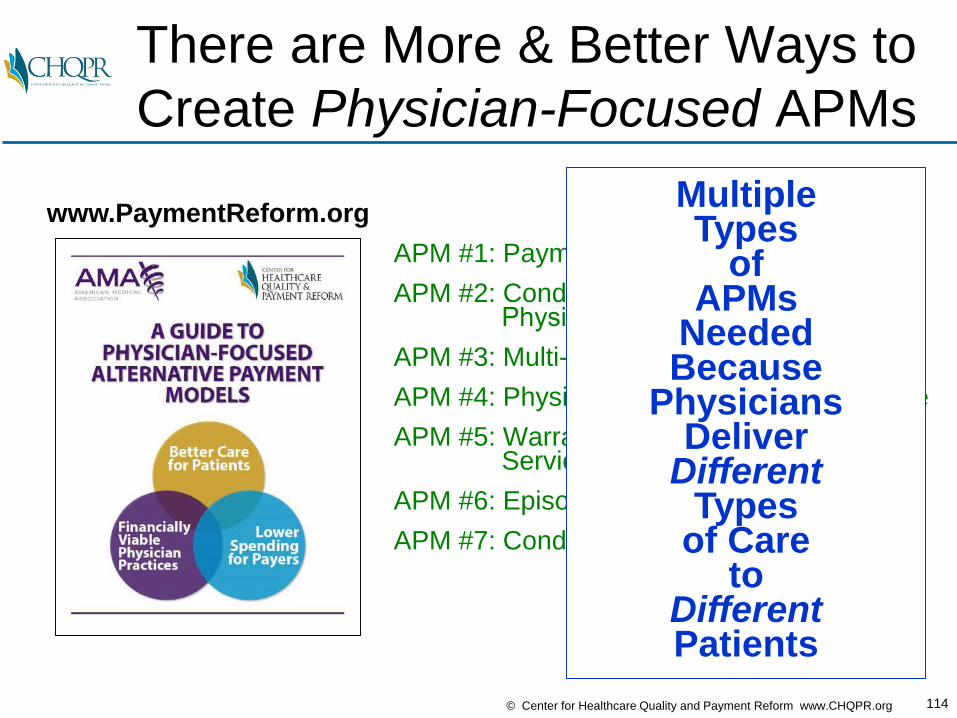
There are More & Better Ways to
Create Physician-Focused APMs
APM #1: Payment for a High-Value Service
APM #2: Condition-Based Payment for a Physician’s Services
APM #3: Multi-Physician Bundled Payment
APM #4: Physician-Facility Procedure Bundle
APM #5: Warrantied Payment for Physician Services
APM #6: Episode Payment for a Procedure
APM #7: Condition-Based Payment
www.PaymentReform.orgMultipleTypes
ofAPMs
NeededBecause
PhysiciansDeliver
DifferentTypes
of Careto
Different Patients
115© Center for Healthcare Quality and Payment Reform www.CHQPR.org
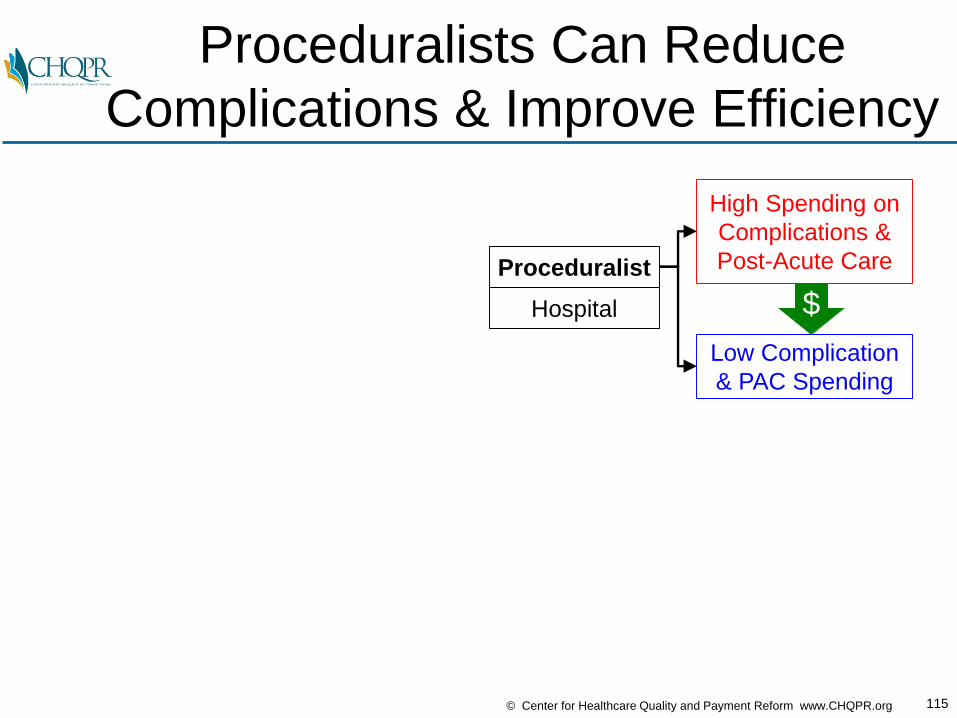
Proceduralists Can Reduce
Complications & Improve Efficiency
High Spending on
Complications &
Post-Acute Care
Low Complication
& PAC Spending
$Hospital
Proceduralist
116© Center for Healthcare Quality and Payment Reform www.CHQPR.org
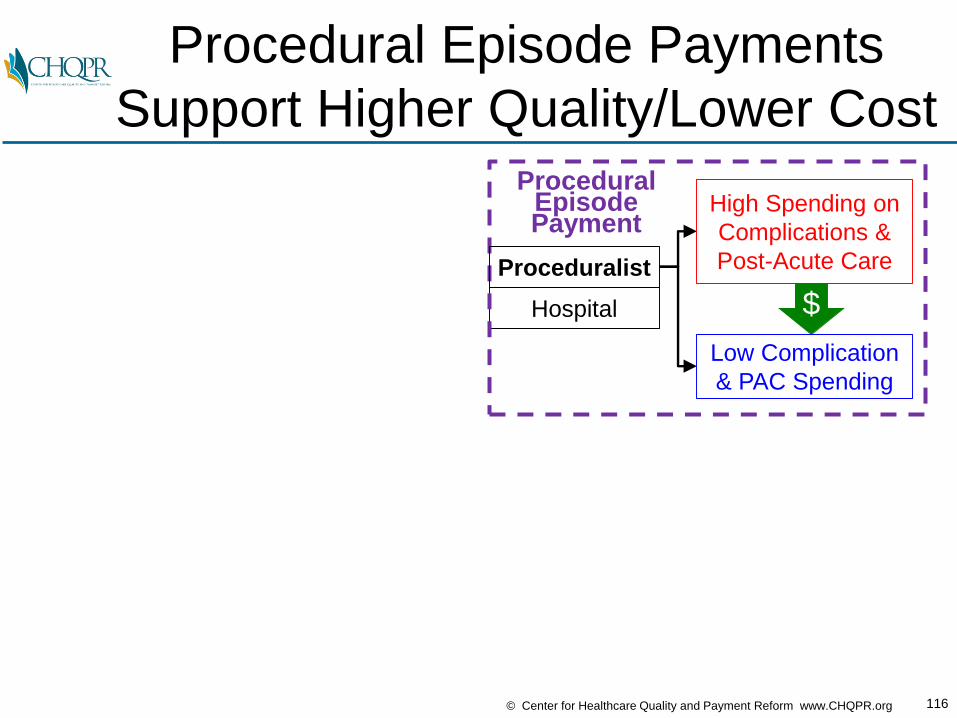
Procedural Episode Payments
Support Higher Quality/Lower Cost
$Hospital
ProceduralEpisodePayment
High Spending on
Complications &
Post-Acute Care
Low Complication
& PAC Spending
Proceduralist
117© Center for Healthcare Quality and Payment Reform www.CHQPR.org
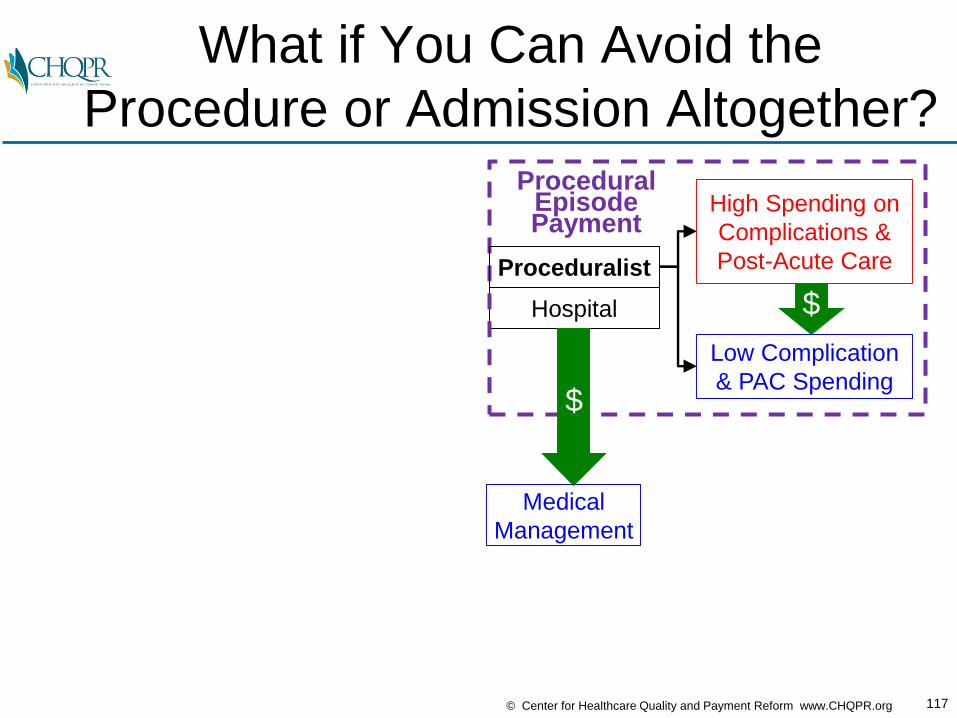
What if You Can Avoid the
Procedure or Admission Altogether?
$
Medical
Management
Hospital
High Spending on
Complications &
Post-Acute Care
Low Complication
& PAC Spending
Proceduralist
ProceduralEpisodePayment
$
118© Center for Healthcare Quality and Payment Reform www.CHQPR.org
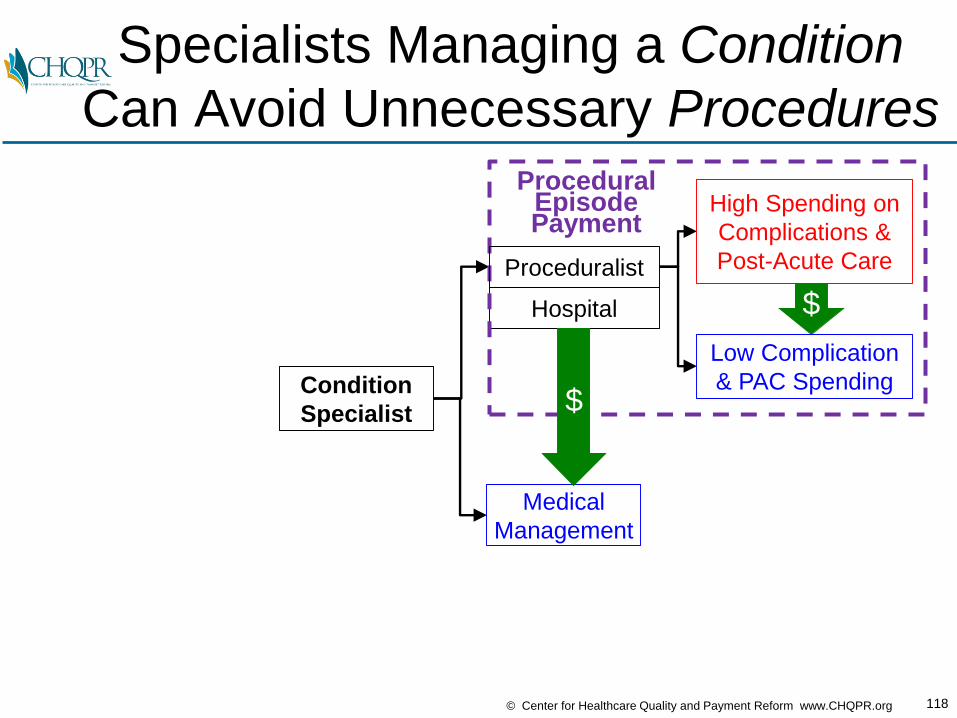
Specialists Managing a Condition
Can Avoid Unnecessary Procedures
$
Condition
Specialist
Medical
Management
Hospital
High Spending on
Complications &
Post-Acute Care
Low Complication
& PAC Spending
Proceduralist
ProceduralEpisodePayment
$

119© Center for Healthcare Quality and Payment Reform www.CHQPR.org
Condition-Based Payment Supports
Use of Highest-Value Treatment
$
Condition
Specialist
Medical
Management
Hospital
Condition-Based
PaymentHigh Spending on
Complications &
Post-Acute Care
Low Complication
& PAC Spending$
ProceduralEpisodePayment
Proceduralist

120© Center for Healthcare Quality and Payment Reform www.CHQPR.org
Are We Making the Payment
for the Correct Condition??
$
Wrong
Condition
Medical
Management???????
Correct
Condition
Correct
Treatment
Hospital
Condition-Based
PaymentHigh Spending on
Complications &
Post-Acute Care
Low Complication
& PAC Spending$
$
Proceduralist
ProceduralEpisodePayment
121© Center for Healthcare Quality and Payment Reform www.CHQPR.org
Diagnostic Error is a Fundamental
Quality Issue Underlying All Others

122© Center for Healthcare Quality and Payment Reform www.CHQPR.org
The Diagnostician Ensures the
Right Condition is Being Treated
$
Condition
Specialist
Medical
ManagementDiagnostician
Correct
Condition
Correct
Treatment
Hospital
Condition-Based
PaymentHigh Spending on
Complications &
Post-Acute Care
Low Complication
& PAC Spending$
$
Proceduralist
ProceduralEpisodePayment
123© Center for Healthcare Quality and Payment Reform www.CHQPR.org
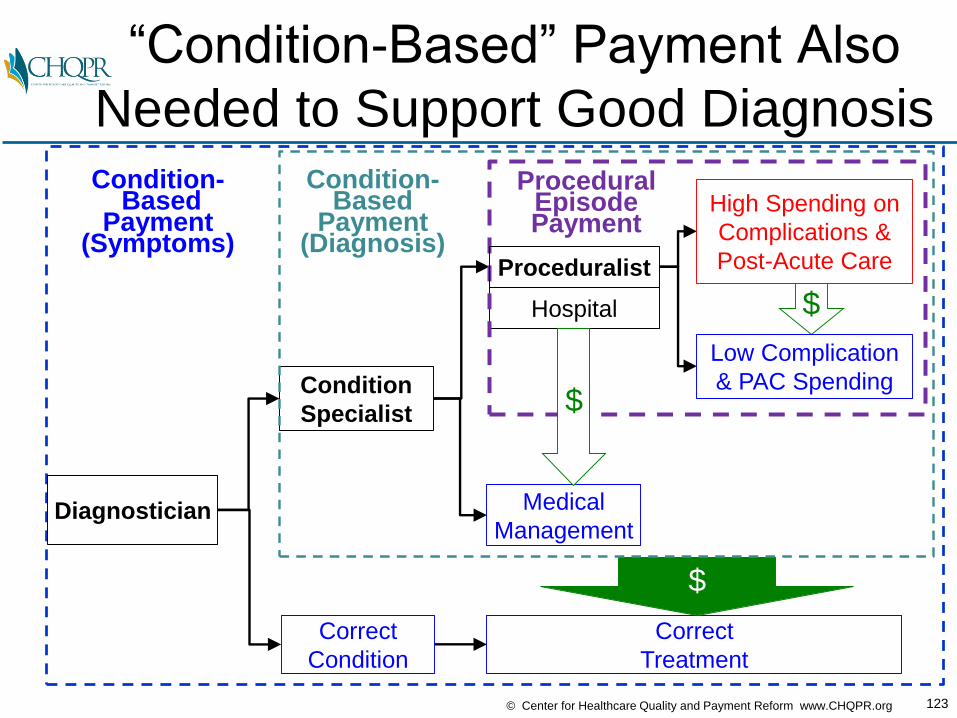
“Condition-Based” Payment Also
Needed to Support Good Diagnosis
Correct
Condition
Correct
Treatment
Condition-Based
Payment(Symptoms)
$
$
Condition
Specialist
Medical
Management
Hospital
Condition-Based
Payment(Diagnosis)
High Spending on
Complications &
Post-Acute Care
Low Complication
& PAC Spending$
Proceduralist
ProceduralEpisodePayment
Diagnostician
124© Center for Healthcare Quality and Payment Reform www.CHQPR.org
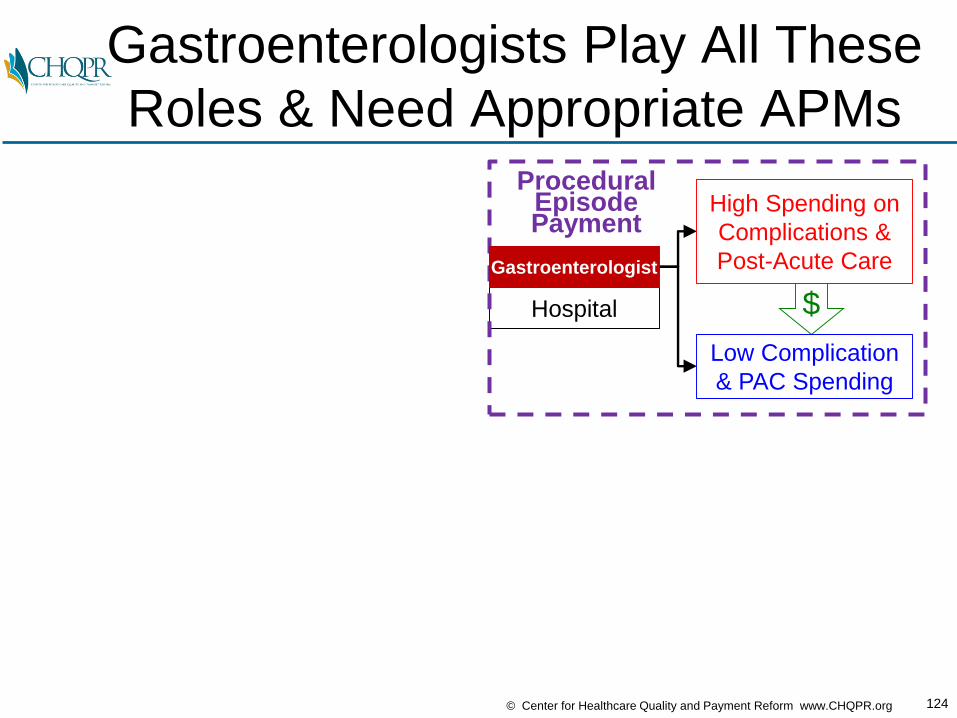
Gastroenterologists Play All These
Roles & Need Appropriate APMs
$Hospital
High Spending on
Complications &
Post-Acute Care
Low Complication
& PAC Spending
Gastroenterologist
ProceduralEpisodePayment

125© Center for Healthcare Quality and Payment Reform www.CHQPR.org
Gastroenterologists Play All These
Roles & Need Appropriate APMs
$
Gastroenterologist
Medical
Management
Hospital
Condition-Based
Payment(Diagnosis)
High Spending on
Complications &
Post-Acute Care
Low Complication
& PAC Spending$
Gastroenterologist
ProceduralEpisodePayment

126© Center for Healthcare Quality and Payment Reform www.CHQPR.org
Gastroenterologists Play All These
Roles & Need Appropriate APMs
Correct
Condition
Correct
Treatment
Condition-Based
Payment(Symptoms)
$
$
Gastroenterologist
Medical
Management
Hospital
Condition-Based
Payment(Diagnosis)
High Spending on
Complications &
Post-Acute Care
Low Complication
& PAC Spending$
Gastroenterologist
ProceduralEpisodePayment
Gastroenterologist
127© Center for Healthcare Quality and Payment Reform www.CHQPR.org
How Would You Design APMs for
Gastroenterology?
128© Center for Healthcare Quality and Payment Reform www.CHQPR.org
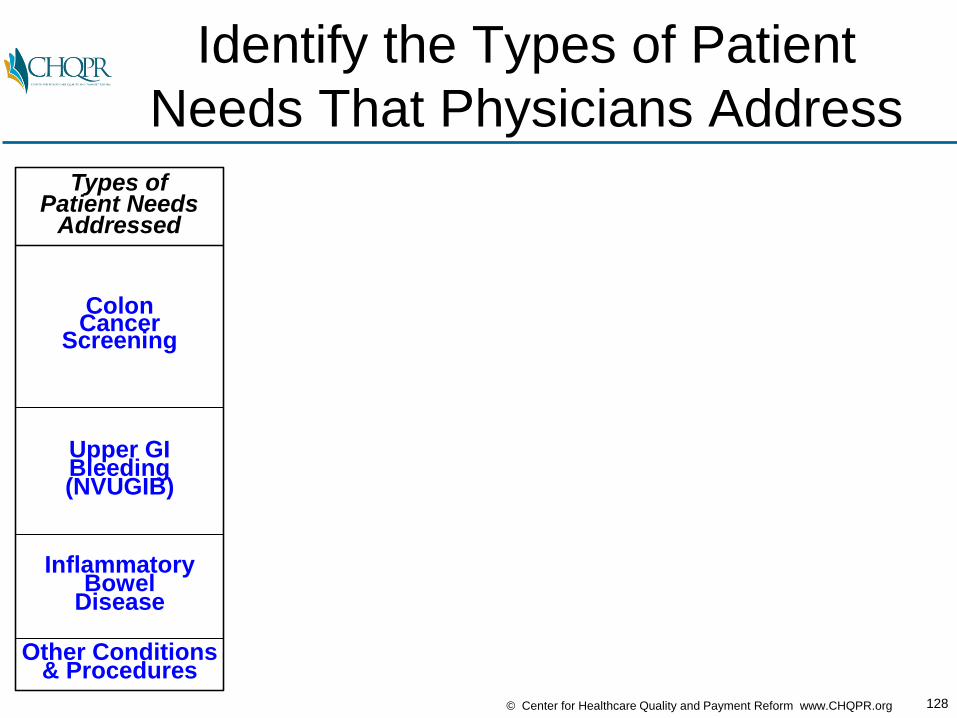
Identify the Types of Patient
Needs That Physicians Address
InflammatoryBowel
Disease
Upper GIBleeding(NVUGIB)
Types ofPatient Needs
Addressed
ColonCancer
Screening
Other Conditions& Procedures

129© Center for Healthcare Quality and Payment Reform www.CHQPR.org
Step 1: Identify the Opportunities
to Improve Care & Reduce Cost
InflammatoryBowel
Disease
Upper GIBleeding(NVUGIB)
Types ofPatient Needs
Addressed
Opportunitiesto Improve Care
and Reduce Cost
ColonCancer
Screening
• Deliver colonoscopyin lowest-cost way
• Improve adenoma detection rate
• Avoid complicationsin colonoscopy
• Focus on highest-riskpatients
Other Conditions& Procedures

130© Center for Healthcare Quality and Payment Reform www.CHQPR.org
Step 2: Identify the Barriers in
the Current Payment System
InflammatoryBowel
Disease
Upper GIBleeding(NVUGIB)
Types ofPatient Needs
Addressed
Opportunitiesto Improve Care
and Reduce Cost
Barriers inCurrent
Payment System
ColonCancer
Screening
• Deliver colonoscopyin lowest-cost way
• Improve adenoma detection rate
• Avoid complicationsin colonoscopy
• Focus on highest-riskpatients
• All providers paidseparately
• No payment for outreach to high-risk patients
• Higher payment forrepeat & unnecessaryprocedures
Other Conditions& Procedures
131© Center for Healthcare Quality and Payment Reform www.CHQPR.org
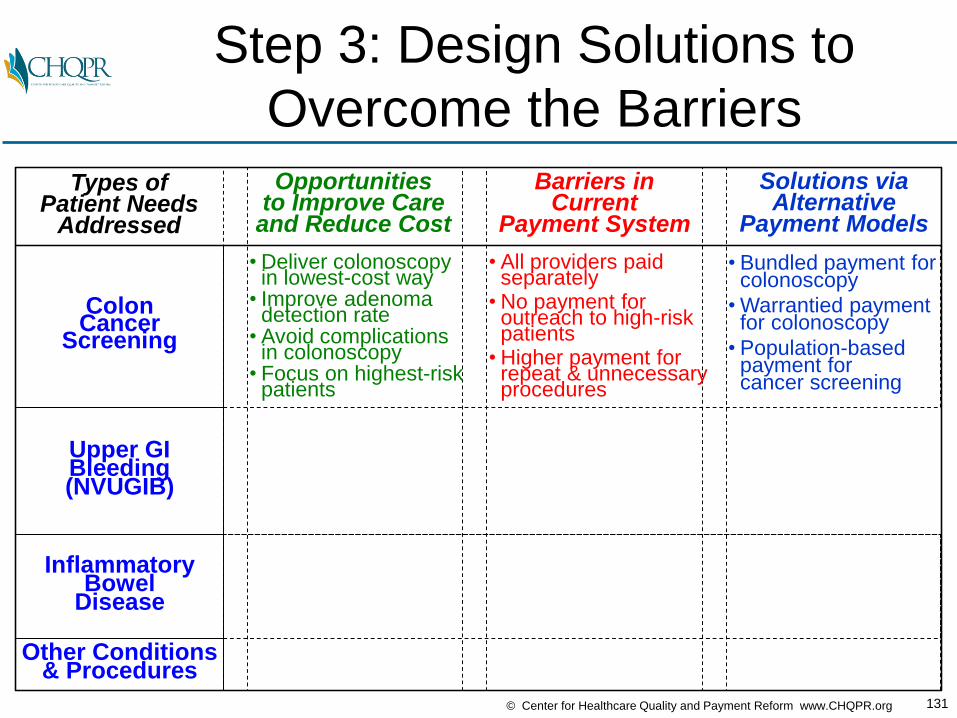
Step 3: Design Solutions to
Overcome the Barriers
InflammatoryBowel
Disease
Upper GIBleeding(NVUGIB)
Types ofPatient Needs
Addressed
Opportunitiesto Improve Care
and Reduce Cost
Barriers inCurrent
Payment System
Solutions viaAlternative
Payment Models
ColonCancer
Screening
• Deliver colonoscopyin lowest-cost way
• Improve adenoma detection rate
• Avoid complicationsin colonoscopy
• Focus on highest-riskpatients
• Bundled payment forcolonoscopy
• Warrantied paymentfor colonoscopy
• Population-basedpayment for cancer screening
• All providers paidseparately
• No payment for outreach to high-risk patients
• Higher payment forrepeat & unnecessaryprocedures
Other Conditions& Procedures

132© Center for Healthcare Quality and Payment Reform www.CHQPR.org
Opportunities, Barriers, and
Solutions Will Differ by Condition
InflammatoryBowel
Disease
Upper GIBleeding(NVUGIB)
Types ofPatient Needs
Addressed
Opportunitiesto Improve Care
and Reduce Cost
Barriers inCurrent
Payment System
Solutions viaAlternative
Payment Models
• Reduce ED visitsand hospitalizationsdue to bleeds
• Use lowest-cost,effective intervention
• Avoid complications
• Bundled/warrantiedpayment foracute conditions
• Condition-based payment for chronicconditions
• No payment forcare management
• Financial penalty forusing lower-costprocedures
ColonCancer
Screening
• Deliver colonoscopyin lowest-cost way
• Improve adenoma detection rate
• Avoid complicationsin colonoscopy
• Focus on highest-riskpatients
• Bundled payment forcolonoscopy
• Warrantied paymentfor colonoscopy
• Population-basedpayment for cancer screening
• All providers paidseparately
• No payment for outreach to high-risk patients
• Higher payment forrepeat & unnecessaryprocedures
Other Conditions& Procedures
133© Center for Healthcare Quality and Payment Reform www.CHQPR.org
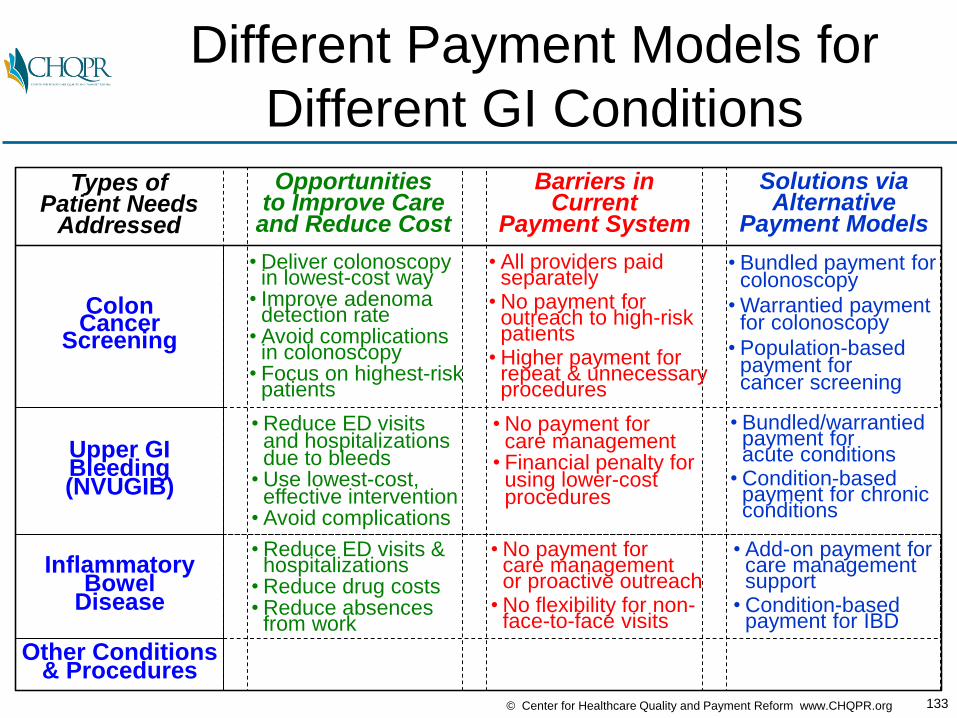
Different Payment Models for
Different GI Conditions
InflammatoryBowel
Disease
Upper GIBleeding(NVUGIB)
Types ofPatient Needs
Addressed
Opportunitiesto Improve Care
and Reduce Cost
Barriers inCurrent
Payment System
Solutions viaAlternative
Payment Models
• Reduce ED visitsand hospitalizationsdue to bleeds
• Use lowest-cost,effective intervention
• Avoid complications
• Reduce ED visits &hospitalizations
• Reduce drug costs• Reduce absences
from work
• No payment forcare managementor proactive outreach
• No flexibility for non-face-to-face visits
• Add-on payment forcare managementsupport
• Condition-basedpayment for IBD
• Bundled/warrantiedpayment foracute conditions
• Condition-based payment for chronicconditions
• No payment forcare management
• Financial penalty forusing lower-costprocedures
ColonCancer
Screening
• Deliver colonoscopyin lowest-cost way
• Improve adenoma detection rate
• Avoid complicationsin colonoscopy
• Focus on highest-riskpatients
• Bundled payment forcolonoscopy
• Warrantied paymentfor colonoscopy
• Population-basedpayment for cancer screening
• All providers paidseparately
• No payment for outreach to high-risk patients
• Higher payment forrepeat & unnecessaryprocedures
Other Conditions& Procedures

134© Center for Healthcare Quality and Payment Reform www.CHQPR.org
Not Every Condition Needs
an Alternative Payment Model
InflammatoryBowel
Disease
Upper GIBleeding(NVUGIB)
Types ofPatient Needs
Addressed
Opportunitiesto Improve Care
and Reduce Cost
Barriers inCurrent
Payment System
Solutions viaAlternative
Payment Models
• Reduce ED visitsand hospitalizationsdue to bleeds
• Use lowest-cost,effective intervention
• Avoid complications
• Reduce ED visits &hospitalizations
• Reduce drug costs• Reduce absences
from work
• No payment forcare managementor proactive outreach
• No flexibility for non-face-to-face visits
• Add-on payment forcare managementsupport
• Condition-basedpayment for IBD
• Bundled/warrantiedpayment foracute conditions
• Condition-based payment for chronicconditions
• No payment forcare management
• Financial penalty forusing lower-costprocedures
ColonCancer
Screening
• Deliver colonoscopyin lowest-cost way
• Improve adenoma detection rate
• Avoid complicationsin colonoscopy
• Focus on highest-riskpatients
• Bundled payment forcolonoscopy
• Warrantied paymentfor colonoscopy
• Population-basedpayment for cancer screening
• All providers paidseparately
• No payment for outreach to high-risk patients
• Higher payment forrepeat & unnecessaryprocedures
Other Conditions& Procedures • FFS
135© Center for Healthcare Quality and Payment Reform www.CHQPR.org
Building Blocks of
Good APMs

136© Center for Healthcare Quality and Payment Reform www.CHQPR.org
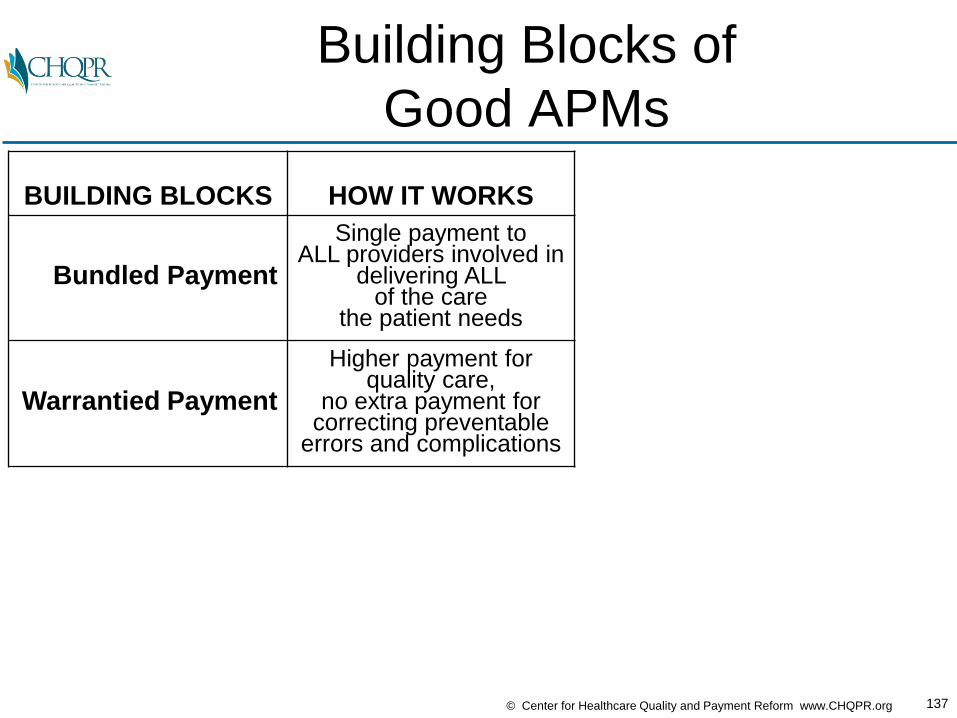
Building Blocks of
Good APMs
BUILDING BLOCKS HOW IT WORKS
Bundled Payment
Single payment to ALL providers involved in
delivering ALL of the care
the patient needs
137© Center for Healthcare Quality and Payment Reform www.CHQPR.org
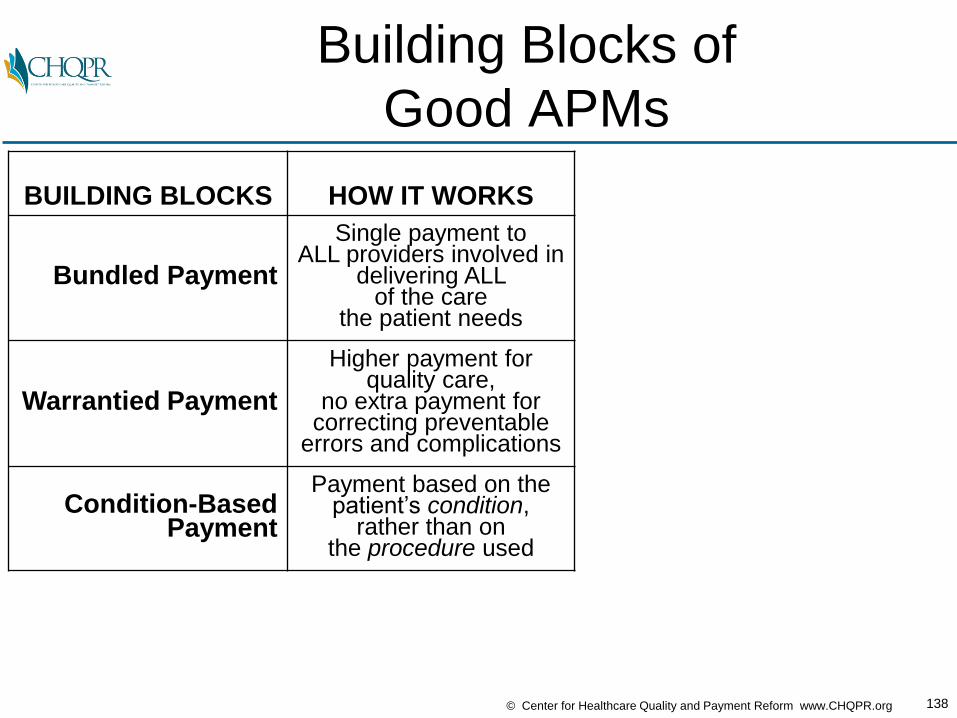
Building Blocks of
Good APMs
BUILDING BLOCKS HOW IT WORKS
Bundled Payment
Single payment to ALL providers involved in
delivering ALL of the care
the patient needs
Warrantied Payment
Higher payment for quality care,
no extra payment for correcting preventable
errors and complications
138© Center for Healthcare Quality and Payment Reform www.CHQPR.org
Building Blocks of
Good APMs
BUILDING BLOCKS HOW IT WORKS
Bundled Payment
Single payment to ALL providers involved in
delivering ALL of the care
the patient needs
Warrantied Payment
Higher payment for quality care,
no extra payment for correcting preventable
errors and complications
Condition-Based Payment
Payment based on the patient’s condition,
rather than on the procedure used

139© Center for Healthcare Quality and Payment Reform www.CHQPR.org
Building Blocks of
Good APMs
BUILDING BLOCKS HOW IT WORKS
Bundled Payment
Single payment to ALL providers involved in
delivering ALL of the care
the patient needs
Warrantied Payment
Higher payment for quality care,
no extra payment for correcting preventable
errors and complications
Condition-Based Payment
Payment based on the patient’s condition,
rather than on the procedure used
PerformanceGuarantee
Payment only made if quality standards
are met and pre-defined outcomes
are achieved
140© Center for Healthcare Quality and Payment Reform www.CHQPR.org
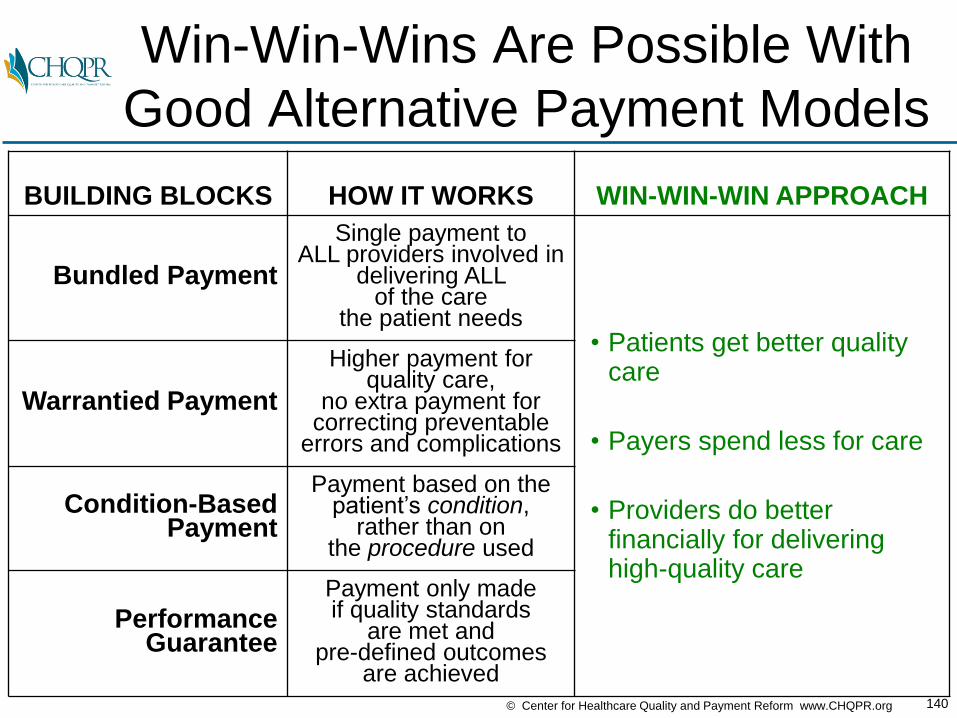
Win-Win-Wins Are Possible With
Good Alternative Payment Models
BUILDING BLOCKS HOW IT WORKS WIN-WIN-WIN APPROACH
Bundled Payment
Single payment to ALL providers involved in
delivering ALL of the care
the patient needs• Patients get better quality
care
• Payers spend less for care
• Providers do better financially for delivering high-quality care
Warrantied Payment
Higher payment for quality care,
no extra payment for correcting preventable
errors and complications
Condition-Based Payment
Payment based on the patient’s condition,
rather than on the procedure used
PerformanceGuarantee
Payment only made if quality standards
are met and pre-defined outcomes
are achieved

141© Center for Healthcare Quality and Payment Reform www.CHQPR.org
Win-Win-Win Results Through
Bundled Payment
BUILDING BLOCKS HOW IT WORKS WIN-WIN-WIN APPROACH
Bundled Payment
Single payment to ALL providers involved in
delivering ALL of the care
the patient needs• Patients get better quality
care
• Payers spend less for care
• Providers do better financially for delivering high-quality care
Warrantied Payment
Higher payment for quality care,
no extra payment for correcting preventable
errors and complications
Condition-Based Payment
Payment based on the patient’s condition,
rather than on the procedure used
PerformanceGuarantee
Payment only made if quality standards
are met and pre-defined outcomes
are achieved

142© Center for Healthcare Quality and Payment Reform www.CHQPR.org
The Way We Pay for Healthcare
Fee for Service
14,000Individual
fees
143© Center for Healthcare Quality and Payment Reform www.CHQPR.org
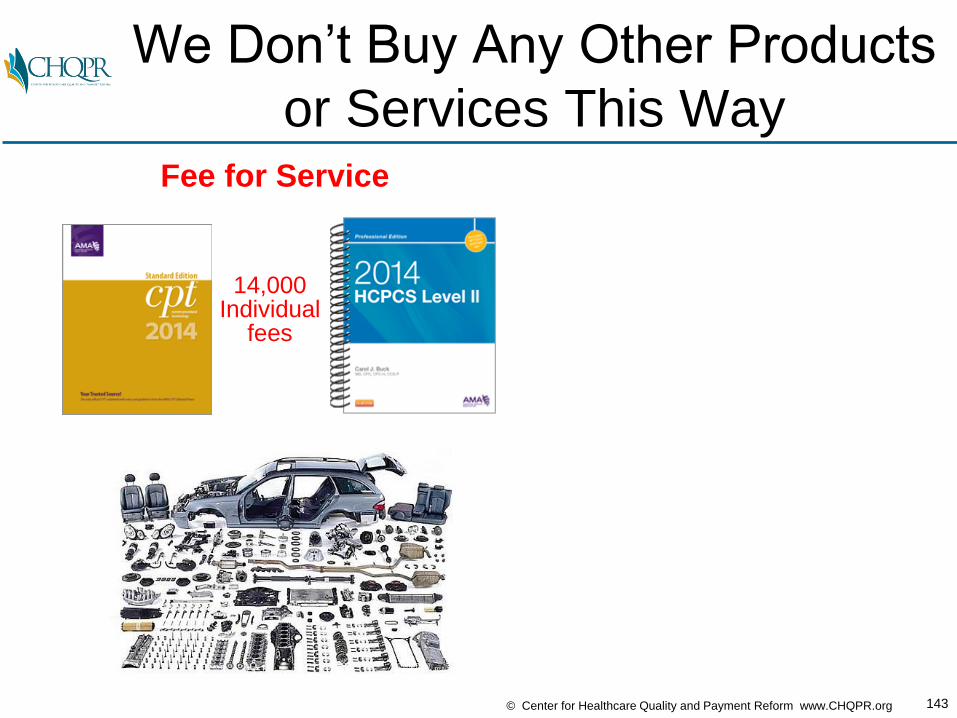
We Don’t Buy Any Other Products
or Services This WayFee for Service
14,000Individual
fees
144© Center for Healthcare Quality and Payment Reform www.CHQPR.org
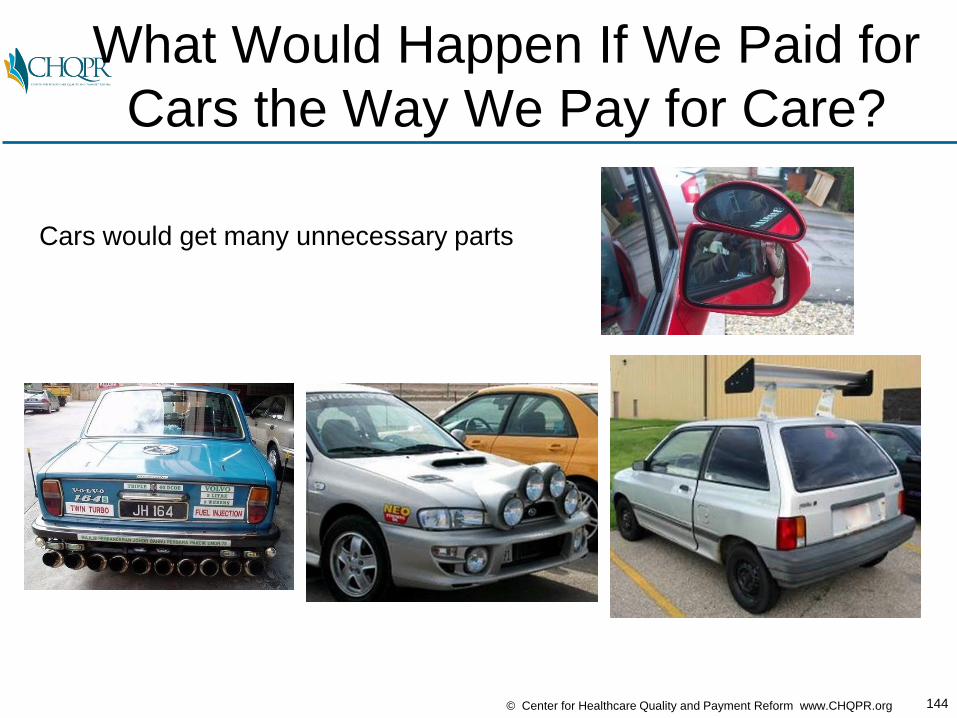
What Would Happen If We Paid for
Cars the Way We Pay for Care?
Cars would get many unnecessary parts
145© Center for Healthcare Quality and Payment Reform www.CHQPR.org
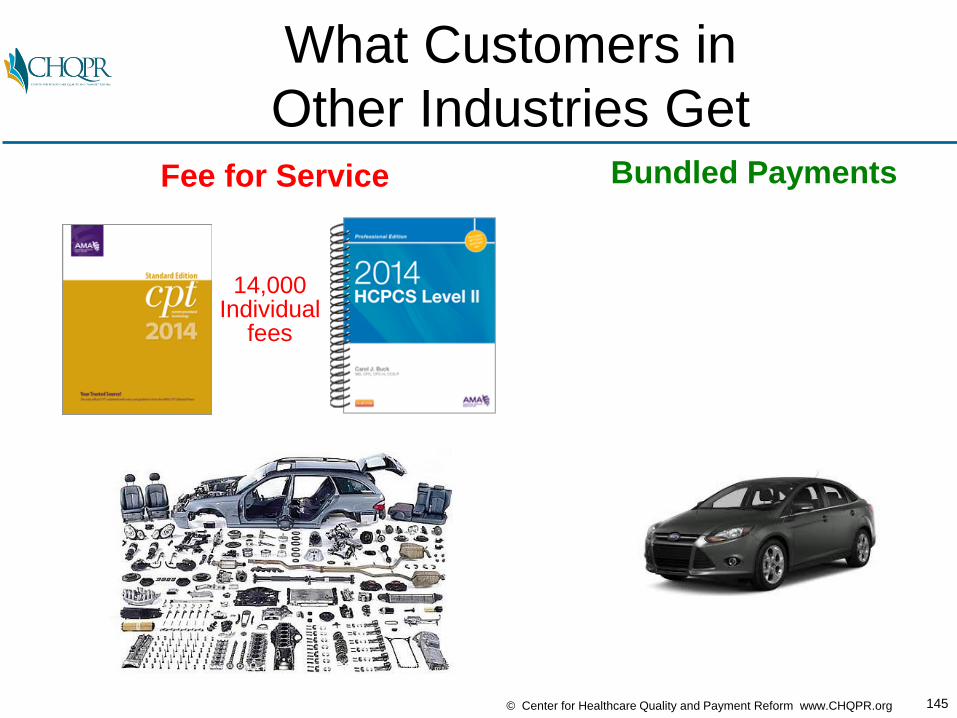
What Customers in
Other Industries GetFee for Service
14,000Individual
fees
Bundled Payments

146© Center for Healthcare Quality and Payment Reform www.CHQPR.org
What Patients Want and
Should Get in HealthcareFee for Service Bundled Payments
• Colonoscopy (All Services)
• Knee Surgery (All Services)
• Heart Surgery (All Services)
• IBD Management (All Services)
14,000Individual
fees

147© Center for Healthcare Quality and Payment Reform www.CHQPR.org
Today: All Participants in a
Colonoscopy Are Paid Separately
COST TYPE TODAY
Gastroenterologist $220

148© Center for Healthcare Quality and Payment Reform www.CHQPR.org
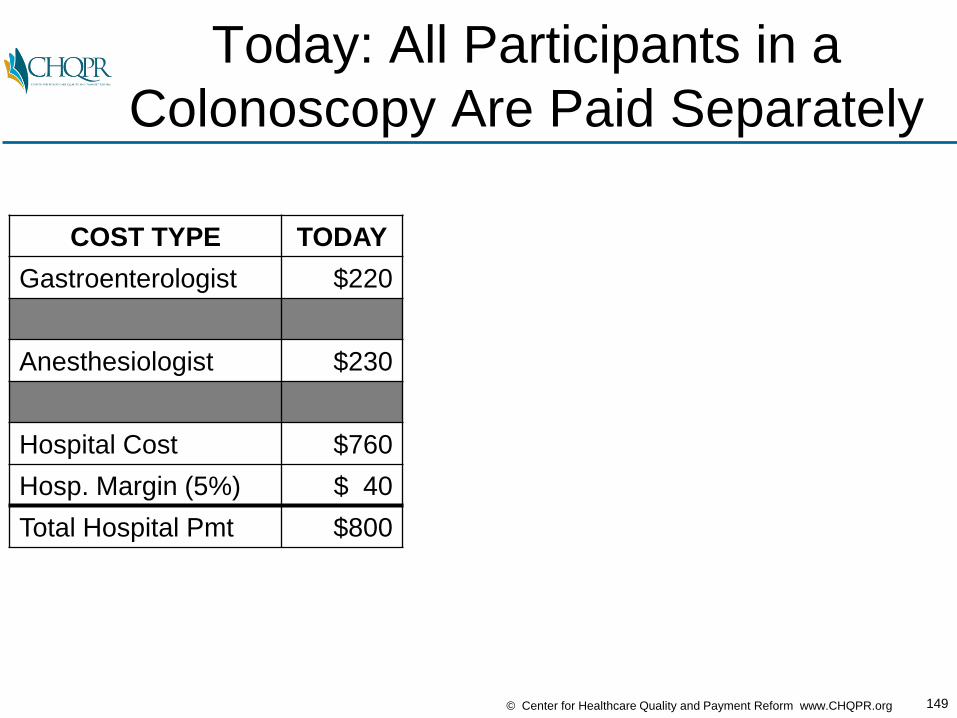
Today: All Participants in a
Colonoscopy Are Paid Separately
COST TYPE TODAY
Gastroenterologist $220
Anesthesiologist $230
149© Center for Healthcare Quality and Payment Reform www.CHQPR.org
Today: All Participants in a
Colonoscopy Are Paid Separately
COST TYPE TODAY
Gastroenterologist $220
Anesthesiologist $230
Hospital Cost $760
Hosp. Margin (5%) $ 40
Total Hospital Pmt $800
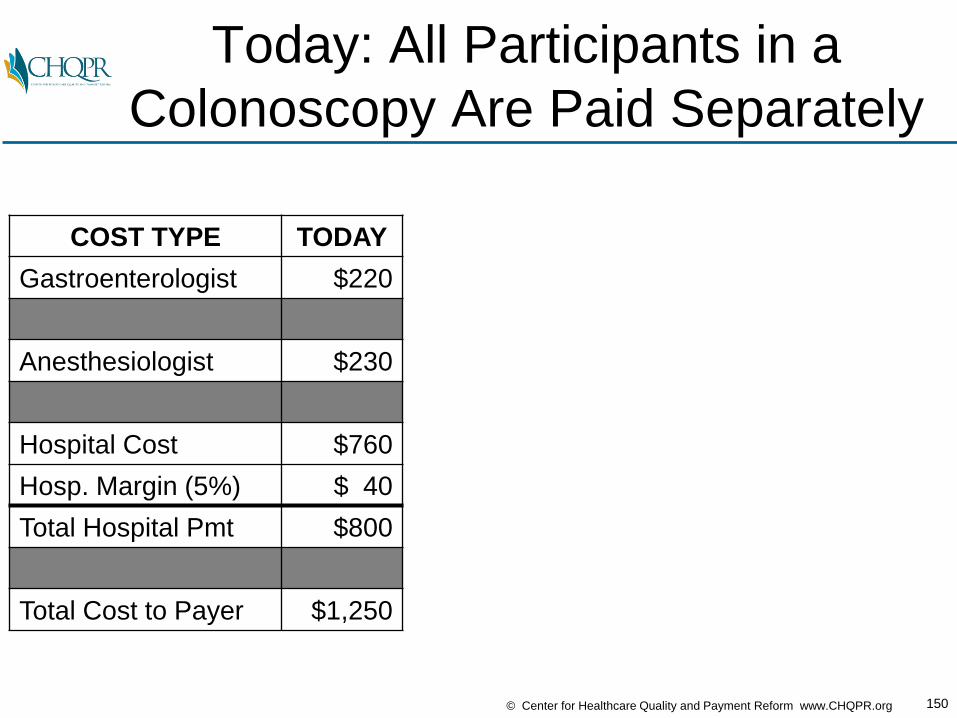
150© Center for Healthcare Quality and Payment Reform www.CHQPR.org
Today: All Participants in a
Colonoscopy Are Paid Separately
COST TYPE TODAY
Gastroenterologist $220
Anesthesiologist $230
Hospital Cost $760
Hosp. Margin (5%) $ 40
Total Hospital Pmt $800
Total Cost to Payer $1,250
151© Center for Healthcare Quality and Payment Reform www.CHQPR.org
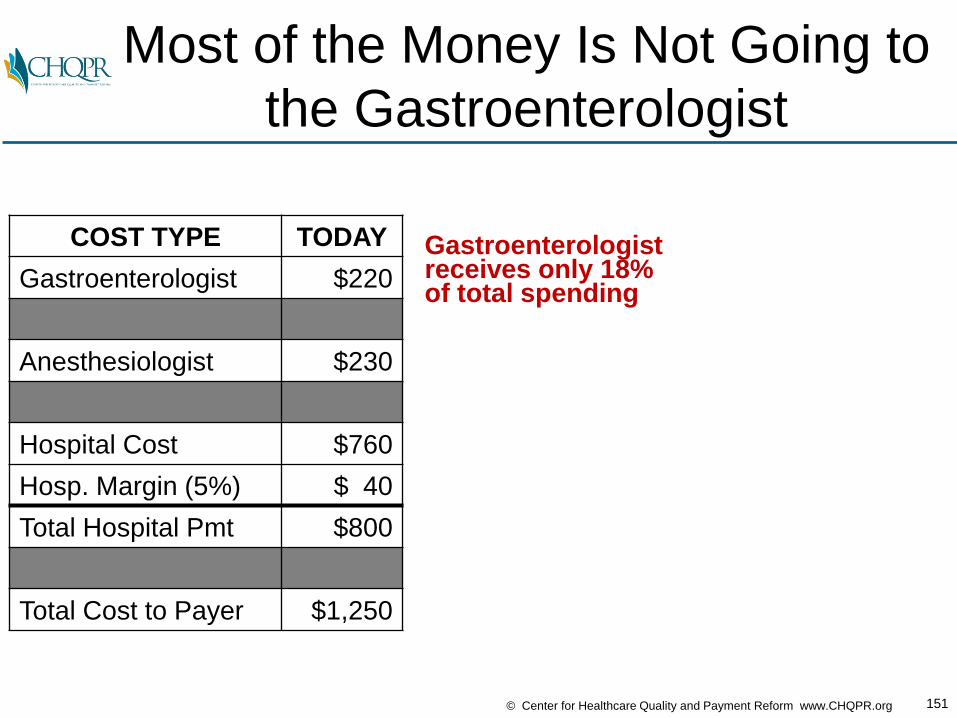
Most of the Money Is Not Going to
the Gastroenterologist
COST TYPE TODAY
Gastroenterologist $220
Anesthesiologist $230
Hospital Cost $760
Hosp. Margin (5%) $ 40
Total Hospital Pmt $800
Total Cost to Payer $1,250
Gastroenterologist receives only 18% of total spending
152© Center for Healthcare Quality and Payment Reform www.CHQPR.org
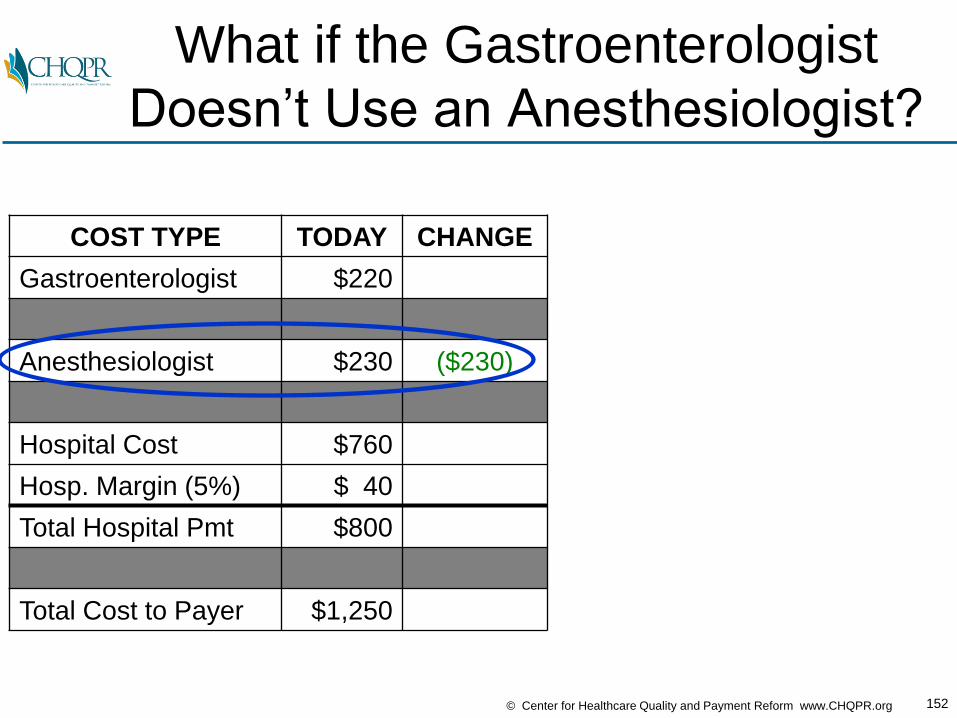
What if the Gastroenterologist
Doesn’t Use an Anesthesiologist?
COST TYPE TODAY CHANGE
Gastroenterologist $220
Anesthesiologist $230 ($230)
Hospital Cost $760
Hosp. Margin (5%) $ 40
Total Hospital Pmt $800
Total Cost to Payer $1,250

153© Center for Healthcare Quality and Payment Reform www.CHQPR.org
All of the Savings
Would Go to the Payer
COST TYPE TODAY CHANGE SPLIT NEW % CHG
Gastroenterologist $220 $0 $220 +0%
Anesthesiologist $230 ($230) $0 -100%
Hospital Cost $760 $760
Hosp. Margin (5%) $ 40 $ 40 +0%
Total Hospital Pmt $800 $800 -0%
Total Cost to Payer $1,250 ($230) $1,020 -18%
154© Center for Healthcare Quality and Payment Reform www.CHQPR.org
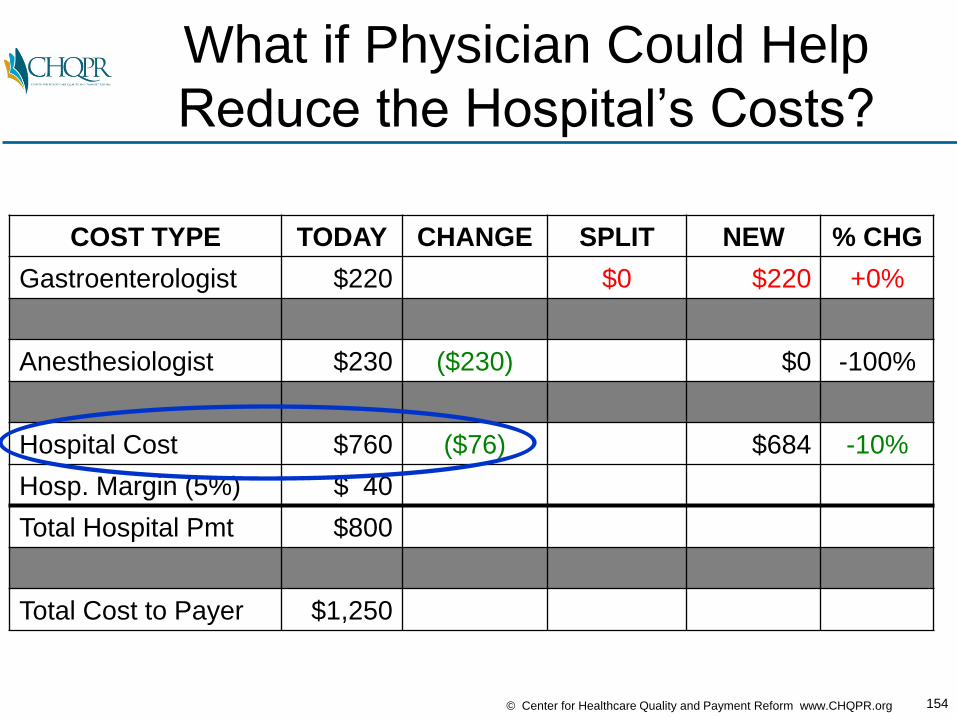
What if Physician Could Help
Reduce the Hospital’s Costs?
COST TYPE TODAY CHANGE SPLIT NEW % CHG
Gastroenterologist $220 $0 $220 +0%
Anesthesiologist $230 ($230) $0 -100%
Hospital Cost $760 ($76) $684 -10%
Hosp. Margin (5%) $ 40
Total Hospital Pmt $800
Total Cost to Payer $1,250
155© Center for Healthcare Quality and Payment Reform www.CHQPR.org
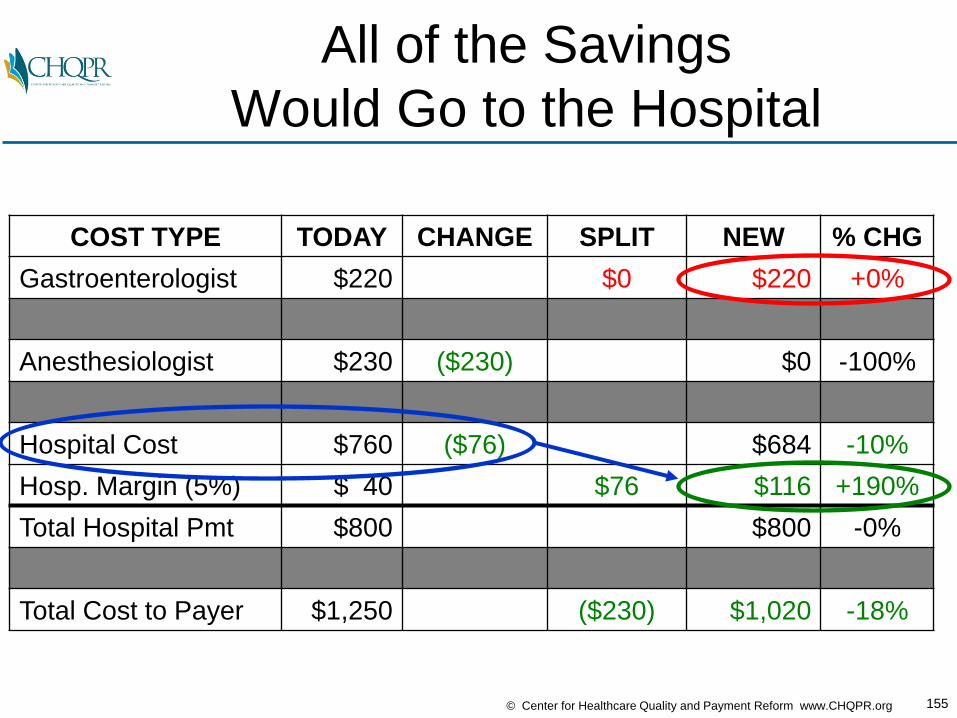
All of the Savings
Would Go to the Hospital
COST TYPE TODAY CHANGE SPLIT NEW % CHG
Gastroenterologist $220 $0 $220 +0%
Anesthesiologist $230 ($230) $0 -100%
Hospital Cost $760 ($76) $684 -10%
Hosp. Margin (5%) $ 40 $76 $116 +190%
Total Hospital Pmt $800 $800 -0%
Total Cost to Payer $1,250 ($230) $1,020 -18%
156© Center for Healthcare Quality and Payment Reform www.CHQPR.org
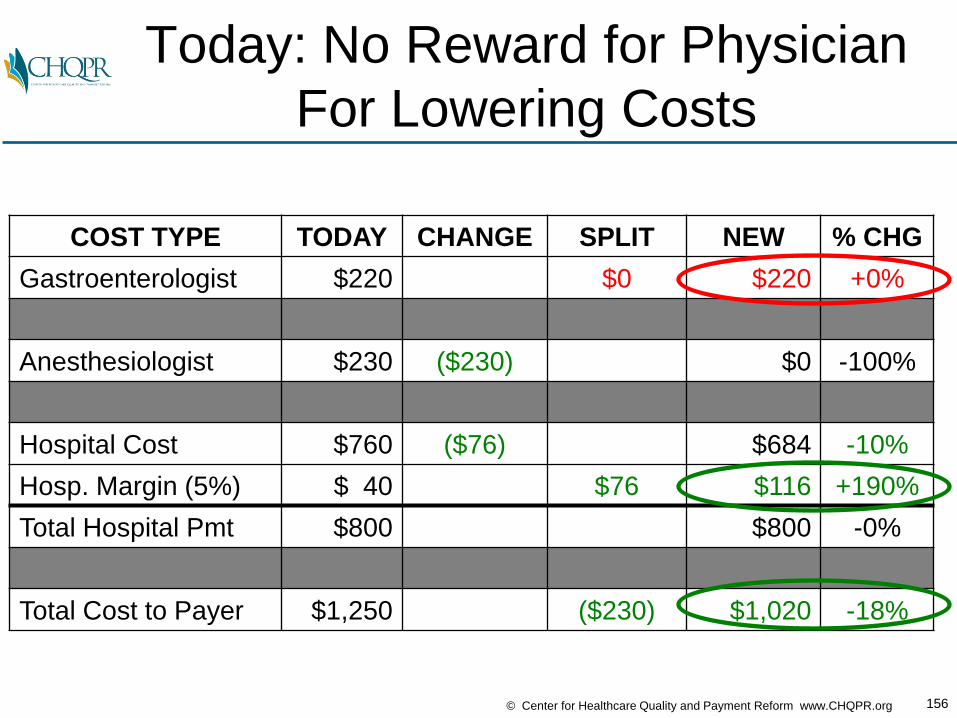
Today: No Reward for Physician
For Lowering Costs
COST TYPE TODAY CHANGE SPLIT NEW % CHG
Gastroenterologist $220 $0 $220 +0%
Anesthesiologist $230 ($230) $0 -100%
Hospital Cost $760 ($76) $684 -10%
Hosp. Margin (5%) $ 40 $76 $116 +190%
Total Hospital Pmt $800 $800 -0%
Total Cost to Payer $1,250 ($230) $1,020 -18%
157© Center for Healthcare Quality and Payment Reform www.CHQPR.org
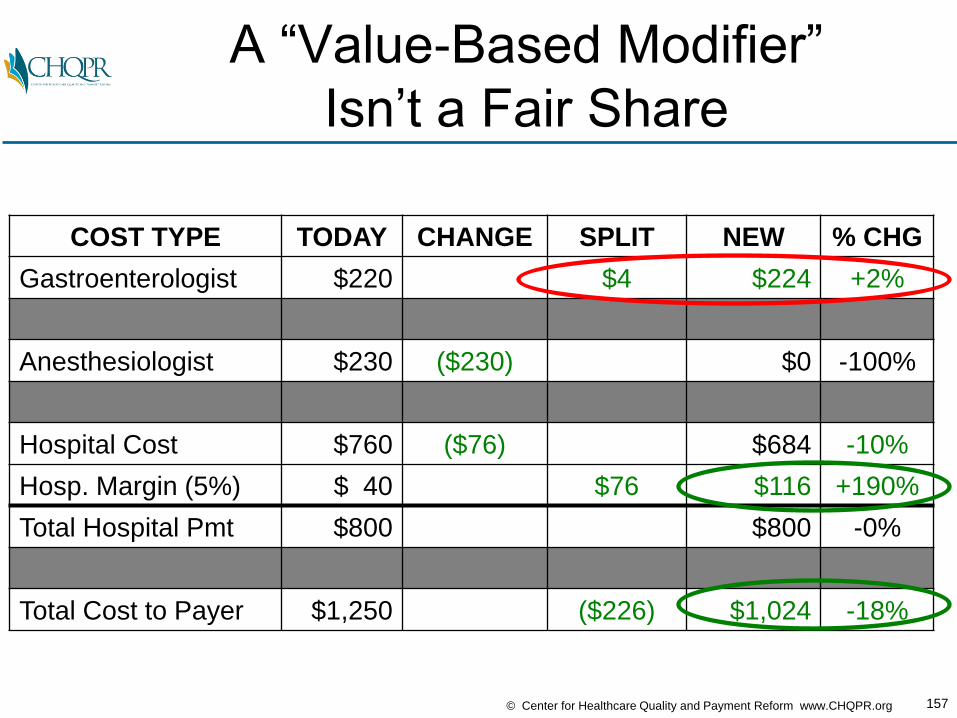
A “Value-Based Modifier”
Isn’t a Fair Share
COST TYPE TODAY CHANGE SPLIT NEW % CHG
Gastroenterologist $220 $4 $224 +2%
Anesthesiologist $230 ($230) $0 -100%
Hospital Cost $760 ($76) $684 -10%
Hosp. Margin (5%) $ 40 $76 $116 +190%
Total Hospital Pmt $800 $800 -0%
Total Cost to Payer $1,250 ($226) $1,024 -18%
158© Center for Healthcare Quality and Payment Reform www.CHQPR.org
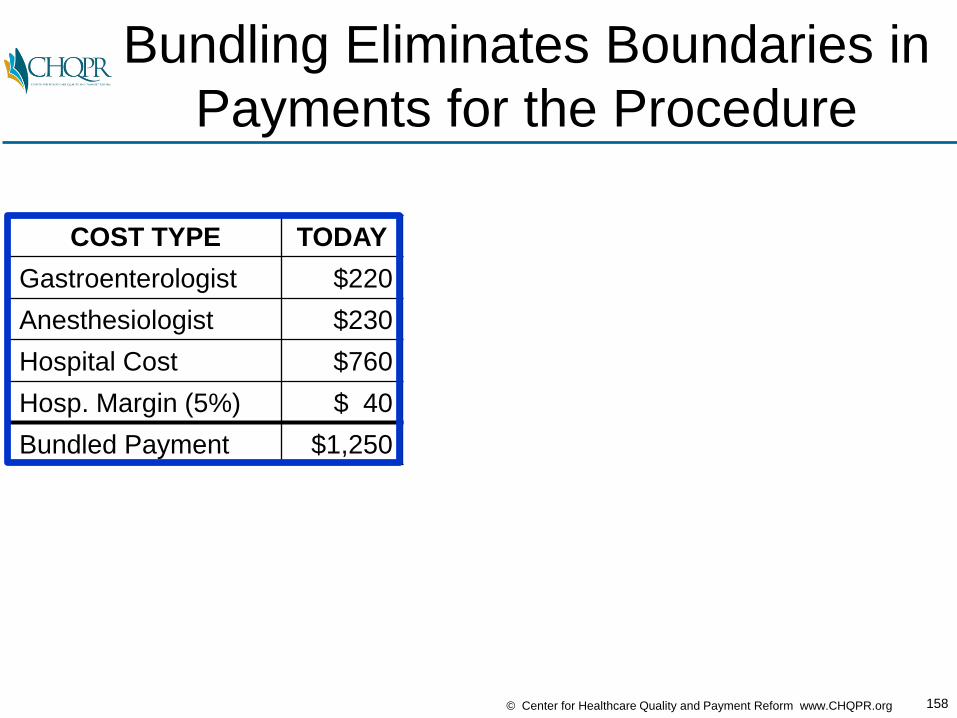
Bundling Eliminates Boundaries in
Payments for the Procedure
COST TYPE TODAY
Gastroenterologist $220
Anesthesiologist $230
Hospital Cost $760
Hosp. Margin (5%) $ 40
Bundled Payment $1,250
159© Center for Healthcare Quality and Payment Reform www.CHQPR.org
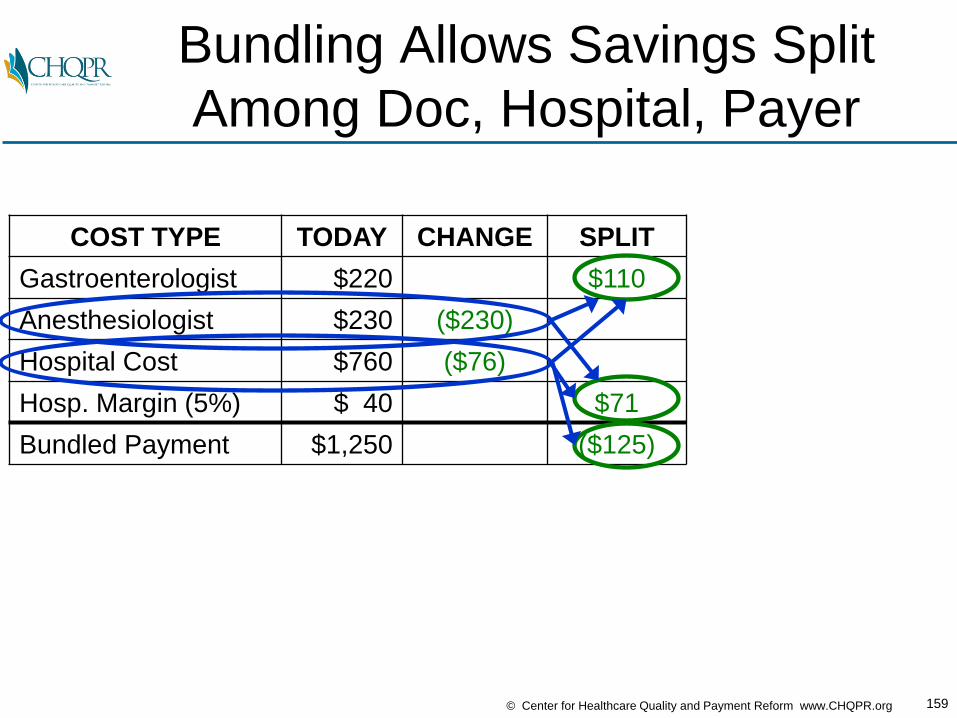
Bundling Allows Savings Split
Among Doc, Hospital, Payer
COST TYPE TODAY CHANGE SPLIT
Gastroenterologist $220 $110
Anesthesiologist $230 ($230)
Hospital Cost $760 ($76)
Hosp. Margin (5%) $ 40 $71
Bundled Payment $1,250 ($125)
160© Center for Healthcare Quality and Payment Reform www.CHQPR.org
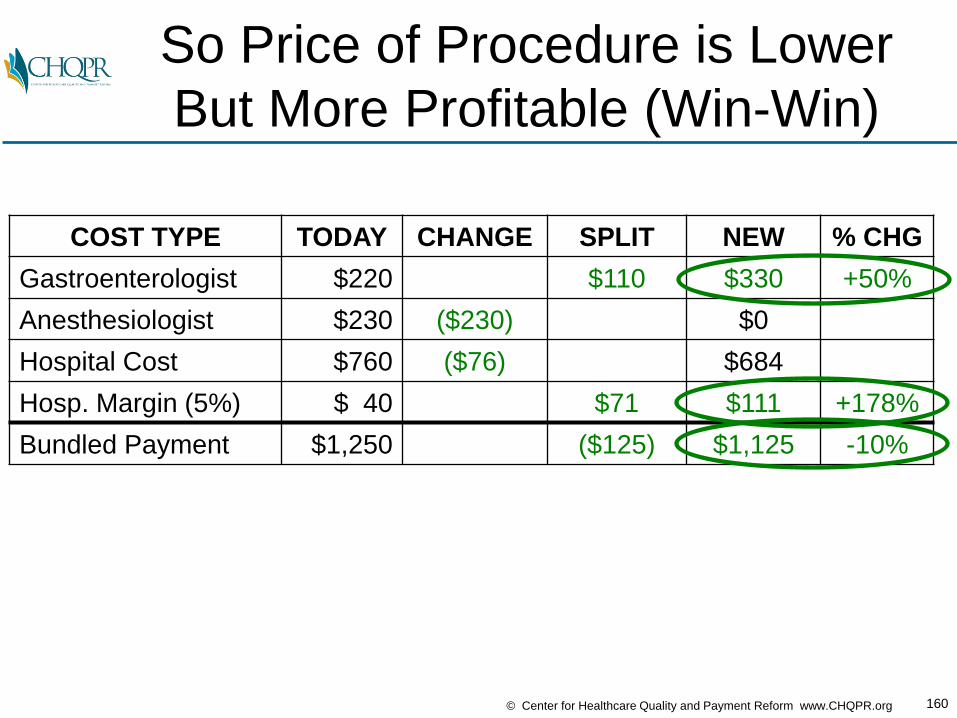
So Price of Procedure is Lower
But More Profitable (Win-Win)
COST TYPE TODAY CHANGE SPLIT NEW % CHG
Gastroenterologist $220 $110 $330 +50%
Anesthesiologist $230 ($230) $0
Hospital Cost $760 ($76) $684
Hosp. Margin (5%) $ 40 $71 $111 +178%
Bundled Payment $1,250 ($125) $1,125 -10%

161© Center for Healthcare Quality and Payment Reform www.CHQPR.org
If Gastroenterologist Manages
the Bundled Payment…
COST TYPE TODAY
Gastroenterologist $220
Anesthesiologist $230
Hospital/ASC Fee $800
Bundled Payment $1,250
162© Center for Healthcare Quality and Payment Reform www.CHQPR.org
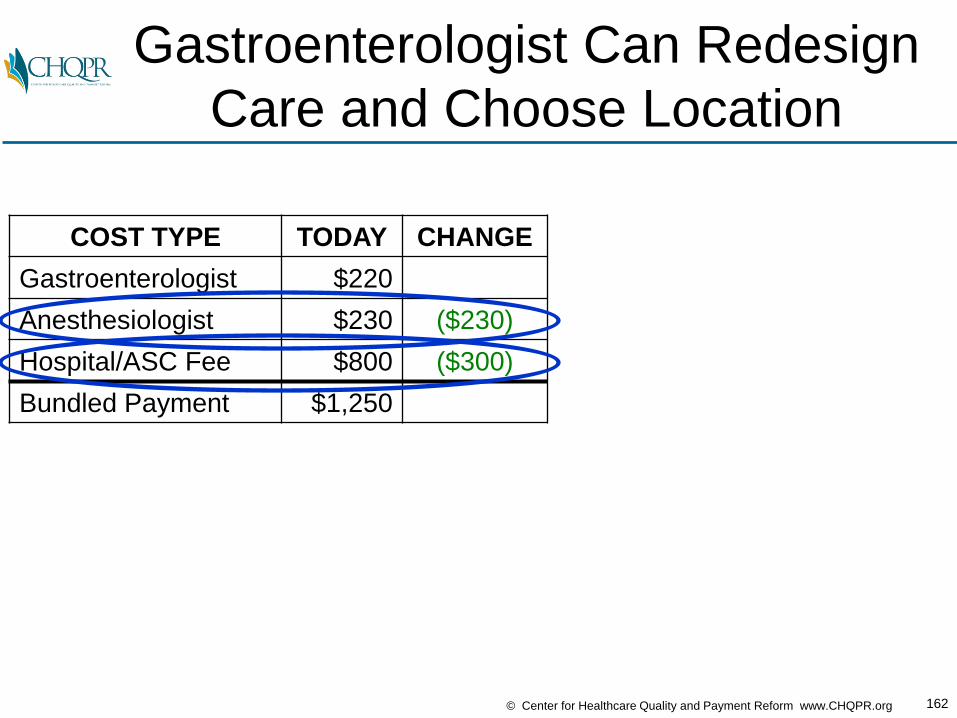
Gastroenterologist Can Redesign
Care and Choose Location
COST TYPE TODAY CHANGE
Gastroenterologist $220
Anesthesiologist $230 ($230)
Hospital/ASC Fee $800 ($300)
Bundled Payment $1,250
163© Center for Healthcare Quality and Payment Reform www.CHQPR.org
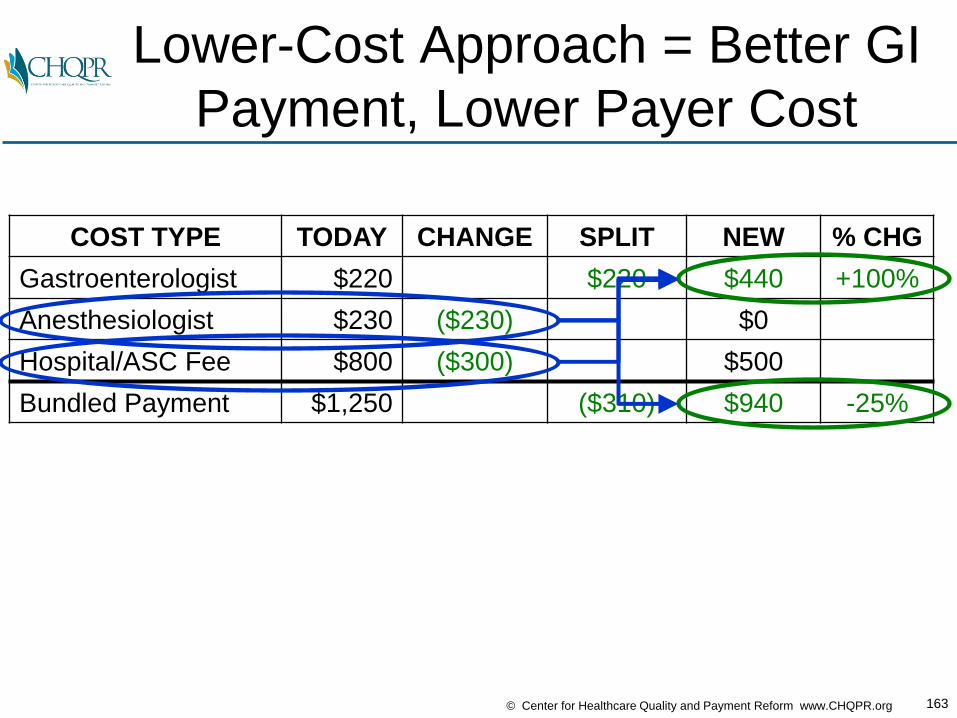
Lower-Cost Approach = Better GI
Payment, Lower Payer Cost
COST TYPE TODAY CHANGE SPLIT NEW % CHG
Gastroenterologist $220 $220 $440 +100%
Anesthesiologist $230 ($230) $0
Hospital/ASC Fee $800 ($300) $500
Bundled Payment $1,250 ($310) $940 -25%
164© Center for Healthcare Quality and Payment Reform www.CHQPR.org
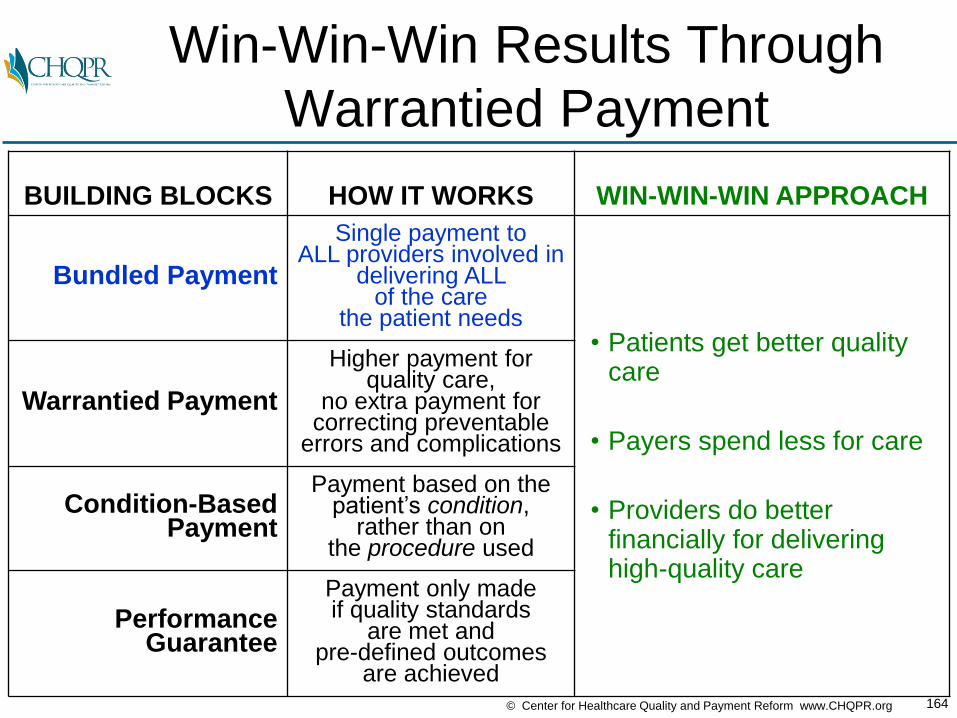
Win-Win-Win Results Through
Warrantied Payment
BUILDING BLOCKS HOW IT WORKS WIN-WIN-WIN APPROACH
Bundled Payment
Single payment to ALL providers involved in
delivering ALL of the care
the patient needs• Patients get better quality
care
• Payers spend less for care
• Providers do better financially for delivering high-quality care
Warrantied Payment
Higher payment for quality care,
no extra payment for correcting preventable
errors and complications
Condition-Based Payment
Payment based on the patient’s condition,
rather than on the procedure used
PerformanceGuarantee
Payment only made if quality standards
are met and pre-defined outcomes
are achieved
165© Center for Healthcare Quality and Payment Reform www.CHQPR.org
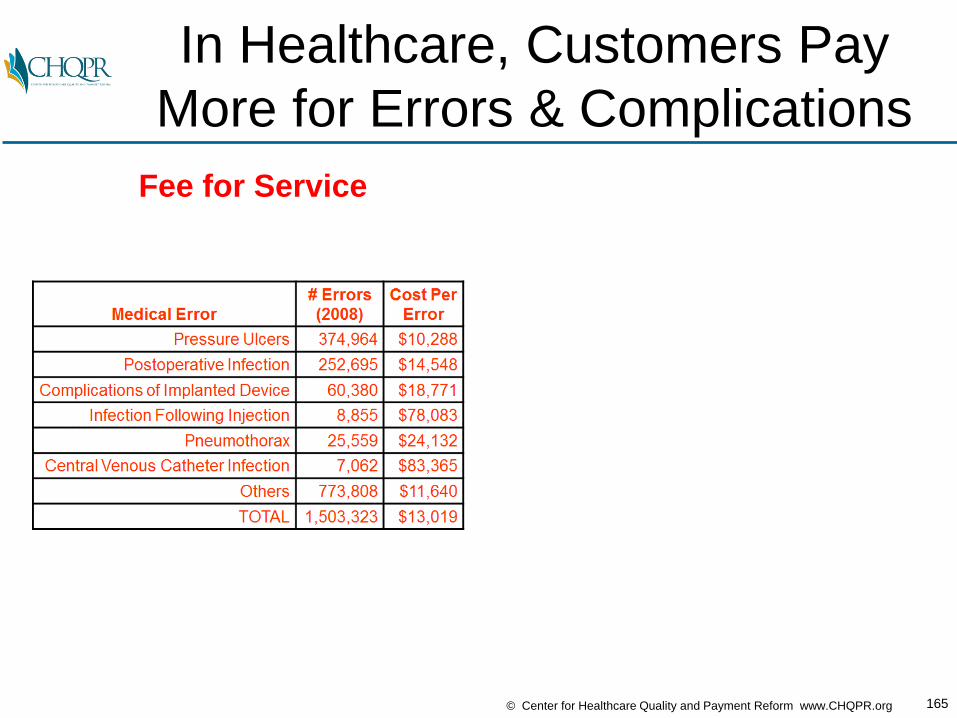
In Healthcare, Customers Pay
More for Errors & Complications
Fee for Service
166© Center for Healthcare Quality and Payment Reform www.CHQPR.org
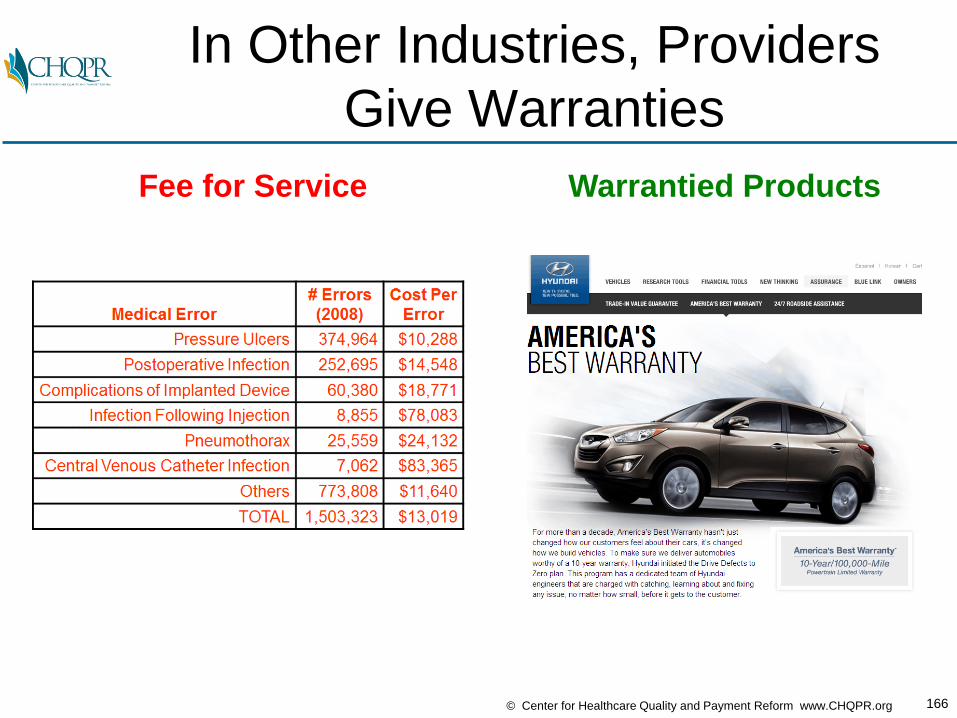
In Other Industries, Providers
Give Warranties
Fee for Service Warrantied Products
167© Center for Healthcare Quality and Payment Reform www.CHQPR.org
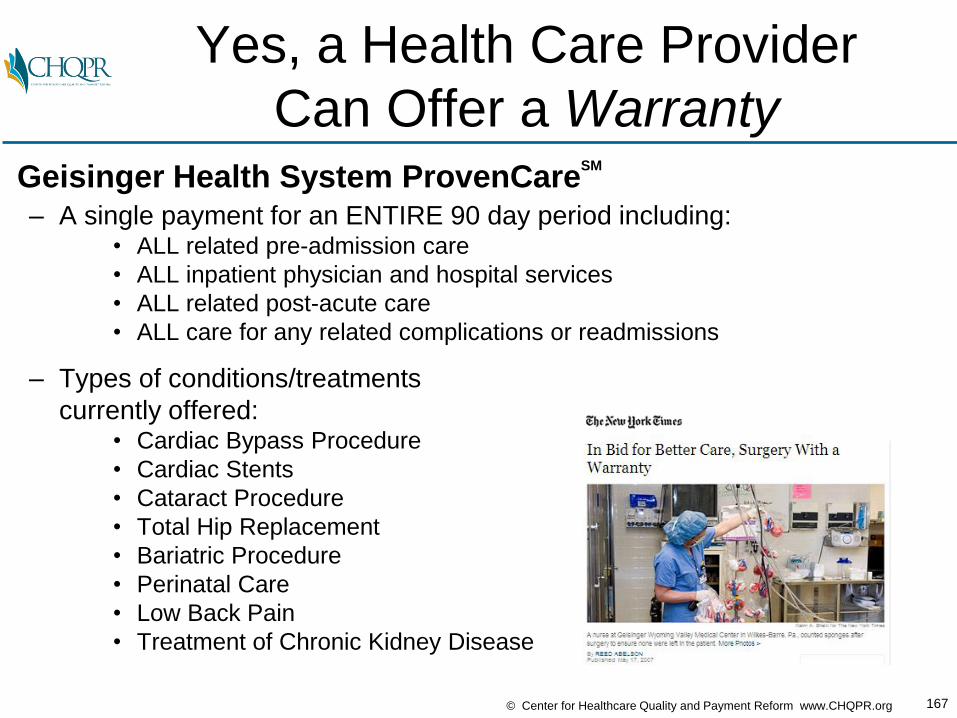
Yes, a Health Care Provider
Can Offer a WarrantyGeisinger Health System ProvenCare
SM
– A single payment for an ENTIRE 90 day period including:• ALL related pre-admission care
• ALL inpatient physician and hospital services
• ALL related post-acute care
• ALL care for any related complications or readmissions
– Types of conditions/treatments
currently offered:• Cardiac Bypass Procedure
• Cardiac Stents
• Cataract Procedure
• Total Hip Replacement
• Bariatric Procedure
• Perinatal Care
• Low Back Pain
• Treatment of Chronic Kidney Disease

168© Center for Healthcare Quality and Payment Reform www.CHQPR.org
Payment + Process Improvement =
Better Outcomes, Lower Costs
169© Center for Healthcare Quality and Payment Reform www.CHQPR.org
Warranties Can Be Offered By
Individual Docs & Small Hospitals• In 1987, an orthopedic surgeon in Lansing, Michigan and the
local hospital, Ingham Medical Center, offered:– a fixed total price for surgical services for shoulder and knee problems– a warranty for any subsequent services needed for a two-year period,
including repeat visits, imaging, rehospitalization and additional Procedure
• Results:– Health insurer paid 40% less than otherwise– Surgeon received over 80% more in payment than otherwise – Hospital received 13% more than otherwise, despite fewer
rehospitalizations
• Method: – Reducing unnecessary auxiliary services such as radiography and
physical therapy– Reducing the length of stay in the hospital– Reducing complications and readmissions.
Johnson LL, Becker RL. An alternative health-care reimbursement system—application of arthroscopy
and financial warranty: results of a two-year pilot study. Arthroscopy. 1994 Aug;10(4):462–70
170© Center for Healthcare Quality and Payment Reform www.CHQPR.org
A Warranty Does Not Guarantee
There Wil Be No Complications
• Offering a warranty on care does not imply that you are
guaranteeing there will be no errors or complications
• It merely means that you are agreeing to correct those
problems at no (additional) charge
• Most warranties are “limited warranties,” in the sense that they
agree to pay to correct some problems, but not all

171© Center for Healthcare Quality and Payment Reform www.CHQPR.org
Prices for Warrantied Care
Will Likely Be Higher
• Q: “Why should we pay more to get good-quality care??”
• A: In most industries, warrantied products cost more, but
they’re desirable because TOTAL spending on the product
(repairs & replacement) is lower than without the warranty

172© Center for Healthcare Quality and Payment Reform www.CHQPR.org
Potential Warranties in
Gastroenterology
• Repeat colonoscopies for poor bowel preparation
• Infections from improperly cleaned equipment
• Colon perforations
• Complications of anesthesia
173© Center for Healthcare Quality and Payment Reform www.CHQPR.org
Potential Warranties in
Gastroenterology
• Repeat colonoscopies for poor bowel preparation
• Infections from improperly cleaned equipment
• Colon perforations
• Complications of anesthesia

174© Center for Healthcare Quality and Payment Reform www.CHQPR.org
Example: Colonoscopy with
10% Repeat RateColonoscopy
Bundled
Payment
Repeat
Rate
$1,250 10%
175© Center for Healthcare Quality and Payment Reform www.CHQPR.org
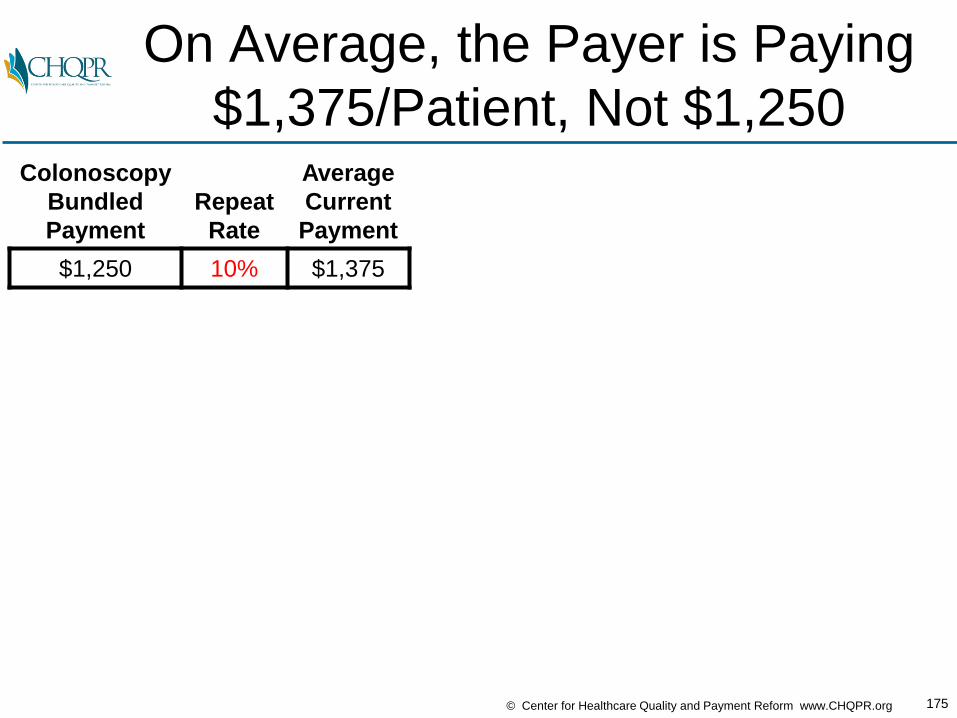
On Average, the Payer is Paying
$1,375/Patient, Not $1,250Colonoscopy
Bundled
Payment
Repeat
Rate
Average
Current
Payment
$1,250 10% $1,375
176© Center for Healthcare Quality and Payment Reform www.CHQPR.org
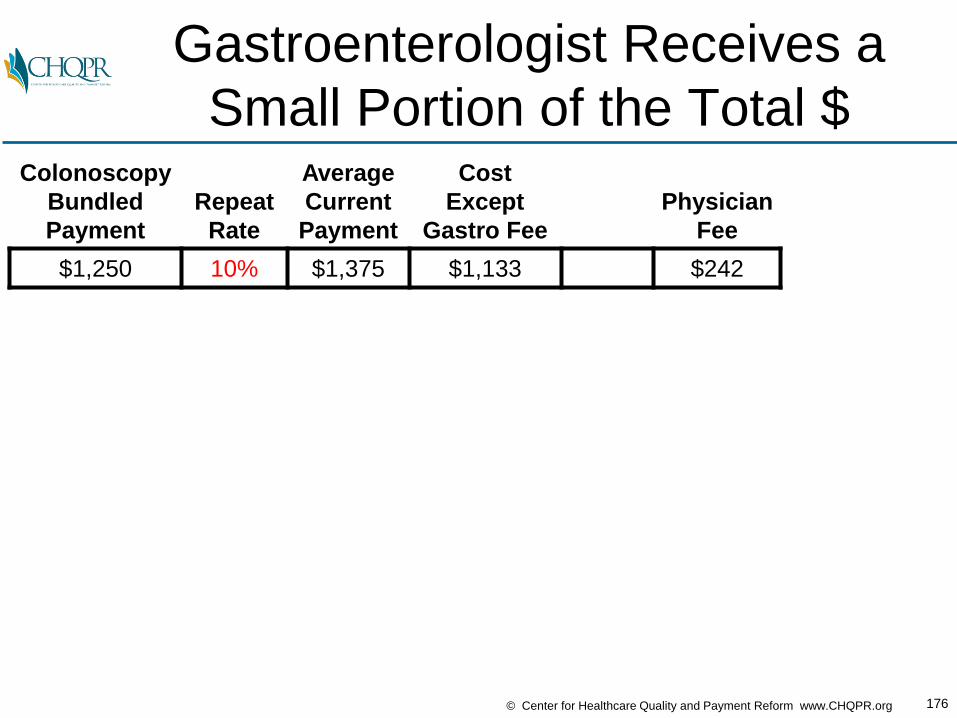
Gastroenterologist Receives a
Small Portion of the Total $Colonoscopy
Bundled
Payment
Repeat
Rate
Average
Current
Payment
Cost
Except
Gastro Fee
Physician
Fee
$1,250 10% $1,375 $1,133 $242
177© Center for Healthcare Quality and Payment Reform www.CHQPR.org
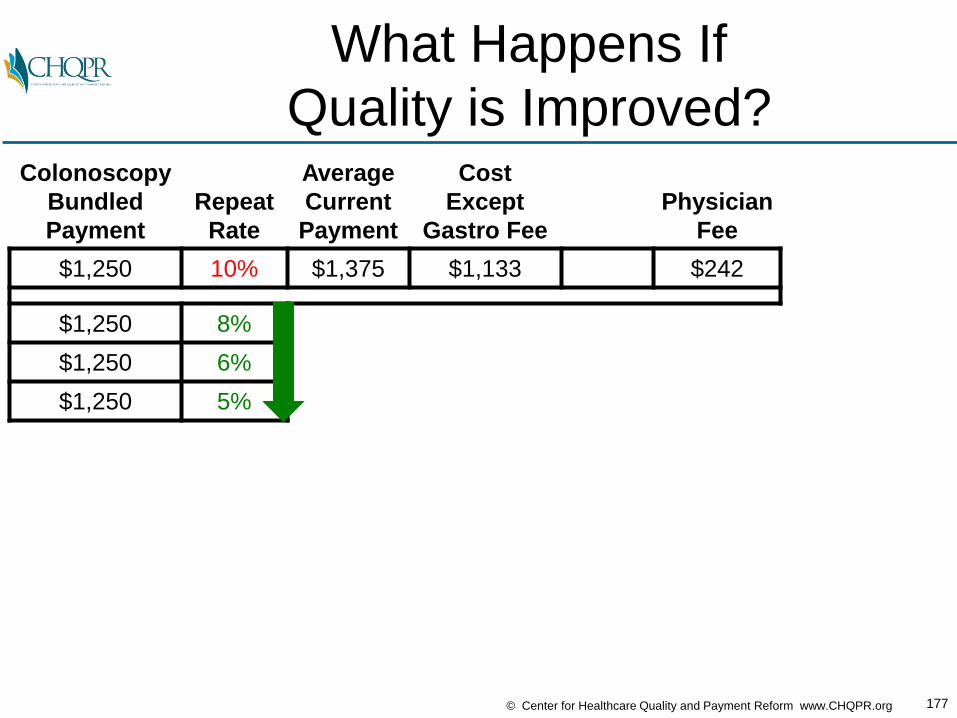
What Happens If
Quality is Improved?Colonoscopy
Bundled
Payment
Repeat
Rate
Average
Current
Payment
Cost
Except
Gastro Fee
Physician
Fee
$1,250 10% $1,375 $1,133 $242
$1,250 8%
$1,250 6%
$1,250 5%

178© Center for Healthcare Quality and Payment Reform www.CHQPR.org
Spending and Costs
Will DecreaseColonoscopy
Bundled
Payment
Repeat
Rate
Average
Current
Payment
Cost
Except
Gastro FeePayer
Change
Physician
Fee
$1,250 10% $1,375 $1,133 $242
$1,250 8% $1,350 $1,112 -1.8%
$1,250 6% $1,325 $1,092 -3.6%
$1,250 5% $1,313 $1,082 -4.5%

179© Center for Healthcare Quality and Payment Reform www.CHQPR.org
Physician Fees Will Also
Decrease With Fewer ProceduresColonoscopy
Bundled
Payment
Repeat
Rate
Average
Current
Payment
Cost
Except
Gastro FeePayer
Change
Physician
FeeProvider
Change
$1,250 10% $1,375 $1,133 $242
$1,250 8% $1,350 $1,112 -1.8% $238 -1.7%
$1,250 6% $1,325 $1,092 -3.6% $233 -3.7%
$1,250 5% $1,313 $1,082 -4.5% $231 -4.5%
180© Center for Healthcare Quality and Payment Reform www.CHQPR.org
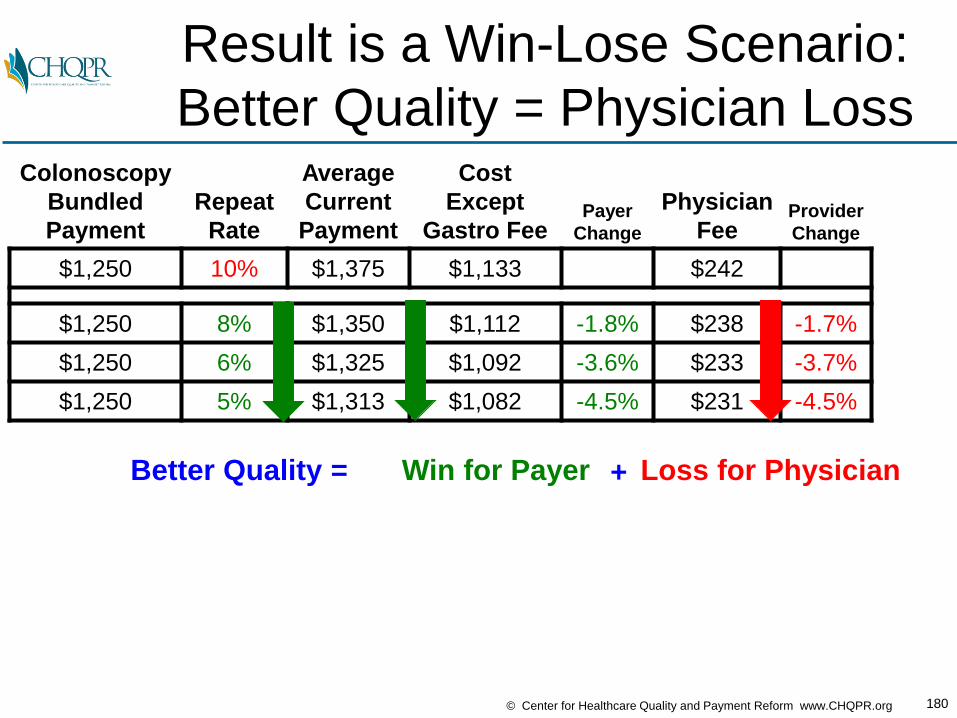
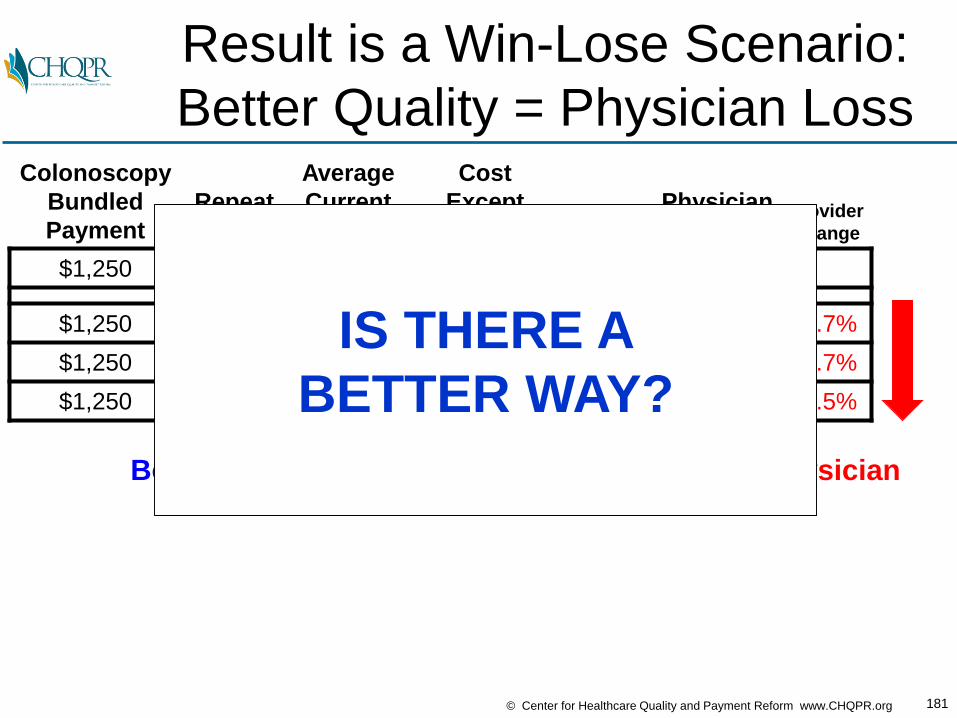
Result is a Win-Lose Scenario:
Better Quality = Physician LossColonoscopy
Bundled
Payment
Repeat
Rate
Average
Current
Payment
Cost
Except
Gastro FeePayer
Change
Physician
FeeProvider
Change
$1,250 10% $1,375 $1,133 $242
$1,250 8% $1,350 $1,112 -1.8% $238 -1.7%
$1,250 6% $1,325 $1,092 -3.6% $233 -3.7%
$1,250 5% $1,313 $1,082 -4.5% $231 -4.5%
Better Quality = Win for Payer Loss for Physician+
181© Center for Healthcare Quality and Payment Reform www.CHQPR.org
Result is a Win-Lose Scenario:
Better Quality = Physician LossColonoscopy
Bundled
Payment
Repeat
Rate
Average
Current
Payment
Cost
Except
Gastro FeePayer
Change
Physician
FeeProvider
Change
$1,250 10% $1,375 $1,133 $242
$1,250 8% $1,350 $1,112 -1.8% $238 -1.7%
$1,250 6% $1,325 $1,092 -3.6% $233 -3.7%
$1,250 5% $1,313 $1,082 -4.5% $231 -4.5%
Better Quality = Win for Payer Loss for Physician+
IS THERE A
BETTER WAY?

182© Center for Healthcare Quality and Payment Reform www.CHQPR.org
What If You Didn’t Charge for
Repeat Colonoscopies?Colonoscopy
Bundled
Payment
Repeat
Rate
Average
Current
Payment
Price
With
Warranty
Cost
Except
Gastro Fee
Physician
Margin Change
$1,250 10% $1,375 $1,133 $242
$1,250 10% $1,375 ?
183© Center for Healthcare Quality and Payment Reform www.CHQPR.org
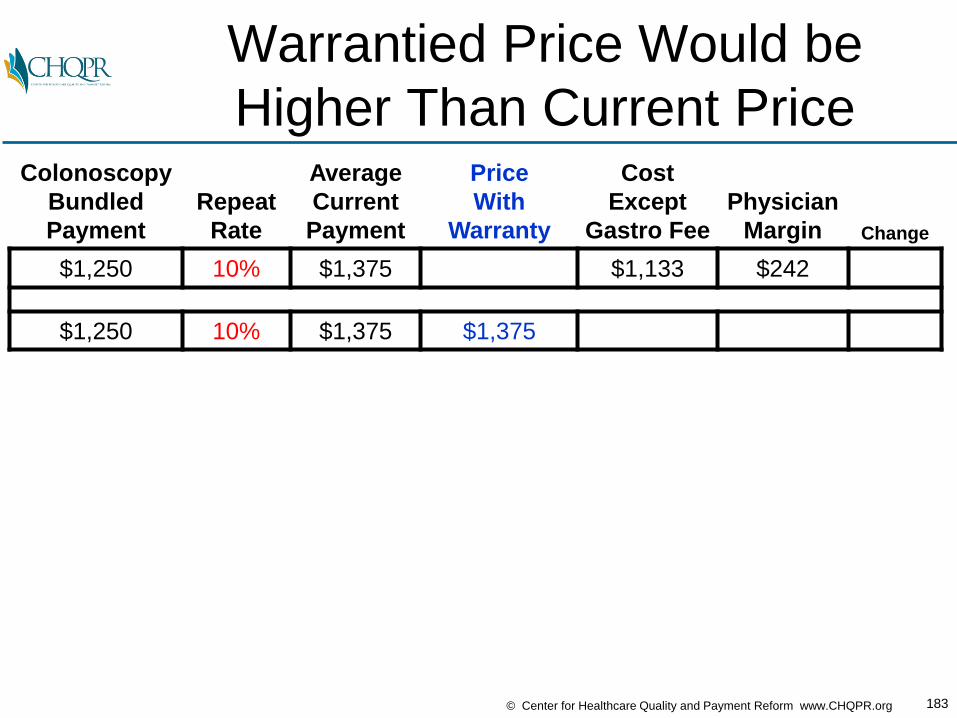
Warrantied Price Would be
Higher Than Current PriceColonoscopy
Bundled
Payment
Repeat
Rate
Average
Current
Payment
Price
With
Warranty
Cost
Except
Gastro Fee
Physician
Margin Change
$1,250 10% $1,375 $1,133 $242
$1,250 10% $1,375 $1,375
184© Center for Healthcare Quality and Payment Reform www.CHQPR.org
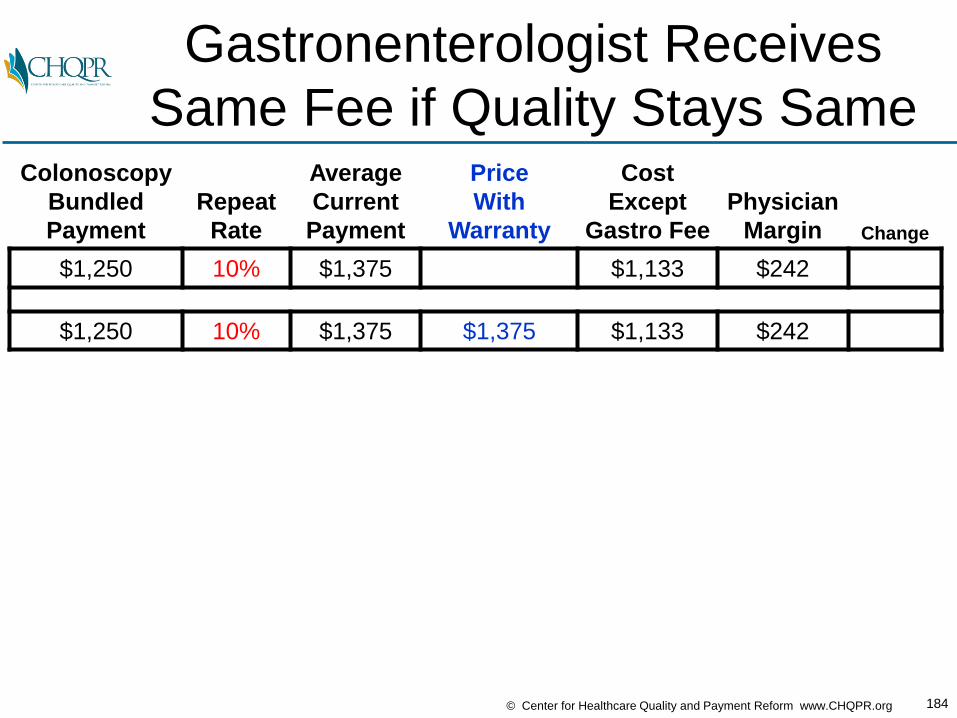
Gastronenterologist Receives
Same Fee if Quality Stays SameColonoscopy
Bundled
Payment
Repeat
Rate
Average
Current
Payment
Price
With
Warranty
Cost
Except
Gastro Fee
Physician
Margin Change
$1,250 10% $1,375 $1,133 $242
$1,250 10% $1,375 $1,375 $1,133 $242
185© Center for Healthcare Quality and Payment Reform www.CHQPR.org
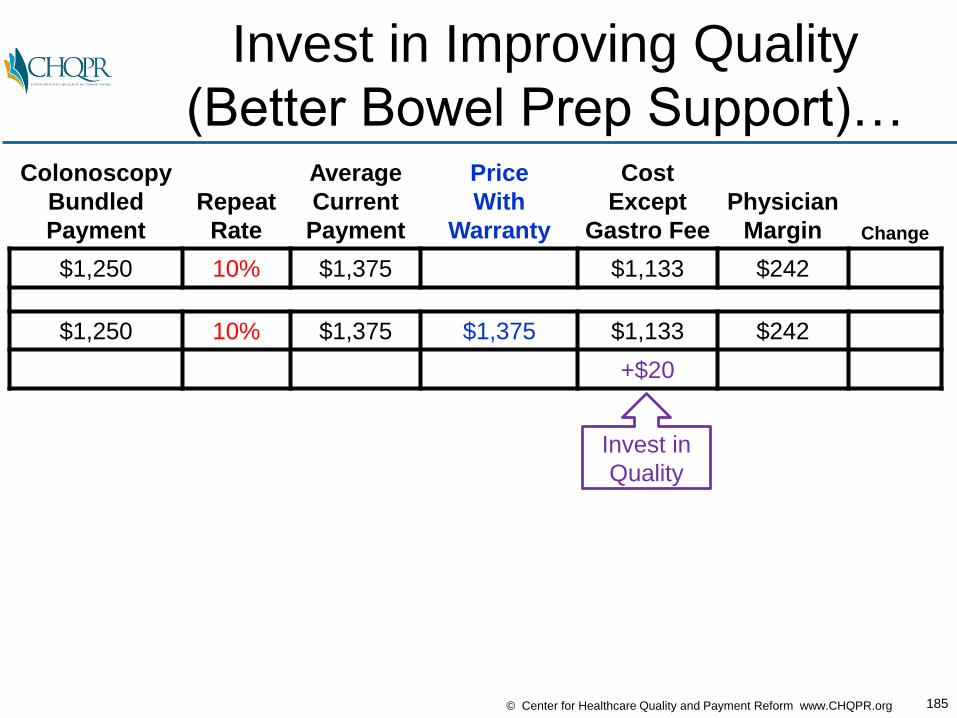
Invest in Improving Quality
(Better Bowel Prep Support)…Colonoscopy
Bundled
Payment
Repeat
Rate
Average
Current
Payment
Price
With
Warranty
Cost
Except
Gastro Fee
Physician
Margin Change
$1,250 10% $1,375 $1,133 $242
$1,250 10% $1,375 $1,375 $1,133 $242
+$20
Invest in
Quality

186© Center for Healthcare Quality and Payment Reform www.CHQPR.org
…Fewer Repeat Procedures
Reduces Total Costs…Colonoscopy
Bundled
Payment
Repeat
Rate
Average
Current
Payment
Price
With
Warranty
Cost
Except
Gastro Fee
Physician
Margin Change
$1,250 10% $1,375 $1,133 $242
$1,250 10% $1,375 $1,375 $1,133 $242
8% $1112+$20
Improve
Quality Invest inQuality
andOtherCosts
Decrease

187© Center for Healthcare Quality and Payment Reform www.CHQPR.org
…Warrantied Payment Doesn’t
Decrease With Fewer Repeats…Colonoscopy
Bundled
Payment
Repeat
Rate
Average
Current
Payment
Price
With
Warranty
Cost
Except
Gastro Fee
Physician
Margin Change
$1,250 10% $1,375 $1,133 $242
$1,250 10% $1,375 $1,375 $1,133 $242
8% $1,375 $1112+$20
Improve
Quality Invest inQuality
andOtherCosts
Decrease
No Loss of
Revenue
188© Center for Healthcare Quality and Payment Reform www.CHQPR.org
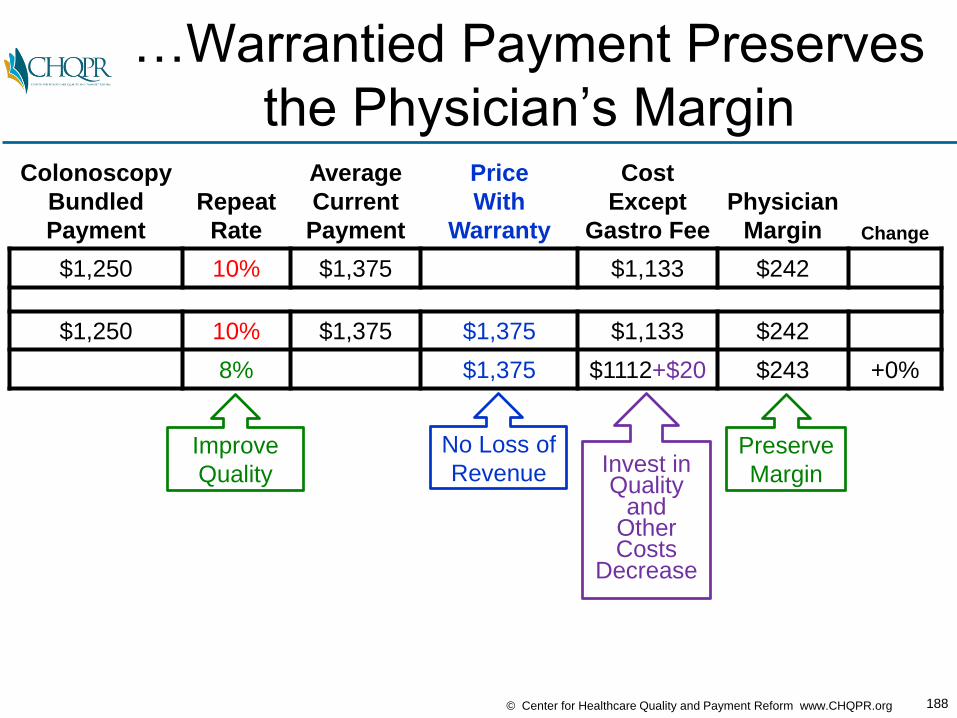
…Warrantied Payment Preserves
the Physician’s MarginColonoscopy
Bundled
Payment
Repeat
Rate
Average
Current
Payment
Price
With
Warranty
Cost
Except
Gastro Fee
Physician
Margin Change
$1,250 10% $1,375 $1,133 $242
$1,250 10% $1,375 $1,375 $1,133 $242
8% $1,375 $1112+$20 $243 +0%
Improve
Quality
Preserve
MarginInvest inQuality
andOtherCosts
Decrease
No Loss of
Revenue

189© Center for Healthcare Quality and Payment Reform www.CHQPR.org
Improving Quality Further
Increases Physician MarginColonoscopy
Bundled
Payment
Repeat
Rate
Average
Current
Payment
Price
With
Warranty
Cost
Except
Gastro Fee
Physician
Margin Change
$1,250 10% $1,375 $1,133 $242
$1,250 10% $1,375 $1,375 $1,133 $242
8% $1,375 $1112+$20 $243 +0%
7% $1,375 $1102+$20 $253 +5%
Better
Quality
Better
MarginReduces
Cost

190© Center for Healthcare Quality and Payment Reform www.CHQPR.org
Virtuous Cycle of Quality
Improvement + Cost ReductionColonoscopy
Bundled
Payment
Repeat
Rate
Average
Current
Payment
Price
With
Warranty
Cost
Except
Gastro Fee
Physician
Margin Change
$1,250 10% $1,375 $1,133 $242
$1,250 10% $1,375 $1,375 $1,133 $242
8% $1,375 $1112+$20 $243 +0%
7% $1,375 $1102+$20 $253 +5%
6% $1,375 $1092+$25 $258 +7%
Better
Quality
Better
MarginReduces
Cost

191© Center for Healthcare Quality and Payment Reform www.CHQPR.org
Price Can Be Reduced
Without Harming MarginsColonoscopy
Bundled
Payment
Repeat
Rate
Average
Current
Payment
Price
With
Warranty
Cost
Except
Gastro Fee
Physician
Margin Change
$1,250 10% $1,375 $1,133 $242
$1,250 10% $1,375 $1,375 $1,133 $242
8% $1,375 $1112+$20 $243 +0%
7% $1,375 $1102+$20 $253 +5%
6% $1,375 $1092+$25 $258 +7%
6% $1,365 $1092+$25 $248 +3%
Still Better
Margin
Allows
Lower Prices
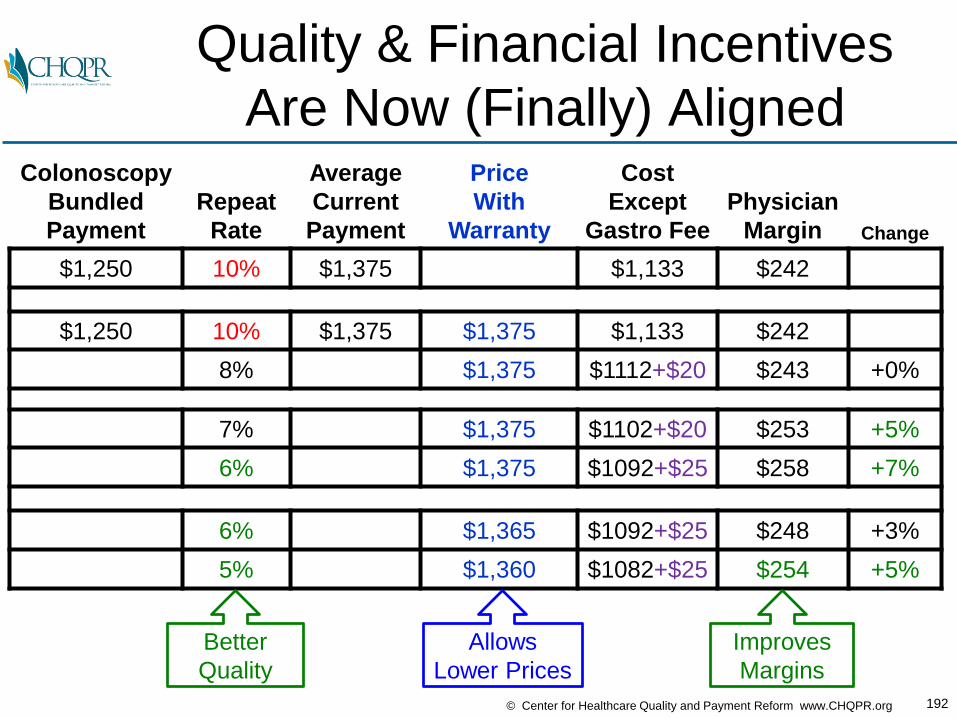
192© Center for Healthcare Quality and Payment Reform www.CHQPR.org
Quality & Financial Incentives
Are Now (Finally) AlignedColonoscopy
Bundled
Payment
Repeat
Rate
Average
Current
Payment
Price
With
Warranty
Cost
Except
Gastro Fee
Physician
Margin Change
$1,250 10% $1,375 $1,133 $242
$1,250 10% $1,375 $1,375 $1,133 $242
8% $1,375 $1112+$20 $243 +0%
7% $1,375 $1102+$20 $253 +5%
6% $1,375 $1092+$25 $258 +7%
6% $1,365 $1092+$25 $248 +3%
5% $1,360 $1082+$25 $254 +5%
Better
Quality
Improves
Margins
Allows
Lower Prices

193© Center for Healthcare Quality and Payment Reform www.CHQPR.org
Win-Win-Win Through
Appropriate Payment & PricingColonoscopy
Bundled
Payment
Repeat
Rate
Average
Current
Payment
Price
With
Warranty
Cost
Except
Gastro Fee
Physician
Margin Change
$1,250 10% $1,375 $1,133 $242
$1,250 10% $1,375 $1,375 $1,133 $242
8% $1,375 $1112+$20 $243 +0%
7% $1,375 $1102+$20 $253 +5%
6% $1,375 $1092+$25 $258 +7%
6% $1,365 $1092+$25 $248 +3%
5% $1,360 $1082+$25 $254 +5%
Quality is Better......Spending is Lower...
...Providers Are More Profitable
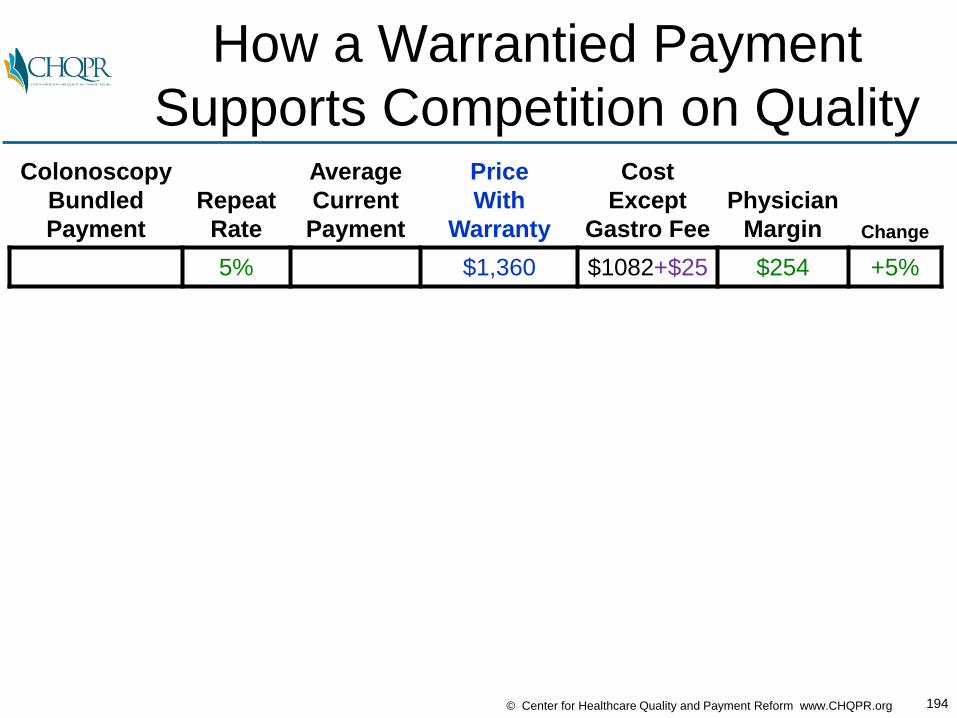
194© Center for Healthcare Quality and Payment Reform www.CHQPR.org
How a Warrantied Payment
Supports Competition on QualityColonoscopy
Bundled
Payment
Repeat
Rate
Average
Current
Payment
Price
With
Warranty
Cost
Except
Gastro Fee
Physician
Margin Change
5% $1,360 $1082+$25 $254 +5%
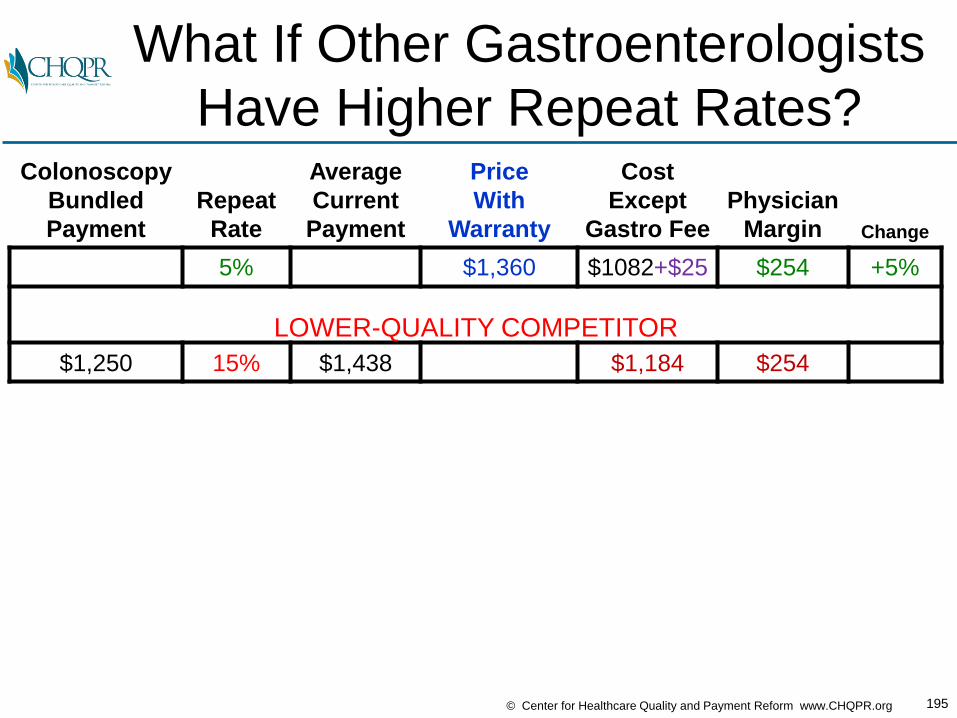
195© Center for Healthcare Quality and Payment Reform www.CHQPR.org
What If Other Gastroenterologists
Have Higher Repeat Rates?Colonoscopy
Bundled
Payment
Repeat
Rate
Average
Current
Payment
Price
With
Warranty
Cost
Except
Gastro Fee
Physician
Margin Change
5% $1,360 $1082+$25 $254 +5%
LOWER-QUALITY COMPETITOR
$1,250 15% $1,438 $1,184 $254
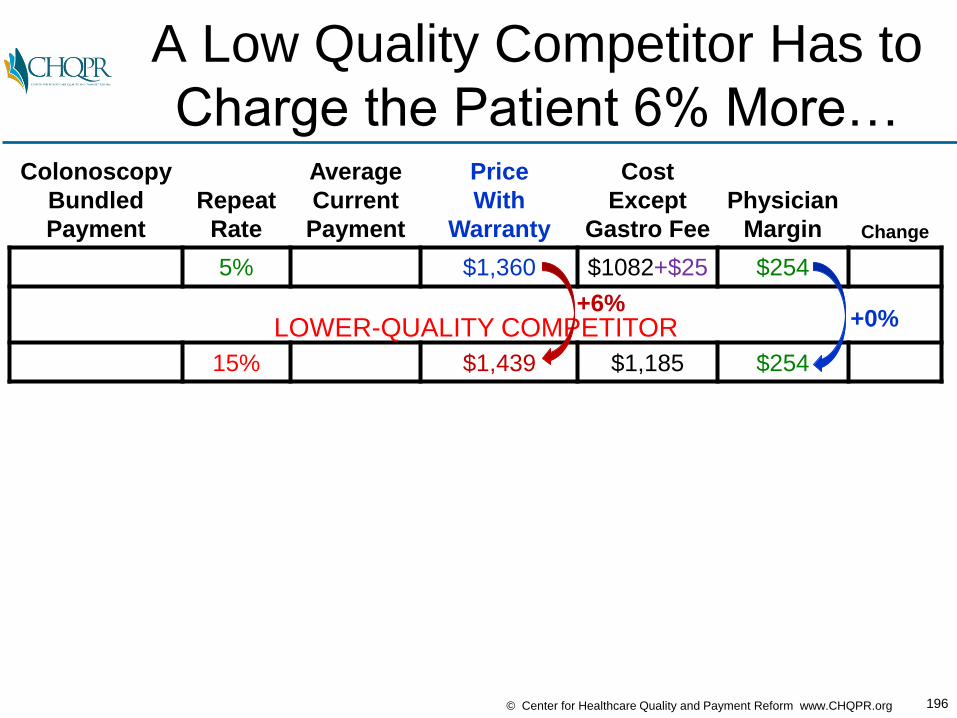
196© Center for Healthcare Quality and Payment Reform www.CHQPR.org
A Low Quality Competitor Has to
Charge the Patient 6% More…Colonoscopy
Bundled
Payment
Repeat
Rate
Average
Current
Payment
Price
With
Warranty
Cost
Except
Gastro Fee
Physician
Margin Change
5% $1,360 $1082+$25 $254
LOWER-QUALITY COMPETITOR
15% $1,439 $1,185 $254
+6%+0%

197© Center for Healthcare Quality and Payment Reform www.CHQPR.org
…Or Match the Price and Pay the
Gastroenterologist 31% LessColonoscopy
Bundled
Payment
Repeat
Rate
Average
Current
Payment
Price
With
Warranty
Cost
Except
Gastro Fee
Physician
Margin Change
5% $1,360 $1082+$25 $254 +5%
LOWER-QUALITY COMPETITOR
15% $1,439 $1,185 $254
15% $1,360 $1,185 $175 -31%
+0%

198© Center for Healthcare Quality and Payment Reform www.CHQPR.org
Win-Win-Win Results Through
Condition-Based Payment
BUILDING BLOCKS HOW IT WORKS WIN-WIN-WIN APPROACH
Bundled Payment
Single payment to ALL providers involved in
delivering ALL of the care
the patient needs• Patients get better quality
care
• Payers spend less for care
• Providers do better financially for delivering high-quality care
Warrantied Payment
Higher payment for quality care,
no extra payment for correcting preventable
errors and complications
Condition-Based Payment
Payment based on the patient’s condition,
rather than on the procedure used
PerformanceGuarantee
Payment only made if quality standards
are met and pre-defined outcomes
are achieved
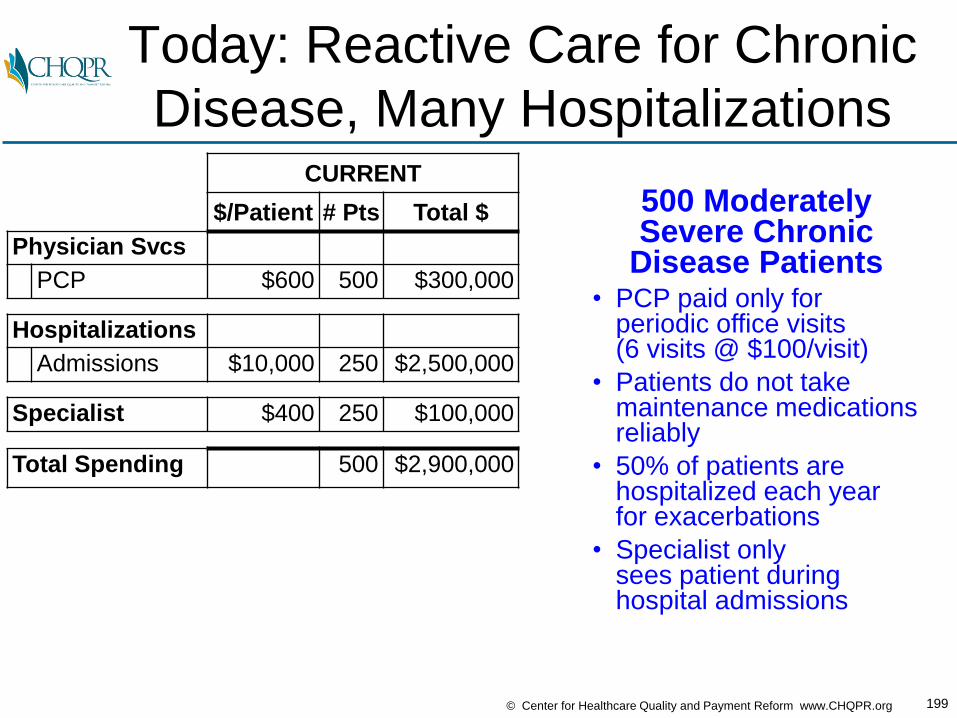
199© Center for Healthcare Quality and Payment Reform www.CHQPR.org
Today: Reactive Care for Chronic
Disease, Many HospitalizationsCURRENT
$/Patient # Pts Total $
Physician Svcs
PCP $600 500 $300,000
Hospitalizations
Admissions $10,000 250 $2,500,000
Specialist $400 250 $100,000
Total Spending 500 $2,900,000
500 ModeratelySevere Chronic
Disease Patients• PCP paid only for
periodic office visits(6 visits @ $100/visit)
• Patients do not takemaintenance medicationsreliably
• 50% of patients are hospitalized each yearfor exacerbations
• Specialist only sees patient duringhospital admissions

200© Center for Healthcare Quality and Payment Reform www.CHQPR.org
Is There a Better Way?
CURRENT FUTURE
$/Patient # Pts Total $ $/Pt # Pts Total $ Chg
Physician Svcs ? ?
PCP $600 500 $300,000 ? ?
Hospitalizations ? ?
Admissions $10,000 250 $2,500,000 ? ?
Specialist $400 250 $100,000 ? ?
Total Spending 500 $2,900,000 ? ?

201© Center for Healthcare Quality and Payment Reform www.CHQPR.org
Pay the PCP for
Proactive Care ManagementCURRENT FUTURE
$/Patient # Pts Total $ $/Pt # Pts Total $ Chg
Physician Svcs
PCP $600 500 $300,000 $900 500 $450,000 +50%
Hospitalizations
Admissions $10,000 250 $2,500,000
Specialist $400 250 $100,000
Total Spending 500 $2,900,000
• Pay PCP $75 per patient per month instead of $100 per visit
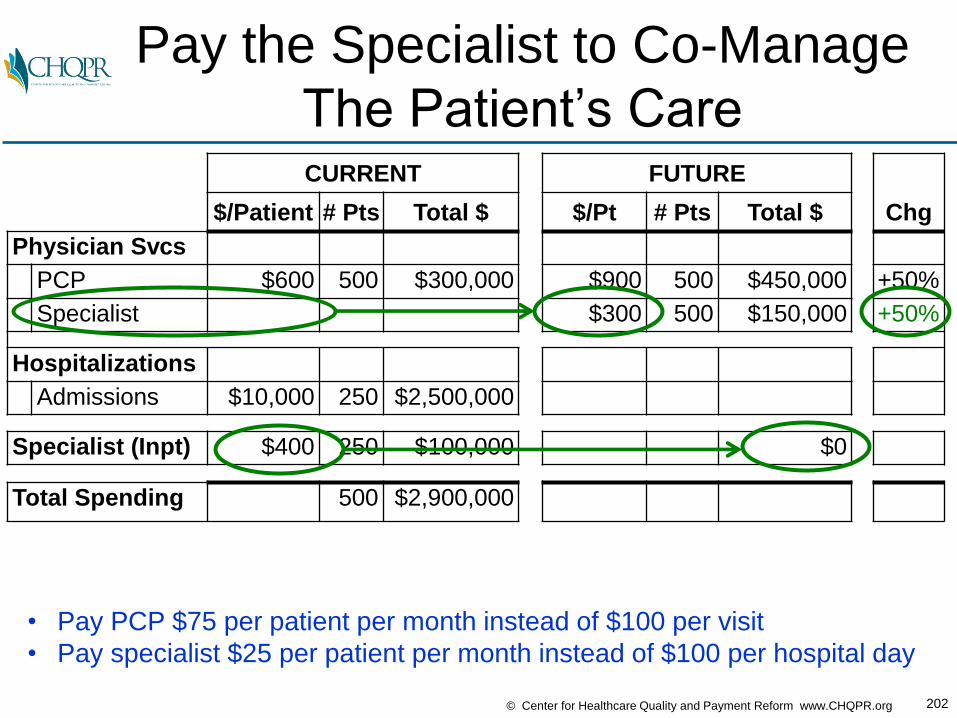
202© Center for Healthcare Quality and Payment Reform www.CHQPR.org
Pay the Specialist to Co-Manage
The Patient’s CareCURRENT FUTURE
$/Patient # Pts Total $ $/Pt # Pts Total $ Chg
Physician Svcs
PCP $600 500 $300,000 $900 500 $450,000 +50%
Specialist $300 500 $150,000 +50%
Hospitalizations
Admissions $10,000 250 $2,500,000
Specialist (Inpt) $400 250 $100,000 $0
Total Spending 500 $2,900,000
• Pay PCP $75 per patient per month instead of $100 per visit
• Pay specialist $25 per patient per month instead of $100 per hospital day
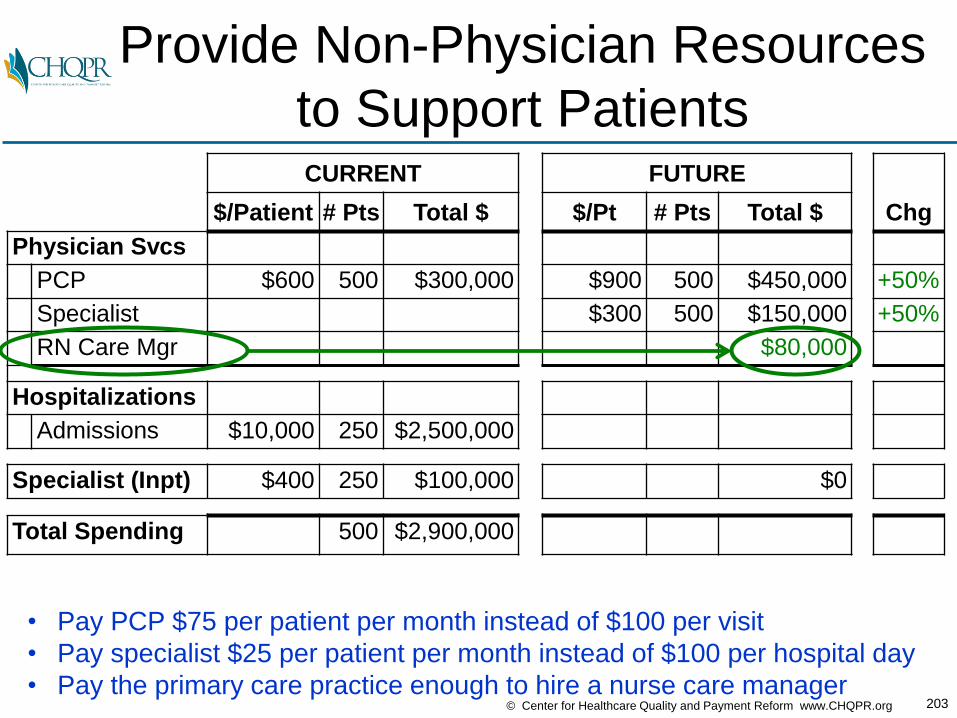
203© Center for Healthcare Quality and Payment Reform www.CHQPR.org
Provide Non-Physician Resources
to Support PatientsCURRENT FUTURE
$/Patient # Pts Total $ $/Pt # Pts Total $ Chg
Physician Svcs
PCP $600 500 $300,000 $900 500 $450,000 +50%
Specialist $300 500 $150,000 +50%
RN Care Mgr $80,000
Hospitalizations
Admissions $10,000 250 $2,500,000
Specialist (Inpt) $400 250 $100,000 $0
Total Spending 500 $2,900,000
• Pay PCP $75 per patient per month instead of $100 per visit
• Pay specialist $25 per patient per month instead of $100 per hospital day
• Pay the primary care practice enough to hire a nurse care manager
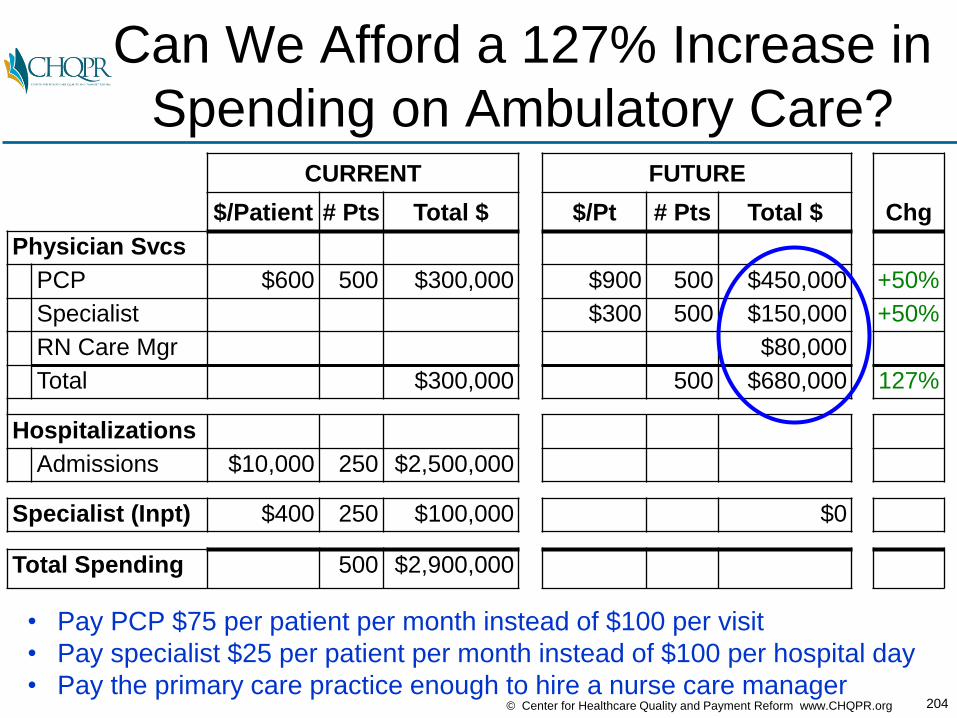
204© Center for Healthcare Quality and Payment Reform www.CHQPR.org
Can We Afford a 127% Increase in
Spending on Ambulatory Care?CURRENT FUTURE
$/Patient # Pts Total $ $/Pt # Pts Total $ Chg
Physician Svcs
PCP $600 500 $300,000 $900 500 $450,000 +50%
Specialist $300 500 $150,000 +50%
RN Care Mgr $80,000
Total $300,000 500 $680,000 127%
Hospitalizations
Admissions $10,000 250 $2,500,000
Specialist (Inpt) $400 250 $100,000 $0
Total Spending 500 $2,900,000
• Pay PCP $75 per patient per month instead of $100 per visit
• Pay specialist $25 per patient per month instead of $100 per hospital day
• Pay the primary care practice enough to hire a nurse care manager
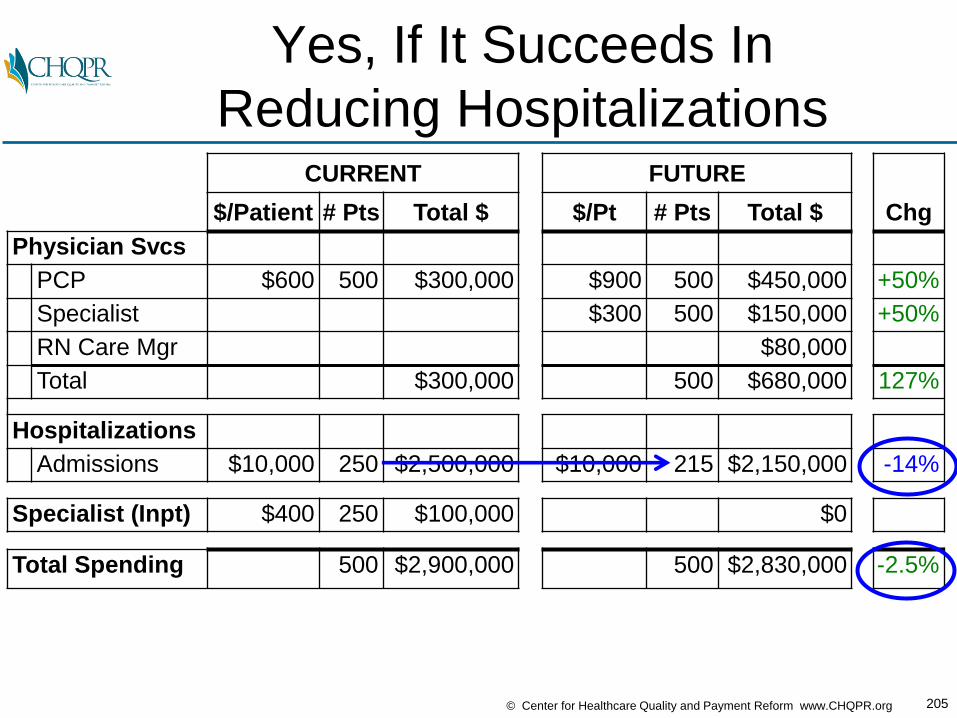
205© Center for Healthcare Quality and Payment Reform www.CHQPR.org
Yes, If It Succeeds In
Reducing HospitalizationsCURRENT FUTURE
$/Patient # Pts Total $ $/Pt # Pts Total $ Chg
Physician Svcs
PCP $600 500 $300,000 $900 500 $450,000 +50%
Specialist $300 500 $150,000 +50%
RN Care Mgr $80,000
Total $300,000 500 $680,000 127%
Hospitalizations
Admissions $10,000 250 $2,500,000 $10,000 215 $2,150,000 -14%
Specialist (Inpt) $400 250 $100,000 $0
Total Spending 500 $2,900,000 500 $2,830,000 -2.5%
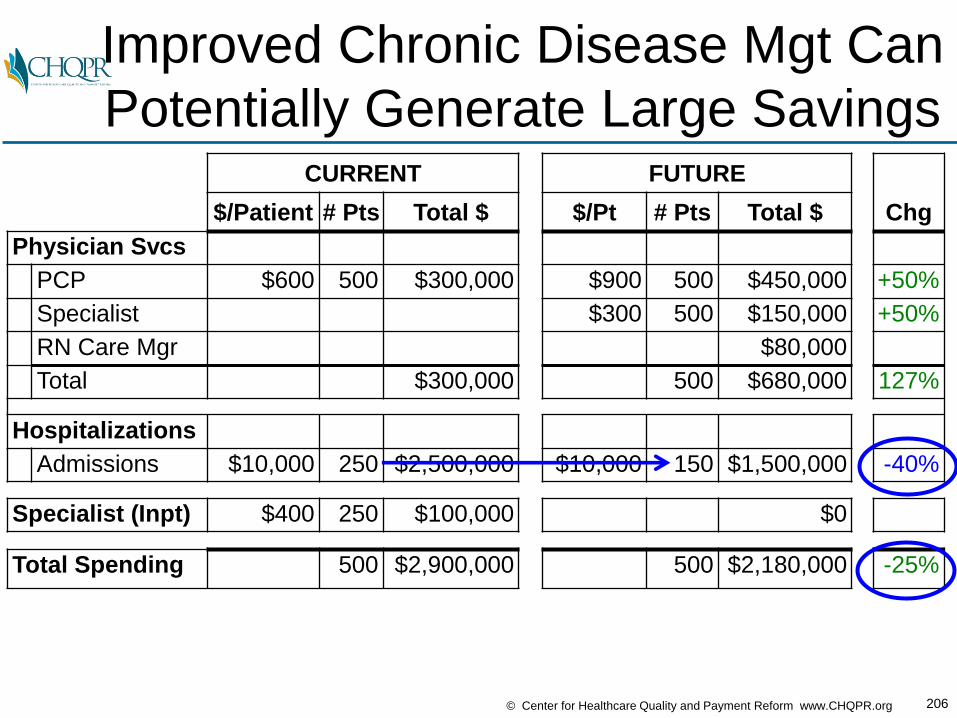
206© Center for Healthcare Quality and Payment Reform www.CHQPR.org
Improved Chronic Disease Mgt Can
Potentially Generate Large SavingsCURRENT FUTURE
$/Patient # Pts Total $ $/Pt # Pts Total $ Chg
Physician Svcs
PCP $600 500 $300,000 $900 500 $450,000 +50%
Specialist $300 500 $150,000 +50%
RN Care Mgr $80,000
Total $300,000 500 $680,000 127%
Hospitalizations
Admissions $10,000 250 $2,500,000 $10,000 150 $1,500,000 -40%
Specialist (Inpt) $400 250 $100,000 $0
Total Spending 500 $2,900,000 500 $2,180,000 -25%

207© Center for Healthcare Quality and Payment Reform www.CHQPR.org
Do Wins for Patients, Docs & Payers
Require Losses for Hospitals?CURRENT FUTURE
$/Patient # Pts Total $ $/Pt # Pts Total $ Chg
Physician Svcs
PCP $600 500 $300,000 $900 500 $450,000 +50%
Specialist $300 500 $150,000 +50%
RN Care Mgr $80,000
Total $300,000 500 $680,000 127%
Hospitalizations
Admissions $10,000 250 $2,500,000 $10,000 150 $1,500,000 -40%
Specialist (Inpt) $400 250 $100,000 $0
Total Spending 500 $2,900,000 500 $2,180,000 -25%

208© Center for Healthcare Quality and Payment Reform www.CHQPR.org
What Should Matter to Hospitals is
Margin, Not Revenues (Volume)

209© Center for Healthcare Quality and Payment Reform www.CHQPR.org
Hospital Costs Are Not
Proportional to Utilization
$800$820$840$860$880$900$920$940$960$980$1,000
81
82
83
84
85
86
87
88
89
90
91
92
93
94
95
96
97
98
99
100
$0
00
#Patients
Cost & Revenue Changes With Fewer Patients
.
Costs
20% reduction in volume
7% reduction
in cost
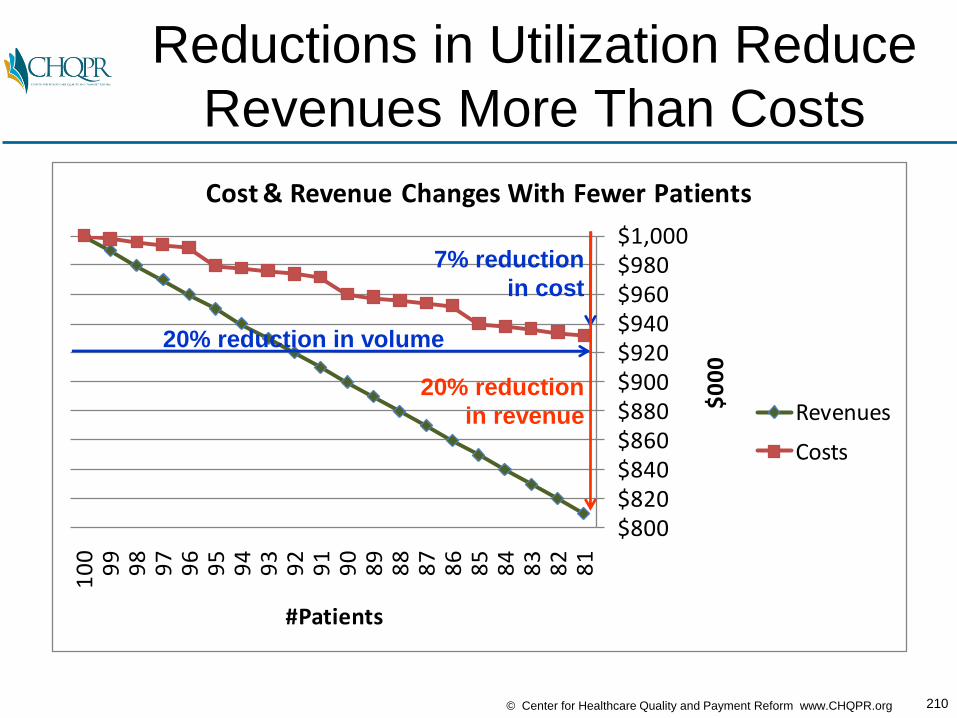
210© Center for Healthcare Quality and Payment Reform www.CHQPR.org
Reductions in Utilization Reduce
Revenues More Than Costs
$800$820$840$860$880$900$920$940$960$980$1,000
81
82
83
84
85
86
87
88
89
90
91
92
93
94
95
96
97
98
99
100
$0
00
#Patients
Cost & Revenue Changes With Fewer Patients
Revenues
Costs
20% reduction in volume
7% reduction
in cost
20% reduction
in revenue
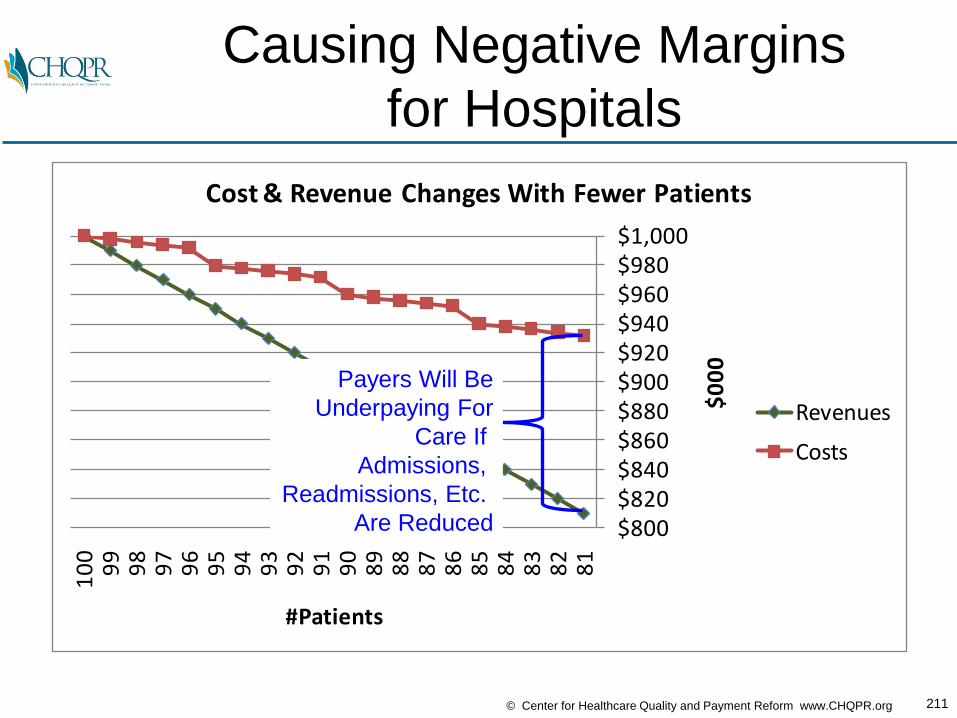
211© Center for Healthcare Quality and Payment Reform www.CHQPR.org
Causing Negative Margins
for Hospitals
$800$820$840$860$880$900$920$940$960$980$1,000
81
82
83
84
85
86
87
88
89
90
91
92
93
94
95
96
97
98
99
100
$0
00
#Patients
Cost & Revenue Changes With Fewer Patients
Revenues
Costs
Payers Will Be
Underpaying For
Care If
Admissions,
Readmissions, Etc.
Are Reduced
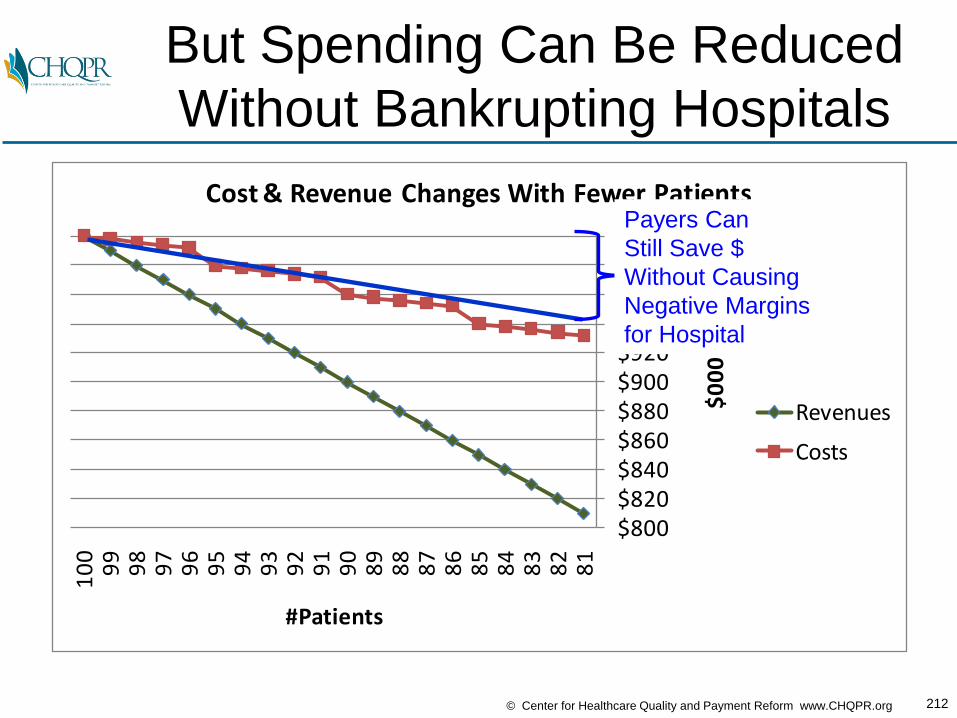
212© Center for Healthcare Quality and Payment Reform www.CHQPR.org
But Spending Can Be Reduced
Without Bankrupting Hospitals
$800$820$840$860$880$900$920$940$960$980$1,000
81
82
83
84
85
86
87
88
89
90
91
92
93
94
95
96
97
98
99
100
$0
00
#Patients
Cost & Revenue Changes With Fewer Patients
Revenues
Costs
Payers Can
Still Save $
Without Causing
Negative Margins
for Hospital

213© Center for Healthcare Quality and Payment Reform www.CHQPR.org
Where Does the
Hospital Payment Go?CURRENT FUTURE
$/Patient # Pts Total $ $/Pt # Pts Total $ Chg
Physician Svcs
PCP $600 500 $300,000 $900 500 $450,000 +50%
Specialist $300 500 $150,000 +50%
RN Care Mgr $80,000
Total $300,000 500 $680,000 127%
Hospitalizations
Admissions $10,000 250 $2,500,000 $10,000 150 $1,500,000 -40%
Specialist (Inpt) $400 250 $100,000 $0
Total Spending 500 $2,900,000 500 $2,180,000 -25%
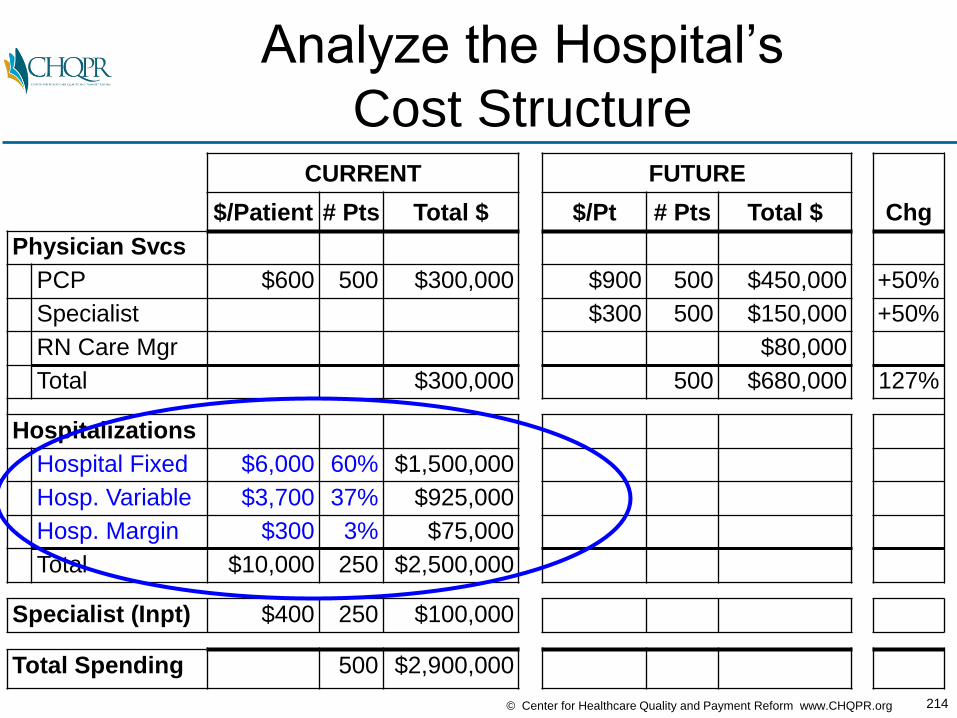
214© Center for Healthcare Quality and Payment Reform www.CHQPR.org
Analyze the Hospital’s
Cost StructureCURRENT FUTURE
$/Patient # Pts Total $ $/Pt # Pts Total $ Chg
Physician Svcs
PCP $600 500 $300,000 $900 500 $450,000 +50%
Specialist $300 500 $150,000 +50%
RN Care Mgr $80,000
Total $300,000 500 $680,000 127%
Hospitalizations
Hospital Fixed $6,000 60% $1,500,000
Hosp. Variable $3,700 37% $925,000
Hosp. Margin $300 3% $75,000
Total $10,000 250 $2,500,000
Specialist (Inpt) $400 250 $100,000
Total Spending 500 $2,900,000

215© Center for Healthcare Quality and Payment Reform www.CHQPR.org
What Happens to Hospital Finances
When Admissions Go Down?CURRENT FUTURE
$/Patient # Pts Total $ $/Pt # Pts Total $ Chg
Physician Svcs
PCP $600 500 $300,000 $900 500 $450,000 +50%
Specialist $300 500 $150,000 +50%
RN Care Mgr $80,000
Total $300,000 500 $680,000 127%
Hospitalizations
Hospital Fixed $6,000 60% $1,500,000
Hosp. Variable $3,700 37% $925,000
Hosp. Margin $300 3% $75,000
Total $10,000 250 $2,500,000 150
Specialist (Inpt) $400 250 $100,000 $0
Total Spending 500 $2,900,000
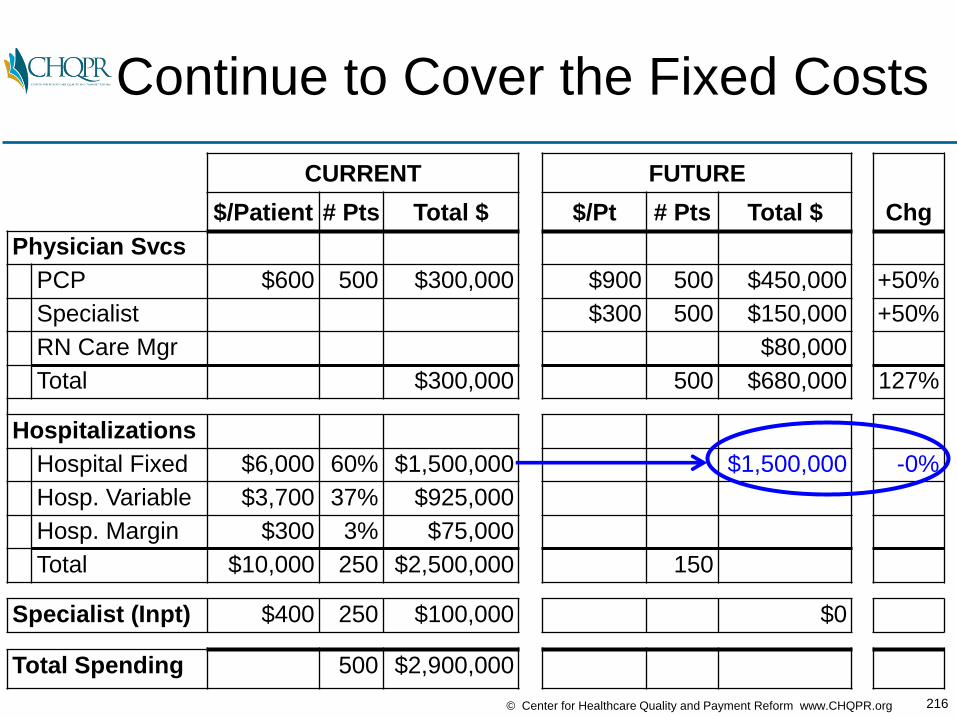
216© Center for Healthcare Quality and Payment Reform www.CHQPR.org
Continue to Cover the Fixed Costs
CURRENT FUTURE
$/Patient # Pts Total $ $/Pt # Pts Total $ Chg
Physician Svcs
PCP $600 500 $300,000 $900 500 $450,000 +50%
Specialist $300 500 $150,000 +50%
RN Care Mgr $80,000
Total $300,000 500 $680,000 127%
Hospitalizations
Hospital Fixed $6,000 60% $1,500,000 $1,500,000 -0%
Hosp. Variable $3,700 37% $925,000
Hosp. Margin $300 3% $75,000
Total $10,000 250 $2,500,000 150
Specialist (Inpt) $400 250 $100,000 $0
Total Spending 500 $2,900,000
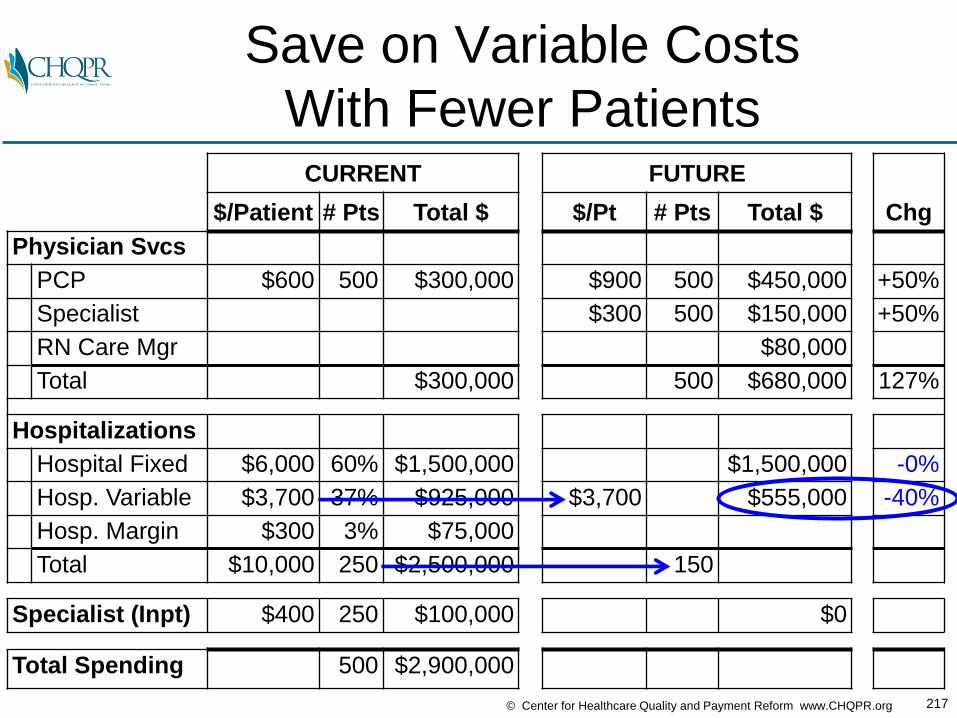
217© Center for Healthcare Quality and Payment Reform www.CHQPR.org
Save on Variable Costs
With Fewer PatientsCURRENT FUTURE
$/Patient # Pts Total $ $/Pt # Pts Total $ Chg
Physician Svcs
PCP $600 500 $300,000 $900 500 $450,000 +50%
Specialist $300 500 $150,000 +50%
RN Care Mgr $80,000
Total $300,000 500 $680,000 127%
Hospitalizations
Hospital Fixed $6,000 60% $1,500,000 $1,500,000 -0%
Hosp. Variable $3,700 37% $925,000 $3,700 $555,000 -40%
Hosp. Margin $300 3% $75,000
Total $10,000 250 $2,500,000 150
Specialist (Inpt) $400 250 $100,000 $0
Total Spending 500 $2,900,000

218© Center for Healthcare Quality and Payment Reform www.CHQPR.org
Increase the Hospital’s
Contribution MarginCURRENT FUTURE
$/Patient # Pts Total $ $/Pt # Pts Total $ Chg
Physician Svcs
PCP $600 500 $300,000 $900 500 $450,000 +50%
Specialist $300 500 $150,000 +50%
RN Care Mgr $80,000
Total $300,000 500 $680,000 127%
Hospitalizations
Hospital Fixed $6,000 60% $1,500,000 $1,500,000 -0%
Hosp. Variable $3,700 37% $925,000 $555,000 -40%
Hosp. Margin $300 3% $75,000 $82,500 +10%
Total $10,000 250 $2,500,000 150
Specialist (Inpt) $400 250 $100,000 $0
Total Spending 500 $2,900,000
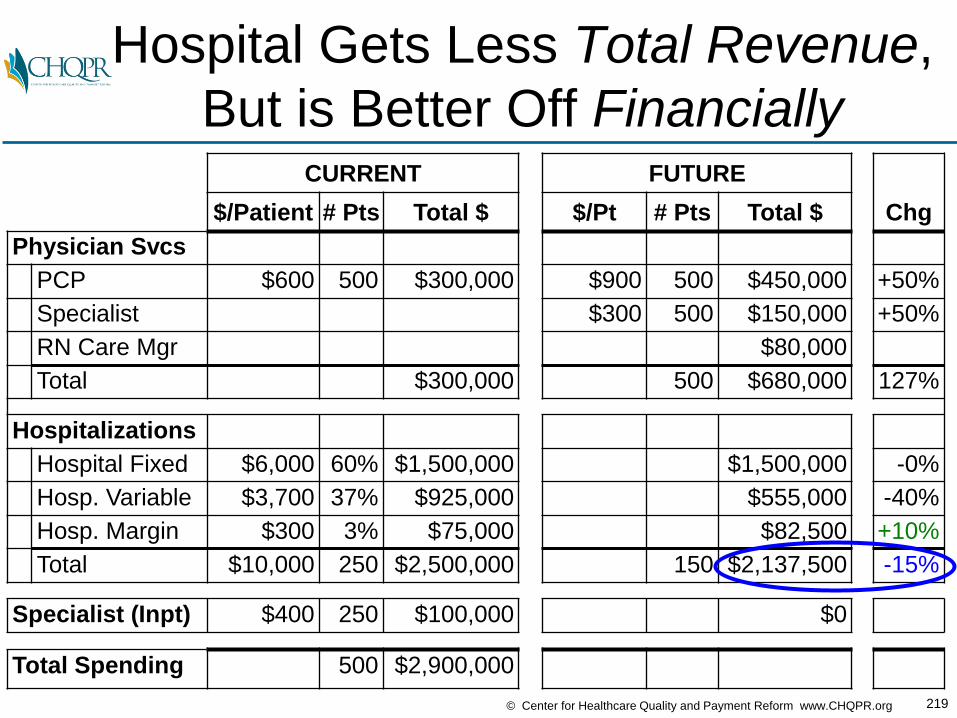
219© Center for Healthcare Quality and Payment Reform www.CHQPR.org
Hospital Gets Less Total Revenue,
But is Better Off FinanciallyCURRENT FUTURE
$/Patient # Pts Total $ $/Pt # Pts Total $ Chg
Physician Svcs
PCP $600 500 $300,000 $900 500 $450,000 +50%
Specialist $300 500 $150,000 +50%
RN Care Mgr $80,000
Total $300,000 500 $680,000 127%
Hospitalizations
Hospital Fixed $6,000 60% $1,500,000 $1,500,000 -0%
Hosp. Variable $3,700 37% $925,000 $555,000 -40%
Hosp. Margin $300 3% $75,000 $82,500 +10%
Total $10,000 250 $2,500,000 150 $2,137,500 -15%
Specialist (Inpt) $400 250 $100,000 $0
Total Spending 500 $2,900,000
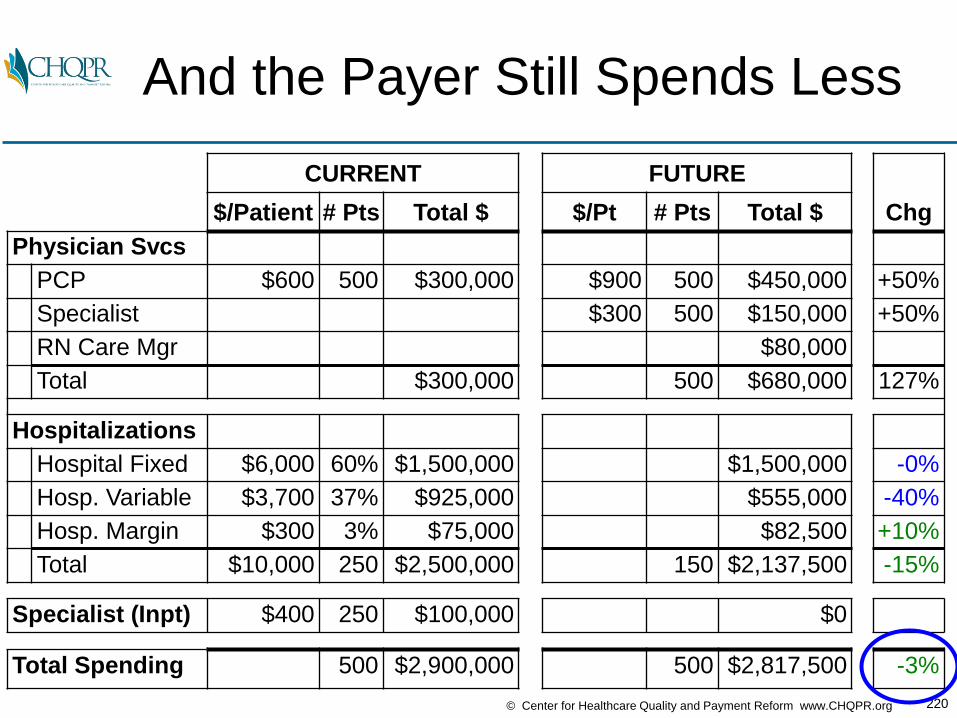
220© Center for Healthcare Quality and Payment Reform www.CHQPR.org
And the Payer Still Spends Less
CURRENT FUTURE
$/Patient # Pts Total $ $/Pt # Pts Total $ Chg
Physician Svcs
PCP $600 500 $300,000 $900 500 $450,000 +50%
Specialist $300 500 $150,000 +50%
RN Care Mgr $80,000
Total $300,000 500 $680,000 127%
Hospitalizations
Hospital Fixed $6,000 60% $1,500,000 $1,500,000 -0%
Hosp. Variable $3,700 37% $925,000 $555,000 -40%
Hosp. Margin $300 3% $75,000 $82,500 +10%
Total $10,000 250 $2,500,000 150 $2,137,500 -15%
Specialist (Inpt) $400 250 $100,000 $0
Total Spending 500 $2,900,000 500 $2,817,500 -3%
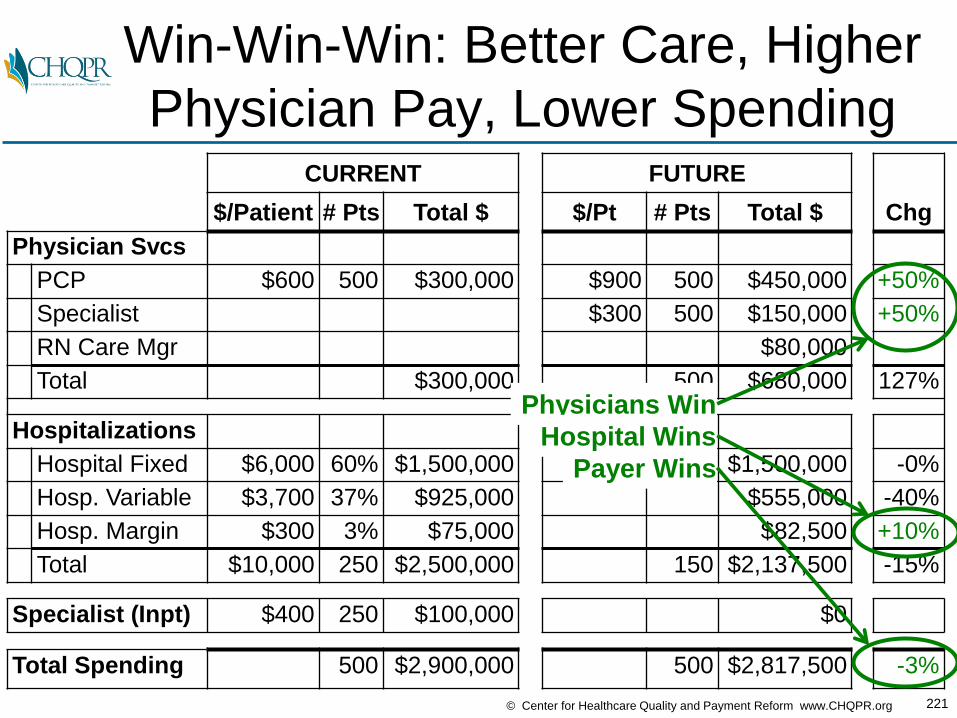
221© Center for Healthcare Quality and Payment Reform www.CHQPR.org
Win-Win-Win: Better Care, Higher
Physician Pay, Lower SpendingCURRENT FUTURE
$/Patient # Pts Total $ $/Pt # Pts Total $ Chg
Physician Svcs
PCP $600 500 $300,000 $900 500 $450,000 +50%
Specialist $300 500 $150,000 +50%
RN Care Mgr $80,000
Total $300,000 500 $680,000 127%
Hospitalizations
Hospital Fixed $6,000 60% $1,500,000 $1,500,000 -0%
Hosp. Variable $3,700 37% $925,000 $555,000 -40%
Hosp. Margin $300 3% $75,000 $82,500 +10%
Total $10,000 250 $2,500,000 150 $2,137,500 -15%
Specialist (Inpt) $400 250 $100,000 $0
Total Spending 500 $2,900,000 500 $2,817,500 -3%
Physicians Win
Payer Wins
Hospital Wins
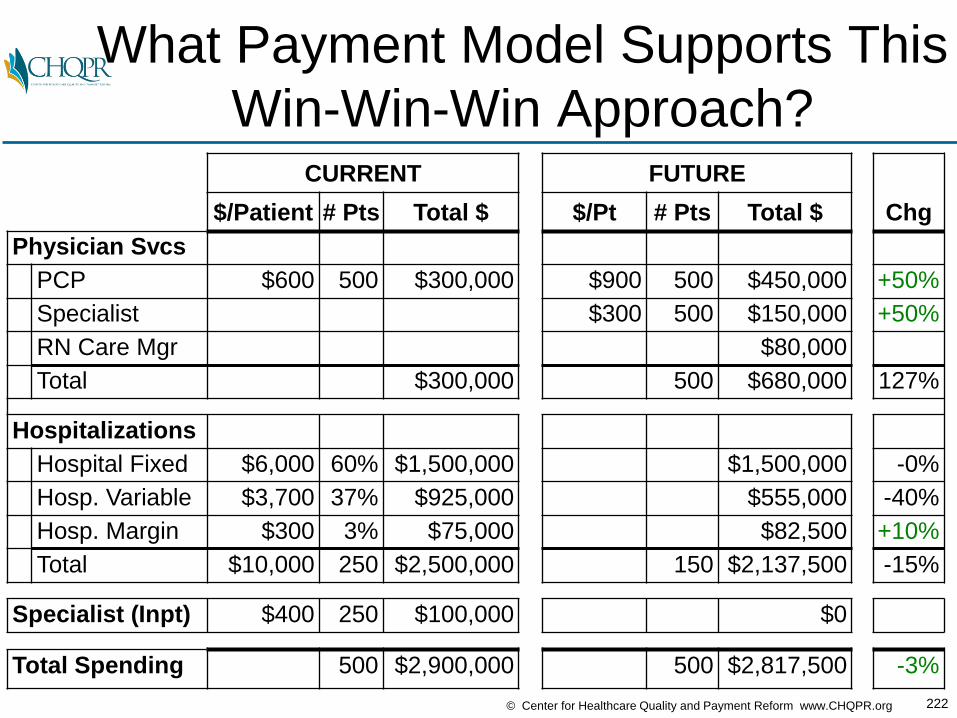
222© Center for Healthcare Quality and Payment Reform www.CHQPR.org
What Payment Model Supports This
Win-Win-Win Approach?CURRENT FUTURE
$/Patient # Pts Total $ $/Pt # Pts Total $ Chg
Physician Svcs
PCP $600 500 $300,000 $900 500 $450,000 +50%
Specialist $300 500 $150,000 +50%
RN Care Mgr $80,000
Total $300,000 500 $680,000 127%
Hospitalizations
Hospital Fixed $6,000 60% $1,500,000 $1,500,000 -0%
Hosp. Variable $3,700 37% $925,000 $555,000 -40%
Hosp. Margin $300 3% $75,000 $82,500 +10%
Total $10,000 250 $2,500,000 150 $2,137,500 -15%
Specialist (Inpt) $400 250 $100,000 $0
Total Spending 500 $2,900,000 500 $2,817,500 -3%

223© Center for Healthcare Quality and Payment Reform www.CHQPR.org
You Don’t Want to Try and
Renegotiate Individual FeesCURRENT FUTURE
$/Patient # Pts Total $ $/Pt # Pts Total $ Chg
Physician Svcs
PCP $600 500 $300,000 $900 500 $450,000 +50%
Specialist $300 500 $150,000 +50%
RN Care Mgr $80,000
Total $300,000 500 $680,000 127%
Hospitalizations
Hospital Fixed $6,000 60% $1,500,000 $1,500,000 -0%
Hosp. Variable $3,700 37% $925,000 $555,000 -40%
Hosp. Margin $300 3% $75,000 $82,500 +10%
Total $10,000 250 $2,500,000 $14,250 150 $2,137,500 -15%
Specialist (Inpt) $400 250 $100,000 $0
Total Spending 500 $2,900,000 500 $2,817,500 -3%

224© Center for Healthcare Quality and Payment Reform www.CHQPR.org
…What Assures The Payer That
There Will Be Fewer Admissions?CURRENT FUTURE
$/Patient # Pts Total $ $/Pt # Pts Total $ Chg
Physician Svcs
PCP $600 500 $300,000 $900 500 $450,000 +50%
Specialist $300 500 $150,000 +50%
RN Care Mgr $80,000
Total $300,000 500 $680,000 127%
Hospitalizations
Hospital Fixed $6,000 60% $1,500,000 $1,500,000 -0%
Hosp. Variable $3,700 37% $925,000 $555,000 -40%
Hosp. Margin $300 3% $75,000 $82,500 +10%
Total $10,000 250 $2,500,000 $14,250 150 $2,137,500 -15%
Specialist (Inpt) $400 250 $100,000 $0
Total Spending 500 $2,900,000 500 $2,817,500 -3%
?

225© Center for Healthcare Quality and Payment Reform www.CHQPR.org
Look at What is Being Spent Today
in Total on the Patient’s ConditionCURRENT FUTURE
$/Patient # Pts Total $ $/Pt # Pts Total $ Chg
Physician Svcs
PCP $600 500 $300,000
Specialist
RN Care Mgr
Total $300,000
Hospitalizations
Hospital Fixed $6,000 60% $1,500,000
Hosp. Variable $3,700 37% $925,000
Hosp. Margin $300 3% $75,000
Total 250 $2,500,000
Specialist (Inpt) $400 250 $100,000
Total Spending $5,800 500 $2,900,000

226© Center for Healthcare Quality and Payment Reform www.CHQPR.org
Tell the Payer You’ll Do It For Less
Than They’re Spending TodayCURRENT FUTURE
$/Patient # Pts Total $ $/Pt # Pts Total $ Chg
Physician Svcs
PCP $600 500 $300,000
Specialist
RN Care Mgr
Total $300,000
Hospitalizations
Hospital Fixed $6,000 60% $1,500,000
Hosp. Variable $3,700 37% $925,000
Hosp. Margin $300 3% $75,000
Total 250 $2,500,000
Specialist (Inpt) $400 250 $100,000
Total Spending $5,800 500 $2,900,000 $5,635 500 $2,817,500 -3%
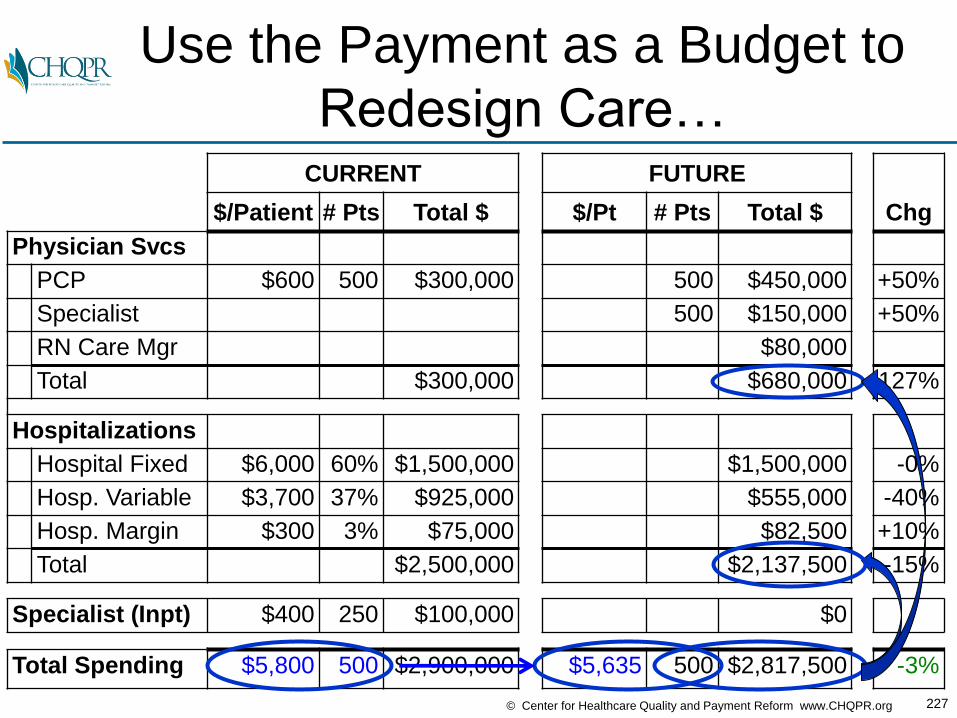
227© Center for Healthcare Quality and Payment Reform www.CHQPR.org
Use the Payment as a Budget to
Redesign Care…CURRENT FUTURE
$/Patient # Pts Total $ $/Pt # Pts Total $ Chg
Physician Svcs
PCP $600 500 $300,000 500 $450,000 +50%
Specialist 500 $150,000 +50%
RN Care Mgr $80,000
Total $300,000 $680,000 127%
Hospitalizations
Hospital Fixed $6,000 60% $1,500,000 $1,500,000 -0%
Hosp. Variable $3,700 37% $925,000 $555,000 -40%
Hosp. Margin $300 3% $75,000 $82,500 +10%
Total $2,500,000 $2,137,500 -15%
Specialist (Inpt) $400 250 $100,000 $0
Total Spending $5,800 500 $2,900,000 $5,635 500 $2,817,500 -3%

228© Center for Healthcare Quality and Payment Reform www.CHQPR.org
…And Let Providers Decide
How They Should Be PaidCURRENT FUTURE
$/Patient # Pts Total $ $/Pt # Pts Total $ Chg
Physician Svcs
PCP $600 500 $300,000 $900 500 $450,000 +50%
Specialist $300 500 $150,000 +50%
RN Care Mgr $80,000
Total $300,000 $680,000 127%
Hospitalizations
Hospital Fixed $6,000 60% $1,500,000 $1,500,000 -0%
Hosp. Variable $3,700 37% $925,000 $555,000 -40%
Hosp. Margin $300 3% $75,000 $82,500 +10%
Total $2,500,000 $2,137,500 -15%
Specialist (Inpt) $400 250 $100,000 $0
Total Spending $5,800 500 $2,900,000 $5,635 500 $2,817,500 -3%
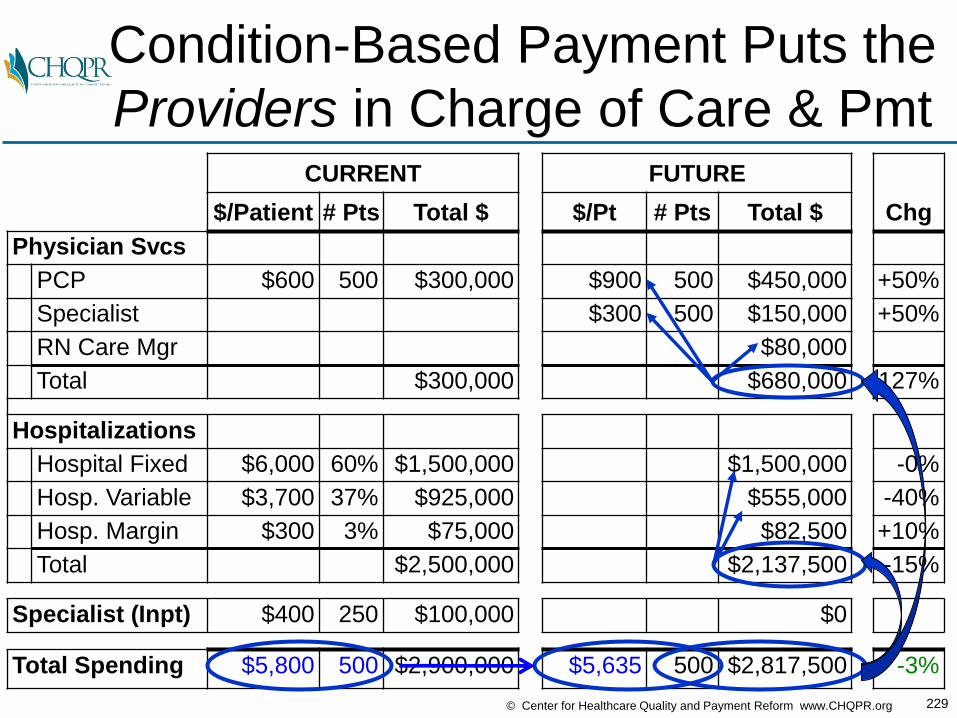
229© Center for Healthcare Quality and Payment Reform www.CHQPR.org
Condition-Based Payment Puts the
Providers in Charge of Care & PmtCURRENT FUTURE
$/Patient # Pts Total $ $/Pt # Pts Total $ Chg
Physician Svcs
PCP $600 500 $300,000 $900 500 $450,000 +50%
Specialist $300 500 $150,000 +50%
RN Care Mgr $80,000
Total $300,000 $680,000 127%
Hospitalizations
Hospital Fixed $6,000 60% $1,500,000 $1,500,000 -0%
Hosp. Variable $3,700 37% $925,000 $555,000 -40%
Hosp. Margin $300 3% $75,000 $82,500 +10%
Total $2,500,000 $2,137,500 -15%
Specialist (Inpt) $400 250 $100,000 $0
Total Spending $5,800 500 $2,900,000 $5,635 500 $2,817,500 -3%
230© Center for Healthcare Quality and Payment Reform www.CHQPR.org
Would “Shared Savings”
Achieve the Same Thing?
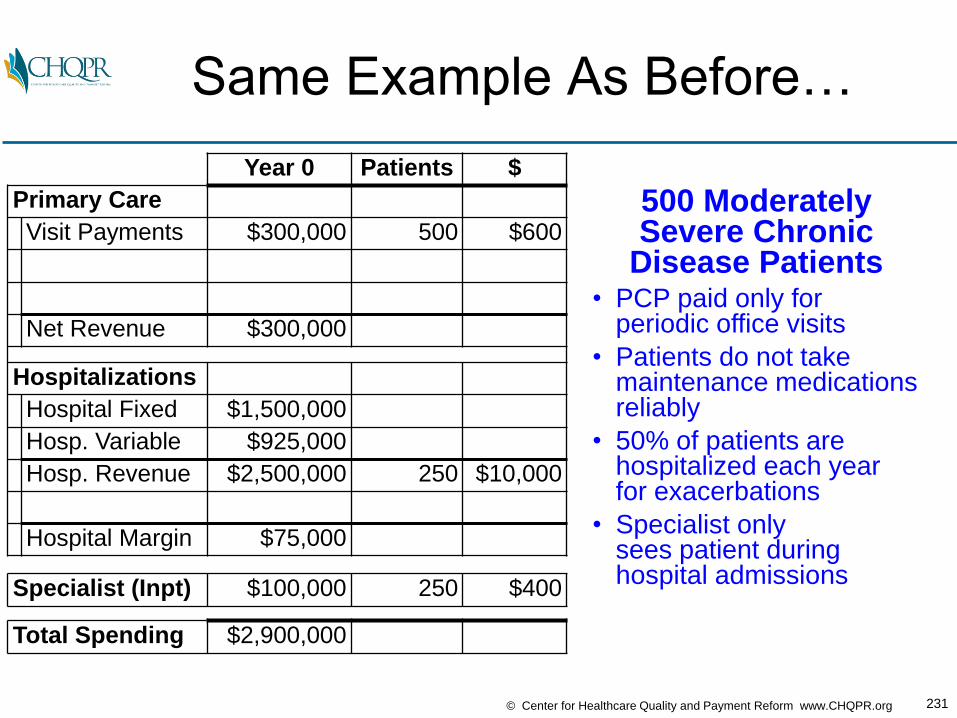
231© Center for Healthcare Quality and Payment Reform www.CHQPR.org
Same Example As Before…
Year 0 Patients $
Primary Care
Visit Payments $300,000 500 $600
Net Revenue $300,000
Hospitalizations
Hospital Fixed $1,500,000
Hosp. Variable $925,000
Hosp. Revenue $2,500,000 250 $10,000
Hospital Margin $75,000
Specialist (Inpt) $100,000 250 $400
Total Spending $2,900,000
500 ModeratelySevere Chronic
Disease Patients• PCP paid only for
periodic office visits
• Patients do not takemaintenance medicationsreliably
• 50% of patients are hospitalized each yearfor exacerbations
• Specialist only sees patient duringhospital admissions

232© Center for Healthcare Quality and Payment Reform www.CHQPR.org
PCPs Hire RNs With No Payment,
Achieve 40% Reduction in AdmitsYear 0 Year 1 Chg
Primary Care
Visit Payments $300,000 $300,000 0%
RN Care Mgr ($80,000)
Net Revenue $300,000
Hospitalizations
Hospital Fixed $1,500,000
Hosp. Variable $925,000
Hosp. Revenue $2,500,000 $1,500,000 -40%
Hospital Margin $75,000
Specialist (Inpt) $100,000
Total Spending $2,900,000

233© Center for Healthcare Quality and Payment Reform www.CHQPR.org
PCPs, Hospitals, Specialists All
Lose Money, Payer Saves MoneyYear 0 Year 1 Chg
Primary Care
Visit Payments $300,000 $300,000 0%
RN Care Mgr ($80,000)
Net Revenue $300,000 $220,000 -27%
Hospitalizations
Hospital Fixed $1,500,000 $1,500,000 -0%
Hosp. Variable $925,000 $555,000 -40%
Hosp. Revenue $2,500,000 $1,500,000 -40%
Hospital Margin $75,000 ($555,000)
Specialist (Inpt) $100,000 $60,000 -40%
Total Spending $2,900,000 $1,860,000 -36%
Payer Savings $1,040,000

234© Center for Healthcare Quality and Payment Reform www.CHQPR.org
No Shared Savings Payment
in Year 1Year 0 Year 1 Chg
Primary Care
Visit Payments $300,000 $300,000 0%
RN Care Mgr ($80,000)
Shared Savings $0
Net Revenue $300,000 $220,000 -27%
Hospitalizations
Hospital Fixed $1,500,000 $1,500,000 -0%
Hosp. Variable $925,000 $555,000 -40%
Hosp. Revenue $2,500,000 $1,500,000 -40%
Shared Savings $0
Hospital Margin $75,000 ($555,000)
Specialist (Inpt) $100,000 $60,000 -40%
Total Spending $2,900,000 $1,860,000 -36%
Payer Savings $1,040,000
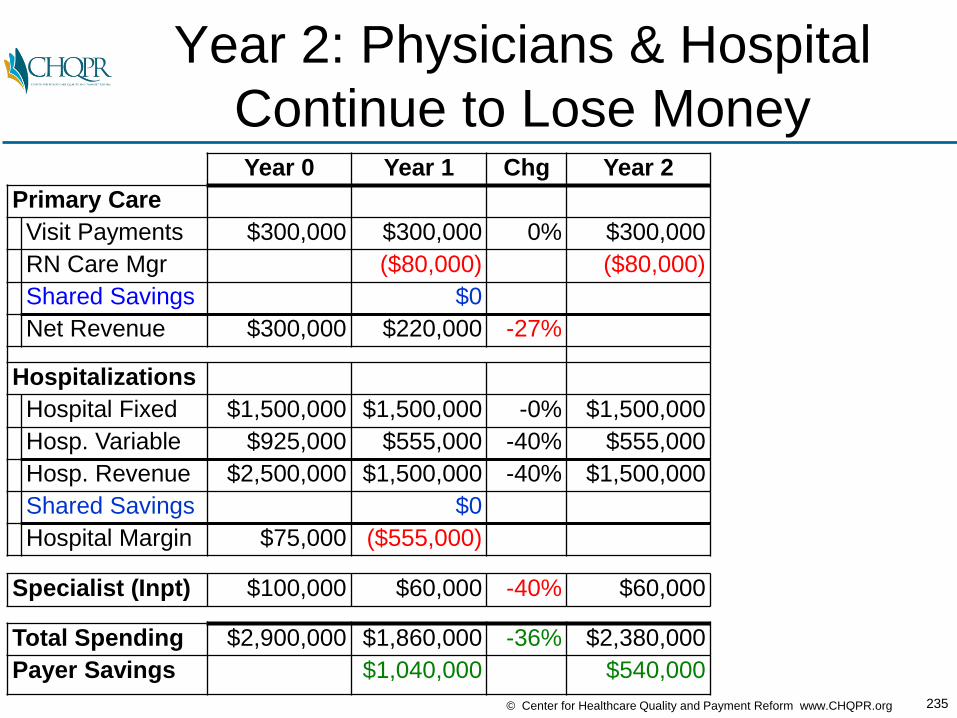
235© Center for Healthcare Quality and Payment Reform www.CHQPR.org
Year 2: Physicians & Hospital
Continue to Lose MoneyYear 0 Year 1 Chg Year 2
Primary Care
Visit Payments $300,000 $300,000 0% $300,000
RN Care Mgr ($80,000) ($80,000)
Shared Savings $0
Net Revenue $300,000 $220,000 -27%
Hospitalizations
Hospital Fixed $1,500,000 $1,500,000 -0% $1,500,000
Hosp. Variable $925,000 $555,000 -40% $555,000
Hosp. Revenue $2,500,000 $1,500,000 -40% $1,500,000
Shared Savings $0
Hospital Margin $75,000 ($555,000)
Specialist (Inpt) $100,000 $60,000 -40% $60,000
Total Spending $2,900,000 $1,860,000 -36% $2,380,000
Payer Savings $1,040,000 $540,000
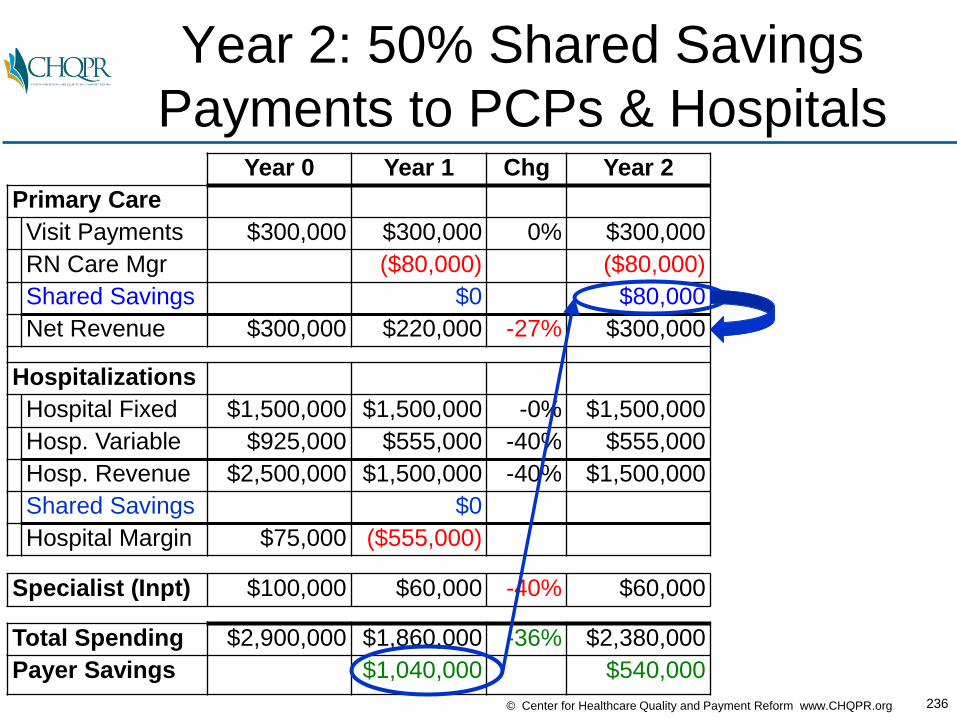
236© Center for Healthcare Quality and Payment Reform www.CHQPR.org
Year 2: 50% Shared Savings
Payments to PCPs & HospitalsYear 0 Year 1 Chg Year 2
Primary Care
Visit Payments $300,000 $300,000 0% $300,000
RN Care Mgr ($80,000) ($80,000)
Shared Savings $0 $80,000
Net Revenue $300,000 $220,000 -27% $300,000
Hospitalizations
Hospital Fixed $1,500,000 $1,500,000 -0% $1,500,000
Hosp. Variable $925,000 $555,000 -40% $555,000
Hosp. Revenue $2,500,000 $1,500,000 -40% $1,500,000
Shared Savings $0
Hospital Margin $75,000 ($555,000)
Specialist (Inpt) $100,000 $60,000 -40% $60,000
Total Spending $2,900,000 $1,860,000 -36% $2,380,000
Payer Savings $1,040,000 $540,000
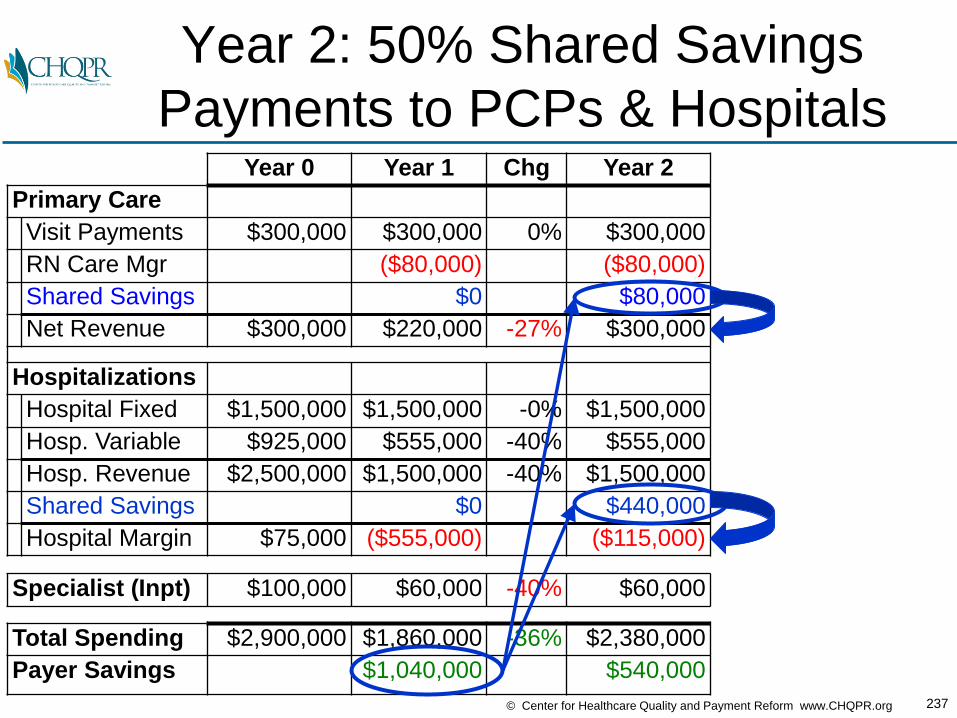
237© Center for Healthcare Quality and Payment Reform www.CHQPR.org
Year 2: 50% Shared Savings
Payments to PCPs & HospitalsYear 0 Year 1 Chg Year 2
Primary Care
Visit Payments $300,000 $300,000 0% $300,000
RN Care Mgr ($80,000) ($80,000)
Shared Savings $0 $80,000
Net Revenue $300,000 $220,000 -27% $300,000
Hospitalizations
Hospital Fixed $1,500,000 $1,500,000 -0% $1,500,000
Hosp. Variable $925,000 $555,000 -40% $555,000
Hosp. Revenue $2,500,000 $1,500,000 -40% $1,500,000
Shared Savings $0 $440,000
Hospital Margin $75,000 ($555,000) ($115,000)
Specialist (Inpt) $100,000 $60,000 -40% $60,000
Total Spending $2,900,000 $1,860,000 -36% $2,380,000
Payer Savings $1,040,000 $540,000

238© Center for Healthcare Quality and Payment Reform www.CHQPR.org
PCP Costs Covered, Hospitals and
Specialists Still LosingYear 0 Year 1 Chg Year 2 Chg
Primary Care
Visit Payments $300,000 $300,000 0% $300,000
RN Care Mgr ($80,000) ($80,000)
Shared Savings $0 $80,000
Net Revenue $300,000 $220,000 -27% $300,000 0%
Hospitalizations
Hospital Fixed $1,500,000 $1,500,000 -0% $1,500,000
Hosp. Variable $925,000 $555,000 -40% $555,000
Hosp. Revenue $2,500,000 $1,500,000 -40% $1,500,000
Shared Savings $0 $440,000
Hospital Margin $75,000 ($555,000) ($115,000)
Specialist (Inpt) $100,000 $60,000 -40% $60,000 -40%
Total Spending $2,900,000 $1,860,000 -36% $2,380,000 -18%
Payer Savings $1,040,000 $540,000

239© Center for Healthcare Quality and Payment Reform www.CHQPR.org
All Physicians and Hospitals
Have Large Cumulative LossesYear 0 Year 1 Chg Year 2 Chg Cumulative
Primary Care
Visit Payments $300,000 $300,000 0% $300,000
RN Care Mgr ($80,000) ($80,000) ($160,000)
Shared Savings $0 $80,000 $80,000
Net Revenue $300,000 $220,000 -27% $300,000 0% ($80,000)
Hospitalizations
Hospital Fixed $1,500,000 $1,500,000 -0% $1,500,000
Hosp. Variable $925,000 $555,000 -40% $555,000
Hosp. Revenue $2,500,000 $1,500,000 -40% $1,500,000
Shared Savings $0 $440,000 $440,000
Hospital Margin $75,000 ($555,000) ($115,000) ($820,000)
Specialist (Inpt) $100,000 $60,000 -40% $60,000 -40% ($80,000)
Total Spending $2,900,000 $1,860,000 -36% $2,380,000 -18%
Payer Savings $1,040,000 $540,000 $1,560,000

240© Center for Healthcare Quality and Payment Reform www.CHQPR.org
It’s Even Worse Than That…
• There is no shared savings payment at all if a minimum total savings level is not reached
• If there is a shared savings payment, it’s reduced if quality thresholds aren’t met, even if the quality measures have nothing to do with where savings occurred
• The shared savings payment ends at the end of the 3-year contract period, even if utilization remains lower, and the payer keeps 100% of the savings in future years
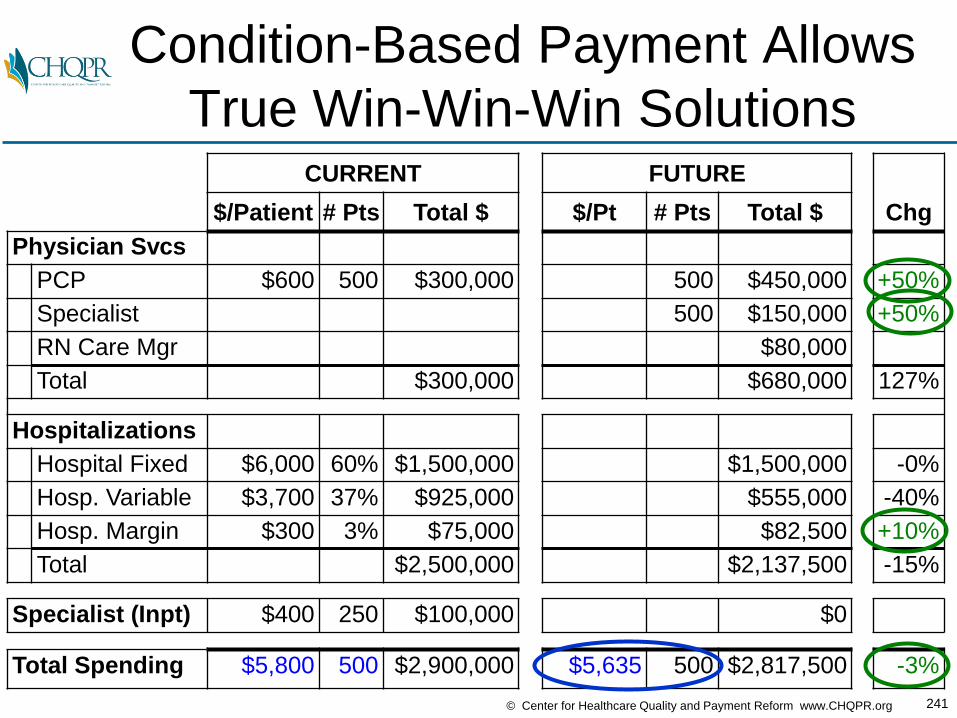
241© Center for Healthcare Quality and Payment Reform www.CHQPR.org
Condition-Based Payment Allows
True Win-Win-Win SolutionsCURRENT FUTURE
$/Patient # Pts Total $ $/Pt # Pts Total $ Chg
Physician Svcs
PCP $600 500 $300,000 500 $450,000 +50%
Specialist 500 $150,000 +50%
RN Care Mgr $80,000
Total $300,000 $680,000 127%
Hospitalizations
Hospital Fixed $6,000 60% $1,500,000 $1,500,000 -0%
Hosp. Variable $3,700 37% $925,000 $555,000 -40%
Hosp. Margin $300 3% $75,000 $82,500 +10%
Total $2,500,000 $2,137,500 -15%
Specialist (Inpt) $400 250 $100,000 $0
Total Spending $5,800 500 $2,900,000 $5,635 500 $2,817,500 -3%
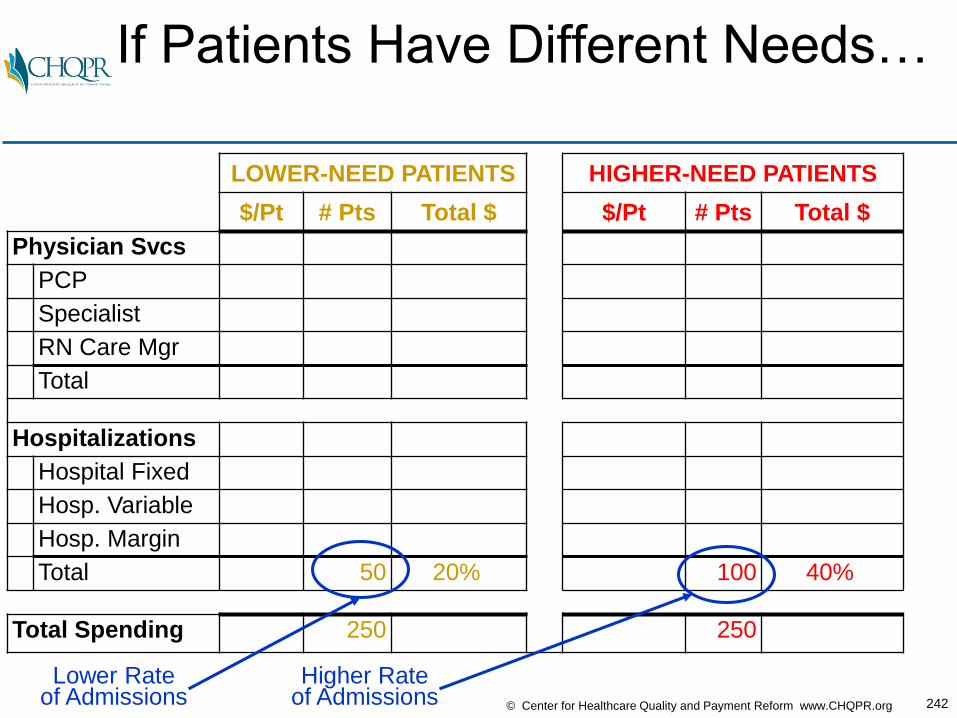
242© Center for Healthcare Quality and Payment Reform www.CHQPR.org
If Patients Have Different Needs…
LOWER-NEED PATIENTS HIGHER-NEED PATIENTS
$/Pt # Pts Total $ $/Pt # Pts Total $
Physician Svcs
PCP
Specialist
RN Care Mgr
Total
Hospitalizations
Hospital Fixed
Hosp. Variable
Hosp. Margin
Total 50 20% 100 40%
Total Spending 250 250
Lower Rateof Admissions
Higher Rateof Admissions

243© Center for Healthcare Quality and Payment Reform www.CHQPR.org
If Patients Have Different Needs…
Risk-Stratify Payments Per PatientPRIMARY CARE HOME SPECIALTY MED. HOME
$/Pt # Pts Total $ $/Pt # Pts Total $
Physician Svcs
PCP $550 250 $137,500 $750 250 $187,500
Specialist $50 250 $12,500 $1050 250 $262,500
RN Care Mgr $20,000 $60,000
Total 250 $170,000 250 $510,000
Hospitalizations
Hospital Fixed $500,000 $1,000,000
Hosp. Variable $3,700 $185,000 $3,700 $370,000
Hosp. Margin $30,000 $52,500
Total 50 $715,000 100 $1,422,500
Total Spending $3,540 250 $885,000 $7,730 250 $1,932,500
Lower PaymentPer Patient
Higher PaymentPer Patient
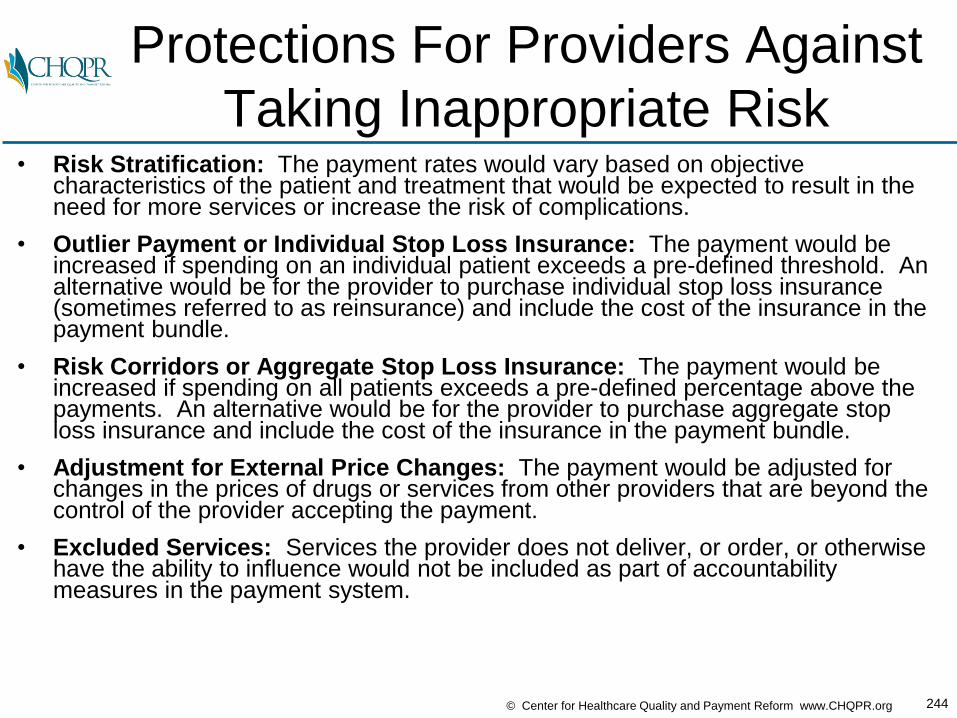
244© Center for Healthcare Quality and Payment Reform www.CHQPR.org
Protections For Providers Against
Taking Inappropriate Risk• Risk Stratification: The payment rates would vary based on objective
characteristics of the patient and treatment that would be expected to result in the need for more services or increase the risk of complications.
• Outlier Payment or Individual Stop Loss Insurance: The payment would be increased if spending on an individual patient exceeds a pre-defined threshold. An alternative would be for the provider to purchase individual stop loss insurance (sometimes referred to as reinsurance) and include the cost of the insurance in the payment bundle.
• Risk Corridors or Aggregate Stop Loss Insurance: The payment would be increased if spending on all patients exceeds a pre-defined percentage above the payments. An alternative would be for the provider to purchase aggregate stop loss insurance and include the cost of the insurance in the payment bundle.
• Adjustment for External Price Changes: The payment would be adjusted for changes in the prices of drugs or services from other providers that are beyond the control of the provider accepting the payment.
• Excluded Services: Services the provider does not deliver, or order, or otherwise have the ability to influence would not be included as part of accountability measures in the payment system.
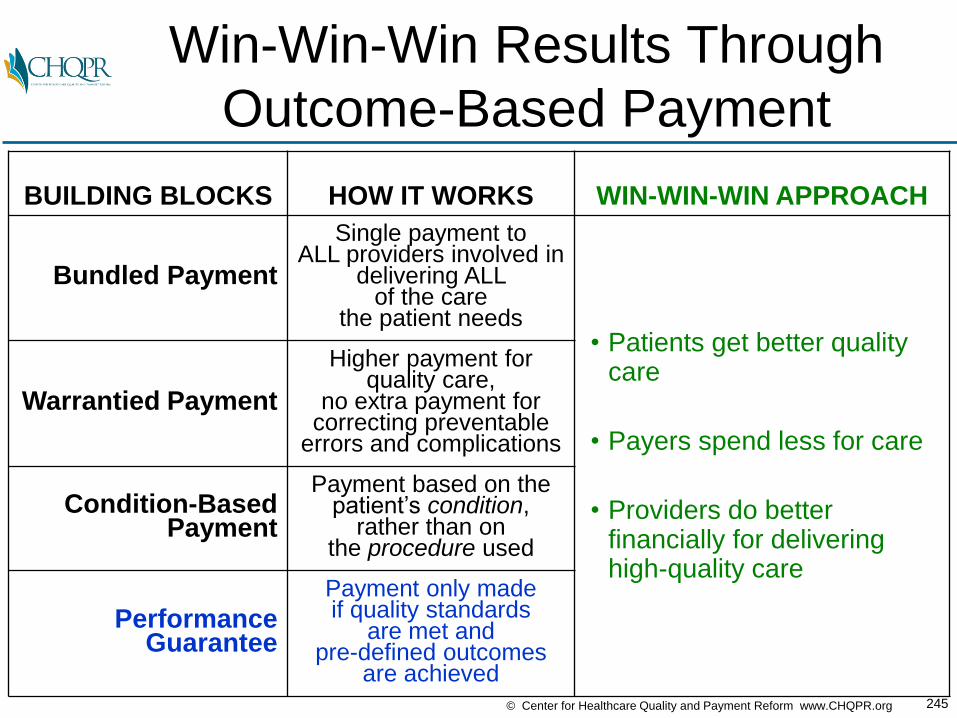
245© Center for Healthcare Quality and Payment Reform www.CHQPR.org
Win-Win-Win Results Through
Outcome-Based Payment
BUILDING BLOCKS HOW IT WORKS WIN-WIN-WIN APPROACH
Bundled Payment
Single payment to ALL providers involved in
delivering ALL of the care
the patient needs• Patients get better quality
care
• Payers spend less for care
• Providers do better financially for delivering high-quality care
Warrantied Payment
Higher payment for quality care,
no extra payment for correcting preventable
errors and complications
Condition-Based Payment
Payment based on the patient’s condition,
rather than on the procedure used
PerformanceGuarantee
Payment only made if quality standards
are met and pre-defined outcomes
are achieved

246© Center for Healthcare Quality and Payment Reform www.CHQPR.org
Hypothetical Procedure Delivered
by a Physician Practice
FFS
# of Patients 100
Payment $2,000
Revenue to Physician $200K

247© Center for Healthcare Quality and Payment Reform www.CHQPR.org
Assume 10% of Procedures
Don’t Meet Quality Standard
FFS
# of Patients 100
# Patients Met Quality Standard 90
# Did Not MeetQuality Standard 10
Payment $2,000
Revenue to Physician $200K

248© Center for Healthcare Quality and Payment Reform www.CHQPR.org
Patients/Payers Pay the Same
If the Standard is Met or Not
FFS
# of Patients 100
# Patients Met Quality Standard 90
# Did Not MeetQuality Standard 10
Payment WhenStandard Met $2,000
Payment When Standard Not Met $2,000
Revenue to Physician $200K

249© Center for Healthcare Quality and Payment Reform www.CHQPR.org
What Happens if
Quality Improves?
FFS FFS
# of Patients 100 100
# Patients Met Quality Standard 90 99
# Did Not MeetQuality Standard 10 1
Payment WhenStandard Met $2,000 $2,000
Payment When Standard Not Met $2,000 $2,000
Revenue to Physician $200K $200K
% Change 0%
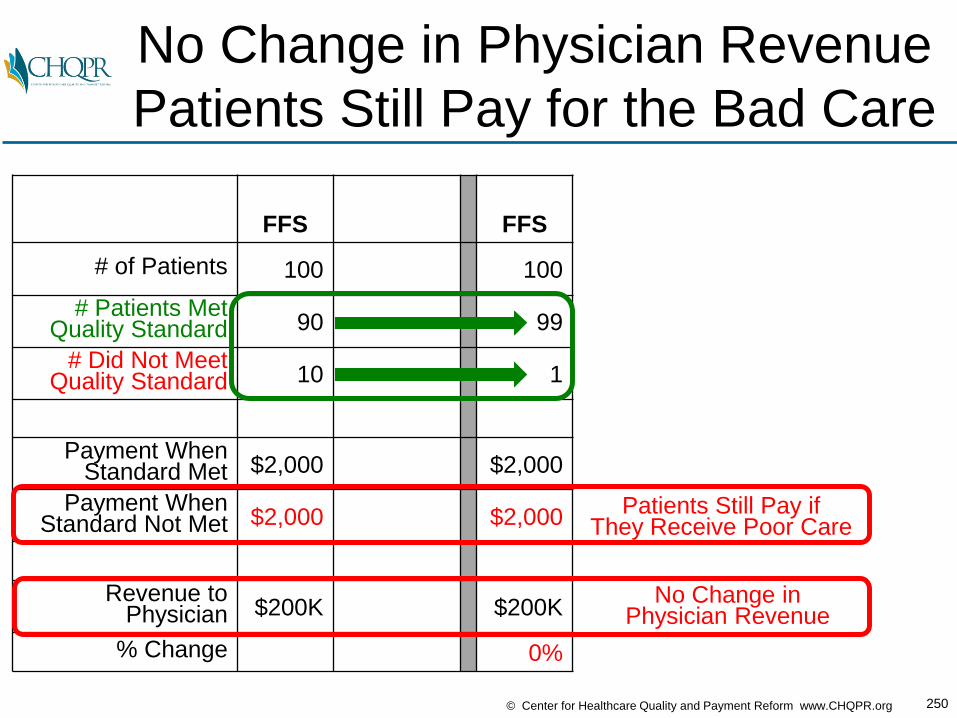
250© Center for Healthcare Quality and Payment Reform www.CHQPR.org
No Change in Physician Revenue
Patients Still Pay for the Bad Care
FFS FFS
# of Patients 100 100
# Patients Met Quality Standard 90 99
# Did Not MeetQuality Standard 10 1
Payment WhenStandard Met $2,000 $2,000
Payment When Standard Not Met $2,000 $2,000
Revenue to Physician $200K $200K
% Change 0%
No Change inPhysician Revenue
Patients Still Pay ifThey Receive Poor Care
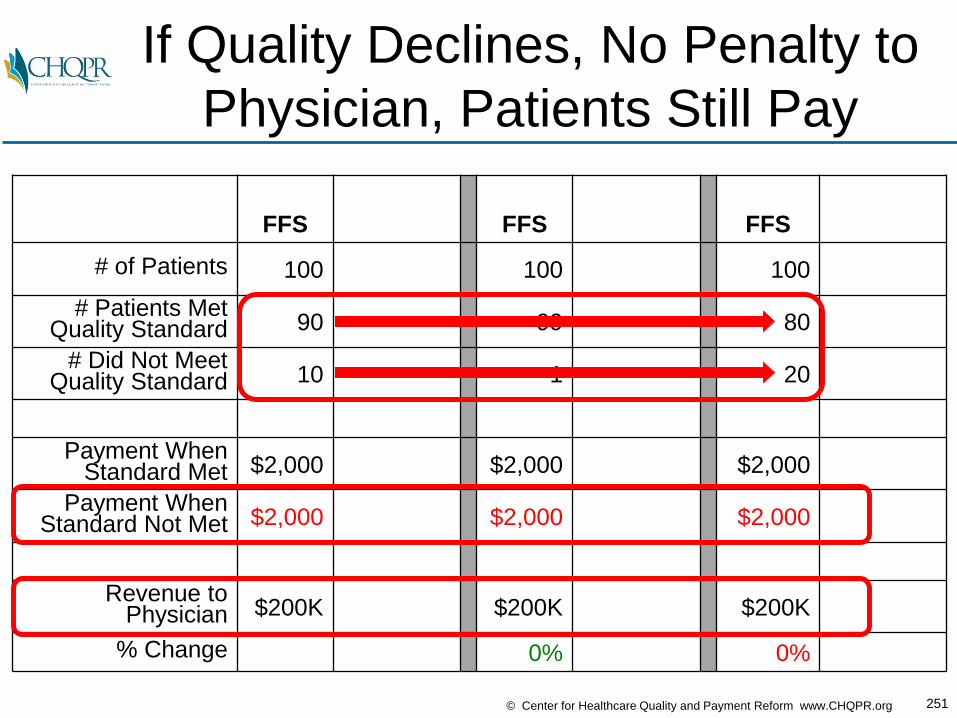
251© Center for Healthcare Quality and Payment Reform www.CHQPR.org
If Quality Declines, No Penalty to
Physician, Patients Still Pay
FFS FFS FFS
# of Patients 100 100 100
# Patients Met Quality Standard 90 99 80
# Did Not MeetQuality Standard 10 1 20
Payment WhenStandard Met $2,000 $2,000 $2,000
Payment When Standard Not Met $2,000 $2,000 $2,000
Revenue to Physician $200K $200K $200K
% Change 0% 0%

252© Center for Healthcare Quality and Payment Reform www.CHQPR.org
P4P Creates Rewards/Penalties
for Physician, But Not for Patients
FFS
FFS+
P4P
FFS+
P4P
# of Patients 100 100 100
# Patients Met Quality Standard 90 99 80
# Did Not MeetQuality Standard 10 1 20
Payment WhenStandard Met $2,000 $2,100 +5% $1,900 -5%
Payment When Standard Not Met $2,000 $2,100 +5% $1,900 -5%
Revenue to Physician $200K $210K $190K
% Change +5% -5%
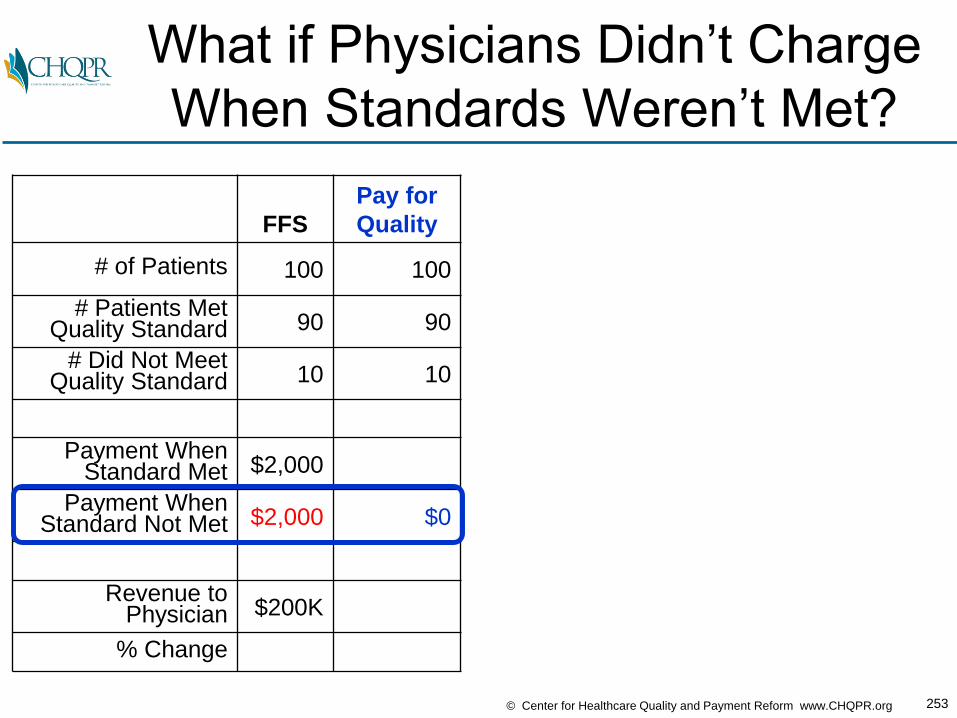
253© Center for Healthcare Quality and Payment Reform www.CHQPR.org
What if Physicians Didn’t Charge
When Standards Weren’t Met?
FFS
Pay for
Quality
# of Patients 100 100
# Patients Met Quality Standard 90 90
# Did Not MeetQuality Standard 10 10
Payment WhenStandard Met $2,000
Payment When Standard Not Met $2,000 $0
Revenue to Physician $200K
% Change

254© Center for Healthcare Quality and Payment Reform www.CHQPR.org
They’d Need to Charge More for
Good Quality Care
FFS
Pay for
Quality
# of Patients 100 100
# Patients Met Quality Standard 90 90
# Did Not MeetQuality Standard 10 10
Payment WhenStandard Met $2,000 $2,222
Payment When Standard Not Met $2,000 $0
Revenue to Physician $200K $200K
% Change
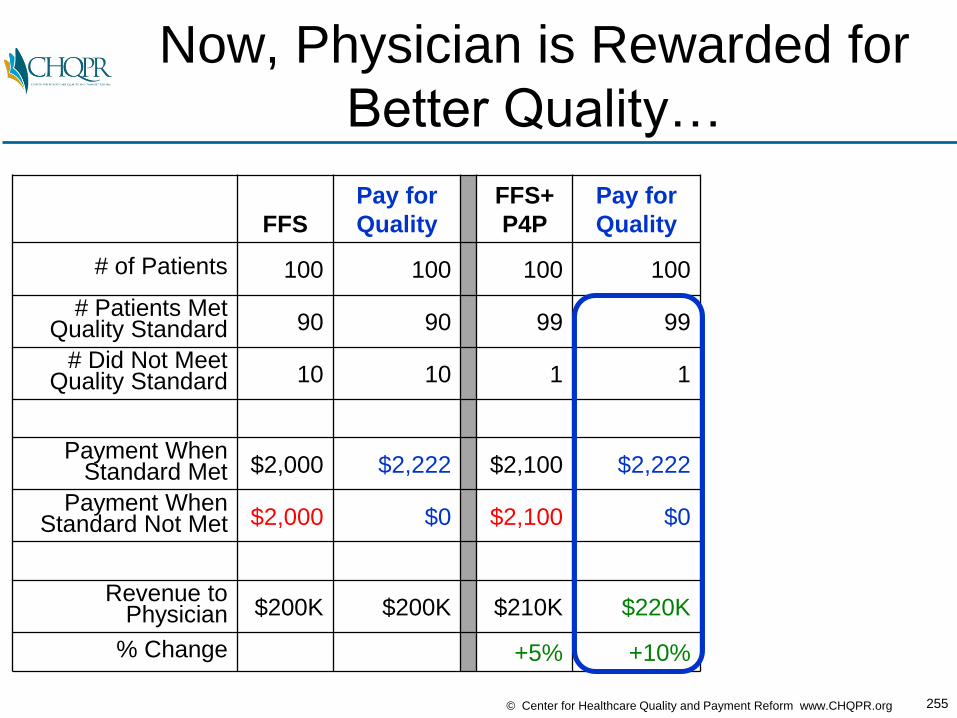
255© Center for Healthcare Quality and Payment Reform www.CHQPR.org
Now, Physician is Rewarded for
Better Quality…
FFS
Pay for
Quality
FFS+
P4P
Pay for
Quality
# of Patients 100 100 100 100
# Patients Met Quality Standard 90 90 99 99
# Did Not MeetQuality Standard 10 10 1 1
Payment WhenStandard Met $2,000 $2,222 $2,100 $2,222
Payment When Standard Not Met $2,000 $0 $2,100 $0
Revenue to Physician $200K $200K $210K $220K
% Change +5% +10%

256© Center for Healthcare Quality and Payment Reform www.CHQPR.org
…and Penalized for Poor Quality
& Patient Doesn’t Pay for Bad Care
FFS
Pay for
Quality
FFS+
P4P
Pay for
Quality
FFS+
P4P
Pay for
Quality
# of Patients 100 100 100 100 100 100
# Patients Met Quality Standard 90 90 99 99 80 80
# Did Not MeetQuality Standard 10 10 1 1 20 20
Payment WhenStandard Met $2,000 $2,222 $2,100 $2,222 $1,900 $2,222
Payment When Standard Not Met $2,000 $0 $2,100 $0 $1,900 $0
Revenue to Physician $200K $200K $210K $220K $190K $178K
% Change +5% +10% -5% -11%

257© Center for Healthcare Quality and Payment Reform www.CHQPR.org
4 Building Blocks of APMs Allow
Patient-Centered Payment
BUILDING BLOCKS HOW IT WORKS WIN-WIN-WIN APPROACH
Bundled Payment
Single payment to ALL providers involved in
delivering ALL of the care
the patient needs• Patients get better quality
care
• Payers spend less for care
• Providers do better financially for delivering high-quality care
Warrantied Payment
Higher payment for quality care,
no extra payment for correcting preventable
errors and complications
Condition-Based Payment
Payment based on the patient’s condition,
rather than on the procedure used
PerformanceGuarantee
Payment only made if quality standards
are met and pre-defined outcomes
are achieved
What Does a
Patient-Centered
Payment & Delivery System
Look Like If
All Physicians Were
Participating?

259© Center for Healthcare Quality and Payment Reform www.CHQPR.org
PATIENT
PreventiveServices
Management
PreventiveServices
Patient-Centered Care:
Provide Preventive Services
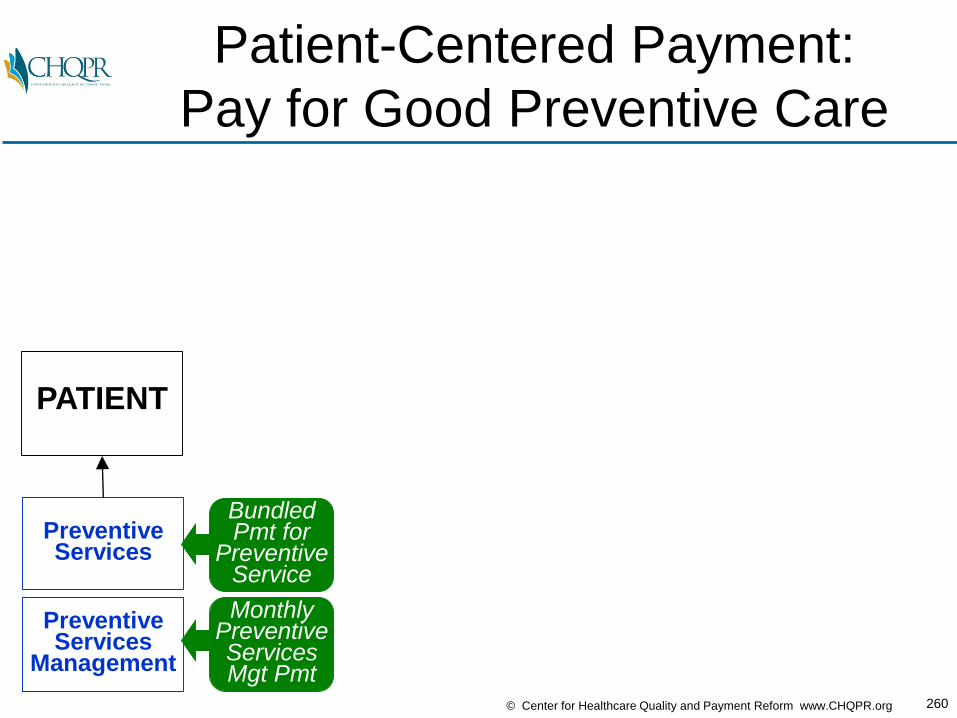
260© Center for Healthcare Quality and Payment Reform www.CHQPR.org
PATIENT
PreventiveServices
Management
PreventiveServices
BundledPmt for
Preventive Service
MonthlyPreventiveServicesMgt Pmt
Patient-Centered Payment:
Pay for Good Preventive Care

261© Center for Healthcare Quality and Payment Reform www.CHQPR.org
PATIENT
PreventiveServices
Management
PreventiveServices
Diagnosis&
TreatmentPlanning
Symptoms
Patient-Centered Care:
Accurately Diagnose Problems
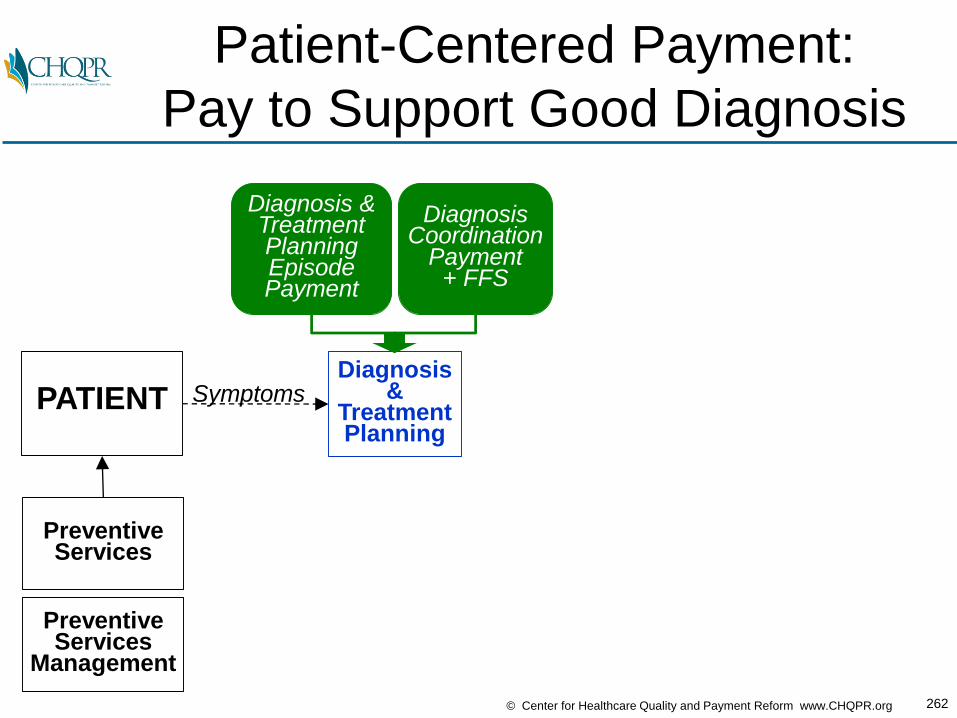
262© Center for Healthcare Quality and Payment Reform www.CHQPR.org
PATIENT
PreventiveServices
Management
PreventiveServices
Diagnosis&
TreatmentPlanning
Symptoms
Diagnosis & TreatmentPlanningEpisodePayment
DiagnosisCoordination
Payment + FFS
Patient-Centered Payment:
Pay to Support Good Diagnosis

263© Center for Healthcare Quality and Payment Reform www.CHQPR.org
PATIENT
PreventiveServices
Management
PreventiveServices
Diagnosis&
TreatmentPlanning
AcuteConditionTreatment
Symptoms
Patient-Centered Care:
Treat Acute Conditions Effectively
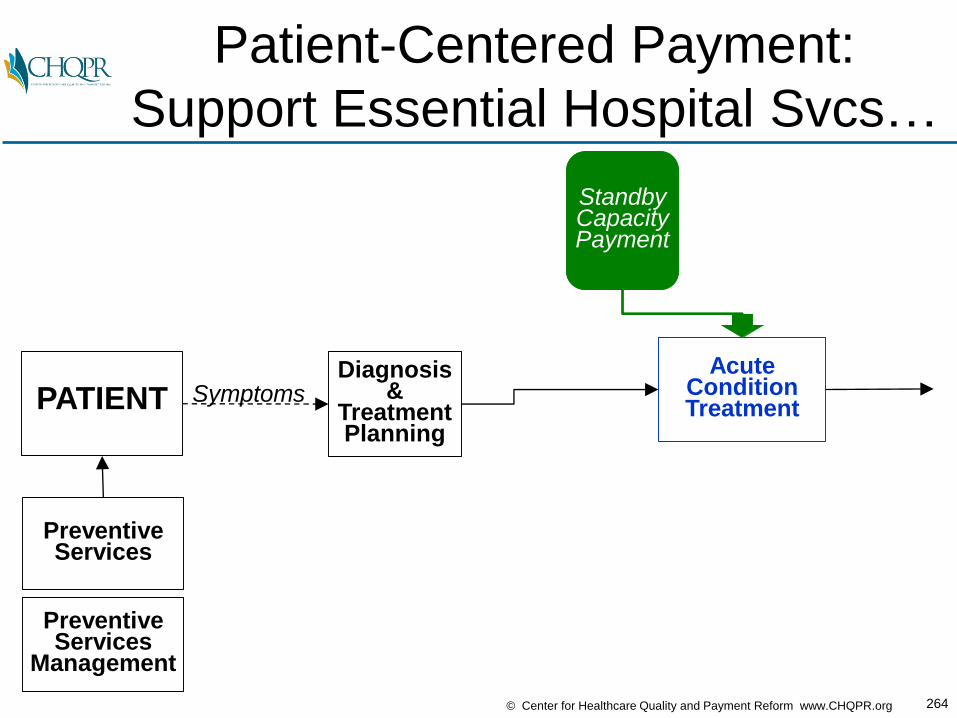
264© Center for Healthcare Quality and Payment Reform www.CHQPR.org
PATIENT
PreventiveServices
Management
PreventiveServices
Diagnosis&
TreatmentPlanning
AcuteConditionTreatment
Symptoms
StandbyCapacityPayment
Patient-Centered Payment:
Support Essential Hospital Svcs…

265© Center for Healthcare Quality and Payment Reform www.CHQPR.org
PATIENT
PreventiveServices
Management
PreventiveServices
Diagnosis&
TreatmentPlanning
AcuteConditionTreatment
Symptoms
AcuteCondition
Coord.TreatmentPayment
+FFS
AcuteConditionEpisodePayment
StandbyCapacityPayment
Patient-Centered Payment:
Pay for Full Bundles of Treatment
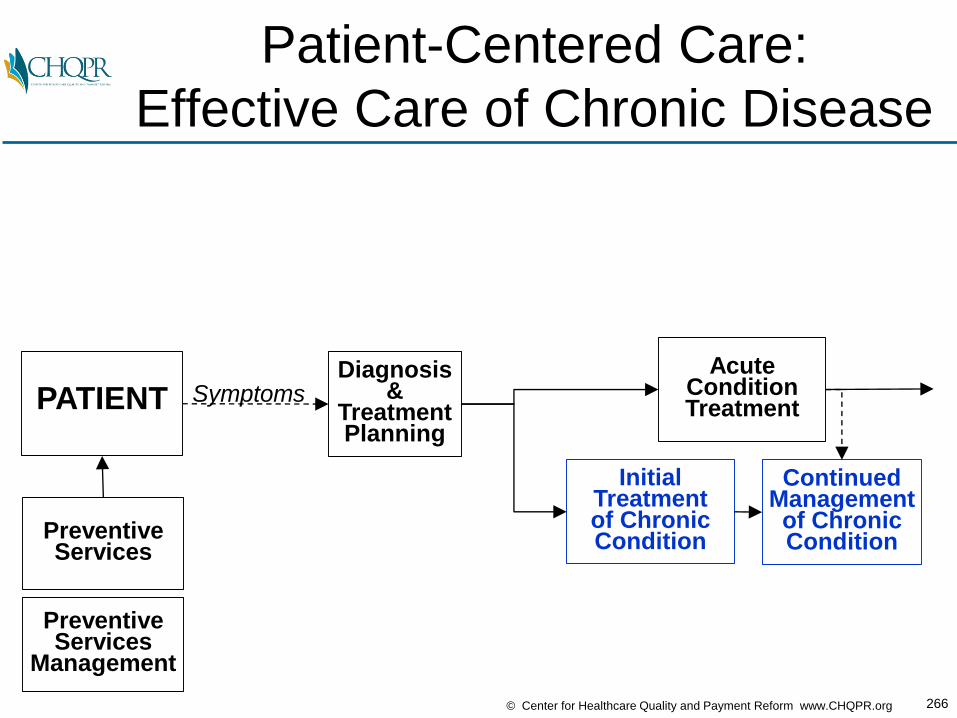
266© Center for Healthcare Quality and Payment Reform www.CHQPR.org
PATIENT
PreventiveServices
Management
PreventiveServices
Diagnosis&
TreatmentPlanning
AcuteConditionTreatment
InitialTreatmentof ChronicCondition
ContinuedManagementof ChronicCondition
Symptoms
Patient-Centered Care:
Effective Care of Chronic Disease
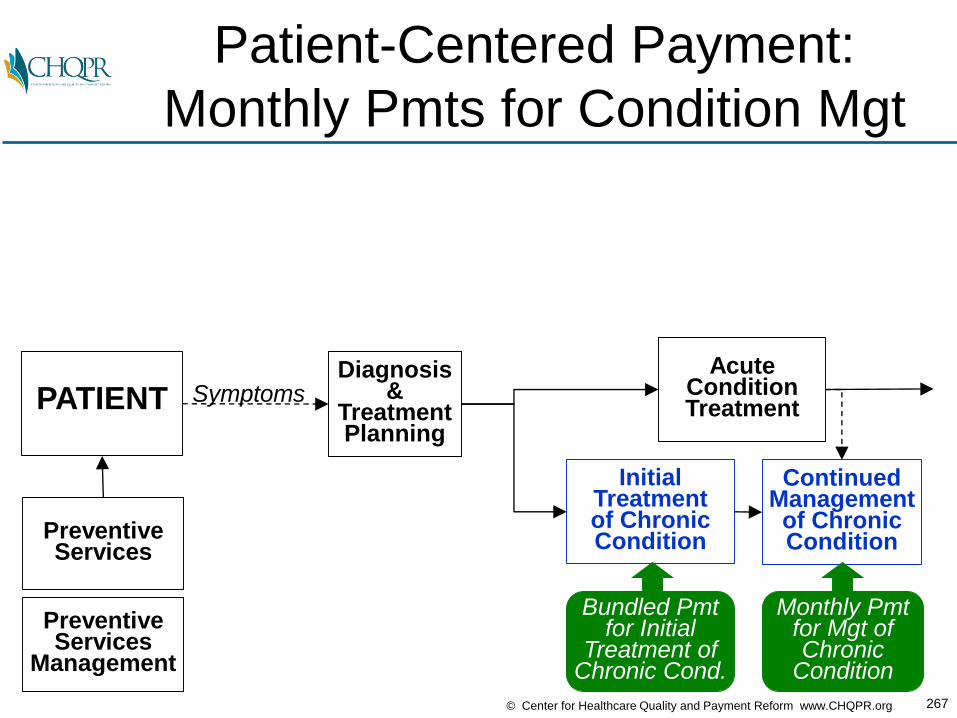
267© Center for Healthcare Quality and Payment Reform www.CHQPR.org
PATIENT
PreventiveServices
Management
PreventiveServices
Diagnosis&
TreatmentPlanning
AcuteConditionTreatment
InitialTreatmentof ChronicCondition
ContinuedManagementof ChronicCondition
Symptoms
Bundled Pmtfor Initial
Treatment ofChronic Cond.
Monthly Pmtfor Mgt of Chronic
Condition
Patient-Centered Payment:
Monthly Pmts for Condition Mgt

268© Center for Healthcare Quality and Payment Reform www.CHQPR.org
PATIENT
PreventiveServices
Management
PreventiveServices
Diagnosis&
TreatmentPlanning
AcuteConditionTreatment
InitialTreatmentof ChronicCondition
ContinuedManagementof ChronicCondition
Symptoms
BundledPmt for
Preventive Service
MonthlyPreventiveServicesMgt Pmt
Diagnosis & TreatmentPlanningEpisodePayment
AcuteCondition
Coord.TreatmentPayment
+FFS
AcuteConditionEpisodePayment
StandbyCapacityPayment
DiagnosisCoordination
Payment + FFS
Bundled Pmtfor Initial
Treatment ofChronic Cond.
Monthly Pmtfor Mgt of Chronic
Condition
Patient-Centered Payment to
Support Patient-Centered Care

269© Center for Healthcare Quality and Payment Reform www.CHQPR.org
For More Details on
Patient-Centered Payment:
www.PaymentReform.org
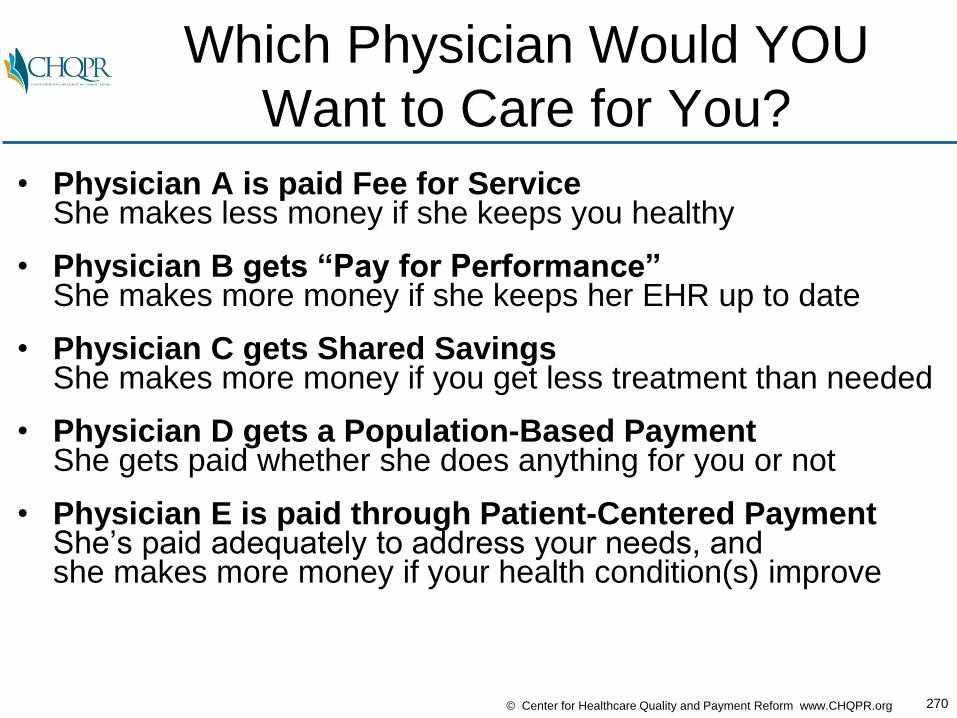
270© Center for Healthcare Quality and Payment Reform www.CHQPR.org
Which Physician Would YOU
Want to Care for You?
• Physician A is paid Fee for ServiceShe makes less money if she keeps you healthy
• Physician B gets “Pay for Performance” She makes more money if she keeps her EHR up to date
• Physician C gets Shared Savings She makes more money if you get less treatment than needed
• Physician D gets a Population-Based PaymentShe gets paid whether she does anything for you or not
• Physician E is paid through Patient-Centered PaymentShe’s paid adequately to address your needs, andshe makes more money if your health condition(s) improve
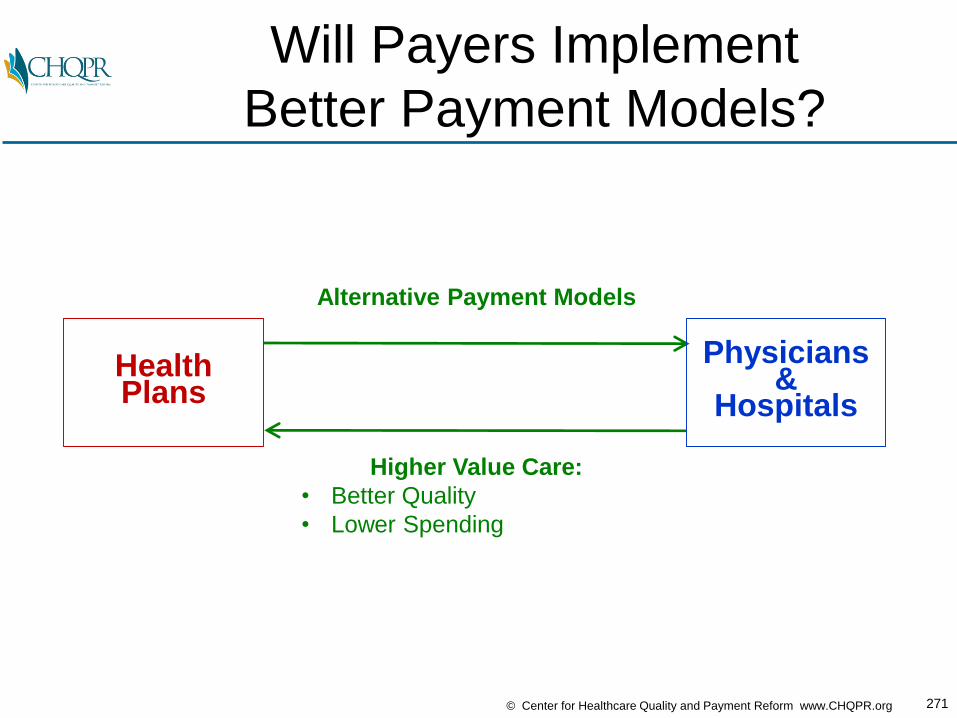
271© Center for Healthcare Quality and Payment Reform www.CHQPR.org
Will Payers Implement
Better Payment Models?
HealthPlans
Alternative Payment Models
Higher Value Care:
• Better Quality
• Lower Spending
Physicians&
Hospitals
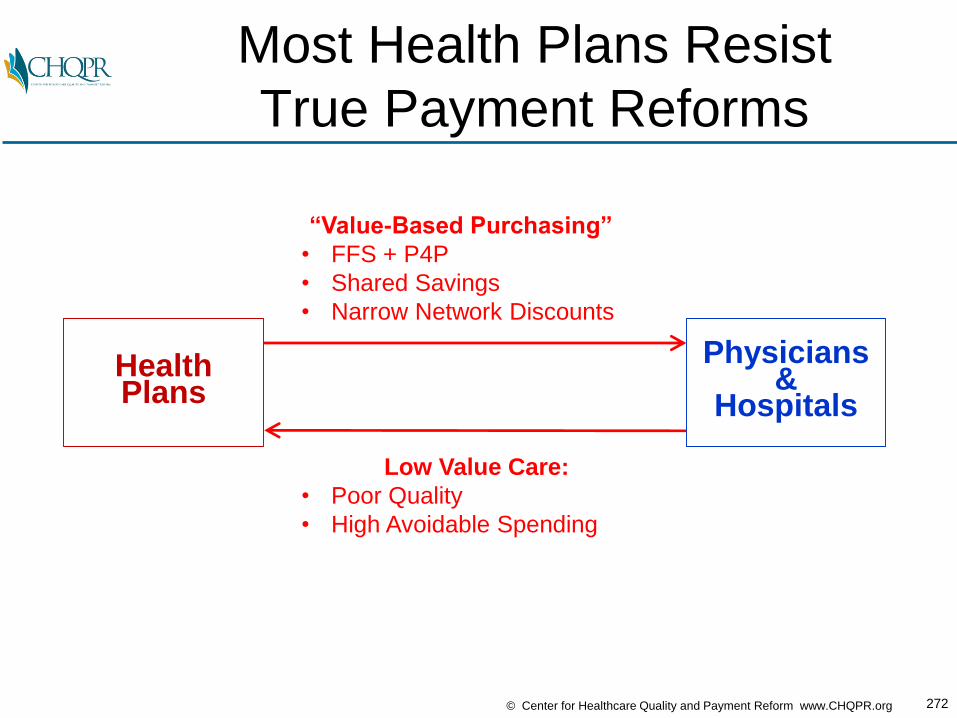
272© Center for Healthcare Quality and Payment Reform www.CHQPR.org
Most Health Plans Resist
True Payment Reforms
HealthPlans
“Value-Based Purchasing”
• FFS + P4P
• Shared Savings
• Narrow Network Discounts
Low Value Care:
• Poor Quality
• High Avoidable Spending
Physicians&
Hospitals

273© Center for Healthcare Quality and Payment Reform www.CHQPR.org
For Most Workers, Employers are
the Insurer, Not a Health Plan
Source:
Employer
Health
Benefits
2012 Annual
Survey.
The Kaiser
Family
Foundation
and Health
Research
and
Educational
Trust
60% of Workers Are Now in Self-Insured Plans

274© Center for Healthcare Quality and Payment Reform www.CHQPR.org
For Self-Funded Employers, The
Health Plan is Just a Pass Through
Self-Funded
Purchasers
ASOHealth Plan(No Risk)
Provider Claims
Purchaser Payment
Physicians&
Hospitals
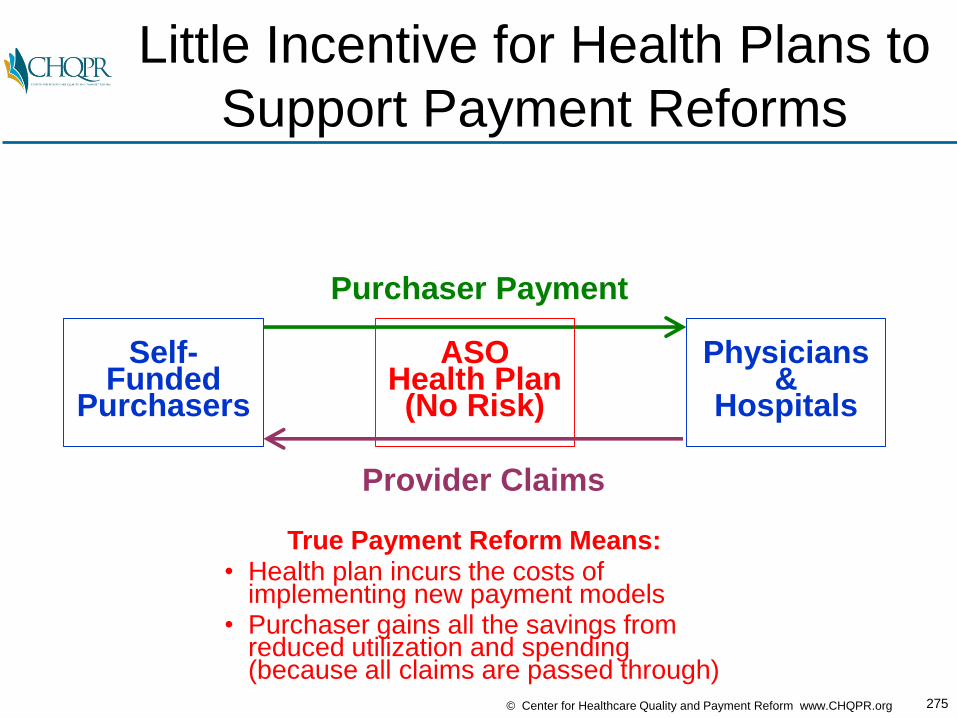
275© Center for Healthcare Quality and Payment Reform www.CHQPR.org
Little Incentive for Health Plans to
Support Payment Reforms
True Payment Reform Means:• Health plan incurs the costs of
implementing new payment models• Purchaser gains all the savings from
reduced utilization and spending(because all claims are passed through)
Self-Funded
Purchasers
ASOHealth Plan(No Risk)
Provider Claims
Purchaser Payment
Physicians&
Hospitals

276© Center for Healthcare Quality and Payment Reform www.CHQPR.org
A Better Approach:
Purchaser/Provider Partnerships
Self-Funded
Purchasers
ProvidersWilling to Manage
Cost/Quality
Better Payment and Benefit Structure
Lower Cost, Higher Quality Care
Provider “wins” if:• Patients stay healthy
and need less care• Purchaser pays
provider adequately tomanage care effectively
Purchasers and Patients “win” if:
• Providers reduce purchasers’ costs
• Patients stay healthy and have lower cost-sharing

277© Center for Healthcare Quality and Payment Reform www.CHQPR.org
Purchasers (Not Plans) Can Pay
for Improved Worker Productivity
Self-Funded
Purchasers
ProvidersWilling to Manage
Cost/Quality
Better Payment and Benefit Structure
Lower Cost, Higher Quality Care
Provider “wins” if:• Patients stay healthy
and need less care• Purchaser pays
provider adequately tomanage care effectively and deliver services efficiently
Purchasers and Patients “win” if:
• Providers reduce purchasers’ costs
• Patients stay healthy and have lower cost-sharing
• Patients return to work faster
WORKERPRODUCTIVITY
EFFICIENCYOF SERVICES
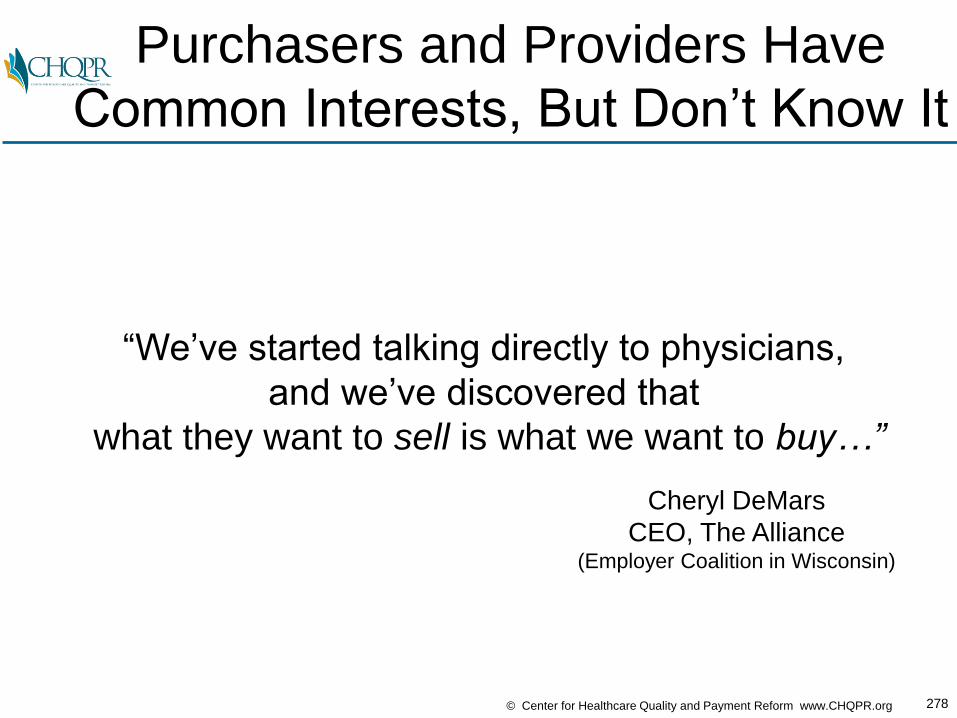
278© Center for Healthcare Quality and Payment Reform www.CHQPR.org
Purchasers and Providers Have
Common Interests, But Don’t Know It
“We’ve started talking directly to physicians,
and we’ve discovered that
what they want to sell is what we want to buy…”
Cheryl DeMars
CEO, The Alliance(Employer Coalition in Wisconsin)

279© Center for Healthcare Quality and Payment Reform www.CHQPR.org
Purchasers Have
Total Risk Today
Self-FundedPurchasers,Medicare,Medicaid
TOTAL
COST OF
HEALTH CARE

280© Center for Healthcare Quality and Payment Reform www.CHQPR.org
The Goal Should Not Be
to Shift Total Risk to Providers
Self-FundedPurchasers,Medicare,Medicaid
TOTAL
COST OF
HEALTH CARE
TOTAL
COST OF
HEALTH CARE
Physicians&
Hospitals
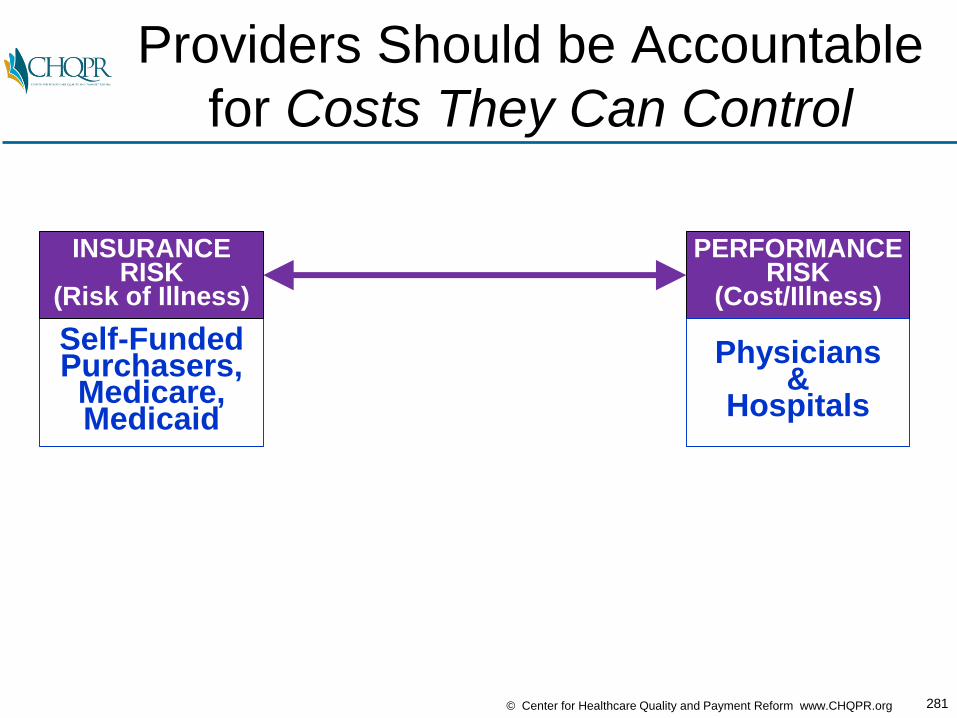
281© Center for Healthcare Quality and Payment Reform www.CHQPR.org
Providers Should be Accountable
for Costs They Can Control
Self-FundedPurchasers,Medicare,Medicaid
INSURANCERISK
(Risk of Illness)
PERFORMANCERISK
(Cost/Illness)
Physicians&
Hospitals
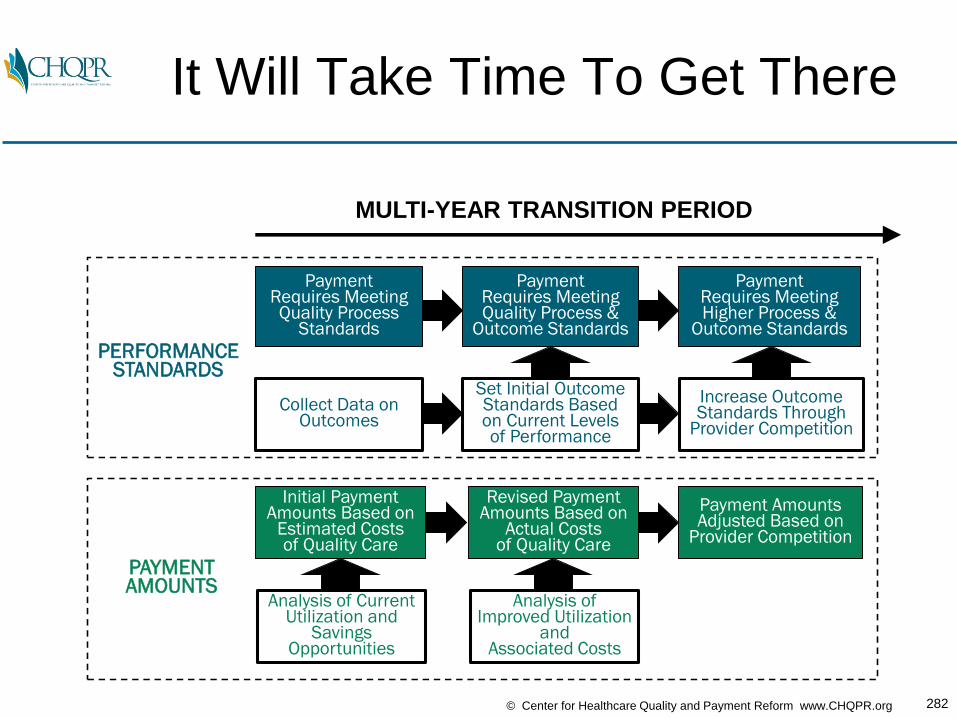
282© Center for Healthcare Quality and Payment Reform www.CHQPR.org
Payment Requires Meeting Quality Process
Standards
Collect Data onOutcomes
Payment Requires Meeting Quality Process &
Outcome Standards
Set Initial Outcome Standards Basedon Current Levelsof Performance
Increase Outcome Standards Through
Provider Competition
Payment Requires Meeting Higher Process &
Outcome Standards
Initial Payment Amounts Based on
Estimated Costs of Quality Care
Analysis of Current Utilization and
Savings Opportunities
Payment Amounts Adjusted Based on
Provider Competition
Revised Payment Amounts Based on
Actual Costs of Quality Care
Analysis of Improved Utilization
andAssociated Costs
MULTI-YEAR TRANSITION PERIOD
PERFORMANCESTANDARDS
PAYMENTAMOUNTS
It Will Take Time To Get There
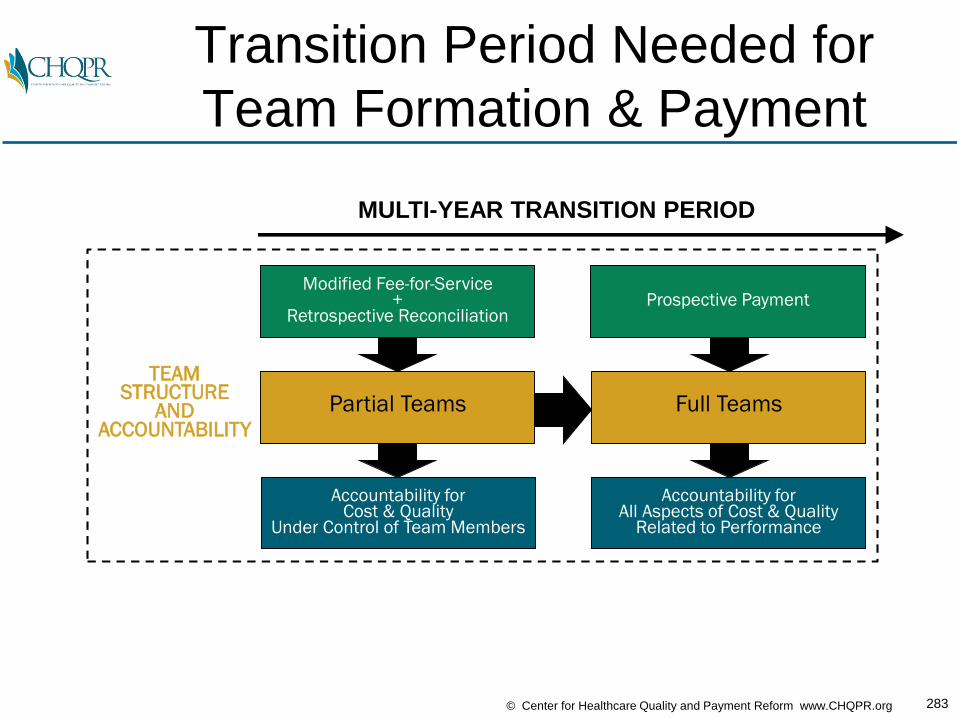
283© Center for Healthcare Quality and Payment Reform www.CHQPR.org
MULTI-YEAR TRANSITION PERIOD
TEAMSTRUCTURE
ANDACCOUNTABILITY
Modified Fee-for-Service +
Retrospective Reconciliation
Partial Teams
Accountability forCost & Quality
Under Control of Team Members
Prospective Payment
Full Teams
Accountability forAll Aspects of Cost & Quality
Related to Performance
Transition Period Needed for
Team Formation & Payment

284© Center for Healthcare Quality and Payment Reform www.CHQPR.org
Three Paths to the Future: Which
Will Gastroenterologists Choose?
PAYER-DESIGNED ALTERNATIVE
PAYMENT MODELS
MERIT-BASED INCENTIVEPAYMENT SYSTEM
(MIPS)
PHYSICIAN-FOCUSED,PATIENT-CENTEREDPAYMENT MODELS
MACRA
#1
#2
#3
285© Center for Healthcare Quality and Payment Reform www.CHQPR.org
If You Don’t Like Doors 1 & 2,
What Should You Do?

286© Center for Healthcare Quality and Payment Reform www.CHQPR.org
If You Don’t Like Doors 1 & 2,
What Should You Do?
1. Listen to the PowerPoint presentations today, go back home, continue business as usual, and hope somebody else figures this out

287© Center for Healthcare Quality and Payment Reform www.CHQPR.org
If You Don’t Like Doors 1 & 2,
What Should You Do?
1. Listen to the PowerPoint presentations today, go back home, continue business as usual, and hope somebody else figures this out
2. Plan to retire before 2019
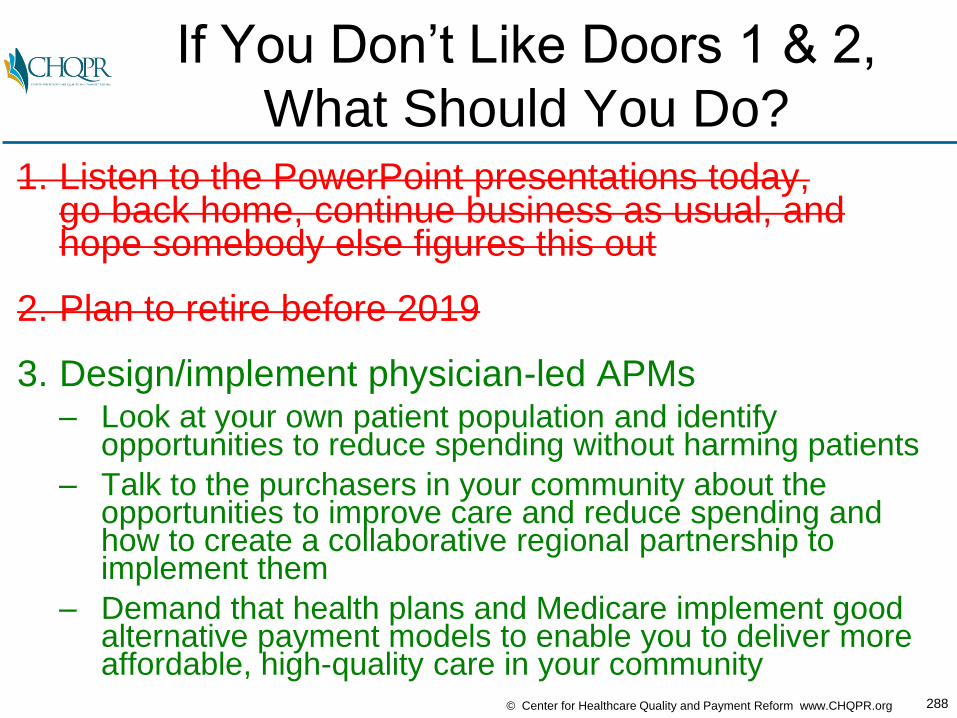
288© Center for Healthcare Quality and Payment Reform www.CHQPR.org
If You Don’t Like Doors 1 & 2,
What Should You Do?
1. Listen to the PowerPoint presentations today, go back home, continue business as usual, and hope somebody else figures this out
2. Plan to retire before 2019
3. Design/implement physician-led APMs– Look at your own patient population and identify
opportunities to reduce spending without harming patients
– Talk to the purchasers in your community about the opportunities to improve care and reduce spending and how to create a collaborative regional partnership to implement them
– Demand that health plans and Medicare implement good alternative payment models to enable you to deliver more affordable, high-quality care in your community
For More Information:
Harold D. MillerPresident and CEO
Center for Healthcare Quality and Payment Reform
(412) 803-3650
www.CHQPR.org
www.PaymentReform.org

APPENDIX

How Do You
Control the Price of Care?
(Under Any Payment Model)

292© Center for Healthcare Quality and Payment Reform www.CHQPR.org
Traveling
from Boston to ClevelandBoston Cleveland
?
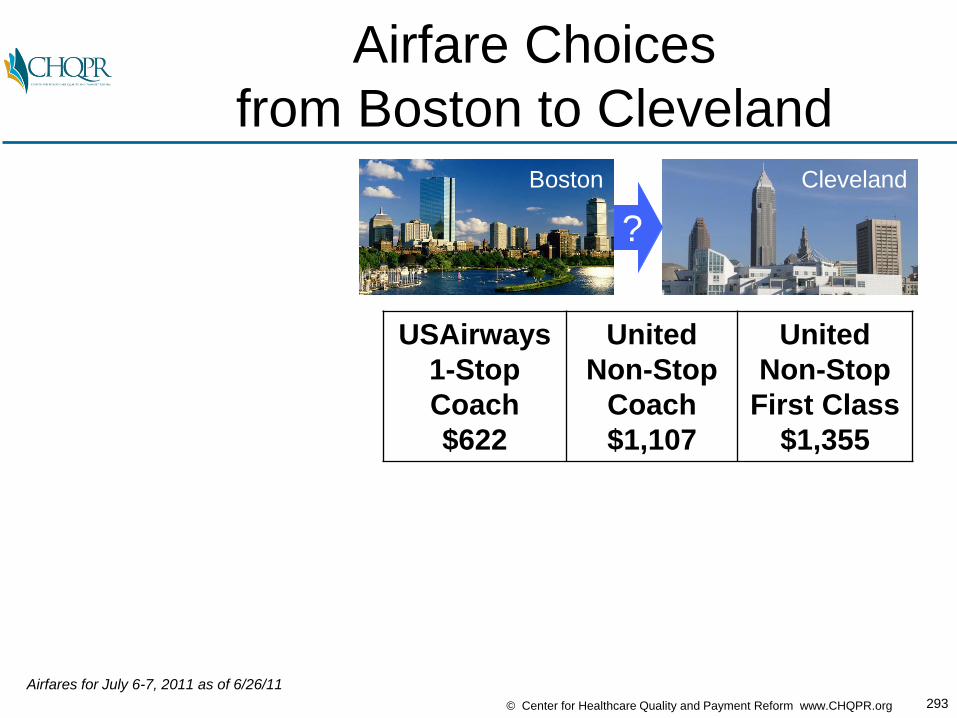
293© Center for Healthcare Quality and Payment Reform www.CHQPR.org
Airfare Choices
from Boston to ClevelandBoston Cleveland
?
USAirways
1-Stop
Coach
$622
United
Non-Stop
Coach
$1,107
United
Non-Stop
First Class
$1,355
Airfares for July 6-7, 2011 as of 6/26/11
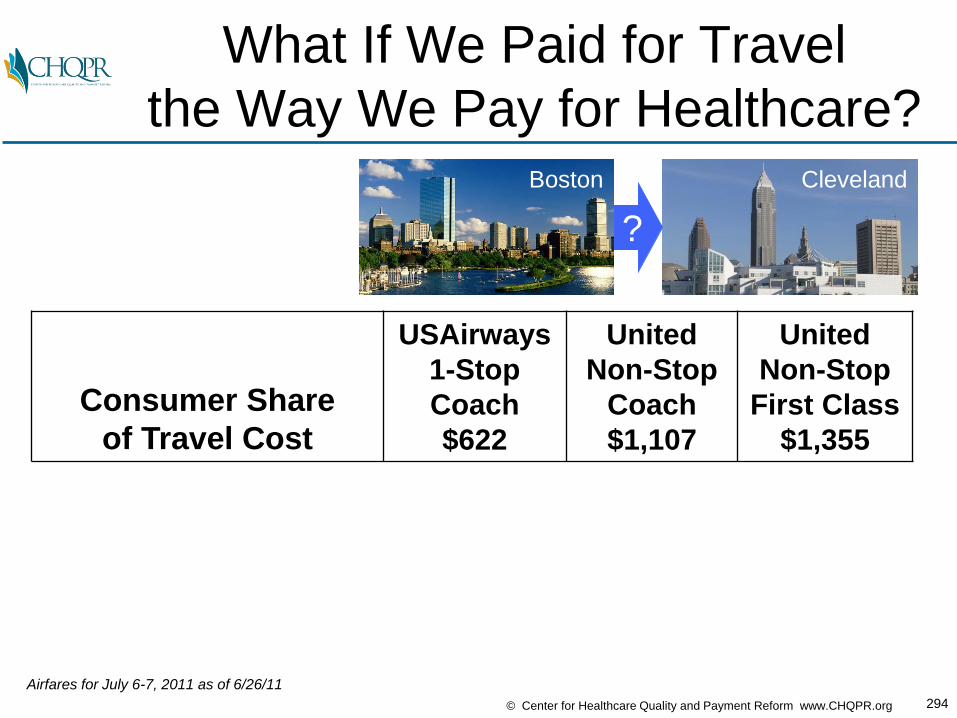
294© Center for Healthcare Quality and Payment Reform www.CHQPR.org
What If We Paid for Travel
the Way We Pay for Healthcare?Boston Cleveland
?
Consumer Share
of Travel Cost
USAirways
1-Stop
Coach
$622
United
Non-Stop
Coach
$1,107
United
Non-Stop
First Class
$1,355
Airfares for July 6-7, 2011 as of 6/26/11

295© Center for Healthcare Quality and Payment Reform www.CHQPR.org
Flat Copayments:
First Class Fare WinsBoston Cleveland
?
Consumer Share
of Travel Cost
USAirways
1-Stop
Coach
$622
United
Non-Stop
Coach
$1,107
United
Non-Stop
First Class
$1,355
$100 Copayment: $100 $100 $100
Airfares for July 6-7, 2011 as of 6/26/11
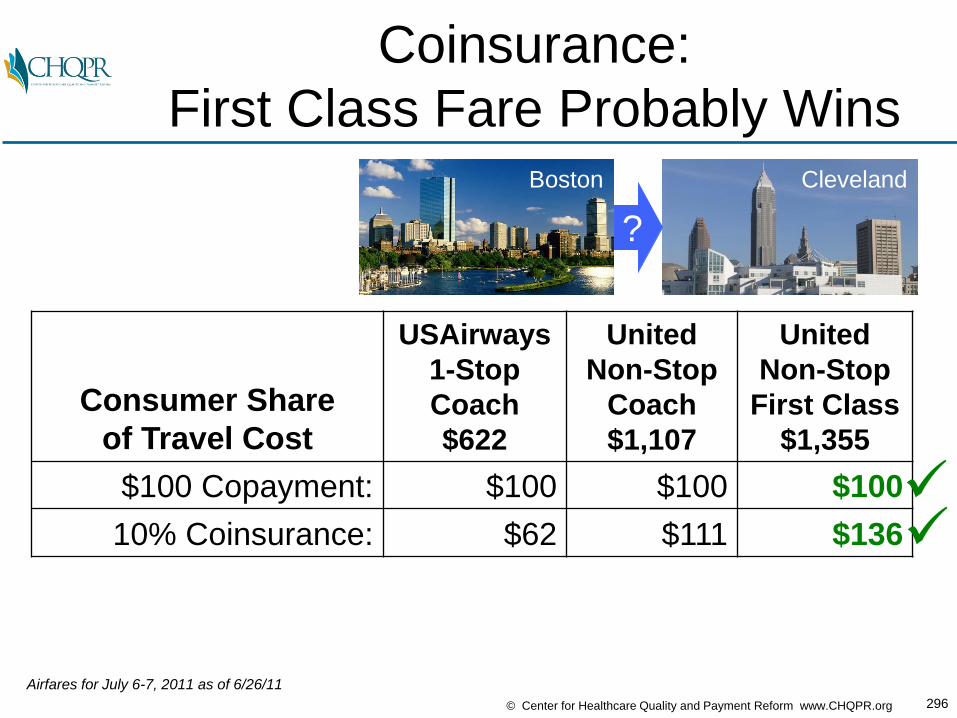
296© Center for Healthcare Quality and Payment Reform www.CHQPR.org
Coinsurance:
First Class Fare Probably WinsBoston Cleveland
?
Consumer Share
of Travel Cost
USAirways
1-Stop
Coach
$622
United
Non-Stop
Coach
$1,107
United
Non-Stop
First Class
$1,355
$100 Copayment: $100 $100 $100
10% Coinsurance: $62 $111 $136
Airfares for July 6-7, 2011 as of 6/26/11
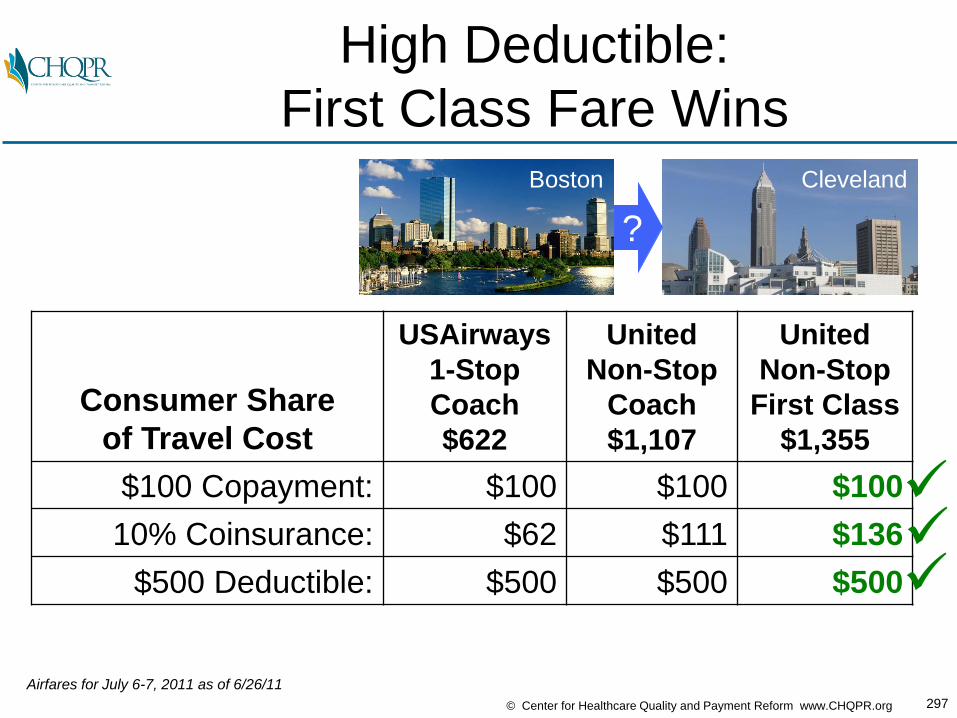
297© Center for Healthcare Quality and Payment Reform www.CHQPR.org
High Deductible:
First Class Fare WinsBoston Cleveland
?
Consumer Share
of Travel Cost
USAirways
1-Stop
Coach
$622
United
Non-Stop
Coach
$1,107
United
Non-Stop
First Class
$1,355
$100 Copayment: $100 $100 $100
10% Coinsurance: $62 $111 $136
$500 Deductible: $500 $500 $500
Airfares for July 6-7, 2011 as of 6/26/11
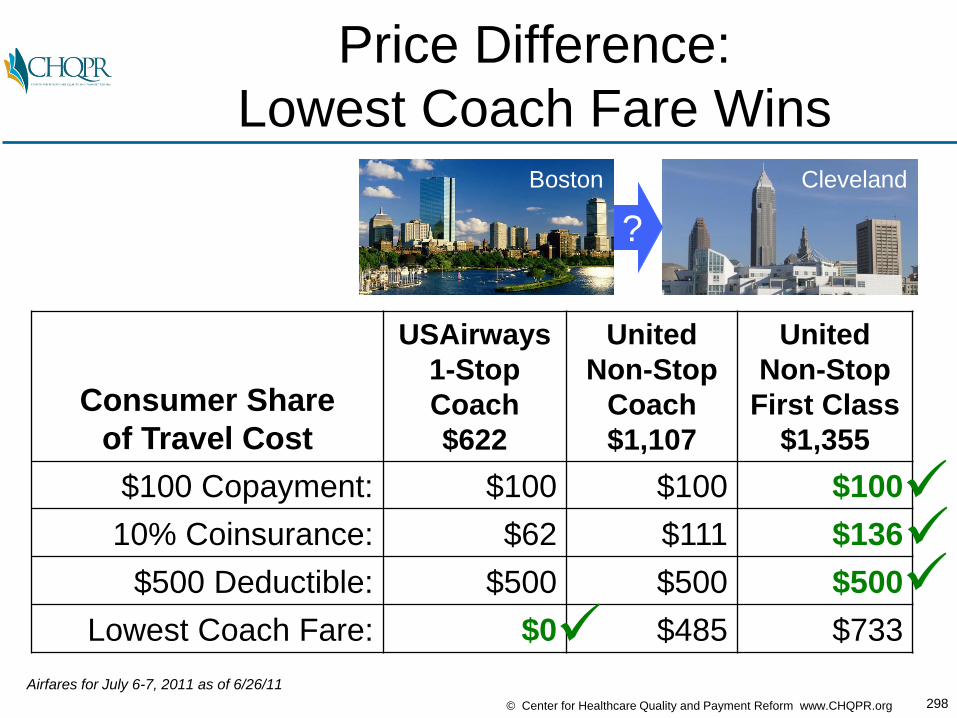
298© Center for Healthcare Quality and Payment Reform www.CHQPR.org
Price Difference:
Lowest Coach Fare WinsBoston Cleveland
?
Consumer Share
of Travel Cost
USAirways
1-Stop
Coach
$622
United
Non-Stop
Coach
$1,107
United
Non-Stop
First Class
$1,355
$100 Copayment: $100 $100 $100
10% Coinsurance: $62 $111 $136
$500 Deductible: $500 $500 $500
Lowest Coach Fare: $0 $485 $733
Airfares for July 6-7, 2011 as of 6/26/11

299© Center for Healthcare Quality and Payment Reform www.CHQPR.org
Where Will You Get
Your Knee Replaced?
Consumer Share
of Surgery CostPrice #1
$20,000
Price #2
$25,000
Price #3
$30,000
Knee Joint
Replacement
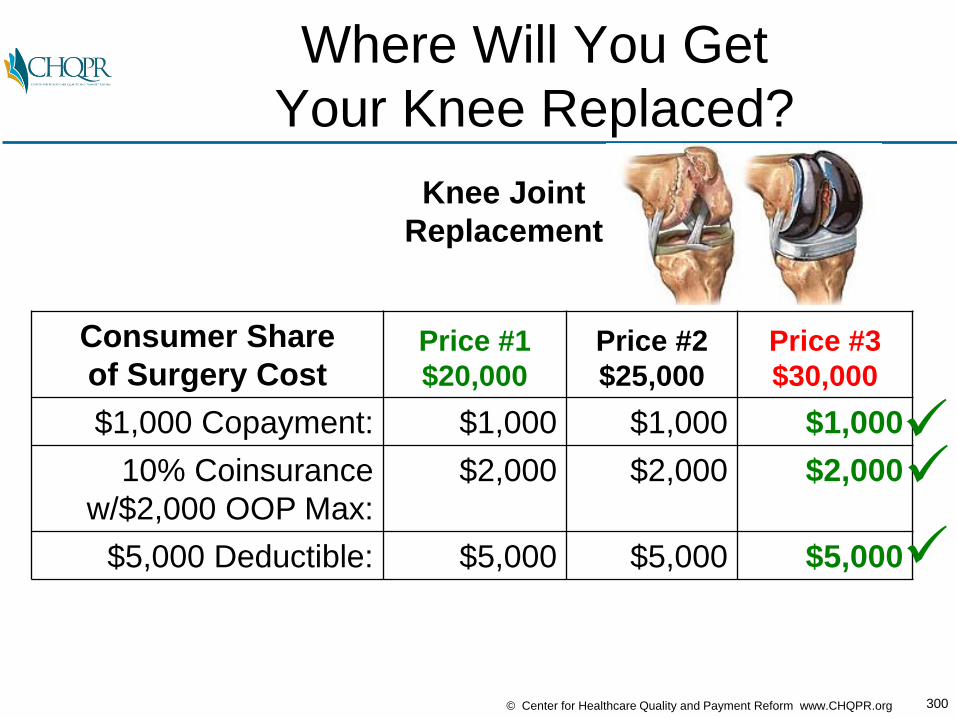
300© Center for Healthcare Quality and Payment Reform www.CHQPR.org
Where Will You Get
Your Knee Replaced?
Consumer Share
of Surgery CostPrice #1
$20,000
Price #2
$25,000
Price #3
$30,000
$1,000 Copayment: $1,000 $1,000 $1,000
10% Coinsurance
w/$2,000 OOP Max:
$2,000 $2,000 $2,000
$5,000 Deductible: $5,000 $5,000 $5,000
Knee Joint
Replacement

301© Center for Healthcare Quality and Payment Reform www.CHQPR.org
Where Will You Get
Your Knee Replaced?
Consumer Share
of Surgery CostPrice #1
$20,000
Price #2
$25,000
Price #3
$30,000
$1,000 Copayment: $1,000 $1,000 $1,000
10% Coinsurance
w/$2,000 OOP Max:
$2,000 $2,000 $2,000
$5,000 Deductible: $5,000 $5,000 $5,000
Highest-Value: $0 $5,000 $10,000
Knee Joint
Replacement
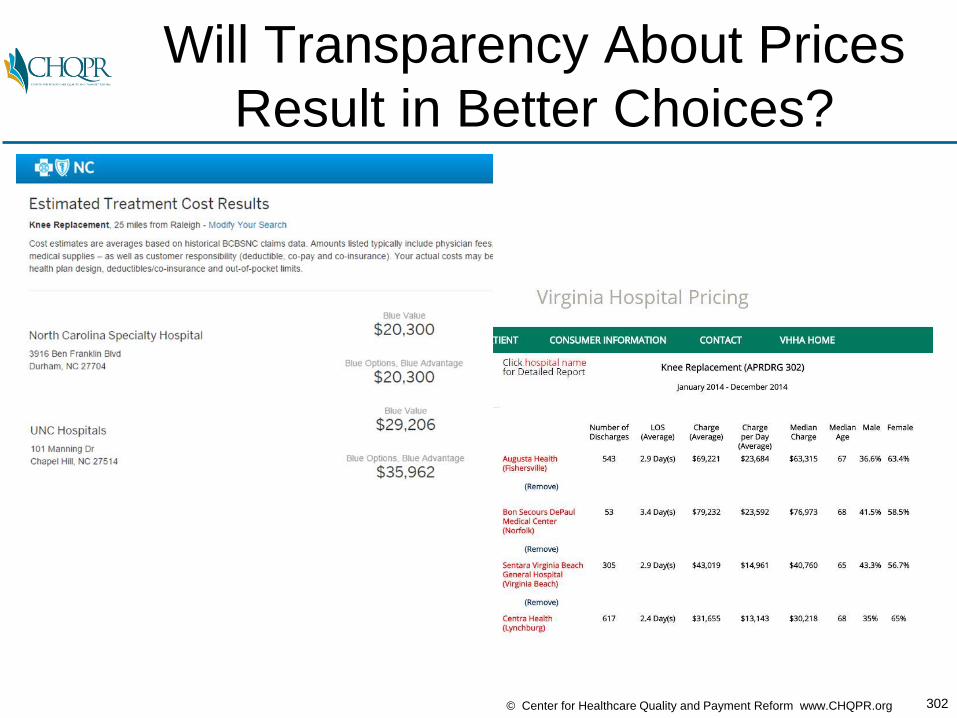
302© Center for Healthcare Quality and Payment Reform www.CHQPR.org
Will Transparency About Prices
Result in Better Choices?
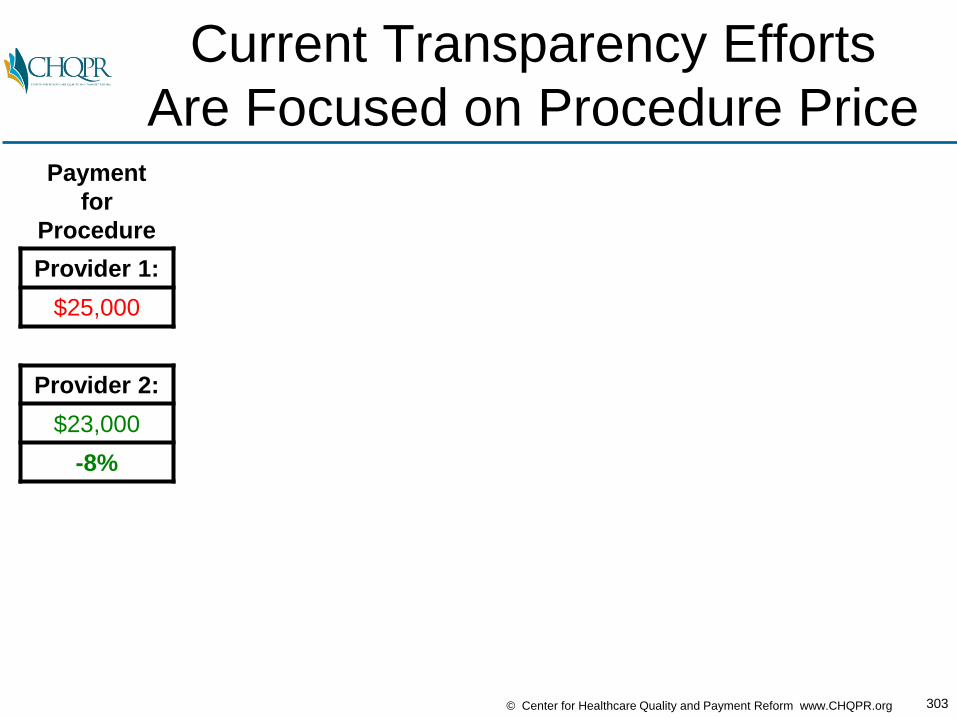
303© Center for Healthcare Quality and Payment Reform www.CHQPR.org
Current Transparency Efforts
Are Focused on Procedure PricePayment
for
Procedure
dded
Provider 1:
$25,000
Provider 2:
$23,000
-8%
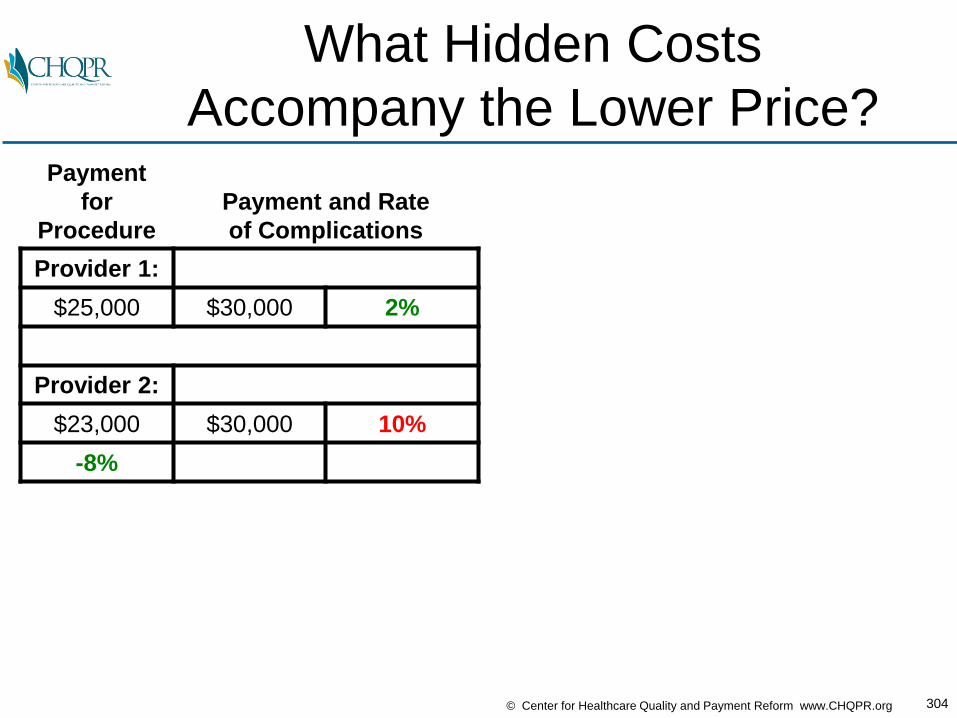
304© Center for Healthcare Quality and Payment Reform www.CHQPR.org
What Hidden Costs
Accompany the Lower Price?Payment
for
Procedure
Payment and Rate
of Complications
Provider 1:
$25,000 $30,000 2%
Provider 2:
$23,000 $30,000 10%
-8%

305© Center for Healthcare Quality and Payment Reform www.CHQPR.org
Total Spending May Be Higher
With the “Lower Price” ProviderPayment
for
Procedure
Payment and Rate of
Complications
Average
Total
Payment
Provider 1:
$25,000 $30,000 2% $25,600
Provider 2:
$23,000 $30,000 10% $26,000
-8% +2%
Provider 2 hasa lower starting price,but is more expensive
when lower qualityis factored in
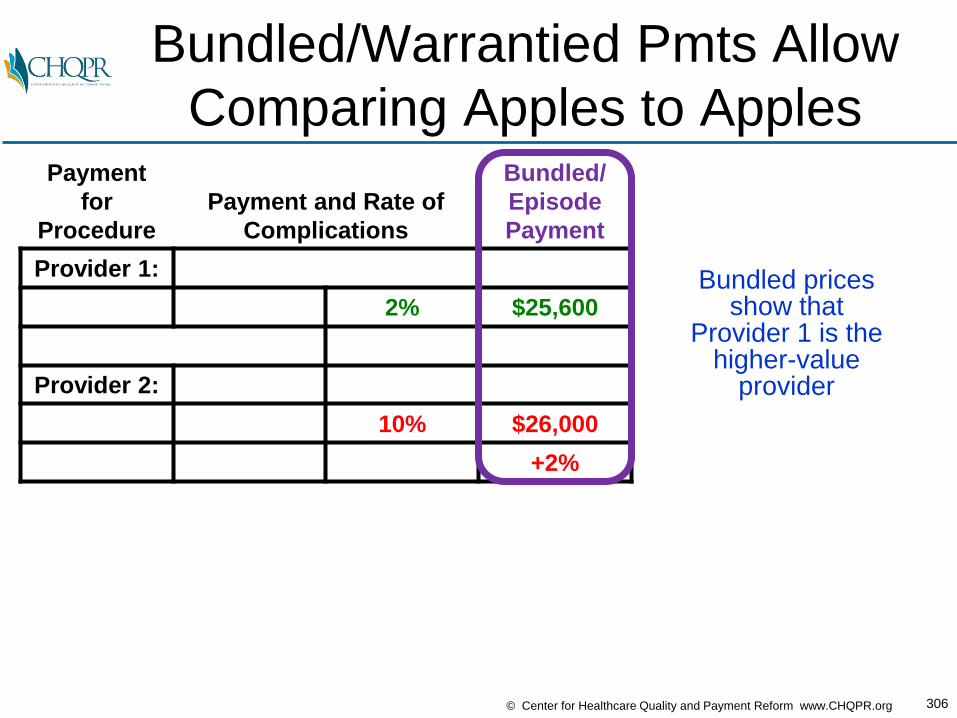
306© Center for Healthcare Quality and Payment Reform www.CHQPR.org
Bundled/Warrantied Pmts Allow
Comparing Apples to ApplesPayment
for
Procedure
Payment and Rate of
Complications
Bundled/
Episode
Payment
Provider 1:
2% $25,600
Provider 2:
10% $26,000
+2%
Bundled pricesshow that
Provider 1 is thehigher-value
provider
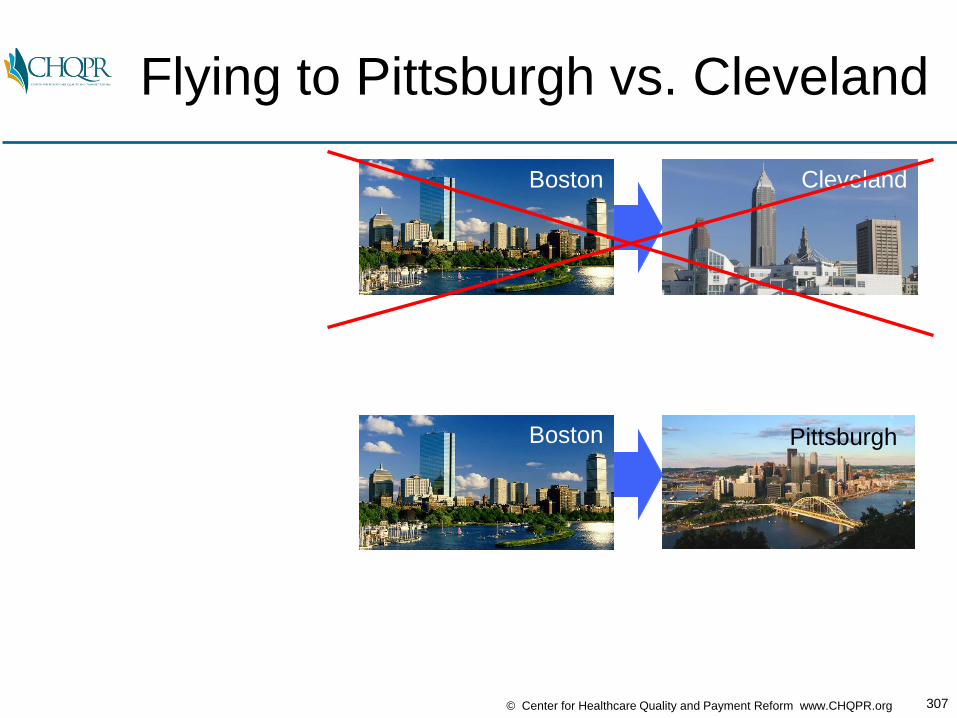
307© Center for Healthcare Quality and Payment Reform www.CHQPR.org
Flying to Pittsburgh vs. Cleveland
Boston Cleveland
Boston Pittsburgh
Cleveland
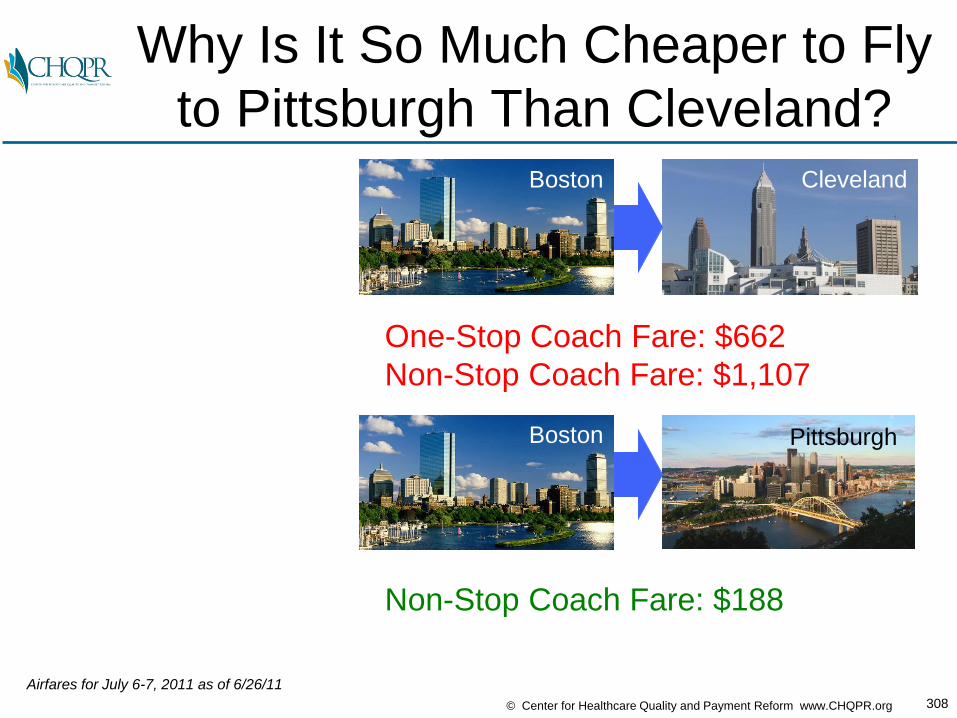
308© Center for Healthcare Quality and Payment Reform www.CHQPR.org
Why Is It So Much Cheaper to Fly
to Pittsburgh Than Cleveland?Boston Cleveland
Boston Pittsburgh
One-Stop Coach Fare: $662
Non-Stop Coach Fare: $1,107
Non-Stop Coach Fare: $188
Airfares for July 6-7, 2011 as of 6/26/11
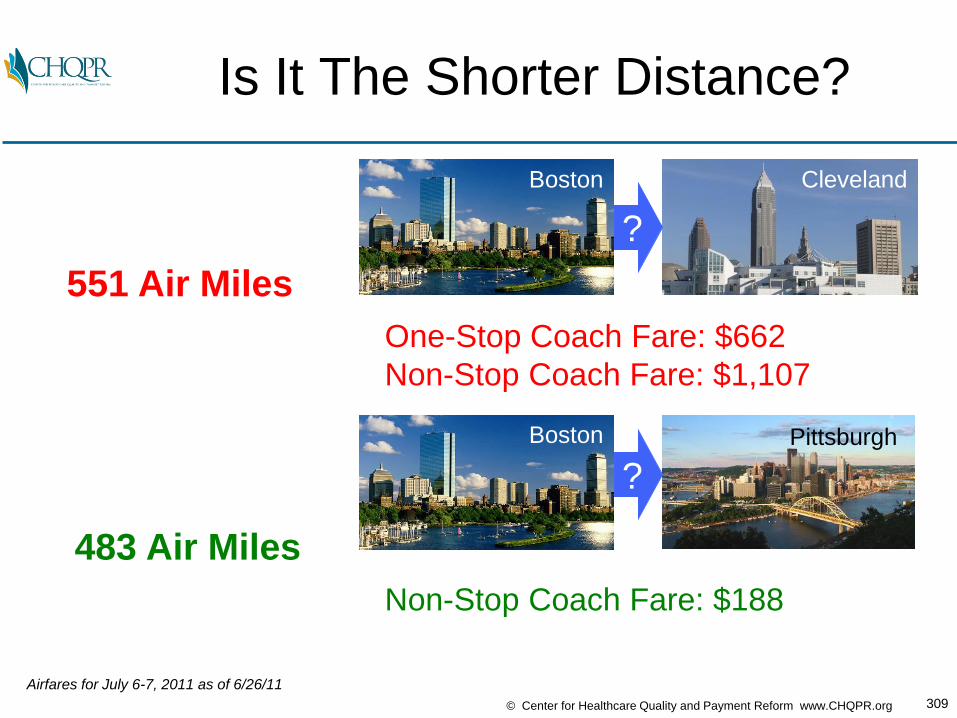
309© Center for Healthcare Quality and Payment Reform www.CHQPR.org
Is It The Shorter Distance?
Boston Cleveland
?
Boston Pittsburgh
?
Non-Stop Coach Fare: $188
551 Air Miles
Airfares for July 6-7, 2011 as of 6/26/11
483 Air Miles
One-Stop Coach Fare: $662
Non-Stop Coach Fare: $1,107

310© Center for Healthcare Quality and Payment Reform www.CHQPR.org
Or Greater Competition?
Boston Cleveland
?
Boston Pittsburgh
?
Choice: United Non-Stop: $1,107
(No other non-stop choice)
Choice #3: USAirways Non-Stop: $238
Choice #2: JetBlue Non-Stop: $188
Choice #1: Delta Non-Stop: $188
NON-
COMPETITIVE
MARKET
COMPETITIVE
MARKET
Airfares for July 6-7, 2011 as of 6/26/11

311© Center for Healthcare Quality and Payment Reform www.CHQPR.org
Choice & Competition
Encourages Efficiency
Consumer Share
of Surgery CostPrice #1
$20,000
Price #2
$25,000
Price #3
$30,000
Highest-Value: $0 $5,000 $10,000
Knee Joint
Replacement
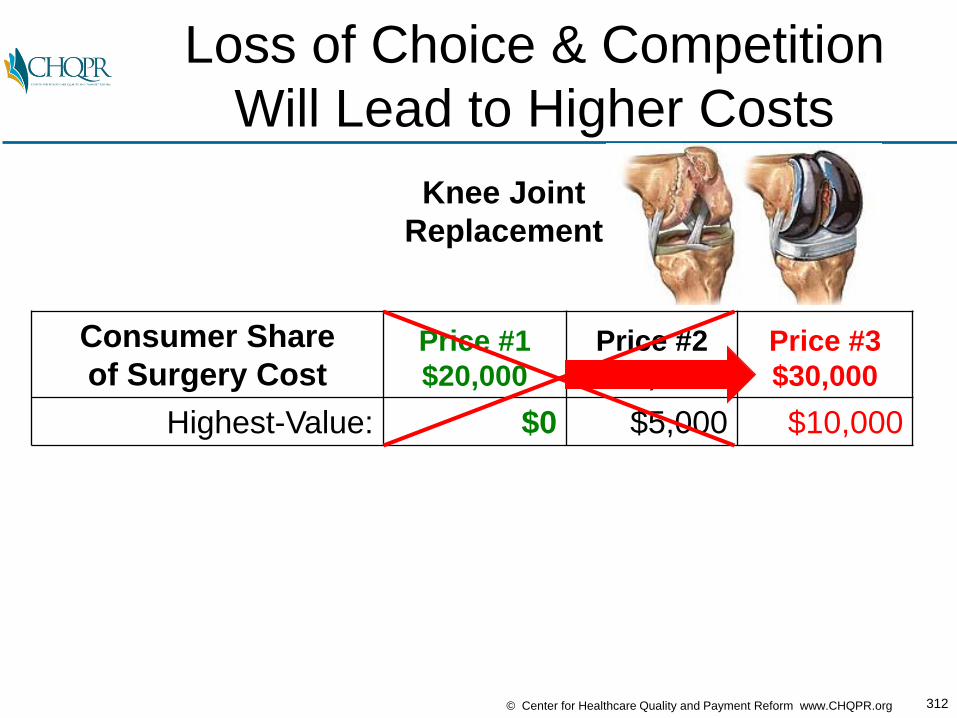
312© Center for Healthcare Quality and Payment Reform www.CHQPR.org
Loss of Choice & Competition
Will Lead to Higher Costs
Consumer Share
of Surgery CostPrice #1
$20,000
Price #2
$25,000
Price #3
$30,000
Highest-Value: $0 $5,000 $10,000
Knee Joint
Replacement