reduced bitumen application rates using bitumen emulsions ... · reduced bitumen application rates...
TRANSCRIPT

Reduced bitumen application rates using bitumen emulsions
November 2014 SA Bagshaw Opus Research Ltd NZ Transport Agency research report 560 Contracted research organisation – Opus Research Ltd

ISBN 978-0-478-41985-6 (electronic)
ISSN 1173-3764 (electronic)
NZ Transport Agency
Private Bag 6995, Wellington 6141, New Zealand
Telephone 64 4 894 5400; facsimile 64 4 894 6100
www.nzta.govt.nz
Bagshaw, S (2014) Reduced bitumen application rates using bitumen emulsions. NZ Transport Agency
research report 560. 48pp.
Opus Research Ltd was contracted by the NZ Transport Agency in 2013 to carry out this research.
This publication is copyright © NZ Transport Agency 2014. Material in it may be reproduced for personal
or in-house use without formal permission or charge, provided suitable acknowledgement is made to this
publication and the NZ Transport Agency as the source. Requests and enquiries about the reproduction of
material in this publication for any other purpose should be made to the Manager National Programmes,
Investment Team, NZ Transport Agency, at [email protected].
Keywords: application rate, bitumen, chipseal, cohesive energy, emulsion, sprayseal.
An important note for the reader
The NZ Transport Agency is a Crown entity established under the Land Transport Management Act 2003.
The objective of the Agency is to undertake its functions in a way that contributes to an efficient, effective
and safe land transport system in the public interest. Each year, the NZ Transport Agency funds innovative
and relevant research that contributes to this objective.
The views expressed in research reports are the outcomes of the independent research, and should not be
regarded as being the opinion or responsibility of the NZ Transport Agency. The material contained in the
reports should not be construed in any way as policy adopted by the NZ Transport Agency or indeed any
agency of the NZ Government. The reports may, however, be used by NZ Government agencies as a
reference in the development of policy.
While research reports are believed to be correct at the time of their preparation, the NZ Transport Agency
and agents involved in their preparation and publication do not accept any liability for use of the research.
People using the research, whether directly or indirectly, should apply and rely on their own skill and
judgement. They should not rely on the contents of the research reports in isolation from other sources of
advice and information. If necessary, they should seek appropriate legal or other expert advice.
Acknowledgements
The authors gratefully acknowledge the following colleagues for supply of bitumen and emulsions: John
Vercoe and Sean Bearsley, the members of our Steering Group (Joanna Towler, Steve Wright, Alan Stevens
and Sean Bearsley) and our peer reviewers (John Donbavand and Jeff Waters). The author also thanks Phil
Herrington and John Patrick.
Abbreviations and acronyms
AADT annual average daily traffic
AAR aggregate application rate
ACE apparent cohesive energy
EAR emulsion application rate
Lm-2 litres per square metre
PMB polymer-modified bitumen binders
pph parts per hundred
RAMM Road Asset and Maintenance Management database
REA Road Emulsion Association
Transport Agency New Zealand Transport Agency
w/w weight for weight

5
Contents
Executive summary ............................................................................................................................................................................... 7 Abstract ........................................................................................................................................................................................................ 8 1 Introduction ................................................................................................................................................................................. 9 2 Literature review ................................................................................................................................................................... 10
2.1 Bitumen emulsion application rates in chipseals .................................................................. 10 2.2 Summary .................................................................................................................................. 12
3 RAMM database analysis .................................................................................................................................................. 13 3.1 Introduction ............................................................................................................................. 13 3.2 RAMM analysis assumptions ................................................................................................... 13 3.3 Preliminary analysis................................................................................................................. 16
3.3.1 How does the cutback bitumen application rate compare with the emulsion application rate? ................................................................................................................. 19
3.4 Achieved lives .......................................................................................................................... 25 3.4.1 Identify whether emulsions fail at a different rate than cutback bitumen seals. ... 25
3.5 Application rates ..................................................................................................................... 30 3.6 Recommendations ................................................................................................................... 30
4 Experimental ............................................................................................................................................................................ 31 4.1 Introduction ............................................................................................................................. 31 4.2 Materials and sample preparation .......................................................................................... 31 4.3 Pendulum knock-off test – preparation .................................................................................. 32 4.4 Pendulum knock-off test – verification .................................................................................. 35 4.5 Theory of pendulum test ........................................................................................................ 36 4.6 Chip coverage: degrees of binder rise or ‘uppage’ ............................................................... 37 4.7 Apparent cohesive energy tests (ACE) – pendulum knock off .............................................. 40
5 Conclusions, specifications and recommendations ........................................................................................ 42 5.1 Specification of emulsion chipseal application rate .............................................................. 42 5.2 Recommendations for further research ................................................................................. 43
6 References ................................................................................................................................................................................. 44 Appendix A: Graphs of pendulum test results ................................................................................................................. 45

6

7
Executive summary
This NZ Transport Agency research project investigated the possibility of reducing the amount of bitumen
(and, par infra, cutters such as kerosene) used in chipseal road surfaces if the bitumen is applied as an
emulsion rather than as a hot cutback bitumen. The experimental design provided an indirect calculation
of the ‘apparent cohesive energy’ (ACE) of the bitumen layer in sample chipseals. These samples were
prepared with two different non polymer-modified bitumen binders (of different viscosities from different
suppliers) and the emulsions manufactured from those binders.
Experimental results for the different emulsions (after curing) were compared with each other, with the
base bitumen from which each emulsion was prepared, and with those same base binders diluted with
kerosene. Two different bitumen emulsions were used and for each two residual bitumen application rates
and one cutback dilution rate were investigated. A single aggregate application rate was examined. The
swinging pendulum ‘knock-off’ test directly measured the momentum lost from a pendulum of known
momentum as a result of ‘knocking off’ a tower that was firmly attached to the top of a sample chipseal
surface. From this loss of momentum the energy required to dislodge a patch of chip from the seal was
observed and used to infer the ACE. The ACE is a function of several variables: bitumen-chip adhesion,
chip application rate, binder film thickness and inherent cohesion. The differences in ACE between
emulsions, base binders and cutback binders were compared.
The results showed clear, statistically significant, differences in ACE between seals constructed with the
emulsions, the base binders and the cutback base binders. For the same residual bitumen application rate
the ACE increased in the order: cutback base binder, cured emulsion seals, base binder seals. The
preliminary conclusion was that if the ACE value rankings measured were representative of the same
binders in the field then it might be possible to apply bitumen emulsions at lower residual bitumen rates
than a cutback prepared from the same bitumen (assuming that the emulsified bitumen was not itself
cutback).
The difference in ACE value was probably mainly due to the cutback binders having lower viscosities than
the emulsified bitumens (even after curing to evaporate the kerosene), rather than any inherent advantage
conferred by application as an emulsion. In fact the results suggested that emulsification might actually be
disadvantageous for seal performance. The emulsified binders, even after extensive curing, did not reach
the strength of the base binders. The implication was that if a given bitumen were to be applied hot (no
cutter) or as an emulsion, then the resulting emulsion seal would also be weaker than the hot base-binder
version. This would mean that residual bitumen application rates would need to be higher to achieve the
same performance.
It must be stressed, however, that the laboratory results can only go so far towards replicating an actual
chipseal surface. The overall strength of a real world chipseal is built by more than just the bitumen
cohesive energy. Aspects such as stone mosaic interlock also contribute, but the results discussed here
isolate and focus on the cohesion within the bitumen film. In summary, the results obtained indicate
statistically significant differences in the bitumen cohesive energy component of laboratory-produced
chipseal samples when the bitumen is applied in different forms (cutback, emulsion, base binder).
Reduced bitumen application rates using bitumen emulsions
8
Abstract
This research project investigated the differences in cohesive energies of model chipseal samples
prepared from bitumen emulsions, the base binders, and the kerosene cutback base binder. The aim was
to determine if it was possible to construct chipseals by using a lower residual bitumen application rate
whilst still retaining adequate performance. Analysis of the NZTA RAMM (Road Asset and Maintenance
Management) database indicated that chipseals are indeed being prepared using emulsions at lower
residual bitumen application rates than cutback binders. But also that emulsion seals have neither yet
seen sufficiently long service, nor in sufficient numbers, to determine any differences in lifetimes
compared with cutback seals. Laboratory results from Opus Research, Petone 2014 have indicated that
cohesive energies of the bitumen layer in single layer chipseals prepared from cutback binders are lower
than those prepared from emulsions of the same base binder, which are lower than those prepared from
the base binders themselves. The suggestion, based on the balance of the data, is that viable chipseals
may well be possible at lower bitumen application rates when applied as emulsions (provided the
emulsified bitumen was not itself cutback).

1 Introduction
9
1 Introduction
This NZ Transport Agency (the Transport Agency) research project investigated the possibility of reducing
the amount of bitumen (and, par infra, cutters such as kerosene) used in chipseal road surfaces if the
bitumen was applied as an emulsion rather than as a hot cutback bitumen. The experimental design
provided an indirect measurement of the ‘apparent cohesive energy’ (ACE) of the bitumen layer in model
single layer chipseals. These samples were prepared with two different non polymer-modified bitumen
binders (of different viscosities from two different local suppliers) and the emulsions and cutbacks formed
from those binders.
Experimental results for the base binders, the emulsions, and the kerosene cutbacks prepared from the
two binders were all compared with each other. One cutback dilution rate, one aggregate application rate
(AAR) and two residual bitumen application rates were investigated.
The Opus Research swinging pendulum ‘knock-off’ test (derived from the Vialit pendulum bitumen
cohesive energy test, hereafter the ‘ACE test’) directly measured the momentum lost by a pendulum of
known mass as a result of ‘knocking off’ a tower that was firmly attached to the top of a laboratory
prepared sample chipseal surface. The momentum lost by the pendulum is considered to be equal to
(other losses are considered to be negligible) the cohesive energy of the bitumen film. The ACE is a
function of several variables: bitumen-chip adhesion, chip application rate, film thickness and inherent
cohesion. The differences in ACE between emulsions, the base binders and the cutback base binders were
compared. The results showed there were clear, statistically significant, differences in the ACEs of
cutback, emulsified and base binders.
The research aimed to understand if and how chipseal performance might be affected if residual bitumen
application rates were reduced when using emulsions. If a reduction in emulsion application rates (EARs)
could be achieved while at the same time maintaining performance of model chipseal samples, then it
might be possible to infer a reduction in overall construction costs.

Reduced bitumen application rates using bitumen emulsions
10
2 Literature review
2.1 Bitumen emulsion application rates in chipseals
Chipseal road surfacing in New Zealand is generally done using hot ‘cutback’ bitumens of various grades.
The sealing chips are very often greywacke, but this depends on the geology of particular regions, with
basalts being used in the Auckland region, for example. While emulsion sealing has been used in
New Zealand for more than 40 years, the use of emulsions has been gaining more traction over the past
20 years. Proponents of emulsion sealing suggest a number of important economic, safety and
environmental advantages over cutback bitumen sealing in addition to potential performance advantages1.
However, regardless of the documentation of emulsion use in New Zealand for the past 20–40 years,
analysis of the NZ Transport Agency (the Transport Agency) RAMM database (see chapter 3) indicates that
the number of road surfaces in New Zealand constructed using emulsions is only 10% of those made using
cutback bitumens. Furthermore, while the quantitative data on emulsion seals from the RAMM database is
scant beyond 10 years ago, it does indicate that the use of emulsions is increasing.
It is generally considered that emulsification of bitumen is simply another method for the delivery of the
bitumen. Theoretically at least, after the emulsion has ‘broken’, and the water has left the emulsion, the
residual bitumen that remains should be fundamentally the same as the bitumen prior to emulsification.
Few researchers, however, discuss the fact that the emulsifier and other non-volatile additives are likely to
remain in the bitumen and may either disrupt or enhance the bitumen chemistry. In many countries,
especially in Europe, bitumen in the form of emulsions has been used for many years. Indeed, in the
United Kingdom for example, availability of cutback bitumen for use on road surfaces is very restricted.
Surface dressing emulsions in the United Kingdom are designed around the specification EN13808 and
Road Note 39 (Roberts and Nicholls 2008). Early emulsions contained up to 70% residual bitumen but
recent products using polymer-modified bitumen binders (PMBs) are raising the contents above 70%. Most
emulsions applied in roading contexts are cationic emulsions.
The text, Chipsealing in New Zealand (Transit NZ et al 2005, p327) outlines the various details that can be
manipulated in the design of a chipseal. While no absolute values are provided for application rates, the
design guide for hot cutback bitumen application rates is given in chapter 11 of that text (Transit NZ et al
2005, p415). The textbook does not raise the question of differential emulsion-cutback residual bitumen
application rates. The implicit assumption is that once the water has evaporated, the emulsion seal is
essentially the same as a hot cutback (once all the kerosene has evaporated). Ball studied the implications
of increasing emulsion use in New Zealand (Ball 1995). It was noted that a significant proportion of
emulsions was polymer modified, but also that contractors continued to dilute or cut back emulsified
bitumen with up to 2pph (parts per hundred) kerosene as opposed to typically 3pph kerosene in a hot
cutback. The latter observation is relevant to the present study (see below), but the possibility of reducing
residual application rates was not mentioned.
A field study on the application of polymer-modified bitumen emulsions (PMEs) in high-stress road areas
was undertaken in New Zealand in 1993–95 (Patrick 2000). One of the sites contained a control section at
the same residual application rate but this was prepared using 180/200 penetration grade ‘straight
bitumen’ (presumably cutback) not polymer-modified bitumen, so the seals are not directly comparable
and no direct conclusions on relative performance can be drawn.
1 For more information, see the websites of the Asphalt Emulsion Manufacturers Association (AEMA) www.aema.org.uk
and Road Science www.roadscience.co.nz
2 Literature review
11
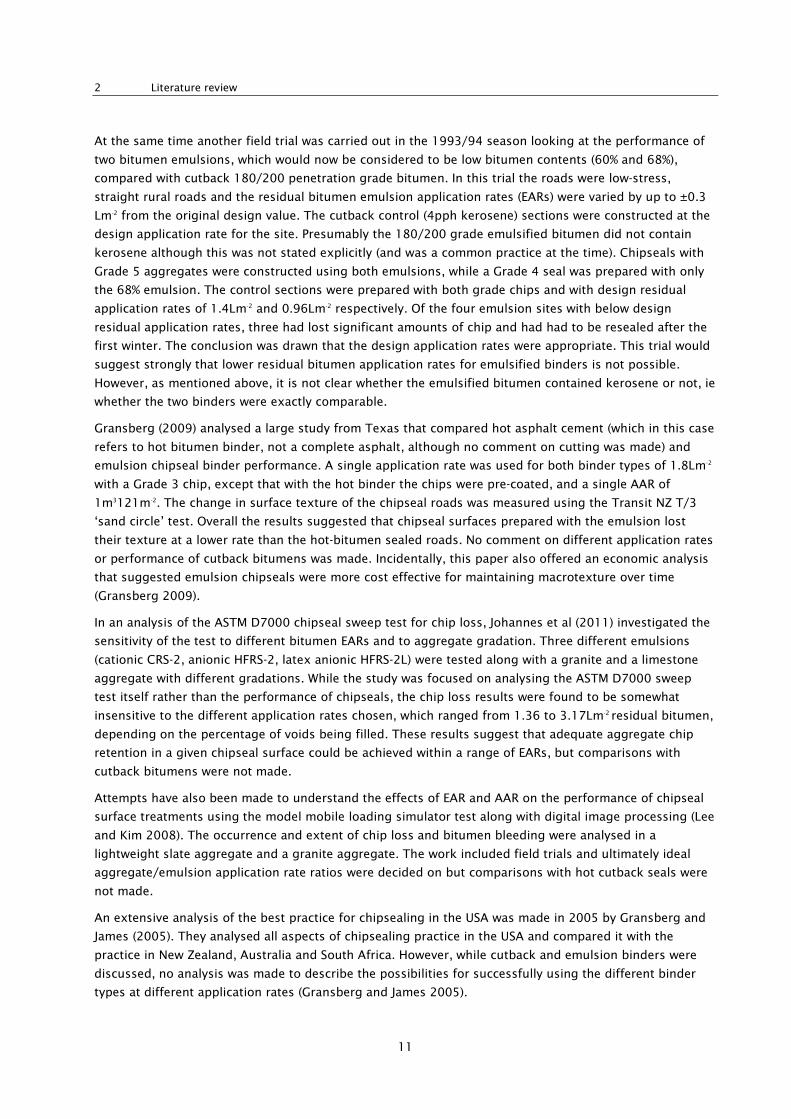
At the same time another field trial was carried out in the 1993/94 season looking at the performance of
two bitumen emulsions, which would now be considered to be low bitumen contents (60% and 68%),
compared with cutback 180/200 penetration grade bitumen. In this trial the roads were low-stress,
straight rural roads and the residual bitumen emulsion application rates (EARs) were varied by up to ±0.3
Lm-2 from the original design value. The cutback control (4pph kerosene) sections were constructed at the
design application rate for the site. Presumably the 180/200 grade emulsified bitumen did not contain
kerosene although this was not stated explicitly (and was a common practice at the time). Chipseals with
Grade 5 aggregates were constructed using both emulsions, while a Grade 4 seal was prepared with only
the 68% emulsion. The control sections were prepared with both grade chips and with design residual
application rates of 1.4Lm-2 and 0.96Lm-2 respectively. Of the four emulsion sites with below design
residual application rates, three had lost significant amounts of chip and had had to be resealed after the
first winter. The conclusion was drawn that the design application rates were appropriate. This trial would
suggest strongly that lower residual bitumen application rates for emulsified binders is not possible.
However, as mentioned above, it is not clear whether the emulsified bitumen contained kerosene or not, ie
whether the two binders were exactly comparable.
Gransberg (2009) analysed a large study from Texas that compared hot asphalt cement (which in this case
refers to hot bitumen binder, not a complete asphalt, although no comment on cutting was made) and
emulsion chipseal binder performance. A single application rate was used for both binder types of 1.8Lm-2
with a Grade 3 chip, except that with the hot binder the chips were pre-coated, and a single AAR of
1m3121m-2. The change in surface texture of the chipseal roads was measured using the Transit NZ T/3
‘sand circle’ test. Overall the results suggested that chipseal surfaces prepared with the emulsion lost
their texture at a lower rate than the hot-bitumen sealed roads. No comment on different application rates
or performance of cutback bitumens was made. Incidentally, this paper also offered an economic analysis
that suggested emulsion chipseals were more cost effective for maintaining macrotexture over time
(Gransberg 2009).
In an analysis of the ASTM D7000 chipseal sweep test for chip loss, Johannes et al (2011) investigated the
sensitivity of the test to different bitumen EARs and to aggregate gradation. Three different emulsions
(cationic CRS-2, anionic HFRS-2, latex anionic HFRS-2L) were tested along with a granite and a limestone
aggregate with different gradations. While the study was focused on analysing the ASTM D7000 sweep
test itself rather than the performance of chipseals, the chip loss results were found to be somewhat
insensitive to the different application rates chosen, which ranged from 1.36 to 3.17Lm-2 residual bitumen,
depending on the percentage of voids being filled. These results suggest that adequate aggregate chip
retention in a given chipseal surface could be achieved within a range of EARs, but comparisons with
cutback bitumens were not made.
Attempts have also been made to understand the effects of EAR and AAR on the performance of chipseal
surface treatments using the model mobile loading simulator test along with digital image processing (Lee
and Kim 2008). The occurrence and extent of chip loss and bitumen bleeding were analysed in a
lightweight slate aggregate and a granite aggregate. The work included field trials and ultimately ideal
aggregate/emulsion application rate ratios were decided on but comparisons with hot cutback seals were
not made.
An extensive analysis of the best practice for chipsealing in the USA was made in 2005 by Gransberg and
James (2005). They analysed all aspects of chipsealing practice in the USA and compared it with the
practice in New Zealand, Australia and South Africa. However, while cutback and emulsion binders were
discussed, no analysis was made to describe the possibilities for successfully using the different binder
types at different application rates (Gransberg and James 2005).

Reduced bitumen application rates using bitumen emulsions
12
2.2 Summary
Internationally the use of hot cutback bitumen for chipsealing is uncommon and the literature provides
little insight into comparative emulsion/cutback application rates.
In New Zealand the literature indicates that the use of bitumen emulsions for chipseal surfacing in
New Zealand is increasing for a range of reasons, but the effects of differential application rates for
emulsion and cutback seals has not been studied or discussed. The only work that enables direct
comparison of emulsion seals and cutbacks is Patrick (1998), which reported on field trials in this area.
Patrick examined the effect of emulsion residual bitumen application rate in the field and showed that
application rates of 0.2Lm-2 to 0.3Lm-2 below design values were unacceptable. Failure occurred, whereas a
cutback seal (and emulsion seals) at the design application rate did not. This suggests that lower residual
application rates for emulsion seals would not be possible without adversely affecting performance. It was
not made clear, however, in the report whether the emulsified bitumen was also cutback, which may have
been the case and is an important point in light of the findings discussed in chapter 4. It should also be
borne in mind that the Patrick study was done over 20 years ago and that emulsion technologies and
techniques have developed since that time so that contemporary results may differ.

3 RAMM database analysis
13
3 RAMM database analysis
3.1 Introduction
Analysis of the Transport Agency RAMM database was performed to assess the current state of the art
with regard to EARs. Several questions were investigated: Are emulsions being applied at lower residual
application rates than equivalent cutback bitumens in New Zealand? Are those seals achieving equivalent
or longer lives? This objective was analysed in two parts: ‘application rates’ and ‘achieved lives’ based on a
set of general sample assumptions documented separately.
3.2 RAMM analysis assumptions
Data for this analysis was extracted from the RAMM database, ‘Entire Network Security Zone’ on 20
September 2013.
The tables extracted from RAMM included:
• surface table: c_surface
• surfaces sectioned by carriageway: surface_structure
• carriageway table: carr_way
The following assumptions were made:
• Regions defined by cway_area in the carriageway table (24 total) were represented by historical
contract areas (note these do not align with new network outcome contract regions).
• Only surfaces which had been sectioned by carriageway were included in the analysis. Any surfaces
which did not exist in the surface_structure table were excluded. This included a number of older
surfaces (pre-2000) for which a reseal date could not be defined.
• Both top surfaces and expired surfaces were included. Expired surfaces: only one layer under was
included (layer_no=2).
• Only reseals and second coats were included. First coats and membrane seals were excluded.
• To normalise data, surface life was described as a percentage:
– achieved life/default life where default lives were based on a simplified RAMM life table.
Table 3.1 Segmentation of surface types/years of service life
Surfacing type
Use 1 Use 2 Use 3 Use 4 Use 5 Use 6 Use 7
(<100
vpd)
(100-
500vpd)
(500-
2,000
vpd)
(2,000–
4,000
vpd)
(4,000–
10,000
vpd)
(10,000–
20,000
vpd)
(>20,000
vpd)
Grade 4 12 10 8 7 6 5 4
Grade 3 14 12 10 9 8 7 6
Grade 2 16 14 12 11 10 9 8
Grade 4/6 14 12 10 9 8 6 4
Grade 3/5 16 14 12 11 10 8 6
Grade 2/4 18 16 14 13 12 10 9

Reduced bitumen application rates using bitumen emulsions
14
• To normalise the data, the binder application rate was described as a differential (Lm-2): actual –
design or percentage differential (%): (actual – design)/design
• Where design was taken from Transit NZ et al (2005) (this design algorithm might, however, not be
accepted as the industry standard)
(ALD+0.7*Td)*(0.291-0.025*LOG10(AADT/2*(1+0.09*HCV)*100)) (Equation 3.1)
– ALD:
Chip grade ALD
2 11
3 9
4 7
– Td: avg texture depth at reseal (mm); default 1.2mm
– AADT: annual average daily traffic
– HCV: percentage of heavy commercial vehicles
• A positive differential or percentage occurs when actual binder application rate was higher than the
design rate.
• All analyses were completed based on sealed area.
• Only certain chipseals, deemed to be applied in ‘normal’ sealing circumstances were included as
shown in table 3.2 (highlighted yellow) (JE Patrick, E Beca, pers comms. 2013).Patrick, 2013).
Table 3.2 Surface types
surf_binder Binder Name B130 Bitumen 130/150 B180 Bitumen 180/200 B45 Bitumen 45/55 B60 Bitumen 60/70 B80 Bitumen 80/100 E130 Emulsion 130/150 E180 Emulsion 180/200 E80 Emulsion 80/100 EPM Emulsion Polymer Modified PMB Polymer Modified Bitumen POLY Polyurethane UNKN Unknown

3 RAMM database analysis
15
Only cutback bitumen (highlighted green) and bitumen emulsion (highlighted orange) binder types have
been included as shown in table 3.3.
Table 3.3 Binder types
Note: 45/55 and 60/70 are not often used as sealing binders
Table 3.4 shows the network level summary of data available (sealed areas). The regions highlighted have
been selected as having significant areas of (>10%) emulsion seals for analysis.
Table 3.4 Summary statistics
Cutback bitumen (000m2) Emulsion (000m2) % Emulsion
cway_area Layer2 Top Layer2 Top Layer2 Top
AUCK ALLIANCE 491 248 3 6 1% 2%
BOP EAST 1,911 3,136 39 16 2% 1%
BOP WEST 1,007 1,058 8 0 1% 0%
CENTRAL WAIKATO 2,659 3,999 19 10 1% 0%
COASTAL OTAGO 2,809 1,752 411 3,050 13% 64%
EAST WAIKATO 2,691 3,836 139 134 5% 3%
EAST WANGANUI 2,825 5,009 217 272 7% 5%
GISBORNE 1,414 1,816 20 0 1% 0%
MARLBOROUGH 1,046 1,671 12 16 1% 1%
NAPIER 1,762 2,859 3 49 0% 2%
NELSON 1,598 1,328 231 1,309 13% 50%
aly Material Name Count useCONC Concrete 30 nBOLID BOLIDT Polyurethane Mix 13 nCOMB Combination Seal 1 nTEXT Texturising Seal 3461 nLOCK Locking Coat Seal 96 nRCHIP Red Chip Seal (McCullum) 125 nPSKID Premium skid surface PSV >70 61 nOGEM Open graded emulsion mix 147 n3CHIP Blended Chipseal 2 nCAPE Capeseal 34 nVFILL Void fill seal 7042 n1CHIP Single Coat Seal 28343 ySLRY Slurry Seal 538 nOTHER Other material type 55 nPSEAL Prime Coat 53 nRACK Racked in Seal 3392 ySMA Stone Mastic Asphalt 1869 nUTA Ultra Thin Asphalt 42 n2CHIP Two Coat Seal 19859 yOGPA Open Graded Porous Asphalt 4428 nOGPAH High Strength Ogpa 49 nAC Asphaltic Concrete 3702 nB/S Sandwich Seal 1753 nBBM Bitumen Bound Macadam 444 n

Reduced bitumen application rates using bitumen emulsions
16
Cutback bitumen (000m2) Emulsion (000m2) % Emulsion
cway_area Layer2 Top Layer2 Top Layer2 Top
NORTHLAND 2,548 4,671 64 191 2% 4%
NTH CANTERBURY 503 1,829 43 1,685 8% 48%
OTAGO CENTRAL 2,781 2,297 79 1,803 3% 44%
PSMC 005 535 928 19 40 3% 4%
PSMC 006 1,222 2,896 62 30 5% 1%
ROTORUA DIST 1,595 2,072 49 37 3% 2%
SOUTHLAND 2,704 3,544 123 1,300 4% 27%
STH CANTERBURY 1713 841 249 2149 13% 72%
TAURANGA CITY 344 279 0 44 0% 14%
WELLINGTON 1157 1202 26 30 2% 2%
WEST COAST 3289 3845 0 7 0% 0%
WEST WAIKATO 1711 1968 100 60 5% 3%
WEST WANGANUI 2707 5921 394 593 13% 9%
3.3 Preliminary analysis
Can emulsions be applied at lower application rates than equivalent cutback bitumen and achieve
equivalent or longer lives?
Although emulsions have been used in New Zealand for longer, it appears from this analysis that robust
RAMM data on emulsion use extends back only approximately 10 years. Therefore, this analysis has
studied seals applied over the past 10 years only, notwithstanding that emulsions were being used much
earlier. The two following box and whisker charts show the distribution of seals split by emulsion and
cutback bitumen, and top surface and expired surface for the regions highlighted in table 3.4. Figure 3.1
shows the distribution of surfacing year and figure 3.2 shows the percentage of life achieved. Collectively
these charts suggest we do not have sufficient data to answer the question posed above. Note: These
charts are based on the number of surfaces (not length or area sealed).

3 RAMM database analysis
17
Figure 3.1 Distribution of surface year
The two right-hand elements in figure 3.1 show the full set (top and expired) of cutback bitumen and
emulsion surfaces; the ‘box’ which represents 25% through 75% of the emulsion distribution sits on top of
the cutback bitumen ‘box’. This confirms that these two distributions are not comparable. The distribution
of expired emulsions by surface year is more closely aligned to top surface cutback bitumen than to
expired surfaces.
To compare application rates of cutback bitumen and emulsion seals with their achieved lives, we must
analyse the expired surface sets. Again, the expired emulsion box sits on top of the expired cutback
bitumen box with 75% of the expired cutback bitumen seals surfaced by 2000 compared with only 25% of
expired emulsion seals.
The expired emulsions have on average achieved only 50% of their expected service life (figure 3.2)
compared with 100% of the cutback bitumens achieving their expected service life. However, the
distributions of the top surface and expired emulsions are quite similar suggesting that the emulsions
which have already expired will make up the subset of early failures of a distribution which is yet to
develop completely and therefore requires more time to be established.
1970
1975
1980
1985
1990
1995
2000
2005
2010
2015
BitumenExpired
Bitumen Top EmulsionExpired
Emulsion Top Bitumen ALL Emulsions ALL
Distribution of Surface Dates by Binder Regions with >10% Emulsion Seals
Reduced bitumen application rates using bitumen emulsions
18
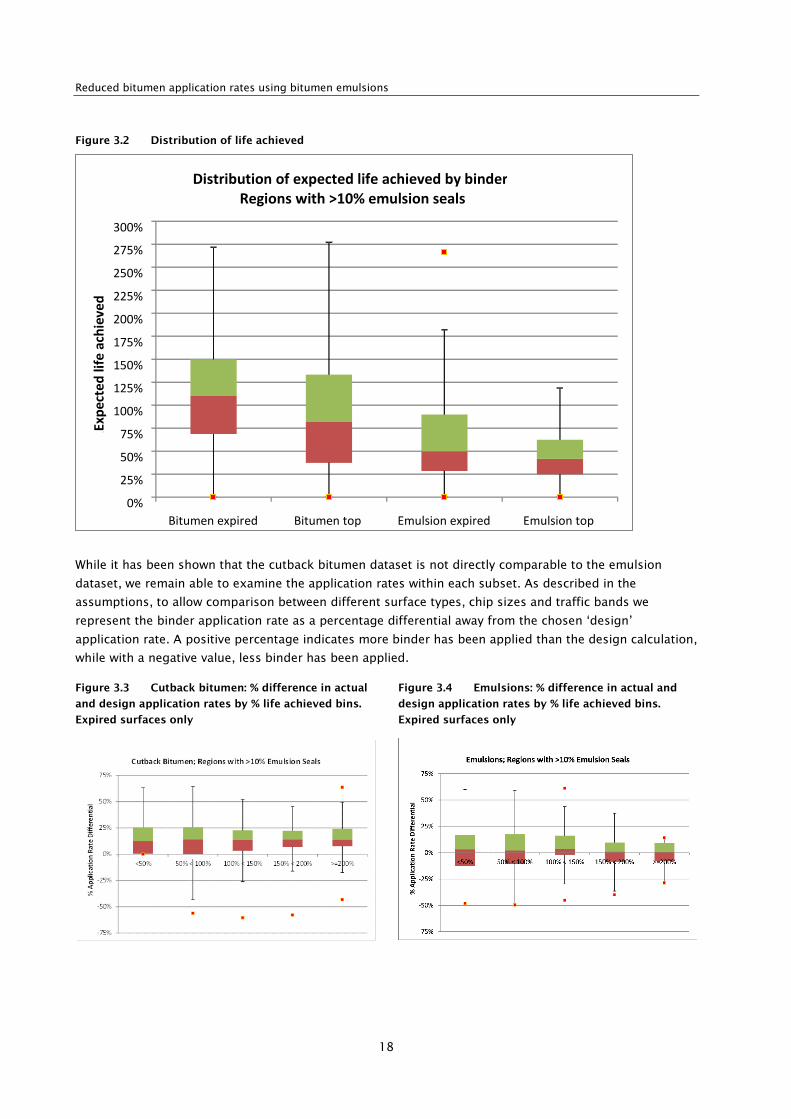
Figure 3.2 Distribution of life achieved
While it has been shown that the cutback bitumen dataset is not directly comparable to the emulsion
dataset, we remain able to examine the application rates within each subset. As described in the
assumptions, to allow comparison between different surface types, chip sizes and traffic bands we
represent the binder application rate as a percentage differential away from the chosen ‘design’
application rate. A positive percentage indicates more binder has been applied than the design calculation,
while with a negative value, less binder has been applied.
Figure 3.3 Cutback bitumen: % difference in actual
and design application rates by % life achieved bins.
Expired surfaces only
Figure 3.4 Emulsions: % difference in actual and
design application rates by % life achieved bins.
Expired surfaces only
0%
25%
50%
75%
100%
125%
150%
175%
200%
225%
250%
275%
300%
Bitumen expired Bitumen top Emulsion expired Emulsion top
% Ex
pect
ed li
fe a
chie
ved
Distribution of expected life achieved by binder Regions with >10% emulsion seals
3 RAMM database analysis
19
Figures 3.3 and 3.4 are subsets of the full dataset, including only expired surfaces in regions with
significant emulsion seals (>10% by area). Over 75% of the cutback bitumen seals (figure 3.3) within this
subset had a higher application rate than the ‘recommended’ design – on average approximately 15%
higher. The trend shows that seals achieving longer lives (figure 3.3 moving left to right) have application
rates higher than the chosen design value.
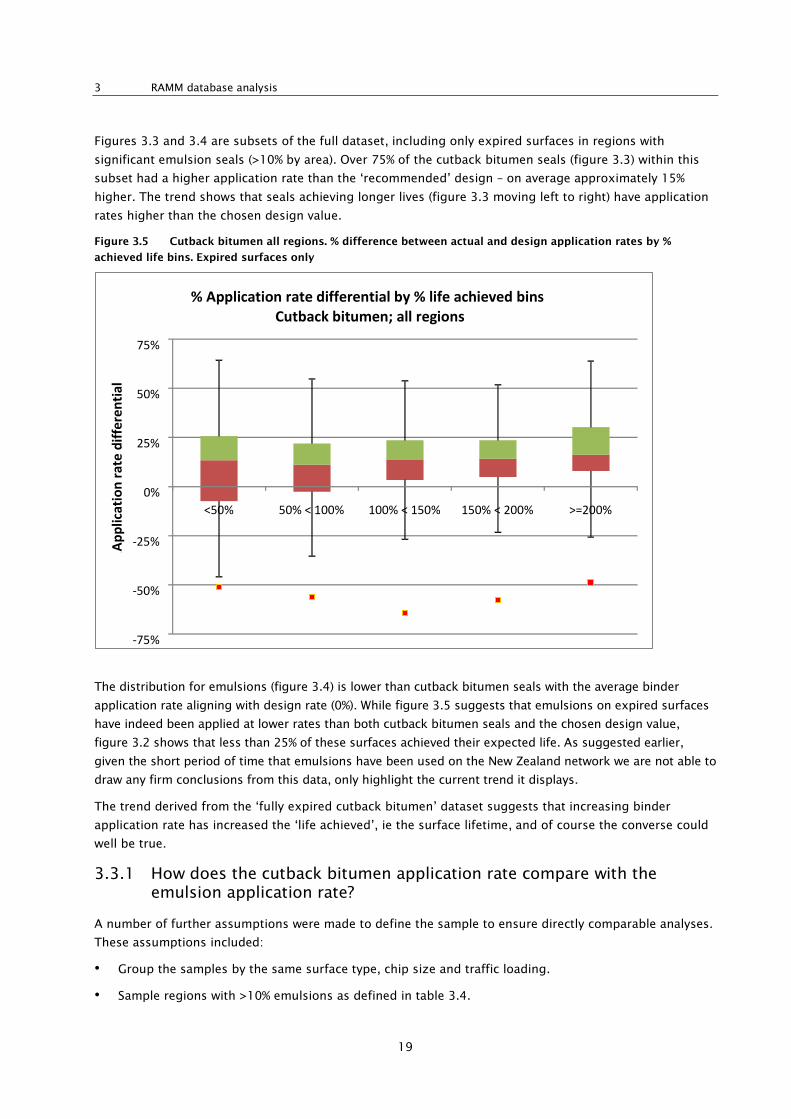
Figure 3.5 Cutback bitumen all regions. % difference between actual and design application rates by %
achieved life bins. Expired surfaces only
The distribution for emulsions (figure 3.4) is lower than cutback bitumen seals with the average binder
application rate aligning with design rate (0%). While figure 3.5 suggests that emulsions on expired surfaces
have indeed been applied at lower rates than both cutback bitumen seals and the chosen design value,
figure 3.2 shows that less than 25% of these surfaces achieved their expected life. As suggested earlier,
given the short period of time that emulsions have been used on the New Zealand network we are not able to
draw any firm conclusions from this data, only highlight the current trend it displays.
The trend derived from the ‘fully expired cutback bitumen’ dataset suggests that increasing binder
application rate has increased the ‘life achieved’, ie the surface lifetime, and of course the converse could
well be true.
3.3.1 How does the cutback bitumen application rate compare with the emulsion application rate?
A number of further assumptions were made to define the sample to ensure directly comparable analyses.
These assumptions included:
• Group the samples by the same surface type, chip size and traffic loading.
• Sample regions with >10% emulsions as defined in table 3.4.
-75%
-50%
-25%
0%
25%
50%
75%
<50% 50% < 100% 100% < 150% 150% < 200% >=200%
% Ap
plic
atio
n ra
te d
iffer
entia
l
% Application rate differential by % life achieved bins
Cutback bitumen; all regions

Reduced bitumen application rates using bitumen emulsions
20
• Use top surfaces only.
• Make an approximate estimate of traffic by pavement use bands (1 through 7). Traffic loadings below
100 AADT and over 20,000 AADT have been excluded due to very low sample (band 1 and 7).
• Remove polymer-modified binders (both cutback and emulsion) as these are not typically applied in
‘normal’ (JE Patrick, E Beca, pers comms 2013) sealing circumstances. As shown in figures 3.6 and 3.7
below, within the sample regions the majority of emulsions (47%) are polymer modified particularly
North and South Canterbury thus reducing the sample size significantly. Coastal and Central Otago
and Nelson are the only three regions applying a majority of emulsions without polymer modification.
Note: All seals in the sample regions that are not polymer modified have been included in the sample.
• Remove minor seal types: single coat GD2, GD3 and GD4 which collectively make up less than 10% of
the emulsion sample. Combine RACK and 2CHIP grouped by largest chip size.
Figure 3.6 Cutback bitumen binder types: sample
regions, top surface (7% polymer modified)
Figure 3.7 Emulsion binder types: sample regions,
top surface (47% polymer modified)
Figure 3.8 Cutback bitumen surface type/chip size:
sample regions, top surface
Figure 3.9 Emulsion surface type/chip size: sample
regions, top surface
For each surface within the sample, the actual application rate was subtracted from the design application
rate with data grouped by traffic band, largest chip size and binder (cutback bitumen and emulsion). The
distribution of application rate differentials was compared with 25th, 50th and 75th percentiles shown in
table 3.5. The yellow highlighted groups have very small sample numbers.
There is a range of design application rates within each sample group due to the relatively wide traffic
bands and the inclusion of %HCV in the calculation. These ranges are all under 0.2Lm-2.
010002000300040005000600070008000900010000
0%10%20%30%40%50%60%70%80%90%
100%
Are
a (m
2, 0
00)
Emulsion Binder Types: Top Surface, Sample Regions
E130 E180 E80 EPM Series5
0% 4% 3% 2%
9%
22%
7%
34%
19%
Emulsion Surface Type (Excl EPM)Top Surface, Sample Regions
GD2 GD3 GD4 RACK_2 RACK_3 RACK_4 TWO_2 TWO_3 TWO_4
0
1000
2000
3000
4000
5000
6000
7000
0%10%20%30%40%50%60%70%80%90%
100%
Are
a (m
2, 0
00)
Cutback Bitumen Binder Types: Top Surface, Sample Regions
B130 B180 B80 PMB Series5
4%
35%
5%10%5%
1%
20%
19%1%
Cutback Bitumen Surface Type (Excl PMB)Top Surface, Sample Regions
GD2 GD3 GD4 RACK_2 RACK_3 RACK_4 TWO_2 TWO_3 TWO_4

3 RAMM database analysis
21
The difference % design column provides an indication of the magnitude of values as a percentage rather
than application rate (Lm-2) calculated only for the 50th percentile. It was calculated for each sample group
as the difference/average design application rate.

Reduced bitumen application rates using bitumen emulsions
22
Table 3.5 Application rate differentials (actual – design) (Lm-2) for the defined sample split by traffic band and chip size
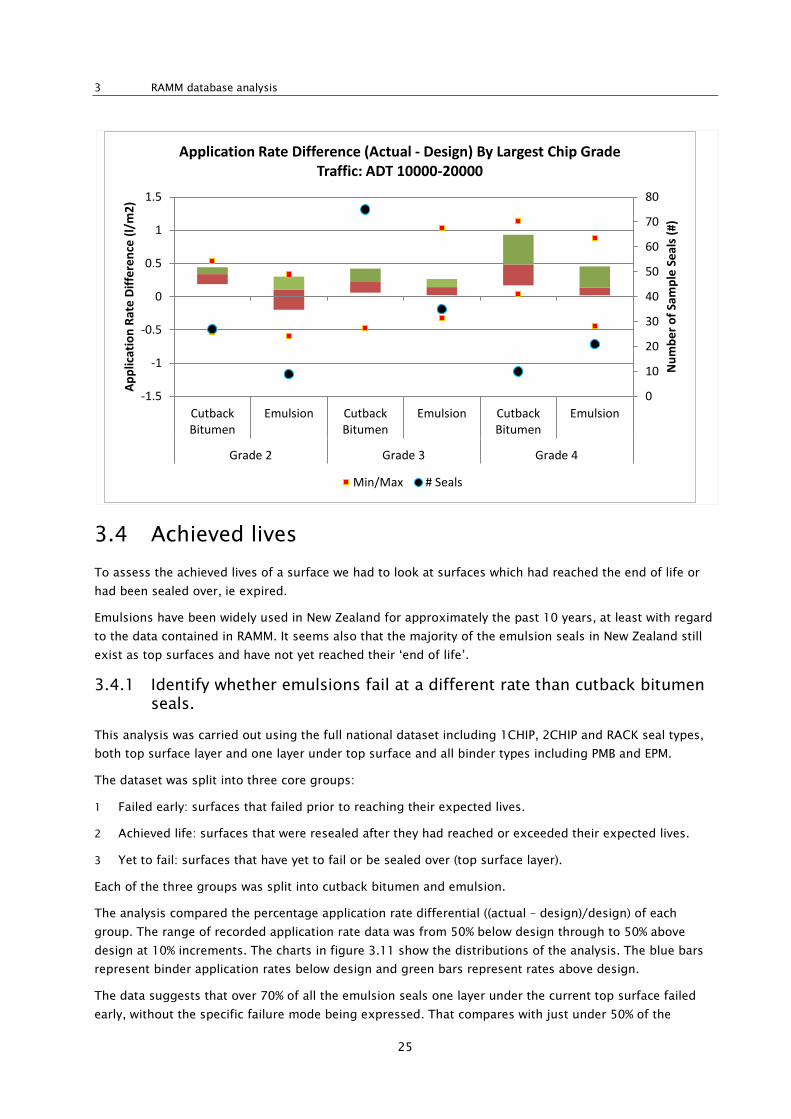
• The data in figure 3.10 suggests emulsions are being applied at lower application rates than corresponding cutback bitumen binders with every sample
group showing a negative difference.
• Larger first chip size and lower traffic groups show the greatest differential.
• Across all traffic bands the Grade 2 emulsion sample is small and the Grade 4 cutback bitumen sample is small.
The charts in figure 3.10 show the 25th, 50th and 75th percentile range, minimum and maximum values and sample size for each sample group.
Traffic Band
Chip Grade
Cutback Bitumen Emulsion
Cutback Bitumen Emulsion Difference
Cutback Bitumen Emulsion Difference
Difference % Design
Cutback Bitumen Emulsion Difference
Cutback Bitumen Emulsion Difference
Cutback Bitumen Emulsion
Grade 2 63 3 -0.25 -0.97 -0.72 0.09 -0.91 -1.00 -48% 0.21 -0.76 -0.97 0.46 0.21 -0.25 2.05 to 2.24 2.1 to 2.1
Grade 3 40 27 -0.24 -0.46 -0.22 0.03 -0.33 -0.36 -21% 0.21 -0.04 -0.24 0.45 0.42 -0.03 1.7 to 1.86 1.7 to 1.75
Grade 4 2 38 0.24 -0.09 -0.33 0.46 0.04 -0.42 -30% 0.69 0.19 -0.50 0.44 0.28 -0.17 1.38 to 1.38 1.36 to 1.43
Grade 2 363 39 -0.11 -0.68 -0.57 0.09 -0.40 -0.49 -25% 0.26 -0.18 -0.44 0.37 0.50 0.13 1.83 to 2.05 1.87 to 2.04
Grade 3 382 240 -0.12 -0.19 -0.07 0.08 -0.08 -0.16 -10% 0.24 0.12 -0.12 0.36 0.31 -0.04 1.52 to 1.71 1.52 to 1.7
Grade 4 51 144 0.00 -0.04 -0.04 0.16 0.09 -0.07 -5% 0.28 0.22 -0.05 0.28 0.26 -0.02 1.23 to 1.35 1.22 to 1.36
Grade 2 161 16 -0.03 -0.65 -0.63 0.10 -0.29 -0.39 -22% 0.27 -0.09 -0.36 0.30 0.56 0.26 1.76 to 1.9 1.77 to 1.84
Grade 3 197 119 -0.02 -0.09 -0.07 0.15 0.08 -0.07 -5% 0.30 0.20 -0.09 0.32 0.29 -0.02 1.47 to 1.58 1.46 to 1.56
Grade 4 18 125 0.14 0.02 -0.12 0.20 0.16 -0.04 -3% 0.38 0.27 -0.11 0.23 0.24 0.01 1.17 to 1.25 1.16 to 1.25
Grade 2 149 26 0.05 -0.60 -0.65 0.24 -0.27 -0.51 -29% 0.42 -0.23 -0.65 0.37 0.37 0.00 1.67 to 1.81 1.68 to 1.78
Grade 3 177 157 0.12 -0.05 -0.17 0.25 0.08 -0.17 -12% 0.34 0.18 -0.16 0.22 0.23 0.01 1.37 to 1.52 1.36 to 1.51
Grade 4 18 128 0.15 0.02 -0.14 0.29 0.10 -0.19 -16% 0.32 0.27 -0.05 0.17 0.26 0.09 1.13 to 1.21 1.1 to 1.2
Grade 2 27 9 0.19 -0.20 -0.39 0.34 0.10 -0.24 -15% 0.44 0.30 -0.14 0.25 0.50 0.25 1.6 to 1.69 1.6 to 1.69
Grade 3 75 35 0.06 0.02 -0.04 0.23 0.14 -0.09 -6% 0.42 0.27 -0.16 0.36 0.24 -0.12 1.32 to 1.43 1.32 to 1.42
Grade 4 10 21 0.17 0.02 -0.15 0.48 0.14 -0.35 -31% 0.93 0.46 -0.48 0.76 0.44 -0.33 1.06 to 1.14 1.08 to 1.13
ADT
4000
-10
000
ADT
1000
0-20
000
Inter Quartile RangeCount Design Rate Range50th Percentile25th Percentile 75th Percentile
ADT
100-
500
ADT
500-
2000
ADT
2000
-40
00

3 RAMM database analysis
23
Figure 3.10 Application rate differences by traffic volume
0
10
20
30
40
50
60
70
-1.5
-1
-0.5
0
0.5
1
1.5
CutbackBitumen
Emulsion CutbackBitumen
Emulsion CutbackBitumen
Emulsion
Grade 2 Grade 3 Grade 4
Num
ber o
f Sam
ple
Seal
s (#
)
Appl
icat
ion
Rate
Diff
eren
ce (l
/m2)
Application Rate Difference (Actual - Design) By Largest Chip Grade Traffic: ADT 100-500
Min/Max # Seals
0
50
100
150
200
250
300
350
400
450
-1.5
-1
-0.5
0
0.5
1
1.5
CutbackBitumen
Emulsion CutbackBitumen
Emulsion CutbackBitumen
Emulsion
Grade 2 Grade 3 Grade 4
Num
ber o
f Sam
ple
Seal
s (#
)
Appl
icat
ion
Rate
Diff
eren
ce (l
/m2)
)
Application Rate Difference (Actual - Design) By Largest Chip Grade Traffic: ADT 500-2000
Min/Max # Seals

Reduced bitumen application rates using bitumen emulsions
24
0
50
100
150
200
250
-1.5
-1
-0.5
0
0.5
1
1.5
CutbackBitumen
Emulsion CutbackBitumen
Emulsion CutbackBitumen
Emulsion
Grade 2 Grade 3 Grade 4
Num
ber o
f Sam
ple
Seal
s (#
)
Appl
icat
ion
Rate
Diff
eren
ce (l
/m2)
Application Rate Difference (Actual - Design) By Largest Chip Grade Traffic: ADT 2000-4000
Min/Max # Seals
020406080100120140160180200
-1.5
-1
-0.5
0
0.5
1
1.5
CutbackBitumen
Emulsion CutbackBitumen
Emulsion CutbackBitumen
Emulsion
Grade 2 Grade 3 Grade 4
Num
ber o
f Sam
ple
Seal
s (#
)
Appl
icat
ion
Rate
Diff
eren
ce (l
/m2)
Application Rate Difference (Actual - Design) By Largest Chip Grade Traffic: ADT 4000-10000
Min/Max # Seals
3 RAMM database analysis
25
3.4 Achieved lives
To assess the achieved lives of a surface we had to look at surfaces which had reached the end of life or
had been sealed over, ie expired.
Emulsions have been widely used in New Zealand for approximately the past 10 years, at least with regard
to the data contained in RAMM. It seems also that the majority of the emulsion seals in New Zealand still
exist as top surfaces and have not yet reached their ‘end of life’.
3.4.1 Identify whether emulsions fail at a different rate than cutback bitumen seals.
This analysis was carried out using the full national dataset including 1CHIP, 2CHIP and RACK seal types,
both top surface layer and one layer under top surface and all binder types including PMB and EPM.
The dataset was split into three core groups:
1 Failed early: surfaces that failed prior to reaching their expected lives.
2 Achieved life: surfaces that were resealed after they had reached or exceeded their expected lives.
3 Yet to fail: surfaces that have yet to fail or be sealed over (top surface layer).
Each of the three groups was split into cutback bitumen and emulsion.
The analysis compared the percentage application rate differential ((actual – design)/design) of each
group. The range of recorded application rate data was from 50% below design through to 50% above
design at 10% increments. The charts in figure 3.11 show the distributions of the analysis. The blue bars
represent binder application rates below design and green bars represent rates above design.
The data suggests that over 70% of all the emulsion seals one layer under the current top surface failed
early, without the specific failure mode being expressed. That compares with just under 50% of the
0
10
20
30
40
50
60
70
80
-1.5
-1
-0.5
0
0.5
1
1.5
CutbackBitumen
Emulsion CutbackBitumen
Emulsion CutbackBitumen
Emulsion
Grade 2 Grade 3 Grade 4
Num
ber o
f Sam
ple
Seal
s (#
)
Appl
icat
ion
Rate
Diff
eren
ce (l
/m2)
Application Rate Difference (Actual - Design) By Largest Chip Grade Traffic: ADT 10000-20000
Min/Max # Seals

Reduced bitumen application rates using bitumen emulsions
26
equivalent cutback bitumen seals. If the emulsion seals behave similarly to the cutback seals, one would
expect this figure to sit around 50% once the dataset reaches a steady state (ie a normal distribution). This
aligns with the earlier conclusion that the emulsion dataset has not yet reached steady state and therefore
results are not yet fully reliable.
However, it is evident that the percentage of surfaces with application rates below design (blue bars) is
higher in seals that are failing early than those achieving their expected lives, for both cutback bitumen
and emulsion seals. Interestingly, the application rates of the ‘failed early’ group and ‘yet to fail with life
remaining’ group are quite similar. Very few (<9%) emulsion seals, whether sealed over or still in service,
have met their expected lives compared with approximately one-third (33%) of the cutback bitumen seals.

3 RAMM database analysis
27
Figure 3.11 National binder application rates by binder type
In conclusion:
• The dataset of emulsion seals that have been sealed over is very small, so the expected distribution of
50% seal failure may not have reached a steady state because we currently have over 70% of these
seals failing early. It is therefore difficult to draw a conclusion that is firm about the seal failure rates
from the available data.
• Cutback bitumen and emulsion seals are more likely to fail early if the binder application rate is low.
16% and 27% of cutback bitumen and emulsion seals respectively that failed early, had an application
rate of less than design compared with only 3% and 7% with an application rate below design that met
or exceeded expected life.
0%10%20%30%40%50%60%70%80%90%
100%
cut bit emul cut bit emul cut bit emul cut bit emul
Failed Early Achieved Life Life Remaining Achieved Life
One Layer Under (Failed and Resealed) Top Surface (Yet to Fail)
% o
f Sea
ls
National Binder Application Rate (% Difference from Design) by Binder Type
-50% -40% -30% -20% -10% 0% 10% 20% 30% 40% 50%
02468
101214
cut bit emul cut bit emul cut bit emul cut bit emul
Failed Early Achieved Life Life Remaining Achieved Life
One Layer Under (Failed and Resealed) Top Surface (Yet to Fail)
Seal
ed A
rea
(Milli
on m
2)
National Binder Application Rate (% Difference from Design) by Binder Type
-50% -40% -30% -20% -10% 0% 10% 20% 30% 40% 50%

Reduced bitumen application rates using bitumen emulsions
28
The following charts show the current status (in terms of failed early, achieved life and yet to fail) split by
emulsion and cutback bitumen:
Figure 3.12 Status of seals by surface year 2000–2013
All surfaces in the dataset (1CHIP, 2CHIP, RACK excluding first-coat) seals
All surfaces in datasets including polymer-modified seals
All surfaces in datasets excluding polymer-modified seals
0
1000000
2000000
3000000
4000000
5000000
6000000
7000000
2000 2001 2002 2003 2004 2005 2006 2007 2008 2009 2010 2011 2012 2013
Surf
ace
Area
(m2)
Surface Year
Cutback Bitumen Current Status of Seals by Surface Year
Achieved Life Failed Early Yet To Fail
0%
10%
20%
30%
40%
50%
60%
70%
80%
90%
100%
2000 2001 2002 2003 2004 2005 2006 2007 2008 2009 2010 2011 2012 2013
Perc
enta
ge T
otal
)Surface Year
Cutback Bitumen Current Status of Seals by Surface Year
Achieved Life Failed Early Yet To Fail
0
1000000
2000000
3000000
4000000
5000000
6000000
7000000
2000 2001 2002 2003 2004 2005 2006 2007 2008 2009 2010 2011 2012 2013
Surf
ace
Area
(m2)
Surface Year
Cutback Bitumen Current Status of Seals by Surface Yearexcl PMB
b_Achieved Life b_Failed Early b_Yet To Fail
0%
10%
20%
30%
40%
50%
60%
70%
80%
90%
100%
2000 2001 2002 2003 2004 2005 2006 2007 2008 2009 2010 2011 2012 2013
Perc
enta
ge T
otal
)
Surface Year
Cutback Bitumen Current Status of Seals by Surface Year excl PMB
b_Achieved Life b_Failed Early b_Yet To Fail
0
200000
400000
600000
800000
1000000
1200000
1400000
1600000
1800000
2000000
2000 2001 2002 2003 2004 2005 2006 2007 2008 2009 2010 2011 2012 2013
Surf
ace
Area
(m2)
Surface Year
Emulsions Current Status of Seals by Surface Year
Achieved Life Failed Early Yet To Fail
0%
10%
20%
30%
40%
50%
60%
70%
80%
90%
100%
2000 2001 2002 2003 2004 2005 2006 2007 2008 2009 2010 2011 2012 2013
Perc
enta
ge T
otal
)
Surface Year
Emulsions Current Status of Seals by Surface Year
Achieved Life Failed Early Yet To Fail

3 RAMM database analysis
29
Figure 3.13 Status of seals by surface year 2005
Figure 3.13 shows all seals surfaced in 2005 with the percentage in each group. Distributions are fairly
similar across all groups.
3.4.1.1 Significance test (z-test two sample means)
Table 3.6 shows results for a full dataset z-test of sample means, comparing the percentage of life
remaining at the time of reseal for two samples: cutback bitumen seals failing early and emulsion seals
failing early. These included PMB and PME. The full dataset analysed together suggests that the means are
in fact significantly different. However, when analysed by surface year (much smaller samples) no year
produced a result with significantly different means.
Table 3.6 Sample mean significant tests
Scenario 1 Mean % life remaining at failure Significant?
Cutback bitumen Emulsion z
2000 40% 34% 1.75 two samples the same
2001 35% 40% -1.54 two samples the same
2002 37% 42% -1.12 two samples the same
2003 43% 47% -1.33 two samples the same
2004 47% 48% -0.22 two samples the same
2005 49% 49% -0.22 two samples the same
2006 55% 60% -1.91 two samples the same
2007 63% 68% -1.72 two samples the same
2008 72% 71% 0.12 two samples the same
0%
10%
20%
30%
40%
50%
60%
70%
80%
90%
100%
Cutback Bitumen All Cutback Bitumen ExPMB
Emulsion All Emulsion Ex EBM
Perc
enta
ge T
otal
Scenario and Binder Type
Current Status of Seals Surfaced in 2005
Achieved Life Failed Early Yet To Fail

Reduced bitumen application rates using bitumen emulsions
30
Scenario 1 Mean % life remaining at failure Significant?
Cutback bitumen Emulsion z
2009 77% 76% 0.12 two samples the same
2010 84% 82% 0.85 two samples the same
2011 88% 86% 1.06 two samples the same
2000–2013 52% 57% -5.24 significantly different
We concluded that we had not yet reached a steady state of expired emulsion seals and therefore could
not assess the achieved lives of emulsion seals.
3.5 Application rates
The application rate was assessed by comparing the actual application rate as recorded in RAMM with the
most recent design application rate presented in Transit NZ et al (2005) (it should perhaps be noted that
this algorithm might not necessarily be recommended by the industry):
• A number of assumptions were made to define a comparable sample of emulsion and cutback
bitumen surfaces (see section 3.3.1).
• Based on median, 25th and 75th percentile values, all sample groups supported the hypothesis that
emulsions were applied at a lower rate than cutback bitumen. When the full sample was compared,
and we assumed that the application rates were correct, the mean application rate for:
– emulsion was 4.6% higher than design,
– cutback bitumen was 8.3% higher than design.
• Statistical tests (f test and z-test) indicated this difference in means was significant.
• Significant outliers in actual vs design application rate differential led to concerns over the reliability
of RAMM application rate data. Many RAMM recorded application rates appeared to be unrealistic in a
practical sense. There was no identifiable trend in the outlying data so we were unable to identify and
remove statistically relevant outliers.
We can confirm that within the data sample analysed, emulsion seals had, in general, been applied at
lower rates than cutback bitumen. However, we were concerned about the reliability of the RAMM
application rate data for both cutback bitumen and emulsion seals and suggested that until data quality
improved we should not draw any firm conclusions.
3.6 Recommendations
• Continue to improve RAMM data quality. Ensure automated checks are in place to flag any application
rates entered in RAMM which fall outside a defined design application rate tolerance.
• Re-analyse data once expired emulsion seals have reached a steady state to test whether they are
meeting expected lives.
• Interestingly, following the conclusion of this analysis another independent RAMM analysis on a
similar research question was released by the Transport Agency (Wanty 2014). The overall conclusions
regarding the ability to use the RAMM data, as it stands at the present time, to make statements about
emulsion seal lifetimes were fundamentally the same as those obtained here.

4 Experimental
31
4 Experimental
4.1 Introduction
The experimental section of this project focused on determining the differences in apparent cohesive
energy (ACE) within the bitumen films of model chipseal samples, as measured by a swinging pendulum
‘knock-off’ test (figure 4.1). The pendulum test is a development of the Vialit Pendulum test and has been
used previously by Opus Research (Herrington et al 2011) to determine the ACE within chipseal layers
prepared with multigrade bitumen binders. This work compared the ACE values of chipseal samples
prepared with emulsions, the base binders and cutback base binders. Inferences were then made
regarding the relative performances of the three different types of binder application in the field.
Figure 4.1 Opus Research pendulum tester with chipseal sample in place
4.2 Materials and sample preparation
The chipseal samples tested were prepared using 10/20 ‘Grade 3’ crushed greywacke chip supplied by
Kiwi Point Quarry, Wellington, New Zealand. The as-supplied chip was sieved (passing 13.2, retained on
9.5mm), washed well with water, dried at approximately 120oC overnight and stored until required.
Two non-polymer modified cationic bitumen emulsions and the base binders from which they were
prepared, were obtained. Emulsion A was a cationic emulsion, with no additional modifiers, prepared from
a 180/200 base at a concentration of 70.8% w/w. Emulsion B was a cationic emulsion, with no additional

Reduced bitumen application rates using bitumen emulsions
32
modifiers, prepared from a 130/150 base bitumen at a concentration of 72% w/w (values as provided by
suppliers). Emulsion B was much more viscous and thixotropic than Emulsion A. Both of the emulsion
samples were used as supplied, and all masses were calculated so as to apply a given rate of residual
bitumen. Emulsions and the base binders were used as supplied, except for the cutback experiments
where the base binders were mixed or ‘cutback’ with kerosene to a level of 2pph by mass, immediately
prior to use so as to avoid evaporation of the cutter.
Aluminium square extrusion (30 x 30 x 100mm x 1.5mm wall) for the knock off towers was sourced from
Ulrich Aluminium, Petone. Construction epoxy for attaching towers, Sikadur 31, was sourced from Sika
(New Zealand). The pendulum tester (figure 4.1) and steel sample plates which raised walls to create
shallow sample wells of 120 x 130 x 4mm (surface area = 0.016m2), were all fabricated in-house
(figure 4.2).
4.3 Pendulum knock-off test – preparation
Model chipseal samples were prepared on the sample plates using the different bitumen materials. The
base binders were heated for two to three hours at 120oC in order to flow evenly across the hot sample
plates, which were also heated to 120oC. Emulsions and sample plates on the other hand, were heated to
80oC. In order to be confident that the base bitumen had not hardened significantly during the heating,
the penetration values of the two base binder samples after being heated for an additional 3.5 hours were
measured. The penetration values were found to be within the standard error of the technique, ie those of
the original specification. This indicated that the extent of heating in this experiment had not significantly
hardened the base bitumen.
A layer of bitumen, emulsion or cutback at one of two different residual bitumen application rates was
formed by pouring the appropriate mass (as determined by the desired application rate) of hot binder
onto the sample plates. These were left standing for a few minutes to level out. The sample plates were
still warm (approximately 40oC) at the point of adding the chip. The base binder still flowed slowly and the
emulsions had not broken. A known mass of the Grade 3 chip was then spread onto the bitumen layer by
hand and rolled in with a 5cm wide rubber printers’ roller. This ensured good chip spreading and lay-down
of the individual chips ensuring as much binder coverage as possible (figure 4.2). The emulsions were still
not fully ‘broken’ at this point. Six (6) replicate sample plates of each base binder, emulsion and cutback
bitumen were prepared at 1.5Lm-2 and 1.93Lm-2 bitumen application rate (BAR) or EAR (as residual
bitumen) coverage and 14.4kgm-2 AAR.
Figure 4.2 Chipseal plate sample

4 Experimental
33
Figure 4.3 Chipseal plate with tower attached and after knock-off
The sample plates were covered with as many chips as possible to completely cover the bitumen layer.
The purpose of the experiment was to test the cohesion of the bitumen layer via a chipseal (bitumen/chip)
interface. We did not want any opportunity to arise for the knock-off tower to become bound directly to
the bitumen layer.
In the samples prepared with emulsions, the chips drew water out of the emulsions very rapidly. This wet
the upper chip surfaces visibly and thereby created an effective drying surface for the emulsions. This
‘wicking’ of the water out of the emulsion via capillary action, meant that water loss and emulsion
breakage was not controlled solely by evaporation directly out of the uncovered emulsion film surfaces.
The wicking phenomenon may prove to be relevant to chip adhesion and also to the mechanisms of
emulsion breakage in other mineral chip systems, where the chips are not as hydrophilic or as porous as
greywacke systems (eg granite). This phenomenon contributes to, but is not the same, as the meniscus
effect which describes the chip surface coverage achieved by the emulsion binders.
Emulsion samples were then ‘cured’ in a vented, temperature controlled oven at 35oC over 48 hours to
allow the emulsions to break, and for as much water as possible to evaporate from the emulsion in a
manageable time. Cutback samples were subjected to the same conditions even though they did not need
‘curing’ as such but did require evaporation of some of the kerosene cutter. In the interests of comparison
and to simulate any bitumen oxidation that might occur during this treatment, the base-binder samples
were also subjected to the same conditions.
After ‘curing’ for 48 hours at 35oC, the aluminium knock-off towers were attached to the upper surface of each
chipseal sample using a strong construction epoxy filler (figure 4.3). Approximately the same mass of the
epoxy filler was spread over the same defined area of each plate so as to contact as many and as much of the
chip upper surface as possible in that defined area and to make the mass knocked off each sample as close as
possible. The area of the epoxy was determined to produce reliable knock-off results in previous experiments
(Herrington et al 2011). The epoxy was then allowed to cure at 35oC over a further 48 hours.
In order for the pendulum to knock out the tower, we needed to reduce the actual bitumen cohesion, so
prior to testing all samples were heated to 60oC for 4 hours (noting that this could also allow additional
water/kerosene to evaporate from the sample). Each sample plate was fixed into the pendulum device,
separated from the steel structure by a wood insulating plate, so that the test was performed as close to
60oC as possible. The pendulum was then raised to a constant height (90o from vertical) and released. The

Reduced bitumen application rates using bitumen emulsions
34
‘tower’ was knocked out of the chipseal using a single blow of the pendulum so that it carried the section
of the chipseal (tower/epoxy/chip/bitumen) with it (figure 4.3). The extent of travel of the pendulum
following knock-off was determined by an electronic potentiometer that displayed the value of the
maximum swing height for each swing and was recorded. The speed of the head of the pendulum just
before impact was 3.9ms-1 (14km/h-1), imparting an energy pulse of approximately 20J. Mechanical and air
friction losses were considered to be negligible in this work.
The tower with the attached epoxy/chipseal was then placed back onto the plate with two sheets of tissue
paper separating the tower from the plate, to prevent any adhesion between the bitumen surfaces. It was
subjected to a second blow from the pendulum, recording the swing value achieved after this. In this way
we measured the energy required to dislodge the mass contained in the tower/epoxy/chips/binder sample
but not resisted by the cohesion of the binder. The difference between the two blows was defined as the
ACE of the bitumen layer.
Figure 4.4 Water loss from emulsion chipseals at 35oC and 60oC

4 Experimental
35
At this time, a selection of emulsion chipseal samples was prepared in order to monitor their weight loss
over time so that we might understand how much water remained trapped in the bitumen after
curing/aging for several days at 35º and 60oC. The data (figure 4.4) showed very rapid early loss of water
followed by slow continued water loss over the next 48 hours, with the rate reducing even further over
longer time. We observed approximately 100% water loss from the emulsion A at 35oC, while interestingly
at 60oC, the weight loss was slightly lower. However, the weight loss from emulsion B was only between
73% and 78% of the theoretical maximum and the differences between 35º and 60oC were much smaller
than emulsion A. The reasons why emulsion B retained some water were not clear but the physical forms
of the two emulsions were different and may have had bearing on the water loss. The samples were also
placed into hot ovens rather than having the temperatures raised slowly. This may have caused surface
skinning which could have resulted in restricted water loss in the higher temperature experiments, but
both emulsions were treated in the same way.
The length of time taken to pre-treat our samples corresponded approximately to the time required to
reach virtual maximum water loss (approximately 100 hours) for emulsion A. We did not measure directly
the kerosene that was lost from the cutback samples. In practice emulsion seals are expected to carry
traffic after only a few hours or less after construction so that the water content of the seal may well be
greater than that remaining in the test seals after the curing process used here.
4.4 Pendulum knock-off test – verification
The experimental method was then tested for consistency and reproducibility with four replicates of
samples of a stock cationic bitumen emulsion (approx 70% w/w) at EARs of: 0.5, 1.0, 1.25, 1.5, 2.0 and
3.0Lm-2 and constant AAR of 14.4kg m-2. Our initial testing of the experiment produced consistent results
between the replicates with an acceptable 12 ± 3% variation for each of the application rates tested. The
experiment also demonstrated reasonable trends of increasing mean ACE with increasing application rate
up to a level where one might reasonably expect the ACE to not significantly increase further (figure 4.5).
We were therefore able to be confident that the test procedure would be suitable to provide us with results
from which we could draw fair conclusions about this aspect of the chipseal system.
Figure 4.5 Verification of pendulum test. Graph shows mean values of untextured steel plate samples (blue)
and mean of the Grade 5 plate data (red)
050
010
0015
00
0.5 1 1.25 1.5 2 3
Mean difference
G3 chip on G5 plate
Bitumen emulsion application rate / L/m2
Mea
n pe
ndul
um sw
ing
diffe
renc
e

Reduced bitumen application rates using bitumen emulsions
36
A group of samples was also prepared where a layer of Grade 5 chips was epoxied onto the surface of the
steel sample plates in order to produce a textured surface. We then prepared the Grade 3 chipseal, at 1.5
Lm-2 only, on top of the Grade 5 layer in the same manner as the other samples. We could see that the ACE
value of the sample prepared on the Grade 5 chip surface was significantly lower than the values obtained
from chipseals prepared directly on the steel plate surface and the spread was somewhat greater.
Examination of the post-test sample indicated this was due to a significant reduction in Grade 3
chip/bitumen contact due to the chips not all sitting into the bitumen wells formed in the Grade 5 chip
base. We decided at that point not to continue testing this type of sample and to focus only on the
samples prepared directly on the steel surface. But this result makes it very clear how the texture of a
given road surface plays an important role in the design of subsequent surfaces.
4.5 Theory of pendulum test
Although it was not necessary to calculate the actual cohesive energies of the bitumen films (we were only
interested in the differences in behaviours), we present below the theoretical background of the test. At
the point of impact, the swinging pendulum loses energy through dis-bonding and ‘knocking out’ the seal
patch. The remaining kinetic energy in the pendulum is converted to potential energy as it rises to its
maximum height and swings past the knocked out sample. The potential energy at that point is given by
equation 4.1:
U = mgL(1 – cosθ) + ½m'gL(1 – cosθ) (Equation 4.1)
Where:
• U = the potential energy (J)
• θ = the angle the pendulum rises from the vertical position after impact (rad)
• m = the mass of the pendulum bob (1.53kg)
• m’ = the mass of the pendulum shaft (2.04kg)
• L = the length of the pendulum shaft (0.783m)
• g = acceleration due to gravity (9.81m/s).
The maximum potential energy of the pendulum attained after impacting the bonded stud was subtracted
from that of the respective ‘unbonded’ test to give the energy absorbed by the seal (equation 4.2). We
make the assumption that masses of the samples displaced are all approximately equal, or at least within
the experimental uncertainty, given the construction technique.
ΔU = mgL(cosθ – cos θt) + ½m'gL(cosθ – cos θt) (Equation 4.2)
Where:
• ΔU = the energy absorbed by the seal (J)
• θ = the angle to which the pendulum rises from the vertical position after impacting the unbound stud
(rad)
• θt = the angle to which the pendulum rises from the vertical position after impacting the bound stud
(rad).
In this way therefore, the energy lost by the swinging pendulum equals the energy required to remove the
seal patch. In all cases the failure as the patch was removed from the sample was inside the bitumen film
4 Experimental
37
and not at the chip/bitumen or the bitumen/plate interfaces. We are therefore confident that the energy
lost by the pendulum equates to the apparent cohesive energy of the bitumen film.
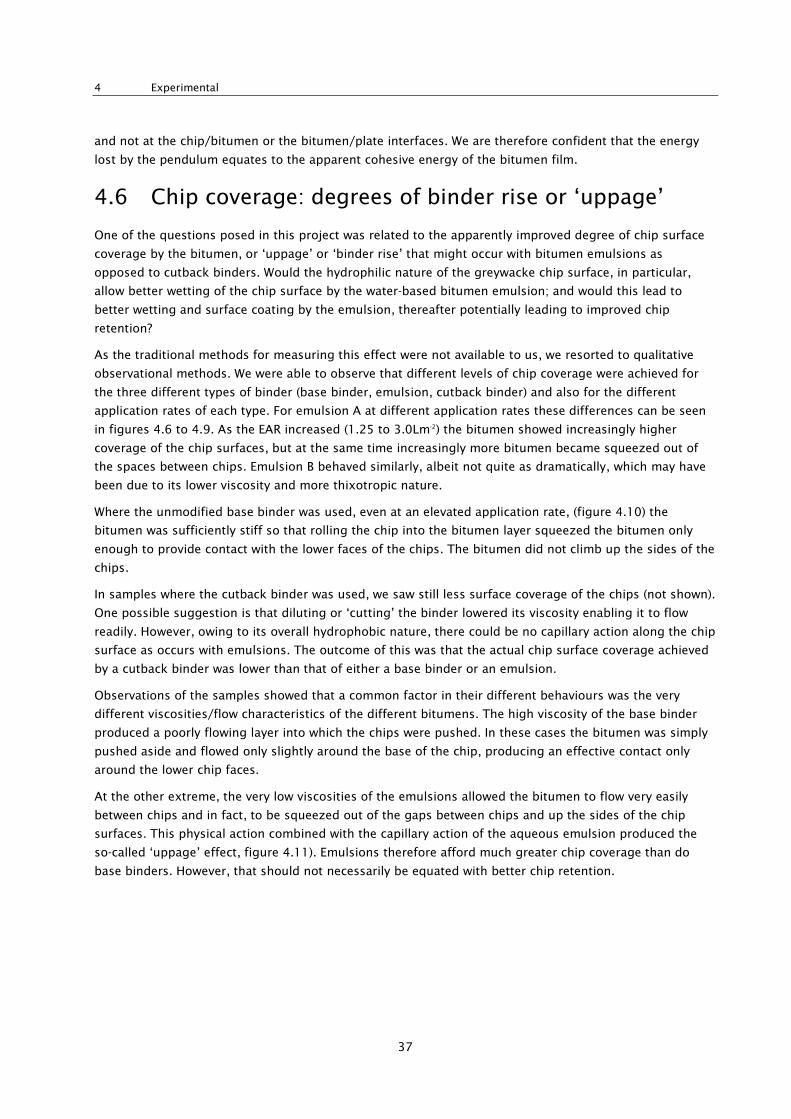
4.6 Chip coverage: degrees of binder rise or ‘uppage’
One of the questions posed in this project was related to the apparently improved degree of chip surface
coverage by the bitumen, or ‘uppage’ or ‘binder rise’ that might occur with bitumen emulsions as
opposed to cutback binders. Would the hydrophilic nature of the greywacke chip surface, in particular,
allow better wetting of the chip surface by the water-based bitumen emulsion; and would this lead to
better wetting and surface coating by the emulsion, thereafter potentially leading to improved chip
retention?
As the traditional methods for measuring this effect were not available to us, we resorted to qualitative
observational methods. We were able to observe that different levels of chip coverage were achieved for
the three different types of binder (base binder, emulsion, cutback binder) and also for the different
application rates of each type. For emulsion A at different application rates these differences can be seen
in figures 4.6 to 4.9. As the EAR increased (1.25 to 3.0Lm-2) the bitumen showed increasingly higher
coverage of the chip surfaces, but at the same time increasingly more bitumen became squeezed out of
the spaces between chips. Emulsion B behaved similarly, albeit not quite as dramatically, which may have
been due to its lower viscosity and more thixotropic nature.
Where the unmodified base binder was used, even at an elevated application rate, (figure 4.10) the
bitumen was sufficiently stiff so that rolling the chip into the bitumen layer squeezed the bitumen only
enough to provide contact with the lower faces of the chips. The bitumen did not climb up the sides of the
chips.
In samples where the cutback binder was used, we saw still less surface coverage of the chips (not shown).
One possible suggestion is that diluting or ‘cutting’ the binder lowered its viscosity enabling it to flow
readily. However, owing to its overall hydrophobic nature, there could be no capillary action along the chip
surface as occurs with emulsions. The outcome of this was that the actual chip surface coverage achieved
by a cutback binder was lower than that of either a base binder or an emulsion.
Observations of the samples showed that a common factor in their different behaviours was the very
different viscosities/flow characteristics of the different bitumens. The high viscosity of the base binder
produced a poorly flowing layer into which the chips were pushed. In these cases the bitumen was simply
pushed aside and flowed only slightly around the base of the chip, producing an effective contact only
around the lower chip faces.
At the other extreme, the very low viscosities of the emulsions allowed the bitumen to flow very easily
between chips and in fact, to be squeezed out of the gaps between chips and up the sides of the chip
surfaces. This physical action combined with the capillary action of the aqueous emulsion produced the
so-called ‘uppage’ effect, figure 4.11). Emulsions therefore afford much greater chip coverage than do
base binders. However, that should not necessarily be equated with better chip retention.

Reduced bitumen application rates using bitumen emulsions
38
Figure 4.6 1.25Lm-2 emulsion A, Grade 3 chip Figure 4.7 1.5Lm-2 emulsion A, Grade 3 chip
Figure 4.8 1.93Lm-2 emulsion A, Grade 3 chip Figure 4.9 3.0Lm-2 emulsion A, Grade 3 chip
Figure 4.10 1.93Lm-2 bitumen base binder A, Grade 3 chip

4 Experimental
39
Figure 4.11 Schematic diagram of suggested modes of bitumen/chip interaction: A) Base binder, high raised
shoulders; B) Emulsion, capillary-induced surface coverage; C) Cutback binder, flow-induced low shoulders
The diluted cutback bitumen on the other hand, appeared to have a viscosity that was low enough to allow
it to flow more than the base binder, but not as much as the emulsified binder. Because the cutback
remained hydrophobic it did not exhibit capillary action around the chip surface and did not flow up the
chip surfaces. This means that the cutback bitumen flowed enough to level out after the chip was
embedded into the bitumen and therefore offered the least chip surface coverage.
While the higher chip coverage for emulsions might improve the chip retention outcome, it might be just
as likely to result in a thinner base film as the emulsion covered the chip surfaces, and was squeezed out
from under the chips. This might possibly manifest as a lower ACE. If the application rate was too high the
squeezing of the bitumen might also lead to tracking and flushing of the bitumen at elevated
temperatures in service. It seemed likely from these observations that the lower chip coverage observed
for the cutback binder would lead to lower ACE values.
A
B
C
Reduced bitumen application rates using bitumen emulsions
40
4.7 Apparent cohesive energy tests (ACE) – pendulum knock off
Following the verification of the test procedure, samples were prepared with the bitumen base binders,
emulsions and cutbacks supplied by our two local manufacturers (see for example figure 4.12). If the ACE
values for the different bitumen application types were statistically different, that would allow us to
suggest that either higher or lower application rates of emulsion over cutbacks might be applicable. While
our experiment did not directly measure an actual road surface, suitable inferences regarding the relative
performances in the field could be made.
We can summarise the results qualitatively here and quantitatively in table 4.1 and figure 4.13:
• The higher application rate of any type of bitumen had higher ACE than the lower application rate. The
ACE differences between application rates for the emulsions were smaller than those observed for the
cutbacks and base binders.
• Cutback bitumens had the lowest ACE, about 35%–65% of base binder.
• Emulsions had intermediate ACE values.
• Base binders had the highest ACE values.
• All samples exhibited good chip/bitumen and plate/bitumen adhesion, ie the failure was entirely
cohesive in nature.
• The differences between the lowest (cutback) and highest (base binder) ACE values were greater at the
higher application rate.
• The differences in ACE between cutback and emulsion were smaller than those between emulsions
and base binder.
• Lower application rates of any type of bitumen (1.5Lm-2 vs 1.93Lm-2) produced less variation between
ACE results.
For each of the groups of results, at each application rate, an analysis of variance (ANOVA) test was
conducted. The results showed, in each case, that the difference between the means of the cutback,
emulsion and base binder pendulum tests were statistically significant at the 1% probability level.
The key finding from these experiments therefore, is that at the same residual bitumen application rate,
(1.5Lm-2 and 1.93Lm-2 tested here), emulsion seals had lower ACE than pure base binder seals, but higher
ACE than cutback binder seals.

4 Experimental
41
Figure 4.12 1.5L/m2 G3 on plate binder A 180/200 base binder
Table 4.1 Mean ACE values (±95% CL) from pendulum experiments
Binder type Residual bitumen application rate
1.5Lm-2 1.93Lm-2
Binder A cutback 656 ±110 727±170
Emulsion A 810±107 812±175
Base binder A
(180/200 PEN)
1066±137 1310±149
Binder B cutback 759±40 991±100
Emulsion B 1022±192 1141±89
Base binder B
(130/150 PEN)
1231±161 1492±136
Figure 4.13 Mean ACE values (±95% CL) from pendulum experiments
0
200
400
600
800
1000
1200
1400
1600
1 2 3 4 5 6
Pend
ulum
swin
g he
ight
di
ffere
nce
Sample number
1.5 L/m2 G3 on plate Binder A cutback 2pph
0
200
400
600
800
1000
1200
1400
1600
1800
Binder Acutback
Emulsion A Base binder A Binder Bcutback
Emulsion B Base binder B
Mea
n AC
E va
lues
Binder types
Mean ACE values (±95% CL)
1.5 1.93

Reduced bitumen application rates using bitumen emulsions
42
5 Conclusions, specifications and recommendations
A review of available literature did not provide any clear indications that applying bitumen emulsions at
lower residual rates than cutback bitumens would be acceptable.
Analysis of the Transport Agency’s RAMM database tentatively indicated that bitumen emulsions are, in
practice in New Zealand, being applied at residual bitumen rates lower than those of cutback bitumens.
However, RAMM also suggested that road surfaces prepared with bitumen emulsions are not yet
sufficiently old enough to indicate, with confidence, if they are failing prematurely or performing
adequately. We suggest therefore, that no firm conclusions about emulsion seal lives may be drawn
currently from the RAMM database analysis. The analysis should be revisited after another few years of
road use.
Laboratory pendulum knock-off experiments demonstrated that the differences in ACE values of model
chipseals were statistically significantly depending on the type of binder. The test is also sufficiently
sensitive to differentiate between the 180/200 bitumen and the slightly ‘stiffer’ 130/150 bitumen
provided by our suppliers. Observed cohesive energies of the cutback binders were 15%–20% lower than
the emulsified binders. The cohesive energies of the emulsions were 20%–30% lower than those of the
base binders.
The implication is therefore, that if all other aspects are equal and they are applied at the same rates, the
cohesion of a bitumen chipseal may be improved through using an emulsion compared with a cutback
bitumen, but that both will be inferior to the unmodified base binder. This finding is not unexpected in
the case of the cutback seals as previous research has shown that about 20% of the added kerosene
remains permanently in the binder and does not evaporate, resulting in a softer binder than the original
(Herrington et al 2006). In the case of the emulsified seal, however, it has generally been assumed that the
bitumen properties after evaporation of the water will be essentially those of the base binder. The results
presented here show that this might not be the case.
The reduced cohesion of the emulsified bitumen over that of the base binders does not appear to be
related simply to water retained in the emulsion seals because the differences between the base binder
and emulsion seals are about the same in both cases although much more water was retained in emulsion
A compared with emulsion B.
Observations of increased ‘uppage’ or binder rise when the bitumen is applied as an emulsion might
suggest that emulsions could exhibit greater propensity for bitumen tracking or flushing at higher
application rates (>1.5Lm-2). At the same time, the cutback bitumens appeared to have lower chip coverage
than both emulsions and base binders, which may have contributed to their low ACE values.
5.1 Specification of emulsion chipseal application rate
The suggestions for implementation or specification of emulsion use to be drawn from this work require
making assumptions about current chipseal performance. In practice, in the field, cutback bitumens such
as those used here generally provide adequate seal performance in terms of chip retention. If a reasonable
assumption is made that the ACE values measured here reflect the relative ranking likely to be found in
the field, then it should be concluded that the higher ACE values provided by emulsions will allow lower
EARs to be used until ACE values equal to those of the cutback bitumens are reached. This of course is
only the case if the emulsified bitumen is not itself cut back.

5 Conclusions, specifications and recommendations
43
Verification of the conclusions drawn here will necessitate the construction and long-term monitoring of
new road field trials where different emulsion, cutback and base-binder application rates can be trialled
over an appropriate time scale. The trial must include at least one winter and of course will need to
include sections where we will observe seal failure in order to establish the bounds of the specification.
A preliminary conclusion can be reached from analysis of the ACE values measured on model chipseal
samples. If it is assumed that the model ACE values are representative of those observed in real chipseals
then it may be possible to apply bitumen emulsions at lower residual bitumen application rates than an
equivalent cutback bitumen and achieve the same ACE. This reduction would be about 10%–15% as
residual bitumen. This value is consistent with the anecdotal evidence that has been provided by users
and contractors who have suggested that emulsions can, or indeed are, being applied at rates between
10%–15% lower than cutbacks.
5.2 Recommendations for further research
It is clear from the results of this investigation that the laboratory based experiments provide insight into
the nature of the cohesive behaviour in the chipseal layer, but that they may not provide insight into the
cohesive behaviour in the field.
We note also that there are some gaps in the experiments that could not be filled in this particular
investigation. We recommend therefore that additional experiments be undertaken to take into account
the addition of both solid phase and solution phase adhesion agents. It would also be advantageous to
repeat the experimental set with emulsions prepared from the same grade of base binder from the two
different sources (ie have the Binder B supplier prepare emulsion from a 180/200 binder). Most
importantly, however, will be to test the contention that chipseals can be successfully prepared with lower
emulsion application rates by preparing and monitoring field trial test seals. These trials will need to
include seal sections that will unambiguously fail and sections that are based on current best practice and
hence less likely to fail, along with sections prepared with different application rates of both emulsion and
cut-back binder. Monitoring of the sections will need to continue through at least one winter season,
preferably two or more.
Reduced bitumen application rates using bitumen emulsions
44
6 References
Ball, GFA (2005) Implications of increased emulsion sealing on state highways. Central Laboratories report
05-521095.00, Wellington: Opus International Consultants.
Gransberg, D and DMB James (2005). Chip seal best practices. A synthesis of highway practice. National
cooperative highway research program, NCHRP synthesis 342.
Gransberg, D (2009) Comparing hot asphalt concrete cement and emulsion chipseal binder performance
using macrotexture measurements, qualitative ratings and economic analysis. Paper TRB 09-0411
presented at the Transportation Research Board 88th Annual Meeting, Washington, DC, 14 January
2009.
Herrington, PR, M Gribble and G Bentley (2011) Multigrade bitumen for chipsealing applications. NZ
Transport Agency research report 460.
Johannes, PT, E Mahmoud and H Bahia (2011) Sensitivity of ASTM D7000 Sweep test to emulsion
application rate and aggregate gradation. Transportation Research Record 2235, Journal of the
Transportation Research Board 95.
Lee, JS and YR Kim (2008) Understanding the effects of aggregate and emulsion application rates on
performance of asphalt surface treatments. Transportation Research Record: J. Transportation
Research Board No. 2044.
Patrick, JE (1998) Bitumen emulsion sealing: New Zealand field trials. Transfund NZ research report 99.
Patrick, JE (2000) Polymer-modified bitumen emulsion as chipseal binder in high stress areas on New
Zealand roads. Transfund NZ research report 162.
Roberts, C and JC Nicholls (2008) Design guide for road surface dressing. Transport Research Laboratory
road note RN39 (6th ed).
Transit NZ, Road Controlling Authorities and Roading NZ (2005) Chipsealing in New Zealand. Wellington,
New Zealand.
Wanty, D (2014) Binder and hot cutback binder, chipseal life and usage analysis. Accessed 23 October
2014. http://hip.nzta.govt.nz/__data/assets/pdf_file/0008/47879/WTCar_Binder_final.pdf.

Appendix A: Graphs of pendulum test results
45
Appendix A: Graphs of pendulum test results
0
200
400
600
800
1000
1200
1400
1600
1 2 3 4 5 6
Pend
ulum
swin
g he
ight
diff
eren
ce
Sample number
1.5 L/m2 G3 on plate Binder A cutback 2pph
0200400600800
1000120014001600
1 2 3 4 5 6Pend
ulum
swin
g he
ight
diff
eren
ce
Sample number
1.5 L/m2 G3 on plate Emulsion A
0
200
400
600
800
1000
1200
1400
1600
13 14 15 16 17 18
Pend
ulum
swin
g he
ight
diff
eren
ce
Sample number
1.5 L/m2 G3 on plate Base binder A 180/200

Reduced bitumen application rates using bitumen emulsions
46
0
200
400
600
800
1000
1200
1400
1600
7 8 9 10 11 12
Pend
ulum
swin
g he
ight
diff
eren
ce
Sample number
1.5 L/m2 G3 on plate Binder B cutback 2pph
0
200
400
600
800
1000
1200
1400
1600
1 2 3 4 5 6
Pend
ulum
swin
g he
ight
diff
eren
ce
Sample number
1.5 L/m2 G3 on plate Emulsion B
0
200
400
600
800
1000
1200
1400
1600
7 8 9 10 11 12
Pend
ulum
swin
g he
ight
diff
eren
ce
Sample Number
1.5 L/m2 G3 on plate Base binder B 130/150

Appendix A: Graphs of pendulum test results
47
0
200
400
600
800
1000
1200
1400
1600
13 14 15 16 17 18
Pend
ulum
swin
g he
ight
diff
eren
ce
Sample number
1.93 L/m2 G3 on plate Binder A cutback 2pph
0
200
400
600
800
1000
1200
1400
1600
19 20 21 22 23 24Pend
ulum
swin
g he
ight
diff
eren
ce
Sample number
1.93 L/m2 G3 on Emulsion A
0
200
400
600
800
1000
1200
1400
1600
7 8 9 10 11 12
Pend
ulum
swin
g he
ight
diff
eren
ce
Sample number
1.93 L/m2 G3 on plate Base binder A 180/200

Reduced bitumen application rates using bitumen emulsions
48
0
500
1000
1500
2000
2500
19 20 21 22 23 24
Pend
ulum
swin
g he
ight
diff
eren
ce
Sample number
1.93 L/m2 G3 on plate Binder B cutback 2pph
0
500
1000
1500
2000
2500
19 20 21 22 23 24
Pend
ulum
swin
g he
ight
diff
eren
ce
Sample number
1.93 L/m2 G3 on plate Emulsion B
0
500
1000
1500
2000
2500
7 8 9 10 11 12
Pend
ulum
swin
g he
ight
diff
eren
ce
Sample number
1.93 L/m2 G3 on plate Base binder B 130/150