reducing air pollution and co2 in guiyang, china environmental model city cooperation program in...
TRANSCRIPT

Sino-Japan Environmental Model City Cooperation Program in Guiyang City of China
Reducing Air Pollution and CO2Reducing Air Pollution and CO2in Guiyang, China
(Digest version)
Aug.28-29 2006 Seattle USA
(Digest version)
Aug.28 29 2006 Seattle USA Institute for Global Environmental
St t i (IGES)Strategies (IGES)Director , IGES Beijing Office
H.KOYANAGI
Environmental Problems in ChinaEnvironmental Problems in China
• Air Pollution • Water Pollution• Hazardous wastesHazardous wastes• Soil pollution • Toxic chemical compounds • Toxic chemical compounds • Desertification
A id i • Acid rain • Yellow sand storm, etc. • Climate change is not an urgent and
prior issues for China!
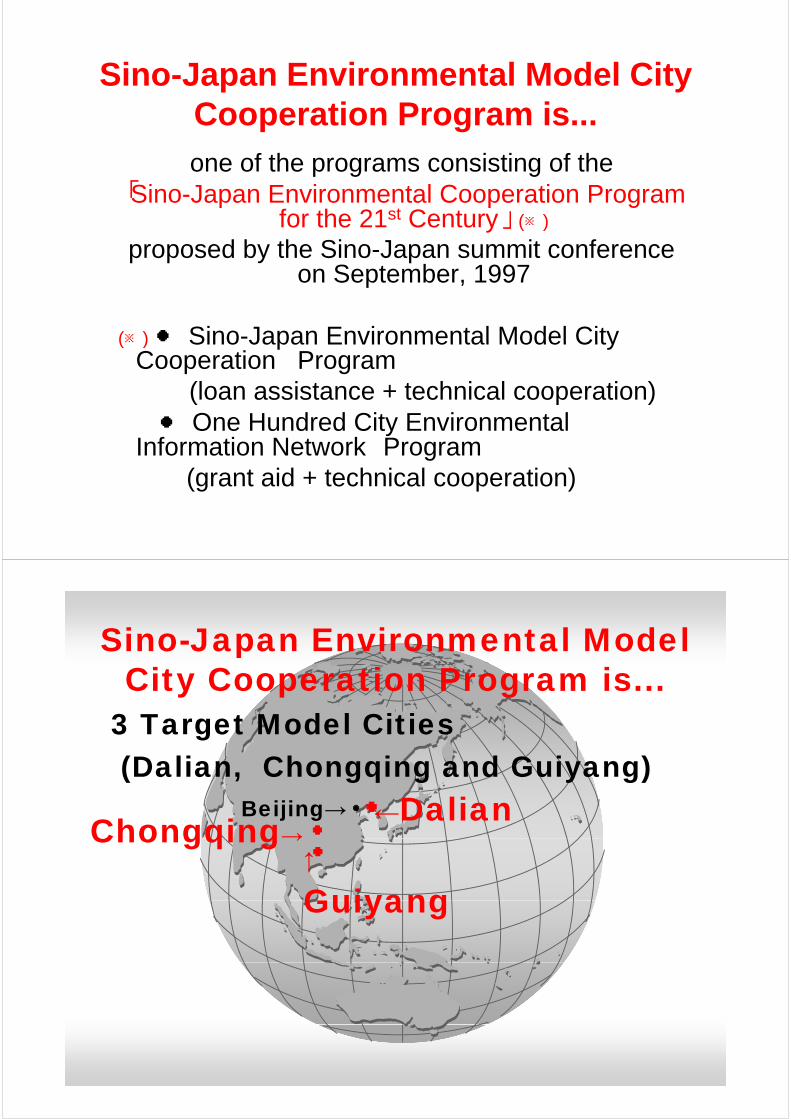
Sino-Japan Environmental Model City Cooperation Program is...
f th i ti f thone of the programs consisting of the 「Sino-Japan Environmental Cooperation Program
for the 21st Century」 (※)for the 21st Century」 (※)
proposed by the Sino-Japan summit conference on September 1997on September, 1997
(※)● Sino-Japan Environmental Model City(※)● Sino Japan Environmental Model City Cooperation Program
(loan assistance + technical cooperation) ( p )● One Hundred City Environmental
Information Network Program (grant aid + technical cooperation)
Sino-Japan Environmental Model pCity Cooperation Program is...
3 T t M d l Citi3 Target Model Cities(Dalian, Chongqing and Guiyang)
Chongqing→・Beijing→・
(Dalian, Chongqing and Guiyang)・←Dalian
↑
Guiyang
Chongqing→・
Guiyang

Sino-Japan Environmental Model City Cooperation Program is...
• To establish measures for major airTo establish measures for major air pollution sources
and air monitoring system
• Supported by total 30 7 billion• Supported by total 30.7 billion Japanese yen (267million US$) of loan assistance for three cities
• To establish a recycling-oriented i t tsociety system
Sino-Japan Environmental Model City Cooperation Program is...
• To give technical assistance on human and institutional capacityhuman and institutional capacity building by technical cooperation
To make a successful model case of• To make a successful model case of environmental improvement p

Cooperation ProgramCooperation Program in Guiyang City ofin Guiyang City of
ChinaC a
Area 8 000km2Area 8,000km2Population 3.5million(CBD Area 150km2CBD Population 1 million)CBD Population 1 million)
China
Guizhou Province
Guiyang City

2002F Y GDP/person・year2002F.Y. GDP/person・year
1200
1400
800
1000
400
600
800
200
400
US$0
GuizhouProvince
Guiyang City Ave.of China
US$
2002F Y GDP/person・year2002F.Y. GDP/person・year
35000
40000
25000
30000
15000
20000
5000
10000
US$0GuizhouProvince
GuiyangCity
Ave.ofChina
Japan(‘00)
US$

Air Pollutant Emissions in Guiyang City
ton
600,000
700,000
500,000
600,000
300,000
400,000
100,000
200,000 SO2(t)
PM(t)
01997 1998 Japan(‘99)
Dust(t)
Air Pollution Concentration in Guiyang CityGuiyang City
Unit:mg/m3Standard Level (AVG./yr:SO2 0.06, TSP 0.20)
0 35
0.3
0.35
0.2
0.25
0 1
0.15
0.05
0.1
SO2 TSP0.06
01997

Air Pollution Concentration in Guiyang CityGuiyang City
Unit:mg/m3Standard Level(AVG./yr:SO2 0.06, TSP 0.20)
0 35
0.3
0.35
0.2
0.25
0 1
0.15
0.05
0.1
SO2 TSP0.06
01997
1 Summary of Cooperation 1.Summary of Cooperation Project by Loan Assistance

1.Summary of Cooperation Project by Loan Assistance
・Total 30.7 billion Japanese yen (267 million US$) l f th itiUS$) loan for three cities
・14.5 billion yen (126 million US$) for y ( $)Guiyang city and same amount was prepared by implementing organization’sprepared by implementing organization s own fund
・Total 7sub-projects were implemented in Guiyang cityy g y
○ Measures for Large-scale Air ○ gPollution Sources(1) Measures for Sulfur Dioxide and Dust(1) Measures for Sulfur Dioxide and Dust
from Guiyang Steel Plant( ) M f S lf Di id d D(2) Measures for Sulfur Dioxide and Dust
from Guizhou Cement Plant(3) Measures for Sulfur Dioxide and Dust
from Guiyang Power Planty g
○ Supply of Clean Energy(4) S l D lf i d Cl C l(4) Supply Desulfurized Clean Coal (5) Supply Coal Gas pp y

○ Strengthening the Capacity of○ Strengthening the Capacity of Environmental Monitoring (6) Establishment of Automatic Air
Monitoring Stations and On-line Monitoring g gSystem for Emission Sources
○ Preventing Mercury Contamination (7) Construction of new production facility
without the use of mercurywithout the use of mercury
2 S f C ti 2. Summary of Cooperation Project by Technical Project by Technical Cooperation
・Cooperation on human capacity development and capacity development and institutional capacity p ydevelopment

2 Summary of Cooperation2.Summary of Cooperation Project by Technical Cooperation
(1) Assistance on Preparation of Master Plan(1) Assistance on Preparation of Master Plan for Air Quality Management in Guiyang City
(2) Di t h f E t(2) Dispatch of Experts
(3) Assistance for Enterprises on Environmental ManagementEnvironmental Management
(4) Assistance on Establishment of Recycling-i t d S i t S toriented Society System
(4)Assistance on establishment of recycling oriented society systemrecycling-oriented society system
・Assisted establishment of Guiyang Circular Economy Ordinance

(1) Guiyang Steel Plant
Before
After

Expected Emission Reduction of Air Pollutants
(1) Guiyang Steel Plant
• SO2 Approx 8 600 t/year
(1) Guiyang Steel Plant
SO2 Approx. 8,600 t/year
(84% of reduction rate)
PM+DUST A 5 800 /・PM+DUST Approx. 5,800 t/year
(94% of reduction rate)(94% of reduction rate)
Source: City of Guiyang
Expected Emission Reduction Rate of Air Pollutants
100%
80
90
100
60
70
80
40
50
60
20
30
40
SO2
0
10
20
PM+DUST
0BEFORE AFTER

(2) Guizhou Cement Plant
Before
4 Old Cement Kilns
Expected Emission Reduction of Air Pollutants
(2) G i h C t Pl t
SO2 A 3 900 t/
(2) Guizhou Cement Plant
• SO2 Approx. 3,900 t/year
(84% of reduction rate)(84% of reduction rate)
・ PM+DUST Approx. 9,500 t/year
(96% f d ti t )(96% of reduction rate)
Source: City of Guiyang

Expected emission reduction rate of air pollutants
100
%
80
90
100
60
70
80
40
50
60
20
30
40
SO2
0
10
20PM+DUST
0BEFORE AFTER
(3) Guiyang Power Plant(3) Guiyang Power Plant1998.8.

Expected Emission Reduction of Air Pollutants
(3) G i P Pl t
• SO2 Approx 102 800t/year
(3) Guiyang Power Plant
• SO2 Approx. 102,800t/year
(94% of reduction rate)
・ PM+DUST Approx. 33,400 t/year
(93% of reduction rate)(93% of reduction rate)
Source: City of GuiyangSource: City of Guiyang
Expected Emission Reduction Rate of Air Pollutants
100
%
80
90
100
60
70
80
40
50
60
SO2
PM+DUST
20
30
40 PM+DUST
10
20
0BEFORE AFTER

Expected Emission Reduction of Air Pollutants
(4) S l D lf i d Cl C l
SO2 Appro 26 500 t/ ear
(4) Supply Desulfurized Clean Coal
• SO2 Approx. 26,500 t/year
・ PM+DUST Approx. 14,700 t/year
Source: City of Guiyang
Expected Emission Reduction of Air Pollutants
(5)Supply Coal Gas
• SO2 Approx. 18,200 t/yearSO2 Approx. 18,200 t/year
・ PM Approx. 9,100 t/year
Source: City of Guiyang

(6) Establishment of Automatic Air Monitoring Stations and On lineMonitoring Stations and On-line Monitoring Systems for Emission Sources
1998 81998.8.
Old Monitoring FacilityOld Monitoring Facility
Expected Emission Reduction of Air Pollutants
(7) M f M P ll ti t(7) Measures for Mercury Pollution at
Chemical Plants
• SO2 Approx. 3,600 t/year
PM A 5 300 t/・ PM Approx. 5,300 t/year
・COD Approx. 5,500 t/year
Source: City of Guiyang

ConclusionConclusionConclusionConclusion
Result of technical Result of technical cooperationp・Preparation of master plan for air
quality management in Guiyang city (2004 11 )city (2004.11.)
・Establishment of Guiyang Circular Economy Ordinance (2004 11 )Economy Ordinance (2004.11.)

Expected outputs from p pimplementing model city cooperation programcooperation program
(Within Model Area140km2)
T t l i i d ti f lf di id• Total emission reduction of sulfur dioxide 163,500 t/year
(Y 1996 203 000 81% f d ti t )(Year 1996 203,000t 81% of reduction rate)
T t l i i d ti f PM d d t• Total emission reduction of PM and dust 57,000 t/year
(Y 1996 86 000t 66% f d ti t )(Year 1996 86,000t 66% of reduction rate)
Source: City of Guiyang y y g
Comparison with 1996 Emission Level (Sulfur dioxide)
400 000
ton
350,000
400,000
250,000
300,000
150 000
200,000
100,000
150,000
SO2163,500t
0
50,000
the entire Model Modelthe entireGuiyang city
ModelArea(Before)
ModelArea(After)

Comparison with 1996 Emission Level (PM + Dust)ton
120,000
140,000
80 000
100,000
60,000
80,000
57,000t
20 000
40,000PM+DUST
0
20,000
the entire Model ModelGuiyang city Area(Before) Area(After)
Result of Model City Cooperation ProgramProgram
Emission change of SO2 in Guiyang cityunit: ton
500 000
600,000
unit: ton
400,000
500,000
200 000
300,000
100,000
200,000
01997 1998 1999 2000 2001 2002 2003 2004 2005
T t l SO2(t ) SO2 f Pl t (t )Total SO2(ton) SO2 from Plants(ton)

Change of Concentration of Sulfur Dioxide in Urban Area of Guiyang City
Standard Level(AVG /Yr:SO2 0 06 mg/m3 )Standard Level(AVG./Yr:SO2 0.06 mg/m )Unit:mg/m3
0.35
0 25
0.3
0.2
0.25
0.1
0.15
0
0.050.06
01997 1998 1999 2000 2001 2002 2003 2004 2005
SO2
Co benefit effects by model cityCo-benefit effects by model city cooperation program
Emission reduction of• Emission reduction of carbon dioxide(CO2)carbon dioxide(CO2)
→ 1.07million t/yeary
Source: City of Guiyang

Environmental Problems in ChinaEnvironmental Problems in China
• Air Pollution • Water Pollution• Hazardous wastesHazardous wastes• Soil pollution • Toxic chemical compounds • Toxic chemical compounds • Desertification
A id i • Acid rain • Yellow sand storm, etc. • Climate change is not an urgent and
prior issues for China!
Effectiveness of Co benefitsEffectiveness of Co-benefits
• Promotion of program for climate change integrating with air pollution measures in such Guiyang p y gcity
may be quite effective in developing countries including China

Thankyou!you!