reducing invasive organisms in trade in great lakes...
TRANSCRIPT

Reducing Invasive Organisms in Trade in Great Lakes
Watersheds
Bureau of Science Services Wisconsin Department of Natural Resources P.O. Box 7921 Madison, WI 53707-7921 Miscellaneous Publication PUB-SS-1144 2014
______________________________________________________ Executive Summary: This report describes grant-funded work undertaken by the Wisconsin Department of Natural Resources to reduce the availability of invasive species in the live aquatic plant trade in Wisconsin. We: 1) surveyed aquatic plant retailers to assess attitudes towards invasive species and knowledge of the invasive species regulations, and to identify barriers to selling non-invasive alternatives; 2) surveyed Wisconsin aquatic plant retailers’ stock to locate regulated species for sale; 3) conducted educational visits and provided educational materials to retailers; and 4) surveyed small water bodies to assess the landscape risk from aquatic invasive plants sold in the live plant trade. This report describes the work conducted under this grant, documents the grant deliverables, and fulfills final reporting requirements for our grant agreement. This project was funded by the United States Environmental Protection Agency through the Great Lakes Restoration Initiative, Award #GL-00E00804-0. Points of view expressed in this report do not necessarily reflect the views or policies of the United States Environmental Protection Agency. Mention of trade names and commercial products does not constitute endorsement of their use.
Cover photo: Image of a regulated, invasive aquatic plant, parrot feather (Myriophyllum aquaticum), for sale in a Wisconsin garden center. Editor: Dreux J. Watermolen
The Wisconsin Department of Natural Resources provides equal opportunity in its employment, programs, services, and functions under an Affirmative Action Plan. If you have any questions regarding this plan, please write to Equal Opportunity Office, Department of Interior, Washington, DC 20240.
This publication is available in alternative format (large print, Braille, audio tape, etc.) upon
request. Please call (608) 266-0531 for more information.
Reducing Invasive Organisms in Trade
in Great Lakes Watersheds
Kelly I. Wagner, Chrystal Schreck, Jennifer Hauxwell, Alison Mikulyuk, Melinda Wilkinson, Scott Van Egeren,
and Daniel L. Oele
Bureau of Science Services Wisconsin Department of Natural Resources
P.O. Box 7921 Madison, WI 53707
January 2014

Reducing Invasive Organisms in Trade
i
Contents Introduction ........................................................................................................... 1
Recommendations from Previous Work ...................................................................... 1 Project Goals .......................................................................................................... 2
Project Highlights and Accomplishments ............................................................... 3
Collaboration with Partners ....................................................................................... 3 Wisconsin Department of Agriculture, Trade, and Consumer Protection ..................... 3 County AIS coordinators ...................................................................................... 3 Citizen-based Networks ....................................................................................... 4 Great Lakes Management Transition Board ............................................................ 4 Sea Grant/Great Lakes Commission ...................................................................... 4 2012 Social Survey of Retailers, Landscapers, and Growers .......................................... 5 Retailer Knowledge of Regulations ........................................................................ 5 Retailer Awareness of Preventive Measures ............................................................ 8 Retailer Inventory of Invasive Species Stock .......................................................... 9 2012 Retailer Plant Stock Surveys ........................................................................... 12 2012 Outreach and Educational Efforts .................................................................... 21 Education Plan.................................................................................................. 21 Educational Efforts ............................................................................................ 21 2013 Social Survey of Retailers, Landscapers, and Growers ........................................ 23 Retailer Knowledge of Regulations ...................................................................... 24 Retailer Awareness of Preventive Measures .......................................................... 26 Retailer Inventory of Invasive Species Stock ........................................................ 27 2013 Retailer Plant Stock Surveys ........................................................................... 30 Change in Stock, 2012-2013 .............................................................................. 36 2013 Outreach and Educational Efforts .................................................................... 39 Teacher Outreach and Education ........................................................................ 39 Pond Owner and Water Gardener Outreach and Education ..................................... 39 Follow Up Enforcement Actions ............................................................................... 40 2012 Urban Landscape Surveys .............................................................................. 41
Technology Transfer ............................................................................................. 54
Presentations and Displays Resulting from Work ....................................................... 54 Publications Resulting from Work ............................................................................ 54
Information and Education Products ..................................................................... 55 Peer-reviewed Journal Articles ............................................................................. 55
Lessons Learned, Recommendations, and Future Work ........................................ 56
Retailer Awareness of Invasive Species & Understanding of Laws ................................ 56 Availability of Regulated Species in Trade ................................................................. 57 Effectiveness of Outreach and Educational Efforts...................................................... 58 Distribution of Invasive Species Relative to Retail Sources.......................................... 61
Acknowledgements .............................................................................................. 62 Literature Cited .................................................................................................... 62 Appendices ........................................................................................................... 66

Reducing Invasive Organisms in Trade
ii
Appendices A. Education and Outreach Plan 66
B. 2012 Social Survey Response Data 71
C. 2013 Social Survey Response Data 76
D. Species Lists and Resources for Pet and Aquarium Stores 79
E. Outreach Letter for Pet and Aquarium Stores 81
F. Outreach Letter for Aquatic Plant Nurseries 82
G. Factsheet: Invasive Aquatic Plants and Their Other Names 83
H. Factsheet: Are Your Snails Okay? 85
I. Factsheet: Crayfish and the Invasive Species Rule 86
J. Factsheet: Chapter NR 40 Regulated Plants 87
K. Brochure: Protect Your Pond or Water Garden 89
L. Brochure: Make the Right Choice about Elodea 91
M. Teacher Mailing Cover Letter 93
N. Pond Retailer Mailing Cover Letter 94
O. Pond Owner Mailing Cover Letter 95
P. Poster “Landscape Risk Assessment of Invasive Aquatic Plants in 96 Southeast Wisconsin Ponds”
Reducing Invasive Organisms in Trade
iii
Tables 1. Breakdown of 2012 survey respondents by sample group. 6 2. Floating and emergent species reported in the 2012 social survey. 10 3. Submerged species reported in the 2012 social survey. 11 4. Aquatic plants found at retail stores in 2012. 16 5. Breakdown of 2013 survey respondents by sample group. 24 6. Floating and emergent species list reported in the 2013 social 28
survey. 7. Submerged species reported in the 2013 social survey. 29 8. Aquatic plants found at retail stores in 2013. 32 9. Changes in the number of stores carrying a particular species 38
from 2012 to 2013. 10. Description of the number of random rake tows taken to supplement 45
the visual search. 11. Species found in pond surveys and their regulatory status at the 46
time of the survey. 12. Variables used in logistic regression models. 48 13. Results from binary logistic regression models describing species 50
presence in ponds due to proximity to retail stores. 14. Results of binary logistic regression models predicting presence/ 52
absence of the most common invasive plant species found in the pond surveys.
15. Results of the binary logistic regression model predicting presence/ 52
absence of ch. NR 40 species used for the risk map. 16. Non-native, unregulated plants for sale in Wisconsin live plant trade. 60
Reducing Invasive Organisms in Trade
iv
Figures 1. 2012 social survey responses to the question “How knowledgeable 6
do you feel you are about invasive species regulations in Wisconsin?” 1. 2012 social survey responses (%) to the question, “In your opinion, 7
how strong or weak are Wisconsin regulations on non-native invasive aquatic plants? Would you say the regulations are…”
2. 2012 social survey responses (%) to regulatory action questions. 7 3. 2012 social survey responses (%) to prevention behavior questions. 8 4. Locations of 297 stores visited for aquatic plant stock surveys 13
in 2012. 5. Locations of aquatic plant retailers in Wisconsin. 14 6. 2013 social survey responses to the question “How knowledgeable do 25
you feel you are about invasive species regulations in Wisconsin?” 7. 2013 social survey responses to the question, “In your opinion, how 25
strong or weak are Wisconsin regulations on non-native invasive aquatic plants? Would you say the regulations are…”
8. 2013 social survey responses (%) to regulatory action questions. 26 9. 2013 social survey responses (%) to prevention behavior questions. 27 10. Locations of 146 stores visited for aquatic plant stock surveys 31
in 2013. 11. Number of stores selling invasive aquatic plants surveyed in 37
each sampling year, grouped by education and regulation status. 12. Five-county study area included in the pond surveys. 42 13. Map of all water bodies in study area. 43 14. Study area with the locations of the 148 surveyed ponds and the 44
high and low risk categories based on NR 40-regulated species for sale within 17 km.
15. Example search tracks on pond. 45 16. Predicted probability of a planted pond based on distance to 50
nearest house. 18. Risk map showing predicted probability of a pond having a ch. 83
NR 40-listed species.

Reducing Invasive Organisms in Trade
1
Introduction Invasive species are a considerable environmental and economic problem in the United States, contributing to the loss of biological diversity (Wilcove et al. 1998, Clavero and Garcia-Berthou 2005, Pimentel et al. 2005; but see Gurevitch and Padilla 2004), disrupting ecosystem functions and disturbance regimes (Mack and D’Antonio 1998, Ehrenfeld 2010), and costing almost $120 billion annually (Pimental et al. 2005). As a large freshwater system that serves as a hub of commerce, industry, tourism, and recreation, the Great Lakes are vulnerable to invasive species. Over 180 non-native species have been introduced to the Great Lakes basin, and the discovery rate of 1.8 new introductions per year is the most of any freshwater system known (Ricciardi 2006). The economic cost of aquatic invasive species (AIS) to the Great Lakes is estimated to be over $100 million per year (Rosaen et al. 2012). While intercontinental shipping is responsible for the majority of historical introductions of invasive species to the Great Lakes (Ricciardi 2006), in the past five decades trade in live organisms has made up a considerable proportion, responsible for both deliberate and accidental introductions (Ricciardi 2006). Many others have pointed to the live organism trade as a vector of concern (Padilla and Williams 2004, Kerr et al. 2005, Keller and Lodge 2007), more importantly so with increasing global trade and extension to new markets (Mack and Lonsdale 2001, Hulme 2009, Bradley et al. 2012). For invasive plants, it is well documented that the primary pathway of introduction is through horticultural cultivation (Groves 1998 in Perrings and Dehnen-Schmutz 2005, Mack and Erneberg 2002, Pyšek et al. 2002). For aquatic and wetland plants, horticulture and aquarium releases are primary vectors (Les and Mehrhoff 1999, Reichard and White 2001), including for the Great Lakes (Mills et al. 1993) and in Wisconsin. Over the course of just three years (2007-2010), 22 populations of seven invasive aquatic plants – all available via the live organism trade - were newly documented in Wisconsin waters. Eight of these findings occurred in man-made or private ponds. These populations were detected by chance alone and not through any systematic survey of water bodies on the landscape. This suggests that the live organism trade vector and establishment of AIS in ponds and other small water bodies may pose a significant threat to inland Wisconsin waters as well as the Great Lakes. Each population established on Wisconsin’s landscape represents a potential source for the invasion of additional waters. Small water bodies are constructed and managed for a variety of reasons such as stormwater control, ornamental water gardens, fish stocking, and subdivision recreation. Wisconsin examples show that each of these types of water bodies (which are often sites targeted for trade-sourced plantings) can support populations of AIS that could serve as source populations for future introductions. Recommendations from Previous Work The U.S. Environmental Protection Agency (EPA) strategic plan (U.S. EPA 2010) includes invasive species as an emerging ecological challenge; one that has been designated as a major focus area in the Great Lakes Restoration Initiative (GLRI). The Wisconsin Great Lakes Strategy (Wisconsin DNR 2009) recommends action to determine the threat of introduction of AIS to Wisconsin waters posed by vectors other than ballast water. Additionally, The Great Lakes Regional Collaboration Strategy to Protect and Restore the Great Lakes (Great Lakes Regional Collaboration 2005; hereafter, the ‘Strategy’) also
Reducing Invasive Organisms in Trade
2
addresses the threat of aquatic invasive species and has made recommendations to help reduce the number and severity of AIS introductions. As part of the Strategy recommendations, seven milestones have been established to address the horticultural trade vector of AIS introductions. This project aimed to address the introduction vector related to live organisms in commerce. The Wisconsin Department of Natural Resources (Wisconsin DNR) has already taken steps that support milestone 3.1, 3.2 and 3.3 of the Strategy as part of an overarching plan to decrease the incidence and impacts of non-indigenous species. The Wisconsin DNR has conducted detailed literature reviews and risk evaluations on over 200 suspected invasive species, including 63 aquatic plants. The species known or expected to be invasive in the state were classified for regulation (“prohibited” or “restricted” categories); those with uncertain invasive potential or without enough information were placed on unregulated watch lists to be reevaluated in the future. A few were deemed to not pose an invasive risk in Wisconsin. In 2009, Wisconsin enacted legislation (ch. NR 40, Wisconsin Administrative Code; hereafter, ‘NR 40’) that prohibits the unpermitted possession, transport, transfer, or introduction of prohibited species, and the unpermitted transport, transfer, or introduction of restricted species. To further address Strategy milestones aiming to reduce invasive species in trade through enforcement and risk assessments (milestones 3.6 and 3.7), the Wisconsin DNR undertook the work reported in this document. Project Goals We approached the issue of invasive species in trade from three angles. First, we gathered basic information on retail sources of live aquatic organisms in order to quantify the existence of source populations of AIS and allow us to strategically conduct educational outreach and enforcement activities. Second, we conducted an education and outreach campaign to 1) educate horticultural and pet/aquarium retailers on Wisconsin’s new regulations (i.e. NR 40) and give them resources to share with their customers, and 2) provide pond owners with information on responsible pond ownership and how the invasive species regulations affect them. Third, we examined the relationship between AIS source availability and presence of AIS populations in small water bodies (ornamental ponds, storm water retention ponds, waterways) in the urban landscape to help define how many or which types of water bodies need to be monitored for early detection of AIS. These three goals were intended to enhance and support each other while accommodating an adaptive approach that will most efficiently allow us to reduce the impact of the live organism trade vector and ultimately protect and improve the health of Great Lakes ecosystems.

Reducing Invasive Organisms in Trade
3
Project Highlights and Accomplishments Collaboration with Partners Throughout the project, we coordinated activities with several agencies and organizations to improve operations and broaden the reach of our work. These partnerships allowed us to reach a larger audience, provide more effective educational materials, efficiently coordinate enforcement activities, and be responsible with our limited resources. Wisconsin Department of Agriculture, Trade, and Consumer Protection The Wisconsin Department of Agriculture, Trade, and Consumer Protection (DATCP) is the primary regulatory entity for plant nurseries and dealers in the State of Wisconsin, licensing and inspecting them under state statute (Ch. 94, Wis. Stats.). The Wisconsin DATCP is a member of the Wisconsin Invasive Species Council and a key partner in communicating and enforcing the invasive species regulations to the horticultural sector in Wisconsin. The Wisconsin DNR and Wisconsin DATCP established a cooperative agreement to facilitate implementation of ch. NR 40 and structure the flow of information to nurseries regulated by the Wisconsin DATCP. Under this agreement, the Wisconsin DNR invasive species coordinator receives reports of invasive species violations at nurseries from the existing statewide network of invasive species staff, county coordinators, and the public and notifies Wisconsin DATCP nursery inspectors of violations. The nursery inspectors handle initial contact with the reported nurseries and seek compliance. In most cases, Wisconsin DNR staff will then follow-up to confirm compliance. If voluntary compliance is not achieved, the Wisconsin DNR will proceed through the process of stepped enforcement, which may include written notices, enforcement conferences, citations, and/or fines and penalties. The Wisconsin DATCP may or may not assist the Wisconsin DNR with final enforcement actions or inspections. In addition, the Wisconsin DNR has provided training to nursery inspectors, so that they may help educate nurseries on the regulations and look for ch. NR 40 violations during inspections. For this project, the Wisconsin DATCP also provided Wisconsin DNR a list of state plant nurseries and dealers, including those that self-reported selling aquatic plants. County AIS Coordinators A number of county aquatic invasive species (AIS) coordinators had engaged with their local plant nurseries and pet stores prior to the beginning of this project. To learn from their experiences early in our project, we conducted a survey of AIS coordinators to determine the businesses contacted, the type of contact made, and the type of response given by the retailers. This informal survey provided us with some baseline information regarding what has worked and what has not worked with Wisconsin retailers. Throughout the project, we continued to engage with the AIS coordinators by providing regular updates at statewide meetings and by sharing resources.

Reducing Invasive Organisms in Trade
4
Citizen-based Networks We also used the existing structures of Wisconsin’s citizen-based monitoring programs to increase the efficacy of our education and outreach. Two programs in particular, the Citizen Lake Monitoring Network (CLMN) and the Clean Boats, Clean Waters (CBCW) programs were especially suited to this goal. The CLMN and CBCW volunteers are concerned about AIS issues, and the organizations are highly functional social networks with a proven efficacy. We provided resources and materials developed for this project to these organizations, and asked for their help in distributing them to network volunteers and other interested people. In addition, we observed the CBCW outreach model while developing our own outreach strategy in order to integrate lessons already learned. Great Lakes Management Transition Board Project PIs (Van Egeren and Wilkinson) have been active members in the Great Lakes AIS Management Transition Board (MTB). The MTB is a mechanism for state, federal, and provincial agency resource managers to inform invasive species researchers of their operational needs in the context of planning and conducting several large GLRI-funded AIS research projects coordinated by Dr. David Lodge (University of Notre Dame) and Lindsay Chadderton (The Nature Conservancy’s Great Lakes Program). The research projects are intended to create models, monitoring plans, and species risk assessment techniques that can be used in common by all Great Lakes states to improve regional AIS program consistency. The MTB also has led to better communication and information sharing among Great Lakes states, provinces, federal agencies and research scientists. Specifically of interest to our project was the creation of tools for risk assessment of new aquatic plants, crayfish, mollusks, fish, reptiles, and amphibians that may enter trade. Although Wisconsin had already implemented a species assessment process (ch. NR 40) prior to formation of the MTB, we helped to review and give direction to the risk assessment tools that are being developed by project scientists for the Great Lakes region. In addition, participation in the MTB allowed Wisconsin DNR staff to use the lists of species from the researchers’ risk assessment tools in developing lists of species to be assessed for the revision of the state’s invasive species rule currently in progress. We intend to share our final report and subsequent publications with the MTB and associated researchers in order to facilitate coordination among regional management agencies. Sea Grant/Great Lakes Commission To increase the reach of our educational efforts, we coordinated with the University of Wisconsin Sea Grant Institute throughout the project to leverage the national Habitatitude campaign. On June 19, 2012 we provided several educational presentations on invasive species during a day-long workshop in Fond du Lac, Wisconsin for aquarium industry and aquarium hobbyist representatives. This workshop included the Habitatitude campaign as well as educational materials from our program efforts. Additionally, we provided consultation to the Illinois/Indiana Sea Grant program during their efforts to establish an educational program for retailers for a separate GLRI-funded project. Finally, during the time of this project, the Great Lakes Commission was working on a regional GLRI effort in collaboration with local Sea Grant offices and other regional groups to assess and address the issue of aquatic invasive species through Internet trade. We

Reducing Invasive Organisms in Trade
5
provided consultation directly to the coordinator of the project and participated in several regional working group meetings with this group. Our experiences with providing education to retailers in Wisconsin, as well as the materials we developed were integrated with this Great Lakes Commission effort. 2012 Social Survey of Retailers, Landscapers, and Growers From January through March 2012 we developed a social survey in coordination with the University of Wisconsin’s Survey Center to assess retailer knowledge of regulations, awareness of preventative measures, and inventory of invasive species stock. The mail survey was conducted in three waves, with the first mailing occurring on March 22 and the final on May 9. This project consisted of a sample of 583 aquarium stores, pet stores, plant nurseries, and garden stores believed to be selling aquatic plants. The breakdown of respondents per sample group is displayed in Table 1. The sample included aquarium stores, pet stores, plant nurseries, and garden stores that were potentially selling aquatic plants. Wisconsin DNR staff obtained a list of licensed nurseries (growers and dealers) from the Wisconsin DATCP. We then conducted an informal phone survey of 1,313 licensed nurseries, as well as a number of unlicensed nurseries gathered by searching Internet and telephone listings, to determine which ones sold aquatic plants. Those that reported selling aquatic plants are identified as “reported” in the sample. For some retailers we were unable to determine their aquatic plant sale status before mailing out the survey – these retailers are labeled as “Unknown.” All pet and aquarium stores that were included were identified to be selling fish or other aquatic materials. The final response rate was 64.9% with 323 respondents completing the survey. See Appendix B for full 2012 response data. Retailer Knowledge of Regulations A core goal of our retailer social survey was to assess retailer knowledge of Wisconsin’s invasive species regulations, specifically the state’s comprehensive administrative rule (ch. NR 40, Wis. Admin. Code). It is difficult to assess factual knowledge in a survey without creating the feeling of “being tested.” In order to avoid creating a testing atmosphere, we instead asked the question, “How knowledgeable do you feel you are about invasive species regulations in Wisconsin?” This question then assesses the respondents’ confidence level more than their actual knowledge of the subject. Results to this question are shown in Figure 1. Additionally we asked respondents to describe how strong or weak they felt the regulations were (Figure 2). We also looked at whether or not respondents planned to sell regulated species to gain further insights into their understanding of regulated species. These results are shown in Tables 2 and 3 in the “Retailer Inventory” section. We asked a series of questions related to actions that would imply knowledge of regulations. Figure 3 shows 2012’s responses to asking how frequently retailers did each of the following:
- Check for updates on State regulated plant lists when placing orders. - Check for updates on Federal regulated plant lists when placing orders. - Educate customers on how to properly dispose of unwanted aquatic plants. - Dispose of unwanted aquatic plants in the trash or compost.

Reducing Invasive Organisms in Trade
6
Table 1. Breakdown of 2012 survey respondents by sample group. “Licensed” refers to nurseries holding a Wisconsin DATCP grower or dealer license. “Unlicensed” are nurseries without a license. “Reported” refers to stores known to sell aquatic plants (either self-reported or referred to us by a county AIS coordinator). “Unknown” includes stores whose aquatic plant status was unknown.
Sample Group ID Range Number of Outlets within Group
Licensed/Reported 1000s 170 Licensed/Unknown 2000s 244 Unlicensed/Reported 3000s 33 Unlicensed/Unknown 4000s 26 Pet stores 5000s 110
TOTAL n/a 583
Figure 1. 2012 social survey responses to the question “How knowledgeable do you feel
you are about invasive species regulations in Wisconsin?”
0.0%
5.0%
10.0%
15.0%
20.0%
25.0%
30.0%
Not at allknowledgeable
A littleknowledgeable
Somewhatknowledgeable
VeryKnowledgeable
Extremelyknowledgeable

Reducing Invasive Organisms in Trade
7
Figure 2. 2012 social survey responses (%) to the question, “In your opinion, how strong
or weak are Wisconsin regulations on non-native invasive aquatic plants? Would you say the regulations are…”
Figure 3. 2012 social survey responses (%) to regulatory action questions.
0.0%
5.0%
10.0%
15.0%
20.0%
25.0%
30.0%
35.0%
40.0%
45.0%
Much tooweak
Somewhat tooweak
At about theright level
Somewhat toostrong
Much toostrong
0.0%
10.0%
20.0%
30.0%
Check for updates on State regulated plant lists when placing
orders
0.0%
10.0%
20.0%
30.0%
Check for updates on Federal regulated plant lists when placing
orders
0.0%
10.0%
20.0%
30.0%
40.0%
Dispose of unwanted aquatic plants in the trash or compost
0.0%10.0%20.0%30.0%40.0%
Educate customers on how to properly dispose of unwanted
aquatic plants
Reducing Invasive Organisms in Trade
8
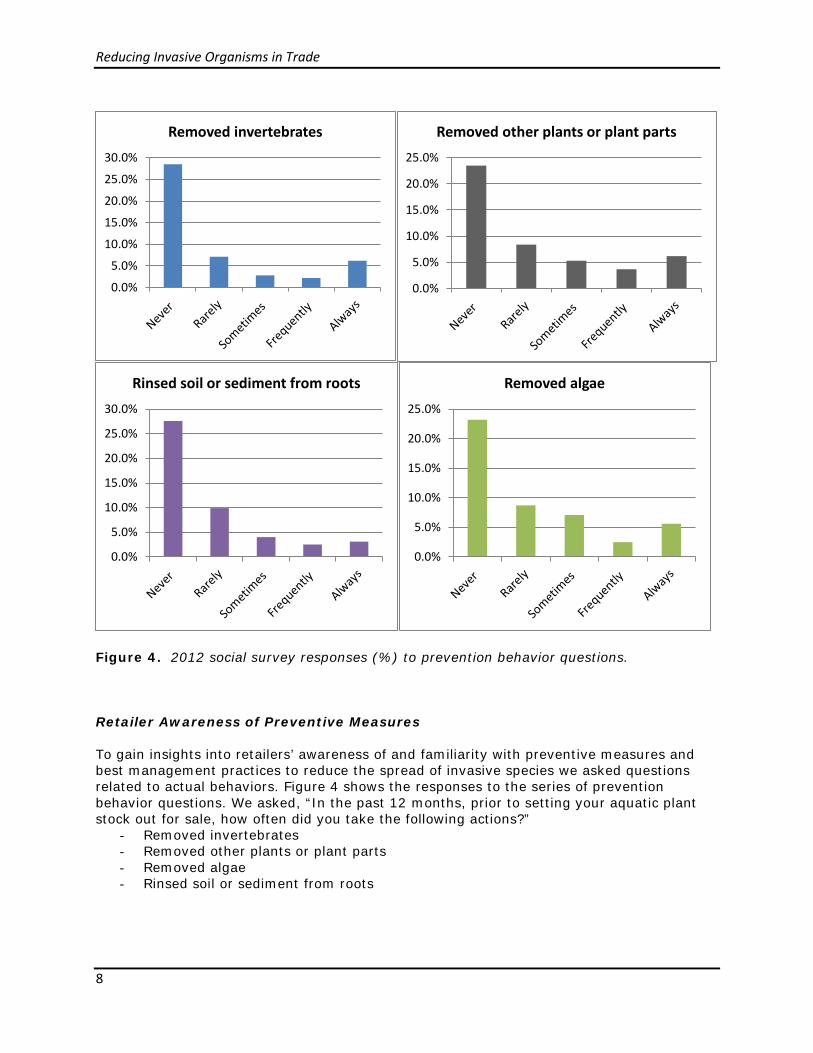
Figure 4. 2012 social survey responses (%) to prevention behavior questions. Retailer Awareness of Preventive Measures
To gain insights into retailers’ awareness of and familiarity with preventive measures and best management practices to reduce the spread of invasive species we asked questions related to actual behaviors. Figure 4 shows the responses to the series of prevention behavior questions. We asked, “In the past 12 months, prior to setting your aquatic plant stock out for sale, how often did you take the following actions?”
- Removed invertebrates - Removed other plants or plant parts - Removed algae - Rinsed soil or sediment from roots
0.0%
5.0%
10.0%
15.0%
20.0%
25.0%
30.0%
Removed invertebrates
0.0%
5.0%
10.0%
15.0%
20.0%
25.0%
Removed other plants or plant parts
0.0%
5.0%
10.0%
15.0%
20.0%
25.0%
30.0%
Rinsed soil or sediment from roots
0.0%
5.0%
10.0%
15.0%
20.0%
25.0%
Removed algae
Reducing Invasive Organisms in Trade
9
Retailer Inventory of Invasive Species Stock
Part of the social survey used two pages of tables where we asked retailers to indicate their familiarity with a variety of aquatic plants. They also asked to indicate if they have stocked any of the plants in the past five years and to indicate whether or not they planned to sell the species within the next twelve months. The percentages reported in the following tables are based upon the responding sample of 323 cases. However for most of the plants, roughly 60–65% of the respondents did not indicate whether or not they have ever stocked or plan to stock any of the plants. In such cases where the answers are left blank it is impossible to know whether or not that retailer has ever sold or planned to sell the plants. Thus, the familiarity percentage is accurate, but we assume the percentages referring to stocking behavior to be somewhat higher in actuality. In the case of Egeria densa, only 1 respondent said they were familiar – the same retailer had stocked and planned to stock the plant in the future. Conversely, 102 retailers said they were familiar with Anacharis; 56 had sold this plant, 32 were planning to sell it in the future. During the course of this study we determined that the plant retailers commonly refer to as anacharis is actually Egeria densa. The variance in this data demonstrates one of the challenges faced with regulating the plant industry – naming conventions, even scientific ones, can vary widely.

Reducing Invasive Organisms in Trade
10
Table 2. Floating and emergent species reported in the 2012 social survey. Common name(s), Scientific name Regulated or
unregulated Familiar with this
plant
Stocked this
plant in past 5 years
Plan to stock this plant in
next 12 months
Floating species
American lotus, Nelumbo lutea unregulated 43.7% 13.3% 8.0%
European frog bit, Hydrocharis spp. regulated 17.3% 2.5% 0.9%
Floating marsh pennywort, Hydrocotyle spp.
unregulated 29.7% 8.7% 3.7%
Water chestnut, Trapa spp. regulated 20.4% 1.5% 0.3%
Water clover, water shamrock, Marsilea spp.
unregulated 25.1% 7.1% 2.8%
Water lettuce, Pistia spp. unregulated 52.0% 32.8% 23.2%
Yellow floating heart, Nymphoides peltata
regulated 21.7% 6.8% 2.5%
Emergent or marginal species
Flowering rush, Butomus umbellatus regulated 26.6% 8.4% 4.6%
Manna grass, sweet grass, Glyceria maxima
unregulated 25.1% 7.7% 3.7%
Narrow-leaf cattail, Typha angustifolia regulated 43.7% 15.2% 7.7%
Common reed, Pampas reed, Phragmites australis
regulated 38.1% 6.2% 3.4%
Pickerel weed, Pontederia spp. unregulated 37.2% 19.2% 15.8%
Purple loosestrife, Lythrum salicaria regulated 51.1% 2.2% 0.3%
Sweet flag, Acorus calamus unregulated 44.0% 27.2% 18.9%
Wand loosestrife, Lythrum virgatum unregulated 15.2% 0.9% 0.3%
Water dropworts, Vietnamese water celery, Oenanthe aquatic, O. javanica
unregulated 14.6% 4.3% 2.2%
Yellow iris, pale yellow iris, Iris pseudacorus
unregulated 52.9% 23.5% 13.0%

Reducing Invasive Organisms in Trade
11
Table 3. Submerged species reported in the 2012 social survey. Common name(s), Latin name Regulated
or unregulated
Familiar with this
plant
Stocked this
plant in past 5 years
Plan to stock this plant in
next 12 months
Submerged species
Anacharis, Hydrilla spp., Egeria spp. regulated 31.6% 17.3% 9.9%
Australian swamp stonecrop, New Zealand pygmyweed, Crassula spp.
regulated 7.4% 0.9% 0.0%
Brazilian waterweed, Egeria spp. regulated 8.0% 1.9% 0.0%
Brittle naiad, waternymph, Najas minor regulated 9.0% 1.5% 0.3%
Coontail, hornwort, Ceratophyllum spp. unregulated 22.3% 12.1% 9.0%
Curly-leaf pondweed, Potamogeton crispus regulated 14.6% 0.9% 0.0%
East Indian hygrophila, temple plant, hygro, Hygrophila spp.
unregulated 14.9% 6.8% 4.6%
Eurasian watermilfoil, Myriophyllum spicatum
regulated 22.9% 1.5% 0.6%
Fanwort, Cabomba spp. regulated 16.7% 7.1% 5.0%
Glosso, mudmat, Glossostigma spp. unregulated 8.0% 3.1% 2.0%
Hydrilla, Hydrilla spp. regulated 13.7% 1.9% 0.9%
Oxygen-weed, African elodea, African waterweed, Lagarosiphon spp.
regulated 8.7% 1.9% 0.6%
Parrot feather, Myriophyllum aquaticum, M. brasiliense
regulated 30.3% 16.4% 8.0%
Water celery, eelgrass, Vallisneria americana
unregulated 22.6% 7.4% 5.3%
Waterweed, elodea, Elodea canadensis unregulated 20.4% 6.2% 4.3%

Reducing Invasive Organisms in Trade
12
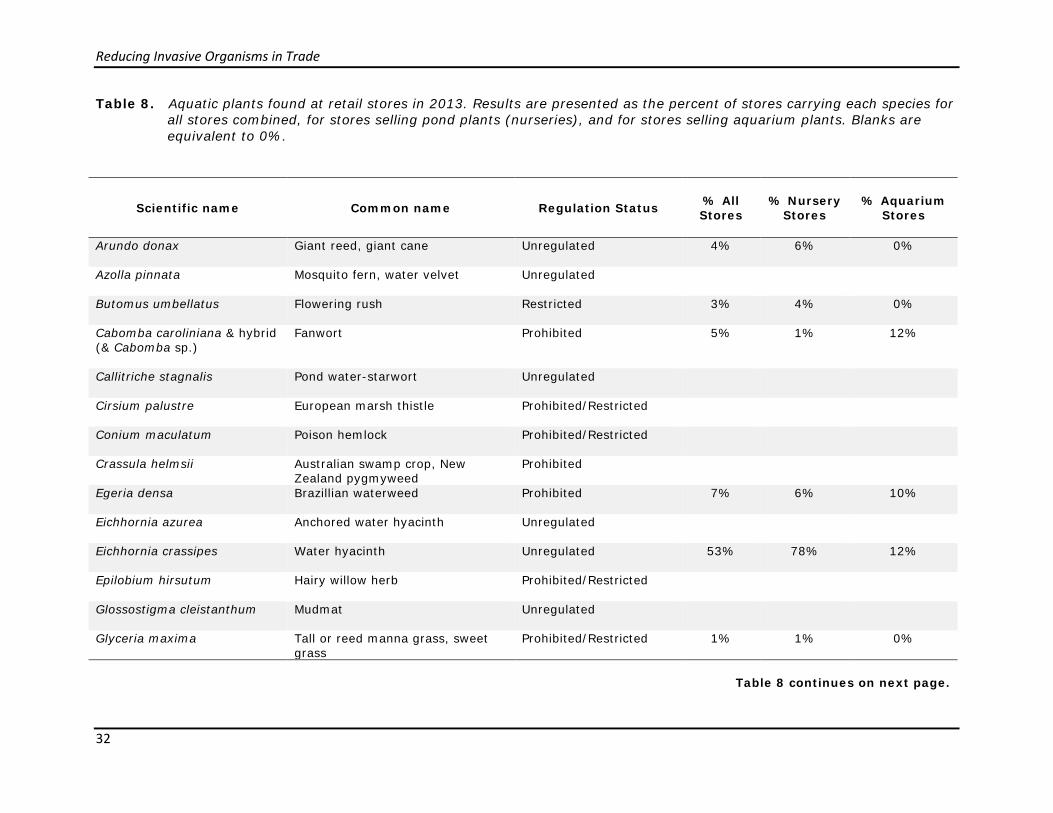
2012 Retailer Plant Stock Surveys In March through June 2012, we surveyed publicly available retail stock in aquarium stores, pet stores, plant nurseries, and garden stores for invasive aquatic plants. The stores surveyed had reported to the Wisconsin DATCP that they sold aquatic plants or had told Wisconsin DNR staff in an informal telephone survey of 1,313 licensed nurseries that they sold aquatic plants. Unlicensed nursery stores were also surveyed. Locations of unlicensed stores were gathered by searching Internet and telephone listings. Pet and aquarium store locations were also gathered from Internet and telephone listings. We visited 297 stores to conduct stock surveys (Figure 5). Visits were unannounced and conducted anonymously by a Wisconsin DNR employee, similar to Maki and Galatowitsch (2004). For stores with multiple locations in Wisconsin, we visited at least two locations, and at least 10% of stores for each chain. We visited 91% of licensed nurseries that reported selling aquatic plants (153 stores), 100% of the unlicensed nurseries that we located (32 stores), and 100% of the pet and aquarium stores (112 stores). Several stores we visited were unable to be surveyed due to being closed for business at the time of the visit or because they were not an actual retail location (i.e. a home business); however, we collected data on enough stores to exceed our numerical targets: 130 licensed nurseries (100 target), 26 unlicensed nurseries (no target, maximum of 50), and 79 aquarium and pet stores (50 target). Surveyors recorded the presence/absence of 21 regulated aquatic plant species and 36 currently unregulated but potentially invasive aquatic plant species. The unregulated species included species on our watch list (species evaluated but not listed in ch. NR 40) as well as species being evaluated for listing under the revision of ch. NR 40, which began in the summer of 2012. Surveyors recorded complete label information for each plant, including scientific name, common name, and variety. Merchant identifications were considered correct unless the surveyor was able to confirm that the plant was a taxon other than what was labeled. Surveyor identifications were made in the store with vouchers taken by photo. Purchases were also made when additional study of a plant was required for identification. For some genera, morphological identification of sterile plants was not possible, and specimens were sent to the Thum lab at Grand Valley State University for genetic identification (Cabomba spp. and Myriophyllum spp.). If a purchase was made, the number and type of hitchhikers present was recorded. We found live aquatic plants for sale in 160 stores, and five additional stores sold aquatic plants but did not have any for sale at the time of our visit (Figure 6). These included 66 stores selling aquarium plants (pet stores and aquarium stores) and 99 stores selling plants for ponds (water garden stores, garden centers, and nurseries). We identified a regulated plant in 33% of stores selling aquatics (52 stores; Figure 6). Of the 58 species we searched for, we found 25 for sale (Table 4). Four prohibited species were being sold: Cabomba caroliniana, Egeria densa, Myriophyllum aquaticum, and Nymphoides peltata. Three restricted species were being sold: Glyceria maxima, Phragmites australis, and Typha angustifolia. C. caroliniana was the most common regulated plant sold in aquarium stores, while M. aquaticum was the most common regulated plant sold for use in ponds. Most species (60%) were sold for use either in aquaria or ponds, not both. One notable exception was the prohibited plant E. densa, which was sold commonly in aquarium stores as a background plant and also in pond stores as an oxygenator. This trend may change as more plants become regulated and stores search for substitutions.

Reducing Invasive Organisms in Trade
13
Figure 5. Locations of 297 stores visited for aquatic plant stock surveys in 2012. Stores in
black were visited, but either did not carry aquatic plants or were closed at the time of visit.

Reducing Invasive Organisms in Trade
14
Figure 6. Locations of aquatic plant retailers in Wisconsin. Map includes the 165 stores we
found selling aquatic plants, plus the additional chain store locations for those chains selling aquatic plants.
Reducing Invasive Organisms in Trade
15
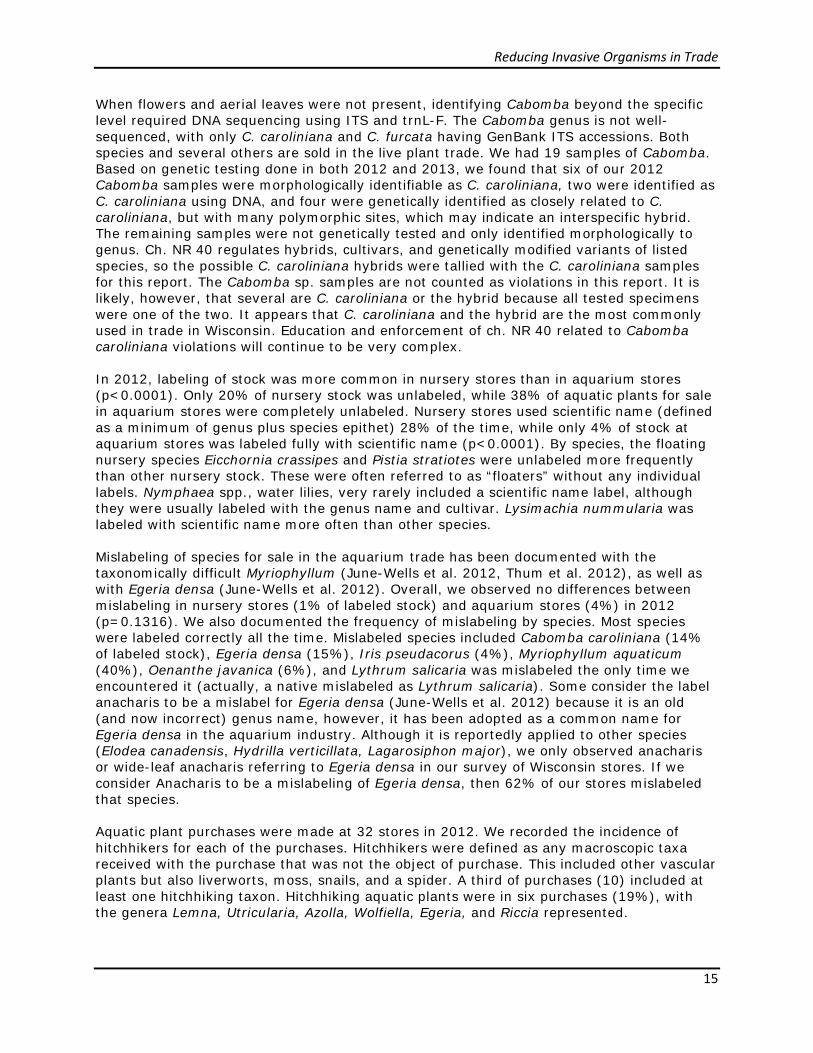
When flowers and aerial leaves were not present, identifying Cabomba beyond the specific level required DNA sequencing using ITS and trnL-F. The Cabomba genus is not well-sequenced, with only C. caroliniana and C. furcata having GenBank ITS accessions. Both species and several others are sold in the live plant trade. We had 19 samples of Cabomba. Based on genetic testing done in both 2012 and 2013, we found that six of our 2012 Cabomba samples were morphologically identifiable as C. caroliniana, two were identified as C. caroliniana using DNA, and four were genetically identified as closely related to C. caroliniana, but with many polymorphic sites, which may indicate an interspecific hybrid. The remaining samples were not genetically tested and only identified morphologically to genus. Ch. NR 40 regulates hybrids, cultivars, and genetically modified variants of listed species, so the possible C. caroliniana hybrids were tallied with the C. caroliniana samples for this report. The Cabomba sp. samples are not counted as violations in this report. It is likely, however, that several are C. caroliniana or the hybrid because all tested specimens were one of the two. It appears that C. caroliniana and the hybrid are the most commonly used in trade in Wisconsin. Education and enforcement of ch. NR 40 related to Cabomba caroliniana violations will continue to be very complex. In 2012, labeling of stock was more common in nursery stores than in aquarium stores (p<0.0001). Only 20% of nursery stock was unlabeled, while 38% of aquatic plants for sale in aquarium stores were completely unlabeled. Nursery stores used scientific name (defined as a minimum of genus plus species epithet) 28% of the time, while only 4% of stock at aquarium stores was labeled fully with scientific name (p<0.0001). By species, the floating nursery species Eicchornia crassipes and Pistia stratiotes were unlabeled more frequently than other nursery stock. These were often referred to as “floaters” without any individual labels. Nymphaea spp., water lilies, very rarely included a scientific name label, although they were usually labeled with the genus name and cultivar. Lysimachia nummularia was labeled with scientific name more often than other species. Mislabeling of species for sale in the aquarium trade has been documented with the taxonomically difficult Myriophyllum (June-Wells et al. 2012, Thum et al. 2012), as well as with Egeria densa (June-Wells et al. 2012). Overall, we observed no differences between mislabeling in nursery stores (1% of labeled stock) and aquarium stores (4%) in 2012 (p=0.1316). We also documented the frequency of mislabeling by species. Most species were labeled correctly all the time. Mislabeled species included Cabomba caroliniana (14% of labeled stock), Egeria densa (15%), Iris pseudacorus (4%), Myriophyllum aquaticum (40%), Oenanthe javanica (6%), and Lythrum salicaria was mislabeled the only time we encountered it (actually, a native mislabeled as Lythrum salicaria). Some consider the label anacharis to be a mislabel for Egeria densa (June-Wells et al. 2012) because it is an old (and now incorrect) genus name, however, it has been adopted as a common name for Egeria densa in the aquarium industry. Although it is reportedly applied to other species (Elodea canadensis, Hydrilla verticillata, Lagarosiphon major), we only observed anacharis or wide-leaf anacharis referring to Egeria densa in our survey of Wisconsin stores. If we consider Anacharis to be a mislabeling of Egeria densa, then 62% of our stores mislabeled that species. Aquatic plant purchases were made at 32 stores in 2012. We recorded the incidence of hitchhikers for each of the purchases. Hitchhikers were defined as any macroscopic taxa received with the purchase that was not the object of purchase. This included other vascular plants but also liverworts, moss, snails, and a spider. A third of purchases (10) included at least one hitchhiking taxon. Hitchhiking aquatic plants were in six purchases (19%), with the genera Lemna, Utricularia, Azolla, Wolfiella, Egeria, and Riccia represented.

Reducing Invasive Organisms in Trade
16
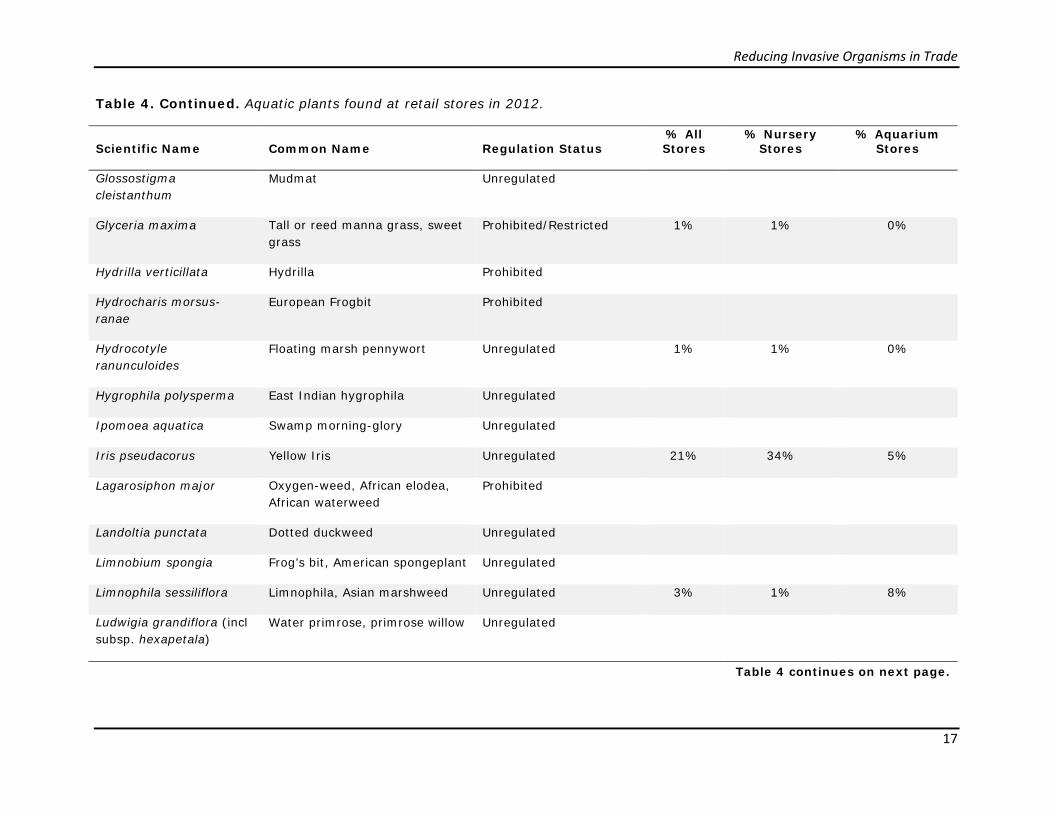
Table 4. Aquatic plants found at retail stores in 2012. Results are presented as the percent of stores carrying each species for all stores combined, for stores selling pond plants (nurseries), and for stores selling aquarium plants. Blanks are equivalent to 0%. Cabomba spp. identified only to genus are tallied along with C. caroliniana and hybrid in parentheses.
Scientific Name
Common Name
Regulation Status
% All Stores
% Nursery Stores
% Aquarium Stores
Arundo donax Giant reed, giant cane Unregulated 2% 3% 0%
Azolla pinnata Mosquito fern, water velvet Unregulated
Butomus umbellatus Flowering rush Restricted
Cabomba caroliniana & hybrid (& Cabomba sp.)
Fanwort Prohibited 8(12)% 1(2)% 18(27)%
Callitriche stagnalis Pond water-starwort Unregulated
Cirsium palustre European marsh thistle Prohibited/Restricted
Conium maculatum Poison hemlock Prohibited/Restricted
Crassula helmsii Australian swamp crop, New Zealand pygmyweed
Prohibited
Egeria densa Brazillian waterweed Prohibited 14% 11% 18%
Eichhornia azurea Anchored water hyacinth Unregulated
Eichhornia crassipes Water hyacinth Unregulated 38% 59% 11%
Epilobium hirsutum Hairy willow herb Prohibited/Restricted
Table 4 continues on next page.
Reducing Invasive Organisms in Trade
17
Table 4. Continued. Aquatic plants found at retail stores in 2012. Scientific Name
Common Name
Regulation Status
% All Stores
% Nursery Stores
% Aquarium Stores
Glossostigma cleistanthum
Mudmat Unregulated
Glyceria maxima Tall or reed manna grass, sweet grass
Prohibited/Restricted 1% 1% 0%
Hydrilla verticillata Hydrilla Prohibited
Hydrocharis morsus-ranae
European Frogbit Prohibited
Hydrocotyle ranunculoides
Floating marsh pennywort Unregulated 1% 1% 0%
Hygrophila polysperma East Indian hygrophila Unregulated
Ipomoea aquatica Swamp morning-glory Unregulated
Iris pseudacorus Yellow Iris Unregulated 21% 34% 5%
Lagarosiphon major Oxygen-weed, African elodea, African waterweed
Prohibited
Landoltia punctata Dotted duckweed Unregulated
Limnobium spongia Frog’s bit, American spongeplant Unregulated
Limnophila sessiliflora Limnophila, Asian marshweed Unregulated 3% 1% 8%
Ludwigia grandiflora (incl subsp. hexapetala)
Water primrose, primrose willow Unregulated
Table 4 continues on next page.

Reducing Invasive Organisms in Trade
18
Table 4. Continued. Aquatic plants found at retail stores in 2012. Scientific Name
Common Name
Regulation Status
% All Stores
% Nursery Stores
% Aquarium Stores
Lysimachia nummularia Creeping Jenny, moneywort Unregulated 48% 71% 12%
Lythrum salicaria Purple loosestrife Restricted
Lythrum virgatum European wand loosestrife Unregulated
Marsilea minuta Dwarf water clover, pepperwort Unregulated 1% 0% 3%
Marsilea mutica Nardoo, Australian water-clover Unregulated 4% 6% 0%
Marsilea quadrifolia Water shamrock or European waterclover
Unregulated 2% 1% 5%
Myriophyllum aquaticum & varieties
Parrotfeather Prohibited 16% 23% 6%
Myriophyllum crispatum Upright watermilfoil Unregulated
Myriophyllum pinnatum Cut-leaf watermilfoil Unregulated
Myriophyllum spicatum Eurasian watermilfoil Restricted
Myosotis scorpiodes Forget-me-not Unregulated 5% 8% 0%
Najas minor Brittle, lesser, bushy, slender, spiny, or minor naiad/waternymph
Prohibited
Nasturtium officinale Watercress Unregulated 1% 2% 0%
Nelumbo nucifera & hybrids
Sacred lotus Unregulated 8% 12% 0%
Table 4 continues on next page.

Reducing Invasive Organisms in Trade
19
Table 4. Continued. Aquatic plants found at retail stores in 2012. Scientific Name
Common Name
Regulation Status
% All Stores
% Nursery Stores
% Aquarium Stores
Nymphaea spp. Hardy waterlilies Unregulated 52% 76% 18%
Nymphoides cristata Crested floating heart, white water snowflake
Unregulated
Nymphoides indica Water snowflake Unregulated
Nymphoides peltata Yellow floating heart Prohibited 1% 2% 0%
Oenanthe aquatica Vietnamese water-celery, Japanese parsley, Chinese celery
Unregulated
Oenanthe javanica Vietnamese water-celery, Japanese parsley, Chinese celery
Unregulated 13% 20% 0%
Ottelia alismoides Duck lettuce Unregulated
Peltandra virginica Green arrow arum, tuckahoe Unregulated 1% 1% 0%
Phalaris arundinacea Reed canary grass Unregulated 6% 9% 0%
Phragmites australis Phragmites, common reed Restricted 3% 4% 0%
Pistia stratiotes Water lettuce Unregulated 37% 56% 14%
Potamogeton crispus Curly-leaf pondweed Restricted
Rorippa amphibia Great yellow cress, great water cress
Unregulated
Sagittaria sagittifolia Hawaii arrowhead, Japanese arrowhead
Unregulated
Table 4 continues on next page.

Reducing Invasive Organisms in Trade
20
Table 4. Continued. Aquatic plants found at retail stores in 2012. Scientific Name
Common Name
Regulation Status
% All Stores
% Nursery Stores
% Aquarium Stores
Salvinia spp. Salvinia species, water velvet,
cat's tongue Unregulated
Stratiotes aloides Water soldiers Unregulated
Trapa natans Water chestnut Prohibited
Typha angustifolia Narrow-leaf cattail Restricted 2% 3% 0%
Typha laxmannii Graceful cattail Unregulated 7% 11% 0%
Typha X glauca Hybrid cattail Restricted

Reducing Invasive Organisms in Trade
21
2012 Outreach and Educational Efforts A primary goal of this project was to educate retailers in the horticulture and aquarium industries. We designed educational materials to communicate the ecological and economic impact of aquatic invasive species, the identities of regulated species in Wisconsin, best practices to reduce their spread, and non-invasive alternatives to their use. The educational goal was to increase knowledge and understanding of the issues and ultimately to change retailer behavior -- decreasing the availability of invasive species to the Wisconsin public. Both the retailer social surveys and the retailer stock surveys served as tools to assess the impact of our education and outreach activities on vendor behavior. We implemented a focused educational program during the summer and fall of 2012. Our targeted, strategic outreach effort that focused on the areas that pose the highest risk for the establishment of new invasive plants leveraged both efforts by the local Sea Grant offices to increase the visibility of the Habitatitude campaign that encourages responsible care for pond and aquarium organisms and new state efforts to increase awareness and compliance with invasive species laws. Lessons learned from our efforts will help guide Wisconsin DNR’s educational approach to retailers beyond the timeframe of this project. Education Plan Early in 2012 we finalized an “Education and Outreach Plan” (Appendix A). This plan was designed using a multifaceted educational approach based upon theories of social marketing and accepted models of behavioral change (Hines et al. 1987, Hungerford and Volk 1990). The methods included carefully crafted mailed correspondence, phone and email interactions, and individually designed, in-person educational visits. Studies in other regions have shown that intensive in-person contact at workshops, seminars, and such are generally more effective then publication distribution alone when it comes to influencing behavior change (Woodman 2012, Israel et al. 1999, Larson et al. 2005). In light of this, all retailers received an educational mailing, while a subset of retailers also received an in-person educational visit. This second group we consider “visited.” The group that only received the mailed information is considered “unvisited.” We included this distinction in the educational approach to determine whether or not the extra effort of an in-person visit would result in an increased likelihood of behavior change. We measured the overall effectiveness of our educational efforts by the self-reported information in the completed social surveys as well as by in-store stock surveys completed before and after the educational efforts. Educational Efforts The educational efforts in 2012 followed the Education and Outreach Plan and were expanded and adjusted as needed. Data from the 2012 social surveys was used to help develop the educational materials for vendors and finalize the educational approach. The first stage of education was an educational mailing. In June, we mailed 100 outreach packets to the pet and aquarium stores included in the social survey. The outreach packets included a cover letter, a handout to explain how invasive species regulations apply to the particular business, a picture guide of Wisconsin’s regulated aquatic invasive plants, a brochure about invasive fish, and an invitation to an invasive species workshop. The cover

Reducing Invasive Organisms in Trade
22
letter also included links to Wisconsin DNR’s invasive species webpage for more information. Numerous personal correspondences were made with vendors in response to questions that resulted from the communication. In July, we mailed 451 similar outreach packets to licensed and unlicensed nurseries included in the social survey. These packets did not include the fish brochure or workshop invitation, but additionally included a full list of regulated invasive plants (including terrestrial plants). The retailers in this study included several large national chain stores. For these businesses, additional correspondence was made via telephone and email with the store’s regional aquatic plant buyer or manager. Outreach packets were provided to the corporate contacts via email for these larger chain stores (e.g., Petco, Walmart, etc.). In these cases, we were able to directly educate the person who makes buying decisions for the chain’s Wisconsin stores. Each individual retail location also received a mailed informational packet, resulting in approximately 120 additional mailings. The second stage of education included in-person visits for a subset of retailers. For the in-person educational visit component of the project, we selected retailers that reported through the mailed survey that they were planning to sell species listed in ch. NR 40 (76 stores) and those retailers that were found to be selling NR 40-regulated species during the stock survey visits (58 stores). Since some of these stores were covered by both categories, the total number of stores selected was 110. Twenty of the 110 stores were randomly selected to serve as a control for the educational efforts (they did not receive an in-store visit). Additionally, 20 of the compliant stores were randomly selected to receive an in-store visit. These site visits were conducted between July and October. Information from these visits has been logged and observations are being used to assist in the development of final outreach materials. During the educational site visits, our educator met with the owner or plant buyer, provided the educational packet, and discussed invasive species regulations and best management practices. Where appropriate, plant identification assistance was provided. Stores that had large aquatic plant selections were provided the book Aquatic Plants of the Upper Midwest: A Photographic Field Guide to Our Underwater Forests (Skawinski 2011). This resource was provided to assist with plant identification and awareness of native alternatives. Personal correspondence was made throughout the reporting period with several vendors in response to the mailings and in-person visits. Data from both the social surveys and the stock surveys was used to develop the educational materials for vendors and finalize the educational approach. In 2012 a number of outreach materials were developed, as shown in the technology transfer section of this report. These publications can also be viewed in full in Appendices D-P.
Reducing Invasive Organisms in Trade
23
2013 Social Survey of Retailers, Landscapers, and Growers From January through March 2013, we developed a second social survey in coordination with the University of Wisconsin Survey Center to assess retailer knowledge of regulations and awareness of preventative measures, and to inventory invasive species stock. An additional intent of this second survey was to assess the effectiveness of the educational efforts and determine any changes between 2012 and 2013. The survey went out in three waves, with the first one mailed on April 1, 2013, and the final on May 9, 2013. The 2013 survey used the same sample groups as the 2012 survey, but the number decreased due to business closures and those that were identified as not selling aquatic plants. The final sample size for 2013 was 525 stores, including pet stores, plant nurseries and garden stores (Table 5). The final response rate for the 2013 sample was 59.8% with 275 respondents completing the survey. See Appendix C for full 2013 response data.
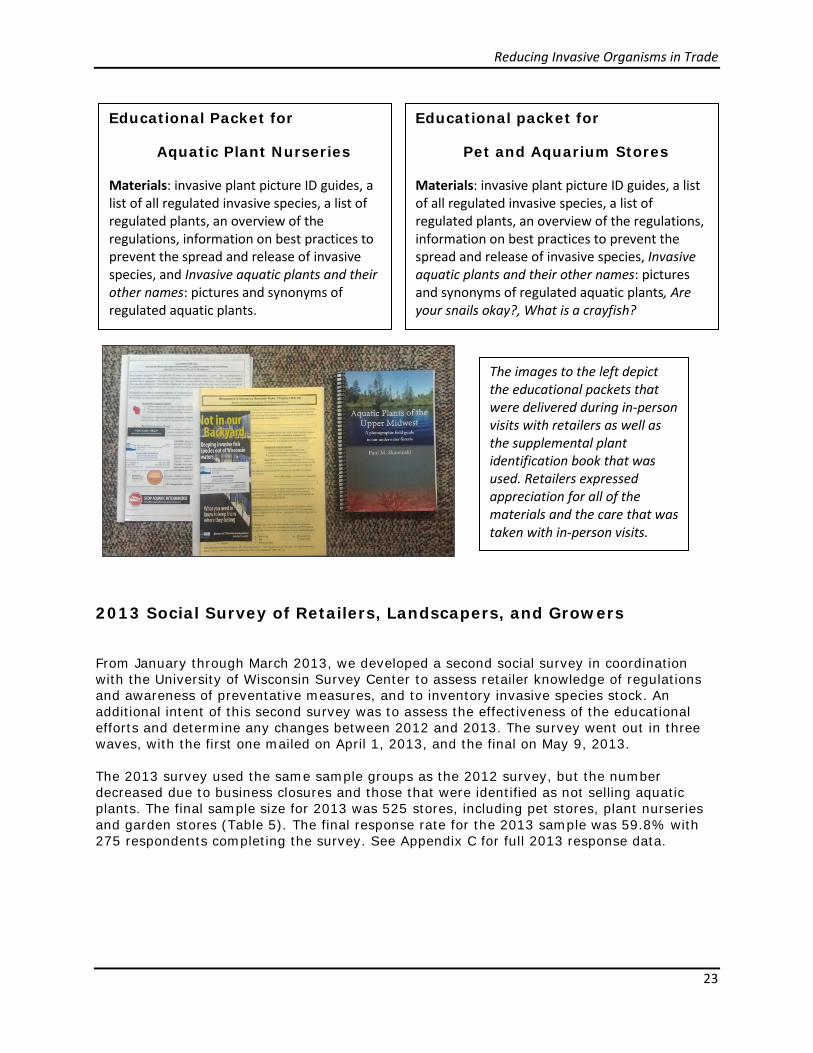
Educational Packet for
Aquatic Plant Nurseries
Materials: invasive plant picture ID guides, a list of all regulated invasive species, a list of regulated plants, an overview of the regulations, information on best practices to prevent the spread and release of invasive species, and Invasive aquatic plants and their other names: pictures and synonyms of regulated aquatic plants.
Educational packet for
Pet and Aquarium Stores
Materials: invasive plant picture ID guides, a list of all regulated invasive species, a list of regulated plants, an overview of the regulations, information on best practices to prevent the spread and release of invasive species, Invasive aquatic plants and their other names: pictures and synonyms of regulated aquatic plants, Are your snails okay?, What is a crayfish?
The images to the left depict the educational packets that were delivered during in-person visits with retailers as well as the supplemental plant identification book that was used. Retailers expressed appreciation for all of the materials and the care that was taken with in-person visits.
Reducing Invasive Organisms in Trade
24
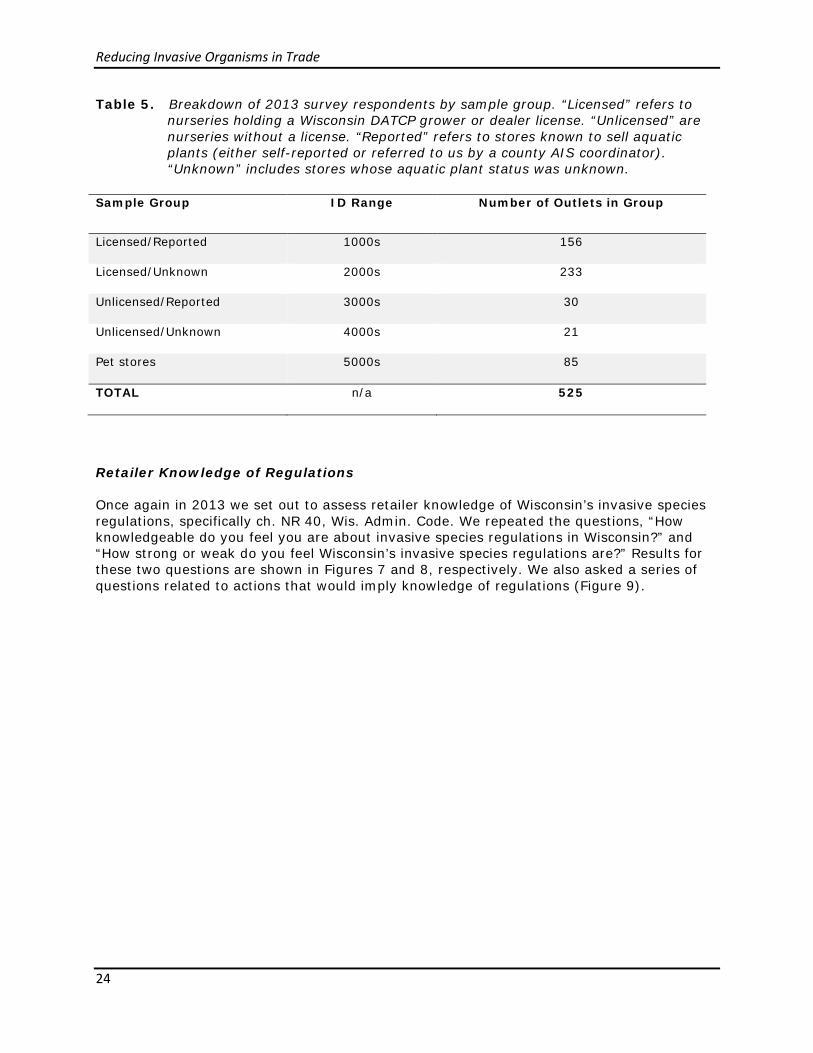
Table 5. Breakdown of 2013 survey respondents by sample group. “Licensed” refers to nurseries holding a Wisconsin DATCP grower or dealer license. “Unlicensed” are nurseries without a license. “Reported” refers to stores known to sell aquatic plants (either self-reported or referred to us by a county AIS coordinator). “Unknown” includes stores whose aquatic plant status was unknown.
Sample Group ID Range Number of Outlets in Group
Licensed/Reported 1000s 156
Licensed/Unknown 2000s 233
Unlicensed/Reported 3000s 30
Unlicensed/Unknown 4000s 21
Pet stores 5000s 85
TOTAL n/a 525
Retailer Knowledge of Regulations
Once again in 2013 we set out to assess retailer knowledge of Wisconsin’s invasive species regulations, specifically ch. NR 40, Wis. Admin. Code. We repeated the questions, “How knowledgeable do you feel you are about invasive species regulations in Wisconsin?” and “How strong or weak do you feel Wisconsin’s invasive species regulations are?” Results for these two questions are shown in Figures 7 and 8, respectively. We also asked a series of questions related to actions that would imply knowledge of regulations (Figure 9).

Reducing Invasive Organisms in Trade
25
Figure 7. 2013 social survey responses to the question “How knowledgeable do you feel you are about invasive species regulations in Wisconsin?”
Figure 8. 2013 social survey responses to the question, “In your opinion, how strong or
weak are Wisconsin regulations on non-native invasive aquatic plants? Would you say the regulations are…”
0.00%
5.00%
10.00%
15.00%
20.00%
25.00%
30.00%
35.00%
0.00%
10.00%
20.00%
30.00%
40.00%
50.00%
60.00%
Much tooweak
Somewhattoo weak
At about theright level
Somewhattoo strong
Much toostrong

Reducing Invasive Organisms in Trade
26
Figure 9. 2013 social survey responses (%) to regulatory action questions.
Retailer Awareness of Preventive Measures
To gain insights into retailers’ awareness of and familiarity with preventive measures and best management practices to reduce the spread of invasive species we asked questions related to actual behaviors. Figure 10 shows the responses to the series of prevention behavior questions we asked. We asked, “In the past 12 months, prior to setting your aquatic plant stock out for sale, how often did you take the following actions?”
- Removed invertebrates - Removed other plants or plant parts - Removed algae - Rinsed soil or sediment from roots
0.0%10.0%20.0%30.0%40.0%
Check for updates on State regulated plant lists when placing
orders
0.0%5.0%
10.0%15.0%20.0%25.0%30.0%
Check for updates on Federal regulated plant lists when placing
orders
0.0%
10.0%
20.0%
30.0%
40.0%
Dispose of unwanted aquatic plants in the trash or compost
0.0%
10.0%
20.0%
30.0%
40.0%
Educate customers on how to properly dispose of unwanted
aquatic plants

Reducing Invasive Organisms in Trade
27
Figure 10. 2013 social survey responses (%) to prevention behavior questions.
Retailer Inventory of Invasive Species Stock
In 2013, we again asked retailers to indicate their familiarity with a variety of aquatic plants, as well as their stocking history and future intentions. The percentages reported in the following tables (Tables 6-7) are based upon the responding sample of 275 cases. In 2013, the percentage of retailers that answered all three parts of this series of questions was greater than it was in 2012. The percentage of respondents that did not indicate whether or not they have ever stocked or plan to stock a plant ranged from 28% to 42% for the bulk of the plants in 2013, versus the 60% to 65% range in 2012.
0.0%10.0%20.0%30.0%40.0%50.0%60.0%70.0%
Removed invertebrates
0.0%10.0%20.0%30.0%40.0%50.0%60.0%
Removed other plants or plant parts
0.0%
10.0%
20.0%
30.0%
40.0%
50.0%
Removed algae
0.0%10.0%20.0%30.0%40.0%50.0%60.0%
Rinsed soil or sediment from roots

Reducing Invasive Organisms in Trade
28
Table 6. Floating and emergent species list reported in the 2013 social survey. Common name(s), Latin name Regulated
or unregulated
Familiar with this
plant
Stocked this
plant in past 5 years
Plan to stock this plant in next 12 months
Floating species
American lotus, Nelumbo lutea unregulated 42.9% 10.2% 4.0%
European frog bit, Hydrocharis spp. regulated 18.2% 4.0% 0.0%
Floating marsh pennywort, Hydrocotyle spp. unregulated 32.4% 8.0% 3.6%
Water chestnut, Trapa spp. regulated 28.7% 2.2% 0.4%
Water clover, water shamrock, Marsilea spp. unregulated 27.6% 6.5% 2.9%
Water hyacinth, Eicchornia crassipes* unregulated 60.7% 32.4% 23.3%
Water lettuce, Pistia spp. unregulated 59.3% 33.8% 23.3%
Yellow floating heart, Nymphoides peltata regulated 23.6% 4.7% 1.1%
Emergent or marginal species
Flowering rush, Butomus umbellatus regulated 32.7% 8.7% 2.2%
Manna grass, sweet grass, Glyceria maxima unregulated 33.1% 3.6% 1.8%
Narrow-leaf cattail, Typha angustifolia regulated 54.2% 13.8% 7.3%
Common reed, Pampas reed, Phragmites australis
regulated 46.5% 4.7% 1.1%
Pickerel weed, Pontederia spp. unregulated 41.5% 18.9% 12.0%
Purple loosestrife, Lythrum salicaria regulated 61.8% 1.8% 0.4%
Sweet flag, Acorus calamus unregulated 46.5% 24.4% 14.9%
Wand loosestrife, Lythrum virgatum unregulated 20.4% 0.7% 0.7%
Water dropworts, Vietnamese water celery, Oenanthe aquatic, O. javanica
unregulated 18.9% 6.2% 1.5%
Yellow iris, pale yellow iris, Iris pseudacorus unregulated 61.1% 20.4% 12.7%

Reducing Invasive Organisms in Trade
29
Table 7. Submerged species reported in the 2013 social survey. Common name(s), Latin name Regulated
or unregulated
Familiar with this
plant
Stocked this
plant in past 5 years
Plan to stock this plant in next 12 months
Submerged species
Anacharis, Hydrilla spp., Egeria spp. regulated 26.5% 12.7% 3.6%
Australian swamp stonecrop, New Zealand pygmyweed, Crassula spp.
regulated 7.3% 0.7% 0.0%
Brazilian waterweed, Egeria spp. regulated 9.5% 2.2% 0.7%
Brittle naiad, waternymph, Najas minor regulated 9.1% 1.1% 0.0%
Coontail, hornwort, Ceratophyllum spp. unregulated 24.4% 11.6% 6.5%
Curly-leaf pondweed, Potamogeton crispus regulated 14.9% 1.5% 0.4%
East Indian hygrophila, temple plant, hygro, Hygrophila spp.
unregulated 15.3% 6.5% 3.3%
Eurasian watermilfoil, Myriophyllum spicatum
regulated 24.7% 2.2% 0.4%
Fanwort, Cabomba spp. regulated 16.7% 6.2% 1.8%
Glosso, mudmat, Glossostigma spp. unregulated 8.0% 2.2% 1.5%
Hydrilla, Hydrilla spp. regulated 12.4% 0.7% 0.0%
Oxygen-weed, African elodea, African waterweed, Lagarosiphon spp.
regulated 11.3% 1.1% 0.7%
Parrot feather, Myriophyllum aquaticum, M. brasiliense
regulated 33.1% 16.0% 4.7%
Water celery, eelgrass, Vallisneria americana
unregulated 23.3% 5.8% 5.1%
Waterweed, elodea, Elodea canadensis unregulated 20.7% 4.4% 2.5%

Reducing Invasive Organisms in Trade
30
2013 Retailer Plant Stock Surveys In May through June 2013, we visited 146 stores (Figure 11). Many, however, were closed or no longer carried aquatic plants. We were able to resurvey 110 stores that had been surveyed in 2012, and conducted initial surveys in 13 stores that had not been surveyed in 2012. Most of those had self-reported in the 2012 social survey that they carried aquatic plants. Of the stores that were resurveyed, 80 had received one-on-one education on ch. NR 40 regulations and plant identification; 30 stores had not received any additional education between the 2012 and 2013 stock surveys. We identified a regulated plant in 30% of stores selling aquatic species in 2013 (31 stores). Some of these were unvisited control stores: 28% of educated stores were selling regulated plants, and 38% of unvisited stores were selling regulated plants. We found 27 aquatic plant species for sale in 2013 from our list of 58 invasives (Table 8). We found four species listed as prohibited in ch. NR 40: C. caroliniana, E. densa and M. aquaticum were found in 2012, and Hydrocharis morsus-ranae was found in one store. Nymphoides peltata, which was found in 2012, was not observed in any stores in 2013. For restricted species, Glyceria maxima, Phragmites australis, and Typha angustifolia again were found, as well as Butomus umbellatus. C. caroliniana and M. aquaticum were again the most common regulated plants sold in aquarium stores and pond stores, respectively. We identified Cabomba sp. with a mix of genetic testing and morphological analysis again in 2013. We identified two samples as C. caroliniana, three as the possible C. caroliniana interspecific hybrid, and one as Cabomba haynesii. The identification of parrot feather samples was also done by genetic analysis in 2013. There are a number of different Myriophyllum spp. sold in the aquarium trade and misidentification is common without genetic testing (Thum et al. 2012). We found similar confusion with M. aquaticum in the nursery trade. In 2012, we encountered parrot feather 26 times, however most were vouchered with photos, and genetic testing was unsuccessful on the pressed sample we had. Of the 13 samples from 2013, two were M. aquaticum, five were the Myriophyllum sp. “red 1” from Moody and Les (2010) and Thum et al. (2012), one was the Myriophyllum sp. “red 2” from Moody and Les (2010) and Thum et al. (2012), three were Myriophyllum crispatum, and two were an unknown Myriophyllum species, even after genetic analysis. The unknown Myriophyllum were sold as Myriophyllum propium, which is not an accepted taxonomic name. This species was found in the nursery trade in Connecticut but also could not be identified (CAES 2009). The Myriophyllum crispatum samples were often sold as red-stemmed parrot feather, but not all of the plants labeled as red-stemmed parrot feather were M. crispatum. The M. sp. “red 1” and “red 2” samples are both closely related to M. aquaticum and may be a variety of M. aquaticum or a closely related undescribed species. For this project, M. propium sales (unknown M. sp.) were treated as compliant with ch. NR 40, and all other parrot feather sales were tallied as not compliant, following the education stores received prior to the discovery of the many species/varieties being sold as parrot feather. The ability to regulate M. aquaticum depends on our ability to accurately differentiate it from other Myriophyllum species, and currently this is very difficult.

Reducing Invasive Organisms in Trade
31
Figure 11. Locations of 146 stores visited for aquatic plant stock surveys in 2013. Stores
in black were visited, but either did not carry aquatic plants or were closed at the time of visit.
Reducing Invasive Organisms in Trade
32
Table 8. Aquatic plants found at retail stores in 2013. Results are presented as the percent of stores carrying each species for all stores combined, for stores selling pond plants (nurseries), and for stores selling aquarium plants. Blanks are equivalent to 0%.
Scientific name Common name Regulation Status % All Stores
% Nursery Stores
% Aquarium Stores
Arundo donax
Giant reed, giant cane Unregulated 4% 6% 0%
Azolla pinnata
Mosquito fern, water velvet Unregulated
Butomus umbellatus
Flowering rush Restricted 3% 4% 0%
Cabomba caroliniana & hybrid (& Cabomba sp.)
Fanwort Prohibited 5% 1% 12%
Callitriche stagnalis
Pond water-starwort Unregulated
Cirsium palustre
European marsh thistle Prohibited/Restricted
Conium maculatum
Poison hemlock Prohibited/Restricted
Crassula helmsii
Australian swamp crop, New Zealand pygmyweed
Prohibited
Egeria densa
Brazillian waterweed Prohibited 7% 6% 10%
Eichhornia azurea
Anchored water hyacinth Unregulated
Eichhornia crassipes
Water hyacinth Unregulated 53% 78% 12%
Epilobium hirsutum
Hairy willow herb Prohibited/Restricted
Glossostigma cleistanthum
Mudmat Unregulated
Glyceria maxima
Tall or reed manna grass, sweet grass
Prohibited/Restricted 1% 1% 0%
Table 8 continues on next page.

Reducing Invasive Organisms in Trade
33
Table 8. Continued. Aquatic plants found at retail stores in 2013.
Scientific name Common name Regulation Status % All Stores
% Nursery Stores
% Aquarium Stores
Hydrilla verticillata
Hydrilla Prohibited
Hydrocharis morsus-ranae
European Frogbit Prohibited 1% 1% 0%
Hydrocotyle ranunculoides
Floating marsh pennywort Unregulated 1% 1% 0%
Hygrophila polysperma
East Indian hygrophila Unregulated
Ipomoea aquatica
Swamp morning-glory Unregulated
Iris pseudacorus
Yellow Iris Unregulated 23% 36% 2%
Lagarosiphon major Oxygen-weed, African elodea, African waterweed
Prohibited
Landoltia punctate
Dotted duckweed Unregulated
Limnobium spongia
Frog’s bit, American spongeplant Unregulated
Limnophila sessiliflora
Limnophila, Asian marshweed Unregulated 2% 1% 5%
Ludwigia grandiflora (incl subsp. hexapetala)
Water primrose, primrose willow Unregulated
Lysimachia nummularia
Creeping Jenny, moneywort Unregulated 55% 81% 12%
Lythrum salicaria
Purple loosestrife Restricted
Lythrum virgatum
European wand loosestrife Unregulated
Marsilea minuta
Dwarf water clover, pepperwort Unregulated 1% 1% 0%
Marsilea mutica
Nardoo, Australian water-clover Unregulated 6% 9% 0%
Table 8 continues on next page.

Reducing Invasive Organisms in Trade
34
Table 8. Continued. Aquatic plants found at retail stores in 2013.
Scientific name Common name Regulation Status % All Stores
% Nursery Stores
% Aquarium Stores
Marsilea quadrifolia Water shamrock or European waterclover
Unregulated 3% 1% 5%
Myriophyllum aquaticum & varieties
Parrot feather Prohibited 9% 13% 2%
Myriophyllum crispatum
Upright watermilfoil Unregulated 3% 4% 0%
Myriophyllum pinnatum
Cut-leaf watermilfoil Unregulated
Myriophyllum spicatum
Eurasian watermilfoil Restricted
Myosotis scorpiodes
Forget-me-not Unregulated 16% 25% 0%
Najas minor Brittle, lesser, bushy, slender, spiny, or minor naiad/waternymph
Prohibited
Nasturtium officinale
Watercress Unregulated 2% 3% 0%
Nelumbo nucifera & hybrids
Sacred lotus Unregulated 7% 10% 0%
Nymphaea spp.
Hardy waterlilies Unregulated 56% 75% 26%
Nymphoides cristata
Crested floating heart, white water snowflake
Unregulated
Nymphoides indica
Water snowflake Unregulated
Nymphoides peltata
Yellow floating heart Prohibited
Oenanthe aquatic
Vietnamese water-celery, Japanese parsley, Chinese celery
Unregulated
Oenanthe javanica
Vietnamese water-celery, Japanese parsley, Chinese celery
Unregulated 16% 23% 5%
Ottelia alismoides
Duck lettuce Unregulated
Peltandra virginica
Green arrow arum, tuckahoe Unregulated 3% 4% 0%
Table 8 continues on next page.

Reducing Invasive Organisms in Trade
35
Table 8. Continued. Aquatic plants found at retail stores in 2013.
Scientific name Common name Regulation Status % All Stores
% Nursery Stores
% Aquarium Stores
Phalaris arundinacea
Reed canary grass Unregulated 14% 22% 2%
Phragmites australis
Phragmites, common reed Restricted 7% 10% 0%
Pistia stratiotes
Water lettuce Unregulated 47% 67% 12%
Potamogeton crispus
Curly-leaf pondweed Restricted
Rorippa amphibian
Great yellow cress, great water cress
Unregulated
Sagittaria sagittifolia
Hawaii arrowhead, Japanese arrowhead
Unregulated
Salvinia spp.
Salvinia species, water velvet, cat's tongue
Unregulated 1% 1% 0%
Stratiotes aloides
Water soldiers Unregulated
Trapa natans
Water chestnut Prohibited
Typha angustifolia
Narrow-leaf cattail Restricted 2% 3% 0%
Typha laxmannii
Graceful cattail Unregulated 7% 10% 0%
Typha X glauca
Hybrid cattail Restricted
Reducing Invasive Organisms in Trade
36
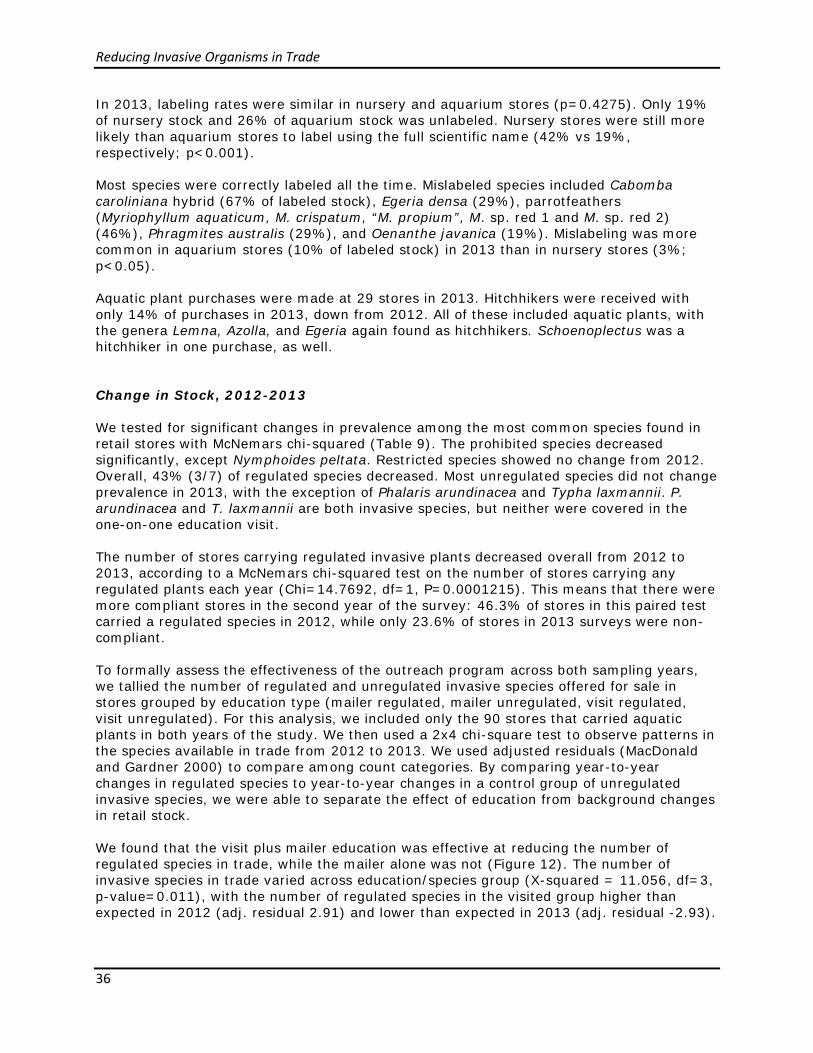
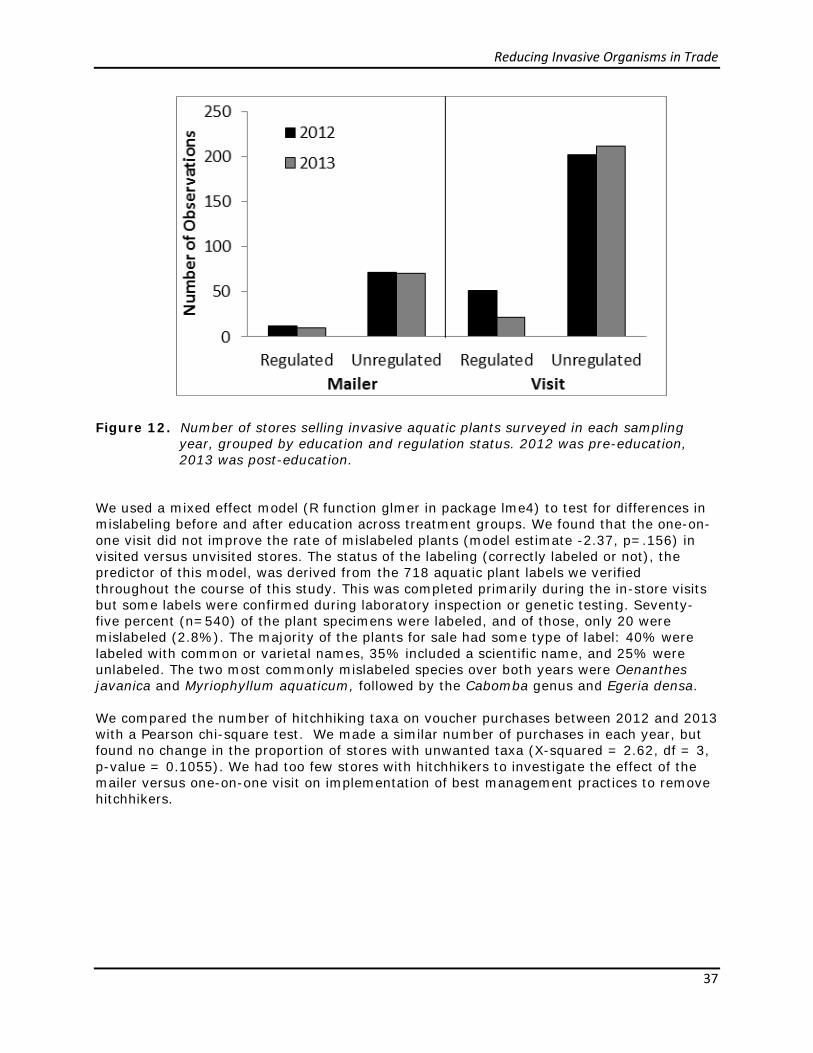
In 2013, labeling rates were similar in nursery and aquarium stores (p=0.4275). Only 19% of nursery stock and 26% of aquarium stock was unlabeled. Nursery stores were still more likely than aquarium stores to label using the full scientific name (42% vs 19%, respectively; p<0.001). Most species were correctly labeled all the time. Mislabeled species included Cabomba caroliniana hybrid (67% of labeled stock), Egeria densa (29%), parrotfeathers (Myriophyllum aquaticum, M. crispatum, “M. propium”, M. sp. red 1 and M. sp. red 2) (46%), Phragmites australis (29%), and Oenanthe javanica (19%). Mislabeling was more common in aquarium stores (10% of labeled stock) in 2013 than in nursery stores (3%; p<0.05). Aquatic plant purchases were made at 29 stores in 2013. Hitchhikers were received with only 14% of purchases in 2013, down from 2012. All of these included aquatic plants, with the genera Lemna, Azolla, and Egeria again found as hitchhikers. Schoenoplectus was a hitchhiker in one purchase, as well. Change in Stock, 2012-2013 We tested for significant changes in prevalence among the most common species found in retail stores with McNemars chi-squared (Table 9). The prohibited species decreased significantly, except Nymphoides peltata. Restricted species showed no change from 2012. Overall, 43% (3/7) of regulated species decreased. Most unregulated species did not change prevalence in 2013, with the exception of Phalaris arundinacea and Typha laxmannii. P. arundinacea and T. laxmannii are both invasive species, but neither were covered in the one-on-one education visit. The number of stores carrying regulated invasive plants decreased overall from 2012 to 2013, according to a McNemars chi-squared test on the number of stores carrying any regulated plants each year (Chi=14.7692, df=1, P=0.0001215). This means that there were more compliant stores in the second year of the survey: 46.3% of stores in this paired test carried a regulated species in 2012, while only 23.6% of stores in 2013 surveys were non-compliant. To formally assess the effectiveness of the outreach program across both sampling years, we tallied the number of regulated and unregulated invasive species offered for sale in stores grouped by education type (mailer regulated, mailer unregulated, visit regulated, visit unregulated). For this analysis, we included only the 90 stores that carried aquatic plants in both years of the study. We then used a 2x4 chi-square test to observe patterns in the species available in trade from 2012 to 2013. We used adjusted residuals (MacDonald and Gardner 2000) to compare among count categories. By comparing year-to-year changes in regulated species to year-to-year changes in a control group of unregulated invasive species, we were able to separate the effect of education from background changes in retail stock. We found that the visit plus mailer education was effective at reducing the number of regulated species in trade, while the mailer alone was not (Figure 12). The number of invasive species in trade varied across education/species group (X-squared = 11.056, df=3, p-value=0.011), with the number of regulated species in the visited group higher than expected in 2012 (adj. residual 2.91) and lower than expected in 2013 (adj. residual -2.93).
Reducing Invasive Organisms in Trade
37
Figure 12. Number of stores selling invasive aquatic plants surveyed in each sampling
year, grouped by education and regulation status. 2012 was pre-education, 2013 was post-education.
We used a mixed effect model (R function glmer in package lme4) to test for differences in mislabeling before and after education across treatment groups. We found that the one-on-one visit did not improve the rate of mislabeled plants (model estimate -2.37, p=.156) in visited versus unvisited stores. The status of the labeling (correctly labeled or not), the predictor of this model, was derived from the 718 aquatic plant labels we verified throughout the course of this study. This was completed primarily during the in-store visits but some labels were confirmed during laboratory inspection or genetic testing. Seventy-five percent (n=540) of the plant specimens were labeled, and of those, only 20 were mislabeled (2.8%). The majority of the plants for sale had some type of label: 40% were labeled with common or varietal names, 35% included a scientific name, and 25% were unlabeled. The two most commonly mislabeled species over both years were Oenanthes javanica and Myriophyllum aquaticum, followed by the Cabomba genus and Egeria densa. We compared the number of hitchhiking taxa on voucher purchases between 2012 and 2013 with a Pearson chi-square test. We made a similar number of purchases in each year, but found no change in the proportion of stores with unwanted taxa (X-squared = 2.62, df = 3, p-value = 0.1055). We had too few stores with hitchhikers to investigate the effect of the mailer versus one-on-one visit on implementation of best management practices to remove hitchhikers.
Reducing Invasive Organisms in Trade
38
Table 9. Changes in the number of stores carrying a particular species from 2012 to 2013. Table shows McNemar’s Chi-squared summary statistics. Cabomba caroliniana includes hybrids and Myriophyllum aquaticum includes varieties.
Scientific Name Common Name Regulation Status
M. Chi df p Change Direction
Cabomba caroliniana Cabomba, fanwort Prohibited 4.000 1 * Decrease
Egeria densa Anacharis Prohibited 10.032 1 ** Decrease
Myriophyllum aquaticum
Parrotfeather Prohibited 23.670 1 *** Decrease
Nymphoides peltata Yellow floating heart Prohibited 0.500 1 ns
Butomus umbellatus Flowering rush Restricted 1.330 1 ns
Phragmites australis Phragmites, common reed
Restricted 0.800 1 ns
Typha angustifolia Narrow-leaf cattail Restricted 0.000 1 ns
Arundo donax Giant reed Unregulated 0.000 1 ns
Eicchornia crassipes Water hyacinth Unregulated 0.000 1 ns
Iris pseudacorus Yellow iris Unregulated 0.840 1 ns
Limnophila sessiliflora
Ambulia Unregulated 0.250 1 ns
Lysimachia nummularia
Creeping Jenny Unregulated 0.410 1 ns
Marsilea mutica Nardoo, Australian water-clover
Unregulated 0.000 1 ns
Marsilea quadrifolia Water shamrock, European waterclover
Unregulated 0.000 1 ns
Myosotis scorpiodes Water forget-me-not Unregulated 2.720 1 ns
Nelumbo nucifera Sacred lotus Unregulated 2.290 1 ns
Nymphaea spp. Hardy water lilies Unregulated 1.530 1 ns
Oenanthes javanica Vietnamese or Chinese water-celery, Japanese parsley
Unregulated 0.056 1 ns
Peltandra virginica Green arrow arum, tuckahoe
Unregulated 1.330 1 ns
Pistia stratiotes Water lettuce Unregulated 0.740 1 ns
Phalaris arundinacea Reed canary grass Unregulated 5.786 1 * Decrease
Typha laxmannii Graceful cattail Unregulated 4.167 1 * Decrease

Reducing Invasive Organisms in Trade
39
2013 Outreach and Educational Efforts Outreach and educational efforts in 2013 focused on two audiences, retailers and consumers. The retailer component consisted of following-up with non-compliant retailers (see “Follow Up Enforcement Actions” below) and continuing correspondence with those that had remaining questions or concerns. The consumer component focused on two core audiences, educators and pond owners or water gardeners. During our 2012 educational visits with retailers, we were told repeatedly that biology teachers repeatedly requested one specific regulated invasive plant, Egeria densa. This knowledge led us to focus some of our consumer efforts directly on biology teachers, as described below. Teacher Outreach and Education Historically, Egeria densa, also known as anacharis or, incorrectly, as elodea, has been used by biology teachers to study cell structures and cellular processes like cytoplasmic streaming. Due to its ability to invade both still and flowing water ecosystems including lakes, ponds, ditches, and rivers, E. densa is listed as a prohibited invasive plant in Wisconsin. It can form dense stands that crowd out native vegetation and reduce an area’s value as a fish habitat; it can also interfere with recreational activities such as fishing and swimming. In order to address the issue of teachers continuing to seek out Egeria densa and other regulated species, we felt it necessary to communicate directly with teachers. Having an alternative to suggest to the educators was crucial to the success of our outreach. Luckily, there are alternative plants that biology teachers can use in their labs. Elodea canadensis is one native alternative to study. Another alternative is Egeria najas, also known as narrow-leaf anacharis. Both of these species are suitable for the general labs that E. densa has been used for in the past. We distributed a cover letter, the elodea brochure, and the aquatic plants handout to all middle and high school biology and general science teachers in Wisconsin. We obtained the names and addresses of the teachers from the Wisconsin Department of Public Instruction (DPI). The DPI also sent an email announcement out on our behalf to the Wisconsin science teachers’ listserv. During this process we also learned that both college professors and elementary school teachers were using E. densa, and in some cases, other regulated species. Thus we compiled a list of the appropriate contacts for all Wisconsin colleges, universities, and technical schools so that we could provide the same information about invasive aquatic plants to professors. This information was distributed via email in January 2014. Additional DNR staff will be contacting elementary school teachers in 2014 about this issue as well. Pond Owner and Water Gardener Outreach and Education Pond owners and water gardeners comprise one of the major consumer groups of aquatic plants purchased from plant nurseries. We reached out to this audience through two routes: indirectly through retailers and directly through direct mailings.
Reducing Invasive Organisms in Trade
40
In late July, 2013 we mailed packets of 30 pond brochures out to 325 retailers – all of which we confirmed were selling aquatics through our 2012 surveys. The pond brochure was distributed to these retailers to provide to their customers. In addition, these retailers received a cover letter, a handout on Elodea, and a picture guide to aquatic plants. This mailing went out to parent stores for all retailers and all of the Wisconsin locations for the chain stores Petco, Petsmart, and Menards. In early December 2013, we sent a cover letter, pond brochure, and aquatic plant guide directly to approximately 15,500 landowners that have ponds or other water bodies on or neighboring their properties. The recipients stemmed from seven counties in southeast Wisconsin. The goal of this effort was to directly educate pond owners about the risks of invasive species, how to identify them, and what to do about them on their properties. We identified recipients through geospatial analysis of water body locations in conjunction with county parcel ownership records. Response to both of these efforts was positive in that both retailers and consumers called or emailed to request further materials and express their participation. Critical to the success of our educational efforts were the development of educational materials. These publications along with the presentations that resulted from our efforts are described in the “Technology Transfer” chapter of this report. Follow Up Enforcement Actions In order to handle any non-compliant retailers in 2013, a cooperative agreement was finalized with Department of Agriculture, Trade, and Consumer Protection (DATCP) staff to clarify how any continued follow up actions would proceed. Internal DNR protocols were also finalized to address cross-program coordination. In May, educational and enforcement follow-ups began with the non-compliant stores found through the follow-up stock surveys.
• Non-compliant plant nurseries that received an educational visit were reported to the Wisconsin DATCP for cooperative enforcement follow-through.
• Non-compliant pet stores that received an educational visit were issued a notice of non-compliance by the Wisconsin DNR and went through the stepped enforcement process.
• Non-compliant retailers that did not receive an educational visit in 2012 received
educational communication from the Wisconsin DNR and follow-ups to ensure compliance.
During May and June 2013, project staff found regulated plant species remaining at 30 retailers. Regulated invasive fish and crayfish were found at two additional retailers. Of the 32 retailers reported, eight had not received educational visits in 2012. Seven retailers received in-person educational visits from the Wisconsin DNR, four retailers were issued a Notice of Non-compliance, and three retailers received educational information via mail. The remaining retailers were reported to the Wisconsin DATCP for cooperative enforcement. Compliance was achieved with all retailers where the stepped enforcement process was completed. However, seventeen of the cases reported to the Wisconsin DATCP were still in process at the end of 2013.

Reducing Invasive Organisms in Trade
41
During 2013, the Wisconsin DNR received a total of 48 reports of retailer invasive species regulation violations; well over half of these reports came directly from the efforts of this project. In 2012, the Wisconsin DNR received a total of 19 reports. The retailer violations found through this project in 2012 were not reported since educational follow-up was part of the study design. Without a concerted effort to look for violations, it is evident that many will go unchecked. This indicates the need for increased agency efforts to inspect for violations or for increased collaboration with partners. The public is always encouraged to report violations, and in 2014, AIS County Coordinators have been encouraged to engage with local retailers more to increase the likelihood of catching reoccurring violations. 2012 Urban Landscape Surveys This study also examined the relationship between AIS source availability and presence of AIS populations in small water bodies. We intended to observe which AIS sold in the live plant trade are found growing in ponds around areas with high retail availability, and whether or not proximity to retail store affected the AIS found. Additionally, we hoped to learn which types of ponds are susceptible either to planting and growth of AIS found in the live plant trade. The area selected for this portion of the study (Figure 13) was a developed region of southeastern Wisconsin, where numerous small water bodies, a relatively dense population, and several retail sources of live aquatic plants create many opportunities for novel introductions of invasive plants of trade. All ponds included in the study were within 5 km of a drainage to Lake Michigan and less than 5 acres in size. Pond selection was randomized across six strata relating to the dominant land use in a 500-m buffer around the pond (>50% agricultural, >50% developed, other; from 2006 National Land Cover Database) and retail availability of aquatic invasive species (high or low). High or low availability of aquatic invasive species was determined by the number of regulated species available for sale within close proximity. In the study area, the average distance from a random point to the third nearest store selling aquatic plants was 17 km, so 17 km was used as the distance threshold when counting invasive species. Ponds were considered to be in a high-availability area if there were greater than or equal to nine regulated species sold at stores within 17 km, and in a low-availability area if there were zero, one, or two regulated species sold at stores within 17 km (Figure 14).
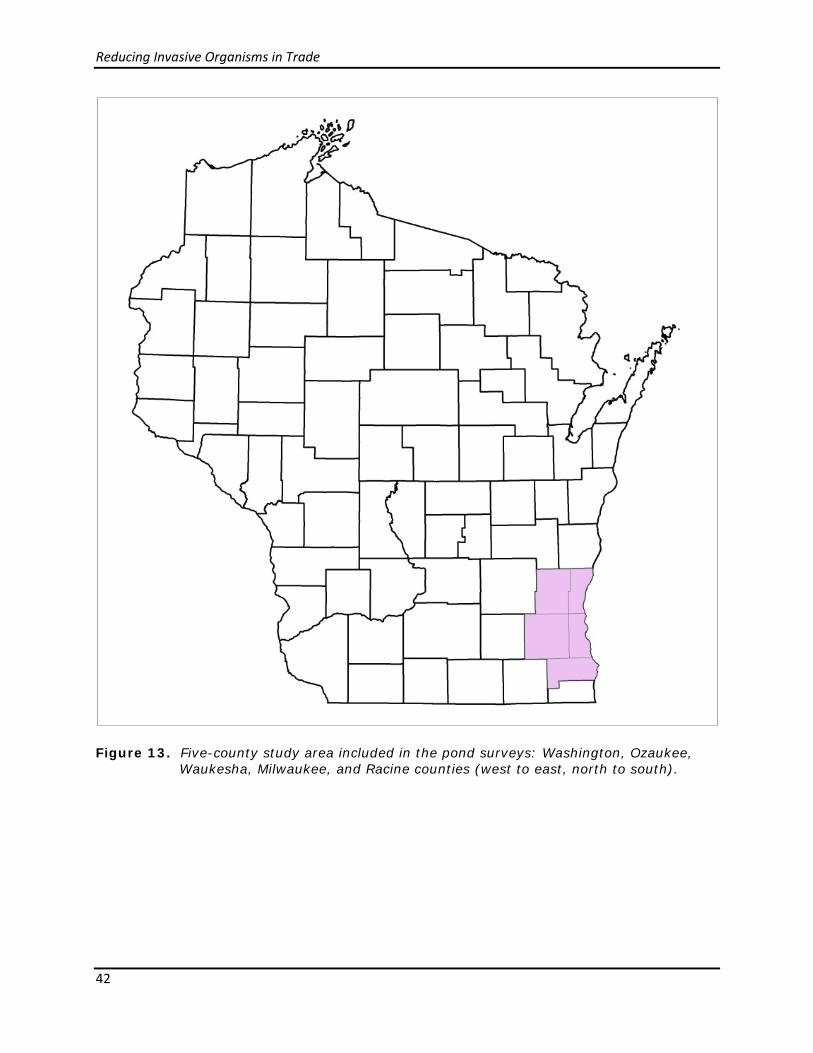
Reducing Invasive Organisms in Trade
42
Figure 13. Five-county study area included in the pond surveys: Washington, Ozaukee,
Waukesha, Milwaukee, and Racine counties (west to east, north to south).
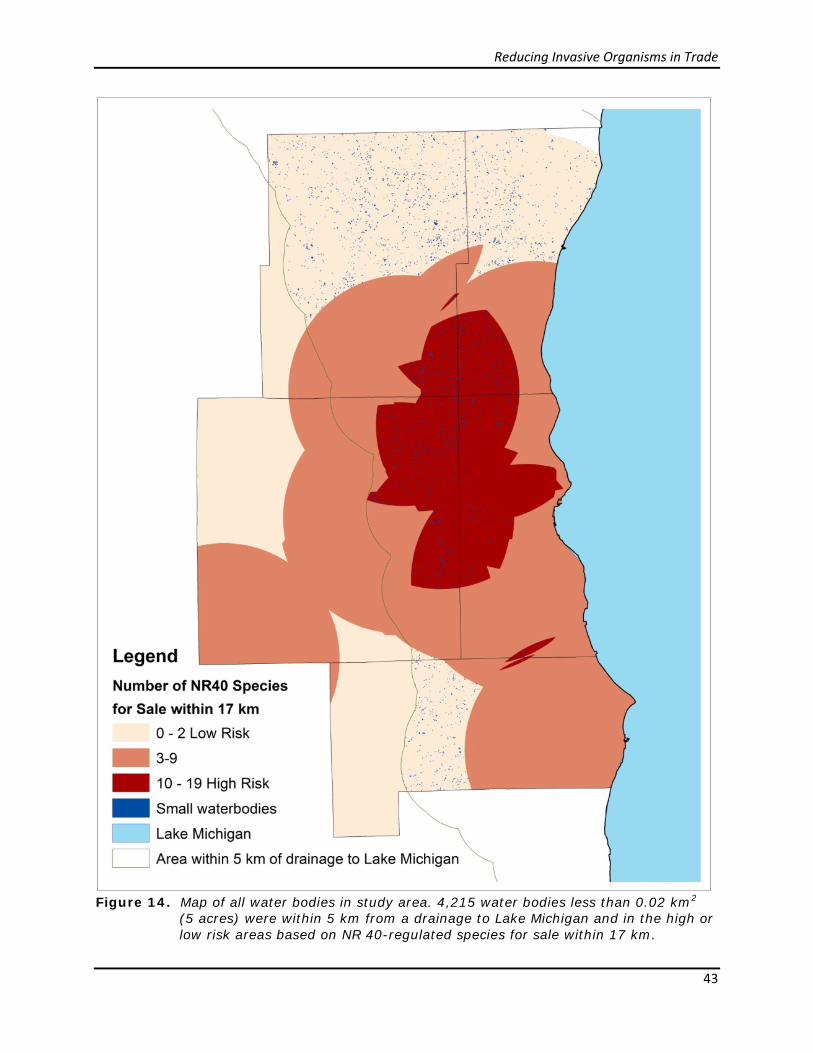
Reducing Invasive Organisms in Trade
43
Figure 14. Map of all water bodies in study area. 4,215 water bodies less than 0.02 km2
(5 acres) were within 5 km from a drainage to Lake Michigan and in the high or low risk areas based on NR 40-regulated species for sale within 17 km.

Reducing Invasive Organisms in Trade
44
Figure 15. Study area with the locations of the 148 surveyed ponds and the high and low
risk categories based on NR 40-regulated species for sale within 17 km.
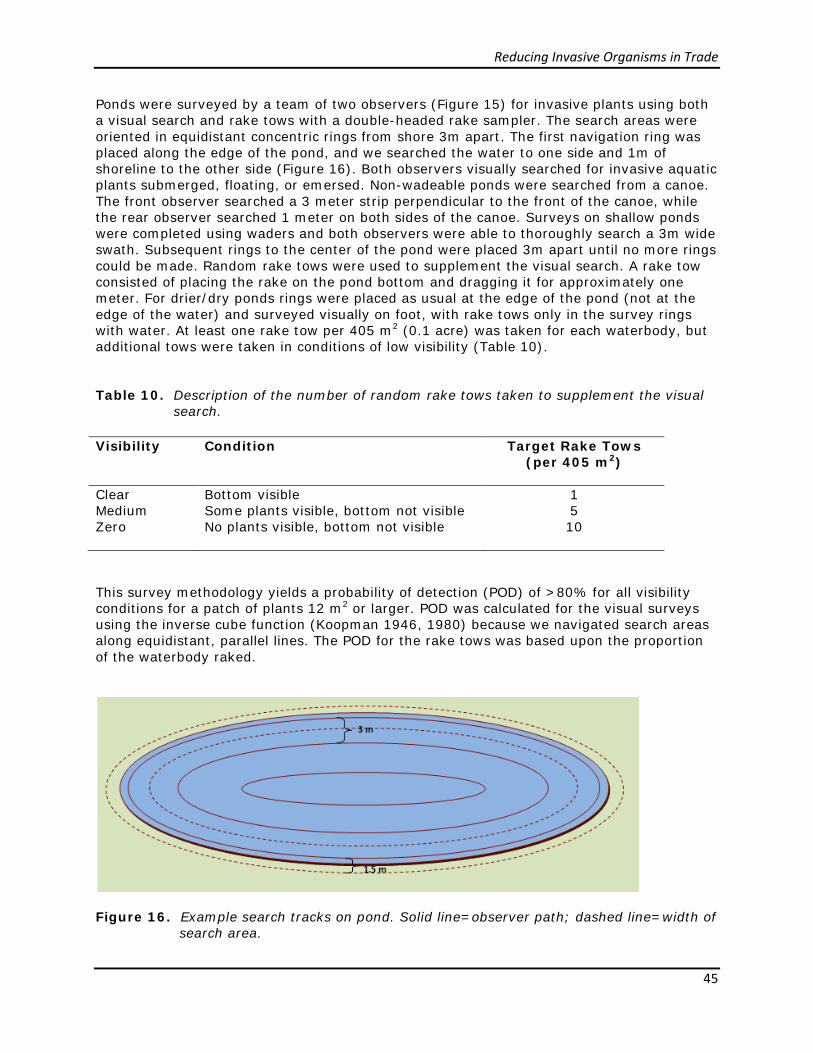
Reducing Invasive Organisms in Trade
45
Ponds were surveyed by a team of two observers (Figure 15) for invasive plants using both a visual search and rake tows with a double-headed rake sampler. The search areas were oriented in equidistant concentric rings from shore 3m apart. The first navigation ring was placed along the edge of the pond, and we searched the water to one side and 1m of shoreline to the other side (Figure 16). Both observers visually searched for invasive aquatic plants submerged, floating, or emersed. Non-wadeable ponds were searched from a canoe. The front observer searched a 3 meter strip perpendicular to the front of the canoe, while the rear observer searched 1 meter on both sides of the canoe. Surveys on shallow ponds were completed using waders and both observers were able to thoroughly search a 3m wide swath. Subsequent rings to the center of the pond were placed 3m apart until no more rings could be made. Random rake tows were used to supplement the visual search. A rake tow consisted of placing the rake on the pond bottom and dragging it for approximately one meter. For drier/dry ponds rings were placed as usual at the edge of the pond (not at the edge of the water) and surveyed visually on foot, with rake tows only in the survey rings with water. At least one rake tow per 405 m2 (0.1 acre) was taken for each waterbody, but additional tows were taken in conditions of low visibility (Table 10). Table 10. Description of the number of random rake tows taken to supplement the visual
search. Visibility Condition Target Rake Tows
(per 405 m2)
Clear Bottom visible 1 Medium Some plants visible, bottom not visible 5 Zero No plants visible, bottom not visible 10
This survey methodology yields a probability of detection (POD) of >80% for all visibility conditions for a patch of plants 12 m2 or larger. POD was calculated for the visual surveys using the inverse cube function (Koopman 1946, 1980) because we navigated search areas along equidistant, parallel lines. The POD for the rake tows was based upon the proportion of the waterbody raked.
Figure 16. Example search tracks on pond. Solid line=observer path; dashed line=width of
search area.
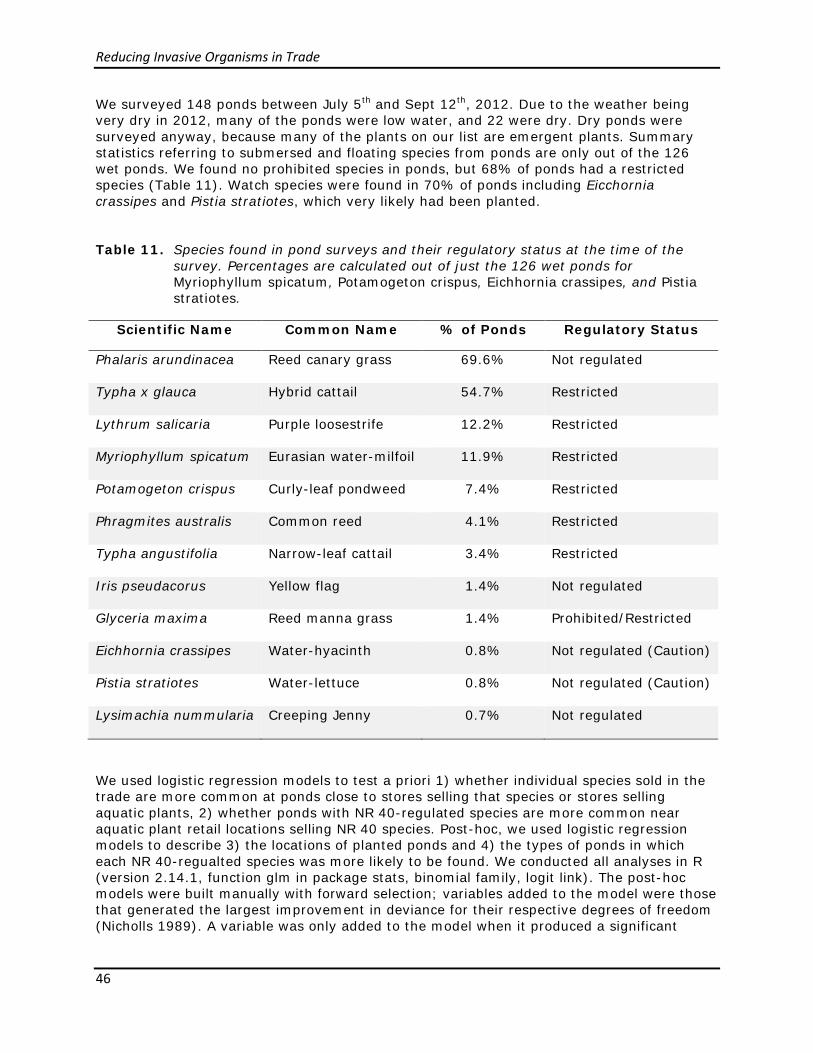
Reducing Invasive Organisms in Trade
46
We surveyed 148 ponds between July 5th and Sept 12th, 2012. Due to the weather being very dry in 2012, many of the ponds were low water, and 22 were dry. Dry ponds were surveyed anyway, because many of the plants on our list are emergent plants. Summary statistics referring to submersed and floating species from ponds are only out of the 126 wet ponds. We found no prohibited species in ponds, but 68% of ponds had a restricted species (Table 11). Watch species were found in 70% of ponds including Eicchornia crassipes and Pistia stratiotes, which very likely had been planted. Table 11. Species found in pond surveys and their regulatory status at the time of the
survey. Percentages are calculated out of just the 126 wet ponds for Myriophyllum spicatum, Potamogeton crispus, Eichhornia crassipes, and Pistia stratiotes.
Scientific Name Common Name % of Ponds Regulatory Status
Phalaris arundinacea Reed canary grass 69.6% Not regulated
Typha x glauca Hybrid cattail 54.7% Restricted
Lythrum salicaria Purple loosestrife 12.2% Restricted
Myriophyllum spicatum Eurasian water-milfoil 11.9% Restricted
Potamogeton crispus Curly-leaf pondweed 7.4% Restricted
Phragmites australis Common reed 4.1% Restricted
Typha angustifolia Narrow-leaf cattail 3.4% Restricted
Iris pseudacorus Yellow flag 1.4% Not regulated
Glyceria maxima Reed manna grass 1.4% Prohibited/Restricted
Eichhornia crassipes Water-hyacinth 0.8% Not regulated (Caution)
Pistia stratiotes Water-lettuce 0.8% Not regulated (Caution)
Lysimachia nummularia Creeping Jenny 0.7% Not regulated
We used logistic regression models to test a priori 1) whether individual species sold in the trade are more common at ponds close to stores selling that species or stores selling aquatic plants, 2) whether ponds with NR 40-regulated species are more common near aquatic plant retail locations selling NR 40 species. Post-hoc, we used logistic regression models to describe 3) the locations of planted ponds and 4) the types of ponds in which each NR 40-regualted species was more likely to be found. We conducted all analyses in R (version 2.14.1, function glm in package stats, binomial family, logit link). The post-hoc models were built manually with forward selection; variables added to the model were those that generated the largest improvement in deviance for their respective degrees of freedom (Nicholls 1989). A variable was only added to the model when it produced a significant

Reducing Invasive Organisms in Trade
47
change in deviance (p<0.05) over the simpler model and it lowered the Akaike Information Criterion (AIC) by at least two units. We did fit models with one variable even where the response was rare (m = 5-10). A small number (<10) of positive response events per variable (EPV) has been shown to affect the validity of the logistic regression model (Peduzzi et al. 1996), however others suggest this value is more appropriately four EPV or fewer (Vittinghoff and McCulloch 2007). This applied to predictive models of planted ponds (m=7), ponds with Typha angustifolia (m=5) and ponds with Phragmites australis (m=6). Explanatory variables considered for input into the models (Table 12) included pond characteristics such as size, type of pond, pond origin, presence of culverts or docks, and accessibility; site characteristics such as ownership, nearby use (within 30 meters), distance to nearest house, and whether or not it was connected to a wetland; regional characteristics such as position in the landscape, land use within 500 m2, degree of human activity (housing density and population density), and distance to nearest recorded wild population of a given species; socio-economic characteristics such as income and education level; and horticultural characteristics such as whether the pond was in a high or low availability area (17 km radius) of aquatic invasives or distance to various nursery or aquarium stores (i.e. those selling invasives or a particular species). Final models were checked for multicollinearity using Variance Inflation Factor (R function VIF) and validated using leave-one-out cross-validation (R function cv.glm from package boot) to estimate the prediction error rate of our models. To further determine each model’s ability to discriminate, the Receiver Operating Characteristic curve analysis was used (R function ROC from package Epi). The area under the ROC curve (AUC), also referred to as the c-statistic, indicates the ability of the model to discriminate between the binary outcomes. AUC ranges from 0.5, indicating a model with poor discriminatory power (i.e. less than chance), and 1, which indicates excellent discriminatory power (i.e. perfect). We tested all seven species found in both store surveys and pond surveys to see if ponds with a given species were closer to stores selling that species than ponds without (Table 13). We also tested for a relationship between the presence of any NR 40-regulated species in ponds and in stores. Although Lythrum salicaria was not found to be currently sold, historically it has been offered for sale in the horticultural trade so we also tested the relationship for that species as well, based on distance to any nursery store. L. salicaria and aggregated NR 40-regulated species were the only significant tests; in both cases ponds closer to retail outlets were more likely to have L. salicaria (P=0.03) and NR 40-regulated species on aggregate (P=0.005). The other seven species did not show any relationship between pond presence and retail outlet.

Reducing Invasive Organisms in Trade
48
Table 12. Variables used in logistic regression models. All variables requiring calculations in mapping software used ArcGIS 10.1 and Geospatial Modeling Environment. WROC=Wisconsin Regional Orthophotography Consortium.
Variable Type Unit Source
Pond
Size numeric m2 WROC imagery, 6-18" resolution Pond dry categorical 2 levels: yes/no 2012 field observation Stormwater pond categorical 2 levels: yes/no 2012 field observation Pond origin categorical 2 levels: natural/artificial 2012 field observation Presence of a culvert categorical 2 levels: yes/no 2012 field observation Presence of a dock categorical 2 levels: yes/no 2012 field observation Accessible to public categorical 2 levels: yes/no 2012 field observation Site
Site use within 30 m categorical 4 levels: natural/residential/ commercial/urban park
WROC imagery, 6-18" resolution
Ownership categorical 3 levels: public&nonprofit/ individual/commercial
County Register of Deeds
Golf course categorical 2 levels: yes/no 2012 field observation Distance to nearest house numeric m WROC imagery, 6-18" resolution Adjacent wetland categorical 2 levels: yes/no 2012 field observation/24k USGS topo map Regional
Landscape position categorical 2 levels: Low position/ other DNR base hydrography layers following Riera et al. 2000 (Low=score of 1+, other<0)
Majority land use within 500 m categorical 3 levels: agricultural/ developed/other
2006 National Land Cover Database
Housing density numeric n houses per km2 U.S. Census Bureau; by 2010 census tract Population density numeric n individuals per km2 U.S. Census Bureau; by 2010 census tract Distance to urban area numeric km U.S. Census Bureau; 2010 Urbanized Area (>50,000
pop.) Distance to nearest recorded wild population of a given sp.
numeric km DNR SWIMS database, WI State Herbarium, and Great Lakes Early Detection Network
Table 12 continues on next page.
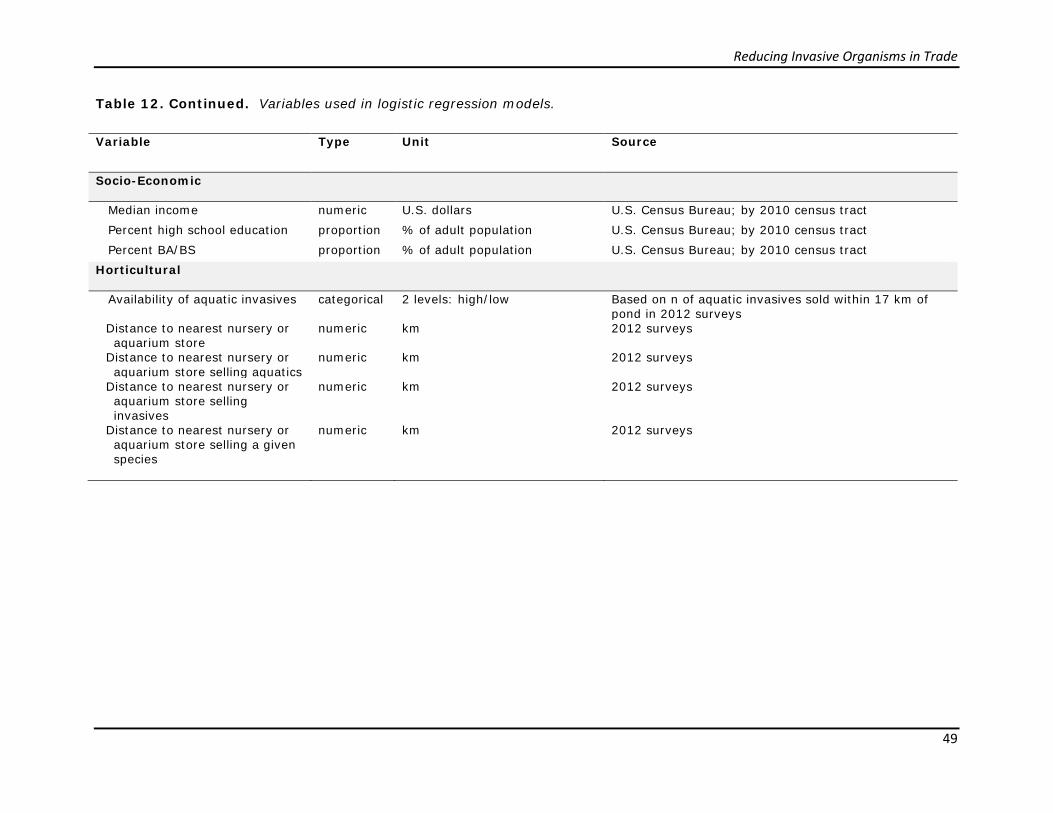
Reducing Invasive Organisms in Trade
49
Table 12. Continued. Variables used in logistic regression models.
Variable Type Unit Source
Socio-Economic
Median income numeric U.S. dollars U.S. Census Bureau; by 2010 census tract Percent high school education proportion % of adult population U.S. Census Bureau; by 2010 census tract Percent BA/BS proportion % of adult population U.S. Census Bureau; by 2010 census tract Horticultural
Availability of aquatic invasives categorical 2 levels: high/low Based on n of aquatic invasives sold within 17 km of pond in 2012 surveys
Distance to nearest nursery or aquarium store
numeric km 2012 surveys
Distance to nearest nursery or aquarium store selling aquatics
numeric km 2012 surveys
Distance to nearest nursery or aquarium store selling invasives
numeric km 2012 surveys
Distance to nearest nursery or aquarium store selling a given species
numeric km 2012 surveys

Reducing Invasive Organisms in Trade
50
Table 13. Results from binary logistic regression models describing species presence in ponds due to proximity to retail stores. “NR 40 species” refers to any species listed as prohibited or restricted. DV=dependent variable, IV=independent variable. Wald z-statistic and result of likelihood ratio test (LRT) on the model deviance are shown. Species currently regulated under NR 40 are indicated by *.
DV(presence/absence) IV (distance to …) Estimate Std.
Error z value
Pr
(>z) LRT
Eichhornia crassipes store selling EICCRA -0.3459 0.4242 -0.815 0.415 ns
Glyceria maxima* store selling GLYMAX -0.1104 0.1025 -1.077 0.282 ns
Iris pseudacorus store selling IRIPSE -0.0079 0.0577 -0.136 0.892 ns
Lysimachia nummularia store selling LYSNUM -0.3386 0.4266 -0.794 0.427 ns
Lythrum salicaria* aquatic nursery store -0.0585 0.0298 -1.966 0.049 *
Phragmites australis* store selling PHRAUS -0.0551 0.0489 -1.127 0.260 ns
Pistia stratiotes store selling PISSTR -0.3968 0.4043 -0.981 0.326 ns
Typha angustifolia* store selling TYPANG 0.0405 0.0297 1.364 0.172 ns
NR 40 Species store selling NR 40-regulated species
-0.1110 0.0392 -2.834 0.005 **
Figure 17. Predicted probability of a planted pond based on distance to nearest house.
UL=upper limit (95% confidence) LL=lower limit (95% confidence).
0
0.1
0.2
0.3
0.4
0.5
0 50 100 150 200 250 300 350 400Prob
abilt
y of
Pla
nted
Pon
d
Distance to Nearest House (m)
Predicted Probability of Planted Pond Predicted
UL
LL

Reducing Invasive Organisms in Trade
51
Planted ponds were defined as ponds where we found horticultural varieties of plants (e.g., variegated plants), trade species not yet commonly found in the wild in Wisconsin (Eicchornia crassipes, Pistia stratiotes), landscaping, plants in buckets, or where we were told by the landowner that the pond had been planted. We found seven ponds out of 148 that fit these criteria (4.7%). The logistic regression model suggested that ponds closest to houses were more likely to be planted (P=0.03, cross-validated error 0.054, AUC=0.707, Figure 17). A number of ponds close to houses weren’t planted, so the positive predictive value of the model is low (2%), but the negative predictive value is very high (87.8%). Horticultural variables were important in just two of the seven species for which we created individual species models: Lythrum salicaria and Phalaris arundinacea were both more common closer to stores (Table 14). The site use immediately buffering the pond (30-m) was also important to the L. salicaria model, with both commercial sites and urban parks more likely to have purple loosestrife than a natural site (P=0.03, P=0.04, respectively), although residential buffer use did not predict presence of L. salicaria (P=0.20). Stormwater ponds were less likely to have P. arundinacea present (P=0.00001), but ponds near stores selling NR 40-regulated species (P=0.02) and low in the landscape (P=0.07) were both more likely to contain P. arundinacea. Phragmites australis was more common in ponds near urban areas, while Typha angustifolia presence was best explained by being near a wetland. However, the T. angustifolia model was not significant by the likelihood ratio test, and had poor discriminatory ability (AUC=0.662). This may partially be because occurrences were rare in our dataset (only 5 ponds had T. angustifolia). The hybrid cattail model (T. X glauca) performed almost as poorly (AUC=0.677), with presence most strongly predicted by presence of T. latifolia, the broad-leaved cattail and stormwater ponds. Myriophyllum spicatum was most common in larger ponds and ponds closer to other wild populations of M. spicatum. Finally, curly-leaf pondweed presence was most likely in ponds occurring on a golf course. In addition to the logistic regression models, we tested whether or not invasive plants from trade that we found on the landscape were more commonly sold in stores than invasives from trade that were not found on the landscape. We tested this with a non-parametric Mann-Whitney U-test (R function wilcox.test). We found that invasives that were present in ponds were more widely available in stores (W=241.5, P=0.02). Species found in ponds were sold in a mean of 32.4 stores, while species not found in ponds were sold in a mean of only 5.1 stores. This was true when just looking at species sold in the aquarium trade, as well (W=64, P=0.0173). The presence in stores reflects the popularity of a plant and therefore should be an indication of the relative number of propagules able to disperse onto the landscape through planting. A study of availability of invasives in the horticultural trade in Britain also found that market presence was related to probability of a species escaping (Dehnen-Schmutz et al. 2006). Finally, we created a risk map of predicted ch. NR 40 species presence in ponds statewide (Figure 18). We based this on the model predicting ch. NR 40 species presence, but modified the ownership term because this information was not readily available for all counties. The next best term was site use in the 30-m buffer around the pond (residential use or not; see Table 15), and this we were able to determine from aerial photographs for all ponds. The risk map indicates that most of southeastern Wisconsin is at higher risk for invasive species, but also that a large section of northwestern Wisconsin around the populated areas of Eau Claire and Hudson (Minneapolis-St. Paul metro area) is at higher risk. In these areas, there are a number of ponds close to houses as well as stores selling regulated species. Based on this map, Lake Michigan has a much higher threat of introduction from horticultural aquatic plants in Wisconsin than does Lake Superior.

Reducing Invasive Organisms in Trade
52
Table 14. Results of binary logistic regression models predicting presence/absence of the most common invasive plant species found in the pond surveys. All models use the entire dataset (n=148) except for MYRSPI and MYRCRI, which use ponds that had water only (n=126). DV=dependent variable, IV=independent variable, term Pr is the result of Wald’s test, CV=leave one out cross-validation, PV+=positive predictive value, PV-=negative predictive value, AUC=Area under the ROC curve, and LRT=likelihood ratio test. Species codes: LYTSAL=Lythrum salicaria, TYPANG= Typha angustifolia, PHRAUS=Phragmites australis, PHAARU=Phalaris arundinacea, TYPXGLA=Typha X glauca, TYPLAT=Typha latifolia, MYRSPI=Myriophyllum spicatum, POTCRI=Potamogeton crispus.
Model Variables DV~ IV (level)
Estimate Std. Error
Pr (>|z|)
CV Error
PV+ (%)
PV- (%)
AUC LRT
LYTSAL~ km to aquatic plant store 30-m buffer use (comm) 30-m buffer use (park) 30-m buffer use (resid)
-0.2463 2.3681 2.8236 1.4259
0.1155 1.0962 1.3860 1.1133
* * * ns
0.129 4.2 73.1 0.79 ***
TYPANG~ Adjacent wetland
2.0794
0.9653
* 0.034 2.2 84.6 0.662 ns
PHRAUS~ km to urban area
-1.9566
1.7283
ns 0.041 0.0 91.4 0.732 **
PHAARU~ Stormwater pond km to store selling NR 40 Low landscape position
-1.5460 -0.1026 1.9717
0.4189 0.0435 1.0960
*** * ns
0.297 52.6 11.4 0.742 ***
TYPXGLA~ TYPLAT Stormwater
1.9102 0.8256
0.5829 0.3682
** *
0.351 40.0 30.1 0.677 ***
MYRSPI~ Size (m2) km to wild MYRSPI
0.0002
-0.2089
0.0001 0.0974
** *
0.127 4.7 72.5 0.747 ***
POTCRI~ Golf course pond
3.4380
0.842
*** 0.071 5.1 37.5 0.714 ***
Table 15. Results of the binary logistic regression model predicting presence/absence of ch.
NR 40 species used for the risk map. DV=dependent variable, IV=independent variable, term Pr is the result of Wald’s test, CV=leave one out cross-validation, PV+=positive predictive value, PV-=negative predictive value, AUC=Area under the ROC curve, and LRT=likelihood ratio test.
Model Variables DV~ IV (level)
Estimate Std. Error
Pr (>|z|)
CV Error
PV+ (%)
PV- (%)
AUC LRT
NR40~ 30-m buffer use (resid) km to nearest house Size km to store selling NR40
-1.4389 -0.0037 0.0002
-0.1066
0.470 0.001 0.000 0.042
** ** * *
0.298 30.6 19.6 0.741 ***

Reducing Invasive Organisms in Trade
53
Figure 18. Risk map showing predicted probability of a pond having a ch. NR 40-listed
species, based on the logistic regression model shown in Table 15.
Reducing Invasive Organisms in Trade
54
Technology Transfer Presentations and Displays Resulting from Work
• Webinar meeting participation: Protecting the Great Lakes from the Internet Trade of Aquatic Invasive Species. Great Lakes Commission webinar on January 14, 2013.
• Oral presentation: “Invasive species regulation revision and GLRI aquatic plants in trade project,” DATCP Nursery Inspectors Meeting in Madison, WI, on February 12, 2013.
• Oral presentation: “Invasive Species in Trade -- Coming to a Wetland Near You?” Wisconsin Wetlands Association 18th Annual Conference in Sheboygan, WI, on February 13, 2013.
• Oral presentation: “Live Plants in Trade,” Wisconsin Lakes Partnership Meeting in Boulder Junction, WI, on February 20, 2013.
• Oral and webcast presentation: “Working with Live Plant Retailers to Reduce the Availability of Aquatic Invasive Plants in Wisconsin,” DNR Science Services Seminar Series in Madison, WI, on February 22, 2013.
• Poster presentation: “Landscape Risk Assessment of Invasive Aquatic Plants in Southeast Wisconsin Ponds”, Wisconsin DNR Science Open House, Madison, WI, on March 1, 2013. (Poster - see Appendix P)
• Educational display: The use of aquatic invasive plants in the classroom, Wisconsin Society of Science Teachers Annual Conference in Wausau, WI, on March 14 -16, 2013.
• Oral presentation: “Invasive Aquatic Plants in Trade: Quantifying Availability and Risk to Wisconsin Waters,” Wisconsin Lakes Partnership Convention in Green Bay, WI, on April 10, 2013.
• Regional meeting participation: Invasive Ornamental Working Group Symposium at the Chicago Botanical Gardens on October 3, 2013.
• Oral presentation: Aquatic Invasive Species Coordinators Annual Fall Meeting in Stevens Point, WI, on October 29, 2013.
• Regional meeting participation: Protecting the Great Lakes from the Internet Trade of Aquatic Invasive Species. Great Lakes Commission in Detroit, MI on November 20, 2013. (participated remotely)
• Poster presentation: Final results of project. Wisconsin Lakes Convention in Stevens Point on April 24-26, 2014.
Publications Resulting from Work Species Lists and Resources for Pet and Aquarium Stores – Appendix D
Invasive Aquatic Plants and Their Other Names – Appendix G Are your snails okay? – Appendix H Crayfish and the Invasive Species Rule – Appendix I
Chapter NR 40 Regulated Plants – Appendix J (revision only) Brochure: Protect Your Pond or Water Garden – Appendix K Brochure: Make the Right Choice about Elodea – Appendix L

Reducing Invasive Organisms in Trade
55
Information and Education Products Outreach letter for Pet and Aquarium Stores – Appendix E
Outreach letter for Aquatic Plant Nurseries – Appendix F Teacher mailing cover letter – Appendix M Pond retailer mailing cover letter – Appendix N
Pond owner mailing cover letter – Appendix O Peer-reviewed Journal Articles We have three journal articles that are currently in preparation to be submitted to peer-reviewed journals:
• The impacts of educational efforts as demonstrated in retailer response to mailed social survey
• Availability of aquatic invasive plants in the live plant trade before and after education on invasive species regulations
• Patterns of invasive species occurrence and relationship to the aquatic plant trade in small water bodies across an urbanized landscape in Wisconsin

Reducing Invasive Organisms in Trade
56
Lessons Learned, Recommendations, and Future Work Retailer Awareness of Invasive Species & Understanding of Laws Through this study we sought to increase retailer awareness of invasive species and understanding of Wisconsin’s invasive species laws. We sought to measure the change in awareness and understanding through direct questions in the social surveys and through observed behaviors in the retailer stock surveys. Our survey results highlight part of the picture, but our in-person experiences with retailers, and our involvement with regional industry discussions and meetings provided additional pieces of information to synthesize. With all of these pieces in mind, we can paint a fairly complete picture of retailer awareness of invasive species and understanding of the associated laws. This study provided additional information that will be used by Wisconsin DNR staff to inform current partnerships and future interactions with the plant industry. Above all, this effort provided ten Wisconsin DNR with an opportunity to engage with the industry out on the landscape in a new way, which has helped to establish better working relationships and general good will between the regulators (Wisconsin DNR) and the regulated industry. During several site visits, retailers expressed their gratitude for the individual attention and the education-first approach towards enforcement. Some retailers engaged with Wisconsin DNR staff beyond the formal visits, such as through the collaborative Sea Grant workshop and additional communications when seeking to have questions answered. In an email correspondence after receiving additional educational materials in 2013, one such retailer commented,
“I wanted to say thank you for the ‘Protect Your Pond or Water Garden’
brochures and the ‘Know Your Plants - Know the Rules’ publication that you sent. They are very helpful to me and my staff, as well as our customers in making sure we are doing the right things for the Wisconsin environment. As always, I appreciate the positive, cooperative, proactive approach that you and the DNR are taking in trying to prevent the introduction of invasive aquatic species in or state. I commend your efforts and look forward to helping in any way that I can.”
Comments such as this are encouraging, even though they do not quantitatively demonstrate our success. They do, however, reinforce our measures and provide a qualitative element that is invaluable. While we saw a general increase in awareness and knowledge, some disappointments remained. Following the 2013 round of the social survey, a small number of retailers still reported planning to sell regulated invasive species (4.7% of respondents reported that they planned to sell parrot feather, Myriophyllum aquaticum). This percentage was down considerably from the 8.0% that planned to sell M. aquaticum in 2012, but our aim was to get that percentage down to 0%. Why would retailers still plan to sell a regulated plant after learning that it is prohibited? Parrot feather has been a widely popular landscaping plant in the past. It is possible that retailers plan to continue its sale despite knowing of its prohibition. However, it is also possible that the few retailers that planned to continue its sale did not realize that that specific plant was regulated. On two occasions following up with retailers that continued to sell regulated species after being educated through several venues, the retailer claimed to have not realized that the plant was regulated, and quickly pulled the plant from sale upon learning of its status. This situation could be a direct reflection of the plant familiarity and naming challenges described in the “Effectiveness of Outreach & Educational Efforts” discussion which follows. The retailers could be generally familiar with the regulations, have reviewed the regulated plant lists, and have missed a few of the regulated plants.
Reducing Invasive Organisms in Trade
57
Conversely, it is possible that retailers were aware of the prohibition and continued its sale because there was little perceived threat of repercussion for continuing the sale. In the coming years, consistent enforcement of the regulations across the state will be vital to ensure that this does not become a common practice. Following the 2013 round of the social survey, 25.5% of respondents still felt that they were “not at all knowledgeable” about Wisconsin’s invasive species regulations. Perhaps these respondents never opened the outreach packet that arrived in the mail, or perhaps the information delivery method was inadequate to reach them. It is hard to say. It would be worthwhile to follow-up directly with these retailers to determine what form of education would work for them initially. At the same time, 28% of respondents felt they were just “a little knowledgeable” and 43.2% of respondents felt they were either “somewhat,” “very,” or “extremely” knowledgeable about invasive species regulations. Both of these numbers slightly increased from 2012 when 27.1% where “a little knowledgeable” and 35.6% either “somewhat,” “very,” or “extremely” knowledgeable. For the majority of the respondents, the educational efforts we delivered at a minimum provided a foundation for increasing their understanding. Over time, with increased educational efforts we would expect to see this trend continue. Availability of Regulated Species in Trade Although we did not find any evidence that the informational mailer reduced the prevalence of invasive species in stores, the educational outreach visit to retailers did. Across all stores, we detected 2012 to 2013 decreases in the most common regulated species, as well as an improvement in the number of stores compliant with the regulations. This is encouraging that many retailers responded quickly to become compliant with the invasive species regulations. There is additional work to be done: 23.6% of stores were still noncompliant in 2013. Not all regulated species decreased. Nymphoides peltata, Butomus umbellatus, Phragmites australis, and Typha angustifolia were still being sold and did not show any reductions from 2012 to 2013 stock surveys. However, all of these species were relatively uncommon in the 2012 surveys to begin with; the most common species was only present in 3% of stores. It is possible that these species were more widely recognized as invasive (either by customers or retailers) due to their presence and impacts in the wild in Wisconsin. Other invasive species present or widespread in the state that reportedly were sold in the live plant trade, but not found in our surveys, include Myriophyllum spicatum and Lythrum salicaria. If this is a contributing factor to the baseline presence of the restricted species, then education about up-and-coming (prohibited) invasive plants targeting water gardeners, pond owners, and aquarists may help reduce further the demand for prohibited species and help prevent their introduction to the state. Our analysis shows that although mislabeling is rare in the live plant trade overall, several species continue to be mislabeled. Those identified previously include Myriophyllum spp. and Egeria densa (Thum et al. 2012). However, we also found Cabomba caroliniana to be mislabeled. Egeria densa’s mislabeling issues appear to arise from historical name changes as well as crypsis with other closely related species (Egeria najas, Elodea canadensis, Hydrilla verticillata). The mislabeling issues we observed with Myriophyllum aquaticum and Cabomba caroliniana appear to also be due to breeding and changes occurring with the species in the trade: hybridization and development of varieties. These are not well identified and pose a considerable hurdle for regulatory agencies to enforce regulations prohibiting these two

Reducing Invasive Organisms in Trade
58
species. Furthermore, a plant unidentifiable morphologically and genetically was found in our surveys (Myriophyllum sp. ‘propium’), despite the Myriophyllum genus being relatively well-sequenced (Aiken 1981, Moody and Les 2010, Thum et al. 2012). Although hitchhiking species are concerning as an invasion pathway, we did not commonly find them on purchases in our study. Other studies of hitchhikers on aquatic plants have found much higher rates of unwanted taxa (>90%; Maki and Galatowitsch 2004, Keller and Lodge 2007); however, these included non-vegetative propagules whereas our study did not. This is not to say that unwanted taxa purchased on plants pose little risk: hitchhiking hydrilla (Hydrilla verticillata) was responsible for the only known population of hydrilla found to date in Wisconsin. Multiple stores in our study had the regulated parrot feather (Myriophyllum aquaticum) hitchhiking in unregulated emergent plants that were not purchased as vouchers. We did not observe any changes in the prevalence of unwanted taxa between 2012 and 2013. Had stores incorporated recommended best management practices to remove contaminant plants and animals prior to sale, we would have expected to see a decrease in the presence of hitchhikers. The biological results as well as the social survey results indicate that most stores did not implement preventative procedures to remove hitchhiking organisms. It is somewhat surprising that we did not observe any increases in unregulated species to compensate for the decreases in regulated plants. Stores would be expected to find alternatives to the regulated plants in order to continue to offer their customers a variety of plants for their water gardens or aquaria. It is possible that they did not find alternatives as quickly as they were able to pull regulated stock from their shelves, and this might change if annual surveys were continued. Alternatively, the replacements selected may have been non-invasive plants already available in the trade or native species and therefore not tracked in this study. The introduction of new species into the live plant trade from new climates and regions of the world has been identified as a major contributor to future waves of horticultural-mediated invasions (Bradley et al. 2012). Continued vigilance and periodic assessment of species introduced into trade will be required to ensure that species adopted do not pose an invasion risk in Wisconsin or the Great Lakes region. Table 16 lists several species observed frequently in our surveys but not tracked formally. Future studies could evaluate these species for invasiveness in the Great Lakes region using available risk assessment tools, or alternatively screen them for a “green” list (Dehnen-Schmutz 2011). Effectiveness of Outreach and Educational Efforts We measured the overall effectiveness of our educational efforts by the self-reported information in the completed social surveys as well as by in-store stock surveys completed before and after the educational efforts. Overall, our results showed an increase in compliance for both the visited and unvisited groups, suggesting that the educational approach of sending informational mailings was successful. However, no significant difference was found between the magnitude of change in the visited versus the unvisited groups. Initially, this may be a good sign for regulators and land managers – the impact of mailed outreach materials was not significantly different than the impact of in-person educational visits. It is considerably less resource-intensive to mail or email materials than it is to physically visit someone in person. However, when it comes to implementing a truly effective educational approach for behavior change, the real lesson here may not be that publications and in-person learning are equally valuable – rather the lesson may be that one visit is not enough.

Reducing Invasive Organisms in Trade
59
Changing behavior is a complex task that has received attention in diverse fields ranging from environmental education, to healthcare, to resource management, and social marketing. Research from the field of environmental education has demonstrated that one-time visits are valuable, but that repeated and ongoing environmental experiences are most effective (Falk & Falling, 1980; Knapp, 2000; Koran, et al, 1989). Our educational approach acknowledged this in that the “visited” group had at least two incidents of contact, versus one incident of contact for the unvisited group. However, insights from this field suggest that additional visits, repeated points of contact, would be needed to see a significant difference between the two groups. Even one more educational contact may have been enough to tip the scales between the visited and unvisited groups. Additional studies would be needed to affirm this. What we learned both quantitatively and qualitatively throughout this project has helped us form recommendations for future outreach and enforcement. Through our efforts we have developed a useful outreach approach and recognized several major gaps that needed to be addressed with this particular regulated community. Each in-person visit was tailored to the needs of the retailer to the extent feasible. However the nature of the visits had some limitations. Each visit was unannounced and varied per the time the owner or manager had available. The basics of the regulations were explained and the educational packet included resources to help the retailers understand the regulations completely. Wisconsin’s invasive species regulations are complex and a full understanding of them requires further study than a twenty minute tutorial. Those retailers that attended supplemental workshops or did their own personal study would have developed a much better familiarity with the regulations than those that did not go beyond what was provided. To address the needs of this regulated community in the future, it would prove valuable to make multiple educational opportunities available such as providing workshops in coordination with trade organizations, online resources and tutorials, and in-person visits where appropriate. Two other issues that became clear during this project where retailers lack of familiarity with certain plants and differences in naming conventions. Addressing these issues will be vital in all future outreach efforts. Every retailer has a different level of knowledge related to plants – some are trained botanists, some have training through working in the industry, and some have a mix of other related training from a variety of sources. For pet stores in particular, some retailers may have no training in plant identification at all. This range of knowledge means that not all retailers will be familiar with all of the listed regulated plants. While Wisconsin’s regulations list only about sixteen purely aquatic plant species, the regulations cover over seventy-five individual plant species. The learning curves related to becoming familiar with all regulated plant species varies widely for Wisconsin retailers. In addition to basic familiarity with plants, retailers in the plant industry face another challenge in regards to the naming of plants. It is well understood within the biological fields that species may have many different common names which vary by region or due to other factors. For this reason, the scientific community relies upon the scientific or Latin names of species to ensure that communication can happen about species consistently across regional or national boundaries. Within the plant industry species are often only known by a common name, or may additionally be known by a specific trade name. This means retailers may not be familiar with the current scientific names regulated species are listed under. In an effort to address this issue, Wisconsin has available a master list of known synonyms for regulated species (common, scientific, and trade names). This is a resource that has been valuable for Wisconsin retailers, but we found additional resources were needed to address this issue for aquatic plant retailers. This was the primary reason that the resource Invasive Aquatic Plants and Their Other Names (Appendix G) was created during this project. This resource focused in on the top eight aquatic plants that retailers were most likely to encounter to help focus awareness. This
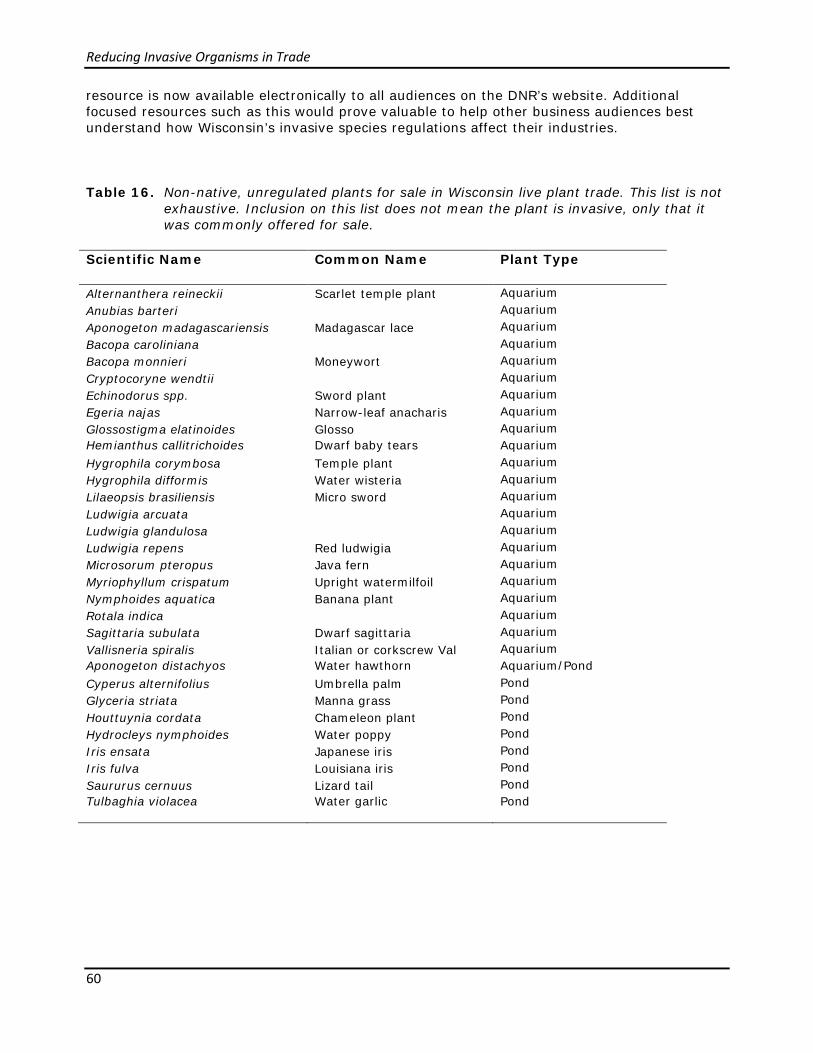
Reducing Invasive Organisms in Trade
60
resource is now available electronically to all audiences on the DNR’s website. Additional focused resources such as this would prove valuable to help other business audiences best understand how Wisconsin’s invasive species regulations affect their industries. Table 16. Non-native, unregulated plants for sale in Wisconsin live plant trade. This list is not
exhaustive. Inclusion on this list does not mean the plant is invasive, only that it was commonly offered for sale.
Scientific Name Common Name Plant Type
Alternanthera reineckii Scarlet temple plant Aquarium Anubias barteri Aquarium Aponogeton madagascariensis Madagascar lace Aquarium Bacopa caroliniana Aquarium Bacopa monnieri Moneywort Aquarium Cryptocoryne wendtii Aquarium Echinodorus spp. Sword plant Aquarium Egeria najas Narrow-leaf anacharis Aquarium Glossostigma elatinoides Glosso Aquarium Hemianthus callitrichoides Dwarf baby tears Aquarium Hygrophila corymbosa Temple plant Aquarium Hygrophila difformis Water wisteria Aquarium Lilaeopsis brasiliensis Micro sword Aquarium Ludwigia arcuata Aquarium Ludwigia glandulosa Aquarium Ludwigia repens Red ludwigia Aquarium Microsorum pteropus Java fern Aquarium Myriophyllum crispatum Upright watermilfoil Aquarium Nymphoides aquatica Banana plant Aquarium Rotala indica Aquarium Sagittaria subulata Dwarf sagittaria Aquarium Vallisneria spiralis Italian or corkscrew Val Aquarium Aponogeton distachyos Water hawthorn Aquarium/Pond Cyperus alternifolius Umbrella palm Pond Glyceria striata Manna grass Pond Houttuynia cordata Chameleon plant Pond Hydrocleys nymphoides Water poppy Pond Iris ensata Japanese iris Pond Iris fulva Louisiana iris Pond Saururus cernuus Lizard tail Pond Tulbaghia violacea Water garlic Pond

Reducing Invasive Organisms in Trade
61
Distribution of Invasive Species Relative to Retail Sources Our work on assessing the landscape level risk of horticultural sources of aquatic plants shows that there are links between species sold and species present on the landscape. Invasive aquatic plants that were present in ponds in our surveys were the species most commonly sold in stores. This effect could be due to escape of propagules directly from plants grown at the nursery, customers purchasing and planting the plant on the landscape, and/or secondary spread following planting in a new location. This finding is consistent with Dehnen-Schmutz et al. (2006), who found that species that had escaped from cultivation were offered more commonly in 19th century nursery catalogs than species that had not escaped, and over half were no longer on sale. For L. salicaria, and for all NR 40-regulated species together, there was a spatial relationship between retail source and landscape presence as reflected by the results of our distance to store models. In addition, this relationship may persist after the plant is removed from sale: although L. salicaria was not sold in any retail stores in our survey in 2012, the pond populations we observed were geographically closer to aquatic plant stores. This spatial relationship was not replicated at the scale we made observations, so it is difficult to say what characteristics of L. salicaria contributed to the observed pattern. Other species may exhibit a similar relationship at a broader scale, or this may be an isolated pattern due to the extreme popularity of this plant.
Planted ponds were much more likely near houses than away from them. While it makes sense that people would beautify the ponds closest to their houses, we cannot rule out the possibility of our data showing a spurious connection because we were more likely to have known that a pond was planted if the landowner talked to us while we did the survey. While we used other indicators, this transfer of information did not occur with ponds out of view of houses, and certainly, people do plant ponds to benefit wildlife, rather than just for aesthetic reasons. Despite the intuition that planted ponds would be more likely to have invasives from the plant trade, as well, our data did not support this. This may be due to the small number (only 7 ponds) of water bodies we discovered that had been planted. With these caveats in mind, our data does show that there are a number of waterbodies that would not be likely to be intentionally planted (those over ~150m from a house). The individual species distribution models we ran indicate that although some horticultural variables may affect the presence of certain species, their relative importance to other variables is low. There were some interesting relationships elucidated by our data, including Potamogeton crispus being more prevalent on golf courses, Myriophyllum spicatum being more common in larger ponds near other infestations, and Typha X glauca being more common in ponds where the native T. latifolia is present, however these relationships are tangential to the focus of our study and will not be further discussed here.

Reducing Invasive Organisms in Trade
62
Acknowledgements We thank Diane Menuz and Eric Erdmann for GIS support, and Elizabeth Haber for field and office support. We also thank Kim Peterson for data analysis for the social survey and Jordan Petchenik for survey development assistance. We would also like to thank Michelle Nault, Martha Barton, and Erin Vennie-Vollrath for their assistance with data collection. Special thanks to numerous property owners for allowing access to their private ponds. Literature Cited Aiken, S.G. 1981. A conspectus of Myriophyllum (Haloragaceae) in North America. Brittonia
33(1):57–69. Bradley B.A., D.M. Blumenthal, R. Early, E.D. Grosholz, J.J. Lawler, L.P. Miller, C.J.B. Sorte, et
al. 2012. Global change, global trade, and the next wave of plant invasions. Frontiers in Ecology and the Environment 10(1):20-28.
Cacho, O.J., D. Spring, P. Pheloung, and S. Hester. 2006. Evaluating the feasibility of
eradicating an invasion. Biological Invasions 8(4):903–917. Clavero, M. and E. Garcı´a-Berthou. 2005. Invasive species are a leading cause of animal
extinctions. Trends in Ecology and Evolution 20(3):110. Connecticut Agricultural Experiment Station (CAES). 2009. Invasive Plant Advisory, June 11,
2009. Connecticut Agricultural Experiment Station Invasive Aquatic Plant Program. Available online at www.ct.gov/caes/iapp. Accessed December 30, 2013.
Dehnen‐Schmutz, K. 2011. Determining non‐invasiveness in ornamental plants to build green
lists. Journal of Applied Ecology 48(6):1374–80. Ehrenfeld, J.G. 2010. Ecosystem consequences of biological invasions. Annual Review of
Ecology, Evolution, and Systematics 41(1):59–80. doi: 10.1146/annurev-ecolsys-102209-144650.
Falk, J.H. and J.D. Balling. 1980. The school field trip: Where you go makes the difference.
Science and Children 17(6):6-8. Great Lakes Regional Collaboration. 2005. Great Lakes Regional Collaboration Strategy to
Protect and Restore the Great Lakes. Available online at http://glrc.us/strategy.html. Groves, R.H. 1998. Recent Incursions of Weeds to Australia, 1971–1995. Technical Series (3).
Australia Cooperative Research Centre for Weed Management Systems. (Not seen; cited in Perrings and Dehnen-Schmutz 2005).
Gurevitch, J. and D.K. Padilla. 2004. Are invasive species a major cause of extinctions? Trends
in Ecology and Evolution 19(9):470–474.

Reducing Invasive Organisms in Trade
63
Hines, J.M., H.R. Hungerford, and A.N. Tomera. 1987. Analysis and synthesis of research on responsible environmental behavior: A meta-analysis. Journal of Environmental Education 18(2):1-8.
Hulme, P.E. 2009. Trade, transport and trouble: managing invasive species pathways in an era
of globalization. Journal of Applied Ecology 46(1):10-18. Hungerford, H.R. and T. Volk. 1990. Changing learner behavior through environmental
education. Journal of Environmental Education 21(3):8-21. Israel, G.D., J.O. Easton, and G.W. Knox. 1999. Adoption of landscape management practices
by Florida residents. HortTechnology 9:262–266. June-Wells, M., C.R. Vossbrinck, J. Gibbons, and G. Bugbee. 2012. The aquarium trade: a
potential risk for nonnative plant introductions in Connecticut, USA. Lake and Reservoir Management 28(3):200-205.
Keller, R.P. and D.M. Lodge. 2007. Species Invasions from commerce in live aquatic
organisms: problems and possible solutions. Bioscience 57(5):428. Kerr, S.J., C.S. Brousseau, and M. Muschett. 2005. Invasive aquatic species in Ontario: a
review and analysis of potential pathways for introduction. Fisheries 30:21–30. Knapp, D. 2000. Memorable experiences of a science field trip. School Science and
Mathematics 100(2):65-72. Koopman, B.O. 1946. Search and Screening. Center for Naval Analyses, Alexandria, VA. (Not
seen; cited in Cacho et al. 2006). Koopman, B.O. 1980. Search and Screening: General Principles with Historical Applications.
Pergamon Press, New York, NY. (Not seen; cited in Cacho et al. 2006). Koran, J.J., Jr., M.L. Koran, and J. Ellis. 1989. Evaluating the effectiveness of field experiences:
1939-1989. Visitor Behavior 4(2):7-10. Larson, B.C., Israel, G.D., Knox, G.W., Finch, C.R., and J. Butler. 2005. Evaluating landscape
education programs: Examples from Florida, Texas and Pennsylvania. Pp. 211–218 In G.K. Kiefer and R.J. Kirschner (eds.). Proceedings of the 4th National Conference: Nonpoint Source and Stormwater Pollution Education Programs, Chicago, Illinois, October 17-20, 2005. Chicago Botanic Garden, Chicago, IL.
Les, D.H. and L.J. Mehrhoff. 1999. Introduction of nonindigenous aquatic vascular plants in
southern New England: a historical perspective. Biological Invasions 1(2-3):281-300. Mack, M.C. and C.M. D’Antonio. 1998. Impacts of biological invasions on disturbance regimes.
Trends in Ecology and Evolution 13(5):195-198. MacDonald, P.L. and R.C. Gardner. 2000. Type I error rate comparisons of post hoc procedures
for i x j chi-square tables. Educational and Psychological Measurement 60(5):735-754. Mack, R.N. and M. Erneberg. 2002. The United States naturalized flora: largely the product of
deliberate introductions. Annals of the Missouri Botanical Garden (2002):176-189.

Reducing Invasive Organisms in Trade
64
Mack, R.N. and W.M. Lonsdale. 2001. Humans as global plant dispersers: getting more than
we bargained for. BioScience 51(2):95-102. Maki, K. and S. Galatowitsch. 2004. Movement of invasive aquatic plants into Minnesota (USA)
through horticultural trade. Biological Conservation 118(3):389–96. Michigan State University. 2008. The theory of reasoned action. Adapted from Understanding
Attitudes and Predicting Human Behavior, I. Ajzen and M. Fishbein, 1980. Prentice Hall, Englewood, NJ. Available online at www.fw.msu.edu/outreachextension/thetheoryofreasonedaction.htm. Accessed February 2, 2012.
Mills, E.L., J.H. Leach, J.T. Carlton, and C.L. Secor. 1993. Exotic species in the Great Lakes: a
history of biotic crises and anthropogenic introductions. Journal of Great Lakes Research 19(1):1-54.
Moody, M.L. and D.H. Les. 2010. Systematics of the aquatic angiosperm genus Myriophyllum
(Haloragaceae). Systematic Botany 35(1):121-139. Padilla, D.K. and S.L Williams. 2004. Beyond ballast water: aquarium and ornamental trades
as sources of invasive species in aquatic ecosystems. Frontiers in Ecology and the Environment 2(3):131–138.
Peduzzi, P., J. Concato, E. Kemper, T.R. Holford, and A.R. Feinstein. 1996. A simulation study
of the number of events per variable in logistic regression analysis. Journal of clinical Epidemiology 49(12):1,373-1,379.
Perrings, C and K. Dehnen-Schmutz. 2005. How to manage biological invasions under
globalization. Trends in Ecology and Evolution 20(5):212–15. Pimentel, D., R. Zuniga, and D. Morrison. 2005. Update on the environmental and economic
costs associated with alien-invasive species in the United States. Ecological Economics 52(3):273–88.
Pyšek, P, J Sádlo, and B Mandák. 2002. Catalogue of alien plants of the Czech Republic. Preslia
74:97–186. Reichard, S.H. and P. White. 2001. Horticulture as a pathway of invasive plant introductions in
the United States. BioScience 51(2):103-113. Ricciardi, A. 2006. Patterns of invasion in the Laurentian Great Lakes in relation to changes in
vector activity. Diversity and Distributions 12(4):425–33. Rosaen, A.L., E.A. Grover, C.W. Spencer, and P.L. Anderson. 2012. The Costs of Aquatic
Invasive Species to Great Lakes States. Anderson Economical Group, East Lansing, MI. Skawinski, P.M. 2011. Aquatic Plants of the Upper Midwest: A Photographic Field Guide to Our
Underwater Forests. The author, Wausau, WI. Thum, R.A., A.T. Mercer, and D.J. Wcisel. 2012. Loopholes in the regulation of invasive
species: genetic identifications identify mislabeling of prohibited aquarium plants. Biological Invasions 14(5):929–37.

Reducing Invasive Organisms in Trade
65
U.S. Environmental Protection Agency (EPA). 2010. Fiscal Year 2011-2015 EPA Strategic Plan:
Achieving Our Vision. Environmental Protection Agency, Washington, DC. Available online at http://www2.epa.gov/planandbudget/archive#StrategicPlan.
Vittinghoff, E. and C.E. McCulloch. 2007. Relaxing the rule of ten events per variable in logistic
and Cox regression. American Journal of Epidemiology 165(6):710-718. Wilcove, D.S., D. Rothstein, J. Dubow, A. Phillips, and E. Losos. 1998. Quantifying threats to
imperiled species in the United States. BioScience 48(8):607-615. Wisconsin Department of Natural Resources (DNR). 2009. Wisconsin Great Lakes Strategy:
Restoring and Protecting Our great Lakes. Office of Great Lakes, Wisconsin Department of Natural Resources, Madison, WI. Available online at http://dnr.wi.gov/topic/ GreatLakes/documents/GLStrategy2009Final.pdf.
Woodman, A.P. 2012. How effective are environmental education programs in changing
community knowledge, skills, attitudes and behaviour in relation to water catchment issues? EEA Library of Evidence Reviews. Available online at www.environmentalevidence.com.au/reviewlibrary.

Reducing Invasive Organisms in Trade
66
Appendix A. Education and Outreach Plan Introduction General approach: In developing an educational plan, it is critical to ensure that the methodology and materials are valued, relevant and accessible to the audience at hand. In essence, this requires that the educational approach starts “where they’re at” and builds from there. Successful implementation requires understanding the audience, which includes knowing what the audience knows already, what challenges they face, and what support they would like to receive. To better understand these audiences, I reviewed business and association websites, professional newsletters and catalogues. Personal communication and past partnerships within the industry were also considered. Finally, I reviewed Sea Grant’s efforts with aquatic retailers. Personal contact with each retailer will ultimately form the best understanding, as it will be relationally based. Businesses have many goals in regards to how they operate. In determining the best way to approach aquatic plant retailers, I have included considerations of the following business desires:
to be economically successful to please customers civic duty to contribute to the community or “do right”
Educational Goals: Material Tool
1) Inform retailers of the invasive species regulations (O5a) 2) Increase retailer knowledge of NR40 regulations (O5a) 3) Help retailers identify prohibited and restricted species (O5a, samples) 4) Increase awareness of the threats posed by AIS (O5b, case study) 5) Increase understanding of the ecological risks aquatic invasive species present (O5b) 6) Increase the number of plant nurseries, water garden and aquarium retailers that use best
management practices (O5b, demos) 7) Increase retailer awareness of native plant alternatives (O5b, O5c)
Outputs:
1) Education & Outreach Plan for aquatic plant retailers 2) Best management practices (For aquatic retailers & aquaculture)
a. Background research b. Agreed-upon
3) Background research on behavioral change 4) Data : Self-reported data on awareness, preventive measures, and aquatic plant sales 5) Supporting educational materials
a. What they need to know (Regulations & ID) -- Regulated AIS 2012 handout b. Actions they need to take (Risk & BMPs) -- Handout c. Resources for their customers (Native plants, Regs & BMPs, pond, water garden,
aquarium specific resources) -- Brochure, posters, Habitatitude & Sea Grant Materials d. Outreach letter -- letter
Methodology
1) Personal contact 1) phone call 2) survey 3) any follow-up 4) letter 5) phone/email 6) visit 7) follow-up
2) Educational materials (a. Regs & ID, b. BMPs, c. Customer resources, d. outreach letter) 3) Visit: Explanation of NR40 & ID help (script, plant samples, other tools) ; material distribution

Reducing Invasive Organisms in Trade
67
Audiences Aquatic Plant Retailers in Wisconsin
1) NURSERIES Survey Categories: A. Garden Center, Greenhouse or Nursery;
B. Water Garden or Pond Store; C. Home Improvement or Hardware store Codes: 1000s: "licensed/reported", "licensed/considering" & "licensed/past, future"
2000s: "licensed/unknown"; 3000s: "unlicensed/reported"; 4000s: "unlicensed/unknown"
2) PET STORES/ AQUARIUMS Survey Categories: D. Aquarium or Pet store Codes: 5000s aquarium and pet stores
Education & Outreach Plan Actions:
1. Develop material packets: Regulations, BMPs, other resources a. Regulations
Summary List of what not to sell Info on other species (terrestrial plants, fish, inverts, etc)
b. BMPs c. Resources
List of native alternatives 1. List of where to get plants
Materials for customers 1. water gardeners, rain gardeners, wetland users, lake owners 2. aquarium keepers, pet owners 3. Habitatitude
d. Variety for different types of businesses 2. Write letter as follow-up to survey; introduction; thank you 3. Contact and arrange visits 4. Visit
a. Provide materials 5. Follow-up
a. Via phone, email, or letter (preferred option of business) 6. Contact outreach associations/ groups (See outreach contacts in Pond excel)
a. Write article for trade organizations b. Present at tradeshow c. Provide workshops
Bruce company provides seminars: http://www.brucecompany.com/pages/wholesale/Ponds-Water-Features.php
Hobbyist groups, etc. 7. Create long-term update/ outreach contact plan - integrate into overall outreach

Reducing Invasive Organisms in Trade
68
Resources:
General Outreach Outlets: See “Internet_Outreach” excel file in GLRI folder
Timeline Winter 2012
- Develop social survey March 2012
- Send out social surveys - Develop educational materials
April 2012 - develop educational materials
May 2012 - review with partners (SG, UWEx) - develop letters - Finalize educational materials - Update AIS coordinators
June 2012 - Send letters - Visit preparation - Survey analysis - Habitatitude meeting
July / August/ September 2012 - review social survey data - Site visits - Complete targeted Outreach Campaign
to “non-compliant” retailers October 2012
- Analyze social survey data - Meet with groups
November 2012 - Analyze social survey data - Meet with groups
Winter 2013 - revise social survey - meet with groups
February 2013 - Send follow-up social survey (assess change
due to education and outreach) Summer 2013
- Assess education and outreach efficacy - Analyze data - Use results to guide the educational
approach for the future - Plan for conference presentations
Fall 2013 & Winter/Spring 2014 - Share results
o Lakes Convention o AIS Coordinators meeting o others
- Publish findings
Background from Grant Proposal We should conduct an education campaign so that a greater number of retailers and consumers understand the new regulations. We will assess the impact of education and outreach activities on vendor behavior by repeating this retailer survey in the field season of 2013, a year after the implementation of educational programs. Whereas changes in general knowledge may be more easily achieved through education and outreach, it is of interest to us to determine whether education leads to actual behavioral change.
During the first year of the project, we will administer a social survey to retailers*, landscapers, and growers in order to identify preventive procedures already in place and assess retailers’ knowledge of aquatic invasive species issues and new statewide regulations. Past social marketing research targeting boaters and anglers has shown personal contact to be more effective than written notices, advertizing

Reducing Invasive Organisms in Trade
69
or other forms of contact, and we will be including this as part of a multi-faceted educational approach (Shaw, personal communication). Our educational goals include informing vendors of new regulations, helping them identify prohibited and restricted species, and increasing their awareness of threats posed by AIS. We will implement this focused educational program during the first full summer field season of 2012 by targeting non-compliant vendors identified during the spring biological vendor survey. We then plan to use the results collected during the 2013 biological vendor follow-up surveys to guide the educational approach for the future beyond the timeframe of this project. This targeted, strategic outreach effort that focuses on the urban areas that pose the highest risk for the establishment of new invasive plants will leverage both efforts by the local Sea Grant offices to increase the visibility of the Habitatitude campaign that encourages responsible care for pond and aquarium organisms and new state efforts to increase awareness and compliance with invasive species laws. By collecting information on the threats of AIS via the live organism trade both in 2012, before the educational campaign and in 2013, following the targeted campaign, we can assess our impact, facilitate EPA oversight, and allow our educational effort to progress in as cost-effective and beneficial a manner as is possible.
Time Objective Steps Achievements
Sprin
g 20
12 • Develop social
survey • Develop
education and outreach materials
• Develop and send simple social survey to aquatics retailers
• Create educational plan, identify best management practices for aquatics retailers
• Education plan and support materials
Sum
mer
20
12 • Education and
outreach to aquatics retailers
• Site visits to aquatics retailers identified during aquatics retailer surveys
• Education and outreach
Fall
2012
• Synthesize social survey results
• Analyze social survey data • Self-reported data on awareness and preventive measures of aquatics retailers in Wisconsin
Win
ter
2013
• Assess change in beliefs due to education and outreach
• Send follow-up social survey
Sum
mer
201
3 • Assessment of efficacy of education and outreach
• Quantify aquatics retailers’ awareness of invasive species issues after education
• Peer-reviewed paper written and submitted
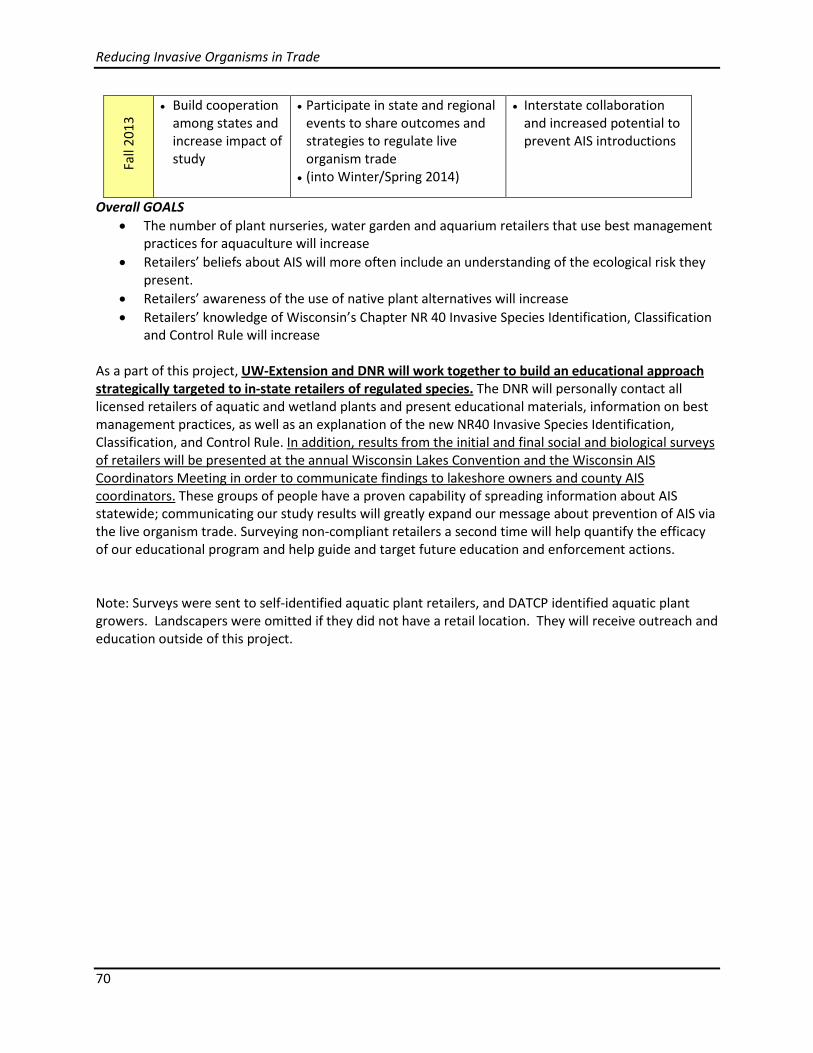
Reducing Invasive Organisms in Trade
70
Fall
2013
• Build cooperation among states and increase impact of study
• Participate in state and regional events to share outcomes and strategies to regulate live organism trade
• (into Winter/Spring 2014)
• Interstate collaboration and increased potential to prevent AIS introductions
Overall GOALS • The number of plant nurseries, water garden and aquarium retailers that use best management
practices for aquaculture will increase • Retailers’ beliefs about AIS will more often include an understanding of the ecological risk they
present. • Retailers’ awareness of the use of native plant alternatives will increase • Retailers’ knowledge of Wisconsin’s Chapter NR 40 Invasive Species Identification, Classification
and Control Rule will increase As a part of this project, UW-Extension and DNR will work together to build an educational approach strategically targeted to in-state retailers of regulated species. The DNR will personally contact all licensed retailers of aquatic and wetland plants and present educational materials, information on best management practices, as well as an explanation of the new NR40 Invasive Species Identification, Classification, and Control Rule. In addition, results from the initial and final social and biological surveys of retailers will be presented at the annual Wisconsin Lakes Convention and the Wisconsin AIS Coordinators Meeting in order to communicate findings to lakeshore owners and county AIS coordinators. These groups of people have a proven capability of spreading information about AIS statewide; communicating our study results will greatly expand our message about prevention of AIS via the live organism trade. Surveying non-compliant retailers a second time will help quantify the efficacy of our educational program and help guide and target future education and enforcement actions. Note: Surveys were sent to self-identified aquatic plant retailers, and DATCP identified aquatic plant growers. Landscapers were omitted if they did not have a retail location. They will receive outreach and education outside of this project.
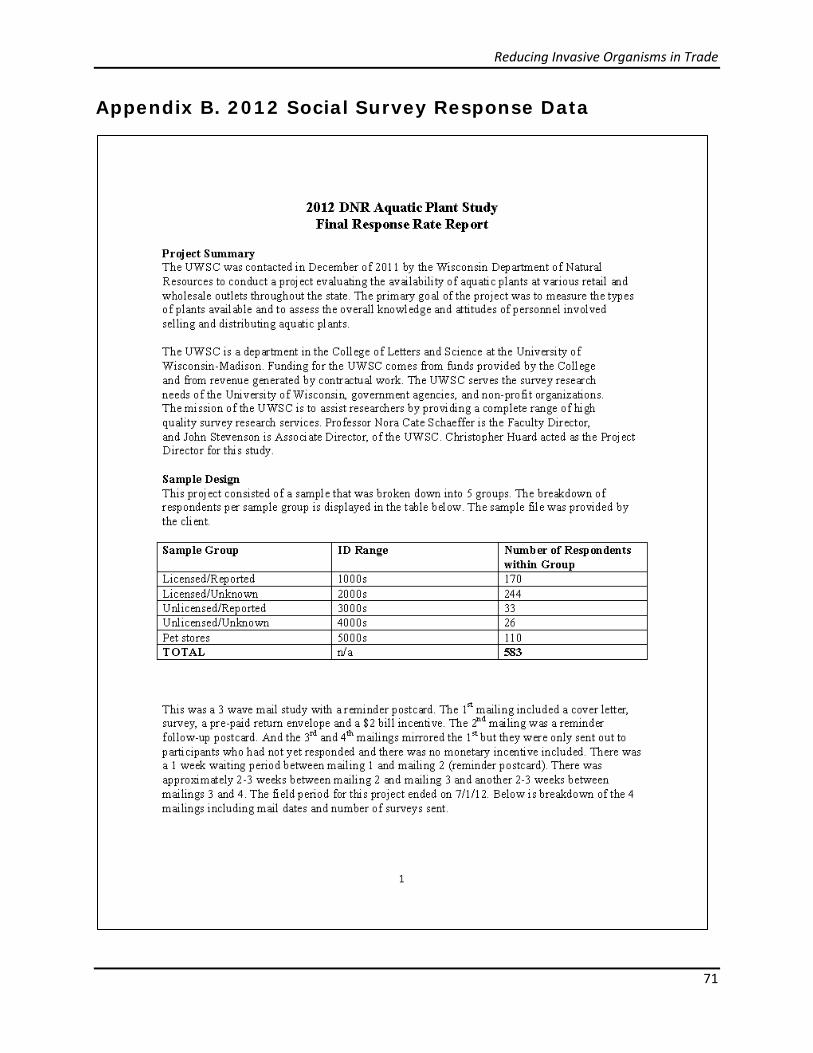
Reducing Invasive Organisms in Trade
71
Appendix B. 2012 Social Survey Response Data
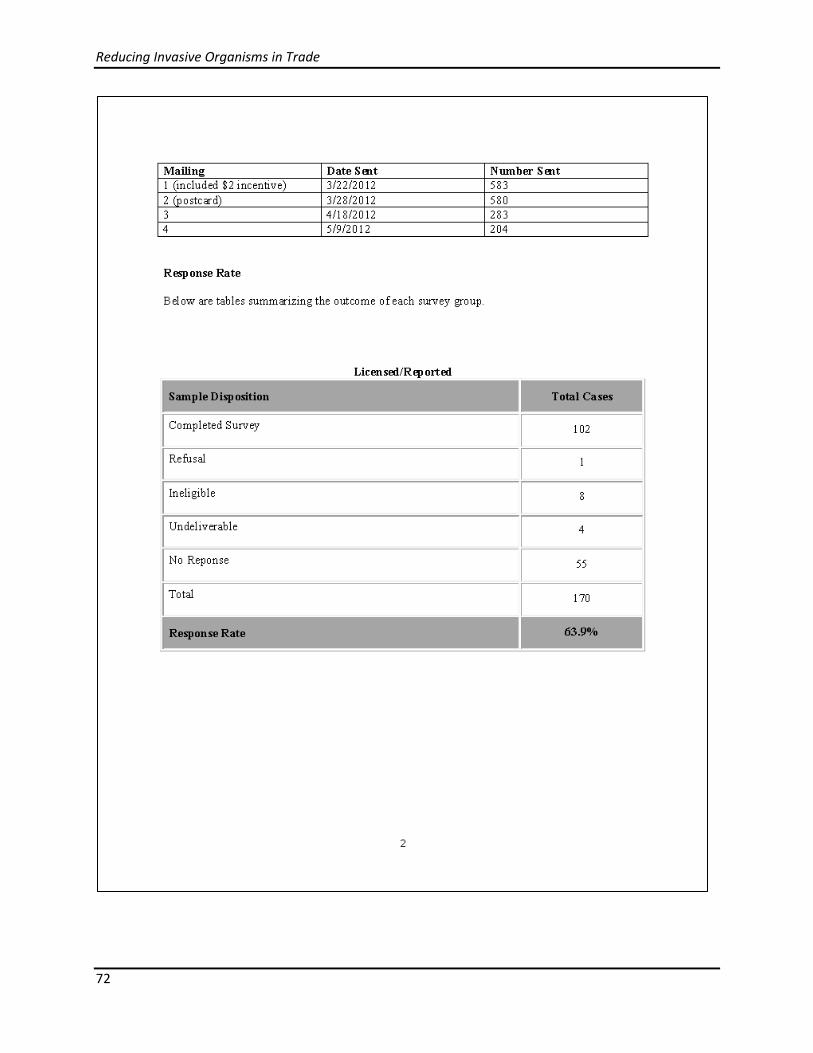
Reducing Invasive Organisms in Trade
72
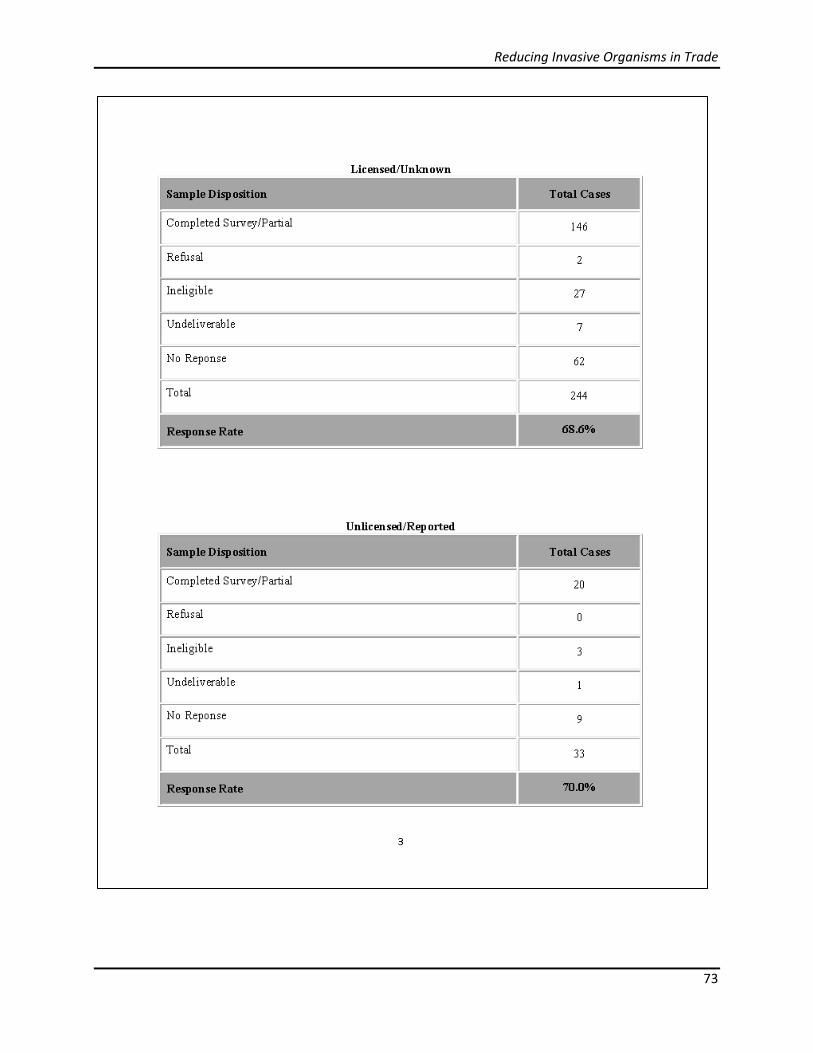
Reducing Invasive Organisms in Trade
73
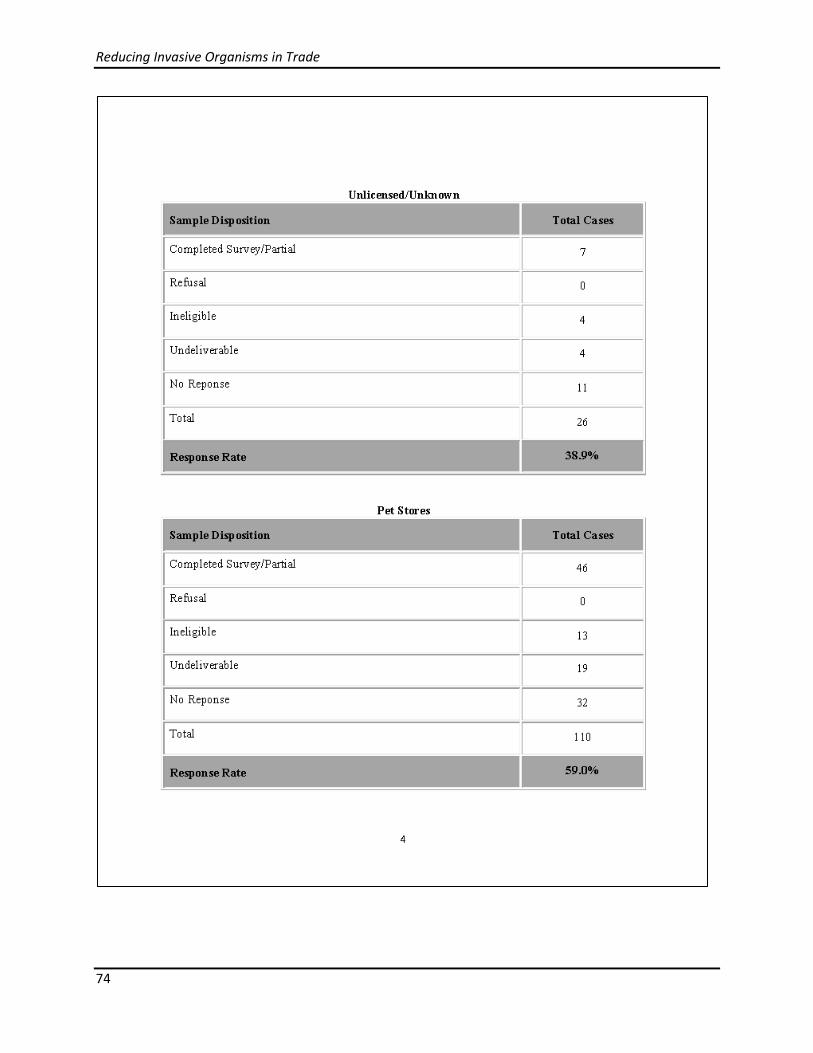
Reducing Invasive Organisms in Trade
74
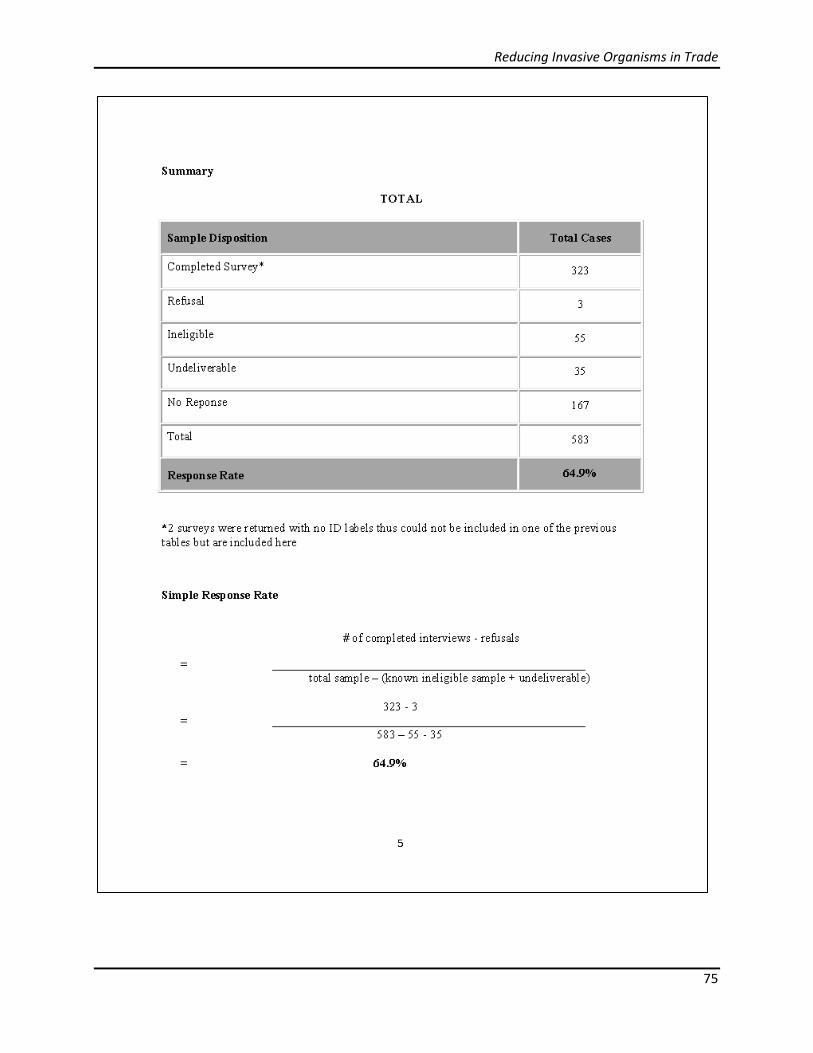
Reducing Invasive Organisms in Trade
75

Reducing Invasive Organisms in Trade
76
Appendix C. 2013 Social Survey Response Data
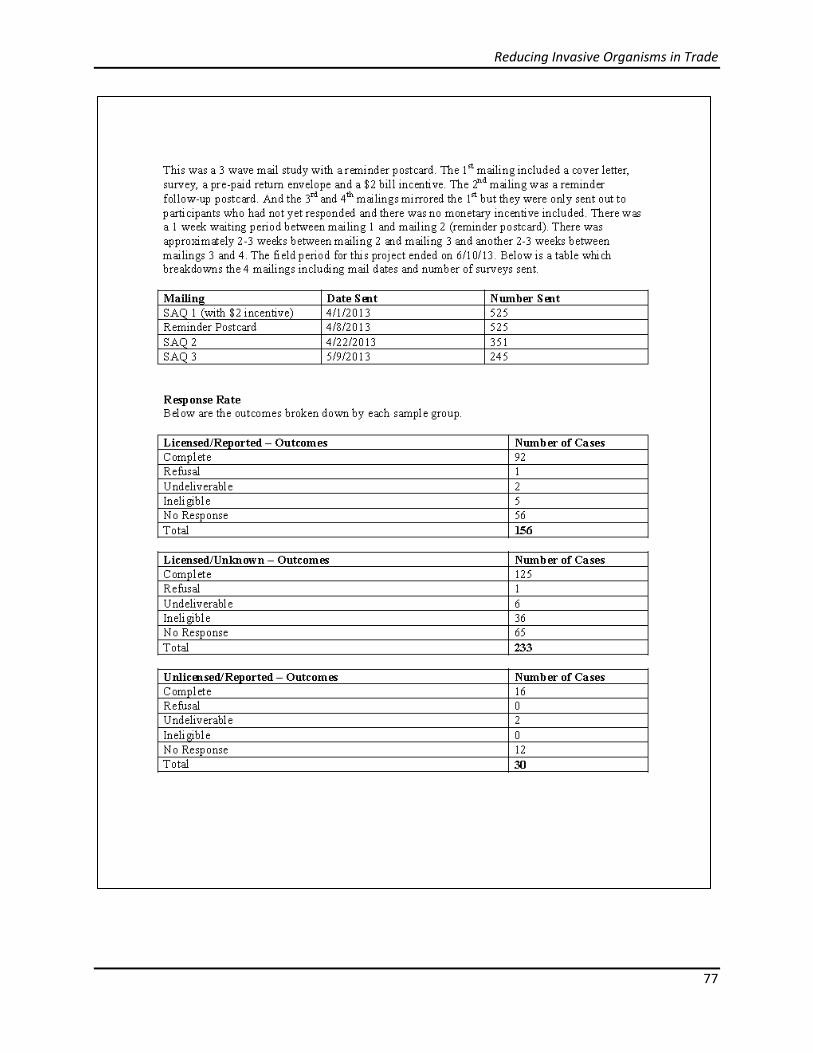
Reducing Invasive Organisms in Trade
77

Reducing Invasive Organisms in Trade
78
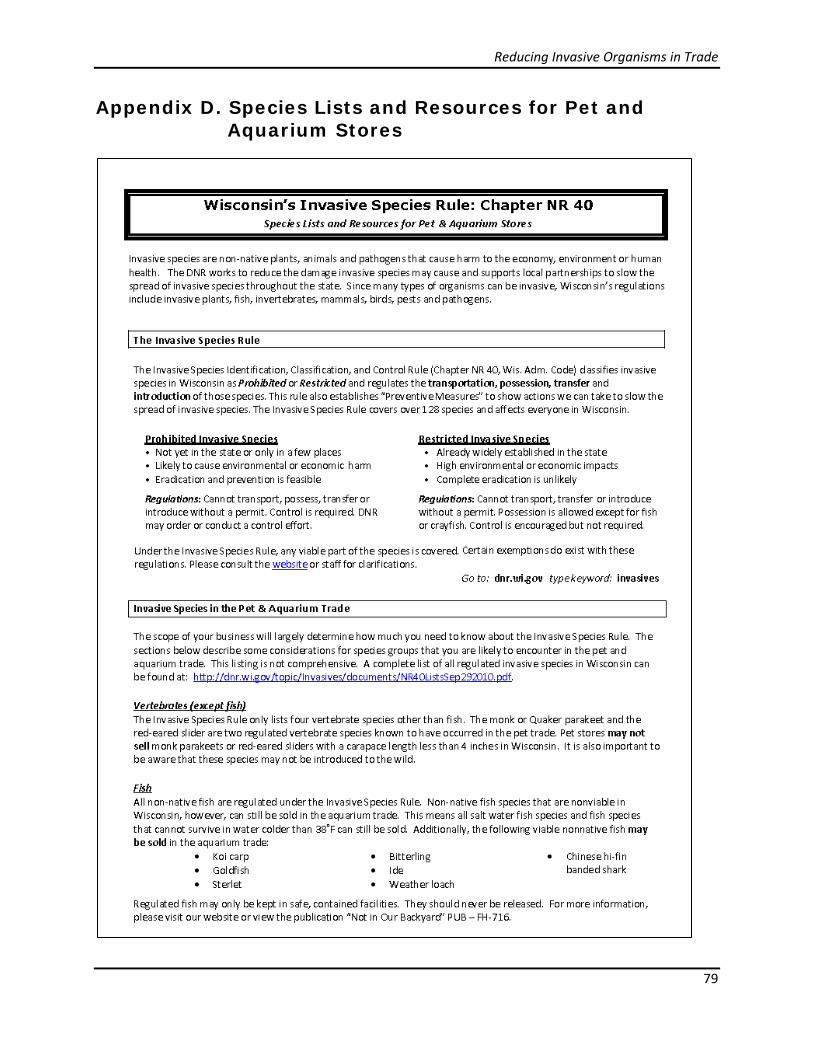
Reducing Invasive Organisms in Trade
79
Appendix D. Species Lists and Resources for Pet and Aquarium Stores
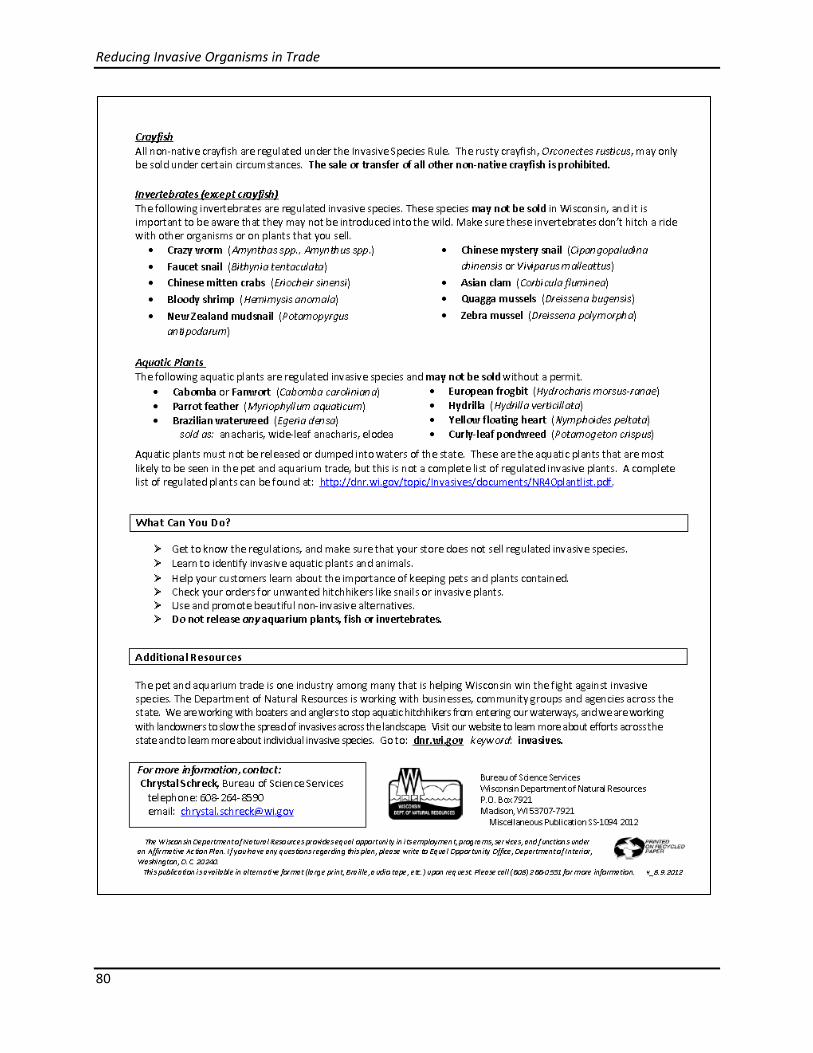
Reducing Invasive Organisms in Trade
80

Reducing Invasive Organisms in Trade
81
Appendix E. Outreach Letter for Pet and Aquarium Stores
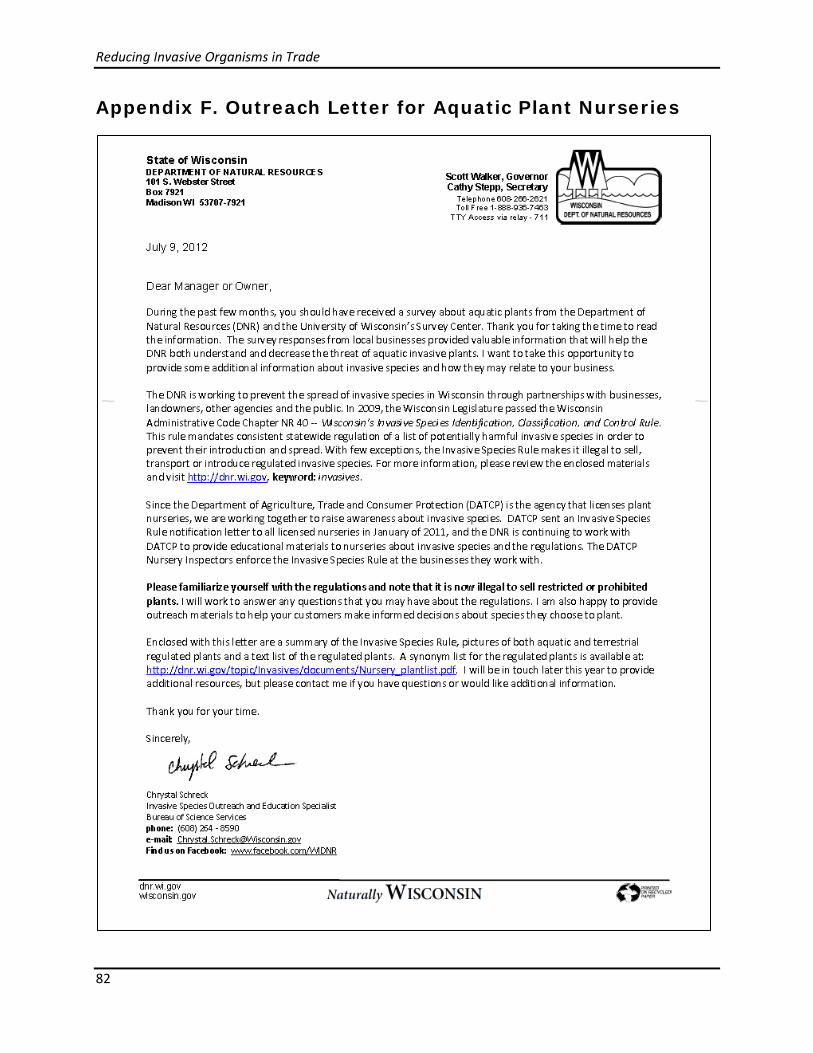
Reducing Invasive Organisms in Trade
82
Appendix F. Outreach Letter for Aquatic Plant Nurseries

Reducing Invasive Organisms in Trade
83
Appendix G. Factsheet: Invasive Aquatic Plants and Their Other Names
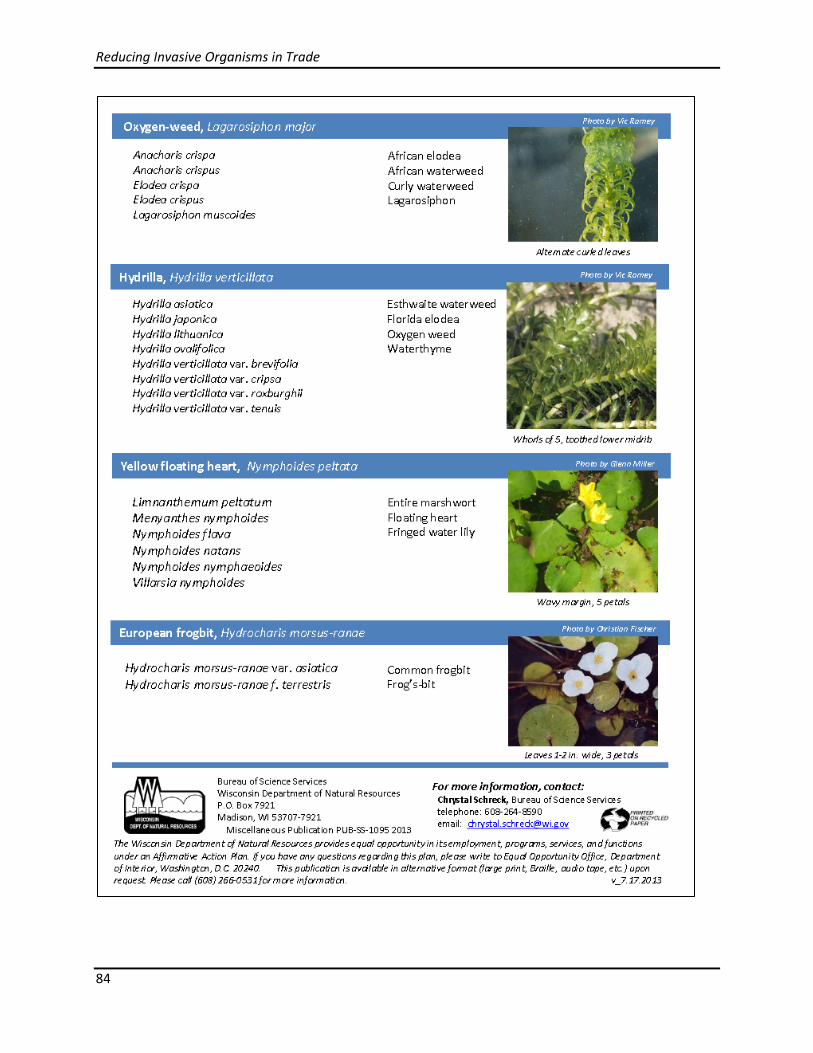
Reducing Invasive Organisms in Trade
84
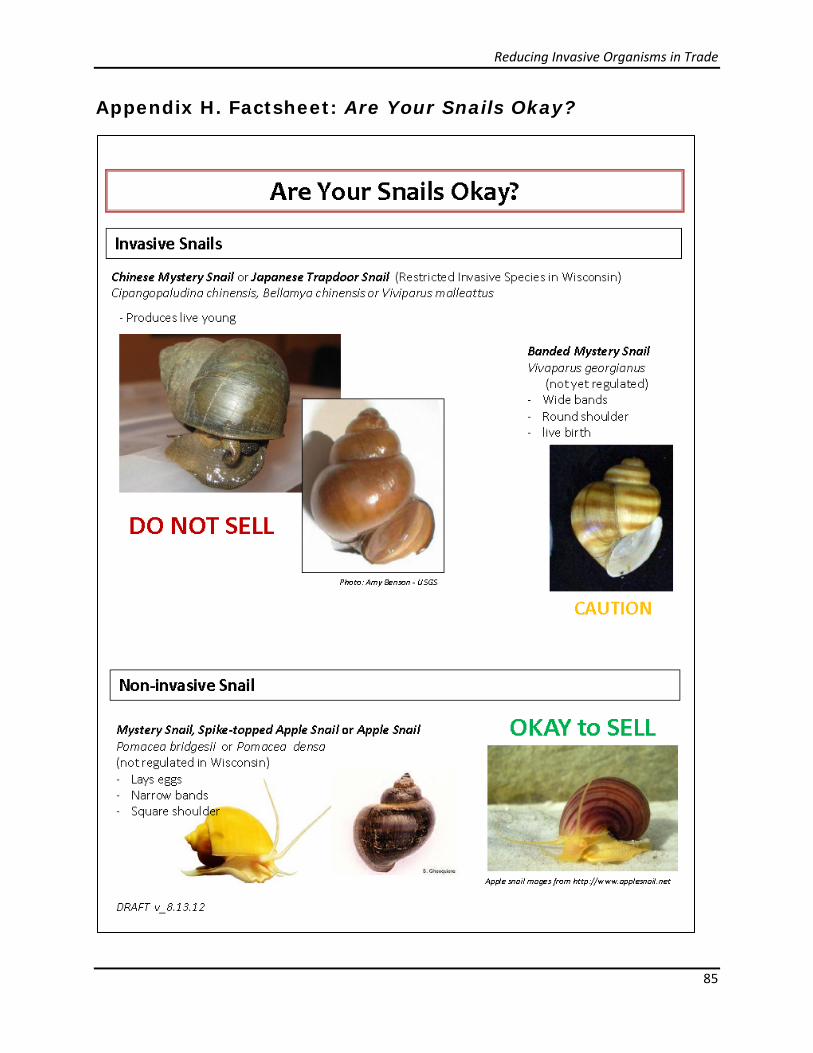
Reducing Invasive Organisms in Trade
85
Appendix H. Factsheet: Are Your Snails Okay?

Reducing Invasive Organisms in Trade
86
Appendix I. Factsheet: Crayfish and the Invasive Species Rule

Reducing Invasive Organisms in Trade
87
Appendix J. Factsheet: Chapter NR 40 Regulated Plants
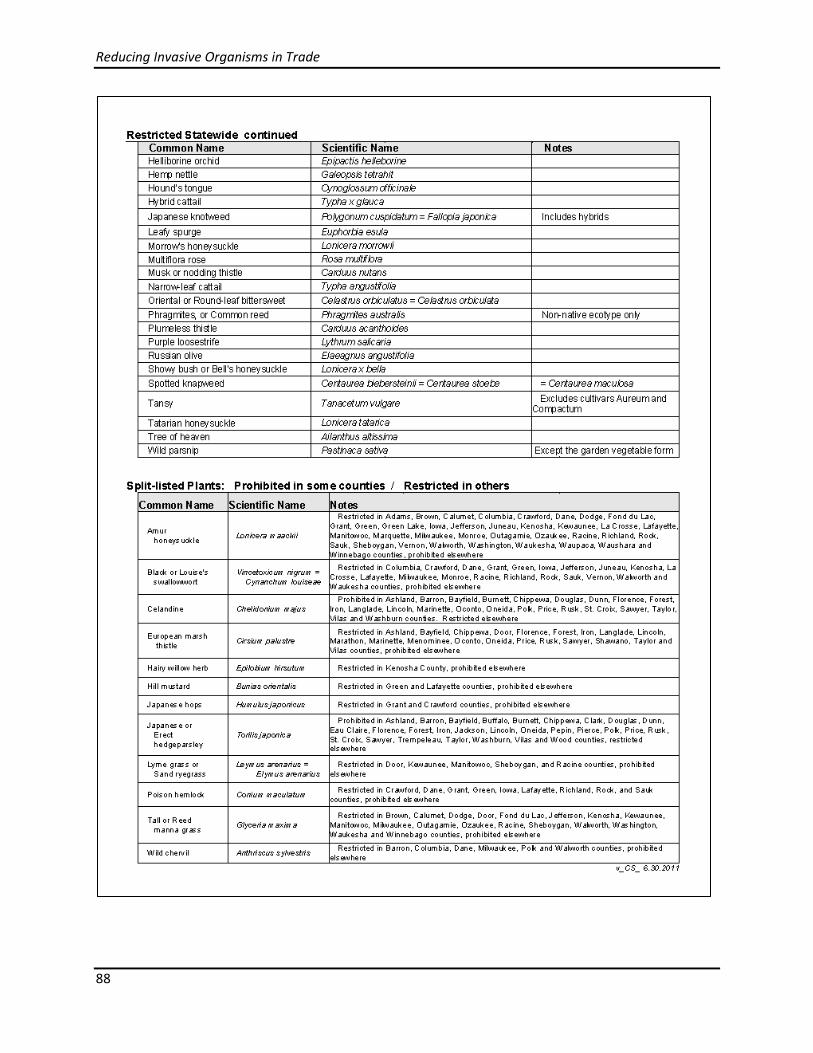
Reducing Invasive Organisms in Trade
88
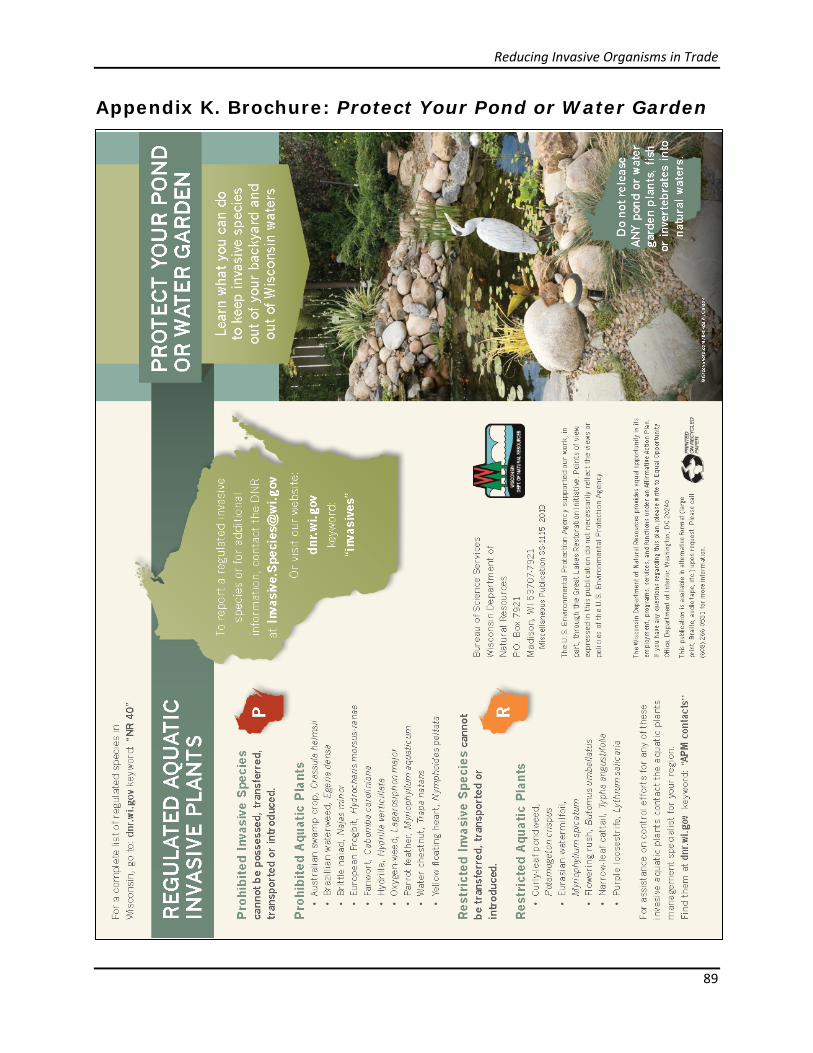
Reducing Invasive Organisms in Trade
89
Appendix K. Brochure: Protect Your Pond or Water Garden

Reducing Invasive Organisms in Trade
90
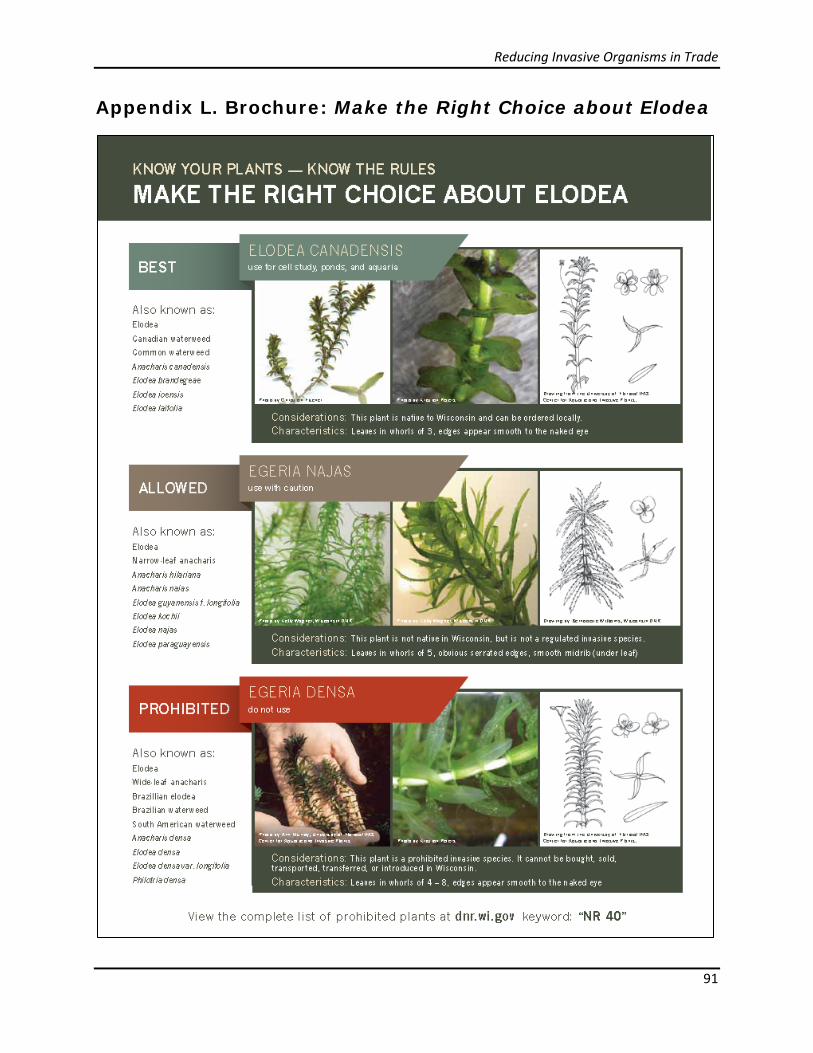
Reducing Invasive Organisms in Trade
91
Appendix L. Brochure: Make the Right Choice about Elodea

Reducing Invasive Organisms in Trade
92

Reducing Invasive Organisms in Trade
93
Appendix M. Teacher Mailing Cover Letter
Reducing Invasive Organisms in Trade
94
Appendix N. Pond Retailer Mailing Cover Letter
Reducing Invasive Organisms in Trade
95
Appendix O. Pond Owner Mailing Cover Letter

Reducing Invasive Organisms in Trade
96
Appendix P. Poster: “Landscape Risk Assessment of Invasive Aquatic Plants in Southeast Wisconsin Ponds”

Reducing Invasive Organisms in Trade
97
Notes

Reducing Invasive Organisms in Trade
98
Notes

Reducing Invasive Organisms in Trade
99
Reducing Invasive Organisms in Trade
100
Science Services Center for Excellence – providing expertise for science-based decision-making We develop and deliver science-based information, technologies, and applications to help others make well-informed decisions about natural resource management, conservation, and environmental protection. Our Mission: The Bureau of Science Services supports the Wisconsin Department of Natural Resources and its partners by: • conducting applied research and acquiring original knowledge. • analyzing new information and emerging technologies. • synthesizing information for policy and management decisions. • applying the scientific method to the solution of environmental and natural resources problems. • providing science-based support services for management programs department-wide. • collaborating with local, state, regional, and federal agencies and academic institutions in Wisconsin and around the world.