reducing speed limits to support lower skid resistance investigatory levels · reducing speed...
TRANSCRIPT

Reducing Speed Limits to Support
Lower Skid Resistance
Investigatory Levels
Fergus Tate – National Traffic and Safety Manager NZTA

Presentation Outline:
• Background
• Research questions
• Requirements of analysis framework
• Key steps in analysis framework
• Case study
• Concluding remarks

Background (1):
• NZ Transport Agency instigated research
project
• NZTA Project Manager, Fergus Tate
• Research Team, Peter Cenek and Robert
Henderson, Opus
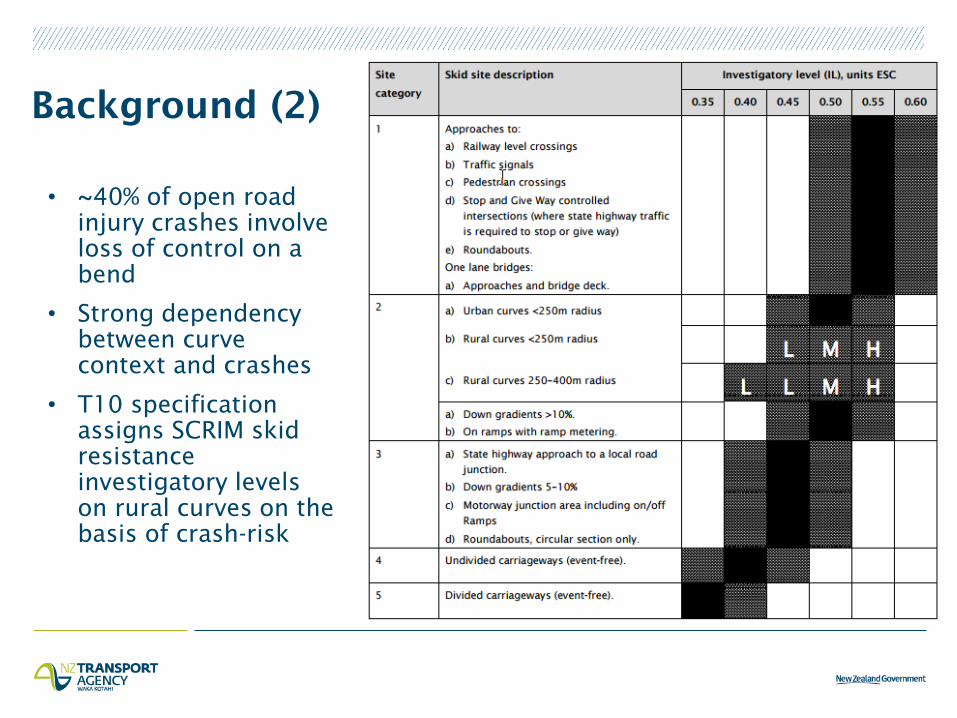
Background (2)
• ~40% of open road
injury crashes involve
loss of control on a
bend
• Strong dependency
between curve
context and crashes
• T10 specification
assigns SCRIM skid
resistance
investigatory levels
on rural curves on the
basis of crash-risk

Background (3):
• Financial and resource constraints
- not always possible to provide high quality
aggregates
• There are strong relationships between crashes on
curves and
a. Wet surface friction (SCRIM)
b. Vehicle speed
• In response, could look to lower speeds at specific
curves or potentially along a route to allow use of local
aggregate sources.

Research questions:
1. If lower SCRIM skid resistance investigatory
values are to be adopted what reduction in speed
would be needed to achieve the same curve
crash risk ?
2. What would be the impact of these lower speeds
on road users?

Requirements of analysis framework (1):
• All required inputs must be available from existing
SH data sources e.g. RAMM.
• Utilise relationships derived from NZ research for:
– skid resistance of the road surface and curve crash
risk
– horizontal radius of curvature and expected service
life of the road surface
– posted speed limits and mean and 85th
%ile speeds

Requirements of analysis framework (2):
• Where possible, procedures provided in the
Transport Agency’s Economic Evaluation Manual
for calculating the costs of benefits and dis-
benefits must be incorporated.
• Able to be delivered in the form of a spreadsheet-
based tool.

Key steps in analysis framework (1):
1. Determine the curve crash risk associated with the
current T10 skid resistance investigatory levels
using 85th
%ile speeds for curves/route of interest.
2. Analyse the impact of reduced 85th
%ile speeds in
increments of 5 km/h on curve crash risk
assuming an investigatory skid resistance value of
0.4 ESC, this being the average skid resistance
level achieved on SH’s when local aggregates are
used.

Key steps in analysis framework (2):
3. Determine reduced route mean speed/speed limit
that achieves T10 levels of curve crash risk but
with a reduced skid resistance of 0.4 ESC.
4. Determine associated impacts of the reduced
traffic speed on:
- Travel time
- Vehicle operating costs
- Crash cost savings
- Life of surfacing
- CO2
emissions

Case study (1):
• Open speed limit
(100km/h) section of
SH58.
• 10 km length containing
28 high risk curves
(horizontal radius of
curvature ≤ 400m)
• 19 of these high risk
curves managed to IL
≥0.5 ESC
• AADT = 13766
• Existing average annual
crash density is
- 0.72 all injury
crashes per km
- 0.34 wet road injury
crashes per km

Case study (2):
Example of
a SH58 curve
that is being
managed to a
skid
resistance
investigatory
level of 0.55
ESC
(RS 3.69 km
to 3.76 km)

Case Study (3):
Identifying new speed limit on basis of predicted collective curve crash risk
Statistic
Predicted Collective Curve Crash Risk (annual all injury crashes per curve)
Target
(IL met)
Maximum 85 percentile speed (skid resistance = 0.4 ESC)
100km/h
95km/h
90 km/h
85km/h
80km/h
75km/h
70km/h
65km/h
60km/h
55km/h
50km/h
Max 0.46 0.50 0.47 0.45 0.40 0.40 0.40 0.40 0.40 0.40 0.40 0.40
Mean 0.24 0.28 0.25 0.23 0.22 0.21 0.20 0.20 0.20 0.20 0.20 0.20
Median 0.22 0.26 0.22 0.20 0.20 0.20 0.20 0.19 0.19 0.19 0.19 0.19
Total No. 6.79 7.91 6.98 6.40 6.03 5.79 5.68 5.59 5.53 5.48 5.45 5.43
Actual annual all injury crash number over period 2011-2016 = 7.2

Case Study (4):
Increase in Travel Time:
• Reducing the open road speed limit from 100 km/h to
90 km/h over the 9.946 km route was shown to
increase the travel time by 0.66 minutes in the
increasing direction and 0.67 minutes in the
decreasing direction.
• The cost associated with these increases in travel time
was calculated to be $1,930,569.60 assuming an
AADT of 14,254 vehicles per day and a composite
value of travel time (all occupants and vehicle types
combined) of $33.48c/hr (July 2015).

Case Study (5):
Comparison of
Benefits/Disbenefits
Component Calculated Annual Cost ($)
Disbenefit:
Travel Time $1,930,569.60
Benefit
Curve Crashes $228,150.00
Severity of Crashes $118,609.00
Base VOC $198,856.35
Speed Change Cycle $3,264,682.09
CO2 Emissions $7,954.25
Extended Seal Life $506.12
Subtotal: $3,818,757.81
Benefit-Disbenefit: $1,888,188.21

Concluding Remarks
• Reducing the open road speed limit has been shown
to be a very effective safety measure if the skid
resistance of high risk curves cannot be maintained
at or above their recommended investigatory level.
• However, there is a valid concern when lowering
speed limits that, while the mean and 85th
percentile
speeds appropriately lower, the variability in speeds
increase and the upper 15th
percentile speeds remain
high.