reducing the embodied carbon of walls in industrial buildings
TRANSCRIPT

Insulated Panel SystemsNorth America
Reducing the Embodied Carbon of Walls in Industrial BuildingsA comparison of differing wall systems and their impact on embodied carbon

Insulated Panel SystemsReducing the Embodied Carbon of Walls in Industrial Buildings
“ For teams seeking to reduce the embodied carbon of their industrial building to the highest degree possible, Kingspan QuadCore® is an effective solution, particularly if the carbon reduction strategies have already been applied to the concrete mix design of the building foundation and floor slab.”KieranTimberlake, “Kingspan: Life Cycle Assessment of Industrial Claddings Report”, June 7, 2020.

Insulated Panel SystemsReducing the Embodied Carbon of Walls in Industrial Buildings
3
Contents
Introduction 4Embodied Carbon: A Locked-in Carbon Cost 4Executive Summary 5
Background 6Purpose of Assessment 6 Scope and System Boundary 6Shared vs. Unique Building Components 7Wall Assemblies 8
Methodology: Life Cycle Assessment (LCA) 16
Results 17
Conclusion 20
Appendix 25
References 39

Insulated Panel SystemsReducing the Embodied Carbon of Walls in Industrial Buildings
4
Introduction
Embodied Carbon: A Locked-in Carbon CostAccording to Architecture 2030, the building sector accounts for 39% of global greenhouse gas (GHG) emissions – 28% of that is from building operations, while the remaining 11% is specifically from building materials and construction1.
While energy use associated with building operations can be reduced over time with measures such as energy efficiency retrofits, shifts towards renewable energy procurement, and on-site renewable energy installations, embodied carbon from building materials and construction are unchangeable once a building is constructed.
The 11% of GHG accounted for by building materials and construction represents this one-off fixed carbon cost as the embodied carbon which is locked into buildings once they are built. It is estimated that the embodied carbon associated with the annual construction of 66 billion square feet of new buildings globally is a staggering 3.7 billion metric tons1 - that's more than 11,000 Empire State Buildings every year2.
This locked-in nature of embodied carbon means that the opportunity for architects and building owners to reduce the carbon footprint of a building, as it relates to building materials, therefore, is limited to the design and procurement phases of a project. This clearly underscores the critical importance of thoughtful material selection and detailed specifications at the outset.
Source: Architecture 2030
The locked-in nature of embodied carbon underscores the critical importance of thoughtful material selection and detailed specifications at the outset.
Building Operations
28%Industry
30%
Transportation
22%
Building Materials & Construction
11%
Other
9%
1metric ton CO2
27’
27’
27’
3,700,000,000 metric tons of embodied
carbon is associated with new construction
globally every year.

Insulated Panel SystemsReducing the Embodied Carbon of Walls in Industrial Buildings
5
Executive SummaryThis paper compares four different wall assemblies applied to the same building design, a typical warehouse structure, to demonstrate and quantify the embodied environmental impacts of material selection, calculated using whole-building life cycle assessment (LCA).
To conduct this study, Kingspan engaged architectural planning and research firm KieranTimberlake, creators of the Tally® LCA software used in the analysis.
The four wall systems compared were a Kingspan insulated metal panel (IMP) system insulated with a QuadCore® insulation core, an IMP insulated with mineral fiber, insulated concrete, and tilt-up concrete. Each building design shares several common elements across the four buildings but varies per the requirements of each wall system in areas such as structural members and associated foundations.
While the shared elements accounted for the vast majority of the mass of the buildings, the primary aim of this study was to compare wall envelopes and quantify the environmental impacts of wall system selection.
The LCAs revealed that the wall system using Kingspan IMPs insulated with QuadCore® had the lowest embodied carbon levels, represented as global warming potential (GWP), out of all the systems compared – 28% lower than both the insulated concrete and tilt-up concrete walls, which had the highest levels of embodied carbon.
Furthermore, the Kingspan QuadCore® IMP wall also had the lowest impact on smog formation – 19% lower than the highest impact design which used tilt-up concrete wall, again followed closely by the insulated concrete wall.
In terms of acidification, the mineral fiber IMP wall had the highest impact, with insulated concrete wall having the lowest impact – 34% lower than the mineral fiber IMP wall.
The impact on ozone depletion of all four wall systems was miniscule, with the highest impact at only 0.08 kg CFC-11 equivalent, which was the mineral fiber IMP wall.
In assessing non-renewable energy demand, the mineral fiber IMP wall had the highest impact, with the Kingspan QuadCore® IMP wall using 13% less non-renewable energy.
In the category of eutrophication, all four wall systems were very close with only a 14 kg Nitrogen-equivalent (Neq) difference from the lowest to the highest impacts – the tilt-up concrete wall having the lowest impact at 173 kg Neq, and the Kingspan QuadCore® IMP wall system at 188 kg Neq.
The study reveals that for design teams and building owners seeking to reduce the embodied carbon of building envelopes in industrial buildings to the highest degree possible, Kingspan QuadCore® IMPs are an effective solution.
The Kingspan QuadCore® IMP wall system had 28% lower embodied carbon than both insulated concrete and tilt-up concrete. This is equivalent to saving the CO2 emissions from burning 149 tons of coal, or the Greenhouse gas emissions from driving the average car 671,270 miles (27 times around the Earth)3.
28%lower embodied
carbon
149tons of coal
671,720miles driven
Insulated Panel SystemsReducing the Embodied Carbon of Walls in Industrial Buildings
6
Background
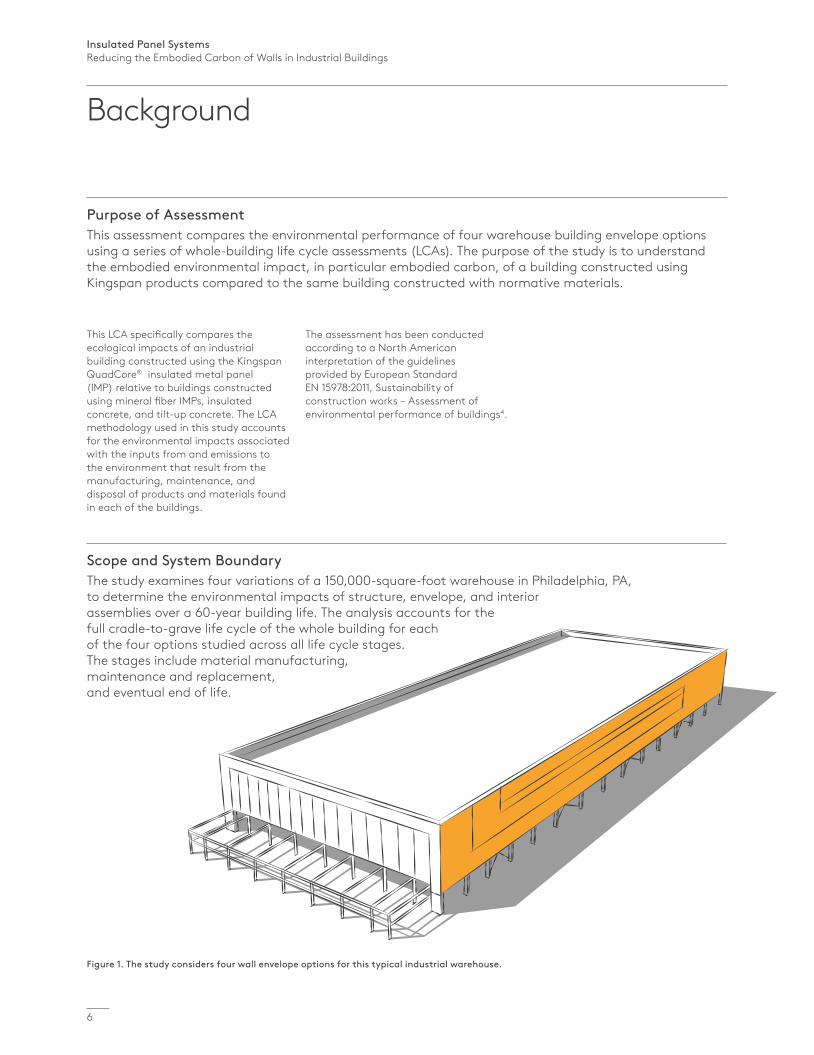
Scope and System BoundaryThe study examines four variations of a 150,000-square-foot warehouse in Philadelphia, PA, to determine the environmental impacts of structure, envelope, and interior assemblies over a 60-year building life. The analysis accounts for the full cradle-to-grave life cycle of the whole building for each of the four options studied across all life cycle stages. The stages include material manufacturing, maintenance and replacement, and eventual end of life.
Purpose of AssessmentThis assessment compares the environmental performance of four warehouse building envelope options using a series of whole-building life cycle assessments (LCAs). The purpose of the study is to understand the embodied environmental impact, in particular embodied carbon, of a building constructed using Kingspan products compared to the same building constructed with normative materials.
Figure 1. The study considers four wall envelope options for this typical industrial warehouse.
This LCA specifically compares the ecological impacts of an industrial building constructed using the Kingspan QuadCore® insulated metal panel (IMP) relative to buildings constructed using mineral fiber IMPs, insulated concrete, and tilt-up concrete. The LCA methodology used in this study accounts for the environmental impacts associated with the inputs from and emissions to the environment that result from the manufacturing, maintenance, and disposal of products and materials found in each of the buildings.
The assessment has been conducted according to a North American interpretation of the guidelines provided by European Standard EN 15978:2011, Sustainability of construction works – Assessment of environmental performance of buildings4.

Insulated Panel SystemsReducing the Embodied Carbon of Walls in Industrial Buildings
7
Each option meets the performance criteria defined by the International Building Code5. Equivalent energy performance is proxied by maintaining a wall R-value of 20, as required for climate zone 4A.
All buildings meet structural requirements for typical Philadelphia conditions, with structural modifications per option to support the envelope as well as regionally appropriate loads for snow and wind.
Architectural products and assemblies include all materials required for the product’s manufacturing and use, such as hardware, sealants, adhesives, coatings, and finishing. Material quantities are included up to a 1% cut-off factor by mass, except for cases known to have high environmental impacts at low levels, where a 1% cut-off is implemented by environmental impact.
Figure 2. US Climate zone map; Philadelphia is in Climate Zone 4A per the International Building Code, 2018.
Philadelphia
Shared vs. Unique Building ComponentsTo compare the impacts of the wall envelopes specifically, it was important to identify which building components were common throughout each of the four designs and which were unique to each wall system. This enabled the analysis to isolate the outcomes for each building to the wall assemblies, allowing for appropriate side-by-side comparisons.
The shared components of each of the four buildings include: Roof assembly comprising polyisocyanurate (PIR)
insulation, sheathing board, and TPO membrane Interior structure of steel columns, trusses, and
joists supporting a steel roof deck Floor slab of unfinished concrete on grade Overhead coiling doors, several aluminum-framed
windows, and egress doors as required by building code
Foundation system including continuous concrete foundation wall and concrete wall footing
Unique to each building variation is an envelope assembly which includes: A full wall assembly and any related support
structures as required Supplementary foundations such as column
footings, additional edge foundations, and exterior wall support as required
The analysis in this paper focuses on the comparison of the impacts of the unique components for each building.
Table 1. Building components are held constant or changed to maintain equity across options.
Kingspan QuadCore® IMP
Mineral Fiber IMP
Insulated Concrete
Tilt-up Concrete
Wall Assembly Unique Unique Unique Unique
Vertical Structure Unique Unique
Foundations Unique Unique
Doors and Windows Shared
Roofing Shared
Floor Slab Shared

Insulated Panel SystemsReducing the Embodied Carbon of Walls in Industrial Buildings
8
Wall Assemblies
Kingspan IMP insulated with QuadCore®
The Kingspan QuadCore® IMP assembly uses a 2½-inch thick, 24-inch wide Kingspan KS panel. Steel girts provide the secondary structure for hanging the panels between the W-section columns and beams supporting the joists for the roof. Additional concrete footings with embedded steel plates support the steel perimeter columns.
Figure 3. Kingspan KS panel insulated with QuadCore®

Insulated Panel SystemsReducing the Embodied Carbon of Walls in Industrial Buildings
9
Figure 4. Structural bay and foundation detail of the building using the Kingspan QuadCore® IMP.
Exterior Wall1. 21/2 in. Kingspan QuadCore® insulated metal
panel (22 ga steel sheet, PVDF coating, hybrid polyisocyanurate fill, Zincalume coating, modified polyester coating)
2. Stainless steel fasteners and clips3. White butyl caulk4. 6x6x3/8 in. HSS steel in braced frame to
support panels5. 6x6x5/16 in. HSS steel framing
around openings (not shown)6. 8x8x3/8 in. HSS steel in non-braced frame to
support panels7. 10x10x3/8 in. HSS steel in braced frame to
support panels8. 14x14x5/8 in. HSS steel perimeter columns9. W24x55 W-flange to support roof joists10. Steel plate column attachment
Foundation11. 22x22x11/2 in. steel embed plate for
non-braced frame columns (not shown)12. 24x24x21/2 in. steel embed plate for
braced frame columns13. 2x2 ft. concrete pier at exterior columns14. 4x4x11/2 ft. concrete footing for non-braced
frame columns (not shown)15. 8x8x21/2 ft. Concrete footing for braced
frame columns16. 12 in. concrete footing wall17. Steel reinforcing rod (rebar)
6
3
2
1 21/2”
15
17
13
12
8
16
8
7
4
10
6
9

Insulated Panel SystemsReducing the Embodied Carbon of Walls in Industrial Buildings
10
Figure 5. Insulated metal panel with a mineral fiber core.
Wall Assemblies
Mineral Fiber IMPThis IMP envelope option is based on a 5-inch thick, 42-inch wide standard fluoropolymer-coated panel made of G-90 galvanized steel wrapped around a high-density rigid mineral fiber core. The panel requires a perimeter steel structure of columns, beams, and girts as well as perimeter concrete footings. This added structure is identical to the structural design supporting the Kingspan QuadCore® panels.

Insulated Panel SystemsReducing the Embodied Carbon of Walls in Industrial Buildings
11
Figure 6. Structural bay and foundation detail of the building using the mineral fiber IMP.
Exterior Wall1. 5 in. metal-clad mineral wool panel
(26 ga steel sheet, 43/4 in. high-density mineral wool board, polyurethane adhesive, G-90 galvanized coating, fluoropolymer coating)
2. Galvanized fasteners and clips3. 6x6x3/8 in. HSS steel in braced frame to
support panels4. 6x6x5/16 in. HSS steel framing around
openings (not shown)5. 8x8x3/8 in. HSS steel in non-braced frame to
support panels6. 10x10x3/8 in. HSS steel in braced frame to
support panels7. 14x14x5/8 in. HSS steel perimeter columns8. W24x55 W-flange to support roof joists9. Steel plate column attachment
Foundation10. 22x22x11/2 in. steel embed plate for non
braced frame columns (not shown)11. 24x24x21/2 in. steel embed plate for braced
frame columns12. 2x2 ft. concrete pier at exterior columns13. 4x4x11/2 ft. concrete footing for non-braced
frame columns (not shown)14. 8x8x21/2 ft. Concrete footing for braced
frame columns15. 12 in. concrete footing wall16. Steel reinforcing rod (rebar)
15
16
12
11
7
5
2
1 5”
15
7
6
3
9
5
8
Insulated Panel SystemsReducing the Embodied Carbon of Walls in Industrial Buildings
12
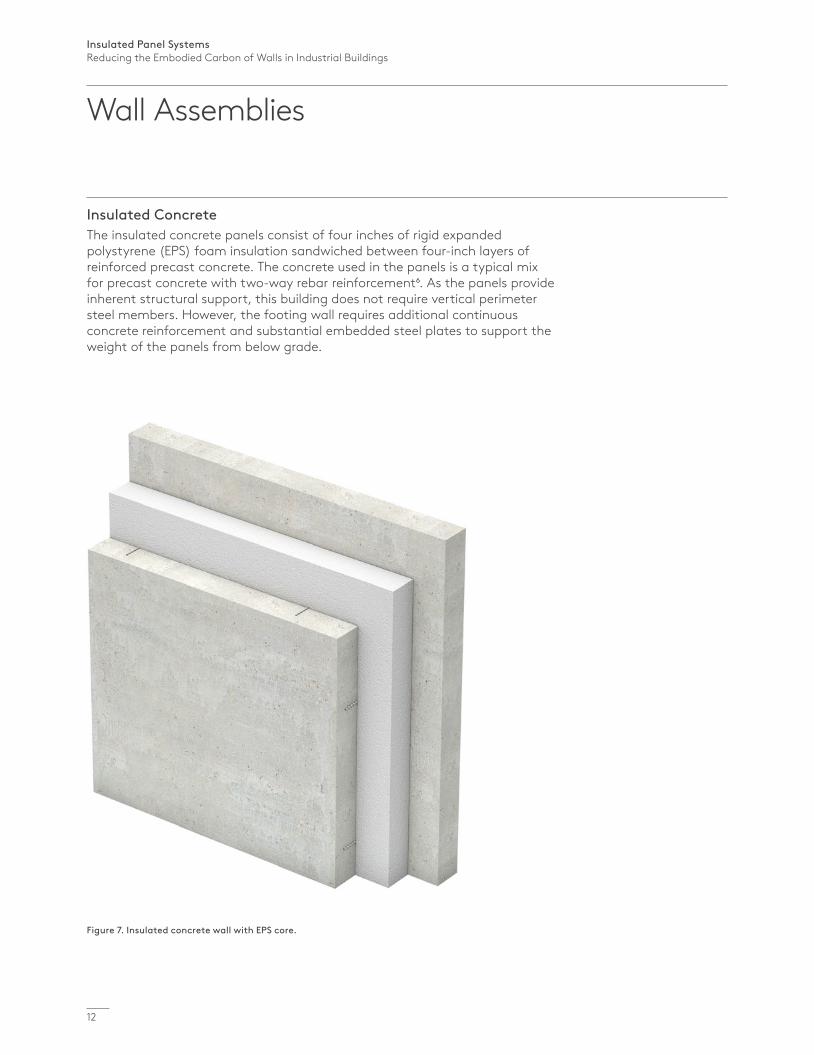
Figure 7. Insulated concrete wall with EPS core.
Wall Assemblies
Insulated ConcreteThe insulated concrete panels consist of four inches of rigid expanded polystyrene (EPS) foam insulation sandwiched between four-inch layers of reinforced precast concrete. The concrete used in the panels is a typical mix for precast concrete with two-way rebar reinforcement6. As the panels provide inherent structural support, this building does not require vertical perimeter steel members. However, the footing wall requires additional continuous concrete reinforcement and substantial embedded steel plates to support the weight of the panels from below grade.

Insulated Panel SystemsReducing the Embodied Carbon of Walls in Industrial Buildings
13
Figure 8. Structural bay and foundation detail of the building using insulated concrete.
Exterior Wall1. 4 in. precast structural concrete
(admixture, coarse aggregate, expanded slag, fly ash, Portland cement, sand, rebar)
2. 4 in. Expanded polystyrene (EPS) board3. 4 in. precast structural concrete
(admixture, coarse aggregate, expanded slag, fly ash, Portland cement, sand, rebar)
4. Steel reinforcing rod (rebar)5. 12x12x3/4 in. Steel embed plate
Foundation6. 12x1/2 in. steel shelf7. 1/2x12 in. Steel embed plate8. 4 in. continuous concrete footing neck9. 12 in. continuous concrete footing wall10. 3x1 ft. continuous concrete footing11. Steel reinforcing rod (rebar)
1
2
3
1'5
4
6
9
10
7
11
8

Insulated Panel SystemsReducing the Embodied Carbon of Walls in Industrial Buildings
14
Figure 9. Tilt-up concrete wall assembly with fiberglass batt insulation and internal lining.
Wall Assemblies
Tilt-Up ConcreteThe primary material in the tilt-up concrete construction is the nine-inch thick tilt-up reinforced concrete panel. The concrete mix matches the typical mix for a 5ksi panel in the Philadelphia region and uses a mixture of slag and fly ash to replace some of the cement to reduce embodied greenhouse gas emissions7. As the panels do not provide sufficient thermal insulation on their own, metal studs with fiberglass batt insulation and an interior layer of gypsum board are required to maintain an equivalent function with the other buildings. The foundation structure for the tilt-up concrete variation is the same as the foundations in the insulated concrete construction.

Insulated Panel SystemsReducing the Embodied Carbon of Walls in Industrial Buildings
15
Figure 10. Structural bay and foundation detail of the building using tilt-up concrete.
Exterior Wall1. 9 in. structural concrete panel (admixture,
coarse aggregate, expanded slag, fly ash, Portland cement, sand, rebar)
2. Steel reinforcing rod (rebar)3. 12x12x3/4 in. Steel embed plate4. 5 in. fiberglass batt insulation5. 5 in. 16 ga. metal stud @16 in. on center6. 5/8 in. gypsum wallboard7. 2 coats acrylic latex paint
Foundation8. 1/2x12 in. Steel embed plate9. 4 in. continuous concrete footing neck10. 12 in. continuous concrete footing wall11. 3x1 ft. continuous concrete footing12. Steel reinforcing rod (rebar)
1’-25/8”
1
45
6 7
3
4
8
10
11
12
2
9

Insulated Panel SystemsReducing the Embodied Carbon of Walls in Industrial Buildings
16
Methodology: Life Cycle Assessment (LCA)
To conduct this comparison study, Kingspan engaged architectural planning and research firm KieranTimberlake, creators of the Tally LCA software used in the analysis.
Each industrial building was designed to create a 600-foot by 250-foot interior space with minimal columns in order to maximize usable clear floor area. As the buildings are situated in Philadelphia, all cast-in-place concrete is assumed to match regional baseline concrete mixes provided by the National Ready Mixed Concrete Association8. Tally, which is a Revit-integrated LCA tool, provided accurate material take-off calculations from the Revit geometry to generate a complete bill of materials.
Tally generated the figures for potential environmental impacts and resource demand over the full building life cycle based on the TRACI 2.1 Characterization Scheme, including Global Warming, Acidification, Eutrophication, Smog Formation, Ozone Depletion, and Non-Renewable Energy Demand9.
Although a characterization scheme translates all emissions and fuel use associated with the assessment into quantities of categorized environmental impact, the degree of resulting environmental harm depends on the regional ecosystem conditions and the location in which emissions occur. Therefore, effects are reported as potential to harm in kilograms of equal relative contribution (eq) of an emission commonly associated with that form of environmental impact, rather than as absolute measures of ecological harm.

Insulated Panel SystemsReducing the Embodied Carbon of Walls in Industrial Buildings
17
Smog Formation PotentialThe impacts of smog formation have the same drivers as the impacts of global warming, and here the Kingspan QuadCore® IMP wall again had the lowest impact – 19% lower than the highest impact design which used the tilt-up concrete wall, again followed closely by the insulated concrete wall.For the two concrete options, the primary driver is the cement. For the IMP options, the most considerable contributions are from the HSS steel support structure and metal in each panel. The difference in performance between the IMP options is due to the contributions of the fluoropolymer coating on the mineral fiber IMP.
Results
1,000,000
800,000
600,000
400,000
200,000
Figure 11. Embodied carbon, measured as global warming potential.
Kingspan QuadCore® IMP
kg CO₂ eq
Mineral Fiber IMP
Insulated Concrete
Tilt-up Concrete
Figure 12. Smog formation comparison.
60,000
50,000
40,000
30,000
20,000
10,000
Kingspan QuadCore® IMP
kg O₃ eq
Mineral Fiber IMP
Insulated Concrete
Tilt-up Concrete
Global Warming PotentialIn this comparison of embodied carbon, measured as global warming potential, the LCA revealed that the Kingspan QuadCore® IMP had the lowest levels out of all the wall assemblies – 28% lower than both the insulated concrete wall and tilt-up concrete wall, which had the highest levels of embodied carbon. The cement content in the precast panels and the tilt-up concrete creates the high greenhouse gas contributions for those options. For the two IMP options, the most significant contributor is the metal structure at the perimeter. The fluoropolymer coating on the mineral fiber IMP also drives up the global warming contribution of that option.

Insulated Panel SystemsReducing the Embodied Carbon of Walls in Industrial Buildings
18
Eutrophication PotentialIn the category of eutrophication, all four wall systems were very close with only a 14 kg Nitrogen equivalent (N eq) difference from the lowest to the highest impacts – the tilt-up concrete wall having the lowest impact at 173 kg N eq, and the Kingspan QuadCore® IMP wall system at 188 kg N eq.
Results
Acidification PotentialComparing only the components that change between buildings, the mineral fiber IMP contributes the most to acidification, while insulated concrete contributes the least, with 34% lower levels than the mineral fiber IMP. The quantity of steel used in each option correlates strongly with the performance in this category. In the mineral fiber IMP, the heavy galvanization and fluoropolymer finish further drive up the impacts.
Figure 13. Acidification comparison.
5,000
4,500
4,000
3,500
3,000
2,500
2,000
1,500
1,000
500
Kingspan QuadCore® IMP
kg SO₂ eq
Mineral Fiber IMP
Insulated Concrete
Tilt-up Concrete
Figure 14. Eutrophication comparison.
200
180
160
140
120
100
80
60
40
20
Kingspan QuadCore® IMP
kg N eq
Mineral Fiber IMP
Insulated Concrete
Tilt-up Concrete

Insulated Panel SystemsReducing the Embodied Carbon of Walls in Industrial Buildings
19
Non-renewable Energy DemandIn assessing non-renewable energy demand, the mineral fiber IMP wall had the highest impact, with the Kingspan QuadCore® IMP wall using 13% less non-renewable energy. The primary driver of impact for the mineral fiber IMP option is the fluoropolymer coating and the power sources used for manufacturing. The insulated concrete option uses the fewest fossil fuels.
Ozone Depletion PotentialWith only a 0.08 kg CFC-11 equivalent (CFC-11 eq) difference between the highest impact wall and the lowest impact wall, these impacts are relatively insignificant across all options.The difference in impact of the mineral fiber IMP is a result of the fluoropolymer coating used in that option. Negative values for insulated concrete this category result from the recycling credits at the end of life associated with the rebar in the concrete, which offset the impacts that would have come with the avoided primary material.
Figure 14. Ozone depletion comparison.
0.09
0.08
0.07
0.06
0.05
0.04
0.03
0.02
0.01
Kingspan QuadCore® IMP
kg CFC-11 eq
Mineral Fiber IMP
Insulated Concrete
Tilt-up Concrete
Figure 16. Non-renewable energy demand comparison.
14,000,000
12,000,000
10,000,000
8,000,000
6,000,000
4,000,000
2,000,000
Kingspan QuadCore® IMP
MJ
Mineral Fiber IMP
Insulated Concrete
Tilt-up Concrete

Insulated Panel SystemsReducing the Embodied Carbon of Walls in Industrial Buildings
20
Conclusion
Due to the locked-in nature of embodied carbon, the effort to reduce the carbon footprint of a building, as it relates to building materials, must be considered in the design and procurement phase of a project. This research conducted by KieranTimberlake highlights the importance of thoughtful material selection at the outset.
The results demonstrate that when it comes to material selection for wall envelopes, using Kingspan QuadCore® IMPs for industrial type buildings can reduce the embodied carbon impact of the building compared to conventional systems such as insulated concrete, tilt-up concrete and mineral fiber IMPs. For the building design and boundaries of this study, the LCA analysis revealed that the Kingspan QuadCore® IMPs reduced embodied carbon of the wall envelope by 28% compared to both insulated concrete and tilt-up concrete wall systems.
Future opportunities exist to reduce the embodied carbon in Kingspan QuadCore® IMPs even further through a substantial change in the fuel source mix for manufacturing. The Kingspan QuadCore® product EPD (2019) used in this research describes the current manufacturing fuel sources as natural gas, the Upstate New York electricity grid, and liquified petroleum gas. A substantial change in fuel sources to renewables for manufacturing could improve the Kingspan QuadCore® panel performance in all environmental impact categories, as a direct correlation exists between non-renewable energy demand and environmental impacts, especially global warming, acidification, and smog formation.
These improvement measures are currently underway as part of Kingspan’s Planet Passionate program and will be formally reflected in an updated EPD for Kingspan QuadCore® in the near future.
To reduce the embodied carbon of building envelopes, Kingspan QuadCore® IMPs should be considered the product of choice compared to conventional wall systems such as concrete or mineral fiber IMPs.
The 28% savings in embodied carbon by using Kingspan QuadCore® IMPs compared to the concrete wall systems is equivalent to the CO2 emissions from burning 149 tons of coal, or the Greenhouse gas emissions from driving the average car 671,270 miles (27 times around the Earth).4
28%lower embodied
carbon
149tons of coal
671,720miles driven

Insulated Panel SystemsReducing the Embodied Carbon of Walls in Industrial Buildings
21
Projects
Lower embodied carbon
Independent sustainability certification
Building rating system credits

Insulated Panel SystemsReducing the Embodied Carbon of Walls in Industrial Buildings
22
Our 2030 Global Commitments
At Kingspan, we want to play our part. We believe advanced materials, building systems and digital technologies hold the key to addressing these issues. With our Planet Passionate global sustainability program, we are confident that together we can move to a clean energy future, manage the earth’s resources more sustainably and protect our natural environment.
To do this we have set ourselves a series of goals to be achieved by 2030. ↘
Energy Maintain our Net-Zero
energy target Increase our direct use of renewable
energy to 60% by 2030 Increase our onsite generation of
renewable energy to 20% by 2030 Install solar PV systems on
all owned facilities by 2030
Carbon Net-Zero carbon
manufacturing by 2030 50% reduction in product CO₂
intensity from our primary supply partners by 2030
Zero emission ready company cars by 2025

Insulated Panel SystemsReducing the Embodied Carbon of Walls in Industrial Buildings
23
Planet Passionate Program to Further Drive Down Embodied Carbon
Some of the targets that will specifically the impact embodied carbon of our products include:
Increasing the use of direct renewable energy to 60% by 2030
Increasing our on-site renewable energy generation to 20% by 2030
Reducing the product CO₂ intensity from our primary supply partners by 50% by 2030
All QuadCore® to use upcycled PET by 2025
Through Planet Passionate, we are playing our part by driving energy and carbon out of our business operations and supply chain, as well as increasing our recycling of rainwater and waste, while also accelerating our participation in the circular economy.
For more details on the program and the full list of targets, please visit www.kingspan.com/planetpassionate.
Planet Passionate is Kingspan’s ambitious 10-year global sustainability program that aims to impact three big global issues – climate change, circularity, and protection of our natural world.In addressing these issues, Kingspan has set targets in the areas of energy, carbon, circularity, and water, which are also aimed at making significant advances in the sustainability of both our business operations and our products.
Circularity 1 billion PET bottles upcycled
into our manufacturing processes by 2025
All QuadCore® insulation to utilise upcycled PET by 2025
Zero company waste to landfill by 2030
Water 5 active ocean clean-up
projects by 2025 100 million liters of rainwater
harvested by 2030

Insulated Panel SystemsReducing the Embodied Carbon of Walls in Industrial Buildings
24
Projects
Up to R8.0 per inch
Integrated envelope solution
FIREsafe™
Space saving

Insulated Panel SystemsReducing the Embodied Carbon of Walls in Industrial Buildings
25
Appendix
Environmental Impact CategoriesA characterization scheme translates all emissions and fuel use associated with the reference flow into quantities of categorized environmental impact.
Global Warming Potential (kg CO₂eq)A measure of greenhouse gas emissions, such as carbon dioxide and methane. These emissions are causing an increase in the absorption of radiation emitted by the earth, increasing the natural greenhouse effect. This may, in turn, have adverse impacts on ecosystem health, human health, and material welfare.
Smog Formation Potential (SFP) (kg O₃eq) A measure of ground level ozone, caused by various chemical reactions between nitrogen oxides (NOx) and volatile organic compounds (VOCs) in sunlight. Human health effects can result in a variety of respiratory issues, including increasing symptoms of bronchitis, asthma, and emphysema. Permanent lung damage may result from prolonged exposure to ozone. Ecological impacts include damage to various ecosystems and crop damage.
Acidification Potential (kg SO₂eq) A measure of emissions that cause acidifying effects to the environment. The acidification potential is a measure of a molecule’s capacity to increase the hydrogen ion (H+) concentration in the presence of water, thus decreasing the pH value. Potential effects include fish mortality, forest decline, and the deterioration of building materials.
Eutrophication Potential (kg Neq) A measure of the impacts of excessively high levels of macronutrients, the most important of which are nitrogen (N) and phosphorus (P). Nutrient enrichment may cause an undesirable shift in species composition and elevated biomass production in both aquatic and terrestrial ecosystems. In aquatic ecosystems, increased biomass production may lead to depressed oxygen levels caused by the additional consumption of oxygen in biomass decomposition.
Ozone Depletion Potential (kg CFC-11eq) A measure of air emissions that contribute to the depletion of the stratospheric ozone layer. Depletion of the ozone leads to higher levels of UVB ultraviolet rays reaching the earth’s surface with detrimental effects on humans and plants. As these impacts tend to be very small, ODP impacts can be difficult to calculate and are prone to a larger margin of error than the other impact categories.
Non-Renewable Energy Demand (MJ) A measure of the energy extracted from non-renewable resources (e.g. petroleum, natural gas, etc.) contributing to the Primary Energy Demand. Non-renewable resources are those that cannot be regenerated within a human time scale. Efficiencies in energy conversion (e.g. power, heat, steam, etc.) are taken into account when calculating this result.
As the degree that the emissions will result in environmental harm depends on regional ecosystem conditions and the location in which they occur, the results are reported as impact potential. Potential impacts are reported in kilograms of equivalent relative contribution (eq) of an emission commonly associated with that form of environmental impact (e.g. kg CO₂eq).
The following list provides a description of environmental impact categories reported according to the TRACI 2.1 characterization scheme, the environmental impact model developed by the US EPA to quantify environmental impact risk associated with emissions to the environment in the United States. TRACI is the standard environmental impact reporting format for LCA in North America.
Impacts associated with land use change and fresh water depletion are not included in TRACI 2.1. For more information on TRACI 2.1, reference Bare 201010, Bare 2012, and Guinée 200111.

Insulated Panel SystemsReducing the Embodied Carbon of Walls in Industrial Buildings
26
Acidification (kg SO₂ eq)
Eutrophication (kg N eq)
Global Warming (kg CO₂ eq)
Ozone Depletion (CFC-11 eq)
Smog Formation (kg O₃ eq)
Primary Energy Demand (MJ)
Non-Renewable Energy Demand (MJ)
Renewable Energy Demand (MJ)
Mass (kg)
03 – Concrete
Admixture 0.36 0.04 210.52 0.00000 6.43 4,951.87 4,873.45 77.17 64.12
Coarse aggregate 23.26 1.34 4,257.56 0.00000 550.06 70,766.25 66,374.22 4,460.86 161,953.90
Expanded slag 2.53 0.12 344.84 0.00000 55.45 5,540.97 5,284.36 260.42 12,588.26
Fly ash 4.86 0.40 2,036.31 0.00000 97.97 22,444.75 22,162.13 310.59 8,767.27
Portland cement 194.30 15.14 86,463.15 0.00000 4,176.20 613,456.56 560,047.15 53,191.85 83,281.48
Sand 28.75 1.64 9,360.66 0.00000 711.93 155,541.44 150,984.22 4,524.02 138,914.24
Steel reinforcing rod (rebar) 70.44 2.08 13,830.57 (0.00005) 837.97 194,922.55 183,510.77 11,705.97 9,810.77
Water 3.64 0.20 777.52 0.00000 77.51 12,875.09 12,179.08 709.10 36,864.97
05 – Metals
Cold formed structural steel 1,548.63 73.94 240,682.82 0.00916 22,039.33 4,045,084.09 3,707,005.22 345,265.50 224,013.61
Hot rolled structural steel 220.70 5.13 43,715.72 (0.00002) 1,259.60 553,323.72 539,615.21 12,469.48 39,944.49
Steel plate 126.90 5.96 25,184.68 0.00061 1,808.19 358,856.98 339,168.90 19,897.17 16,943.23
07 – Thermal and Moisture Protection
Stainless steel fasteners 230.60 38.10 11,294.12 0.00166 420.99 224,881.46 179,416.42 46,014.38 4,985.19
Kingspan QuadCore® insulated metal panel 707.73 43.47 247,777.85 0.00018 13,137.88 4,458,331.02 4,247,553.48 210,784.75 65,164.38
TOTAL 3,162.70 187.55 685,936.32 0.01154 45,179.50 10,720,976.74 10,018,174.60 709,671.23 803,295.91
Contribution Assessment by Material
Kingspan QuadCore® IMPTable 2. Data visually reformatted from Tally results export.

Insulated Panel SystemsReducing the Embodied Carbon of Walls in Industrial Buildings
27
Acidification (kg SO₂ eq)
Eutrophication (kg N eq)
Global Warming (kg CO₂ eq)
Ozone Depletion (CFC-11 eq)
Smog Formation (kg O₃ eq)
Primary Energy Demand (MJ)
Non-Renewable Energy Demand (MJ)
Renewable Energy Demand (MJ)
Mass (kg)
03 – Concrete
Admixture 0.36 0.04 210.52 0.00000 6.43 4,951.87 4,873.45 77.17 64.12
Coarse aggregate 23.26 1.34 4,257.56 0.00000 550.06 70,766.25 66,374.22 4,460.86 161,953.90
Expanded slag 2.53 0.12 344.84 0.00000 55.45 5,540.97 5,284.36 260.42 12,588.26
Fly ash 4.86 0.40 2,036.31 0.00000 97.97 22,444.75 22,162.13 310.59 8,767.27
Portland cement 194.30 15.14 86,463.15 0.00000 4,176.20 613,456.56 560,047.15 53,191.85 83,281.48
Sand 28.75 1.64 9,360.66 0.00000 711.93 155,541.44 150,984.22 4,524.02 138,914.24
Steel reinforcing rod (rebar) 70.44 2.08 13,830.57 (0.00005) 837.97 194,922.55 183,510.77 11,705.97 9,810.77
Water 3.64 0.20 777.52 0.00000 77.51 12,875.09 12,179.08 709.10 36,864.97
05 – Metals
Cold formed structural steel 1,548.63 73.94 240,682.82 0.00916 22,039.33 4,045,084.09 3,707,005.22 345,265.50 224,013.61
Hot rolled structural steel 220.70 5.13 43,715.72 (0.00002) 1,259.60 553,323.72 539,615.21 12,469.48 39,944.49
Steel plate 126.90 5.96 25,184.68 0.00061 1,808.19 358,856.98 339,168.90 19,897.17 16,943.23
07 – Thermal and Moisture Protection
Stainless steel fasteners 230.60 38.10 11,294.12 0.00166 420.99 224,881.46 179,416.42 46,014.38 4,985.19
Kingspan QuadCore® insulated metal panel 707.73 43.47 247,777.85 0.00018 13,137.88 4,458,331.02 4,247,553.48 210,784.75 65,164.38
TOTAL 3,162.70 187.55 685,936.32 0.01154 45,179.50 10,720,976.74 10,018,174.60 709,671.23 803,295.91

Insulated Panel SystemsReducing the Embodied Carbon of Walls in Industrial Buildings
28
Contribution Assessment by Material
Mineral Fiber IMPTable 3. Data visually reformatted from Tally results export.
Acidification (kg SO₂ eq)
Eutrophication (kg N eq)
Global Warming (kg CO₂ eq)
Ozone Depletion (CFC-11 eq)
Smog Formation (kg O₃ eq)
Primary Energy Demand (MJ)
Non-Renewable Energy Demand (MJ)
Renewable Energy Demand (MJ)
Mass (kg)
03 – Concrete
Admixture 0.36 0.04 210.52 0.00000 6.43 4,951.87 4,873.45 77.17 64.12
Coarse aggregate 23.26 1.33 4,257.56 0.00000 550.05 70,766.24 66,374.21 4,460.86 161,953.90
Expanded slag 2.53 0.12 344.85 0.00000 55.45 5,540.97 5,284.35 260.41 12,588.27
Fly ash 4.85 0.40 2,036.31 0.00000 97.97 22,444.75 22,162.12 310.59 8,767.27
Portland cement 194.30 15.15 86,463.15 0.00000 4,176.21 613,456.56 560,047.15 53,191.85 83,281.48
Sand 28.75 1.64 9,360.65 0.00000 711.93 155,541.44 150,984.22 4,524.02 138,914.24
Steel reinforcing rod (rebar) 70.44 2.08 13,830.57 (0.00005) 837.97 194,922.55 183,510.77 11,705.97 9,810.77
Water 3.64 0.20 777.52 0.00000 77.51 12,875.09 12,179.08 709.10 36,864.97
05 – Metals
Cold formed structural steel 1,556.45 74.32 241,897.68 0.00920 22,150.57 4,065,501.86 3,725,716.51 347,008.25 225,144.33
Hot rolled structural steel 220.70 5.12 43,715.72 (0.00002) 1,259.60 553,323.72 539,615.20 12,469.48 39,944.50
Steel plate 220.70 5.13 43,715.72 - 1,259.60 553,323.72 539,615.21 12,469.48 39,944.49
07 – Thermal and Moisture Protection
Adhesive, polyurethane 3.93 0.69 1,805.61 - 89.81 34,849.21 33,271.83 1,529.43 802.76
Fluoropolymer coating, metal stock 590.97 25.38 133,431.86 0.06900 8,952.24 2,865,186.52 2,725,867.10 136,399.04 7,313.74
Mineral wool, high density, NAIMA - EPD 1,104.26 20.07 156,509.61 0.00412 5,527.70 1,952,172.40 1,868,364.54 89,042.51 87,556.23
Steel sheet 186.38 14.17 27,350.44 0.00200 4,542.48 547,440.71 482,888.49 66,500.52 18,570.81
Zinc coating (galvanized) for steel G90 156.57 8.17 38,877.02 - 2,527.77 636,425.23 548,935.60 85,932.95 3,118.26
TOTAL 4,368.09 174.00 804,584.78 0.08400 52,823.28 12,288,722.84 11,469,689.83 826,591.62 874,640.13

Insulated Panel SystemsReducing the Embodied Carbon of Walls in Industrial Buildings
29
Acidification (kg SO₂ eq)
Eutrophication (kg N eq)
Global Warming (kg CO₂ eq)
Ozone Depletion (CFC-11 eq)
Smog Formation (kg O₃ eq)
Primary Energy Demand (MJ)
Non-Renewable Energy Demand (MJ)
Renewable Energy Demand (MJ)
Mass (kg)
03 – Concrete
Admixture 0.36 0.04 210.52 0.00000 6.43 4,951.87 4,873.45 77.17 64.12
Coarse aggregate 23.26 1.33 4,257.56 0.00000 550.05 70,766.24 66,374.21 4,460.86 161,953.90
Expanded slag 2.53 0.12 344.85 0.00000 55.45 5,540.97 5,284.35 260.41 12,588.27
Fly ash 4.85 0.40 2,036.31 0.00000 97.97 22,444.75 22,162.12 310.59 8,767.27
Portland cement 194.30 15.15 86,463.15 0.00000 4,176.21 613,456.56 560,047.15 53,191.85 83,281.48
Sand 28.75 1.64 9,360.65 0.00000 711.93 155,541.44 150,984.22 4,524.02 138,914.24
Steel reinforcing rod (rebar) 70.44 2.08 13,830.57 (0.00005) 837.97 194,922.55 183,510.77 11,705.97 9,810.77
Water 3.64 0.20 777.52 0.00000 77.51 12,875.09 12,179.08 709.10 36,864.97
05 – Metals
Cold formed structural steel 1,556.45 74.32 241,897.68 0.00920 22,150.57 4,065,501.86 3,725,716.51 347,008.25 225,144.33
Hot rolled structural steel 220.70 5.12 43,715.72 (0.00002) 1,259.60 553,323.72 539,615.20 12,469.48 39,944.50
Steel plate 220.70 5.13 43,715.72 - 1,259.60 553,323.72 539,615.21 12,469.48 39,944.49
07 – Thermal and Moisture Protection
Adhesive, polyurethane 3.93 0.69 1,805.61 - 89.81 34,849.21 33,271.83 1,529.43 802.76
Fluoropolymer coating, metal stock 590.97 25.38 133,431.86 0.06900 8,952.24 2,865,186.52 2,725,867.10 136,399.04 7,313.74
Mineral wool, high density, NAIMA - EPD 1,104.26 20.07 156,509.61 0.00412 5,527.70 1,952,172.40 1,868,364.54 89,042.51 87,556.23
Steel sheet 186.38 14.17 27,350.44 0.00200 4,542.48 547,440.71 482,888.49 66,500.52 18,570.81
Zinc coating (galvanized) for steel G90 156.57 8.17 38,877.02 - 2,527.77 636,425.23 548,935.60 85,932.95 3,118.26
TOTAL 4,368.09 174.00 804,584.78 0.08400 52,823.28 12,288,722.84 11,469,689.83 826,591.62 874,640.13

Insulated Panel SystemsReducing the Embodied Carbon of Walls in Industrial Buildings
30
Contribution Assessment by Material
Insulated ConcreteTable 4. Data visually reformatted from Tally results export.
Acidification (kg SO₂ eq)
Eutrophication (kg N eq)
Global Warming (kg CO₂ eq)
Ozone Depletion (CFC-11 eq)
Smog Formation (kg O₃ eq)
Primary Energy Demand (MJ)
Non-Renewable Energy Demand (MJ)
Renewable Energy Demand (MJ)
Mass (kg)
03 – Concrete
Admixture 0.30 0.03 175.85 0.00000 5.37 4,136.28 4,070.78 64.46 53.56
Coarse aggregate 9.86 0.57 1,804.76 0.00000 233.17 29,997.42 28,135.66 1,890.93 68,651.36
Expanded slag 1.07 0.05 146.27 0.00000 23.52 2,350.31 2,241.46 110.46 5,339.55
Fly ash 2.06 0.17 863.46 0.00000 41.54 9,517.32 9,397.47 131.70 3,717.61
Portland cement 82.42 6.43 36,679.07 0.00000 1,771.62 260,238.23 237,581.09 22,564.85 35,329.36
Sand 12.18 0.70 3,965.94 0.00000 301.63 65,900.15 63,969.33 1,916.75 58,855.50
Steel reinforcing rod (rebar) 844.86 24.94 165,879.25 (0.00057) 10,050.33 2,337,836.63 2,200,967.47 140,397.56 117,667.18
Precast structural concrete, 4001-5000 psi 1,788.06 140.69 686,641.79 0.00000 40,291.83 5,881,552.51 5,439,101.46 443,465.26 2,780,158.18
Water 1.55 0.08 330.23 0.00000 32.92 5,468.32 5,172.71 301.17 15,657.33
05 – Metals
Hot rolled structural steel 11.82 0.27 2,341.53 (0.00000) 67.47 29,637.45 28,903.19 667.90 2,139.53
Steel joist 0.77 0.03 156.46 0.00000 6.61 2,185.74 2,080.46 112.23 128.52
Steel plate 7.08 0.34 1,158.50 0.00004 100.85 18,733.07 17,254.12 1,491.58 1,049.69
07 – Thermal and Moisture Protection
Expanded polystyrene (EPS), board 99.81 9.42 49,294.38 0.00000 2,522.32 1,403,429.73 1,389,208.08 14,031.18 14,606.07
TOTAL 2,861.84 183.71 949,437.51 (0.00053) 55,449.16 10,050,983.15 9,428,083.27 627,146.01 3,103,353.42

Insulated Panel SystemsReducing the Embodied Carbon of Walls in Industrial Buildings
31
Acidification (kg SO₂ eq)
Eutrophication (kg N eq)
Global Warming (kg CO₂ eq)
Ozone Depletion (CFC-11 eq)
Smog Formation (kg O₃ eq)
Primary Energy Demand (MJ)
Non-Renewable Energy Demand (MJ)
Renewable Energy Demand (MJ)
Mass (kg)
03 – Concrete
Admixture 0.30 0.03 175.85 0.00000 5.37 4,136.28 4,070.78 64.46 53.56
Coarse aggregate 9.86 0.57 1,804.76 0.00000 233.17 29,997.42 28,135.66 1,890.93 68,651.36
Expanded slag 1.07 0.05 146.27 0.00000 23.52 2,350.31 2,241.46 110.46 5,339.55
Fly ash 2.06 0.17 863.46 0.00000 41.54 9,517.32 9,397.47 131.70 3,717.61
Portland cement 82.42 6.43 36,679.07 0.00000 1,771.62 260,238.23 237,581.09 22,564.85 35,329.36
Sand 12.18 0.70 3,965.94 0.00000 301.63 65,900.15 63,969.33 1,916.75 58,855.50
Steel reinforcing rod (rebar) 844.86 24.94 165,879.25 (0.00057) 10,050.33 2,337,836.63 2,200,967.47 140,397.56 117,667.18
Precast structural concrete, 4001-5000 psi 1,788.06 140.69 686,641.79 0.00000 40,291.83 5,881,552.51 5,439,101.46 443,465.26 2,780,158.18
Water 1.55 0.08 330.23 0.00000 32.92 5,468.32 5,172.71 301.17 15,657.33
05 – Metals
Hot rolled structural steel 11.82 0.27 2,341.53 (0.00000) 67.47 29,637.45 28,903.19 667.90 2,139.53
Steel joist 0.77 0.03 156.46 0.00000 6.61 2,185.74 2,080.46 112.23 128.52
Steel plate 7.08 0.34 1,158.50 0.00004 100.85 18,733.07 17,254.12 1,491.58 1,049.69
07 – Thermal and Moisture Protection
Expanded polystyrene (EPS), board 99.81 9.42 49,294.38 0.00000 2,522.32 1,403,429.73 1,389,208.08 14,031.18 14,606.07
TOTAL 2,861.84 183.71 949,437.51 (0.00053) 55,449.16 10,050,983.15 9,428,083.27 627,146.01 3,103,353.42

Insulated Panel SystemsReducing the Embodied Carbon of Walls in Industrial Buildings
32
Contribution Assessment by Material
Tilt-up ConcreteTable 5. Data visually reformatted from Tally results export.
Acidification (kg SO₂ eq)
Eutrophication (kg N eq)
Global Warming (kg CO₂ eq)
Ozone Depletion (CFC-11 eq)
Smog Formation (kg O₃ eq)
Primary Energy Demand (MJ)
Non-Renewable Energy Demand (MJ)
Renewable Energy Demand (MJ)
Mass (kg)
03 – Concrete
Admixture 0.22 0.02 131.84 0.00000 4.02 3,101.20 3,052.09 48.33 40.15
Coarse aggregate 196.51 11.27 35,965.08 0.00000 4,646.50 597,787.31 560,686.31 37,682.41 1,368,081.49
Expanded slag 15.31 0.73 2,089.88 0.00000 336.05 33,580.00 32,024.85 1,578.19 76,288.89
Fly ash 29.42 2.45 12,342.63 0.00000 593.81 136,043.60 134,330.50 1,882.55 53,140.74
Portland cement 1,176.01 91.67 523,337.17 0.00000 25,277.41 3,713,080.28 3,389,808.10 321,955.33 504,079.42
Sand 242.95 13.86 79,104.63 0.00000 6,016.35 1,314,443.39 1,275,931.42 38,231.38 1,173,930.91
Steel reinforcing rod (rebar) 903.18 26.66 177,330.36 (0.00061) 10,744.13 2,499,223.98 2,352,906.35 150,089.59 125,790.07
Water 26.56 1.44 5,676.00 0.00000 565.85 93,989.97 88,909.00 5,176.51 269,119.47
05 – Metals
Cold formed structural steel 239.79 11.45 37,266.57 0.00142 3,412.50 626,328.04 573,980.97 53,459.82 34,685.56
Hot rolled structural steel 11.82 0.27 2,341.53 (0.00000) 67.47 29,637.45 28,903.19 667.90 2,139.53
Steel plate 9.49 0.45 1,553.76 0.00005 135.25 25,124.35 23,140.82 2,000.47 1,407.82
07 – Thermal and Moisture Protection
Fiberglass blanket insulation 82.22 4.34 15,896.31 0.00102 986.52 297,165.53 268,550.86 28,701.14 8,055.33
09 - Finishes
Acrylic latex paint 87.94 4.63 23,496.03 0.00000 1,694.55 558,947.94 505,423.85 53,531.78 9,290.44
Gypsum wallboard 62.63 3.95 39,926.38 0.00000 1,461.76 651,215.07 626,744.60 24,837.58 134,255.43
TOTAL 3,084.05 173.21 956,458.17 0.00188 55,942.16 10,579,668.12 9,864,392.90 719,842.98 3,760,305.24

Insulated Panel SystemsReducing the Embodied Carbon of Walls in Industrial Buildings
33
Acidification (kg SO₂ eq)
Eutrophication (kg N eq)
Global Warming (kg CO₂ eq)
Ozone Depletion (CFC-11 eq)
Smog Formation (kg O₃ eq)
Primary Energy Demand (MJ)
Non-Renewable Energy Demand (MJ)
Renewable Energy Demand (MJ)
Mass (kg)
03 – Concrete
Admixture 0.22 0.02 131.84 0.00000 4.02 3,101.20 3,052.09 48.33 40.15
Coarse aggregate 196.51 11.27 35,965.08 0.00000 4,646.50 597,787.31 560,686.31 37,682.41 1,368,081.49
Expanded slag 15.31 0.73 2,089.88 0.00000 336.05 33,580.00 32,024.85 1,578.19 76,288.89
Fly ash 29.42 2.45 12,342.63 0.00000 593.81 136,043.60 134,330.50 1,882.55 53,140.74
Portland cement 1,176.01 91.67 523,337.17 0.00000 25,277.41 3,713,080.28 3,389,808.10 321,955.33 504,079.42
Sand 242.95 13.86 79,104.63 0.00000 6,016.35 1,314,443.39 1,275,931.42 38,231.38 1,173,930.91
Steel reinforcing rod (rebar) 903.18 26.66 177,330.36 (0.00061) 10,744.13 2,499,223.98 2,352,906.35 150,089.59 125,790.07
Water 26.56 1.44 5,676.00 0.00000 565.85 93,989.97 88,909.00 5,176.51 269,119.47
05 – Metals
Cold formed structural steel 239.79 11.45 37,266.57 0.00142 3,412.50 626,328.04 573,980.97 53,459.82 34,685.56
Hot rolled structural steel 11.82 0.27 2,341.53 (0.00000) 67.47 29,637.45 28,903.19 667.90 2,139.53
Steel plate 9.49 0.45 1,553.76 0.00005 135.25 25,124.35 23,140.82 2,000.47 1,407.82
07 – Thermal and Moisture Protection
Fiberglass blanket insulation 82.22 4.34 15,896.31 0.00102 986.52 297,165.53 268,550.86 28,701.14 8,055.33
09 - Finishes
Acrylic latex paint 87.94 4.63 23,496.03 0.00000 1,694.55 558,947.94 505,423.85 53,531.78 9,290.44
Gypsum wallboard 62.63 3.95 39,926.38 0.00000 1,461.76 651,215.07 626,744.60 24,837.58 134,255.43
TOTAL 3,084.05 173.21 956,458.17 0.00188 55,942.16 10,579,668.12 9,864,392.90 719,842.98 3,760,305.24
Insulated Panel SystemsReducing the Embodied Carbon of Walls in Industrial Buildings
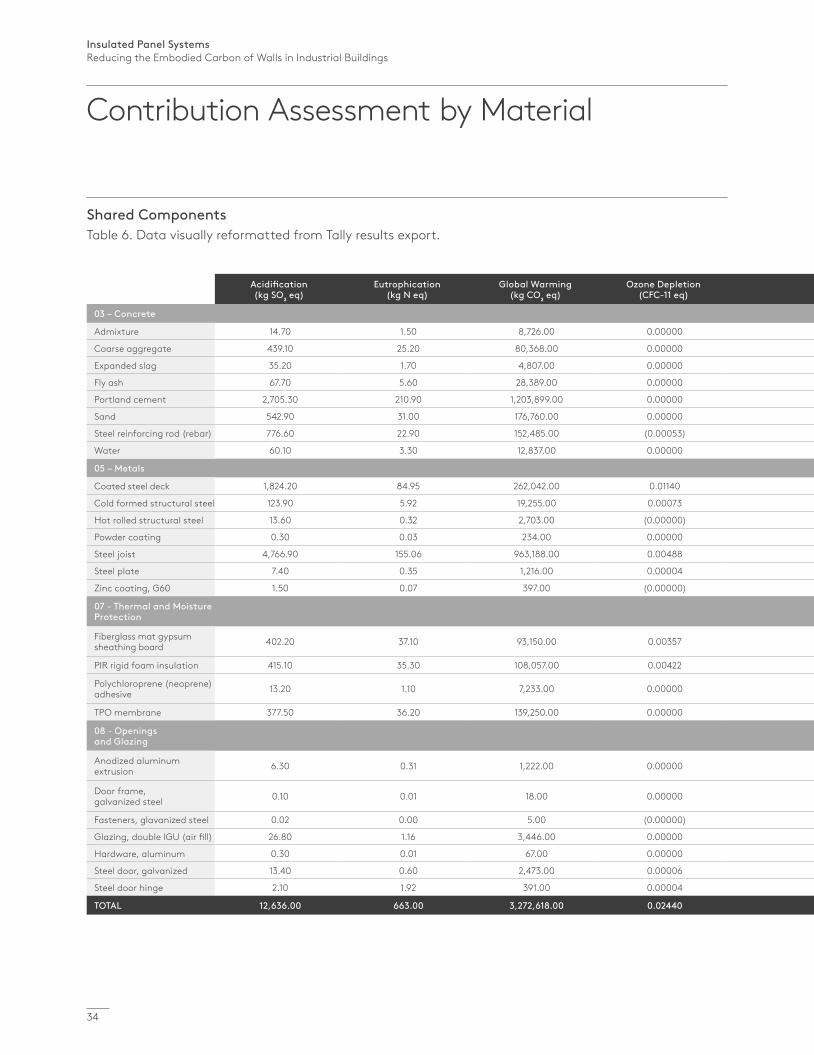
34
Contribution Assessment by Material
Shared ComponentsTable 6. Data visually reformatted from Tally results export.
Acidification (kg SO₂ eq)
Eutrophication (kg N eq)
Global Warming (kg CO₂ eq)
Ozone Depletion (CFC-11 eq)
Smog Formation (kg O₃ eq)
Primary Energy Demand (MJ)
Non-Renewable Energy Demand (MJ)
Renewable Energy Demand (MJ)
Mass (kg)
03 – Concrete
Admixture 14.70 1.50 8,726.00 0.00000 266.30 205,243.00 201,993.00 3,198.40 2,657.00
Coarse aggregate 439.10 25.20 80,368.00 0.00000 10,383.10 1,335,818.00 1,252,912.00 84,205.30 3,057,121.00
Expanded slag 35.20 1.70 4,807.00 0.00000 772.90 77,238.00 73,661.00 3,630.00 175,474.00
Fly ash 67.70 5.60 28,389.00 0.00000 1,365.80 312,910.00 308,969.00 4,330.00 122,227.00
Portland cement 2,705.30 210.90 1,203,899.00 0.00000 58,148.80 8,541,670.00 7,798,006.00 740,634.70 1,159,598.00
Sand 542.90 31.00 176,760.00 0.00000 13,443.60 2,937,139.00 2,851,083.00 85,428.50 2,623,162.00
Steel reinforcing rod (rebar) 776.60 22.90 152,485.00 (0.00053) 9,238.80 2,149,060.00 2,023,243.00 129,060.70 108,166.00
Water 60.10 3.30 12,837.00 0.00000 1,279.70 212,565.00 201,074.00 11,707.00 608,632.00
05 – Metals
Coated steel deck 1,824.20 84.95 262,042.00 0.01140 27,232.30 4,355,441.00 3,979,875.00 366,879.00 212,281.00
Cold formed structural steel 123.90 5.92 19,255.00 0.00073 1,763.20 323,620.00 296,573.00 27,622.00 17,922.00
Hot rolled structural steel 13.60 0.32 2,703.00 (0.00000) 77.90 34,212.00 33,365.00 771.00 2,470.00
Powder coating 0.30 0.03 234.00 0.00000 4.80 4,277.00 3,907.00 362.00 22.00
Steel joist 4,766.90 155.06 963,188.00 0.00488 40,709.10 13,455,795.00 12,807,672.00 690,911.00 791,177.00
Steel plate 7.40 0.35 1,216.00 0.00004 105.90 19,663.00 18,111.00 1,566.00 1,102.00
Zinc coating, G60 1.50 0.07 397.00 (0.00000) 21.70 6,582.00 5,754.00 816.00 31.00
07 - Thermal and Moisture Protection
Fiberglass mat gypsum sheathing board 402.20 37.10 93,150.00 0.00357 5,292.00 1,703,463.00 1,480,469.00 224,969.00 183,948.00
PIR rigid foam insulation 415.10 35.30 108,057.00 0.00422 5,021.00 2,280,344.00 2,226,957.00 50,012.00 42,581.00
Polychloroprene (neoprene) adhesive 13.20 1.10 7,233.00 0.00000 5,766.00 216,007.00 208,308.00 7,809.00 2,722.00
TPO membrane 377.50 36.20 139,250.00 0.00000 6,060.00 3,637,025.00 3,513,808.00 121,953.00 43,200.00
08 - Openings and Glazing
Anodized aluminum extrusion 6.30 0.31 1,222.00 0.00000 79.80 19,304.00 17,685.00 1,763.00 288.00
Door frame, galvanized steel 0.10 0.01 18.00 0.00000 1.90 279.00 260.00 19.00 10.00
Fasteners, glavanized steel 0.02 0.00 5.00 (0.00000) 0.20 66.00 61.00 5.00 1.00
Glazing, double IGU (air fill) 26.80 1.16 3,446.00 0.00000 340.70 49,704.00 47,382.00 2,480.00 2,401.00
Hardware, aluminum 0.30 0.01 67.00 0.00000 2.60 1,093.00 901.00 192.00 27.00
Steel door, galvanized 13.40 0.60 2,473.00 0.00006 208.50 36,657.00 35,044.00 1,633.00 1,137.00
Steel door hinge 2.10 1.92 391.00 0.00004 16.10 6,018.00 5,401.00 647.00 50.00
TOTAL 12,636.00 663.00 3,272,618.00 0.02440 187,603.00 41,921,193.00 39,392,474.00 2,562,604.00 9,158,407.00

Insulated Panel SystemsReducing the Embodied Carbon of Walls in Industrial Buildings
35
Acidification (kg SO₂ eq)
Eutrophication (kg N eq)
Global Warming (kg CO₂ eq)
Ozone Depletion (CFC-11 eq)
Smog Formation (kg O₃ eq)
Primary Energy Demand (MJ)
Non-Renewable Energy Demand (MJ)
Renewable Energy Demand (MJ)
Mass (kg)
03 – Concrete
Admixture 14.70 1.50 8,726.00 0.00000 266.30 205,243.00 201,993.00 3,198.40 2,657.00
Coarse aggregate 439.10 25.20 80,368.00 0.00000 10,383.10 1,335,818.00 1,252,912.00 84,205.30 3,057,121.00
Expanded slag 35.20 1.70 4,807.00 0.00000 772.90 77,238.00 73,661.00 3,630.00 175,474.00
Fly ash 67.70 5.60 28,389.00 0.00000 1,365.80 312,910.00 308,969.00 4,330.00 122,227.00
Portland cement 2,705.30 210.90 1,203,899.00 0.00000 58,148.80 8,541,670.00 7,798,006.00 740,634.70 1,159,598.00
Sand 542.90 31.00 176,760.00 0.00000 13,443.60 2,937,139.00 2,851,083.00 85,428.50 2,623,162.00
Steel reinforcing rod (rebar) 776.60 22.90 152,485.00 (0.00053) 9,238.80 2,149,060.00 2,023,243.00 129,060.70 108,166.00
Water 60.10 3.30 12,837.00 0.00000 1,279.70 212,565.00 201,074.00 11,707.00 608,632.00
05 – Metals
Coated steel deck 1,824.20 84.95 262,042.00 0.01140 27,232.30 4,355,441.00 3,979,875.00 366,879.00 212,281.00
Cold formed structural steel 123.90 5.92 19,255.00 0.00073 1,763.20 323,620.00 296,573.00 27,622.00 17,922.00
Hot rolled structural steel 13.60 0.32 2,703.00 (0.00000) 77.90 34,212.00 33,365.00 771.00 2,470.00
Powder coating 0.30 0.03 234.00 0.00000 4.80 4,277.00 3,907.00 362.00 22.00
Steel joist 4,766.90 155.06 963,188.00 0.00488 40,709.10 13,455,795.00 12,807,672.00 690,911.00 791,177.00
Steel plate 7.40 0.35 1,216.00 0.00004 105.90 19,663.00 18,111.00 1,566.00 1,102.00
Zinc coating, G60 1.50 0.07 397.00 (0.00000) 21.70 6,582.00 5,754.00 816.00 31.00
07 - Thermal and Moisture Protection
Fiberglass mat gypsum sheathing board 402.20 37.10 93,150.00 0.00357 5,292.00 1,703,463.00 1,480,469.00 224,969.00 183,948.00
PIR rigid foam insulation 415.10 35.30 108,057.00 0.00422 5,021.00 2,280,344.00 2,226,957.00 50,012.00 42,581.00
Polychloroprene (neoprene) adhesive 13.20 1.10 7,233.00 0.00000 5,766.00 216,007.00 208,308.00 7,809.00 2,722.00
TPO membrane 377.50 36.20 139,250.00 0.00000 6,060.00 3,637,025.00 3,513,808.00 121,953.00 43,200.00
08 - Openings and Glazing
Anodized aluminum extrusion 6.30 0.31 1,222.00 0.00000 79.80 19,304.00 17,685.00 1,763.00 288.00
Door frame, galvanized steel 0.10 0.01 18.00 0.00000 1.90 279.00 260.00 19.00 10.00
Fasteners, glavanized steel 0.02 0.00 5.00 (0.00000) 0.20 66.00 61.00 5.00 1.00
Glazing, double IGU (air fill) 26.80 1.16 3,446.00 0.00000 340.70 49,704.00 47,382.00 2,480.00 2,401.00
Hardware, aluminum 0.30 0.01 67.00 0.00000 2.60 1,093.00 901.00 192.00 27.00
Steel door, galvanized 13.40 0.60 2,473.00 0.00006 208.50 36,657.00 35,044.00 1,633.00 1,137.00
Steel door hinge 2.10 1.92 391.00 0.00004 16.10 6,018.00 5,401.00 647.00 50.00
TOTAL 12,636.00 663.00 3,272,618.00 0.02440 187,603.00 41,921,193.00 39,392,474.00 2,562,604.00 9,158,407.00
Insulated Panel SystemsReducing the Embodied Carbon of Walls in Industrial Buildings
36
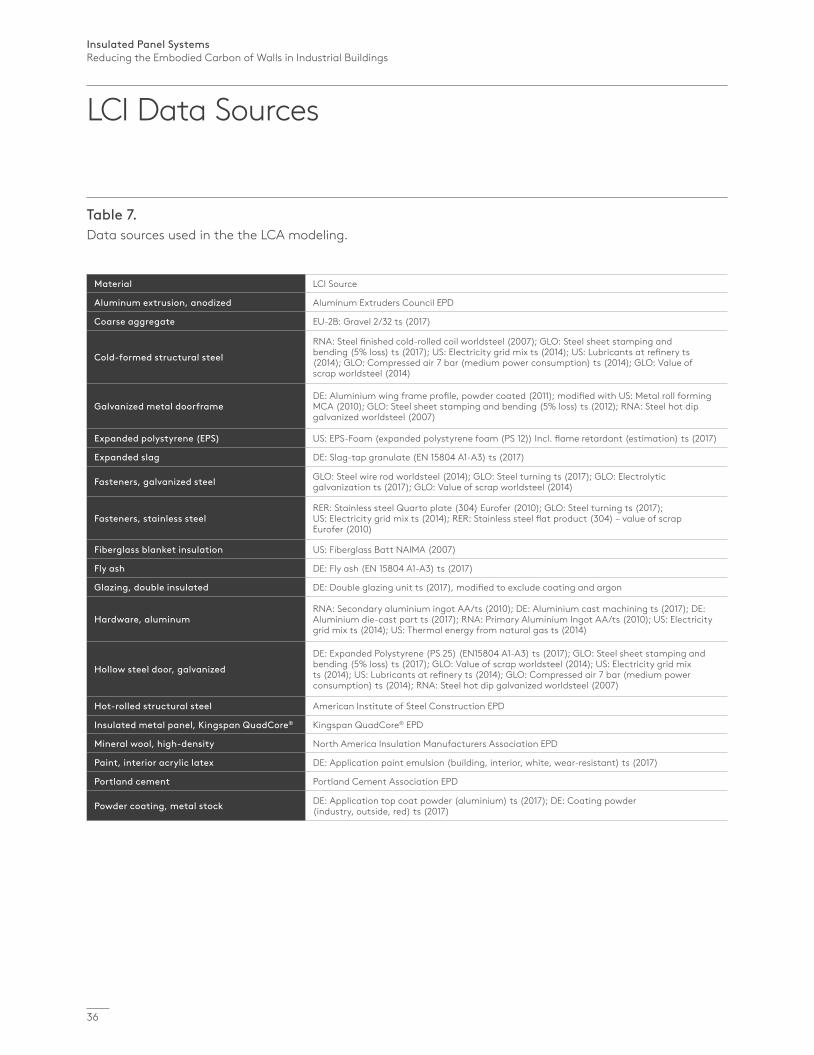
LCI Data Sources
Material LCI Source
Aluminum extrusion, anodized Aluminum Extruders Council EPD
Coarse aggregate EU-2B: Gravel 2/32 ts (2017)
Cold-formed structural steel
RNA: Steel finished cold-rolled coil worldsteel (2007); GLO: Steel sheet stamping and bending (5% loss) ts (2017); US: Electricity grid mix ts (2014); US: Lubricants at refinery ts (2014); GLO: Compressed air 7 bar (medium power consumption) ts (2014); GLO: Value of scrap worldsteel (2014)
Galvanized metal doorframeDE: Aluminium wing frame profile, powder coated (2011); modified with US: Metal roll forming MCA (2010); GLO: Steel sheet stamping and bending (5% loss) ts (2012); RNA: Steel hot dip galvanized worldsteel (2007)
Expanded polystyrene (EPS) US: EPS-Foam (expanded polystyrene foam (PS 12)) Incl. flame retardant (estimation) ts (2017)
Expanded slag DE: Slag-tap granulate (EN 15804 A1-A3) ts (2017)
Fasteners, galvanized steel GLO: Steel wire rod worldsteel (2014); GLO: Steel turning ts (2017); GLO: Electrolytic galvanization ts (2017); GLO: Value of scrap worldsteel (2014)
Fasteners, stainless steelRER: Stainless steel Quarto plate (304) Eurofer (2010); GLO: Steel turning ts (2017); US: Electricity grid mix ts (2014); RER: Stainless steel flat product (304) – value of scrap Eurofer (2010)
Fiberglass blanket insulation US: Fiberglass Batt NAIMA (2007)
Fly ash DE: Fly ash (EN 15804 A1-A3) ts (2017)
Glazing, double insulated DE: Double glazing unit ts (2017), modified to exclude coating and argon
Hardware, aluminumRNA: Secondary aluminium ingot AA/ts (2010); DE: Aluminium cast machining ts (2017); DE: Aluminium die-cast part ts (2017); RNA: Primary Aluminium Ingot AA/ts (2010); US: Electricity grid mix ts (2014); US: Thermal energy from natural gas ts (2014)
Hollow steel door, galvanized
DE: Expanded Polystyrene (PS 25) (EN15804 A1-A3) ts (2017); GLO: Steel sheet stamping and bending (5% loss) ts (2017); GLO: Value of scrap worldsteel (2014); US: Electricity grid mix ts (2014); US: Lubricants at refinery ts (2014); GLO: Compressed air 7 bar (medium power consumption) ts (2014); RNA: Steel hot dip galvanized worldsteel (2007)
Hot-rolled structural steel American Institute of Steel Construction EPD
Insulated metal panel, Kingspan QuadCore® Kingspan QuadCore® EPD
Mineral wool, high-density North America Insulation Manufacturers Association EPD
Paint, interior acrylic latex DE: Application paint emulsion (building, interior, white, wear-resistant) ts (2017)
Portland cement Portland Cement Association EPD
Powder coating, metal stock DE: Application top coat powder (aluminium) ts (2017); DE: Coating powder (industry, outside, red) ts (2017)
Table 7. Data sources used in the the LCA modeling.

Insulated Panel SystemsReducing the Embodied Carbon of Walls in Industrial Buildings
37
Sand US: Silica sand (Excavation and processing) ts (2017)
Material LCI Source
Steel door hinge DE: Door hinge – Object hinge - FV S+B PE-EPD (2009); GLO: Value of scrap worldsteel (2014)
Steel joist Steel Joist Institute EPD
Steel, reinforcing rod GLO: Steel rebar worldsteel (2014)
Steel, sheet
RNA: Steel finished cold rolled coil worldsteel (2007); GLO: Steel sheet stamping and bending (5% loss) ts (2017); US: Electricity grid mix ts (2014); US: Lubricants at refinery ts (2014); GLO: Compressed air 7 bar (medium power consumption) ts (2014); GLO: Value of scrap worldsteel (2014)
Structural concrete, 4001-5000 psi
US: Portland cement PCA/ts (2014); DE: Pumice gravel (grain size 4/16) (EN 15804 A1-A3) ts (2017); DE: Gravel (Grain size 2/32) (EN 15804 A1-A3) ts (2017); DE: Fly ash (EN 15804 A1-A3) ts (2017); DE: Slag-tap granulate (EN 15804 A1-A3) ts (2017); DE: Expanded clay (EN 15804 A1-A3) ts (2017); DE: Calcium nitrate ts (2017); DE: Sodium ligninsulfonate ts (2017); DE: Sodium naphtalene sulfonate [estimated] ts (2017); US: Sodium hydroxide (caustic soda) mix (100%) ts (2017); US: Colophony (rosin, refined) from CN pine gum rosin ts (2017); US: Tap water from groundwater ts (2017); US: Electricity grid mix ts (2014); US: Natural gas mix ts (2014); US: Diesel mix at filling station (100% fossil) ts (2014); US: Liquefied Petroleum Gas (LPG) (70% propane 30% butane) ts (2014); US: Light fuel oil at refinery ts (2014)
Wallboard, gypsum, natural DE: Gypsum wallboard (EN 15804 A1-A3) ts (2017)
Water US: Tap water from groundwater ts (2017)
Zinc coating (galvanized) for steel, G60 GLO: Unit load galvanisation (1 m² steel sheet part, electrolytic) ts (2017); GLO: Zinc mix ts (2017)
Zinc coating (galvanized) for steel, G90 GLO: Unit load galvanisation (1 m² steel sheet part, electrolytic) ts (2017); GLO: Zinc mix ts (2017)
Polyisocyanurate (PIR) Rigid Foam Insulation RNA: Polyisocyanurate rigid foam board roof insulation, R=10.2 (A1-A3) ts-EPD (2013)
Polyurethane adhesive
US: Limestone flour (5mm) ts (2017) DE: Polyurethane (copolymer-component) (estimation from TPU adhesive) ts (2017) US: Lime (CaO) calcination ts (2017) US: Methylene diisocyanate (MDI) ts (2017) DE: Stearic acid ts (2017) US: Electricity grid mix ts (2014)
Fluoropolymer coatingUS: Coil coating MCA (2010) US: Electricity grid mix ts (2014) US: Thermal energy from natural gas ts (2014)

Insulated Panel SystemsReducing the Embodied Carbon of Walls in Industrial Buildings
38
LCA Tool Assumptions
Tally Tool AssumptionsTally methodology is consistent with LCA standards ISO 14040-14044, ISO 21930:2017, ISO 21931:2010, EN 15804:2012, and EN 15978:2011.
Tally utilizes a custom designed LCA database that combines material attributes, assembly details, and architectural specifications with environmental impact data resulting from the collaboration between KieranTimberlake and thinkstep. LCA modeling was conducted in GaBi 8.5 using GaBi 2018 databases and in accordance with GaBi databases and modeling principles.
The data used are intended to represent the US and the year 2017. Where representative data were unavailable, proxy data were used. The datasets used, their geographic region, and year of reference are listed for each entry. An effort was made to choose proxy datasets that are technologically consistent with the relevant entry.
Uncertainty in results can stem from both the data used and their application. Data quality is judged by: its measured, calculated, or estimated precision; its completeness, such as unreported emissions; its consistency, or degree of uniformity of the methodology applied on a study serving as a data source; and geographical, temporal, and technological representativeness. The GaBi LCI databases have been used in LCA models worldwide in both industrial and scientific applications. These LCI databases have additionally been used both as internal and critically reviewed and published studies. Uncertainty introduced by the use of proxy data is reduced by using technologically, geographically, and/or temporally similar data. It is the responsibility of the modeler to appropriately apply the predefined material entries to the building under study.
Scenarios Used for Transportation, EOL, Module D, and Replacement RatesDefault transportation values are based on the three-digit material commodity code in the 2012 Commodity Flow Survey by the US Department of Transportation Bureau of Transportation Statistics and the US Department of Commerce where more specific industry-level transportation is not available. All transportation is assumed to be by diesel truck, except where otherwise specified.
Replacement rates for materials are assumed to follow predicted service life from Product Category Rules and published EPDs. When materials are included in a larger single assembly, the service life for the assembly is presumed to correspond to the outermost non-coating layer. Coatings are assumed to have a separate replacement rate from the rest of the assembly.
At end of life, all products are modeled using the avoided burden approach. Specific end-of-life scenarios are detailed for each entry based on the US construction and demolition waste treatment methods and rates in the 2016 WARM Model by the US Environmental Protection Agency except where otherwise specified. Heterogeneous assemblies are modeled using the appropriate methodologies for the component materials. Concrete products are assumed to have a 55% recycling rate into aggregate or general fill material. Remaining concrete is landfilled. Module D accounts for
both the credit associated with offsetting the production aggregate and the burden of the grinding energy required for processing. Metal products assume a recycling rate at end of life to determine how much secondary metal can be recovered after subtracting any scrap input into manufacturing to calculate net scrap credits in Module D. The corresponding share of the primary burden is allocated to the subsequent product system using secondary material as an input. All other products are assumed to be sent to landfill, including glass, drywall, insulation, and plastics. Where the landfill contains biodegradable material, the energy recovered from landfill gas utilization is reflected as a credit in Module D.
Environmental Categorization and Data Substitutions Environmental impacts are calculated according to the TRACI 2.1 characterization scheme for Global Warming Potential, Acidification Potential, Eutrophication Potential, Smog Formation Potential, Ozone Depletion Potential, and Non-Renewable Energy Demand. TRACI is the standard environmental impact reporting format for LCA in North America. Impacts associated with land use change and fresh water depletion are not included in TRACI 2.1. For more information on TRACI 2.1, reference Bare 2010, EPA 2012, and Guinée 2001. Utilization of recycled or reclaimed material is reflected as a credit in Module D.

Insulated Panel SystemsReducing the Embodied Carbon of Walls in Industrial Buildings
39
References
1 Architecture 2030, https://architecture2030.org/new-buildings-embodied/2 Empire State Realty Trust, "Empire State Building Fact Sheet", https://www.esbnyc.
com/sites/default/files/esb_fact_sheet_4_9_14_4.pdf.3 US Environmental Protection Agency, Greenhouse Gas Equivalencies Calculator,
https://www.epa.gov/energy/greenhouse-gas-equivalencies-calculator4 CSN, EN. “15978 Sustainability of Construction Works—Assessment of
Environmental Performance of Buildings—Calculation Method.” European Standards: Brussels, Belgium (2011).
5 International Code Council (COR). International Building Code, 2018. Washington, D.C.: International Code Council, 2017.
6 Bowen, Frank, and Ramsburg Paul, “Concrete Mix Design: Proportioning.” Precast Inc. Magazine (September-October 2018), https://precast.org/2018/09/concrete-mix-design-proportioning/
7 KT Innovations, Tally Version 2020.01.15.01, 2020.8 National Ready Mixed Concrete Association. Appendix D: NRMCA Member National
and Regional LCA Benchmark (Industry Average) Report – V 3.0 (November 2019). https://www.nrmca.org/wp-content/uploads/2020/02/NRMCA_REGIONAL_BENCHMARK_Nov2019.pdf
9 Bare, J. Tool for the Reduction and Assessment of Chemical and Other Environmental Impacts (TRACI) TRACI version 2.1 User’s Guide. US EPA Office of Research and Development, Washington, DC, EPA/600/R-12/554, 2012.
10 Bare, J. C. Tool for the Reduction and Assessment of Chemical and Other Environmental Impacts (TRACI), Version 2.1 - User’s Manual; EPA/600/R-12/554 2012.
11 Guinée, J.B. et al. “Priority assessment of toxic substances in life cycle assessment. III: Export of potential impact over time and space.” Chemosphere (July 2001), 59-65.

Contact Details
10/2020
For the product offering in other markets please contact your local sales representative or visit www.kingspanpanels.com.
Care has been taken to ensure that the contents of this publication are accurate, but Kingspan Limited and its subsidiary companies do not accept responsibility for errors or for information that is found to be misleading. Suggestions for, or description of, the end use or application of products or methods of working are for information only and Kingspan Limited and its subsidiaries accept no liability in respect thereof.
® Kingspan, QuadCore and the Lion Device are Registered Trademarks of the Kingspan Group plc in the US and other countries. All rights reserved.
® Tally is a Registered Trademark of KieranTimberlake Associates LLP in the US.
© Kingspan Insulated Panels Inc.
USADeLand | FLT: 877-638-3266
Modesto | CAT: 800-377-5110
CanadaCaledon | ONT: 866-442-3594
Langley | BCT: 877-937-6562