reducing the impact of ev charging on the electric grid · analyzing and reducing the impact of ev...
TRANSCRIPT

Sponsored by:
DATA SIM Summer School (Hasselt)15/07/2014
Reducing the impact of EV charging on the
Reducing the impact of EV charging on the
electric grid

Who am I?
15/07/2014
Jesús Fraile-Ardanuy
Associate Professor at Technical University of
Madrid
Main research lines:
Renewable energies
Control system applications
Integration of EVs on the grid

Who is my audience?
15/07/2014

Outline
15/07/2014
Fundamentals of electric grid
Fundamentals of electric vehicles
Electricity markets and EVs
Analyzing and reducing the impact of EV
charging on the electric grid (DATASIM results)
Summary

Why electricity is held in low
esteem?
15/07/2014
Because it is always there.
Because it is cheap.
Because we always ignore it unless…
… The lights go out!

Blackouts!
15/07/2014
Location Million people affected DateIndia 670 30-31 Jul 2012
Indonesia 100 18 Ago 05
Brazil 97 11 Mar 99
Brazil, Paraguay 87 10-11 Nov 2009
USA, Canada 55 14-15 Ago 2003
Italy, Switzerland,
Austria, Slovenia,
Croatia
55 28 Sep 03
USA, Canada 30 09 Nov 65

15/07/2014
670 million people were without electricity.
Roughly equivalent to the entire population of
Europe.
India Blackout

Electric grid fundamentals
15/07/2014
1st
part

Thermal power
plant
Hydro
power plant
Wind
Energy
Transmission
Substation
System Operator
(SO) control center
Transmission
NETWORK
Distribution
substation
Residential
Customers (Low
Voltage)
Industrial
Customers
(Medium or
High
Voltage)
Understanding power systems
15/07/2014
GenerationTransmission and
distribution network
Consumers
Energy flows in one direction,
from generation to consumerSource: REE.es

Understanding electric
generation
15/07/2014

Understanding electric
generation
15/07/2014

Understanding electric
generation
15/07/2014

Understanding electric generator
15/07/2014
Electric Power
Mechanical
Power

Transmission stations
15/07/2014
Electric Generation
(10-20 kV)
Step up
transformer
Transmission
substations
Source: REE.es

Transmission substations
15/07/2014
Step down transformers
Source: REE.es

Transmission substations
15/07/2014
Transfomers are essential in making large-
scale power transfer feasible over long
distances.

Voltage ratings used in Belgium
380 kV 220 kV
110 kV
10 kV
0.4 kV
150 kV
50 kV
10 kV
0.4 kV
10 kV
0.4 kV
110 kV
10 kV
0.4 kV
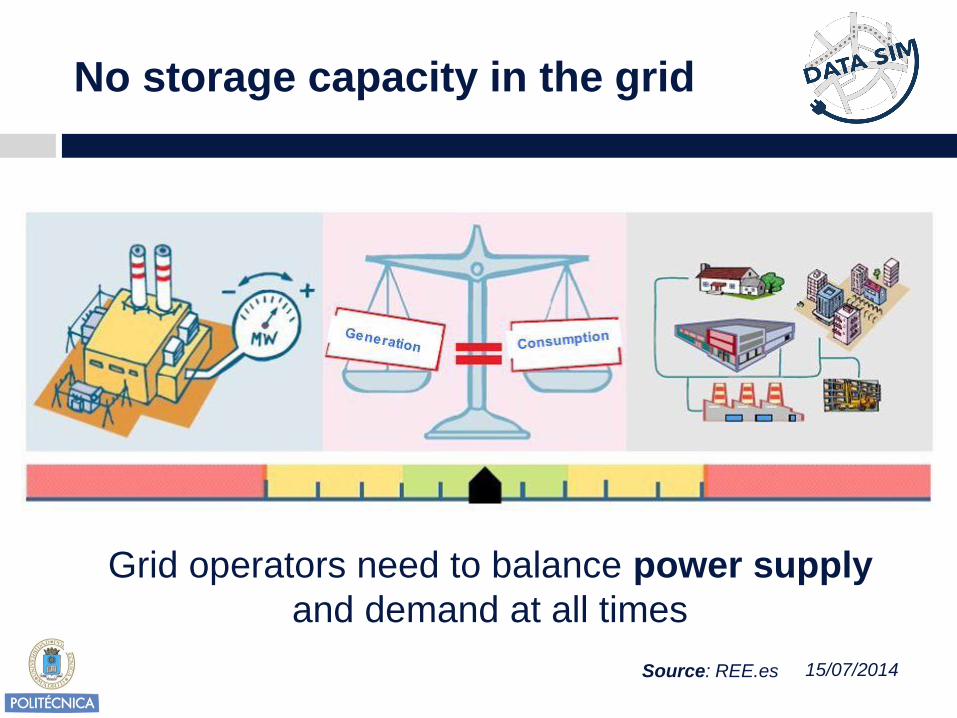
No storage capacity in the grid
15/07/2014
Grid operators need to balance power supply
and demand at all times
Source: REE.es
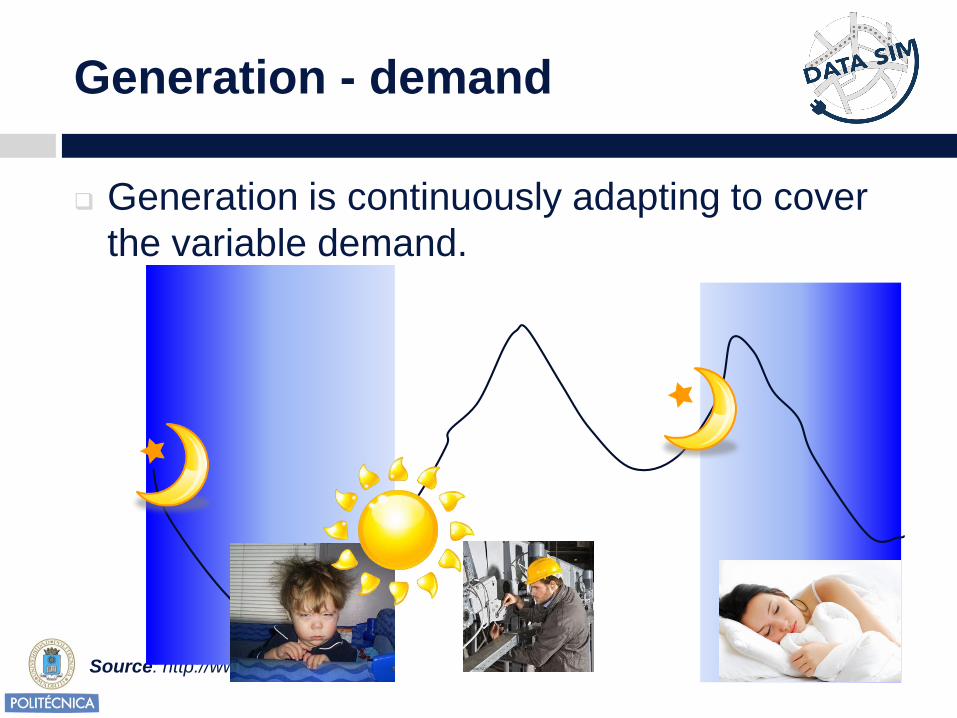
Generation - demand
15/07/2014
Generation is continuously adapting to cover
the variable demand.
Source: http://www.vreg.be

Generation - demand
Different types of power plants are running
during the day, covering the electric demand.
Source:
http://www.aph.gov.au/About_Parliament/Parliamentary_Departments/Parliamentary_Library/pubs
/rp/rp0809/09rp09
Nuclear and coal
Renewable energies
Thermal and hydro
Gas, diesel and hydro

Covering demand with
renewable energy
15/07/2014
In order to promote renewable energies, the
demand is first met from renewable sources.
Source: www.unendlich-viel-energie.de/

Problems with intermittent
renewable energy
15/07/2014
Sometimes, disconnection of renewable energies are needed during low demand periods.
If Generation>Demand Wind generators are disconnected
Renewable energy is lost (spilled wind energy) in this case, because
it is not possible to store large amount of electrical energy during low
demand periods
Source: REE.es

Balancing solutions
15/07/2014
New network interconnections
Energy management:
Demand response
Energy storage
Electric vehicles

Balancing solutions-New
transmission lines
15/07/2014
New electricity highways (transmission network)
A fully interconnected EU electricity market
Developing the huge renewables potential
North Europe: off-shore wind farms, tidal farms
South Europe and Africa: PV and thermosolar plants

Balancing solutions-DSM
15/07/2014
Energy management (demand side management)
Process of managing energy consumption to optimiseavailable and planned resources for power generation.
DSM incorporates all activities that
influence customer use of
electricity and results in the
reduction of the electricity demand,
which are mutually beneficial to the
customers and the utility

Balancing solutions-DSM
15/07/2014
Energy management (DSM main techniques)
Direct DSM:
Load limiters
Direct load control
Indirect DSM:
Time of use price
DSO

Balancing solutions-DSM
15/07/2014
Peak Shaving. Reduction of customer loads during peak demand periods. This can delay the need for additional generation capacity. Peak clipping can be achieved by direct control of customers’ appliances.
Conservation. Reduction in
consumption by consumers. There
is net reduction in both demand and
total energy consumption. Strategic
conservation can be implemented
by motivating customers to use
more energy-efficient appliances.
Load Shifting. Shifting loads from
on-peak to off-peak periods. The net
effect is a decrease in peak
demand, but not change in total
energy consumption.
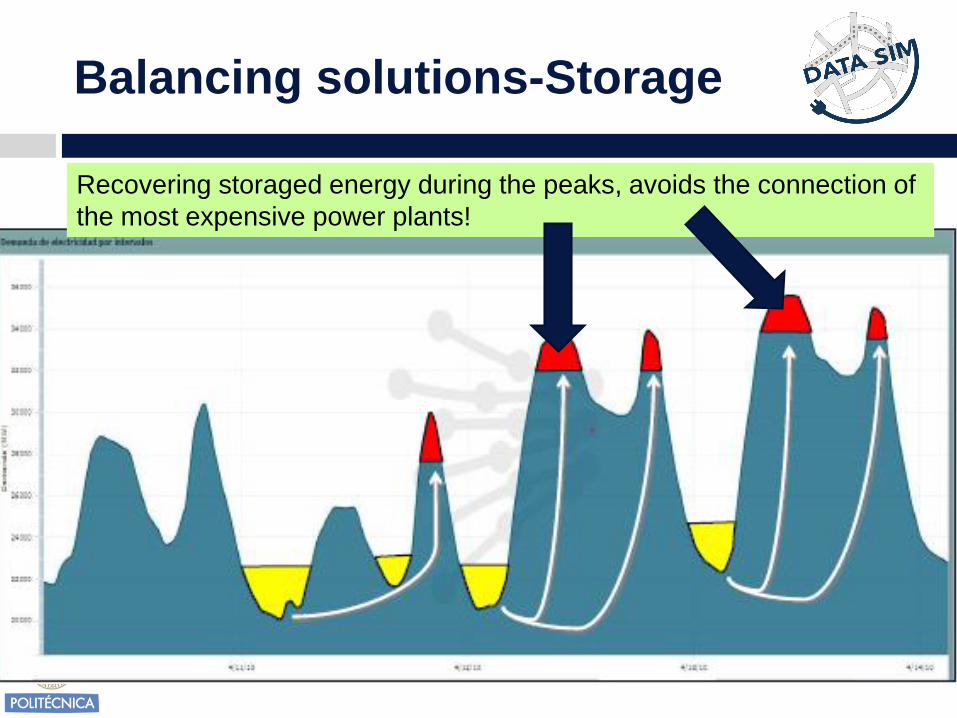
Balancing solutions-Storage
15/07/2014
Recovering storaged energy during the peaks, avoids the connection of
the most expensive power plants!

Balancing solutions-Storage
15/07/2014De Germany: Lead Market for Energy Storage &
Fuel Cell Systems. Germany Trade and Invest

Balancing solutions
15/07/2014
Pumped hydro: At the times
when enough power is
available, water is pumped to
and upper reservoir. When
the electric energy is
expensive, the water is fall
down driving the generator,
producing energy.

Balancing solutions. Storage
15/07/2014
CAES: At times when
enough power is
available, compressed
air is injected into
caverns. The pressure
in such a storage
facility can reach 100
bars. When the air
escapes, it drives a
generator via a turbine
to produce electricity.

Balancing solutions - Storage
15/07/2014
Flywheels: A flywheel is a
rotating mechanical device
that is used to store
rotational energy.
Flywheels have a significant
moment of inertia. The
amount of energy stored in a
flywheel is proportional to
the square of its rotational
speed.
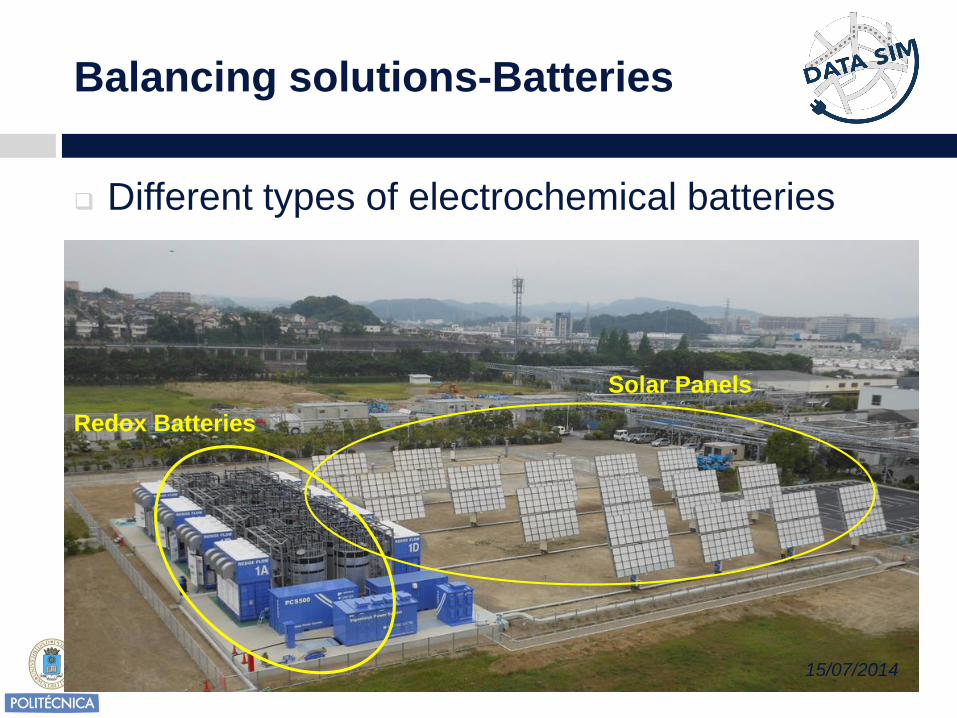
Balancing solutions-Batteries
15/07/2014
Different types of electrochemical batteries
Solar Panels
Redox Batteries

Balancing solutions-batteries
15/07/2014
Distributed storage capacity

Balancing solutions-efficiency in
storage
15/07/2014

A system model change is
needed
Actual electrical grid
Demand is not flexible
Generation is adapted
continuously
No storage
Future electrical grid
Demand will be flexible
Generation won’t be
managed due to its
intermittence
15/07/2014Source: IEA.org
Key elements
1. STORAGE at different levels
2. Active Demand Management (ADM)
3. Communication infrastructure

What is a smart grid?
15/07/2014First Annual Review Meeting, Brussels
The Smart Grid is a bi-directional electric and
communication network that improves the reliability,
security, and efficiency of the electric system for small to
large-scale generation, transmission, distribution, and
storage.

Electric vehicle fundamentals
15/07/2014
2nd
part

Electric vehicles
15/07/2014
First IDEA

Electric vehicles
15/07/2014Source: www.istc.illinois.edu/about/
EV were clean and easier to use (compared to
ICE one)
Lower maintenance and available
infrastructure (no fuel station was available)
Motors had high power-to-weight ratio.
Main drawback:
Limited range.

Hybrid Electric Vehicles
15/07/2014

Hybrid electric vehicles
15/07/2014
1900 Porsche hybrid
HEV can deliver energy for long time
Retain the ease-of-use advantages of EV
Source: www.istc.illinois.edu/about/

Why did gasoline cars win?
15/07/2014
Ford made cars affordable (model T)
Gasoline was a waste product of oil refining
ICE cars were improving continuosly while the
EV technology were not (overtake in 1920s).
Source: www.istc.illinois.edu/about/
ICE cars evolution through the decades

Revival
15/07/2014
Energy crisis 1970s-1980s
Advance in power electronics (80s-90s)
Advance in battery technology (NiMH and Li-
ion battery).
California Zero Emission
Vehicle (ZEV) Mandate
Requires 2%of the
state's vehicles to have
no emissions by 1998
and 10% by 2003.Source: www.istc.illinois.edu/about/

Who kill the EV?
15/07/2014
Who Killed the Electric Car? is a 2006 documentary film that explores the creation,
limited commercialization, and subsequent destruction of the General Motors EV1

Nowadays
15/07/2014
Environmental problems
EU 20-20-20 targets:
Reduction EU greenhouse gas emission by 20% below 1990
levels
20% of renewable energy sources
20% reduction of primary energy
Oil supply problems
Demand increased (China and India)
Lack of cheap oil

EVs solution
15/07/2014
Energy efficiency
Cleaner vehicles
Emission can be avoided of moved to a power
plant where large-scale control is possible
Quieter vehicles (important to reduce stress in
the cities!)
Can help the electric grid!
Source: www.istc.illinois.edu/about/

EVs classification
15/07/2014
Hybrid Electric Vehicles
ICE+Electric motor-generator
Small battery, gets recharged from regenerative breaking; very limited all-electric range (2-3 km)
No plug
Different drivetrain configurationsSeries: ICE turns generator which charges battery
which runs electric motor
Parallel: ICE and electric motor both run the car simultaneously
Mix
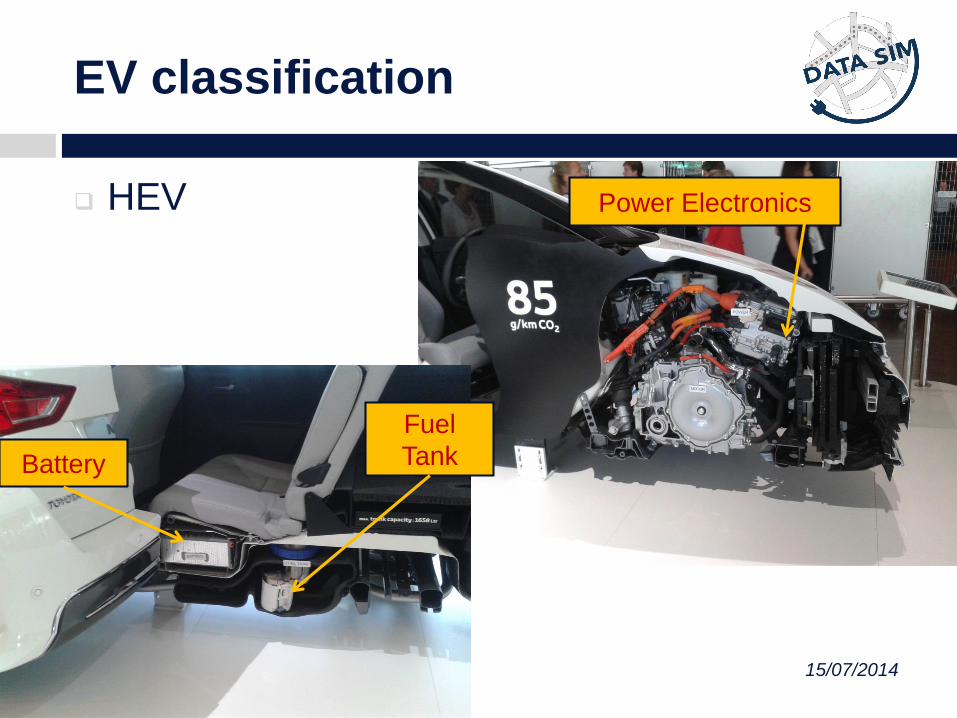
EV classification
15/07/2014
HEV
Battery
Fuel
Tank
Power Electronics

EVs classification
15/07/2014
Plug in hybrid Electric Vehicles
ICE+Electric motor-generator
Larger battery; gets charged by plugging
Limited all-electric range (25 km)

EVs classification
15/07/2014
E-REV: Extended Range Electric Vehicle
A PHEV with a bigger battery for driving ranges of
60-100 km using only the battery (all-electric
driving); after which the gas engine starts

EVs classification
15/07/2014
BEV: Battery Electric Vehicles
Pure electric vehicles; only has an electric drivetrain
Range: Leaf (170 km), Tesla (>300 km), i-Miev (150
km)
When your out of battery, you don’t have any option.
You need to recharge it!

EVs classification
15/07/2014
HEV PHEV E-REV BEV
Electric Motor+Battery
ICE motor

Battery configuration
15/07/2014

Understanding the recharge
process
15/07/2014Source: http://www.schneider-electric.co.uk/documents/electrical-
distribution/en/local/ev/Connection-method-for-charging-systems.pdf
Times for recharging and power levels:

Understanding the recharge
process
15/07/2014
Recharge modes:
Mode 1. Household socket and
extension cord
Mode 2. Domestic socket and cable
with a protection device
Mode 3. Specific socket on a
dedicated circuit
Mode 4. Direct current (DC)
connection for fast recharging
Source: http://www.schneider-electric.co.uk/documents/electrical-
distribution/en/local/ev/Connection-method-for-charging-systems.pdf

Understanding the recharge
process
15/07/2014
Charging sockets:
Source: http://www.schneider-electric.co.uk/documents/electrical-
distribution/en/local/ev/Connection-method-for-charging-systems.pdf

What is an EV.. When driving?
15/07/2014
It must perform as a motor vehicle
It must meet all safety standards
It must meet driver expectations for mobility
and performance
Source: The Grid-Integrated EV by Willet Kempton

What is an EV.. When Plugged
in?
15/07/2014
A load
A smart load
A distributed storage resource

EVs and their interaction with the
power system
15/07/2014
EV is a new energy consumer, increasing the
total electricity consumption and, more
important, the peak demand.
No controlled charging
Effects:
Need to connect peak power plants
Higher electricity prices
Grid constraints
EVs and their interaction with the
power system
15/07/2014
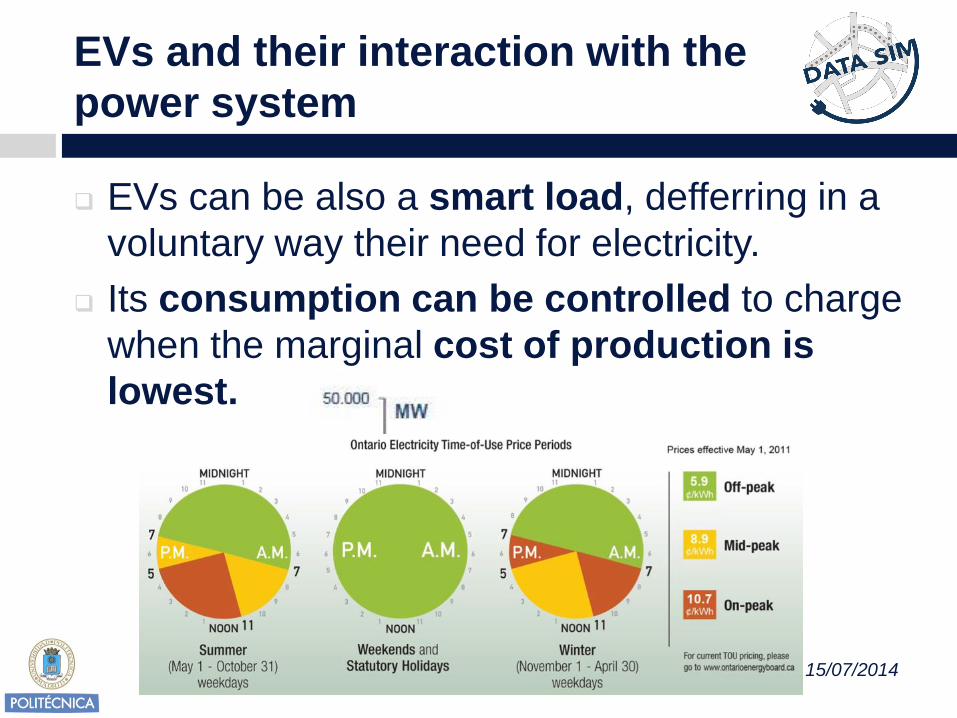
EVs can be also a smart load, defferring in a
voluntary way their need for electricity.
Its consumption can be controlled to charge
when the marginal cost of production is
lowest.

EVs and their interaction with the
power system (Vehicle 2 grid)
15/07/2014
In longer term, EVs can be used as distributed storage
devices, feeding back the electricity stored in their
batteries.
This can help to reduce electricity system costs,
providing:
Regulation services.
Spinning reserves.
Peak-shaving capacity.
There are still several
technical, practical and
economic barriers.
Ancillary
Services

V2G
15/07/2014
Special bidirectional chargers are needed to charge
the battery and also deliver power from vehicle to grid

Some numbers to understand
V2G
15/07/2014
Sources: https://www.tispol.org/guides/belgium.pdf ,
http://epp.eurostat.ec.europa.eu/cache/ITY_OFFPUB/KS-SF-07-087/EN/KS-
SF-07-087-EN.PDF, and
http://www.suburbangreenrevolution.com/site.com/Leaf_Power.html
Assuming:
US cars are used 1 hour/day and parked 23
h/day.
Battery 24 kWh.
Daily travel: 30 km
Real consumption (Nissan Leaf): 6.43 km/kWh
Storage unused: 19 kWh
Power connection:
US 10 -20 kW
Europe 3.6-6 kW

How much power are in cars?
15/07/2014
Denmark UK USA
Light Vehicles
(106)1.9 28.5 191
Vehicle GW
(@15 kW each)29 427 2,865
Avg. Electric
Load (GW)3.6 40 417
Total Generation capacity USA: 1000 GW
Total Generation capacity vehicles: 3,000 GW
6x average load!

EVs aggregators
15/07/2014
The impact of a single EV on the power grid is
negligible
An aggregator need to emerge, where many
EVs are pooled as a one unit.
System Operator
EV
Aggregator

Electricity markets
23/10/2012
3rd
part

Electricity markets
15/07/2014
Electricity can be treated as a commodity that can be separated from transmission as a service and it can be bought, sold and traded in a special market, named electricity market.
Producers submit supply bids and traders and larger consumers submit hourly demand bids for the 24 hours of the following day during the trading session.
The financial market operator combines the production and consumption bids for each hour and finds the marginal price and volume.

Electricity market-Day ahead
15/07/2014
gen
1
gen
2gen
3
Ret
1
Ret
2Ret
3
MWh
Price €/MWh
EV
1
EV
2
EV
3
EV
Aggregator
Final Price
15/07/2014
EV
1
EV
2
EV
3
EV
Aggregator
Supply BIDS
Demand BIDS

Vehicle as other generation plant
15/07/2014Source: www.cie.org.tw
100 EVs = 1 MW
VIRTUAL POWER PLANT conceptEV
Aggregator

EV Aggregators
15/07/2014
Load aggregators are not a new actor in the
electricity market.
They buy electrical energy in the market
representing several customers.
EV aggregators are more advanced:
They can offer more services.
They can offer more technical flexibility.
The need to collect a large amount of information
about drivers behaviour and electricity prices.

Electricity Market-Ancillary
services
15/07/2014
Ancillary services are used to avoid short-termimbalances in electricty markets by dispatchingresources within seconds or minutes.
Different services:
Spinning reserve: Extra online generation
Meet system failures (loss of a transmission line, generator)
20 times a year, 10 min- 1 hour duration
Regulation: Online generation to ensure steadysystem frequency
400 times a day, few minutes duration
Source: Vehicle-to-Grid:
Integrating Electric Drive Vehicles with the Power Grid
Electricity Market-Ancillary
Services
15/07/2014
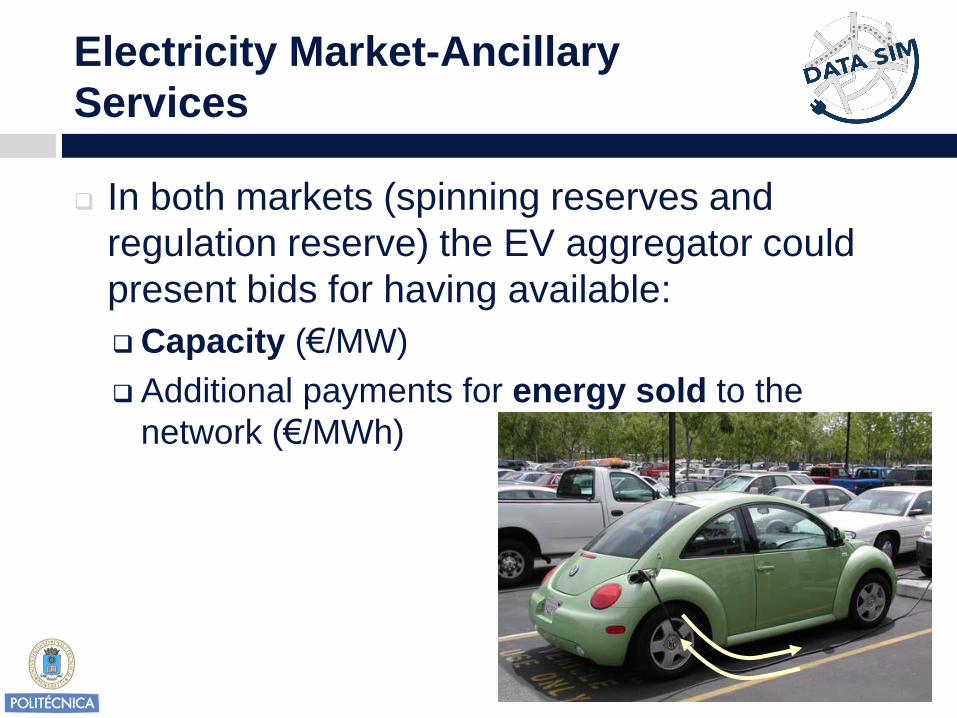
In both markets (spinning reserves and
regulation reserve) the EV aggregator could
present bids for having available:
Capacity (€/MW)
Additional payments for energy sold to the
network (€/MWh)
Regulation Ancillary service
15/07/2014
Regulation is the continuous matching of
supply with demand.
Generation>Demand, system frequency
Generation<Demand, system frequency
Power plants provide regulation today, but they
have slow response.
Grid operator controls in real time the output of
the power plant
Source: Vehicle-to-Grid:
Integrating Electric Drive Vehicles with the Power Grid

Regulation Ancillary service
15/07/2014
EVs could regulate the frequency error by sourcing or sinking power according to grid operator real time commands
50,000 to 100,000 connected EVs could perform all of California’s regulation - with faster response than power plants
Battery state of charge would be maintained above a driver-selected minimum level Regulation doesn’t require net energy - just
energy back and forth at the right time
Source: Vehicle-to-Grid:
Integrating Electric Drive Vehicles with the Power Grid

Regulation Ancillary Service
15/07/2014
Frequency Variation
Error signal
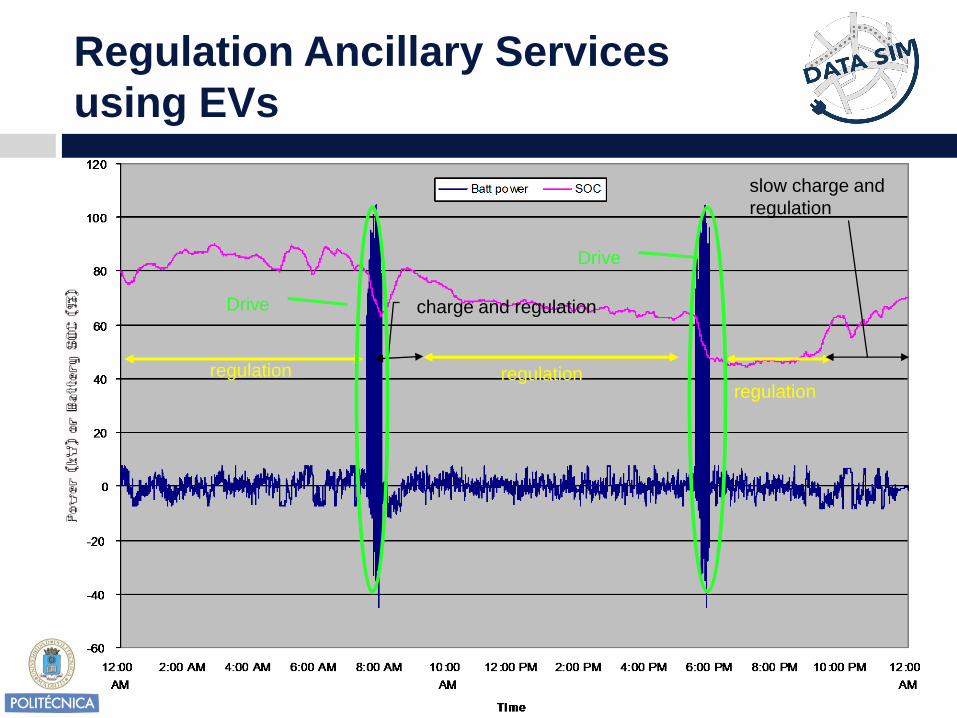
Regulation Ancillary Services
using EVs
regulation regulationregulation
charge and regulation
slow charge and
regulation
Drive
Drive

V2G help to reduce costs
15/07/2014
With V2G applications, generates two value
streams:
Transportation
Drivers pays for use of battery for driving.
Grid support
Utilities pay for ancillary services
Generators pay for buffering PV and wind
Load pay for peak shaving

V2G Key aspects
15/07/2014
Aggregation
Thousands of cars
One entity to the grid (aggregator)
Comunication and control
Grig to aggregator to car
Car to aggregator and car to driver
Forecast
Arrival/departure times, connection duration, tripduration, electricity prices

V2G Real applications
15/07/2014Source: Electric Vehicles: Assets on the Grid
Prof. Willett Kempton’s
pioneering work in V2G makes
UDel the nexus of the Grid on
Wheels Project - a
business/academic collaboration

V2G Real Applications
15/07/2014
Grid on Wheels
participate in PJM’s hour-
ahead reg-up and reg-
down markets.
PJM:
• 164,000 MW peak
• 60 mil population
• 214,000 sq mi

V2G Real Applications
15/07/2014
University of Delaware (Prof. W. Kempton)
EV Grid supply 15 MINI EV modifed for V2G and J1772, to
operate in fleet service and provide grid regulation as part of
Grid on Wheels.

Information needed by the EV
aggregator
15/07/2014
EV
Aggregator
TEMPORAL INFO
Departure time instant
Arrival time instant
SPATIAL INFO
Traveled distance
Connection location
Transmission node
location
PERSONAL INFO
ID
Minimum SoC when
the car is disconnected
OTHER INFO
Total capacity of the battery
Connection power
Other restriction for the battery
(maximum charging rate)
Electricity prices

Why mobility information is
important for EV and SG?
15/07/2014
In order to present bids for buying and selling
energy (and earn money!), EV aggegator
must reduce the uncertainty in:
Electricity market prices
EV owner’s behaviour and preferences
The aggregator must associate the bid to a
transmission network node, therefore it must
produce this forecasts by each network
node

DATASIM WP6
23/10/2012
4th
part
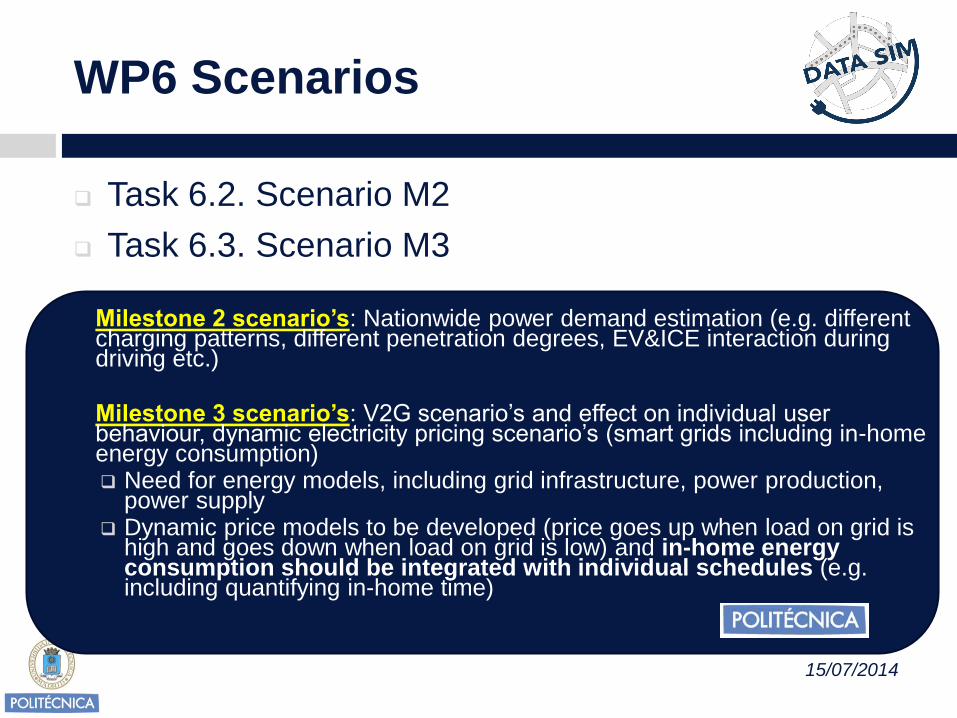
WP6 Scenarios
15/07/2014
Task 6.2. Scenario M2
Task 6.3. Scenario M3
Milestone 2 scenario’s: Nationwide power demand estimation (e.g. different charging patterns, different penetration degrees, EV&ICE interaction during driving etc.)
Milestone 3 scenario’s: V2G scenario’s and effect on individual user behaviour, dynamic electricity pricing scenario’s (smart grids including in-home energy consumption) Need for energy models, including grid infrastructure, power production,
power supply Dynamic price models to be developed (price goes up when load on grid is
high and goes down when load on grid is low) and in-home energy consumption should be integrated with individual schedules (e.g. including quantifying in-home time)


Opportunities for Controlling VE
Charging and V2G Support
15/07/2014Source: www.g4v.eu

Reducing the impact of EV
charging on the Electric Grid
15/07/2014
5th
part

Bottom-up analysis
15/07/2014
Generation
Transmissiongrid
Distribution grid
EV Charging

First Step: Characterizing the EV
charging behavior
15/07/2014
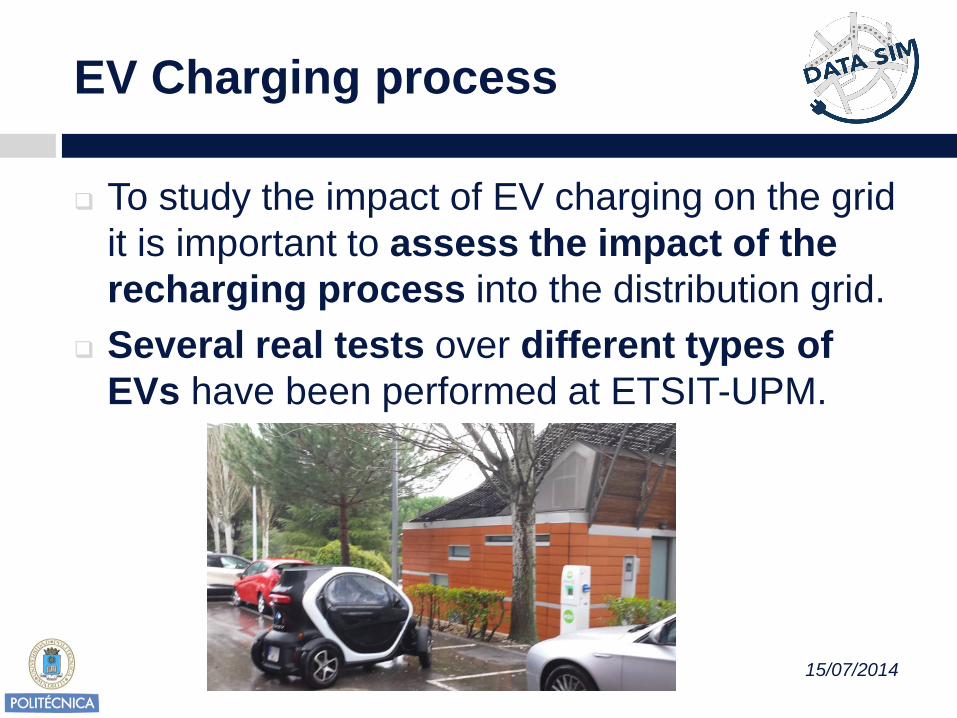
EV Charging process
15/07/2014
To study the impact of EV charging on the grid
it is important to assess the impact of the
recharging process into the distribution grid.
Several real tests over different types of
EVs have been performed at ETSIT-UPM.
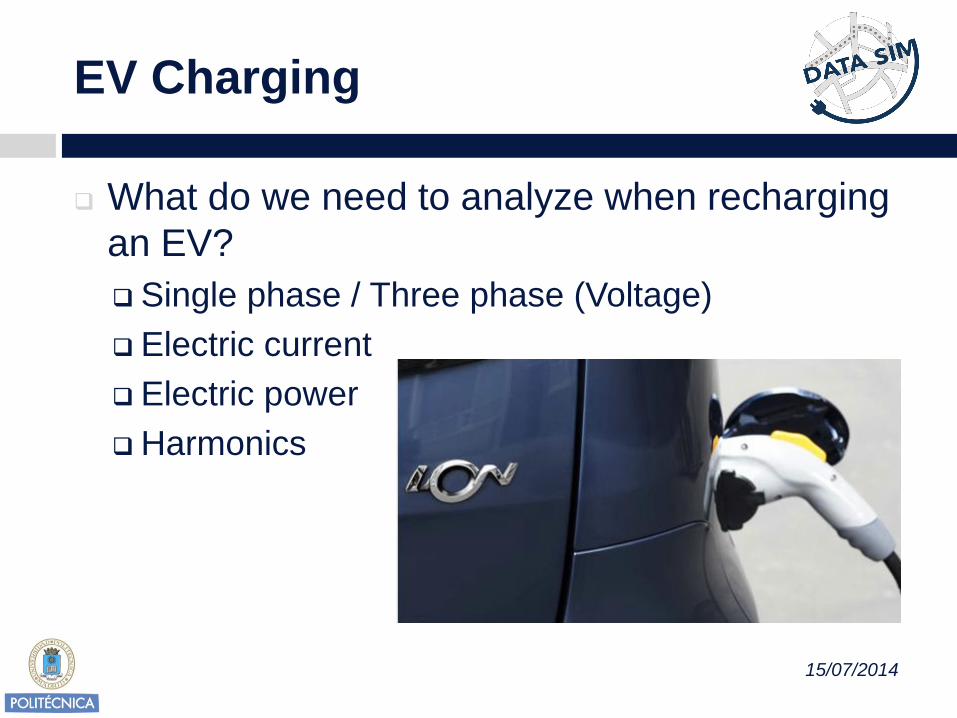
EV Charging
15/07/2014
What do we need to analyze when recharging
an EV?
Single phase / Three phase (Voltage)
Electric current
Electric power
Harmonics

EV Charging- Peugeot iOn
15/07/2014

EV Charging- Peugeot iOn
15/07/2014
Peugeot iOn
Battery Technology Litihum-IonBattery Capacity: 16 kWh
Type of charger Inside AC chargerRated charge voltage: 230 V
Rated charge current: 16 A
0 10 20 30 40 500
500
1000
1500
2000
2500
3000
3500
Time (min)
Pow
er
(W)
0 10 20 30 40 500
5
10
15
Time (min)
Curr
ent (A
)
DescendingPower
DescendingPower
ConstantPower
ConstantPower
Peugeot iOn
Charge power: 3.14 kW
Charge current: 14.08 A

EV Charging- Peugeot iOn
(Harmonics)
15/07/2014
Power electronics converters are
non-linear loads.
Harmonics: A periodic wave having
a frequency integer multiple of the
fundamental grid frequency 50 Hz.

EV Charging- Renault Twizy
15/07/2014
Renault TwizyBattery Technology Litihum-Ion
Battery Capacity: 6.1 kWh
Type of charger Inside AC charger
Rated charge voltage: 230 VRated charge current: 10 A
Rated power: 2.2 kW
0 5 10 15 20 25 300
500
1000
1500
2000
2500
Tiempo (min)
Pote
ncia
(W
)
0 5 10 15 20 25 300
2
4
6
8
10
12
Tiempo (min)
Inte
nsid
ad (
A)

EV Charging - LEMev
15/07/2014
LEM evBattery Technology Litihum-Ion
Battery Capacity: 4 kWh
Type of charger Inside AC chargerRated charge voltage: 230 VRated charge current: 3.5 ARated power: 0.8 kW
0 20 40 60 80 100 120 140 160 1800
100
200
300
400
500
600
700
800
900
Tiempo (min)
Pote
ncia
(W
)
0 20 40 60 80 100 120 140 160 1800
1
2
3
4
5
6
7
Tiempo (min)
Inte
nsid
ad (
A)

EV Charging – LEM ev
15/07/2014

Problem with harmonics
15/07/2014
High levels of harmonic distorsion lead to
problems in the distribution grid:
Overheating of elements of power systems:
Increasing RMS current and power losses
Current through neutral conductor: oversizing
this conductor could be required.
Transformers: Increase both power losses and
eddy current losses, overheating transformer.

Problems with harmonics
15/07/2014
Synchronization of generators: Voltage harmonic
distorsion can cause multiple zero crossing of the
current waveform, affecting the voltaje regulator and
control of the generator to be synchronized (important if
photovoltaic generator are in the same grid)
Capacitor banks: Harmonics increase heat in the
capacitors, reducing their life.
Fuse and circuit breakers: Harmonics can
cause their fail operation.
Meters: Harmonics can cause measuring errors.

Second Step: Impact on
Distribution grid
15/07/2014

Impact in a distribution grid (LV)
15/07/2014
Source: Infrax - IMOB
• 63 houses
• Worst case (all houses have the same
demand consumption pattern)
• Assumed different penetration rates.
• Analyzed:
• Voltage drop in the distribution
network
• Overcurrents in the different lines
• Temperatures in the cables.

Impact in a distribution grid (LV)
15/07/2014
Voltages
1 2 3 4 5 6 7 8 9 10 11 12 130
50
100
150
200
250
Household Line 2
Voltages [
V]
With EV
Without EV
1 2 3 4 5 6 7 8 9 10 11 12 130
20
40
60
80
100
120
Household Line 2
Curr
ent
[A]
With EV
Without EV
Currents Temperatures
1 2 3 4 5 6 7 8 9 10 11 12 130
5
10
15
20
25
30
35
40
45
Household Line 2
Tem
pera
ture
[ºC
]
With EV
Without EV
Conclusion: No problems in this suburban
real distribution network arises, with low EV
penetration rates and even with
uncoordinated charging.
Other areas or countries with a weaker
distribution infrastructure might suffer from
problems even under slow charging.

15/07/2014
Results from G4V project
Source: www.g4v.eu
A number of different distribution grids (MV and LV) have been collected from the DSOs involvedin the project (Sweden, Germany, Italy, Spain and Portugal)
G4V project analyzes the influence of:
Different EV penetration rates (0-100%)
Charging power (3.7, 11 and 55 kW)
Charging infrastructure (at home, at work, everywhere,..)
Charging strategies (uncontrolled, time centeredcharge, Tou tariffs, direct control, etc)

Conclusions from G4V project
15/07/2014Source: www.g4v.eu
The impact of EVs on a specific distribution
grid is never equal and it has to be analyzed
in detail.
For better control, DSO shall have the
possibility of influencing the EVs charging
behaviour.
With different charging strategies, it is possible
to postpone reinforcements for
considerable penetration levels.

Reducing the impact on distribution
grid - Control algorithm
Step down
Transformer
Voltage Violation
Power Charging
ControllerVoltage Set point

Third Step: Transmission grid
15/07/2014

Previous work from IMOB (2012)
15/07/2014
Electric power demand for
household-generated traffic was
estimated as a function of time and
space for the region of Flanders,
Belgium.
An activity-based model was used to
predict traffic demand.
Charging opportunities at home and
work locations were derived from the
predicted schedules and the
estimation of the possibility to charge
at work.
Simulations were run for several
levels of EV market penetration and
for specific ratios of battery-only
electric vehicles (BEVs) to pluggable
hybrid electric vehicles.

Work done in DATASIM - UPM
15/07/2014
(2013) Analysis of the impact of charging of PHEV-
EV in the transmission grid.
IMOB mobility data from Flanders (2386 zones,
13,522 km2 , 5.71 km2/zone)

Work done in DATASIM-UPM
15/07/2014
High Voltage Grid (Belgium)

Analysis of the impact of
charging EV on the transm. grid
Tasks:
Estimation of the “background electric load” for each
transmission substation.
Evaluate the increment of the electric demand due to
EVs in each substation (given by IMOB)
Analysis of the impact of these load increments over the
total substations’ capacity
Background
Electric Load for
each mobility zone
Domestic Load
Complementary load: industrial, electric
transportation (trains), etc

Evaluating the total electric load
per substation
1. Estimation of the Background electricity
consumptions by ZONE
Total Electric Load
in each
SUBSTATION
3. NEAREST SUBSTATION assignment
2. EV Load in each zone (IMOB results)

Assignement mobility zones to
substations
Selecting the feeding substation:For each mobility zone, the coordinates of the
center of gravity are evaluated.
These zones are assigned to the nearest
substation
Electric substation
cg
cg
MOBILITY ZONE 1
MOBILITY ZONE 2
cg
MOBILITY ZONE 3

Assignament example
Transmission
Substation

Main results
Power demand for the zone having the biggest
power 0.8 demand peak during tariff period: low
case residential zone.
(Substation supply zone 2357).
Max Power=47,5 MW incr. +12%
Power Subs=80 MW

Work done in DATASIM - UPM
Power demand for the zone having the
biggest power demand peak during tariff
period: low case residential zone.
(Substation supply zone 2357).
Max Power=47,5 MW
incr. +12%
Power Subs=80 MW

Analysis of the impact of
charging of EV in the grid
Results:
Each substation feeds more than one mobility
zone, so in this case the total aggregated electric
demand in a particular substation (ZAVENTEM)
exceed the substation which feeds the biggest
power demand mobility zone (HELIPORT).
No problems have observed in the Belgian
transmission substations.
These results were presented to International
Conference on Renewable Energy Research and
Applications, ICRERA 2013

Reducing the EV charging
impact on the grid through V2V
15/07/2014

V2V Application
131
Optimization of EV charging under time dependent
electric energy prices.
0,00
10,00
20,00
30,00
40,00
50,00
60,00
1:0
0
2:0
0
3:0
0
4:0
0
5:0
0
6:0
0
7:0
0
8:0
0
9:0
0
10
:00
11
:00
12
:00
13
:00
14
:00
15
:00
16
:00
17
:00
18
:00
19
:00
20
:00
21
:00
22
:00
23
:00
0:0
0
Hourly eletricity prices
0
20
40
60
80
100
120
1:0
0
2:0
0
3:0
0
4:0
0
5:0
0
6:0
0
7:0
0
8:0
0
9:0
0
10
:00
11
:00
12
:00
13
:00
14
:00
15
:00
16
:00
17
:00
18
:00
19
:00
20
:00
21
:00
22
:00
23
:00
0:0
0
EV SoC
Need to charge during the day to complete the schedule.
When do we have to optimally charge?

Total aggregated vehicles’
demand
15/07/2014

V2V Fundamentals
15/07/2014
N vehicles in the mobility zone i, hour h.
A EVlack vehicles. (N-A) EVExcess vehicles
A EVlack
vehicles(N-A) EVExcess vehicles.

EVExcess-Evlack vehicles
interaction134
A EVlack
vehicles (N-A) EVExcess vehicles.
N vehicles in the mobility zone i, hour h.
A EVlack vehicles. (N-A) EVExcess vehicles.

V2V Applications. Aggregated
offer and demand
15/07/2014
0 200 400 600 800 1000 1200 14000
0.5
1
1.5
2
2.5
3
3.5
4
4.5
[min]
kW
h
Offer with Penetration Rate of:0.25%
Hourly Energy Demanded
A EVlack
vehicles
(N-A) EVExcess vehicles.

0 500 1000 15000
1
[min]
kW
h
0 500 1000 15000
5
Energy extracted from the grid
Energy extracted from the cars
V2V Applications. Energy
interchange
15/07/2014A EVlack
vehicles
(N-A) EVExcess vehicles.
0 200 400 600 800 1000 1200 14000
0.5
1
1.5
2
2.5
3
3.5
4
4.5
[min]
kW
h
Offer with Penetration Rate of:0.25%
Hourly Energy Demanded

0 500 1000 15000
10
20
30
40
50
60
70
[min]
c€/k
Wh
Grid Price
Real Price (EV)
V2V Applications. Grid price
15/07/2014A EVlack
vehicles
(N-A) EVExcess vehicles.

V2V Applications. Cost
15/07/2014
Charging directly from the grid vs. Charging
from V2V application
0 500 1000 15000
50
100
150
200
250
[min]
c€
0 500 1000 15000
50
100
150
200
250
Hourly Cost Grid (Total):310.8297€
Hourly Cost EV (Total):190.0529€

Fourth step: Generation capacity
15/07/2014

Expected extra electricity
demand peak
What is the expected extra electricity demand
peak?
Assuming:
Standard Battery Capacity (16 kWh)
Small EV (Mit i-Miev)
Plug-in EV (Chevy Volt-Opel Ampera)

10 20 30 40 50 60 70 80 900
0.2
0.4
0.6
0.8
1
1.2
1.4
1.6
1.8
2x 10
5
Distance [km]
Nu
mb
er
of ve
hic
les
Average Distance
Expected extra electricity
demand peak
Assuming:
Probability functions for:
Distance travelled per day.
Departure and arriving time.
Different charging methods (3.7 kW)
6 8 10 12 14 16 18 20 220
0.5
1
1.5
2
2.5
3
3.5
4
4.5
5x 10
4
Time of day [h]
Leaving and arriving time distributions

Expected extra electricity
demand peak
Spain 2017 (3.6.106 EV 16%) both coordinated and non
coordinated charging
000 2 4 8 10 12 14 16 18 20 22 06
ES1
ES2
Charging time
ES3ES4
random rangerandom range

0 5 10 15 20
2.6
2.8
3
3.2
3.4
3.6
3.8
4
4.2x 10
4
Porcentage
Tota
l S
panis
h p
ow
er
dem
and (
MW
)
3.600.000 EV. Load Demand
No EV
ES1
ES2
ES3
ES4
Expected extra electricity
demand peak
Worst case, all vehicles are completely empty at the start of the recharge
000 2 4 8 10 12 14 16 18 20 22 06
ES1
ES2
Charging time
ES3ES4
random rangerandom range

Expected extra electricity
demand peak
Total penetration 22,326.106 EV
0 5 10 15 20
2.4
2.6
2.8
3
3.2
3.4
3.6
3.8
4x 10
4
Hour of day [h]
Total S
panis
h pow
er dem
and (M
W)
22,325,847 EVs (complete fleet)
Total Power demand (no EV)
Total Power demand (22.3258 106 EV)

Expected extra electricity
demand peak. CONCLUSIONS
Electricity needs for EVs will remain small relative to overload
even with great deployment of EVs.
Without coordination charging, EVs have a much bigger
impact on the use of generation plants (due to the peak
load) and increase network constraints.
It is important to promote mechanisms for demand side
management to recharge during the night-time hours
through:
-Dynamic price (depending on the time of the day it is used)
- Direct control from the DSO
Fraile-Ardanuy, J Martínez, S, Artaloytia, B., Ramírez, D. Fuentes, M and Sánchez, C..'Analysis of the impact of
charging of Plug-in Hybrid and Electric Vehicles in Spain, International Conference on Renewable Energies
and Power Quality (ICREPQ'12), 2012

Fifth Step: Vehicle To Grid
Applications
15/07/2014

Task 6.3.Introduction
15/07/2014
EV-PHEVs can be used as distributed storage
devices, feeding electricity stored in their batteries
back into the electric grid when needed (vehicle to
grid, V2G).
Electricity market and regulatory laws must be
adapted to allow V2G applications.
Vehicle to home or building applications (V2H-V2B)
will be developed firstly.

V2H-V2B Applications
15/07/2014

Study of PHEV-EV integration in
the BEMS
15/07/2014
0 5 10 15 20 25-200
0
200
400
600
Time [h]
0 5 10 15 20 250.05
0.1
0.15
0.2
Time [h]
Building Demand
Total Demand
Energy price (€/kWh)
0 5 10 15 20 25 30-600
-500
-400
-300
-200
-100
0
100
200
300
400
Time [h]
EV Demand (kW)
Arriving time
Departure time
Highest price

Work ongoing in DATASIM - UPM
(2013) “Intelligent Building Management System
using Electric Vehicles-VE2”
15/07/2014

Summary
15/07/2014
Electric Vehicles are expected to be the next
revolution in the world.
It is assumed that a big deployment will
come…
But the reality is
Summary
15/07/2014
EVs will start to affect electric grid in the lowerlevel (low voltage distribution grid) in somespecific areas.
Coordinated charging algorithms are essential to avoid electric constraints in thegrid.
EV owners can have additional revenues(not only mobility) using their idled cars

Summary
15/07/2014
EV aggregators will be the new agent which
interact with markets, SO-DSO and vehicles.
They will need to manage a huge spatio-
temporal information related to the vehicles
and temporal electricity prices to design a
strategy to present bids in the market (and
don’t lose money!)
Mobility is a key factor for the aggregator
agent in the electricity market.

?Thanks for your attention!
15/07/2014