reducing the maritme sector's contribution to climate ......dr carlo raucci (ucl/umas), dr...
TRANSCRIPT
REDUCING THE UK MARITIME SECTOR’S CONTRIBUTION TO AIR POLLUTION AND CLIMATE CHANGE Potential Demands on the UK Energy System from Port and Shipping Electrification A Report for the Department for Transport July 2019

frontier economics
Reducing the UK Maritime Sector’s Contribution to Air Pollution and Climate Change
Authors: Dr Carlo Raucci (UCL/UMAS), Dr Tristan Smith UCL/UMAS); and Kat Deyes (Frontier Economics). Although this report was commissioned by the Department for Transport (DfT), the findings and recommendations are those of the authors and do not necessarily represent the views of the DfT. The information or guidance in this document (including third party information, products and services) is provided by DfT on an 'as is' basis, without any representation or endorsement made and without warranty of any kind whether express or implied. The Department for Transport has actively considered the needs of blind and partially sighted people in accessing this document. The text will be made available in full on the Department’s website. The text may be freely downloaded and translated by individuals or organisations for conversion into other accessible formats. If you have other needs in this regard please contact the Department. Department for Transport Great Minster House 33 Horseferry Road London SW1P 4DR Telephone 0300 330 3000 General enquiries https://forms.dft.gov.uk Website www.gov.uk/dft Queen’s Printer and Controller of Her Majesty’s Stationery Office, 2018, except where otherwise stated Copyright in the typographical arrangement rests with the Crown. You may re-use this information (not including logos or third-party material) free of charge in any format or medium, under the terms of the Open Government Licence v3. To view this licence, visit http://www.nationalarchives.gov.uk/doc/open-government-licence Where we have identified any third-party copyright information you will need to obtain permission from the copyright holders concerned.
Frontier Economics Ltd is a member of the Frontier Economics network, which consists of two separate companies based in Europe (Frontier Economics Ltd) and Australia (Frontier Economics Pty Ltd). Both companies are independently owned, and legal commitments entered into by one company do not impose any obligations on the other company in the network. All views expressed in this document are the views of Frontier Economics Ltd.

frontier economics
Reducing the UK Maritime Sector’s Contribution to Air Pollution and Climate Change
CONTENTS 1 Executive Summary 4 1.1 Aims of this report 4 1.2 Analysis 4 2 Introduction 9 2.1 Aims of this report 9 2.2 UK shipping emissions: scale of the challenge 10 2.3 Electricity requirements at UK ports from shipping 11 2.4 Electricity requirements at UK ports from other equipment 13 3 Potential opportunities for shore power and electric ships 14 3.1 Introduction 14 3.2 Overview of current UK port operations 14 3.3 Port electricity infrastructure 16 3.4 Opportunities from shore power 20 3.5 Scenarios and methods used for this analysis 21 4 Potential future energy requirements from electrifying ports and shipping in the UK 26 4.1 Aim of the analysis 26 4.2 Scenario analysis results 26 4.3 Estimating peak energy demand at representative UK ports 30 4.4 Insights and interpretation 31 5 Potential implications for energy supply infrastructure 33 5.1 Supply-side considerations 33 5.2 Potential barriers to port electrification 35 6 Quality assurance 38 6.1 Quality assurance statement 38 7 Annex 40 7.1 Ship types referred to in this report 40 8 References 41
frontier economics 4
Reducing the UK Maritime Sector’s Contribution to Air Pollution and Climate Change
1 EXECUTIVE SUMMARY 1.1 Aims of this report Maritime 2050: Navigating the Future (DfT, 2019) stated the UK Government’s ambition that “By 2050, the UK will actively drive the transition to zero emission shipping in its waters, moving faster than competitor countries and international standards to capitalise on economic benefits and be seen as a role model in the field”. To achieve this will require determined and collaborative action between industry, government and different parts of the supply chain. In particular, it will involve changes to behaviours, on-board shipping technologies, fuel sources and energy supplies, and the associated on-shore and on-board infrastructure. Building on separate work which considered the full range of actions that could reduce emissions of greenhouse gases (GHGs) and air pollutants from ships (see Frontier Economics et al. 2019a), this report focuses on one particular aspect in more depth: the potential electricity requirements from shore power; the electrification of shipping where this is feasible; and the electrification of the port itself. Little evidence has been published to date in relation to the electricity usage of the UK’s major ports, though electricity (and other fuels) are clearly vital for their effective and efficient operation. Technologies are emerging that will allow greater use of grid electricity to replace the reliance of ships on their auxiliary power1 systems while the ship is moored in port, and some ships will be powered by batteries (which would need to recharge while in port). In addition, some port machinery and equipment (such as fork lifts or mobile cranes) currently using liquid fuels, could also be electrified. In recognition of these developments, Maritime 2050: Navigating the Future (DfT, 2019) made the commitment that: “Government will work to better understand the capacity of the UK’s energy networks to support an increase in demand for green energy from our ports and shipping sectors” (DfT, 2019) This report helps to build this understanding along with identifying the likely barriers to port electrification that may need to be addressed via government policy or otherwise.
1.2 Analysis This analysis is exploratory and draws on scenario analysis. It does not represent government policy nor does it make any inferences about what major ports in the UK are planning or could plan.
1 Auxiliary engines are used for electrical power production on board the ship and therefore account for a proportion of the ship’s fuel consumption. This energy is required to power the ship’s air conditioning system, the lights and other appliances.

frontier economics 5
Reducing the UK Maritime Sector’s Contribution to Air Pollution and Climate Change
For the purposes of estimating the potential total electricity demand for illustrative ports in the future, both on an annual basis and in terms of peak requirements, the analysis considers demand broken down into three areas: The demand from ships for auxiliary power when the vessels are in port (sometimes referred to as ‘cold ironing’ or ‘shore-power’); The demand from ships when they are in port to charge batteries used for propulsion; and The demand for electricity landside within the port – such as for equipment or non-road mobile machinery (NRMM). To reflect uncertainties around the future potential for electrification, scenario analysis has been used to estimate future UK demand from ships using shore power and/or batteries as propulsion. The scenarios that have been considered are2: Business as Usual (BAU): this provides projections of the extent to which ships are likely to use shore power, or have a battery for propulsion that needs to be charged, given the incentives provided by the market and all current and committed policies only; and An ambitious hypothetical scenario in which there is assumed to be a strong incentive within the market to improve fuel efficiency and invest in technologies to reduce emissions. This scenario results in increased take-up of shore power as one of the emission reduction options. In addition, a shift to electric propulsion (use of batteries that need charging when the vessel is in port) is taken-up as an emission reduction option for the relevant ship types (typically smaller ships). The strong incentive to reduce emissions leads to a high level of uptake of battery propulsion in the relevant ship types. This scenario is therefore intended to represent an illustrative upper-bound estimate of the potential demand for electricity from vessels in port. The demand for electricity within the port for other equipment (such as for non-road mobile machinery, NRMM) is estimated through desktop research-derived assumptions. The analysis estimates that between now and around 2050, the annual electricity demand across the ports considered could increase to around 250 Gigawatt hours (GWh) under the BAU scenario and to more than 4,000 GWh under the ambitious emission reduction scenario. Under the BAU scenario, conversion to the use of shore power is estimated to be the major driver of the increase in electricity demand. However, under the scenario with ambitious assumptions about the incentive to reduce emissions, it is estimated that the majority (more than 80%) of the increase in electricity demand from ships is likely to be from those ships that are charging batteries that they rely on for propulsion. Given the distribution of ship calls at ports across the country and the estimates of which type/size ships could be using shore power and / or batteries for propulsion
2 For consistency with related modelling work, where appropriate and where stated, scenario results are used from complementary analysis undertaken by UMAS as part of Frontier Economics et al (2019b)

frontier economics 6
Reducing the UK Maritime Sector’s Contribution to Air Pollution and Climate Change
by 2050, it is estimated that the most significant increases in annual electricity demand requirements by 2050 would be in the North West, North East, and London regions of the UK. However, there are expected to be large increases in annual electricity demand in all locations where there is a significant port.
For the purposes of considering how the electricity infrastructure may be affected by a shift to the electrification of shipping and ports, the increase in peak-load is of primary importance. This is because the infrastructure must be sufficient to accommodate at least the peak level of demand. This has been explored by considering a representative small port, a representative medium-sized port and a representative large port (considered in terms of annual freight traffic). This analysis estimates that the potential peak demand load could be:
Around 9 MW for a representative small port with just 5 ships concurrently demanding electricity;
Around 30 MW for a representative medium-sized port if 20 ships were to demand electricity concurrently; and
Just under 80 MW for a representative large port if 50 ships were to be demanding electricity concurrently.
For context, the UK had peak demand of 52,279 MW in 2017/2018 (BEIS, 2018). In the case of 50 ships simultaneously plugging in at one port, this would therefore represent around 0.15% of the UK’s peak demand.
Shore power demand is likely to be higher at large ports than small ports, not only because of the number of vessels they have in port but also because they berth deep sea ships trading internationally (e.g. large container ships and cruise liners).
Recognising the scale of these potential energy requirements, there are several options available for the port to consider. In the first instance, it may be appropriate for considering whether demand for charging and shore power could be spread to avoid the peak-load demands that would otherwise arise. If this is not feasible, then there are several supply-side options. A port’s connection to the distribution network could in some cases be enhanced (which may also involve new sub-stations); or a direct connection to the transmission system may be more appropriate and viable; it could generate its own power; or it may be able to draw power stored in ships’ batteries. Where infrastructure enhancements are required, these would need to be discussed with the distribution network operator (DNO) (or transmission network operator) for each port. As part of these discussions, a feasibility study may be carried out to identify the options available, and the financial contribution required from the port towards the enhancement costs would need to be agreed. The port would then have a commercial decision to make as to whether to proceed.
The costs of enhancing the network are likely to be very context specific. If the enhancement does not require a new substation then this can be done, probably in a matter of months at a much lower cost than if a new substation were needed or if large-scale reinforcements were needed.
Typical barriers that a port would need to overcome if it were to provide charging infrastructure (for either propulsion or auxiliary power) are:
frontier economics 7
Reducing the UK Maritime Sector’s Contribution to Air Pollution and Climate Change
Split incentives to invest3 and co-ordination failures between ports and the shipping industry. Split incentives can occur when the costs of investing in an abatement option are incurred by one party but the benefits accrue to another (IEA, 2007). There is a risk that the demand for shore power and electrification technologies is hindered because ship owners may not realise all of the associated benefits, such as lower energy costs, because under certain types of contract, it is the charterer that pays for the fuel. This is relevant in this context because in order for the port to have the incentive to invest in the capacity to support shore power and ship electrification, it would need to have sufficient confidence that ships using its port will have invested in the relevant shore power and electrification technology. Intervention to provide information on the potential demand for shore power and the extent to which electrified ships could use particular ports could be helpful.
More widely, existing evidence (EEA, 2017) refers to a ‘chicken and egg’ problem whereby ship owners may be reluctant to invest in abatement options such as electrification until other actors such as ports put in place the supporting infrastructure. However, ports may not want to invest in the supporting infrastructure until the demand can be credibly demonstrated. These co-ordination issues could be partially overcome if governments, trade bodies, or international representative groups can organise, promote and facilitate the diffusion of alternative technologies..
Imperfect information on abatement options can also cause a market failure (Golove & Eto, 1996). Shipowners and ports will make their investment decisions using the information that is available to them. In some cases this information may be unavailable or insufficient. Intervention to make evidence available to inform such decisions could therefore be valuable.
Existing infrastructure and onboard technologies. If there is a difference in the electricity infrastructure offered at certain ports, then electrified ships could be restricted in terms of which routes they operate. There is currently a lack of a global standardised connection specification (physical connection and electricity specification) for the ship to shore interface. This is most important, though not exclusively, for shore power connections where ships using these are (unlike battery electric ships that typically only travel shorter voyages) likely to be trading globally and therefore will need to make the connection in a number of different ports and countries. This is the subject of ongoing international cooperation, and so is likely to be addressed in due course. However, until it is, it can add cost and reduce access/availability. Government could support here by suggesting common standards for the connections between ship and shore, for example.
The cost of capital is an important consideration when investing in a new abatement option such as port electricity infrastructure. Innovation Loans are being used in other sectors to reduce capital costs, for example, by UK Research and Innovation
3 This is a variant of the Principal Agent Problem whereby one agent is responsible for making decisions on behalf of, or that impact on, another entity.

frontier economics 8
Reducing the UK Maritime Sector’s Contribution to Air Pollution and Climate Change
Regulatory constraints could also reduce the speed of uptake in some circumstances. The process of obtaining development consent is led by the port but is likely to involve both the DNO and the port. This would involve public consultation, assessment of environmental impacts, etc and could result in plans having to be altered to gain consent or even being refused consent. This places the investment, and associated planning activities, at risk. This risk could be mitigated by local planners identifying port related upgrades in their strategic plans, and by good planning practice by the applicants.

frontier economics 9
Reducing the UK Maritime Sector’s Contribution to Air Pollution and Climate Change
2 INTRODUCTION 2.1 Aims of this report
Maritime 2050: Navigating the Future (DfT, 2019) stated the UK Government’s ambition that “By 2050, the UK will actively drive the transition to zero emission shipping in its waters, moving faster than competitor countries and international standards to capitalise on economic benefits and be seen as a role model in the field”. To achieve this will require determined and collaborative action between industry, government and different parts of the supply chain.
In particular, it will involve changes to behaviours, on-board shipping technologies, fuel sources and energy supplies, and the associated on-shore and on-board infrastructure.
Building on separate work which considered the full range of actions that could reduce emissions of greenhouse gases (GHGs) and air pollutants from ships (see Frontier Economics et al. 2019a), this report focuses on one particular aspect in more depth: the potential electricity requirements from shore power; the electrification of shipping where this is feasible; and the electrification of the port itself.
Little evidence has been published to date in relation to the electricity usage of the UK’s major ports, though electricity (and other fuels) are clearly vital for their effective and efficient operation. Technologies are emerging that will allow greater use of grid electricity to replace the reliance of ships on their auxiliary power4 systems while the ship is moored in port, and some ships will be powered by batteries (which would need to recharge while in port). In addition, some port machinery and equipment (such as fork lifts or mobile cranes) currently using liquid fuels, could also be electrified. In recognition of these developments, Maritime 2050: Navigating the Future (DfT, 2019) made the commitment that:
“Government will work to better understand the capacity of the UK’s energy networks to support an increase in demand for green energy from our ports and shipping sectors” (DfT, 2019)
This report helps to build this understanding along with identifying the likely barriers to port electrification that may need to be addressed via government policy or otherwise.
The analysis draws on desk-based research, new modelling, and qualitative interviews with industry experts to provide provisional evidence on the following:
1. Contextual information: to illustrate the diversity of the UK’s ports and associated shipping activity, the key characteristics of the ten largest UK ports, in terms of traffic, are described. These ports alone account for more than 70% of the port traffic (in tonnage terms) at the UK’s major ports. Information is provided on their geographical location, freight activity, cargo type, and the distribution network operators (DNOs) for each of those ports.
4 Auxiliary engines are used for electrical power production on board the ship and therefore account for a proportion of the ship’s fuel consumption. This energy is required to power the ship’s air conditioning system, the lights and other appliances.

frontier economics 10
Reducing the UK Maritime Sector’s Contribution to Air Pollution and Climate Change
2. New modelling of annual energy requirements: potential annual electricity requirements across all major UK ports in 2050, taking into account the electricity requirements of ships that could use shore power; ships that need to charge their batteries; and the electricity required by the port itself. This takes the form of scenario analysis which looks at both a business as usual (BAU) scenario and a scenario which is intended to reflect an ambitious shift to these three forms of electrification by 2050.
3. New modelling of potential peak energy demands if ports were to electrify: this uses illustrative analysis of three hypothetical ports that are intended to represent a small, medium and large port, with assumptions about the types of ships that may need to charge batteries and use shore power in 2050.
4. A qualitative description of the process a port may need to follow to ensure its electricity supply infrastructure is adequate to support future shore power demand and ships recharging their batteries: this draws on desk research and interviews with energy system experts to provide information about the aspects a port and its DNO may need to consider and the potential barriers that may need to be overcome.
2.2 UK shipping emissions: scale of the challenge The shipping industry is a critical element in the UK trade’s in goods. Around 95% of British imports and exports in goods are moved by sea, including 25% of the UK’s energy supply and almost half of the country’s food supplies (DfT, 2019). The UK port sector is the second largest in the European Union, handling around 5% of the world’s total maritime freight traffic at some point in its journey (DfT, 2019).
To undertake this scale of activity, ships require a substantial volume of fuel. The current reliance on fossil fuels, however, has harmful consequences due to the associated emissions. Shipping generates emissions of several pollutants that are harmful to human health and environmental ecosystems. These include nitrogen oxides (NOx), sulphur dioxide (SO2), particulate matter (PM2.5 & PM10), volatile organic compounds (VOCs) and ammonia (NH3).
In 2016, domestic shipping alone (ships that start and end their journey in the UK, including overseas territories and Crown dependencies) accounted for 11% of the UK’s total domestic NOx emissions, 2% of primary PM2.5 and 7% of SO2 (DfT, 2019).
In addition, emissions from shipping of greenhouse gases (GHGs) are substantial. As a percentage of the UK’s overall GHG emissions, shipping’s contribution (both international and domestic) is currently relatively small at 3.4% (DfT, 2019)5. However, this share of emissions is likely to increase as the rest of the UK de-carbonises over the coming decades.
Emissions from international shipping, and voyages that are in transit through UK waters far outweigh the volume of emissions from domestic shipping.
5 For comparison, UK aviation (domestic and international) accounts for around 7% of the UK’s total GHG emissions (DfT, 2018a)

frontier economics 11
Reducing the UK Maritime Sector’s Contribution to Air Pollution and Climate Change
2.3 Electricity requirements at UK ports from shipping When vessels are in port, they often continue to generate power using auxiliary internal combustion engines for support purposes, such as refrigeration on container ships. These engines account for a proportion of the ship’s fuel consumption – which is typically fossil fuel – and therefore lead to emissions of GHGs and emissions to air of pollutants.
Instead of using auxiliary power systems, an alternative approach is to connect the ship directly to the port’s electricity supply, known as ‘shore power’ (or cold ironing6). Ports can either take electricity directly from their local distribution network, or generate their own electricity from renewable sources. Eliminating the use of auxiliary engines can lead to a better port working environment through reducing emissions, noise, vibrations, as well as providing the opportunity to provide this energy from renewable sources.
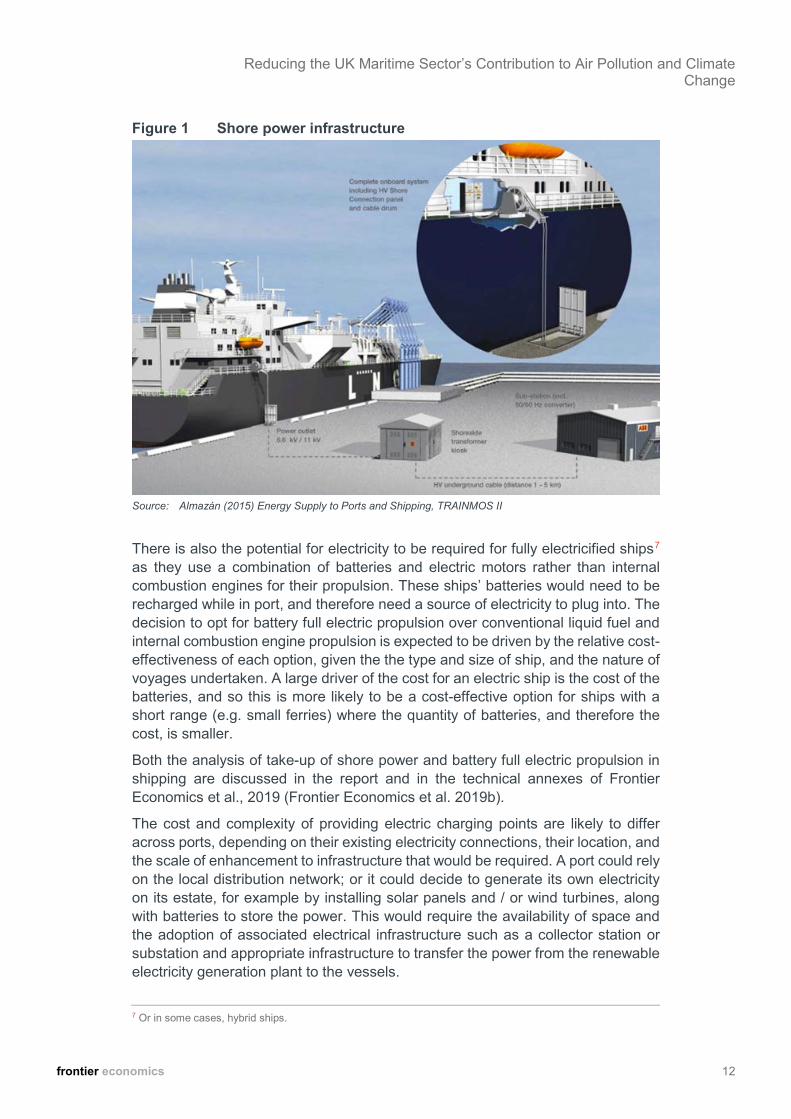
Figure 1 shows the technologies involved in providing shore power to ships in ports (Almazán, 2015). Ships utilising shore power require a step-down transformer which reduces the voltage from the distribution network to the voltage appropriate for use either on board or on shore. The type of step-down transformer needed can vary, depending on the frequency at which the on-board systems operate. The UK grid supplies power at 50 Hz, while American and most Japanese ports supply at 60 Hz, for example.
The incentive for a ship to use shore power can be provided either by regulation or price. For example, regulations on emissions to air of pollutants can make shore power an attractive compliance option for the shipping sector. Alternatively, depending on: a) the cost-effectiveness relative to the other energy efficiency improvement options and b) the price of liquid fuel (for the ship) relative to the price of electricity supplied via shore power, there may be the opportunity for cost reduction through the use of shore power.
6 This is known as ‘cold ironing’ because the ships used to run on coal-fired iron engines so when they were in port and their main or auxiliary engines could be rested, they cooled down and got cold. In this case, the alternative power supply while in port is electricity. For further information see: https://www.marineinsight.com/marine-electrical/what-is-alternate-marine-power-amp-or-cold-ironing/
frontier economics 12
Reducing the UK Maritime Sector’s Contribution to Air Pollution and Climate Change
Figure 1 Shore power infrastructure
Source: Almazán (2015) Energy Supply to Ports and Shipping, TRAINMOS II
There is also the potential for electricity to be required for fully electricified ships7 as they use a combination of batteries and electric motors rather than internal combustion engines for their propulsion. These ships’ batteries would need to be recharged while in port, and therefore need a source of electricity to plug into. The decision to opt for battery full electric propulsion over conventional liquid fuel and internal combustion engine propulsion is expected to be driven by the relative cost-effectiveness of each option, given the the type and size of ship, and the nature of voyages undertaken. A large driver of the cost for an electric ship is the cost of the batteries, and so this is more likely to be a cost-effective option for ships with a short range (e.g. small ferries) where the quantity of batteries, and therefore the cost, is smaller.
Both the analysis of take-up of shore power and battery full electric propulsion in shipping are discussed in the report and in the technical annexes of Frontier Economics et al., 2019 (Frontier Economics et al. 2019b).
The cost and complexity of providing electric charging points are likely to differ across ports, depending on their existing electricity connections, their location, and the scale of enhancement to infrastructure that would be required. A port could rely on the local distribution network; or it could decide to generate its own electricity on its estate, for example by installing solar panels and / or wind turbines, along with batteries to store the power. This would require the availability of space and the adoption of associated electrical infrastructure such as a collector station or substation and appropriate infrastructure to transfer the power from the renewable electricity generation plant to the vessels.
7 Or in some cases, hybrid ships.
frontier economics 13
Reducing the UK Maritime Sector’s Contribution to Air Pollution and Climate Change
The process enahncing the local distribution network is discussed in more detail in Section 5.
2.4 Electricity requirements at UK ports from other equipment There are particular pieces of equipment and infrastructure in a port that can be electrified to reduce emissions. These include gantry cranes, along with gates, tug and dredging boats, refrigerated storage racks, lighting, and auxiliary building power (IEA ETSAP, 2011). Electrification allows gantry cranes to take advantage of a process of ‘energy recuperation’ whereby they can use a combination of diesel and electricity to ensure that energy that would otherwise be lost when they are lowering boxes can be fed back to the grid. This has been demonstrated in the US port of Savannah, where electrified cranes successfully power themselves for 18 minutes per hour (Alliance to Save Energy, 2017). The reduction in fuel consumption for their 27 cranes alone resulted in an annual saving of $10 million, equivalent to around 7.3 GWh in electricity per year (IEA ETSAP, 2011). For illustration, were a port the size of Southampton to electrify its 28 cranes in a similar project, savings on the same scale could potentially be achieved.
frontier economics 14
Reducing the UK Maritime Sector’s Contribution to Air Pollution and Climate Change
3 POTENTIAL OPPORTUNITIES FOR SHORE POWER AND ELECTRIC SHIPS
3.1 Introduction This section presents contextual information that is intended to demonstrate the diversity of ports across the country in terms of their port traffic, the types of cargo they handle, their geographical locations and their Distributional Network Operators (DNOs). Such factors are all important when considering the scale of potential electricity requirements if they were to electrify and the associated implications for the required energy infrastructure. For this, the characteristics of the ten largest UK ports are described as together they account for more than 70% of the port traffic (in tonnage terms) at the UK’s major ports. Of course, there are many ports in the UK operating at smaller scales and with their own unique combination of characteristics.
3.2 Overview of current UK port operations There are 53 major ports in the UK (defined by DfT as those with cargo volumes of at least 1 million tonnes annually, as well as some strategically important ports) (DfT, 2018b) and a further 108 minor ports. Together they accounted for 481.8 million tonnes of port traffic in 2017 (DfT, 2018b), 98% of which was handled at the major ports. The port sector is therefore extremely diverse, and is characterised by some very large ports which account for a substantial share of overall UK port traffic, and a long tail of very small ports.
The largest ten ports, for example, handle more than 70% of the port traffic (in tonnage terms) at the UK’s major ports. This section focuses on the scale of their activity in order to provide some context to their potential energy requirements, if they were to electrify. Figure 2 allows us to draw some observations that could be useful in the context of their potential energy requirements if they were to electrify.
Firstly, even among the largest ten major ports, there is a substantial variation in ‘size’ indicated by the volume of traffic they handle. The largest two ports alone (Grimsby & Immingham and London) together account for almost a quarter of the port traffic (in tonnage terms) at the UK’s major ports (22.1%). The seven next largest ports all handled between 25 million and 35 million tonnes of freight per year in 2017, with the port of Belfast handling around 18 million tonnes of port traffic in 2017.
Secondly, the composition of the cargo they handle also varies substantially. This is important in the context of electrification because the cost effectiveness (and even the feasibility) of full electrification of the ships varies across ship types and sizes (as found in Frontier Economics et al. 2019b). Likewise, the cost effectiveness of onshore power varies across ship types and sizes, meaning that the viability of the associated infrastructure provision at the port may vary.
Figure 2 shows that some ports tend to specialise in handling particular cargo. For example, in 2017, liquid bulk accounted for approximately 97%, 86% and 70% of

frontier economics 15
Reducing the UK Maritime Sector’s Contribution to Air Pollution and Climate Change
total freight traffic at ports Milford Haven, Forth, and Tees and Hartlepool respectively; lift-on lift-off (Lo-Lo) traffic accounted for approximately 87% of Felixstowe’s total freight traffic; and roll-on roll-off (Ro Ro) traffic accounted for approximately 99% of Dover’s total freight traffic. Other ports tend to be more diversified, however.
Figure 2 Top 10 largest UK Ports - contextual data
UK Port Region
Total freight traffic 2017
Total Freight traffic 2017 – cargo type proportions (%)
Thousand tonnes
% of total UK major
port traffic
Liquid bulk Lo-Lo Ro-Ro
Dry bulk and other general cargo
1 Grimsby & Immingham
Yorkshire and the Humber
54,034 11.5% 37.1% 4.2% 30.4% 28.2%
2 London London 49,868 10.6% 29.4% 21.0% 15.7% 34.0%
3 Southampton South East 34,471 7.3% 62.2% 27.7% 3.8% 6.3%
4 Liverpool North West 32,541 6.9% 33.1% 16.7% 23.8% 26.4%
5 Milford Haven Dyfed 31,990 6.8% 96.9% 0.0% 2.8% 0.4%
6 Felixstowe Eastern 29,028 6.2% 0.1% 87.3% 12.6% 0.0%
7 Tees & Hartlepool North East 28,447 6.0% 70.3% 7.6% 7.6% 14.6%
8 Forth Scotland 27,544 5.9% 85.5% 8.0% 1.9% 4.5%
9 Dover South East 26,223 5.6% 0.0% 0.0% 98.9% 1.1%
10 Belfast Antrim/ Down1 18,226 3.9% 12.4% 9.3% 38.1% 40.2%
Source: DfT Port level statistics, PORT0301 https://assets.publishing.service.gov.uk/government/uploads/system/uploads/attachment_data/file/743026/port0303.ods Notes:. Cargo is categorised based on the means by which goods are loaded onto or off of the vessel. Lo-lo traffic are standard freight
containers. Roll-on roll-off traffic are vehicles and trailers. Liquid bulk cargo is transported unpackaged in large quantities for example oil. Dry bulk includes cargo transported in large quantities such as coal, gravel and cement and other general cargo consists primarily of break-bulk cargo, that is cargo which is composed of separate pieces that must be loaded individually.
Figure 3 further illustrates traffic based on cargo type for all ports in the UK that handled over 2 million tonnes of freight traffic in 2017. Ports vary markedly: some specialise in a specific cargo type (for example Glensanda, Holyhead, Port Talbot) whereas others show a more diversified cargo composition (for example Tyne, Bristol, Medway).

frontier economics 16
Reducing the UK Maritime Sector’s Contribution to Air Pollution and Climate Change
Figure 3 UK ports by cargo type, 2017
Source: DfT (2018c) – Port level statistics, PORT0304, Map of UK ports by traffic, cargo and route type https://assets.publishing.service.gov.uk/government/uploads/system/uploads/attachment_data/file/739805/port0304.ods
This diversity in port size and associated cargo is important to recognise in considering their ports’ potential energy requirements if they were to electrify. The potential annual and peak energy requirements are explored further in Section 4.
3.3 Port electricity infrastructure Before providing analysis of the potential electricity requirements from port and shipping electrification, this section provides a brief overview of the infrastructure that provides electricity to ports in the UK from the grid.
Figure 4 illustrates the components of the grid network. As shown, it comprises four parts of the system: generation, transmission, distribution and homes and

frontier economics 17
Reducing the UK Maritime Sector’s Contribution to Air Pollution and Climate Change
businesses. Ports, as business consumers, would be connected to the distribution network or they could directly connect to the transmission network, or they could generate their own energy using on-site renewable generation.
Figure 4 Energy network overview
Source: Ofgem webpage available at: https://www.ofgem.gov.uk/network-regulation-riio-
model/how-energy-networks-work-you
This grid network is managed to maximise the efficiency of the existing infrastructure, therefore ensuring that the lowest costs are charged to consumers.

frontier economics 18
Reducing the UK Maritime Sector’s Contribution to Air Pollution and Climate Change
For this reason, there are unlikely to be substantial amounts of unused electricity connection capacity available to ports, though there may be some spare capacity for historical reasons. For UK ports to make greater use of shore power and/or battery electric propulsion systems, given the existing connection infrastructure and the need to provide significantly increased charging capacity to pursue such options, this implies a likely requirement for some form of enhancement to the connection and potentially wider network enhancement.
In such cases, the port would have to apply to grid operators for increased capacity. However, the scale and location of the required increase will determine whether they need to apply to DNOs, or transmission network owners (TNO) if the increase is significant enough (this is discussed in more detail in Section 5). It is likely that in most cases this can be handled through an enhancement to the distribution network connection. However, where the enhancement of connection capacity is likely to be large (industry experts interviewed for this study suggest this could mean around 100 MW) then an enhancement to the transmission system may also be required. A port could also connect directly to the transmission network. For information, Figure 5 shows the DNOs supplying the UK’s ten largest major ports. Figure 6 presents this information in a map.
Figure 5 DNOs supplying the UK’s largest major ports
Sources: Energy Networks Association (n.d.) Who is my network operator?- http://www.energynetworks.org/info/faqs/who-is-my-network-operator.html Ofgem (2017) RIIO electricity distribution annual report 2016-17, page 1 https://www.ofgem.gov.uk/system/files/docs/2017/12/riio-ed1_annual_report_2016-17.pdf

frontier economics 19
Reducing the UK Maritime Sector’s Contribution to Air Pollution and Climate Change
Figure 6 Map of major port DNOs Principal ports, port groups and freight waterways Electricity DNO map
Source: DfT (2017) transport statistics Great Britain 2017 - p141, Ofgem (2017) RIIO electricity distribution annual report 2016-17 - p1
Figure 5 and Figure 6 show that several DNOs have multiple major ports in their areas. Of the ten largest ports, three ports in the South East are served by the UK Power Networks DNO group (London, Felixstowe and Dover); two are served by the SP Energy Networks DNO group (Liverpool and Forth) and two are served by the Northern Powergrid DNO group. Scottish and Southern Energy have the most ports in their DNO regions with approximately ten ports residing in Scottish Hydro Electric Power Distribution region 14 and four ports residing in Southern Electric Power Distribution region 2.
Where an enhancement to the distribution network is required, the nature of the actual infrastructure enhancement required will in part depend on the existing infrastructure, including the location of substations, and other local customers’ requirements. Substations convert higher voltages from the transmission system into lower voltages for the distribution system before they can be at a useable voltage level for consumers.
The location of substations is therefore important. Figure 7 provides an illustrative example showing the distances of major ports to substations in the SSE Southern Electric Power DNO region (region 2 in Figure 6 above). The port of Southampton is within this DNO region. For reference, the ports of Plymouth and Teignmouth lie in the neighbouring South West region of the Western Power Distribution DNO, and Newhaven and Shoreham ports lie in the other neighbouring South East region of the UK Power Networks DNO. These are all illustrated in Figure 7.
Distances between ports and substations are one of the drivers of the costs involved in providing a connection to a port, as larger distances require more connection infrastructure (e.g. wires) to be implemented. In some cases a new substation may be more viable than connecting to an existing substation. The port would also have other alternatives available such as connecting directly to the

frontier economics 20
Reducing the UK Maritime Sector’s Contribution to Air Pollution and Climate Change
transmission system, generating its own power, or using power stored in ships’ batteries.
Figure 7 SSE Southern Electric Power DNO substations, distance to major ports
Source: SSE network capacity map - https://www.ssen.co.uk/ContractedDemandMap/?mapareaid=1 Note: The map shows publicly available information on the local of substations only. It does not reflect any
assessment of the capacity of those substations to accommodate an increase in the size of port connections, nor does it make any comment about where ports are currently connected to. Distances are approximate based on GPS coordinates. Ports Plymouth and Teignmouth are in the Western Power Distribution DNO area bordering SSE, and Newhaven and Shoreham ports lie in the other neighbouring South East region of the UK Power Networks DNO. These are shown for geographical reference only.
3.4 Opportunities from shore power Converting ships to shore power would affect a variety of operations on board the ship, within the port, and across the electricity grid. The provision of energy to the ships in the form of electricity (either from the grid or on-site generation at the port, through technologies such as solar panels and wind turbines, alongside batteries) creates the opportunity to reduce emissions from that power (e.g. where it is generated from renewable sources) in a way which would not be feasible from on-board internal combustion.
Both on-board and quay-side, eliminating the need for auxiliary internal combustion engines will reduce noise, vibrations, and emissions to air of pollutants, and will improve working conditions. On-board storage of energy in the batteries could open up the possibility for ships to supply energy back to the grid and affect the connection requirements, though this would depend on how that stored power is

frontier economics 21
Reducing the UK Maritime Sector’s Contribution to Air Pollution and Climate Change
used. If the stored electricity is exported back to the grid in the peaks, then grid reinforcement is still likely to be required. However, if the batteries are used to avoid ships charging in the peaks (i.e. they charge at off-peak times then store the power for when they need it), the grid connection requirements could be lower. This opportunity has been examined for electric cars and is often referred as the vehicle-to-grid concept.8
3.5 Scenarios and methods used for this analysis For this report, two pieces of analysis have been carried out to illustrate the potential electricity requirements associated with port and ship electrification to 2050 in the UK. This analysis makes use of the results of the modelling of the UK domestic and international shipping fleets under two different scenarios reported in Frontier Economics et al. (2019b), as well as other relevant evidence.
The first piece of analysis investigates the estimated annual electricity requirement that could arise in the UK under assumptions about the extent of electrification of ports and ships in five-year increments from 2016 (the base year in the modelling) to around 2050.9 Results are presented at the national level and then this is disaggregated to DNO regions, and ship types. The second piece of analysis explores the potential ‘peak-load’ requirement for electricity if multiple ships at a UK port were to simultaneously demand electricity (this could arise if they were not able to charge at off-peak times or over a longer period).
3.5.1 Methods used to estimate annual future electricity demand associated with port and ship electrification at UK ports The potential electricity requirement at the national level was estimated assuming that requirement arises from the sum of (i) shore power, (ii) fully electrified ships that need to plug in to charge their batteries and (iii) electrified port infrastructure, in the UK.
This analysis was undertaken by investigating the difference between two scenarios:
Business as usual (BAU): electricity demand for ports and shipping in the UK under a BAU scenario in which current and agreed IMO policies on air quality and ship efficiency are maintained. This corresponds to Scenario A in Frontier Economics et al. (2019b); and
An ambitious hypothetical scenario in which there is assumed to be a strong technology neutral incentive within the market to improve fuel efficiency and invest in technologies to reduce emissions.
These two scenarios differ in terms of the use of shore power, and the number of ships that are estimated to become full electric.
8 See for example, Brenna (2014) 9 Note that for the purposes of this modelling, 2051 has been modelled rather than 2050. This is because the
model has a base year of 2016 and projects forward in 5-yearly intervals (i.e. 2021, 2026, 2031, etc.) So, 2051 is the closest modelled year to 2050. The one year difference between 2050 and 2051 would have no material impact on the results or conclusions.

frontier economics 22
Reducing the UK Maritime Sector’s Contribution to Air Pollution and Climate Change
The BAU level of energy requirement is estimated by the projected number of vessels that could be using shore power, and the number of ships that are likely to be full electric under BAU assumptions, as estimated in Scenario A in Frontier Economics et al. (2019b).
The ambitious de-carbonisation scenario estimates the energy requirement under the assumption that there are strong technology neutral incentives in place to de-carbonise, which incentivise a shift from fossil fuel to other forms of energy (including electricity for use in shore power and for full electric ships). To develop this scenario, shore side take-up projections were taken from Frontier Economics et al. (2019b), which provides several scenarios that de-carbonise shipping by around 2050 and include projections for shore side power uptake to around 2050. Several scenarios projected a similar level of shore power uptake to around 2050, so one of those scenarios was used for the purposes of this analysis: in this case, Frontier Economics et al. (2019b) Scenario B has been used10. In addition, the number of vessels that are likely to be electric and therefore have batteries that require charging is estimated.
The estimate of the number of ships that shift to batteries (electric propulsion) is derived by comparing the commercial viability of battery electric propulsion with that of an alternative zero emission technology, which in this case is the use of ammonia (as found in scenario B of Frontier Economics et al. 2019b). This comparison is made on the basis of looking at total costs (i.e. capital, operating costs and changes in charter revenues) for the smallest ship sizes in each of the ship type categories. Costs are compared under two cases: (i) if those ships use the standard zero emission option, ammonia; or (ii) if they adopt full electric propulsion. To apply the cost comparison, because the commercial viability can be particularly sensitive to ship size, the smallest ship size category of a given ship type (e.g. Bulk carrier from 0 to 9,999 dwt) is further divided into subcategories and the cost comparison applied to each subcategory. The cost comparison showed that for most of the smallest ship size subcategories, full electric propulsion is more competitive than ammonia under the scenario B assumptions, but that as ship size increases full electrification is less competitive and ammonia would be the preferred solution. For these reasons, this method then applies full electric propulsion as the selected propulsion technology for all the smallest ship subcategory ships for each ship type, from the date in scenario B that they switch to ammonia.
This approach is simpler than the approach taken in Frontier Economics et al. (2019b) and described in detail in the report’s Technical Annexes (Frontier Economics et al. 2019d). In Frontier Economics et al. (2019b), the method tests the commercial viability of full electric propulsion for each ship size and type in each scenario rather than applying a generalisation across all the smallest ship size categories – the latter has been undertaken here as this analysis was carried out before Frontier Economics et al. (2019b) was finalised. Although there are
10 Scenario B applies a carbon price derived from the central BEIS carbon values per tonne of GHG (CO2e). These are applied to the cost of fossil fuels used by shipping starting from zero in 2025 and increasing to match the BEIS value in 2030 and beyond. The scenario results in approximately 100% GHG reduction from shipping by 2050.

frontier economics 23
Reducing the UK Maritime Sector’s Contribution to Air Pollution and Climate Change
small methodological differences, the results in Frontier Economics et al. (2019b) show general agreement with the results for this simpler method.
Having estimated the number of ships likely to take up shore power and those that could switch to electrification in both the BAU scenario and the ambitious de-carbonisation scenario, the total electricity demand for these ships is estimated.
For the ships using full electric propulsion, this is obtained by multiplying the total number of ships with per-ship values of energy demand taken from the model used in Frontier Economics et al. (2019b).
For shore power, the annual fuel requirement at UK ports under the BAU and ambitious de-carbonisation scenarios were estimated for the range of ship types and sizes. The ship type and size categories, and numbers of vessels within each, are the same as those used in Frontier Economics et al. (2019b). The fuel consumption estimates were converted to equivalent electricity consumption estimates first by assuming equivalent total energy demands, and then assuming that battery electric technology is 50% more efficient relative to internal combustion engine technology. The 50% efficiency correction represents the approximate conversion efficiency of chemical energy in liquid fuels into useful electrical energy for use on board and this correction is necessary because shore power is assumed to be supplied directly (with only minimal or negligible losses).
In both the BAU and ambitious de-carbonisation scenarios, demand from the electrification of port infrastructure in the UK is estimated by first segregating each major port in the UK into three categories, based on the number of yearly calls in 2017 derived from DfT statistics (DfT, 2018d):
□ Large: 2000 yearly calls +
□ Medium: 500-2000 yearly calls
□ Small: <500 yearly calls
Port infrastructure electrification is assumed to be dominated by crane haulage11 and is assumed to grow at 10% per 5-year increment under the BAU and 25% per 5-year increment under the ambitious de-carbonisation scenario until a plausible maximum is reached. These assumptions are derived from expert judgment on the basis that electrification will occur gradually as conventional crane haulage reaches end of life and is replaced (BAU) or may be pushed with an incentive scheme in an ambitious scenario (e.g. similar to the carbon price incentive applied to the shipping fleet).
The aggregated national demand at the UK level under each scenario is then estimated by summing the contributions from these three components: shore power, fully-electrified ships, and port infrastructure.
The national demand estimates are then disaggregated to port and DNO level by assuming the distribution of port calls for each ship type and size remains unchanged based on the 2017 statistics published by the DfT (2018d). The dataset of electricity demand and the dataset of port calls use different ship type
11 Assumptions from the IEA ETSAP Shipping Infrastructure Report(2011) suggest each crane performs 30 container moves per hour, at 2 kWh per move, for 4500 hours operational per year

frontier economics 24
Reducing the UK Maritime Sector’s Contribution to Air Pollution and Climate Change
categorisation. A matching between the two categorisations was used and is provided in Table 1.
Table 1: Type equivalence between datasets
GloTraM Cruise Dry Ferry Offshore Ferry RoRo
Tug Unit Container
Unit RoRo Wet Crude
DfT PORT0601 Pax Dry Pax Other Pax Other Unit
Container Unit RoRo Tanker
3.5.2 Method used to estimate the maximum ‘peak-load’ energy requirement associated with port and ship electrification at UK ports The total potential annual energy requirement associated with port and ship electrification at UK ports is one element of this analysis, and is useful to inform the potential infrastructure requirements. However, this demand may not be distributed evenly over the course of the day and therefore, if the total annual demand is used to estimate an average value, the result may underestimate the electricity demand characteristics, particularly the maximum electrical loads or ‘peak-loads’ that are experienced in practice. Maximum electrical loads are more important for the sizing of electricity distribution infrastructure than average loads, because infrastructure has safety limits that cannot be exceeded at any single point in time - the maximum load therefore needs to be accommodated at all times in order to remain within safety limits. A large peak load may occur if multiple ships demand significant electrical load simultaneously.
This piece of analysis focuses on estimating the maximum ‘peak-load’ energy requirement for individual ports under an estimated worst-case simultaneous demand from both full electric ships and the demand from ships using shore power.
The maximum ‘peak-load’ power requirement was estimated for a representative small port, a representative medium-sized port and a representative large port using the following steps:
Under the definition of small, medium, and large ports given in section 3.5.1, a typical number of berths for each of the port sizes was estimated, based on a manual inspection of satellite imagery of example ports;
To estimate shore power demand, assumptions were made about the ship types and sizes calling at each of the representative ports. In particular, two representative ships were estimated for each of the representative ports: an ‘average’ and a ‘large’ ship. The most frequent ship type and size in DfT port call statistics (DfT, 2018d) 12 was assumed as the ‘average’ ship. Whereas the large ship type was assumed to be the largest ship seen berthing in each port.
12 This is from UK Port Freight Statistics (2018) “UK ports, ship arrivals by type and deadweight”
frontier economics 25
Reducing the UK Maritime Sector’s Contribution to Air Pollution and Climate Change
Demand for an individual ship’s shore power electrical load was derived from IMO figures describing power demands at port for auxiliary engines (IMO, 2015), and converted to an equivalent electricity demand.
Demand from fully electrified ships was estimated by converting the energy consumption over one voyage of a representative ship into an equivalent charging total electricity demand. A small passenger ship was used as a representative ship as this represented the approximate average per-ship electricity demand of all the ship type and size categories that were identified as likely candidates for full-electric propulsion. The estimated electricity demand per voyage was then divided by an assumed 4.8-hours13 berthing time to give a power draw during that period to recharge its battery.
Expert judgement was used to define the number of ships that would be berthing at any one time for each of the identified ports.
A maximum concurrent power draw is then estimated as the sum of demand from shore power and the recharging demand of the fully electrified ships.
13 Based on expert judgement, it is assumed that a small passenger ship spends, in an average day, 12 hours at sea and 12 hours at port and it makes 2.5 voyages per day. Of the 12 hours at port, this is divided by 2.5 voyages/day to derive 4.8 hours per berthing.

frontier economics 26
Reducing the UK Maritime Sector’s Contribution to Air Pollution and Climate Change
4 POTENTIAL FUTURE ENERGY REQUIREMENTS FROM ELECTRIFYING PORTS AND SHIPPING IN THE UK
4.1 Aim of the analysis This analysis presents the annual electricity demand in the UK that could result from the uptake of shore power; electrified ships and electrification of port infrastructure out to 2050. These forecasts are broken down into a national total, DNO-level and ship type levels of aggregation, and for a range of representative ports.
4.2 Scenario analysis results Results are presented below for forecast electricity demand at the national and DNO levels, separated into contributions from shore power, full electric ships, and port infrastructure electrification.
Figure 8 shows that, under BAU, total UK port electricity demand is estimated to increase from approximately 20 GWh in 2016 to around 250 GWh per year by around 2050. This increase is estimated to be primarily from the uptake of shore power, with only a modest electrification of infrastructure in the port itself.
Figure 8 Annual total UK port electricity demand under BAU
Source: UMAS modelling Note: The three components of energy demand are battery propulsion which refers to the energy demand
from electrified ships (recharging batteries); port auxiliary power demand which refers to the electrification of port infrastructure; and shore power
frontier economics 27
Reducing the UK Maritime Sector’s Contribution to Air Pollution and Climate Change
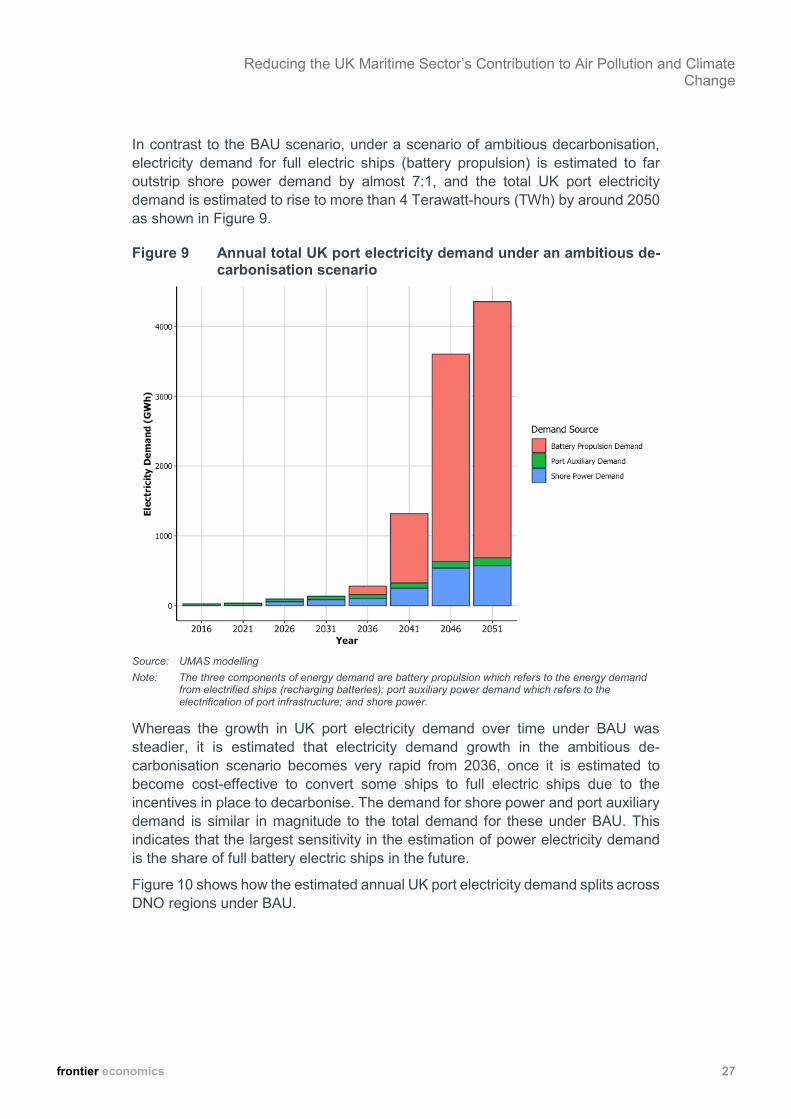
In contrast to the BAU scenario, under a scenario of ambitious decarbonisation, electricity demand for full electric ships (battery propulsion) is estimated to far outstrip shore power demand by almost 7:1, and the total UK port electricity demand is estimated to rise to more than 4 Terawatt-hours (TWh) by around 2050 as shown in Figure 9.
Figure 9 Annual total UK port electricity demand under an ambitious de-carbonisation scenario
Source: UMAS modelling Note: The three components of energy demand are battery propulsion which refers to the energy demand
from electrified ships (recharging batteries); port auxiliary power demand which refers to the electrification of port infrastructure; and shore power.
Whereas the growth in UK port electricity demand over time under BAU was steadier, it is estimated that electricity demand growth in the ambitious de-carbonisation scenario becomes very rapid from 2036, once it is estimated to become cost-effective to convert some ships to full electric ships due to the incentives in place to decarbonise. The demand for shore power and port auxiliary demand is similar in magnitude to the total demand for these under BAU. This indicates that the largest sensitivity in the estimation of power electricity demand is the share of full battery electric ships in the future.
Figure 10 shows how the estimated annual UK port electricity demand splits across DNO regions under BAU.

frontier economics 28
Reducing the UK Maritime Sector’s Contribution to Air Pollution and Climate Change
Figure 10 Annual UK port electricity demand per DNO region under BAU
Source: UMAS modelling
Electricity demand (MWh)0 10000 20000 30000 40000 50000 60000
Other
East (UK Power Networks)
East Midlands (Western Power)
London (UK Power Networks)
Merseyside and North Wales (SP Energy)
North East (Northern Powergrid)
North West (Electricity NW)
North Scotland (SSE)
Central and Southern Scotland (SP Energy)
South East (UK Power Networks)
South (SSE)
South Wales (Western Power)
South West (Western Power)
Yorkshire (Northern Powergrid)
NI (Northern Ireland Electricity)
2051 2031
For the BAU scenario, the majority of the growth in demand for electricity for ports and shipping is estimated to be in Merseyside and North Wales, Yorkshire, and London. It is clear that energy demand growth is expected in all locations where there is a significant port.
Figure 11 shows the estimated annual UK port energy demand by DNO region under an ambitious de-carbonisation scenario.

frontier economics 29
Reducing the UK Maritime Sector’s Contribution to Air Pollution and Climate Change
Figure 11 Annual UK port electricity demand per DNO region under an ambitious de-carbonisation scenario
Compared to BAU,
0 400000 800000 1200000Electricity demand (MWh)
Other
East (UK Power Networks)
East Midlands (Western Power)
London (UK Power Networks)
Merseyside and North Wales (SP Energy)
North East (Northern Powergrid)
North West (Electricity NW)
North Scotland (SSE)
Central and Southern Scotland (SP Energy)
South East (UK Power Networks)
South (SSE)
South Wales (Western Power)
South West (Western Power)
Yorkshire (Northern Powergrid)
2051 2031
Source: UMAS modelling
Figure 11 shows that there is estimated to be a much more even distribution of demand growth over the DNO regions in the ambitious de-carbonisation scenario, with a major shift in demand in North West by 2050. This appears to be driven by a much stronger rate of conversion to battery electric propulsion of offshore vessels.
Figure 12 shows the estimated UK electricity demand by ship type in both the BAU and the ambitious de-carbonisation scenarios. It is estimated that container ship types appear to be the major contributor in both scenarios, but in the ambitious de-carbonisation scenario, the contribution of other ship types becomes more significant.

frontier economics 30
Reducing the UK Maritime Sector’s Contribution to Air Pollution and Climate Change
Figure 12 Annual UK demand for electricity by ship type, BAU (top) and ambitious de-carbonisation (bottom) scenarios
Source: UMAS modelling
Notes: Ship types are listed in the annex
4.3 Estimating peak energy demand at representative UK ports Peak energy demand from ports is what would determine the required enhancements to the grid (both the immediate connection and any wider network enhancements). This is because in order to ensure that customers are always supplied available network capacity must always exceed demand. This means that the system must be able to meet the maximum peak demand at any point in the day. So, if there is a surge in energy demand caused by ships demanding significant electricity concurrently, this could mean that enhancements to the distribution network, or to the transmission system, could be required.

frontier economics 31
Reducing the UK Maritime Sector’s Contribution to Air Pollution and Climate Change
To simulate the potential energy demand surge if ships were to plug in concurrently at a port, three different illustrative ports were considered, with different assumptions about the number of ships that concurrently require power either to recharge their batteries (full electric ships) or because they are using shore power. These assumptions are outlined in section 3.5.2. A detailed analysis for each port may result in different estimates as there may be significant variation relative to the assumed representative ports.
Figure 13 shows that it is estimated that the potential peak load in energy demand could be around 9 MW for a small port with just 5 ships concurrently demanding electricity, and approximately 80 MW for a large port if 50 ships were to be demanding electricity concurrently. For context, the maximum load (demand) in the UK during the winter of 2017/2018 was 52,279MW (BEIS, 2018). Consequently, it is estimated that a single, large UK port at peak demand could represent approximately 0.15% of total UK peak demand.
Figure 13 Estimated peak energy demands from battery ships and shore power at representative UK ports
Source: UMAS modelling. Note: Unit for the sizes of dry and tanker ship types is dwt, whereas, for container, it is TEU (twenty-foot
equivalent unit). Tanker (size 100,000 +dwt) indicates the largest ship seen berthing in each port. The estimate of potential peak of total demands does not include the ‘port infrastructure electrification’ demand
because it is assumed to have a relatively minor contribution (based on the results in Figures 8 and 9)
4.4 Insights and interpretation The total UK electricity supplied (gross) in 2018 was 308 TWh per year, and is forecast to rise to 341 - 371 TWh per year by 2035 (BEIS, 2018).
By 2035 therefore, it is estimated that electricity demand from port-related activities could represent around 0.03-0.04% of total UK electricity supplied under BAU, or

frontier economics 32
Reducing the UK Maritime Sector’s Contribution to Air Pollution and Climate Change
around 0.08-0.09% in the ambitious de-carbonisation scenario. Under BAU, Merseyside and North Wales are estimated to see the most rapid growth driven by the port of Liverpool, while in the ambitious decarbonisation scenario, a strong uptake by offshore and service vessels is estimated to drive the North West to grow the fastest.
In the case of the ambitious de-carbonisation scenario, the growth in annual electricity demand from port-related activities is estimated to be driven by ships with full electric propulsion from around 2040 onwards.
The concurrent power demand is highly sensitive to a range of factors, including in particular the time spent charging at berth. For the purposes of this analysis, 4.8 hours was chosen to reflect the balance between passenger ships typically recharging frequently for a short time and container ships that may need to remain in port much longer whilst they are loaded/unloaded.
A peak demand of 80 MW at any one port would be a substantial increment to port electricity demand. For context and as an example, local grid supply points and bulk power units around one of the UK’s largest major ports currently have maximum capacities of around 50-60 MW14. So, in such a scenario, there are several options available: if this demand is to be met then the distribution-level infrastructure would need to be reinforced, or ports could need to consider drawing power directly from the transmission grid, which would also involve connection costs. Or, alternatively, the port could generate its own power or rely on the stored power in ships’ batteries.
14 See https://www.ssen.co.uk/ContractedDemandMap/?mapareaid=1

frontier economics 33
Reducing the UK Maritime Sector’s Contribution to Air Pollution and Climate Change
5 POTENTIAL IMPLICATIONS FOR ENERGY SUPPLY INFRASTRUCTURE
5.1 Supply-side considerations If a port were to offer shore power - allow ships to charge their batteries while in port - and selected to power its infrastructure and machinery with electricity instead of fossil fuels, then the analysis above has shown that this can greatly increase its electricity requirements.
Of particular interest is the extent to which peak-load may increase because the extent of ‘concurrency’, i.e. large power requirements being placed on the system at the same time, is a critical driver of the extent to which enhancements to electricity connections may be needed.
This section considers the process that a port may need to follow if its electricity requirements were to increase as a result of increased shore power, ship battery charging and electrification of port-side machinery. In particular, it focuses on the process of exploring whether the distribution network connection15 requires an enhancement and, if so, what that involves.
This process involves several steps of engagement with the relevant DNO, which are highlighted in Figure 14 below:
Figure 14 Enhancing an electricity connection from the DNO
1. Discuss potential electricity requirements with the DNO
3. DNO and port agree appropriate option and costsPreferred option is selected and contribution to thecosts by the port are agreed
2. Feasibility studyCollate relevant information and discuss potential options for meeting electricity requirement.
4. Legal ConsiderationsPort and DNOconfirms agreements and contracts required for enhanced connection to distribution network.
5. Acceptance of offer to begin construction and commissioningOnce connection enhancement is accepted and legal requirements dealt with, the connection enhancement can be implemented.
Source: Compiled for the purposes of this study drawing on several references including Ofgem (2014) – ‘How to get
an electricity connection’, https://www.ofgem.gov.uk/publications-and-updates/how-get-electricity-connection and
SSE (2018) connections community guide, p30-p36 for general checklist , https://www.ssen.co.uk/GenerationConnectionsHome/
The type of enhancements required at the DNO level would depend on different factors including the location and capacity of sub-stations, whether local parties may also be intending to increase the demands on the DNO network, and the location of the port on the network (ports tend to be at the end of the network so can be harder to enhance). Furthermore, depending on the scale of increase in electricity required, enhancement to the transmission network may also be
15 A port could also connect directly to the transmission network as an alternative, depending on its energy requirements.

frontier economics 34
Reducing the UK Maritime Sector’s Contribution to Air Pollution and Climate Change
required. Interviews with expert stakeholders undertaken for this study have suggested that this may be needed if the additional electricity requirement exceeds perhaps around 100 MW.
The steps illustrated in Figure 14 are explored in more detail below.
1) Discuss potential electricity requirements with the DNO
DNOs operate on a regional basis and the port needs to identify and approach its own DNO. Engagement of the DNO is an important first step and is an opportunity to discuss the potential activities that a port wishes to undertake that increase its electricity requirements. This provides the DNO with relevant information that it may need when considering the extent to which enhancements to the infrastructure may be required. The DNO will consider these conversations in the context of it also having a strategic overview of other commercial users who may also be considering increases to their energy demands.
2) Feasibility study
A feasibility assessment can be requested from the DNO. The cost of this feasibility study would be incurred by the port and its purpose is to provide information to the port about its connection options to inform its investment decisions. The feasibility study assesses the particular characteristics of the port’s requirements, the port’s current connection and the existing capacity of the local distribution network. The feasibility study would deliver a set of outline options for the port and the DNO to consider, recognising the constraints of the current network and flexibility in the port’s peak demand requirements. This would provide an indication of the timescales and costs for any enhancements that may be required. The port can then work with the DNO to discuss which option would be most appropriate.
3) DNO and port agree appropriate option
A formal connection application would need to be submitted to the DNO. Applications require comprehensive data about the port’s generating equipment and its location (SSE, 2018).16
An assessment of the current infrastructure would be needed, for example, including the extent to which the sub-station capacity and locations are adequate or if they would require an upgrade, or even a new sub-station.
DNOs are required to make a connection offer to customers within 65 working days of receiving the application which contains the required information (SSE, 2018).17 The offer includes the payments that the port would need to make for the enhanced connection. This includes:
‒ Payments to cover any reasonable infrastructure expenses incurred by the DNO in making the connection.
16 For an example, see SSE Community Connections Guide (2018) https://www.ssen.co.uk/GenerationConnectionsHome/
17 See the relevant legislation - The Electricity (Connection Standards of Performance) Regulations 2015 – available at http://www.legislation.gov.uk/uksi/2015/698/made

frontier economics 35
Reducing the UK Maritime Sector’s Contribution to Air Pollution and Climate Change
‒ Reimbursement charges for previously connected customers who initially contributed to the cost of assets now being shared.18
‒ A wider network reinforcement cost, which is proportional to the additional capacity needed to accommodate the new connecting customer with the rest being paid by all consumers in the DNO region.
‒ Connection Offer Expenses to reimburse the DNO for costs it has incurred in developing and making the connection offer.
4) Legal considerations
The port has 3 months to accept the DNO offer. If it does, then this becomes the contract with associated terms, conditions and payments. An additional connection agreement with the DNO may also be required. Securing land rights may also be needed if the enhancement requires any infrastructure to be delivered on land owned by a third party.
Planning permission may also be required if, for example, a new sub-station is needed. This can add both time and cost to the process and would involve the port, the DNO, and the planning authorities.
5) Acceptance of offer to begin construction and commissioning
The timescales involved for enhancement to the network, where required, are likely to be very context specific. Interviews with experts carried out for this study suggest that an enhancement to the distribution network could be undertaken within months. A longer time period of potentially around 18 months could be required if a substation is needed; and very large scale enhancements can take potentially 2-5 years.
Local context and port-specific factors are likely to be key drivers of the cost and ease with which the network can be enhanced. Costs for connection enhancements can vary substantially depending on several factors: whether the existing network can accommodate the additional capacity needed; scale of enhancement required; where the connection is located; flexibility in the port’s electricity requirements; and the distance from the existing network. Costs may also vary due to the fact that some parts of connection construction must be carried out by the DNO, while others may be built by Independent Connection Providers (ICPs).19 Costs can only be considered on a case by case basis.
In addition, if there are other local demand users who are expected to increase their demands on the energy system or new connections such as housing developments then it may be possible to consider the extent to which the costs of some of the infrastructure enhancements can be shared.
5.2 Potential barriers to port electrification There are potential barriers for ports to consider when increasing their electricity requirements to support shore power and ship battery charging, plus electrification
18 Detailed in the Electricity (Connection Charges) Regulations 2002 (ECCRs). 19 Please see the following for more information on ICP’s:
https://www.ssen.co.uk/ConnectionsYouHaveaChoice/

frontier economics 36
Reducing the UK Maritime Sector’s Contribution to Air Pollution and Climate Change
of their own machinery where feasible. These can be considered in terms of the barriers identified in Frontier Economics et al. (2019c). The barriers are summarised below.
Split incentives to invest20 and co-ordination failures between ports and the shipping industry. Split incentives can occur when the costs of investing in an abatement option are incurred by one party but the benefits accrue to another (IEA, 2007). Ship owners are generally responsible for making investments in new technology, such as shore power or electrification, given they own the capital asset i.e. the ship. However, they may not realise all of the associated benefits, such as lower energy costs, because under certain types of contract, it is the charterer that pays for the fuel. This lowers the incentive to invest in cost-effective abatement options (Rehmatulla, 2014, Faber, et al., 2012). Charterers may also be deterred from making investments themselves. Even if they are able to make investments, their incentive to do so will be less than if they owned the vessel themselves. This is because any investment would only benefit them while they are leasing the ship. Future charterers of the ship would then enjoy the benefits of the investment made by the current charterer. This is relevant in this context because in order for the port to have the incentive to invest in the capacity to support shore power and ship electrification, it would need to have sufficient confidence that ships using its port will have invested in the relevant shore power and electrification technology. Intervention to provide information on the potential demand for shore power and the extent to which electrified ships could use particular ports could be helpful.
More widely, existing evidence (EEA, 2017) refers to a ‘chicken and egg’ problem whereby ship owners may be reluctant to invest in abatement options such as electrification until other actors such as ports put in place the supporting infrastructure. However, ports may not want to invest in the supporting infrastructure until the demand can be credibly demonstrated. This affected the development of liquefied natural gas bunkering infrastructure in northern Europe where the uptake of liquefied natural gas was hindered by the lack of bunkering facilities linked to uncertainty of future demand (Aronietis, et al., 2016). These co-ordination issues could be partially overcome if governments, trade bodies, or international representative groups can organise, promote and facilitate the diffusion of alternative technologies..
Imperfect information on abatement options can also cause a market failure (Golove & Eto, 1996). Shipowners and ports will make their investment decisions using the information that is available to them. In some cases this information may be unavailable or insufficient. For example, it may be that ports do not have access to the information that would allow them to make an informed decision about whether ensuring sufficient electricity provision from their port to support shore power or electrified ships is likely to be worthwhile for them to invest in. Intervention to make evidence available to inform such decisions could therefore be valuable.
Existing infrastructure and onboard technologies. If there is a difference in the electricity infrastructure offered at certain ports, then electrified ships could be restricted in terms of which routes they operate. There is currently a lack of a global standardised connection specification (physical connection and electricity
20 This is a variant of the Principal Agent Problem whereby one agent is responsible for making decisions on behalf of, or that impact on, another entity.

frontier economics 37
Reducing the UK Maritime Sector’s Contribution to Air Pollution and Climate Change
specification) for the ship to shore interface. This is most important, though not exclusively, for shore power connections where ships using these are (unlike battery electric ships that typically only travel shorter voyages) likely to be trading globally and therefore will need to make the connection in a number of different ports and countries. This is the subject of ongoing international cooperation, and so is likely to be addressed in due course. However, until it is, it can add cost and reduce access/availability. Government could support here by suggesting common standards for the connections between ship and shore, for example.
The cost of capital is an important consideration when investing in a new abatement option such as port electricity infrastructure (Sorrell, et al., 2004). If the cost of accessing capital is high (i.e. a high interest rate is charged) then this may affect the extent to which the benefits to the port investor exceed the costs. If private sector financing is prohibitively expensive, government intervention to provide subsidised loans may be considered. Innovation Loans are being used in other sectors, for example, by UK Research and Innovation.21
Regulatory constraints could also reduce the speed of uptake in some circumstances. The process of obtaining development consent is led by the port but is likely to involve both the DNO and the port. This would involve public consultation, assessment of environmental impacts, etc and could result in plans having to be altered to gain consent or even being refused consent. This places the investment, and associated planning activities, at risk. This risk could be mitigated by local planners identifying port related upgrades in their strategic plans, and by good planning practice by the applicants.
21 See for example, https://www.gov.uk/guidance/innovation-loans-general-guidance-for-applicants
frontier economics 38
Reducing the UK Maritime Sector’s Contribution to Air Pollution and Climate Change
6 QUALITY ASSURANCE The approach used in this analysis and the various steps taken for specific items of the analysis were subject to internal quality assurance processes. Quality assurance processes have been implemented for both the data and the modelling approach.
This analysis is intended to be a high level indicative analysis that provides some insights into the relative order of magnitudes of energy demands under different assumptions about electrification. As such, expert judgement has been used to formulate some assumptions and this has been noted where this is the case. The analysis is therefore considered proportionate and pragmatic, based on the best evidence available at the current time.
6.1 Quality assurance statement The time available to carry out this work was short. Every effort has been made to quality assure the work in a proportionate manner in line with the agreed timescales. Quality assurance has necessarily been proportionate but is considered adequate for the purposes of the analysis. Further detail is provided below, aligned with the requirements of the Department for Transport’s (DfT) Analytical Assurance Framework (DfT, 2014).
The modelling approach can be divided into two parts:
The first part includes the approach undertaken in Frontier Economics et al. (2019d). A number of outputs of Frontier Economics et al. (2019d) were used as inputs into this analysis such as: the take-up of shore power technology; the number of vessels in the UK fleet; and the specifications of full electric ships. The scenario modelling work carried out by UMAS to input to this analysis was subject to its own quality assurance process. A proportionate approach was employed here to mitigate potential modelling input and calculation errors. Further detail is available in Frontier et al. (2019d).
The second part includes the specific methods applied in this report. These have been quality assured by a review both of the method and of the results at several levels across the team undertaking the analysis.
Quality assurance of this method was provided through three main processes:
1. Immediate quality assurance and error-checking of analysis to ensure the work is as robust as possible.
2. Project Manager review of quantitative outputs to ensure consistency across all outputs and accuracy of findings.
3. Project Director oversight of key outputs to test emerging findings.
The data used for this process was gathered from a variety of sources and sense-checked with subject-matter experts. Where published data was not available, the input of subject-matter experts was used and sense-checked with secondary sources.

frontier economics 39
Reducing the UK Maritime Sector’s Contribution to Air Pollution and Climate Change
Findings from the analysis were also cross-checked with findings from alternative sources where available. The draft report and findings were critiqued by the DfT officials as well as officials in relevant other government departments. In addition, the results of all modelling work carried out as part of this piece of work were sense-checked by analysts at UMAS to ensure the findings are consistent with Frontier et al. (2019b). All staff who carried out the quantitative modelling have considerable expertise carrying out complex analytical work and have extensive experience using appropriate modelling tools. The reasonableness of the quantitative analysis is considered high, given the intended indicative nature of this work. UMAS scenario modelling, which has been subject to rigorous testing, was used as a primary input to this analysis.
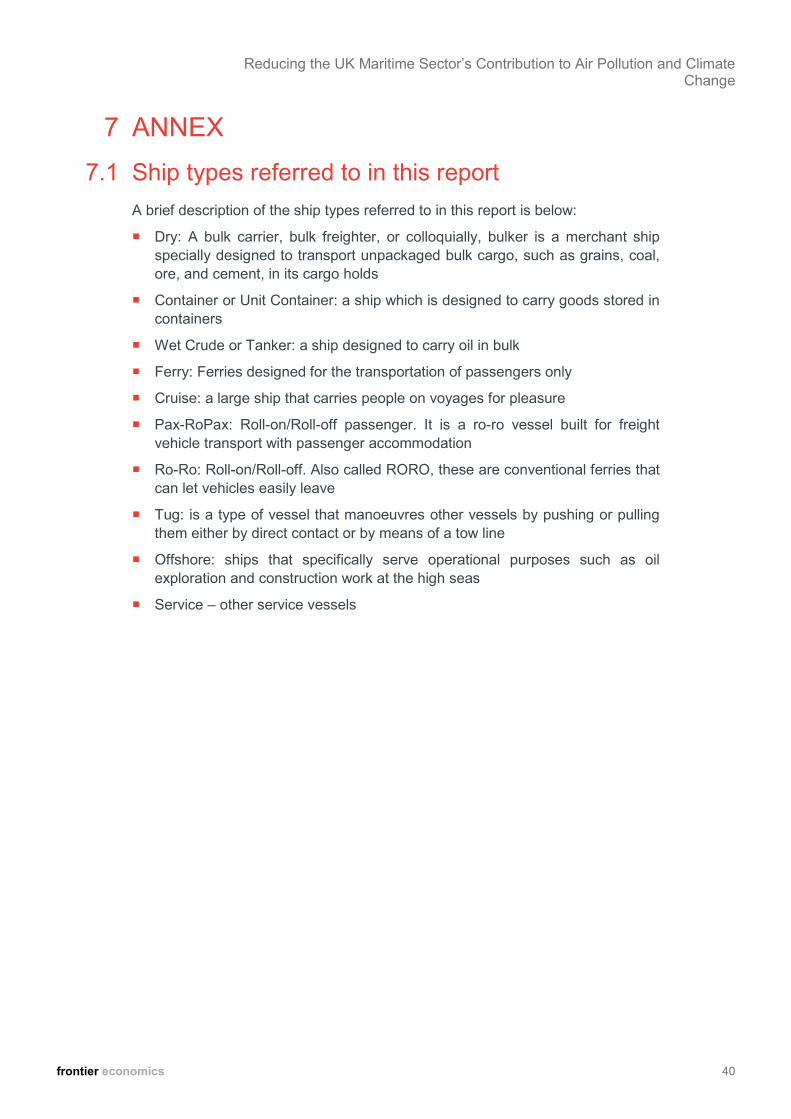
frontier economics 40
Reducing the UK Maritime Sector’s Contribution to Air Pollution and Climate Change
7 ANNEX 7.1 Ship types referred to in this report
A brief description of the ship types referred to in this report is below:
Dry: A bulk carrier, bulk freighter, or colloquially, bulker is a merchant ship specially designed to transport unpackaged bulk cargo, such as grains, coal, ore, and cement, in its cargo holds
Container or Unit Container: a ship which is designed to carry goods stored in containers
Wet Crude or Tanker: a ship designed to carry oil in bulk
Ferry: Ferries designed for the transportation of passengers only
Cruise: a large ship that carries people on voyages for pleasure
Pax-RoPax: Roll-on/Roll-off passenger. It is a ro-ro vessel built for freight vehicle transport with passenger accommodation
Ro-Ro: Roll-on/Roll-off. Also called RORO, these are conventional ferries that can let vehicles easily leave
Tug: is a type of vessel that manoeuvres other vessels by pushing or pulling them either by direct contact or by means of a tow line
Offshore: ships that specifically serve operational purposes such as oil exploration and construction work at the high seas
Service – other service vessels

frontier economics 41
Reducing the UK Maritime Sector’s Contribution to Air Pollution and Climate Change
8 REFERENCES Alliance to Save Energy, 2017. Eye on Infrastructure: Electrifying Ports Saves Fuel, Money, and Public Health. [Online] Available at: https://medium.com/@AllianceToSaveEnergy/eye-on-infrastructure-electrifying-ports-saves-fuel-money-and-public-health-aebea7207984
Almazán, J. L., 2015. Energy Supply to Ports and Shipping. [Online] Available at: https://www.onthemosway.eu/wp-content/uploads/2015/07/ENERGY-SUPPLY-TO-PORTS-AND-SHIPPING.pdf
Aronietis, R., Sys, C., van Hassel, E. and Vanelslander, T., 2016. Forecasting Port-level Demand for LNG as a Ship Fuel: The Case of the Port of Antwerp. Journal of Shipping and Trade, December, 1, p.2.
BEIS (Department for Business, Energy & Industrial Strategy), 2018. Digest of United Kingdom Energy Statistics 2018. [Online] Available at: https://www.gov.uk/government/statistics/digest-of-uk-energy-statistics-dukes-2018-main-report
BEIS (Department for Business, Energy & Industrial Strategy), 2019. Updated Energy and Emissions Projections: 2018. Annex J: Total Electricity Generation by Source. [Online] Available at: https://www.gov.uk/government/publications/updated-energy-and-emissions-projections-2018
Brenna, M., Foiadelli, F. and Longo, M., 2014. The Exploitation of Vehicle-to-Grid Function for Power Quality Improvement in a Smart Grid. IEEE Transactions on Intelligent Transportation Systems, 15(5), pp.2169-2177.
DfT (Department for Transport), 2014. The DfT Analytical Assurance Framework [Online] Available at: https://assets.publishing.service.gov.uk/government/uploads/system/uploads/attachment_data/file/353372/strength-in-numbers.pdf DfT (Department for Transport), 2017. Transport Statistics Great Britain 2017. Page141. [Online] Available at: https://assets.publishing.service.gov.uk/government/uploads/system/uploads/attachment_data/file/664323/tsgb-2017-print-ready-version.pdf
DfT (Department for Transport), 2018a. Aviation 2050: The Future of UK Aviation. A Consultation. [Online] Available at

frontier economics 42
Reducing the UK Maritime Sector’s Contribution to Air Pollution and Climate Change
https://assets.publishing.service.gov.uk/government/uploads/system/uploads/attachment_data/file/769695/aviation-2050-web.pdf
DfT (Department for Transport), 2018b. Port Freight Statistics: 2017. [Online] Available at: https://assets.publishing.service.gov.uk/government/uploads/system/uploads/attachment_data/file/762200/port-freight-statistics-2017.pdf
DfT (Department for Transport), 2018c. Port Level Statistics, PORT0301. [Online] Available at: https://assets.publishing.service.gov.uk/government/uploads/system/uploads/attachment_data/file/743026/port0303.ods
DfT (Department for Transport), 2018c. Port Level Statistics, PORT0304, Map of UK Ports by Traffic, Cargo and Route Type. [Online] Available at: https://assets.publishing.service.gov.uk/government/uploads/system/uploads/attachment_data/file/739805/port0304.ods
DfT (Department for Transport), 2018d. Port and Domestic Waterborne Freight Statistics: Data Tables (PORT). [Online]. Available at: https://www.gov.uk/government/statistical-data-sets/port-and-domestic-waterborne-freight-statistics-port
DfT (Department for Transport), 2019. Maritime 2050: Navigating the Future. [Online] Available at: https://assets.publishing.service.gov.uk/government/uploads/system/uploads/attachment_data/file/773178/maritime-2050.pdf
EEA (European Environment Agency), 2017. Aviation and Shipping – Impacts on Europe’s Environment Reporting Mechanism (TERM) Report. [Online] Available at: https://www.eea.europa.eu/highlights/europe2019s-transport-sector-aviation-and
Energy Networks Association (n.d.) Who is my Network Operator? [Online] Available at : http://www.energynetworks.org/info/faqs/who-is-my-network-operator.html
Faber, J., Behrends, B., Lee, D.S., Nelissen, D. and Smit, M., 2012. The Fuel Efficiency of Maritime Transport: Potential for Improvement and Analysis of Barriers. [Online] Available at: https://www.cedelft.eu/en/publications/download/1400

frontier economics 43
Reducing the UK Maritime Sector’s Contribution to Air Pollution and Climate Change
Frontier Economics, UMAS, E4tech and CE Delft, 2019a. Reducing the UK Maritime Sector’s Contribution to Climate Change and Air Pollution: Emission Reduction Options. A Report for the Department for Transport.
Frontier Economics, UMAS and CE Delft, 2019b. Reducing the UK Maritime Sector’s Contribution to Climate Change and Air Pollution: Take-up of Emission Reduction Options and their Impact on Emissions and Costs. Report for the Department for Transport.
Frontier, UMAS and E4tech, 2019c. Reducing the UK Maritime Sector’s Contribution to Climate Change and Air Pollution: Identification of Market Failures and other Barriers to the Commercial Deployment of Emission Reduction Options. Report for the Department for Transport.
Frontier Economics, UMAS, E4tech and CE Delft, 2019d. Reducing the UK Maritime Sector’s Contribution to Climate Change and Air Pollution: Take-up of Emission Reduction Options and their Impact on Emissions and Costs – Technical Annexes. A Report for the Department for Transport.
Golove, W. and Eto, J., 1996. Market Barriers to Energy Efficiency: A Critical Reappraisal of the Rationale for Public Policies to Promote Energy Efficiency. [Online] Available at: http://emp.lbl.gov/sites/all/files/lbnl-38059.pdf
IEA, 2007. Mind the Gap: Quantifying Principal-Agent Problems in Energy Efficiency. [Online] Available at: http://www.iea.org/publications/freepublications/publication/mind_the_gap.pdf
IEA ETSAP, 2011. Shipping Infrastructure. Technology Brief T17. [Online] Available at: https://iea-etsap.org/E-TechDS/PDF/T17_Shipping_Infrastructure_v4_final_gs.pdf
IMO (International Maritime Organisation), 2015. Third IMO Greenhouse Gas Study 2014. [Online] Available at: http://www.imo.org/en/OurWork/Environment/PollutionPrevention/AirPollution/Documents/Third%20Greenhouse%20Gas%20Study/GHG3%20Executive%20Summary%20and%20Report.pdf
Ofgem, 2014. How to Get an Electricity Connection. [Online] Available at: https://www.ofgem.gov.uk/publications-and-updates/how-get-electricity-connection

frontier economics 44
Reducing the UK Maritime Sector’s Contribution to Air Pollution and Climate Change
Ofgem, 2017. RIIO Electricity Distribution Annual Report 2016-17. Page 1. [Online] Available at: https://www.ofgem.gov.uk/system/files/docs/2017/12/riio-ed1_annual_report_2016-17.pdf
Rehmatulla, N., 2014. Market Failures and Barriers Affecting Energy Efficient Operations in Shipping. [Online] Available at: http://www.lowcarbonshipping.co.uk/images/Publications/PhdThesis/Rehmatulla%202014%20Market%20failures%20and%20barriers%20affecting%20energy%20efficient%20operations%20in%20shipping.pdf
Renewable UK, n.d. Wind Energy Statistics. [Online] Available at: https://www.renewableuk.com/page/UKWEDhome Sorrell, S., Schleich, J., Scott, S., O'Malley, E., Trace, F., Boede, U., Ostertag, K. and Radgen, P., 2000. Barriers to Energy Efficiency in Public and Private Organizations. Final Report, Project JOS3CT970022, Brussels: European Commission.
SSE, 2018. Connections Community Guide. [Online] Available at: https://www.ssen.co.uk/GenerationConnectionsHome/

frontier economics 45
Reducing the UK Maritime Sector’s Contribution to Air Pollution and Climate Change
www.frontier-economics.com
Figure 7.4.12: Annual Demand Breakdown for Londonderry, Scenario B