reducing victoria’s bushfire risk on public land · water companies and industry organisations,...
TRANSCRIPT

Reducing Victoria’s bushfire risk on public landFuel management report 2014–15

© The State of Victoria Department of Environment, Land, Water and Planning 2016
This work is licensed under a Creative Commons Attribution 4.0 International licence. You are free to re-use the work under that licence, on the condition that you credit the State of Victoria as author. The licence does not apply to any images, photographs or branding, including the Victorian Coat of Arms, the Victorian Government logo and the Department of Environment, Land, Water and Planning (DELWP) logo. To view a copy of this licence, visit http://creativecommons.org/licenses/by/4.0/
Printed by Impact Digital, Brunswick.
ISBN 978-1-74146-952-3 (Print) ISBN 978-1-74146-953-0 (pdf)
Disclaimer This publication may be of assistance to you but the State of Victoria and its employees do not guarantee that the publication is without flaw of any kind or is wholly appropriate for your particular purposes and therefore disclaims all liability for any error, loss or other consequence which may arise from you relying on any information in this publication.
AccessibilityIf you would like to receive this publication in an alternative format, please telephone the DELWP Customer Service Centre on 136 186, email [email protected] or via the National Relay Service on 133 677 www.relayservice.com.au. This document is also available on the internet at www.delwp.vic.gov.au
Front cover image: Planned burning in grasslands @ Paul Hitch, Parks Victoria

I
Contents
Introduction� 2
Bushfire�risk�management�reporting�metrics� 4
Residual bushfire risk ................................................................................................................................................................... 5
Ecosystem resilience..................................................................................................................................................................... 5
Tolerable fire intervals ............................................................................................................................................................ 5
Geometric mean abundance .................................................................................................................................................. 5
Vegetation growth stage structure ......................................................................................................................................... 5
Community engagement ..............................................................................................................................................................7
Risk-based planning outputs ........................................................................................................................................................7
Burn preparation .......................................................................................................................................................................... 8
Hazardous tree removal ............................................................................................................................................................... 8
Smoke management..................................................................................................................................................................... 9
Fuel management activities .........................................................................................................................................................9
Monitoring, evaluation and reporting ........................................................................................................................................10
Cost ............................................................................................................................................................................................ 10
Performance rating ..................................................................................................................................................................... 11
Victoria� 12
Residual bushfire risk ................................................................................................................................................................. 12
Tolerable fire intervals ................................................................................................................................................................13
Bushfires ............................................................................................................................................................................... 17
Planned burning ................................................................................................................................................................... 17
Vegetation growth stage structure .............................................................................................................................................18
Case Study: Foothills Fire and Biota project: research to inform ecological fire management ............................................20
Community engagement ............................................................................................................................................................22
Risk-based planning outputs ......................................................................................................................................................23
Strategic bushfire management plans .................................................................................................................................. 23
Burn preparation ........................................................................................................................................................................ 23
Case Study: A collaborative approach to planned burning on public and private land ........................................................24
Hazardous tree removal .............................................................................................................................................................25
Fuel management activities .......................................................................................................................................................26
Weather and the area that was treated by planned burning ...............................................................................................28
Emergency management response ...................................................................................................................................... 28
Planned burn breaches ........................................................................................................................................................ 28
Monitoring ................................................................................................................................................................................. 30
Cost ............................................................................................................................................................................................ 30

II
Regions� 32
Introduction ............................................................................................................................................................................... 32
Barwon�South�West�region� 33
Case Study: Stakeholder input into strategic bushfire management planning ....................................................................34
Community engagement ............................................................................................................................................................35
Burn planning and preparation ..................................................................................................................................................36
Fuel management activities .......................................................................................................................................................36
Monitoring ................................................................................................................................................................................. 36
Gippsland�region� 37
Case Study: Open and consistent dialogue with the community is vital for delivering planned burning ............................38
Community engagement ............................................................................................................................................................39
Burn planning and preparation ..................................................................................................................................................39
Fuel management activities .......................................................................................................................................................40
Monitoring ................................................................................................................................................................................. 40
Grampians�region� 41
Case Study: Engaging in an iconic tourism landscape close to Melbourne ..........................................................................42
Community engagement ............................................................................................................................................................43
Burn planning and preparation ......................................................................................................................................................... 43
Fuel management activities .......................................................................................................................................................44
Monitoring ................................................................................................................................................................................. 44
Hume�region� 45
Case Study: Effective stakeholder relationships help deliver record program .....................................................................46
Community engagement ............................................................................................................................................................47
Burn planning and preparation ......................................................................................................................................................... 47
Fuel management activities .......................................................................................................................................................48
Monitoring ................................................................................................................................................................................. 48
Loddon�Mallee�region� 49
Case Study: Working with volunteer brigades to reduce the number of needless callouts to burns ..................................50
Case Study: Evaluating PHOENIX RapidFire .......................................................................................................................... 51
Case Study: Less irrigation, more risk ................................................................................................................................... 52
Community engagement ............................................................................................................................................................53
Burn planning and preparation ..................................................................................................................................................53
Fuel management activities .......................................................................................................................................................53
Monitoring ................................................................................................................................................................................. 54
Port Phillip region ....................................................................................................................................................................... 55
III
Case Study: Engaging with industry groups to develop the East Central Strategic Bushfire Management Plan ..................56
Community engagement ............................................................................................................................................................57
Burn planning and preparation ..................................................................................................................................................57
Fuel management activities .......................................................................................................................................................57
Monitoring ................................................................................................................................................................................. 58
References� 59
Appendix�1:�Accounting�framework�for�bushfire�fuel�management�treatments� 60
Introduction ............................................................................................................................................................................... 60
Policy .......................................................................................................................................................................................... 60
Accounting unit .................................................................................................................................................................... 60
Planned area ........................................................................................................................................................................ 60
Bushfire fuel treatment objective ........................................................................................................................................ 60
Treated area ......................................................................................................................................................................... 60
Bushfire fuel management treatments ................................................................................................................................ 61

2 Reducing Victoria’s bushfire risk on public land | Fuel management report 2014–15
IntroductionVictoria is one of the most fire-prone areas in the world. In past decades, Victorians have seen the disastrous effects that bushfires can have on communities — on people, properties, our economy and the environment.
Under the Forests Act 1958, and in line with the Code of Practice for Bushfire Management on Public Land 2012 (the code), the Department of Environment, Land, Water and Planning (DELWP) is responsible for managing bushfires on public land.
DELWP works with Parks Victoria and with a broad range of organisations and individuals—including other Victorian Government agencies, local governments, emergency management organisations, environmental organisations, water companies and industry organisations, and with traditional owners through land management partnerships—to manage bushfire risk on almost 8 million hectares (ha) of public land on behalf of all Victorians. Together, we aim to identify and implement the smartest and most effective ways to reduce the risk of bushfires—including when, where and how to conduct planned burning—to safeguard the things people care most about in their local communities.
The code and recommendation 57 of the Victorian Bushfires Royal Commission require DELWP to report annually about the efficiency of its fuel management activities. This fuel management report fulfils these requirements by reporting on fuel management activities, and on progress toward achieving the code’s two objectives, in 2014–15. The code’s two objectives are to:
• minimise the impact of major bushfires on human life, communities, essential and community infrastructure, industries, the economy and the environment. Human life will be afforded priority over all other considerations
• maintain or improve the resilience of natural ecosystems and their ability to deliver services such as biodiversity, water, carbon storage and forest products.
DELWP defines ecosystem resilience as an ecosystem’s capacity to absorb both natural and management-imposed disturbance but still retain its basic structure, function and identity.
In 2014–15, DELWP published:
• the Bushfire Monitoring, Evaluation and Reporting Framework for Bushfire Management on Public Land (the MER Framework), which is a high-level guide for land managers to monitor, evaluate and report on the effectiveness of bushfire management on public land
• strategic bushfire management plans (SBMPs) for three of Victoria’s seven bushfire risk landscapes, and finalised for publication plans for the remaining four.
Both the MER Framework and the SBMPs are requirements of the code and help DELWP meet the two code objectives. This report provides further information about both initiatives.
This report follows broadly the same format as the two previous fuel management reports. This format will evolve in future years to more closely reflect the strategic bushfire management planning process and the MER Framework, as they are implemented.

Reducing Victoria’s bushfire risk on public land | Fuel management report 2014–15 3
Fuel management is one of several strategies in the code to reduce bushfire risk, alongside:
• prevention, to minimise the occurrence of bushfires, particularly those of human origin
• preparedness, so we are ready for bushfires and can better respond to them when they occur
• response, to ensure a timely and adequately resourced initial attack on all detected bushfires on public land
• recovery, to ensure we identify risks and damage resulting from bushfires and conduct rehabilitation where appropriate.
This report, and the initial scope of the MER Framework, is limited to fuel management on public land. This scope is in line with the Victorian Government’s response to the recommendations of the 2009 Victorian Bushfires Royal Commission.
On 19 November 2015 the government responded to the Inspector-General for Emergency Management’s (IGEM’s) 2015 Review of performance targets for bushfire fuel management on public land, setting out a new approach to reducing the risk of bushfire in Victoria. This includes a move to a risk reduction target for fuel management on public land from July 2016. This report provides information about DELWP’s performance for 2014–15 and for this reason does not incorporate this change in approach.
Over the next few years, with input from communities and stakeholders, DELWP expects to expand and document its risk-based planning to include strategies for bushfire prevention, preparedness, response and recovery. We will also improve how we identify and manage risk to the full range of emergency impact categories (people, infrastructure, public administration, environment, economy and social setting) explained in the code. As this occurs, we will expand the MER Framework accordingly. We will also expand our reporting to better account for outcomes, activities and impacts to the community and the environment.
4 Reducing Victoria’s bushfire risk on public land | Fuel management report 2014–15
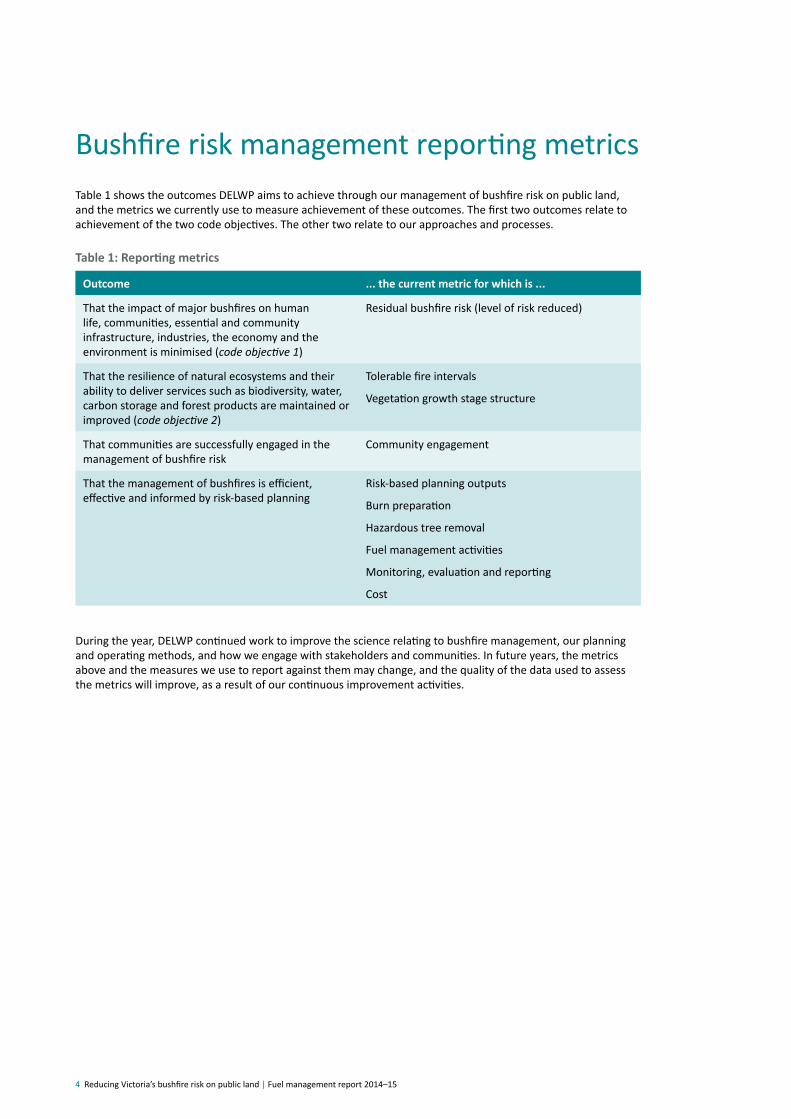
Bushfire risk management reporting metricsTable 1 shows the outcomes DELWP aims to achieve through our management of bushfire risk on public land, and the metrics we currently use to measure achievement of these outcomes. The first two outcomes relate to achievement of the two code objectives. The other two relate to our approaches and processes.
Table�1:�Reporting�metrics�
Outcome ... the current metric for which is ...
That the impact of major bushfires on human life, communities, essential and community infrastructure, industries, the economy and the environment is minimised (code objective 1)
Residual bushfire risk (level of risk reduced)
That the resilience of natural ecosystems and their ability to deliver services such as biodiversity, water, carbon storage and forest products are maintained or improved (code objective 2)
Tolerable fire intervals
Vegetation growth stage structure
That communities are successfully engaged in the management of bushfire risk
Community engagement
That the management of bushfires is efficient, effective and informed by risk-based planning
Risk-based planning outputs
Burn preparation
Hazardous tree removal
Fuel management activities
Monitoring, evaluation and reporting
Cost
During the year, DELWP continued work to improve the science relating to bushfire management, our planning and operating methods, and how we engage with stakeholders and communities. In future years, the metrics above and the measures we use to report against them may change, and the quality of the data used to assess the metrics will improve, as a result of our continuous improvement activities.

Reducing Victoria’s bushfire risk on public land | Fuel management report 2014–15 5
Residual�bushfire�riskThe best current available metric of bushfire risk for the purpose of fuel management is residual bushfire risk. This is the amount of risk left in the landscape after fuel has been reduced by bushfire and fuel management, expressed in terms of potential bushfire impacts on life and property. For example, 80% residual bushfire risk means that the risk of bushfire impacts on life and property—on average, across all land—is 20% less than it would have been had there never been bushfires or fuel management to reduce the fuel load. Fuel management is just one strategy for reducing bushfire risk. It may be the best strategy in some areas. In others, it may be less effective or lead to unacceptable impacts on people, businesses and ecosystems.
Residual bushfire risk changes constantly as fuels are reduced by bushfires and fuel management activities, and as fuels accumulate over time.
DELWP uses PHOENIX RapidFire bushfire simulation software to calculate residual bushfire risk at both the state and regional level. We base simulations on worst-case weather conditions (similar to those on Ash Wednesday 1983 and Black Saturday 2009). Most losses from bushfires in Victoria have occurred under these sorts of conditions, particularly when there has been a strong wind-change, so it is important that the residual bushfire risk metric focuses on the potential impacts of bushfires under such severe conditions.
Combining fire science with the latest modelling technology and in-depth local knowledge equips us to analyse risk, monitor trends and report on results with a level of accuracy not previously possible.
The residual bushfire risk metric addresses the key evaluation question in the MER Framework about the effectiveness of our fuel management strategies in reducing bushfire risk to life and property.
DELWP’s Victorian Bushfire Risk Profiles report describes in more detail how DELWP uses PHOENIX RapidFire to simulate bushfires and calculate residual risk.
Ecosystem resilienceDELWP increasingly uses three measures of ecosystem resilience at a landscape scale:
• tolerable fire intervals (TFIs)
• the geometric mean abundance (GMA) of fauna or flora species in a community
• the vegetation growth stage structure (GSS).
TFI is currently the best-documented and researched measure of ecosystem resilience. In this report, we also include preliminary data about vegetation GSS. DELWP is undertaking research on GMA in the Barwon Otway and East Central bushfire risk landscapes, before using this measure for bushfire management planning. Thus only TFI and GSS are reported in this report, as GMA is still being developed.
Tolerable�fire�intervalsTFIs are the minimum and maximum recommended time intervals between fire events for a particular ecological fire group (EFG). An EFG is a group of ecological vegetation classes with common ecological requirements for fire, and common fire behaviour characteristics. Burning regularly outside these intervals increases the risk of fundamental changes occurring in the structure and functioning of the vegetation.
DELWP uses this measure to evaluate the extent to which fuel management has maintained or improved the resilience of natural ecosystems. It addresses the key evaluation questions in the MER Framework about the effectiveness of fuel management strategies in maintaining the desired amount of landscape within TFI, and in maintaining or improving populations of species that are sensitive to fire. The MER Framework lists the assumptions that DELWP tests through key evaluations questions around the metrics for bushfire residual risk and ecosystem resilience.
Geometric mean abundanceThe GMA of species in a community takes into account the relative abundance of all known species in an ecological community, and provides a robust index of biodiversity associated with community viability. DELWP uses the GMA of species in a community to determine the desired GSS.
Vegetation�growth�stage�structureVegetation GSS relates to the different stages of vegetation succession. The vegetation GSS depends on when it was last burnt or subject to other disturbance. DELWP assumes that maintaining a diversity of growth stages and habitats across landscapes, and therefore a diversity of species, will help maintain or improve ecosystem resilience. We manage fuel to ensure there is an acceptable mix of growth stages in the landscape, and to protect important areas of older growth stages.
The metric addresses the key evaluation question in the MER Framework about the effectiveness of fuel management in achieving the desired GSS for an EFG. The other key evaluation questions addressed by this metric are whether fuel management activities have helped maintain key habitat attributes and an ecological goal GSS, and contributed to the maintenance of populations of fire-sensitive species.

6 Reducing Victoria’s bushfire risk on public land | Fuel management report 2014–15
From this year and retrospectively, the growth stage classes provided by Cheal (2010) have been simplified to four growth stages: Juvenile, Adolescent, Mature and Old. These categories are more amenable to fire planning and are intended to reflect the major shifts in habitat structure and, in turn, abundance of fauna as vegetation succession occurs. The revised growth stage classes encompass these groupings in Cheal (2010):
• Juvenile (Renewal, Juvenility, Founding): from immediate post-fire renewal to establishment, including the period before which the full floristic complement of species is reproductive
• Adolescent (Adolescence): the vegetation is relatively young, and the full complement of species is reproductive, but not at the rate characterising mature vegetation
• Mature (Early Maturity, Maturity, Vigorous Maturity, Stasis, Established): including when dominant species are fully reproductive through to stasis, when vegetation structure and reproductive capacity stabilise
• Old (Waning, Senescence): characterised by declining reproduction of the dominant species and decreasing propagule banks; if left undisturbed, vegetation may become senescent and is then unlikely to be reconstituted following fire.
Table 2 shows, for the ecosystem resilience metrics, the measures we use to report on achievement.
Table�2:�Ecosystem�resilience�measures
Measure What it is
Number of hectares above, below and within TFI The area (in ha) that is currently recorded above, below or within TFI based on the time since it was last burnt by bushfire or planned burning
Number of hectares burnt while below minimum TFI The area (in ha) burnt by bushfires, planned burning or a combination of the two, while below minimum TFI
Number of hectares of each fuel management zone treated by planned burning while below minimum TFI
The area (in ha) in each fuel management zone treated by planned burning while below its minimum TFI
Proportion of each fuel management zone treated by planned burning while below minimum TFI
The proportion of each fuel management zone treated by planned burning while below its minimum TFI
The extent of vegetation in the different growth stage categories
The area (in ha) currently recorded within each growth stage (Juvenile, Adolescent, Mature and Old) based on the time since it was last burnt by bushfire or planned burning

Reducing Victoria’s bushfire risk on public land | Fuel management report 2014–15 7
Community�engagementVictoria’s emergency management arrangements, given form through the Victorian Government’s Emergency Management Reform White Paper and subsequent legislation, aim to build community resilience through increased participation and shared responsibility. Community engagement covers a range of activities, from information exchange to community involvement in decision-making, that give effect to this aim.
The two-way exchange of information and ideas that occurs through community engagement improves the quality of information available to both DELWP and local communities, and builds respect for the priorities and perspectives of all parties. This helps DELWP, its partners and local communities make well-informed decisions.
Crucially, it is how the whole community—including householders, businesses and government agency staff—can understand their various responsibilities and be empowered in a spirit of cooperation to discharge them.
The community engagement measure addresses:
• the code’s principles for bushfire management on public land: that the community be involved in bushfire management; and that bushfire mitigation and management is a shared responsibility between the community, industries, land and fire agencies and government
• the code’s requirements that DELWP better use community knowledge to guide bushfire management strategies and activities; and that it use a range of methods to engage the community in bushfire management planning
• the objectives of DELWP’s Bushfire Management Engagement Strategy 2014–18: to build the understanding of stakeholders and communities about bushfire risk and their roles and responsibilities managing it; and to incorporate community values into decision-making about bushfire-related policy, planning and investment.
We do not use a numerical measure for the community engagement metric, but describe the year’s activities.
Risk-based�planning�outputsRisk-based planning includes strategic planning (resulting in long-term fuel management strategies), operational planning (resulting in rolling three-year fire operations plans [FOPs]) and individual, tactical burn planning (resulting in burn plans).
SBMPs are the starting point for an adaptive bushfire management approach and will be continuously improved by the learnings developed through implementing and evaluating strategies.
Each site identified in a FOP and selected for planned burning must:
• have a burn plan developed
• be made ready for burning.
DELWP develops burn plans and prepares sites for a much greater total area than the target area for fuel management. This gives us operational flexibility by ensuring that sufficient sites are ready to burn when conditions are suitable.
DELWP works with communities and stakeholders when developing burn plans and scheduling burns, to minimise impacts on local events (such as festivals), local animal and plant populations, and economic events (such as grape harvesting).
Table 3 shows, for risk-based planning, the measures we use to report on achievement.
Table�3:�Risk-based�planning�measures
Measure What it is
Strategic bushfire management plan A published strategic document that explains the fuel management strategy and other actions for a risk landscape
Target area for fuel management (TAFM) The total area (in ha) on which we aimed to manage fuel in 2014–15
Area with burn plans developed (over the three-year FOP) The total area (in ha) of all sites identified in a FOP for which burn plans were developed. These may include burns over the three years of the FOP to provide greater flexibility.

8 Reducing Victoria’s bushfire risk on public land | Fuel management report 2014–15
Burn�preparationMaking a site ready for burning can include building a mineral earth break, slashing, applying foam or retardants, managing hazardous trees, removing cuttings from adjoining areas and within spotting distance, and burning adjoining areas.
Hazard tree management includes the identification and assessment of hazardous trees that may be present in and around the planned burn where staff are likely to be working. Treatment can include protection and removal.
Table 4 shows, for burn preparation, the measures we use to report on achievement.
Hazardous�tree�removalBushfires over the last decade have left many trees in Victoria severely damaged. In 2014, DELWP introduced a three-year program to remove fire-damaged and hazardous trees in high-risk and priority areas in state forests and national parks. Hazardous trees are trees that are dead, dying, damaged or decaying and can present a significant threat to the safety of public land users. DELWP and Parks Victoria are working in critical areas to reduce these hazards to help make our state forests and parks safer. The trees we fell are in most cases left on the ground to provide habitat and vital nutrients to the local environment.
Table 5 shows, for hazardous tree removal, the measure we use to report on achievement.
Table�4:�Burn�preparation�measures
Measure What it is
Area for which burns were planned and sites prepared The total area (in ha) of all burn sites with current burn plans and prepared for ignition
Proportion of area for which burns were planned and prepared
The proportion (as a percentage) of the total area of all burn sites with current burn plans and completed preparation work
Table�5:�Hazardous�tree�removal�measure
Measure What it is
Hazardous tree removal Number of kilometres along which hazardous trees have been removed
Closure of Mt Sturgeon walking track © DELWP Box Ironbark Forest, Strathfieldsaye © DELWP

Reducing Victoria’s bushfire risk on public land | Fuel management report 2014–15 9
Smoke�managementDELWP works closely with Environment Protection Authority Victoria (EPA) and other partner agencies to better manage the impacts of smoke on Victorian communities. A smoke management framework is in place and standards to support reporting against the framework are currently being developed. We aim to begin reporting against this framework from next year.
Fuel�management�activitiesFuel management reduces the amount of fuel available to a bushfire, which can reduce its intensity and rate of spread and so improve opportunities for firefighters to suppress it. Fuel management is the most effective way to manage fuel on large areas of public land, and the main way we reduce bushfire risk.
Fuel management includes planned burning—lighting and managing planned fires in the landscape during periods of lower bushfire risk—to reduce the quantity of leaf litter, twigs, bark and undergrowth. It also includes mechanical treatments such as mowing, slashing, mulching and using herbicides. For fuel management purposes, public land in Victoria is classified into four fire management zones:
• Asset Protection Zone: an area around properties and infrastructure where we do intensive fuel management to provide localised protection, to reduce radiant heat and ember attack on life and property in the event of a bushfire
• Bushfire Moderation Zone: an area where we manage fuel hazard to reduce the speed and intensity of bushfires, and to protect nearby assets, particularly from ember attack in the event of a bushfire
• Landscape Management Zone: an area where we manage fuel to reduce residual bushfire risk, to minimise the impact of major bushfires, improve ecosystem resilience, and for other purposes (such as to regenerate forests and protect water catchments)
• Planned Burning Exclusion Zone: an area where we try to avoid planned burning, mainly because ecological assets in this zone cannot tolerate fire.
We conduct planned burning to reduce fuel, maintain or improve ecological resilience and help regenerate forests. We also undertake other fuel management activities to establish and maintain a network of strategic fuel breaks: strips of land with less fuel available to burn during a bushfire, and where we can back burn ahead of an approaching bushfire.
Planned burns are classified as fuel-reduction burns, ecological burns and other burns. Other burns include regeneration burns after logging and the burning of heaps. DELWP and VicForests complete a great number of regeneration and heap burns each year which contribute only marginally to the total area treated by planned burning.
DELWP currently has an annual target for the number of hectares to be fuel managed. The state target is determined through the state Budget process each year and the allocation of hectares to each region for 2014–15 was based on risk analysis.
Table 6 shows, for the fuel management activities metric, the measures we use to report on achievement. The accounting framework for fuel management activities is explained in Appendix 1.
Mallee © DELWP Fuel Management Activities © DELWP

10 Reducing Victoria’s bushfire risk on public land | Fuel management report 2014–15
Monitoring,�evaluation�and�reportingTo measure if our bushfire management is meeting the code objectives, DELWP undertakes monitoring, evaluation and reporting. We measure the effectiveness of our bushfire management so we can improve our knowledge and make better decisions about how to best manage bushfires. The MER Framework provides a system for identifying knowledge gaps, targeting those knowledge gaps with monitoring, improving knowledge through evaluation of the data and communicating that knowledge through reporting. Monitoring is a key part of our risk-based approach to bushfire management, and is addressed through the key evaluation questions in the MER Framework.
CostDuring the year, DELWP produced new internal guidelines to improve budgeting and accounting for fuel management activities. The guidelines clearly separate the direct and indirect costs of fuel management activities as well as fuel management activities from other fire and emergency management activities. The guidelines are intended to help us identify, with much greater precision than at present, the direct and indirect costs of a planned burn, our costs for other fuel management methods, and our costs helping Country Fire Authority (CFA) and local governments manage bushfire fuel on private land.
Direct costs can be assigned to an individual burn while indirect costs cannot. Direct costs include overtime and allowances, plant and aircraft hire, materials and accommodation and meals.
Table 7 shows, for the Cost metric, each of the indirect cost items under the new guidelines, what they include funding for, and the metric in this report to which each relates.
Table�6:�Measures�of�fuel�management�activities
Measure What it is
Target area for fuel management (TAFM) The total area (in ha) we aimed to treat with fuel management activities in 2014–15
Area treated by planned burning The total area (in ha) that we treated by planned burning
Proportion of TAFM treated by planned burning The proportion (as a percentage) of the TAFM that was treated by planned burning
Area treated by other fuel management methods The total area (in ha) we treated with fuel management methods other than planned burning, e.g. slashing
Area suitable for planned burning burnt by bushfires The total area (in ha) in an asset protection zone, bushfire moderation zone or landscape management zone that was burnt by bushfires, including by planned burn breaches that turned into bushfires. DELWP does not count this area (except for the subset below) toward the target because although the bushfire did reduce fuel in the area, we had no current plans to do so.
(including area planned for burning on a current FOP): this is a subset of the item above and is accounted for separately from the item above
The total area (in ha) included in a FOP for planned burning but which was burnt by bushfires. DELWP counts this area toward the target because had bushfires not reduced fuel in the area, we planned to do so.
Total fuel-reduced area (actual) Two totals are provided:
• the total fuel-reduced area (in ha)
• the total fuel-reduced area (in ha) that was included for fuel reduction on a current FOP.
The difference between the two totals is that the second does not include area burnt by bushfires that was not on a current FOP.

Reducing Victoria’s bushfire risk on public land | Fuel management report 2014–15 11
Table�7:�Indirect�cost�items�under�new�accounting�guidelines�for�fuel�management�activities
Metric Cost item Includes�funding�for�...
Burn planning and preparation
Strategic planning Risk analysis, planning guidance, developing strategic bushfire management plans
Operational planning Fire operations plans
Fuel management activities
Capability Emergency event training (including preparing materials and attending courses)
Resource management Payroll for non-senior managers, partnerships, incident management team, Incident Control Centre, State Control Centre, regional coordination centres
Equipment and infrastructure Heavy and light plant, vehicles, road maintenance (but not for expenditure on assets)
Business management Administration, procurement, contract management, payroll and other overheads for senior managers
Monitoring, evaluation and reporting
Monitoring, evaluation and reporting Strategic research, monitoring, evaluation and biodiversity programs
Community engagement
Engagement Engagement at the state, strategic and local levels (but not the individual burn level)
Performance�ratingThis report uses three-bar icons to provide an at-a-glance summary of our performance. Table 8 shows what each icon means.
Table�8:�Summary�icons
Icon Meaning
We fully achieved our planned activities and outcomes
We achieved to the best possible extent our planned activities and outcomes
We did not achieve our planned activities and outcomes, but the risks arising from this non-achievement are manageable
We did not achieve our planned activities and outcomes

12 Reducing Victoria’s bushfire risk on public land | Fuel management report 2014–15
Victoria
� Residual�bushfire�riskFigure 1 shows Victoria’s modelled residual bushfire risk (based on the state’s recorded fire history from 1980–2015) and the residual bushfire risk we expect from 2015–18 as FOPs are implemented. The current level of residual bushfire risk in Victoria is 65% as a result of our bushfire management program.
Figure 1 illustrates that residual bushfire risk:
• fell steeply during the first half of the 1980s, largely as a result of the 1983 Ash Wednesday bushfires
• rose steadily from the 1980s through to the early 2000s as fuel re-accumulated across the landscape
• was substantially reduced as fuel was reduced by major bushfires in the 2000s (particularly the 2009 Black Saturday bushfires); unfortunately, reduced risk came at the cost of a significant loss of life and property
• has begun to gradually rise in recent years as fuel re-accumulates following the major bushfires of the 2000s
• is projected to decline moderately from current levels over the next three years if the fuel reduction activities on the current FOP are carried out— however, if these activities are not carried out, residual risk is projected to rise steeply over the same time period.
Within TFI Below minimum TFI
Year
1980
1981
1982
1983
1984
1985
1986
1987
1988
1989
1990
1991
1992
1993
1994
1995
1996
1997
1998
1999
2000
2001
2002
2003
2004
2005
2006
2007
2008
2009
2010
2011
2012
2013
2014
2015
2016
2017
2018
1,800,000
1,600,000
1,400,000
1,200,000
1,000,000
800,000
600,000
400,000
200,000
0
100
90
80
70
60
50
40
30
20
10
0
Are
a (H
a)Residual risk (%
)
Figure�1.
Total recorded fi re area
Historical residual risk
Projected residual risk without fuel reducti on
Projected residual risk with maximum planned fuel reducti on
Year
1991
1992
1993
1994
1995
1996
1997
1998
1999
2000
2001
2002
2003
2004
2005
2006
2007
2008
2009
2010
2011
2012
2013
2014
2015
100
90
80
70
60
50
40
30
20
10
0
Prop
orti o
n (%
)
Figure�3.
No fi re history Above maximum TFI
Figure�1:�Residual�bushfire�risk�profile�for�Victoria,�from�1980–2018�Residual risk is the amount of bushfire risk which remains in the landscape after fuel has been reduced by bushfires and fuel management activities. The chart shows historical levels of residual risk (red solid line) as modelled between 1980–2015, based on recorded fire history. The vertical bars show the total area (ha) of fire recorded each year over the same time period. Also shown are projected levels of residual risk over the next three years for two scenarios: (i) if no fuel reduction is carried out (dashed red line), and (ii) if the maximum level of fuel reduction on the current FOP is carried out (green line).

Reducing Victoria’s bushfire risk on public land | Fuel management report 2014–15 13
� Tolerable�fire�intervals
2002 2003
2006 2009
2014 2015
Below minimum TFI Within TFI Above maximum TFI Private land Public land with no
recorded fire history
Figure�2:�TFI�status�of�vegetation�on�Victorian�public�land�for�selected�years�from�2002–2015�Different colours represent vegetation in a different status: below minimum TFI (red), within TFI (light blue) and above maximum TFI (dark blue). Private land is shown in light grey and public land with no recorded fire history in dark grey.

14 Reducing Victoria’s bushfire risk on public land | Fuel management report 2014–15
Analysis and mapping of TFIs on public land across the state at the end of 2014–15 showed little change from last year (Figures 2 and 3). The area below the minimum TFI remained at 52%, primarily as a legacy of the 2003, 2006–07 and 2009 bushfires. Owing to the relatively long minimum TFIs for many of the bushfire-affected vegetation types (ranging from 15–80 years), this trend will continue for some time.
The relatively high (24%) proportion of public land with no recorded fire history means the TFI and growth stage data should be used with caution; we cannot infer anything about the TFI and GSS of public land with no recorded fire history.
Figures 4, 5 and 6 show the extent to which Victorian public land has been burnt while its status was below minimum TFI.
When fire occurs in areas that are already below minimum TFI, there may be increased ecological risks and direct, negative impacts on ecosystem resilience. The area burnt while below minimum TFI each year can result from bushfires, planned burning or a combination of the two.

Reducing Victoria’s bushfire risk on public land | Fuel management report 2014–15 15
Within TFI Below minimum TFI
Year
1980
1981
1982
1983
1984
1985
1986
1987
1988
1989
1990
1991
1992
1993
1994
1995
1996
1997
1998
1999
2000
2001
2002
2003
2004
2005
2006
2007
2008
2009
2010
2011
2012
2013
2014
2015
2016
2017
2018
1,800,000
1,600,000
1,400,000
1,200,000
1,000,000
800,000
600,000
400,000
200,000
0
100
90
80
70
60
50
40
30
20
10
0
Are
a (H
a)Residual risk (%
)
Figure�1.
Total recorded fi re area
Historical residual risk
Projected residual risk without fuel reducti on
Projected residual risk with maximum planned fuel reducti on
Year
1991
1992
1993
1994
1995
1996
1997
1998
1999
2000
2001
2002
2003
2004
2005
2006
2007
2008
2009
2010
2011
2012
2013
2014
2015
100
90
80
70
60
50
40
30
20
10
0
Prop
orti o
n (%
)
Figure�3.
No fi re history Above maximum TFI
Year
1992
1993
1994
1995
1996
1997
1998
1999
2000
2001
2002
2003
2004
2005
2006
2007
2008
2009
2010
2011
2012
2013
2014
2015
450,000
400,000
350,000
300,000
250,000
200,000
150,000
100,000
50,000
0
Are
a (h
a)
Figure�4.
Planned burning Bushfi res
Figure�4:�Area�(ha)�of�Victorian�public�land�burnt�while�below�minimum�TFI�from�1992–2015Bars represent area burnt by planned burning (blue) and bushfire (light orange).
Figure�3:�TFI�status�of�vegetation�on�Victorian�public�land�from�1991–2015Different colours represent vegetation in a different status: below minimum TFI (red), within TFI (light blue) and above maximum TFI (dark blue). Public land with no recorded fire history is shown in dark grey.

16 Reducing Victoria’s bushfire risk on public land | Fuel management report 2014–15
Year
1992
1993
1994
1995
1996
1997
1998
1999
2000
2001
2002
2003
2004
2005
2006
2007
2008
2009
2010
2011
2012
2013
2014
2015
120,000
100,000
80,000
60,000
40,000
20,000
0
Are
a (h
a)
Figure�5.
1992
1993
1994
1995
1996
1997
1998
1999
2000
2001
2002
2003
2004
2005
2006
2007
2008
2009
2010
2011
2012
2013
2014
2015
Prop
orti o
n of
eac
h fu
el m
anag
emen
t zon
e (in
one
% in
terv
als)
Figure�6.
Year
Asset Protecti on Zone
Bushfi re Moderati on Zone
Planned Burn Exclusion Zone
Landscape Management Zone
Asset Protecti on Zone
Bushfi re Moderati on Zone
Planned Burn Exclusion Zone
Landscape Management Zone
Year
1992
1993
1994
1995
1996
1997
1998
1999
2000
2001
2002
2003
2004
2005
2006
2007
2008
2009
2010
2011
2012
2013
2014
2015
120,000
100,000
80,000
60,000
40,000
20,000
0
Are
a (h
a)
Figure�5.
1992
1993
1994
1995
1996
1997
1998
1999
2000
2001
2002
2003
2004
2005
2006
2007
2008
2009
2010
2011
2012
2013
2014
2015
Prop
orti o
n of
eac
h fu
el m
anag
emen
t zon
e (in
one
% in
terv
als)
Figure�6.
Year
Asset Protecti on Zone
Bushfi re Moderati on Zone
Planned Burn Exclusion Zone
Landscape Management Zone
Asset Protecti on Zone
Bushfi re Moderati on Zone
Planned Burn Exclusion Zone
Landscape Management Zone
Figure�6:�Proportion�(in�%)�of�each�fuel�management�zone�treated�by�planned�burning�while�below�minimum� TFI�from�1992–2015�Bars represent proportion of area in the Asset Protection Zone (purple), Bushfire Moderation Zone (light orange), Landscape Management Zone (blue) and Planned Burn Exclusion Zone (red). Each interval on the y-axis is representative of 1%. Note that the proportional values for each year are not accumulative.
Figure�5:�Area�(ha)�of�each�fire�management�zone�treated�by�planned�burning�while�below�minimum�TFI�from�1992–2015Bars represent area burnt while below minimum TFI for the Asset Protection Zone (purple), Bushfire Moderation Zone (light orange), Landscape Management Zone (blue) and Planned Burn Exclusion Zone (red).

Reducing Victoria’s bushfire risk on public land | Fuel management report 2014–15 17
BushfiresDuring the 1990s and 2000s, relatively low levels of fuel treatment activities contributed to a build-up of fuels across Victoria. This culminated in several large bushfires in the past decade or so. Some of these bushfires burnt large areas of public land that were already below minimum TFI due to previous bushfires or planned burning. For example, some areas in the Victorian Alps were impacted by more than one of the 2003, 2006–07 and 2013 bushfires.
Planned�burningPlanned burning in areas below minimum TFI in certain areas may help to manage bushfire risk to life and property and important ecosystems by reducing the chance of major bushfires impacting on these assets and values.
Following the release of the 2009 Victorian Bushfires Royal Commission recommendations, the amount of planned burning in the landscape has risen. There has been a corresponding increase in the area treated by planned burning while below minimum TFI, particularly in the last three years.
In terms of area burnt, most hectares treated by planned burning while below minimum TFI in 2015 were in the landscape management zone (around 71,000 ha). Since the landscape management zone is large, this equates to only around 1.5% of that zone burnt below minimum TFI. Most of these planned burns have been carried out as landscape mosaic burns, so only some patches of vegetation within the treatment areas were burnt. The amount of this zone shown as burnt below minimum TFI is therefore likely to be an overestimate.
The area treated by planned burning while below minimum TFI in the asset protection zone in 2015 (nearly 7,000 ha) was much smaller than that burnt in the landscape management zone. This equates to around 8% of that zone, since the asset protection zone is relatively small. It reflects the greater emphasis on more-frequent burning for protection of life and property in the asset protection zone.
DELWP manages for community protection as well as for environmental values. Finding the right balance between reducing fuel in the different fire management zones and minimising the impacts on ecological values is important and will be a part of the strategic planning process.

18 Reducing Victoria’s bushfire risk on public land | Fuel management report 2014–15
� �Vegetation�growth�stage�structureAnalysis of the vegetation GSS on Victoria’s public land in 2014–15 (figures 7 and 8) indicated that the proportions of vegetation in the four growth stage classes was similar to last year (Juvenile 26%, Adolescent 20%, Mature 27% and Old 3%). There was a small increase in the area of Adolescent (up
by 6%) and Old (up by 7%) classes, as vegetation aged. For comparative purposes, GSSs are shown for other years (2002, 2003, 2006 and 2009) to illustrate the effects of significant bushfires on the distribution of growth stages across the state.
2002 2003
2006 2009
2014 2015
Juvenile Adolescent Mature Old Private land Public land with no recorded fire history
Figure�7:�Growth�stage�status�of�vegetation�on�Victorian�public�land�for�selected�years�from�2002–2015Different colours represent vegetation in a different status: Juvenile (red), Adolescent (light orange), Mature (light blue) and Old (dark blue). Private land is shown in light grey and public land with no recorded fire history in dark grey.

Reducing Victoria’s bushfire risk on public land | Fuel management report 2014–15 19
Figure�8:�Growth�stage�status�of�vegetation�on�Victorian�public�land�from�1991–2015Bars in different colours represent vegetation in a different status: Juvenile (red), Adolescent (light orange), Mature (light blue) and Old (dark blue). Dark grey bars represent public land with no recorded fire history.
Year
1991
1992
1993
1994
1995
1996
1997
1998
1999
2000
2001
2002
2003
2004
2005
2006
2007
2008
2009
2010
2011
2012
2013
2014
2015
100
90
80
70
60
50
40
30
20
10
0
Prop
orti o
n (%
)
Figure�8.
No fi re history Old Mature Adolescent Juvenile
Relati ve contributi on (%)
Time since fi re
Fire interval
Fire type
Vegetati on
Survey eff ort (ti me)
Survey eff ort (space)
Figure�9.
0 10 20 30 40 50 60

20 Reducing Victoria’s bushfire risk on public land | Fuel management report 2014–15
CASE STUDY
Foothills Fire and Biota project: research to inform ecological fire management
Foothills forest comprises what is commonly referred to as messmate-peppermint or mixed-species forests. Foothills forest is a focus for fire management in Victoria due to its high flammability, its proximity to communities and the role of fire as an ecosystem driver.
In 2012, DELWP commissioned researchers from the Arthur Rylah Institute, Deakin University, La Trobe University and The University of Melbourne to investigate relationships between biota, fire and other drivers in Foothills forest. The overarching aim of the Foothills Fire and Biota project was to provide models of the relationships between the biota, fire history and landscape patterns that can be used to help predict biodiversity outcomes of bushfire and planned burns in Foothills forest.
Comparison of the relative influence of fire regime variables on species grouped by taxonomic category (birds, mammals and plants) showed that the time since fire and the inter-fire interval were both, on average, influential on species occurrence (as figures 9 and 10 show). The inter-fire interval tended to be more influential on plants than on animals. The type of fire (bushfire or planned burn, a surrogate for severity) generally had little influence on species occurrence.

Reducing Victoria’s bushfire risk on public land | Fuel management report 2014–15 21
Figure�9:�The�relative�influence�of�fire�regime�characteristics,�vegetation�type�(Ecological�Vegetation�Division)�and�survey�effort�on�birdsColoured points represent the response of a single species to a predictor variable (such as time since fire). Vertical lines within boxes represent the median response of all species to a predictor variable. A greater relative contribution (%) by a predictor variable means that it has a stronger influence on the occurrence of bird species.
Year
1991
1992
1993
1994
1995
1996
1997
1998
1999
2000
2001
2002
2003
2004
2005
2006
2007
2008
2009
2010
2011
2012
2013
2014
2015
100
90
80
70
60
50
40
30
20
10
0
Prop
orti o
n (%
)
Figure�8.
No fi re history Old Mature Adolescent Juvenile
Relati ve contributi on (%)
Time since fi re
Fire interval
Fire type
Vegetati on
Survey eff ort (ti me)
Survey eff ort (space)
Figure�9.
0 10 20 30 40 50 60
Relati ve contributi on (%)
Time since fi re
Fire interval
Fire type
Vegetati on
Survey eff ort (ti me)
Survey eff ort (space)
0 10 20 30 40 50 60
Figure�10.
Year
300,000
250,000
200,000
150,000
100,000
50,000
0
Are
a (h
a)
Figure�12.
Planned burning FOP areas aff ected by bushfi re
Other fuel management treatment
Target
2005 2006 2007 2008 2009 2010 2011 2012 2013 2014 2015
Figure�10:�The�relative�influence�of�fire�regime�characteristics,�vegetation�type�(Ecological�Vegetation�Division)�and�survey�effort�on�plantsColoured points represent the response of a single species to a predictor variable (such as time since fire). Vertical lines within boxes represent the median response of all species to a predictor variable. A greater relative contribution (%) by a predictor variable means that it has a stronger influence on the occurrence of plant species.
The project findings indicate that Foothills forest is relatively resilient, most of the species the project could analyse are likely to persist on a landscape scale if subjected to fire regimes within the range of historical variation. Their apparent resilience is likely to be due to many structural and habitat features of Foothills forest being only loosely related to time since fire, as well as to the effects of fire regimes being moderated by environmental variation. The overall resilience of Foothills forest may mean that managers have more latitude around, for example, growth stage distributions than in more fire-sensitive systems. This may allow ecological fire management resources to be directed at protecting and promoting fire-sensitive species and habitats that occur within, or interspersed among, Foothills forest (such as older vegetation).
The project group is continuing to work with the East Central bushfire risk landscape team to establish optimal and target growth stage distributions for Foothill forest, to inform the future management of fire in this critical part of Victoria.

22 Reducing Victoria’s bushfire risk on public land | Fuel management report 2014–15
� Community�engagement2014 marked five years since the formation of the statewide Land and Fire Management Stakeholder Roundtable. This well-established forum held quarterly meetings in 2014–15.
The five-year milestone provided an opportunity for the roundtable to reflect on its purpose and scope. It was agreed the roundtable has moved beyond considering straightforward fuel management issues to making more complex contributions to statewide strategic planning. Planned burning will remain the focus for the roundtable, within the context of land and fire management generally.
In February, the Minister for Environment, Climate Change and Water and Minister for Emergency Services asked IGEM to make recommendations about the form of future performance targets for the bushfire fuel management program. IGEM reported to the government in May. To prepare its response to the review, DELWP consulted extensively with the community and stakeholders. The Land and Fire Management Stakeholder Roundtable contributed to the review, as did the Far East Gippsland Roundtable, the Greater Grampians Roundtable and several high-bushfire-risk communities.
The Planned Burning Notification System went live in autumn 2015 (see screenshot). The system gives those who register with it advance notice of planned and upcoming planned burns, and information about current burns, by SMS or email. People can be notified about specific burns or about all burns within 10 km of a given location. It is particularly useful for people with asthma and heart conditions, apiarists, grape growers and tourism operators, and was developed in consultation with representatives from those sectors.
In 2014, DELWP engagement officers joined the statewide Planned Burning Coordination Team at the State Control Centre for the first time. Engagement officers ensure key government stakeholders (including EPA, CFA, Department of Health and Human Services and Tourism Victoria) are kept informed about the planned burning program and can provide their networks with information about it. Engagement officers also worked with the Bureau of Meteorology and fire behaviour analysts to develop smoke management and engagement plans, so the impact of smoke on local events and at-risk people can be predicted, managed and communicated.
The�Planned�Burning�Notification�System�provides�full�details�of�planned,�upcoming�and�current�burns.

Reducing Victoria’s bushfire risk on public land | Fuel management report 2014–15 23
� Risk-based�planning�outputs
Strategic�bushfire�management�plansDuring the year, DELWP published SBMPs for three of Victoria’s seven bushfire risk landscapes, and finalised for publication plans for the remaining four.
The SBMPs explain the fuel management strategies that DELWP and Parks Victoria will undertake in Victoria’s seven bushfire risk landscapes to minimise the impact of major bushfires on people, property, infrastructure, economic activity and the environment, to achieve the two code objectives. The plans explain how we will manage fuel in the fire management zones—asset protection zones, bushfire moderation zones, landscape management zones and planned burning exclusion zones—on public land, using planned burning and by doing other fuel management activities.
The plans take a risk-based approach to planning for bushfire management, based on the principles of AS/NZS ISO31000:2009 Risk Management - Principles and Guidelines.
The approach:
• pairs local knowledge with world-leading bushfire simulation software, historical data and the best-available science to understand how bushfires behave
• incorporates multiple weather patterns and ignition likelihood weightings
• incorporates the views of communities, industries and other stakeholders about what they value and want to protect from bushfires
• uses ongoing monitoring, evaluation and reporting to continuously improve how we are reducing bushfire risk.
The international standards for risk management, with which our strategic planning approach complies, reflect the fact that risk can never be completely eliminated. Bushfires will still occur, and everyone needs to be prepared and ready to respond. But with appropriate management strategies bushfire risk can be reduced.
� Burn�preparationTable 9 shows data for burn planning and site preparation in Victoria in 2014–15. It shows that burn plans were prepared for more than double (205.5%) the target area for fuel management, exceeding the target for burn planning of 165%. It also shows that burns were planned and sites were prepared for almost double (184.6%) the target area for fuel management, also exceeding the target of 140% for burns planned and prepared.
During the year, DELWP continued its close collaboration with CFA in burn planning and preparation so the department and the authority can work closely with the community to prepare for and conduct planned burns.
Table�9:�Burn�planning�and�site�preparation�data
Measure Ha %�of�TAFM
Target�area�for�fuel�management�(TAFM) 275,000
Area with burn plans developed (over the three-year FOP)
Target 453,750 165.0%
Actual 565,167 205.5%
Area for which burns were planned and sites prepared
Target 385,000 140.0%
Actual 507,774 184.6%

24 Reducing Victoria’s bushfire risk on public land | Fuel management report 2014–15
CASE STUDY
A collaborative approach to planned burning on public and private land
In November 2013, the Grampians district completed the Grampians – Mt Sturgeon planned burn 2 km north-west of the township of Dunkeld, including public and private land. The public land area was national park and classified as Bushfire Moderation Zone. The planned burn formed part of a strategy to protect the township of Dunkeld by reducing the potential for increased fire behaviour and spotting from Mt. Sturgeon under north-westerly winds.
In collaboration with the local CFA Vegetation Management Officer, DELWP approached two private landowners to discuss the strategic inclusion of adjacent private bushland into the burn. Much of Mt Sturgeon is private land which contained a significant fuel hazard. Also, as there was no boundary management track on much of the private/public land interface it would have been difficult to treat the public land without creating substantial new mineral earth control lines. The private landowners agreed to include their bushland into the burn. This nearly doubled the size of the burn but made for a more effective burn unit to implement and also addressed significant risk on private property. The burn was ignited by DELWP and CFA ground crews, and an aerial drip torch, while two CFA tankers from local brigades were present at the burn.
The collaborative planned burn on private/public land was successful and achieved a high level of risk reduction to the township of Dunkeld. Inclusion of the private property in the burn improved the strategic outcome of the burn and involvement of local CFA brigades helped with community engagement around this sensitive burn. DELWP and CFA effectively engaged with the local community which was important given the burn’s proximity to a popular tourist centre and its short-term impacts on walking tracks.

Reducing Victoria’s bushfire risk on public land | Fuel management report 2014–15 25
� Hazardous�tree�removalFigure 11 shows where hazardous tree removal works were completed in the Hume, Port Phillip, Gippsland and Grampians regions. The bulk of the work was done in the Hume and Gippsland regions. These regions have most of Victoria’s road network and bushfire-damaged trees. The total length of road where hazardous trees were removed was about 1,134 km. Work to remove hazardous trees will occur in other regions in future.
Figure�11:�Victorian�roads�(in�red)�where�hazardous�tree�removal�work�has�been�completed�since�the� start�of�the�program

26 Reducing Victoria’s bushfire risk on public land | Fuel management report 2014–15
� Fuel�management�activitiesTable 10 shows fuel management activity data for Victoria in 2014–15. It shows that about 85% of the total fuel management target was met through planned burning.
During the year, DELWP conducted 670 planned burns. CFA helped DELWP with 77 of these, assisting with the treatment of 16,539 ha.
Figure 12 shows the target area for fuel management on Victorian public land and the actual fuel-reduced area toward the target, for each year since 2005. It shows the target area has steadily increased over the period and that with a few exceptions the actual area has been fairly close to the target area.
Table�10:�Fuel�management�activity�data
Measure Ha Ha�toward�target %�of�target
Target�area�for�fuel�management 275,000
Area treated by planned burning 234,614 234,614 85.3%
Ecological burns 40,769 ha (85 burns)
Fuel-reduction burns 190,998 ha (346 burns)
Other burns 2,847 ha (239 burns)
Area treated by other fuel management methods 13,616 13,616 5.0%
Area suitable for planned burning burnt by bushfires 26,611
(including area planned for burning on a current FOP) 6,377 2.3%
Total�fuel-reduced�area�(actual) 274,841 254,607 92.6%

Reducing Victoria’s bushfire risk on public land | Fuel management report 2014–15 27
Figure�12:�Area�(ha)�of�Victorian�public�land�that�was�fuel-reduced,�2005–2015.�Bars represent area treated by planned burning (dark grey), FOP areas affected by bushfire (lime green) and area treated by other fuel management methods (blue). Teal dotted lines represent the annual fuel management target for that year.
Relati ve contributi on (%)
Time since fi re
Fire interval
Fire type
Vegetati on
Survey eff ort (ti me)
Survey eff ort (space)
0 10 20 30 40 50 60
Figure�10.
Year
300,000
250,000
200,000
150,000
100,000
50,000
0
Are
a (h
a)
Figure�12.
Planned burning FOP areas aff ected by bushfi re
Other fuel management treatment
Target
2005 2006 2007 2008 2009 2010 2011 2012 2013 2014 2015

28 Reducing Victoria’s bushfire risk on public land | Fuel management report 2014–15
Weather and the area that was treated by planned�burningMost planned burning in Victoria occurs in spring and autumn. DELWP’s ability to conduct planned burns depends on weather and fuel conditions. We cannot burn if it is too hot, too dry or too wet. For example:
• if winter is particularly wet, the vegetation takes longer to dry out, reducing spring burning opportunities
• the early onset of cool, moist weather in late autumn reduces autumn burning opportunities (as occurred in the Loddon Mallee and Barwon South West regions).
The main conditions that reduce planned burning opportunities are:
• above-average temperatures contributing to fuel being too dry (as occurred in many parts of the state)
• below-average temperatures contributing to fuel being too wet (as occurred for maximum and minimum temperatures in autumn in the west, south and east, with some small areas of the far west very much cooler than average)
• below-average rainfall contributing to fuel being too dry (as occurred in the Mallee and north-central Victoria in winter, and the west and centre of the state in spring and summer)
• above-average rainfall contributing to fuel being too wet (as occurred in southern Victoria in winter and in much of Gippsland in spring and summer).
Generally, the state had higher-than-average temperatures. The average maximum temperature for the state was 21.95°C which is 2.54°C warmer than the 1961–90 average. Spring temperatures were above-average across the state, with much of the coastal south-west recording the highest temperatures on record. Across the state, it was also the driest spring for at least 20 years. February day-time and night-time temperatures were above-average to well-above-average across most of the state. These conditions reduced planned burning opportunities in the west (because of dryness) and in the east (because of wet conditions).
Emergency�management�responseDuring 2014–15 Victoria experienced flooding, storms, fires, heat events and a range of other emergencies that required the involvement of DELWP personnel.
There were several interstate deployments throughout the year in response to requests for assistance for fire and flood (from NSW, SA and WA) and two international deployments (to Canada and the USA) for fire.
In mid-December 2014, lightning ignited more than 350 fires in north-east Victoria. These fires burnt through almost 15,000 ha.
In early January 2015, Victoria experienced severe-to-extreme fire danger, with high temperatures, damaging winds and severe thunderstorms. Major bushfires developed in the west of the state at Moyston, Edenhope, in the Little Desert and at Hastings (in the outer metropolitan area of Melbourne). More than 26,000 ha were burnt.
DELWP attended 1,149 fires affecting 57,250 ha in 2014–15.
Planned burn breachesA planned burn is considered to have escaped when it moves beyond the area designated in the burn plan (by breaching control lines) and if it cannot be contained within 30 minutes and/or requires additional resources and/or impacts private land. Such an escape is classified as a breach. The burn plan may include designated contingency areas. A burn within a contingency area is not considered to be a breach.
Across the state, 10 out of a total of 670 planned burns (or about 1.5% of the total) were considered breaches. Of the 10, three breaches damaged private assets.
Table 11 shows details of planned burn breaches in 2014–15, sorted by their area.
Elvis © DELWP

Reducing Victoria’s bushfire risk on public land | Fuel management report 2014–15 29
Table�11:�Planned�burn�breaches,�2014–15
Burn name (district,�region)
LocationPlanned burn / breach�area�(ha)
Impact
Upper Gundowring Gundowring Fireline (Upper Murray District, Hume region)
7 km south-east of Gundowring
1,432 / 890
A fuel-reduction burn in the bushfire moderation zone was ignited on 26 February 2015 and burnt through a damp gully on 4 March into adjoining state forest, burning at low-to-medium intensity. It became fire 35 Gundowring–Upper Gundowring Fireline.
Abbeyyards–Selwyn Track (Ovens District, Hume region)
31 km south-west of Harrietville
2,525 / 383
A fuel-reduction burn in the landscape management zone was ignited on 28 February 2015 and breached control lines on 11 March. It became fire 49 Abbeyyards–Selwyn Track. The fire burnt an area of adjoining state forest at low intensity.
Licola–Crookayan (Macalister District, Gippsland region)
60 km north of Heyfield
10,420 / 132
A fuel-reduction burn in the landscape management zone was ignited on 10 March 2015 and breached control lines on 12 March, burning into adjacent national park identified as a 2016–17 FOP planned burn. The burnt area was not identified as a contingency area for the planned burn and became fire 34 Licola–Dingo Hill.
Dartmouth–Kings Spur (Upper Murray District, Hume region)
18 km east-south-east of Dartmouth
15,563 / 43
A fuel-reduction burn in the bushfire moderation zone was ignited on 23 February 2015 and spotted over control lines in three locations in the area of a 2016–17 FOP planned burn. It became fire 39 Dartmouth–Eustace Gap Track 31. The fire burnt an area of adjoining national park at low intensity.
Mt Beauty–Little Mount Bogong– Kiewa River East (Ovens District, Hume region)
3 km south-east of Mount Beauty
1,731 / 33
A fuel-reduction burn in the landscape management zone was ignited on 23 February 2015 and spotted over control lines on 15 March. It became fire 50 Mount Beauty–Little Mount Bogong. The fire burnt an area of adjoining national park at low intensity.
McMahons Creek–Whitelaw Track (Yarra District, Port Phillip region)
4 km south-east of McMahons Creek
2,616 / 22
A fuel-reduction burn in the landscape management zone was ignited on 13 March 2015 and spotted into an inaccessible area of adjoining state forest the next day, and additional resources were requested. It became fire 14 McMahons Creek Road 18.
Ballan–Spargo Creek (Midlands District, Grampians region)
16 km north-west of Ballan
54 / 1
A fuel-reduction burn in the landscape management zone was ignited on 10 March 2015 and spotted on the same day into an adjoining private pine plantation. The landowner had given permission to undertake works and the breach was not called a fire.
Creswick–Allendale Rail (Midlands District, Grampians region)
6 km north-east of Creswick
6 / 0.4
An ecological burn in the asset protection zone was ignited on 10 March 2015. It breached a wet control line the same day and burnt into private property. It became fire 39 Allendale–Smyth Street. The fire burnt grass in the adjacent paddock and in an open shed, and scorched the shed posts.
Tallangatta Valley–Lake Findlay (Upper Murray District, Hume region)
5 km east of Tallangatta
1,563 / 0.3
A fuel-reduction burn in the landscape management zone was ignited on 23 February 2015. The burn did not breach contingency areas but increased fire activity had the potential to affect a nearby pine plantation and unplanned resources were dispatched. It became fire 36 Tallangatta Valley–Lake Findlay Track on 5 March 2015.
Blackwood–Simmons Reef (Midlands District, Grampians region)
1 km west of Blackwood
18 / 0.01
A fuel-reduction burn in the asset protection zone was ignited on 11 March 2015 and a single spot on the same day landed on and burnt through an above-ground telephone cable, shutting down phone and internet services to a nearby town; services were restored the next day. The breach was not called a fire.

30 Reducing Victoria’s bushfire risk on public land | Fuel management report 2014–15
� MonitoringIn early 2015, DELWP published the Monitoring, Evaluation and Reporting Framework for Bushfire Management on Public Land. The MER Framework guides how we monitor, evaluate and report on the effectiveness of our bushfire management to government and the community, and helps us improve our knowledge and make better decisions about bushfire management.
Each bushfire risk landscape is developing its own MER plan. Those plans will identify key evaluation questions for each landscape to answer over the next five years, and the MER activities and resources required to answer them.
During the year, monitoring continued for the data that was scheduled for two- and five-year surveys. Few new monitoring activities were undertaken as the new framework was being developed, but will pick up once the landscapes identify their priorities in their MER plans.
A new, three-year research project through the Bushfire and Natural Hazards CRC started with La Trobe University to review our legacy monitoring programs against the new ecosystem resilience key evaluation questions. This project will look for efficiencies in how DELWP collects ecological data, and will identify ways to improve how we collect, evaluate and report on it.
DELWP helped support a successful bid to the Australian Research Council’s Linkage Projects scheme by Latrobe University and The University of Melbourne for funding to build on their previous research into the effect of fire on biodiversity in Foothills forest. The new project will investigate how the growth stages in the landscape should be distributed to best support biodiversity.
DELWP also established a one-year project with The University of Melbourne to investigate the contribution of sampling design and sample size to calculating geometric mean abundance, and to look at how to calculate it in fragmented landscapes.
During the year, we evaluated the alignment of our strategic planning framework with AS/NZ ISO31000:2009 Risk Management – Principles and Guidelines. We also evaluated the compliance of bushfire risk landscape teams with the strategic planning framework. The findings identified areas for updating or improvement as part of the next round of strategic planning. We also used the findings to develop self-assessment tools to evaluate the development and implementation of future versions of the planning framework.
CostTable 12 shows the costs in 2014–15 of DELWP’s fire management effort. It shows the total cost of the entire effort was $222.5 million. Of this, direct fuel management costs were $50.2 million and indirect fuel management costs $63.7 million. Costs under the program for activities other than fuel management (such as fire suppression) were $108.6 million.
Table 13 shows the estimated indirect fuel management costs using the new item structure that DELWP adopted during the year for budgeting and accounting of fuel management activities; the table is a dissection of the $63.7 million total in the table above for indirect fuel management costs. The table shows the largest cost items were operational planning and equipment and infrastructure. As the new guidelines will be implemented in 2015–16, the items in the tables are estimates (although the total is actual). We expect to be able to report actual costs for 2015–16 using the new items in next year’s report.
As well as for planning, preparing and conducting planned burning, and the other initiatives explained in this report, the costs above also provided for:
• improving how we engaged with stakeholders through roundtables and other forums
• working with stakeholders, such as the Red-tailed Black-Cockatoo Recovery Team, and with vignerons, including to research the effects of smoke on wine quality
• improving smoke modelling tools and air quality monitoring methods, with EPA
• remotely monitoring sites for fuel moisture content
• recruiting additional field staff
• increasing staff capability and mobility with stand-by and overtime pay, training, medicals and moving taskforces around the state
• more equipment and vehicles to support field activities
• reviewing policies and procedures such as the fuel management manual.

Reducing Victoria’s bushfire risk on public land | Fuel management report 2014–15 31
Table�12:�Fuel�management�costs,�by�group�and�region
RegionFuel�management�(direct)
Fuel�management�(indirect)
Non-fuel�management
Total
Barwon South West $3,664,110 $4,740,592 $7,879,301 $16,284,003
Gippsland $12,377,797 $8,105,069 $19,241,958 $39,724,824
Grampians $5,314,657 $6,866,135 $9,892,497 $22,073,290
Hume $12,125,038 $8,912,529 $11,987,791 $33,025,357
Loddon Mallee $7,930,012 $7,100,962 $6,250,314 $21,281,287
Port Phillip $2,667,782 $5,493,234 $3,044,696 $11,205,712
Regional Services Directorate $6,151,490 $1,183,462 $5,390,408 $12,725,360
Total Regional Services $50,230,886 $42,401,983 $63,686,965 $156,319,834
Office of Chief Fire Officer $0 $3,720,148 $19,530,778 $23,250,926
Fire and Emergency Management $0 $13,990,739 $13,990,739 $27,981,478
Other corporate functions $0 $3,597,108 $11,390,843 $14,987,951
Total Land, Fire and Environment Division and Corporate Services
$0 $21,307,996 $44,912,360 $66,220,356
Total $50,230,886 $63,709,979 $108,599,325 $222,540,190*
*Excludes trust, capital asset charge, depreciation and corporate overheads.
Table�13:�Estimated�indirect�fuel�management�costs,�by�cost�item
Item % $
Strategic planning 13.7% $8,706,101
Operational planning 21.4% $13,651,679
Capability 12.6% $8,009,868
Resource management 1.9% $1,179,544
Equipment and infrastructure 21.8% $13,899,211
Business management 18.9% $12,053,180
Monitoring, evaluation and reporting 3.7% $2,329,700
Engagement 6.1% $3,880,695
Total 100.0% $63,709,979

32 Reducing Victoria’s bushfire risk on public land | Fuel management report 2014–15
L o d d o nL o d d o n
H u m eH u m e
G r a m p i a n sG r a m p i a n s
G i p p s l a n dG i p p s l a n d
M a l l e eM a l l e e
B a r w o nB a r w o n S o u t h S o u t h W e s t W e s t
P o r tP o r tP h i l l i pP h i l l i p
MALLEE
WIMMERA
TAMBO
GOULBURNMURRAY GOLDFIELDS
MIDLANDS
OVENS
OTWAY
SNOWY
LATROBE
FAR SOUTH WEST MACALISTER
MURRINDINDI
YARRA
UPPER MURRAY
METROPOLITAN
Mildura
Wodonga
BendigoHorsham
Geelong
Ballarat
Hamilton
Swan Hill
Traralgon
Melbourne
WangarattaShepparton
Bairnsdale
Portland Warrnambool
Legend
DELWP Fire Districts
DELWP Regions
Major Towns
Major Roads
Major Rivers
Major Watercourse Areas
Other Public Land
Parks and Reserves
State Forests
N e w S o u t h W a l e s
So
ut
h A
us
tr
al
ia
VICGRIDGDA 94
1:2,100,0000 6012 24 36 48
Kilometers
Figure 13.
DELWP Fire Districts
DELWP Regions
Major Watercourse Areas
Parks and reserves
State forests Other Public Land
Major Towns
Major Roads
Major Rivers
Regions
IntroductionFor fuel management fire operations planning purposes, DELWP currently has six regions, each of which have fire districts. Figure 13 shows the regions and fire districts. It does not show Victoria’s seven bushfire risk landscapes, which DELWP now uses for strategic bushfire management planning purposes. These are areas where bushfire behaviour—including the types of places that bushfires start, the terrain and vegetation through which they spread, and the types of impact they have—is sufficiently common to plan for the area as a whole. Information about the boundaries and characteristics of the seven bushfire risk landscapes is available on the DELWP website.
In 2014–15, as explained in the introduction to this report, DELWP conducted two major initiatives to meet the requirements of the code: preparation of a monitoring, evaluating and reporting framework, and preparation of SBMPs for the seven landscapes. The Monitoring section of this report also explains that the new framework will result in considerable adjustment to how we monitor, evaluate and report on bushfire risk management.
Consequently, reporting for 2014–15 has both a region/district and a landscape aspect. To account for this, this fuel management report includes data:
• at the statewide level about residual bushfire risk, TFI and vegetation GSS
• at the regional level about burn planning and preparation and fuel management activities, these things being conducted in 2014–15 in line with FOPs that were prepared at the region/district level
• at the regional level about monitoring activity for the year being conducted on the basis of regions
• at the regional level about community engagement, which has elements of engagement around strategic planning (now at the landscape level) and operational planning and implementation (at the region/district level, in line with FOPs that to date have been prepared at that level).
As we move to a landscape focus for planning and monitoring, evaluation and reporting, it will be increasingly desirable to report at the landscape level. Accordingly, the DELWP website will supplement the information in this report with 2014–15 data about residual bushfire risk, TFI and vegetation GSS at a landscape level.
Figure�13:�State�of�Victoria�with�DELWP�boundaries�for�regions�and�fire�districts

Reducing Victoria’s bushfire risk on public land | Fuel management report 2014–15 33
Barwon South West regionThe Barwon South West region comprises two fire districts: Far South West and Otway.
The region extends from the South Australian border in the west to the Bellarine Peninsula in the east. Its vegetation communities include coastal heathlands along much of the coast, low Stringybark forests in the north-west and wet forests in the Otway Ranges. Pastures dominate the centre and north of the region, and there are large Pinus radiata and Blue gum plantations throughout the region, particularly in the west.
The region has warm summers and cold winters. Annual average rainfall ranges from around 500 mm in the west to 2,000 mm in the Otway Ranges.
The region provides habitat for many animal and bird species including the south-east subspecies of the Red-tailed black cockatoo, Southern brown bandicoot, Swamp antechinus and Powerful owl.
Barwon South W
est region

34 Reducing Victoria’s bushfire risk on public land | Fuel management report 2014–15
CASE STUDY
Stakeholder input into strategic bushfire management planning
One of the region’s main activities for the year was strategic bushfire management planning, to develop a long-term, strategic vision and direction for fuel management based on mitigating risks to the region’s priorities: its most at-risk communities, infrastructure, environmental assets and cultural heritage.
The region has long involved stakeholders in operational and tactical matters, and is maintaining and enhancing this involvement as DELWP moves to more strategic, risk-based planning processes.
To do this, the Barwon Otway bushfire risk landscape team formed a Bushfire Strategy Advisory Group (BSAG) to provide input into the Strategic Bushfire Risk Assessment & Strategy Selection (SBRASS) Project from late-2013 to mid-2015.
The BSAG identified a range of multi-agency actions, including closing the Great Ocean Road and increasing aircraft patrols on high-fire-danger days, to manage bushfire risk. It also identified the landscape’s priorities and other key assets that would benefit, or be harmed by, a bushfire.
The team then did detailed modelling and analysis to understand the strengths and weaknesses of each action. For example, it analysed the safety benefits of closing the Great Ocean Road on very bad fire days and the cost of doing so. Each group member articulated what they considered important, how they saw the impacts of each action to those things and what trade-offs they considered desirable to best balance the risk that bushfire could destroy what they valued with the costs and benefits of action. This process gave DELWP a much better understanding of what communities value and how they see the trade-offs necessary to protect what they value. Consequently, our fuel management strategy will better reflect community thinking.
The South Western bushfire risk landscape team convened the Western Border Stakeholder Reference Group (WBSRG) in August, which held its first meeting in September. The WBSRG comprised representatives of DELWP, Parks Victoria, Victoria Police, local governments, VicRoads, CFA (volunteers and operations), traditional owners, field naturalists, plantation owners, Bird Life Australia, Great South West Walk, the Red-tailed Black-Cockatoo Recovery Team, apiarists and the Victorian Farmer’s Federation.
The WBSRG will meet quarterly to advise DELWP and Parks Victoria about implementing the landscape’s SBMP; about developing its MER plan; about implementing IGEM’s Review of Performance Targets for Bushfire Fuel Management on Public Land; and about other matters as required.
Barwon South W
est region
Bushfire near Tallageira © Glenn Rudolph

Reducing Victoria’s bushfire risk on public land | Fuel management report 2014–15 35
� Community�engagementDuring the year, regional staff engaged with representatives of local government authorities, CFA, environmental groups, vignerons, tourism associations, water authorities, the equine industry, the timber industry, apiarists and energy producers.
Much of the engagement was through meetings and forums. We also worked to increase awareness of the planned burning program through emails, letters, phone calls, variable message signs, newsletters, posters, maps and letterbox drops.
During the year, we worked directly with private land owners to incorporate parcels of forested private land with high fuel loads into larger public land planned burn plans. By not strictly following fence lines and working together, DELWP and landholders reduced fuel and therefore bushfire risk much more effectively.
The Red-tailed Black-Cockatoo Recovery Team helped us revise the FOP for the Far South West district, to minimise the impact of fuel management on the species. Apart from DELWP staff, the team includes representatives of: BirdLife Australia, Zoos SA, Kowree Farm Tree Group, the Australian Government Department of the Environment and the South Australian Government Department of Environment, Water and Natural Resources.
During the year, we conducted the inaugural Glenelg Fire Conference. Some 120 participants from a range of agencies and the community discussed fire management issues, following the conference theme of shared responsibility.
We involved stakeholder advisory and reference groups extensively in developing the new SBMPs for the Barwon Otway and South Western bushfire risk landscapes.
Barwon South W
est region
South-eastern red-tailed black-cockatoo © Michael Sverns

36 Reducing Victoria’s bushfire risk on public land | Fuel management report 2014–15
Table�14:�Burn�planning�and�site�preparation�data
Barwon�South�West�region Ha %�of�TAFM
Target area for fuel management (TAFM) 21,128
Area for which burn plans were prepared (over the three-year FOP) 42,382 200.6%
Area for which burns were planned and sites prepared 37,716 178.5%
Table�15:�Fuel�management�activity�data
Barwon�South�West�region Ha Ha�toward�target %�of�target
Target�area�for�fuel�management��� 21,128
Area treated by planned burning 13,659 13,659 64.6%
Ecological burns 4,566 ha (10 burns)
Fuel-reduction burns 9,093 ha (29 burns)
Other burns 0.19 ha (2 burns)
Area treated by other fuel management methods 2,397 2,397 11.3%
Area suitable for planned burning burnt by bushfires 346
(including area planned for burning on a current FOP) 1 0.0%
Total�fuel-reduced�area�(actual)��� 16,402 16,057 76.0%
� �Burn�planning�and�preparation
Table 14 shows data for the region’s burn planning and preparation in 2014–15. It shows that burn plans were prepared, and sites prepared, for about double the target area for fuel management (200.6% and 178.5% respectively).
Fuel�management�activitiesTable 15 shows data for the region’s fuel management activities in 2014–15. It shows that planned burning contributed 64.6% to the total target area of 21,128 ha for fuel management, and that the total area that was fuel-reduced was about three-quarters (76%) of the target.
During the year, DELWP conducted 39 ecological and fuel-reduction burns in the region. CFA helped DELWP with 9 of these, assisting with the treatment of 2,693 ha by planned burning.
Planned burning opportunities in the region were reduced by:
• the early onset of cool, moist weather in late autumn reducing autumn burning opportunities
• below-average rainfall contributing to areas being too dry (as occurred in spring and summer)
• below-average temperatures contributing to areas being too wet (as occurred in autumn).
We removed some planned burning locations from the list of available locations because the Red-tailed Black-Cockatoo Recovery Team identified possible risks to the bird and its habitat. This contributed to the region’s ability to meet its targets.
� MonitoringMER activities were limited this year while we focused on developing the MER plan for the Barwon Otway bushfire risk landscape. It was drafted for endorsement and will be implemented from 2016. It will apply over a five-year period and outlines our priority key evaluation questions. In 2016, we aim to establish systematic monitoring processes to measure the effectiveness of fuel management in reducing bushfire risk.
During the year, we contributed funding for a statewide project to improve the robustness of fuel hazard monitoring.
We also assessed five key fire response species across 15 sites to understand whether the current TFI is appropriate and useful for determining their reproductive success in areas that are frequently treated by planned burning.
Barwon South W
est region

Reducing Victoria’s bushfire risk on public land | Fuel management report 2014–15 37
Gippsland regionThe Gippsland region comprises four fire districts: Snowy, South Gippsland, MacCalister and LaTrobe.
The region has riverine plains, foothills and mountains, so it has a very varied climate. Annual average rainfall ranges from around 600 mm to 1,950 mm.
The region usually has a wet winter—with snow in Alpine areas—and a hot, dry summer.
The region has about 70 ecological vegetation classes (EVCs) ranging from wet heathland to shrubby dry forest and subalpine woodland. It is home to a diverse range of plants and animals, including some of the state’s threatened species.
Gippsland region
A bushfire, with Bemm River in the foreground © Michael Beckers DELWP

38 Reducing Victoria’s bushfire risk on public land | Fuel management report 2014–15
CASE STUDY
Open and consistent dialogue with the community is vital for delivering planned burning
The Cape Liptrap Coastal Park stretches from the coast at Point Smythe to the sheltered waters of Waratah Bay, and abuts the small towns of Walkerville and Waratah Bay. These are tiny communities of residents and holiday makers. They provide few services and there is little local government infrastructure.
The 2015/16–2017/18 Fire Operations Plan has proposed two planned burns for the park. The burns are relatively small and low-risk to deliver. They will help protect life and property and will improve the local ecology.
Community consultations before 2014 identified a well-networked and research-focused group of community members from Walkerville who are strongly opposed to any planned burning in the coastal park. This early consultation by the Gippsland fire engagement staff identified the importance of having a comprehensive community engagement strategy, well in advance of conducting either of these planned burns.
Staff developed the Cape Liptrap planned burning – actions and communications plan to ensure they stayed closely connected with community concerns when implementing the FOP. Community engagement activities under the plan included doorknocking local residents, holding community meetings to discuss the proposed burns and corresponding with all ratepayers about upcoming burns: the correspondence included a feedback form.
Analysis of the community engagement activities showed that the majority of people supported the proposed planned burns and appreciated the opportunity to be heard about the issue. Many people also said they wanted the way in which planned burning is conducted to be improved.
DELWP staff will keep consulting with the whole community as they plan and implement planned burns in the Cape Liptrap Coastal Park.
Gippsland region
Planned burning with an aerial driptorch © DELWP

Reducing Victoria’s bushfire risk on public land | Fuel management report 2014–15 39
� Community�engagementRegional staff engaged with stakeholders and the community to develop the FOP through a mail-out and meetings with stakeholders and communities; through one-on-one meetings with landholders and others; and through media releases and advertising. The engagement period was from April to August, with most engagement occurring in April, May and August. We received and responded to 17 formal FOP submissions, over half being burn nominations. Staff fielded numerous other queries informally.
During planned burning, staff contacted landholders, grape growers, olive growers, apiarists and others to speak with them directly about specific burns. We used variable message signs at key locations during the year. We issued daily and weekly outlook notifications to media, stakeholders and interested other people. We also responded to 16 emails to the planned burning email address from February–May.
Smoke was an important issue during autumn. We kept in contact with stakeholders in Morwell about smoke from specific burns on weekends. As required, we issued smoke notifications to the tourism, health and education industries, including an outlook for Easter. We also kept in contact with stakeholders during significant smoke events.
The Far East Gippsland Roundtable provides an opportunity to discuss fire (including planned burning) and emergency management issues with stakeholders. The roundtable also enables stakeholders to share information with each other, and gives DELWP the community perspective so we can respond to any issues or ideas for improvement.
Staff of DELWP, Parks Victoria and CFA engaged with local communities (including through meetings, a sausage sizzle and a tour of planned burn sites) at Cape Liptrap and Raymond Island about managing the risk of bushfire and planned burning at these locations.
� �Burn�planning�and�preparationTable 16 shows data for the region’s burn planning and preparation in 2014–15. It shows that burn plans were prepared, and sites prepared, for roughly three-quarters more than the target area for fuel management (177.6% and 167.3% respectively).
Gippsland region
Table�16:�Burn�planning�and�site�preparation�data
Gippsland�region Ha %�of�TAFM
Target�area�for�fuel�management�(TAFM) 87,219
Area for which burn plans were prepared (over the three-year FOP) 154,909 177.6%
Area for which burns were planned and sites prepared 145,943 167.3%
A community field day © DELWP

40 Reducing Victoria’s bushfire risk on public land | Fuel management report 2014–15
Fuel�management�activitiesTable 17 shows data for the region’s fuel management activities in 2014–15. It shows that planned burning contributed 94.6% to the total target area of 87,219 ha for fuel management, and that the regional target was just about (98.9%) met.
During the year, DELWP conducted 116 ecological and fuel-reduction burns in the region. CFA helped DELWP with 42 of these, assisting with the treatment of 11,149 ha by planned burning.
Planned burning opportunities in the region were reduced by:
• below-average temperatures contributing to areas being too wet (as occurred in autumn)
• above-average rainfall contributing to areas being too wet (as occurred in much of Gippsland in spring, summer and autumn, with three sites in East Gippsland recording their highest-ever daily autumn rainfall).
Spring provided only limited opportunities for planned burning as is usually the case in most of Gippsland. Autumn provided only short-duration opportunities for planned burning, as the usual mild and stable weather did not eventuate. Despite the lack of opportunities, concerted efforts saw us almost meet the target area for fuel management.
� MonitoringMER activities were limited this year while we focused on developing the SBMP. We did continue with some monitoring of fuel hazard and fire severity, to help test a revised method for fuel hazard sampling and the new classification system for fire severity mapping. Ecosystem resilience monitoring as part of legacy programs also continued this year, to tie off those programs before the new MER Framework is implemented.
During the year, we conducted 501 fuel hazard assessments, to better understand the effect of fire severity on fuel accumulation rates.
During the year we also conducted:
• assessments of over 300 individual plants across 28 sites to understand whether the current TFI set for the key fire response species Banksia spinulosa is appropriate and useful for determining their reproductive success for different inter-fire intervals
• assessments of over 50 sites multiple times to determine if Yellow-Bellied Gliders and Greater Gliders (and other nocturnal fauna as recorded) occur as predicted by their species response models
• assessments of 255 hollow-bearing trees across three burns to determine the effect of protection measures on the collapse rate from planned burning
• assessments at 18 sites of the five-year post-burn recovery of plant species (which recorded 261 species)
• 18 all-species assessments at 16 control sites, to assess the post-burn recovery of plant species.
As part of the landscape mosaic burning site at Briagolong, we conducted assessments at:
• 20 sites of the two-year post-burn recovery of birds in mosaic burns and recorded 63 species across 4 EVCs: Damp forest (1 site, 17 species), Lowland forest (1 site, 22 species), Shrubby damp forest (5 sites, 48 species) and Shrubby dry forest (13 sites, 56 species)
• 20 sites of the two-year post-burn recovery of plant species in mosaic burns and recorded 219 species across 4 EVCs: Damp forest (1 site, 56 species), Lowland forest (1 site, 61 species), Shrubby damp forest (5 sites, 128 species) and Shrubby dry forest (13 sites, 174 species)
• 20 sites (by camera) of the two-year post-burn recovery of mammals in mosaic burns and recorded 11 species across 4 EVCs: Damp forest (1 site, 5 species), Lowland forest (1 site, 5 species) Shrubby damp forest (5 sites, 9 species) and Shrubby dry forest (13 sites, 10 species).
Table�17:�Fuel�management�activity�data
Gippsland�region Ha Ha�toward�target %�of�target
Target�area�for�fuel�management��� 87,219
Area treated by planned burning 82,534 82,534 94.6%
Ecological burns 18,804 ha (16 burns)
Fuel-reduction burns 61,939 ha (100 burns)
Other burns 1,791 ha (113 burns)
Area treated by other fuel management methods 3,544 3,544 4.1%
Area suitable for planned burning burnt by bushfires 365
(including area planned for burning on a current FOP) 194 0.2%
Total�fuel-reduced�area�(actual)��� 86,443 86,272 98.9%
Gippsland region

Reducing Victoria’s bushfire risk on public land | Fuel management report 2014–15 41
Gram
pians region
Grampians regionThe Grampians region comprises two fire districts: Midlands and Wimmera.
The region’s landscape includes the iconic sandstone ranges of the Grampians National Park at the heart of the region, the Mallee country in the north-west and the ranges in the east, including the Brisbane and Macedon ranges.
Most of the region has warm summers and cold winters. Annual average rainfall ranges from about 350 mm in the north-west to 850 mm in the east.
The region’s vegetation is diverse, ranging from dry grasslands and healthy woodlands in the Wimmera, to Box Ironbark woodlands and basalt grasslands in the east. The region is known for its many endemic and rare wildflowers.
The region is home to a diverse range of plants and animals including some of the state’s threatened species (such as the south-east subspecies of the Red-tailed Black Cockatoo, the Powerful Owl and Growling Grass Frog.
Taipan wall, Grampians National Park © Steffen Schultz

42 Reducing Victoria’s bushfire risk on public land | Fuel management report 2014–15
CASE STUDY
Engaging in an iconic tourism landscape close to Melbourne
In November, DELWP and Parks Victoria jointly conducted a 290 ha planned burn in the Macedon Regional Park to help protect nearby communities.
In general, the local community supported the burn (which had been postponed in previous years due to weather conditions) but burning on steep slopes in such an iconic tourism landscape close to Melbourne presents challenges. To plan the burn and address these challenges, we engaged with three levels of CFA, the Macedon Ranges Emergency Management Planning Committee, vignerons, tourism operators, VicRoads and local schools.
We scheduled a spring burn, to minimise the potential impact of smoke on nearby wineries.
The proposed burn was close to the summit and its popular spots, the Mount Macedon Memorial Cross and Top of the Range Tea Rooms. After negotiations with the Mount Macedon Memorial Cross Reserve Committee of Management, we planned the burn to minimise disruption to a Remembrance Day event to be held on the mount. The tea rooms, which are serviced by only one access road, were closed for the day.
Smoke from the burn was also to be visible from Braemar College, a local school, during VCE exams and from Woodend, Gisborne, Kyneton, Macedon and the Calder Freeway. The Principal of Braemar College notified students and parents of the planned burn and directed parents’ enquiries to DELWP.
Metro and central Victorian radio stations were the media focus, particularly as smoke would be visible from the freeway, nearby communities and possibly Melbourne. DELWP staff were interviewed on Drive on ABC 774. We put variable messaging boards along the freeway and local roads before, during and after the burn, to alert travellers and deliver safe-driving messages.
The timing of the burn and the comprehensive level of engagement, communication and media coverage resulted in an informed community that raised few concerns about the burn and the resulting smoke. The communication planning also helped develop a consistent approach to smoke messaging across the region and the state.
Gram
pians region
Hanging Rock Winery © Louise Scott, DELWP

Reducing Victoria’s bushfire risk on public land | Fuel management report 2014–15 43
� Community�engagementDuring the year, regional staff engaged with representatives of local government authorities, traditional owners, environmental groups, water authorities, the tourism industry, apiarists, vignerons and the timber industry.
The engagement was through meetings at planned burning sites with stakeholders to talk through how the planned burns would take place, formal presentations and field visits at fire conferences and with community groups, roundtables, phone and face-to-face discussions. New approaches, including the use of variable messaging signs and Facebook, added to the reach of engagement efforts.
Regular meetings of the Grampians Roundtable continue to be an important engagement opportunity, allowing for the exchange of ideas about a range of bushfire management issues and for building relationships with stakeholders.
Before igniting some planned burns close to grape-growing areas or special events, we modelled how smoke would affect particular locations, and we made plans to manage smoke impacts and to communicate what would happen.
� Burn�planning�and�preparationTable 18 shows data for the region’s burn planning and preparation in 2014–15. It shows that burn plans were prepared, and sites prepared, for about double the target area for fuel management (215.5% and 197.3% respectively).
Table�18:�Burn�planning�and�site�preparation�data
Grampians�region Ha %�of�TAFM
Target�area�for�fuel�management�(TAFM) 34,379
Area for which burn plans were prepared (over the three-year FOP) 74,071 215.5%
Area for which burns were planned and sites prepared 67,833 197.3%
Gram
pians region
Community engagement © DELWP

44 Reducing Victoria’s bushfire risk on public land | Fuel management report 2014–15
Table�19:�Fuel�management�activity�data
Grampians�region Ha Ha�toward�target %�of�target
Target�area�for�fuel�management��� 34,379
Area treated by planned burning 31,109 31,109 90.5%
Ecological burns 9,847 ha (20 burns)
Fuel-reduction burns 21,255 ha (66 burns)
Other burns 7 ha (11 burns)
Area treated by other fuel management methods 1,762 1,762 5.1%
Area suitable for planned burning burnt by bushfires 20,958
(including area planned for burning on a current FOP) 5,131 14.9%
Total�fuel-reduced�area�(actual)��� 53,829 38,002 110.5%
Fuel�management�activitiesTable 19 shows data for the region’s fuel management activities in 2014–15. It shows that planned burning contributed 90.5% to the total target area of 34,379 ha for fuel management, and that the total area that was fuel-reduced exceeded the target by 10.5%.
During the year, DELWP conducted 86 ecological and fuel-reduction burns in the region. CFA helped DELWP with seven of these, assisting with the treatment of 1,343 ha by planned burning.
� MonitoringMER activities were limited this year while we focused on developing the SBMP. In 2015–16 we will develop our MER plan.
During the year we conducted:
• assessments at 3 sites of the two-year post-burn recovery, and at 8 sites of the five-year post-burn recovery, of plant species and recorded a total of 207 species
• 11 all-species assessments of the post-burn recovery of plant species; we also assessed 10 control sites.
Gram
pians region
Planned burning, Ballarat © Jude Niemiec, DELWP

Reducing Victoria’s bushfire risk on public land | Fuel management report 2014–15 45
Hum
e region
Hume regionThe Hume region comprises four fire districts: Upper Murray, Ovens, Goulburn and Murrindindi.
The region has corridors forested with River Red Gum along the Murray, Goulburn and Ovens rivers, graduating to cleared farming lands on the northern plains, and on up into dry forested foothills and the mountainous terrain of the northern slopes of the Great Dividing Range.
The region’s annual average rainfall ranges from about 425 mm on the plains to more than 1,200 mm in the Alps.
The region’s native plants and animals include River Red Gums, Murray Cod and several threatened species including Leadbeater’s Possum, Mountain Pygmy Possum, Spotted Tree Frog and Regent Honeyeater.
The Bluff, Alpine National Park © Rowhan Marshall

46 Reducing Victoria’s bushfire risk on public land | Fuel management report 2014–15
CASE STUDY
Effective stakeholder relationships help deliver record program
Despite difficult weather conditions for the 2014–15 planned burning program, the four districts that make up the Hume region achieved the largest-ever planned burning program in the region. In total, there were 146 burns ignited across the region, resulting in 86,387 ha being treated. This achievement was the result of good planning, preparation and delivery by staff at the local, district and regional levels.
To achieve the record program, we needed to increase our engagement with stakeholders and the community. Much of this increased engagement occurred during the autumn planned burning program—with vignerons, apiarists, tourism operators, local governments and event organisers—to mitigate the impacts of smoke.
Throughout the year, we negotiated where possible with stakeholders (face-to-face and by email and phone) about the timing of burns to avoid potential impacts to grape harvesting, regional events and the Easter holidays and Queens Birthday long weekend.
Hum
e region
Smoke from fires can permeate the skin of grapes, and wine made from smoke-tainted grapes may be unmarketable © Caitlin Cruikshank

Reducing Victoria’s bushfire risk on public land | Fuel management report 2014–15 47
� Community�engagementDuring the year, regional staff engaged with representatives of local government agencies, emergency management agencies, registered Aboriginal parties and traditional owners, environmental groups, vignerons, the tourist industry, apiarists and other government departments and agencies.
We engaged with these stakeholders to develop the FOP, to develop the SBMP and to implement the planned burning program.
Engagement was through face-to-face meetings and forums, video messaging, email and phone calls, both as the occasion required and through our communication agreements with industry groups.
We increased our engagement with CFA at its regional, district and local levels. We sent daily and seven-day outlook planned burning notifications to about 400 organisations and individuals. Much of the on-ground operational engagement was during autumn planned burning, mainly with vignerons, apiarists, tourism operators and event organisers to mitigate the impacts of smoke.
Staff also attended the annual regional vigneron planned burning forum, the North East Apiarist Association forum and community events (such as the Myrtleford Show and the Man From Snowy River Bush Festival), Indigenous employment and training events, and other community events hosted by partner agencies.
Some challenges arose with wine and grape growers during the implementation of the planned burning program, with harvesting being delayed. Engagement in the future will focus on reducing the impacts on harvesting.
� Burn�planning�and�preparationTable 20 shows data for the region’s burn planning and preparation in 2014–15. It shows that burn plans were prepared, and sites prepared, for over double the target area for fuel management (262% and 211.9% respectively).
Table�20:�Burn�planning�and�site�preparation�data
Hume�region Ha %�of�TAFM
Target�area�for�fuel�management�(TAFM) 63,069
Area for which burn plans were prepared (over the three-year FOP) 165,227 262.0%
Area for which burns were planned and sites prepared 133,629 211.9%
Hum
e region
We engage with stakeholders and the community in all aspects of strategic bushfire management planning © DELWP

48 Reducing Victoria’s bushfire risk on public land | Fuel management report 2014–15
Fuel�management�activitiesTable 21 shows data for the region’s fuel management activities in 2014–15. It shows that the area we treated by planned burning was 37% greater than the target area of 63,069 ha for fuel management, and that the total area that was fuel-reduced exceeded the target by 38.8%.
During the year, DELWP conducted 75 ecological and fuel-reduction burns in the region. CFA helped DELWP with two of these, assisting with the treatment of 1,108 ha by planned burning.
The region had favourable conditions for planned burning, and we burnt significantly more than the target area for fuel management. We were able to start planned burning for autumn in February—earlier than usual—and managed the risk of breaches despite some testing weather conditions.
� MonitoringMER activities were limited this year while we focused on developing the SBMP.
During the year, we conducted:
• assessments at 12 sites of the two-year post-burn recovery and 6 sites of the five-year post-burn recovery of plant species and recorded a total of 307 species
• 18 all-species assessments of the post-burn recovery of plant species; we also assessed 5 control sites.
As part of the landscape mosaic burning project at Scrubby Thowgla, we conducted assessments at:
• 22 sites of the two-year post-burn recovery of birds in mosaic burns and recorded 57 species across 7 EVCs: Damp forest (3 sites, 32 species), Heathy dry forest (1 site, 12 species), Herb-rich foothill forest (3 sites, 34 species), Montane damp forest (1 site, 18 species), Montane dry forest (5 sites, 35 species), Shrubby dry forest (6 sites, 39 species) and Wet forest (3 sites, 34 species)
• 22 sites to assess the two-year post-burn recovery of plant species in mosaic burns and recorded 196 species across 7 EVCs: Damp forest (3 sites, 79 species), Heathy dry forest (1 site, 29 species), Herb-rich foothill forest (3 sites, 71 species), Montane damp forest (1 site, 39 species), Montane dry forest (5 sites, 78 species), Shrubby dry forest (6 sites, 76 species) and Wet forest (3 sites, 78 species)
• 22 sites (by camera) of the two-year post-burn recovery of mammals in mosaic burns. The number of species was not yet determined at the time of preparing this report because we were processing the camera data.
Next year we will develop our MER plan and focus on critical key evaluation questions.
Table�21:�Fuel�management�activity�data
Hume�region Ha Ha�toward�target %�of�target
Target�area�for�fuel�management��� 63,069
Area treated by planned burning 86,387 86,387 137.0%
Ecological burns 65 ha (3 burns)
Fuel-reduction burns 85,459 ha (72 burns)
Other burns 863 ha (71 burns)
Area treated by other fuel management methods 1,078 1,078 1.7%
Area suitable for planned burning burnt by bushfires 2,197
(including area planned for burning on a current FOP) 71 0.1%
Total�fuel-reduced�area�(actual)��� 89,662 87,536 138.8%
Hum
e region

Reducing Victoria’s bushfire risk on public land | Fuel management report 2014–15 49
Loddon Mallee region
Loddon Mallee regionThe Loddon Mallee region comprises two fire districts: Murray Goldfields and Mallee.
The region has corridors forested with River red gum along the River Murray graduating to cleared dry farmland and large tracts of Mallee and heath on sandy soils. The southern part also has isolated patches of Box Ironbark forest and mixed-species foothill forests.
The region generally has hot summers and mild winters in the west and hot summers with wet and cold winters in the east. Annual average rainfall ranges from 250 mm to 700 mm across the region.
The region is home to 175 threatened animal and 533 threatened plant species including numerous rare and threatened orchids that DELWP is helping to conserve. The grasslands at Terrick Terrick are listed under the Commonwealth Environment Protection and Biodiversity Conservation Act 1999 and there are internationally significant wetlands at Hattah and Kerang.
Gunbower Creek © Carol McCormack DELWP
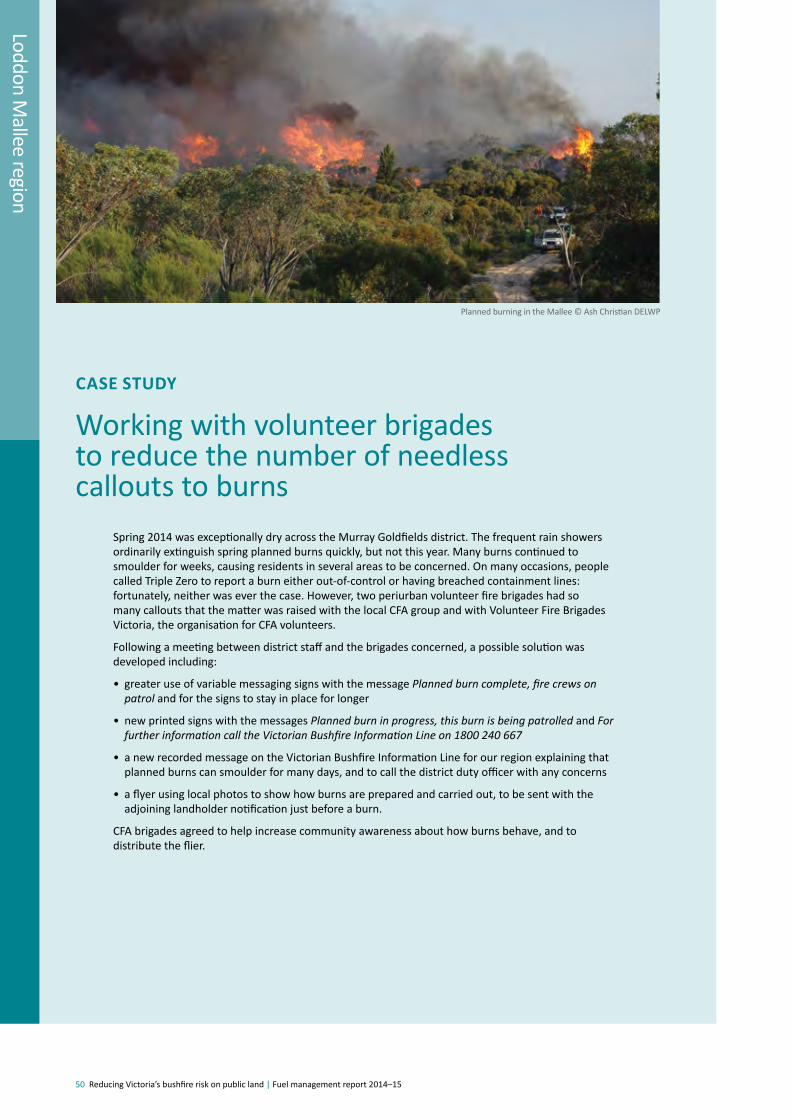
50 Reducing Victoria’s bushfire risk on public land | Fuel management report 2014–15
CASE STUDY
Working with volunteer brigades to reduce the number of needless callouts to burns
Spring 2014 was exceptionally dry across the Murray Goldfields district. The frequent rain showers ordinarily extinguish spring planned burns quickly, but not this year. Many burns continued to smoulder for weeks, causing residents in several areas to be concerned. On many occasions, people called Triple Zero to report a burn either out-of-control or having breached containment lines: fortunately, neither was ever the case. However, two periurban volunteer fire brigades had so many callouts that the matter was raised with the local CFA group and with Volunteer Fire Brigades Victoria, the organisation for CFA volunteers.
Following a meeting between district staff and the brigades concerned, a possible solution was developed including:
• greater use of variable messaging signs with the message Planned burn complete, fire crews on patrol and for the signs to stay in place for longer
• new printed signs with the messages Planned burn in progress, this burn is being patrolled and For further information call the Victorian Bushfire Information Line on 1800 240 667
• a new recorded message on the Victorian Bushfire Information Line for our region explaining that planned burns can smoulder for many days, and to call the district duty officer with any concerns
• a flyer using local photos to show how burns are prepared and carried out, to be sent with the adjoining landholder notification just before a burn.
CFA brigades agreed to help increase community awareness about how burns behave, and to distribute the flier.
Loddon Mallee region
Planned burning in the Mallee © Ash Christian DELWP

Reducing Victoria’s bushfire risk on public land | Fuel management report 2014–15 51
CASE STUDY
Evaluating PHOENIX RapidFireThere is some anecdotal evidence that the PHOENIX RapidFire bushfire simulation software calculates the rate of spread (ROS) and spotting distance of bushfires in the Mallee as significantly greater than they actually are. Such doubts reduce the confidence that fire behaviour analysts in the Mallee have in the software when preparing plans and during incidents. As confidence in the modelling software is essential for good bushfire management planning, the Mallee Murray Goulburn bushfire risk landscape team commissioned an evaluation of PHOENIX RapidFire in the Mallee.
The evaluation compared the ROS of actual bushfires with simulated bushfires ignited at the same location. It drew on data, including about bushfire perimeters at particular time intervals, from log books and previous case studies. Data about final fire perimeters came from DELWP’s fire history database.
The PHOENIX RapidFire software allows for simulations at different fire danger indices (FDIs), a fire danger rating that accounts for differing moisture and meteorological conditions. The evaluation found that under the lower FDIs, the software generally overestimates—sometimes significantly—the ROS in the Mallee spinifex fuel type. This overestimation is due to poor weather and fuel condition data. With more severe FDIs, the software predicts the ROS accurately. In Mallee shrub/heath and Dry heath fuel types, the software slightly underestimates the ROS, regardless of the FDI.
These results will improve confidence in PHOENIX RapidFire simulations when conducting strategic bushfire management planning, which uses the most severe FDI. The overestimation at mild FDIs, now known, can be accounted for in other planning activities and in fire behaviour analysis during bushfire incidents.
Loddon Mallee region
A Mallee bushfire © Nathan Christian DELWP

52 Reducing Victoria’s bushfire risk on public land | Fuel management report 2014–15
Figure�14:�Areas�mapped�as�irrigation�(in�blue)�before�2015�and�after�correction.
Loddon Mallee region
CASE STUDY
Less irrigation, more riskExtensive irrigation in the Shepparton and Swan Hill area has resulted in large areas being difficult to ignite: irrigated paddocks are green in summer and can’t burn. PHOENIX RapidFire, our bushfire simulation software, models bushfire risk as very low in this area. However, there has been less irrigation in recent years, a trend we expect will continue.
In collaboration with the CFA we analysed the historical greenness of vegetation using MODIS imagery and verified that irrigated areas were overrepresented in the fuel layer; we corrected our models accordingly (as Figure 14 shows). We now model fuel loads as higher in many places in this area. Simulations using the new data show there is now a higher risk from bushfire in this area.
PHOENIX RapidFire statewide simulations use a grid of ignition points 5 km apart. When we revised our PHOENIX RapidFire simulations for our higher fuel load areas, we realised that most roads in this part of Victoria run parallel to each other and that, coincidentally, the road grid imitates the statewide ignition grid. If a fire starts near or on a road, PHOENIX RapidFire assumes the fire will self-extinguish or being easily suppressed. This means that the statewide PHOENIX RapidFire calculations may have been underestimating the risk in some areas. Therefore, we reran our calculations using a 1 km grid and compared our findings with the statewide findings. We found there is a higher risk than previously simulated, particularly in the Rushworth and Lake Boga areas.
A revised fuel layer for the state is being developed that incorporates improvements such as the irrigated areas.

Reducing Victoria’s bushfire risk on public land | Fuel management report 2014–15 53
� Community�engagementDuring the year, staff increased their notifications to the community about the planned burning program. The region bought six variable message sign trailers for this purpose and increased the number of letters sent to apiarists, vineyards and adjoining leaseholders, warning of planned burns and inviting communication between stakeholders and district fire staff.
We held a very successful open house to discuss new burns with stakeholders in the Murray Goldfields district.
The 47th annual Big Desert Fire Conference provided an excellent opportunity for local emergency services to be informed about upcoming planned burning.
We worked with local CFA brigades to provide the community with information about the behaviour of planned burns, and how we plan and deliver them, to reduce the number of unnecessary callouts by volunteer brigades to planned burns.
� Burn�planning�and�preparationTable 22 shows data for the region’s burn planning and preparation in 2014–15. It shows that burn plans were prepared, and sites prepared, for about three-quarters more than the target area for fuel management (181.2% and 174.8% respectively).
Fuel�management�activitiesTable 23 shows data for the region’s fuel management activities in 2014–15. It shows that planned burning contributed about a quarter (25.9%) to the total target area of 64,500 ha for fuel management, and that the total area that was fuel-reduced was about one-third (33.4%) of the target.
During the year, DELWP conducted 63 ecological and fuel-reduction burns in the region. CFA helped DELWP with two of these, assisting with the treatment of 75 ha by planned burning.
Planned burning opportunities in the region were reduced by:
• the early onset of cool, moist weather in late autumn, reducing autumn burning opportunities
• below-average winter rainfall contributing to areas being too dry in spring
• above-average rainfall contributing to areas being too wet (as occurred in southern Victoria in winter and in much of Gippsland in spring and summer).
Table�22:�Burn�planning�and�site�preparation�data
Loddon�Mallee�region Ha %�of�TAFM
Target�area�for�fuel�management�(TAFM) 64,500
Area for which burn plans were prepared (over the three-year FOP) 116,849 181.2%
Area for which burns were planned and sites prepared 112,726 174.8%
Table�23:�Fuel�management�activity�data
Loddon�Mallee�region Ha Ha�toward�target %�of�target
Target�area�for�fuel�management��� 64,500
Area treated by planned burning 16,698 16,698 25.9%
Ecological burns 6,863 ha (10 burns)
Fuel-reduction burns 9,824 ha (53 burns)
Other burns 11 ha (10 burns)
Area treated by other fuel management methods 3,855 3,855 6.0%
Area suitable for planned burning burnt by bushfires 2,706
(including area planned for burning on a current FOP) 980 1.5%
Total�fuel-reduced�area�(actual)��� 23,259 21,533 33.4%
Loddon Mallee region

54 Reducing Victoria’s bushfire risk on public land | Fuel management report 2014–15
� MonitoringMER activities were limited this year while we focused on developing the MER plan for the West Central bushfire risk landscape. The plan will be implemented from 2016. It will apply over a five-year period and outlines our priority key evaluation questions. In 2016, we aim to establish systematic monitoring processes to measure the effectiveness of fuel management in reducing bushfire risk.
During the year, we used local knowledge to improve and update fire history information for areas with no recorded fire history. This will enable more accurate bushfire risk modelling. We used Landsat imagery to improve our fire history information for the Little Desert National Park.
As explained in the Evaluating PHOENIX RapidFire case study, we compared the spread and extent of 13 fires to PHOENIX RapidFire simulations of those fires, to evaluate the accuracy of the simulations. This project has informed changes to the way we use PHOENIX RapidFire in the Mallee.
As explained in the Less irrigation, more risk case study, we used imagery to locally update the fuel layer to reflect the current area of land under irrigation. The decrease in land under irrigation results in more flammable fuels in irrigation areas over summer. The fuel layer was updated to more accurately reflect this.
During the year, we conducted:
• ant surveys at 60 sites to contribute to important work on the endangered Pink-Tail Worm Lizard
• habitat structure assessments at 264 sites in the Box Ironbark forest to address key evaluation questions about GSS
• flora assessments at 14 sites to assess the five-year post-burn recovery of flora after burning and recorded 154 species: data from these sites will help answer the TFI key evaluation questions
• 14 all-species assessments to assess the post-burn recovery of flora species and 19 control sites.
Loddon Mallee region
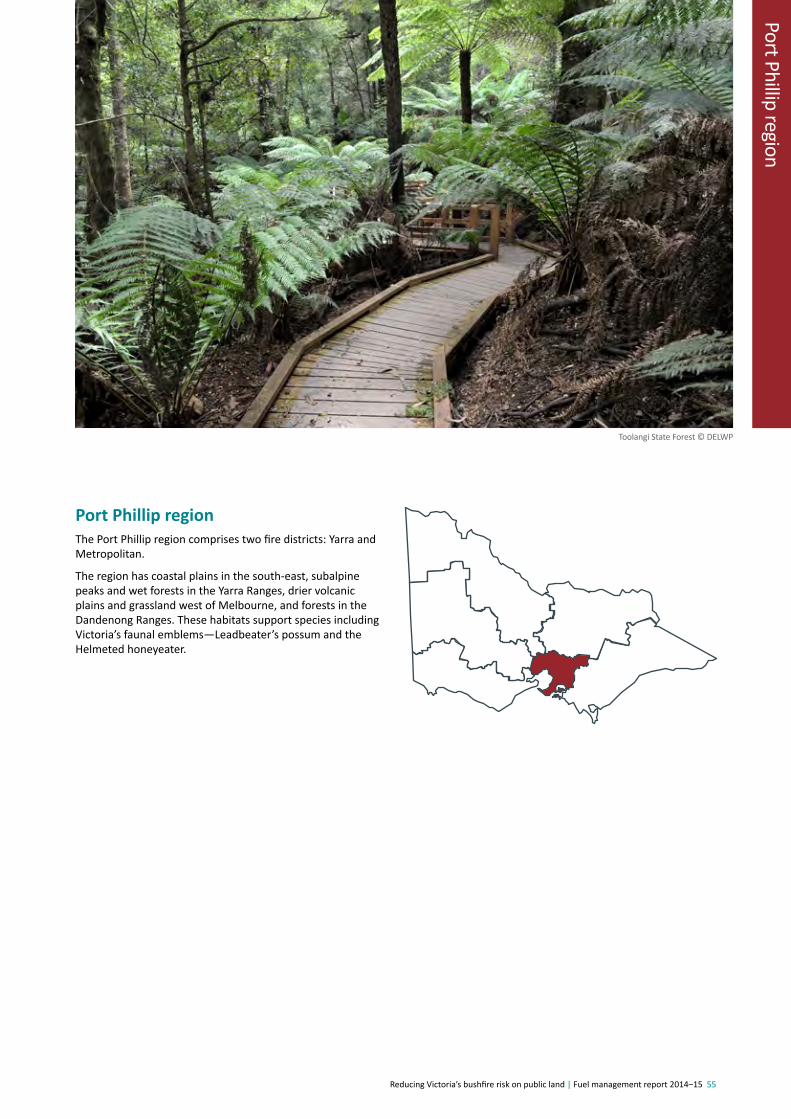
Reducing Victoria’s bushfire risk on public land | Fuel management report 2014–15 55
Port Phillip region
Port�Phillip�regionThe Port Phillip region comprises two fire districts: Yarra and Metropolitan.
The region has coastal plains in the south-east, subalpine peaks and wet forests in the Yarra Ranges, drier volcanic plains and grassland west of Melbourne, and forests in the Dandenong Ranges. These habitats support species including Victoria’s faunal emblems—Leadbeater’s possum and the Helmeted honeyeater.
Toolangi State Forest © DELWP

56 Reducing Victoria’s bushfire risk on public land | Fuel management report 2014–15
CASE STUDY
Engaging with industry groups to develop the East Central Strategic Bushfire Management Plan
During the year, the East Central bushfire risk landscape team developed the first East Central SBMP. A key aim of the plan is to minimise the risk from bushfires to priority infrastructure, particularly to the landscape’s priority power and water infrastructure.
The team met with representatives of the (then) Department of State Development, Business and Innovation (now part of the Department of Economic Development, Jobs, Transport and Resources) and with power industry companies including AGL, Loy Yang and SP-Ausnet. These meetings aimed to validate our analysis with industry knowledge and to allow us to refine our plans with information from the industry’s natural hazard contingency plans.
We also collaborated with Melbourne Water, Gippsland Water and Southern Rural Water to ensure the plan prioritised key water infrastructure and to ensure information in the Victorian Fire Risk Register about water assets was up-to-date.
As a result, we could ensure that priority infrastructure is identified for protection through the SBMP.
Port Phillip region
Thomson Reservoir © DELWP
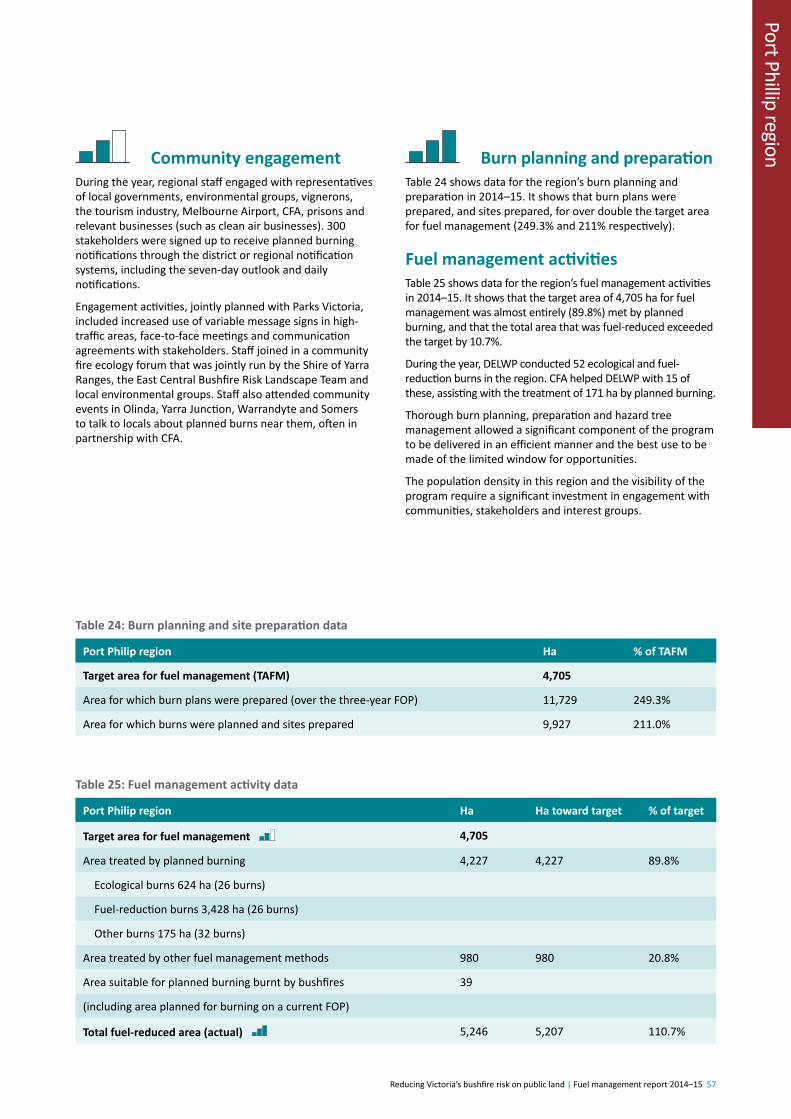
Reducing Victoria’s bushfire risk on public land | Fuel management report 2014–15 57
Port Phillip region� Community�engagementDuring the year, regional staff engaged with representatives of local governments, environmental groups, vignerons, the tourism industry, Melbourne Airport, CFA, prisons and relevant businesses (such as clean air businesses). 300 stakeholders were signed up to receive planned burning notifications through the district or regional notification systems, including the seven-day outlook and daily notifications.
Engagement activities, jointly planned with Parks Victoria, included increased use of variable message signs in high-traffic areas, face-to-face meetings and communication agreements with stakeholders. Staff joined in a community fire ecology forum that was jointly run by the Shire of Yarra Ranges, the East Central Bushfire Risk Landscape Team and local environmental groups. Staff also attended community events in Olinda, Yarra Junction, Warrandyte and Somers to talk to locals about planned burns near them, often in partnership with CFA.
� Burn�planning�and�preparationTable 24 shows data for the region’s burn planning and preparation in 2014–15. It shows that burn plans were prepared, and sites prepared, for over double the target area for fuel management (249.3% and 211% respectively).
Fuel�management�activitiesTable 25 shows data for the region’s fuel management activities in 2014–15. It shows that the target area of 4,705 ha for fuel management was almost entirely (89.8%) met by planned burning, and that the total area that was fuel-reduced exceeded the target by 10.7%.
During the year, DELWP conducted 52 ecological and fuel-reduction burns in the region. CFA helped DELWP with 15 of these, assisting with the treatment of 171 ha by planned burning.
Thorough burn planning, preparation and hazard tree management allowed a significant component of the program to be delivered in an efficient manner and the best use to be made of the limited window for opportunities.
The population density in this region and the visibility of the program require a significant investment in engagement with communities, stakeholders and interest groups.
Table�24:�Burn�planning�and�site�preparation�data
Port�Philip�region Ha %�of�TAFM
Target�area�for�fuel�management�(TAFM) 4,705
Area for which burn plans were prepared (over the three-year FOP) 11,729 249.3%
Area for which burns were planned and sites prepared 9,927 211.0%
Table�25:�Fuel�management�activity�data
Port�Philip�region Ha Ha�toward�target %�of�target
Target�area�for�fuel�management��� 4,705
Area treated by planned burning 4,227 4,227 89.8%
Ecological burns 624 ha (26 burns)
Fuel-reduction burns 3,428 ha (26 burns)
Other burns 175 ha (32 burns)
Area treated by other fuel management methods 980 980 20.8%
Area suitable for planned burning burnt by bushfires 39
(including area planned for burning on a current FOP)
Total�fuel-reduced�area�(actual)��� 5,246 5,207 110.7%

58 Reducing Victoria’s bushfire risk on public land | Fuel management report 2014–15
� MonitoringMER activities were limited this year while we focused on developing the MER plan for the East Central bushfire risk landscape, of which the Port Phillip region is a large part. The plan was drafted for endorsement and will be implemented from 2016. It will apply over a five-year period and outlines our priority key evaluation questions. In 2016, we aim to establish systematic monitoring to measure the effectiveness of fuel management in reducing bushfire risk.
We did continue some monitoring of fuel hazard and fire severity to help test a revised method for fuel hazard sampling and the new classification system for fire severity mapping. We also conducted flora monitoring as part of legacy statewide pre- and post-burn flora monitoring on sites due for five-year post-burn assessments.
During the year, we conducted 94 fuel hazard assessments, to better understand fuel accumulation rates. We completed post-burn fire severity mapping on 23 burns. We planned to map 48 burns but not all these burns were completed during 2014–15 and we will map them after they are completed.
During the year, we conducted:
• flora assessments at 9 sites to assess two-year post-burn recovery and at 3 sites to assess five-year post-burn recovery of flora after burning, and we recorded a total of 163 species
• 12 all-species assessments of the post-burn recovery of flora species and assessed 3 control sites.

Reducing Victoria’s bushfire risk on public land | Fuel management report 2014–15 59
ReferencesCheal, D. (2010) The development of EVD growth stages as a tool for fire management planning. In: Growth stages and tolerable fire intervals for Victoria’s native vegetation data sets. Fire and Adaptive Management Report No. 84, pp 28–36. Department of Sustainability and Environment, East Melbourne, Victoria, Australia.
Department of Environment and Primary Industries (2013), Victorian Bushfire Risk Profiles, Department of Environment and Primary Industries, East Melbourne, Victoria, Australia.
Department of Environment and Primary Industries (2014), Bushfire Management Engagement Strategy 2014–18. Department of Environment and Primary Industries, East Melbourne, Victoria, Australia.
Department of Environment, Land, Water and Planning (2015), Monitoring, Evaluation and Reporting Framework for Bushfire Management on Public Land, Department of Environment, Land, Water and Planning, East Melbourne, Victoria, Australia.
Hines, F., Tolhurst, K., Wilson, A. A. G. and McCarthy, G. J. (2010) Overall fuel hazard assessment guide, 4th edition, Fire and Adaptive Management Report No. 82, Department of Sustainability and Environment, East Melbourne, Victoria, Australia.
Inspector-General for Emergency Management (2015), Review of performance targets for bushfire management on public land, Inspector-General for Emergency Management, Melbourne, Victoria, Australia.
Victorian Bushfires Royal Commission (2010) 2009 Victorian Bushfires Royal Commission Final Report. Parliament of Victoria, Victoria, Australia.

60 Reducing Victoria’s bushfire risk on public land | Fuel management report 2014–15
1 Overall Fuel Hazard Assessment Guide, 4th edition July 2010, Fire and adaptive management report no. 82, Fire Management Branch, Department of Sustainability and Environment, Melbourne.
Appendix 1: Accounting framework for bushfire fuel management treatments
IntroductionUnder the Forests Act 1958, the Secretary to the Department of Environment, Land, Water and Planning is responsible for carrying out proper and sufficient work in State forests, national parks and on protected public land to prevent and suppress bushfires. Bushfire fuel treatment contributes to meeting this outcome.
In a forest or grassland, bushfire fuel is any material that can burn (be ignited and sustain a fire) under certain conditions, including grass, leaf litter, bark, woody debris and live vegetation. Bushfire fuel treatments can be undertaken to modify the load, continuity and arrangement of fuels and reduce the risk of bushfire.
Planned burning is generally the most effective treatment for managing bushfire fuel over large areas. Other treatments (that can be applied at different scales) include slashing, mowing, fuel break construction.
This accounting framework does not apply to outcomes that are not related to bushfire fuel treatment. Land management and/or ecological outcomes are prescribed at the landscape or program level. DELWP will report on the achievement of ecological outcomes as a component of public accountability.
Policy
Accounting�unitThe basic accounting unit for the amount of bushfire fuel management activities in Victoria is the ‘treated area’.
The treated area is the area (in hectares) of land identified on a Fire Operations Plan on which a bushfire fuel treatment has been successfully undertaken to achieve a pre-defined bushfire fuel treatment objective.
Planned areaThe ‘planned area’ is a unit of land identified on a Fire Operations Plan.
Bushfire�fuel�treatment�objectiveA bushfire fuel treatment objective must be established for the ‘planned area’. The objective should be set considering (but not limited to):
• the type and amount of bushfire fuel treatment required to assist in the prevention and suppression of bushfire.
• the height, cover and type of bushfire fuel present at the site.
• legislative requirements, the Code of Practice for Bushfire Management on Public Land 2012 and other relevant policy, the overall land management objectives.
The bushfire fuel treatment objective should be simple, measurable, achievable and realistic. It must be approved prior to undertaking the bushfire fuel treatment for the planned area.
A bushfire fuel treatment objective must specify:
• fuel�treatment�coverage – the portion of the planned area over which the intended fuel outcome is to be achieved, generally expressed as a percentage. The fuel outcomes will be expressed in terms of overall fuel hazard1 or other measures such as height.
• treatment�timeframe/persistence – the timeframe over which the treatment is to be undertaken or persist to achieve the treatment coverage.
Treated areaIf for a planned area the fuel treatment coverage and treatment timeframe are both met, the planned area is determined to be a ‘treated area’

Reducing Victoria’s bushfire risk on public land | Fuel management report 2014–15 61
Bushfire�fuel�management�treatmentsThe type of treatment to be applied should be determined as part of the planning process, and must consider legislative requirements (including any restrictions on the use of a particular treatment type), land management objectives, the bushfire fuel treatment objective and the height, cover and type of bushfire fuel present at the site
The following bushfire fuel treatments are approved for accounting purposes. Each treatment type must be accounted for separately.
• treatment by fire including:
- Planned burning
- Bushfires where they occur in areas pre-planned for fuel treatments.
• mechanical treatment (for example, mowing, slashing and mulching) where identified on an approved Fire Operations Plan
• chemical treatment for example by using herbicide where identified on an approved Fire Operations Plan.
• grazing by domestic stock - Targeted strategic grazing by domestic stock (typically cattle or sheep) can impact on bushfire fuel by physically removing and compacting vegetation (commonly grasses). Grazing by domestic stock may only be accounted for as a bushfire fuel treatment where it is specifically undertaken to manage bushfire fuel and has been identified in an approved Fire Operations Plan.
• other treatments approved by the Secretary to the Department of Environment, Land, Water and Planning


www.delwp.vic.gov.auCustomer Service Centre 136 186