reducing voltage volatility with step voltage regulators...
TRANSCRIPT

energies
Article
Reducing Voltage Volatility with Step VoltageRegulators: A Life-Cycle Cost Analysis of KoreanSolar Photovoltaic Distributed Generation
Yu-Cheol Jeong 1, Eul-Bum Lee 2,3,* and Douglas Alleman 4
1 KEPCO EC (Korea Electric Power Corporation Engineering Construction), 269 Hyeoksin-ro,Gimcheon 39660, Korea; [email protected]
2 Graduate Institute of Ferrous Technology, Pohang University of Science and Technology (POSTECH),77 Cheongam-Ro, Nam-Ku, Pohang 37673, Korea
3 Department of Industrial and Management Engineering, Pohang University of Science andTechnology (POSTECH), 77 Cheongam-Ro, Nam-Ku, Pohang 37673, Korea
4 Construction Engineering and Management, Department of Civil, Environmental and ArchitecturalEngineering, University of Colorado, Boulder, CO 80309, USA; [email protected]
* Correspondence: [email protected]; Tel.: +82-54-279-0136
Received: 24 January 2019; Accepted: 11 February 2019; Published: 18 February 2019
Abstract: To meet the United Nation’s sustainable development energy goal, the Korean Ministryof Commerce announced they would increase renewable energy generation to 5.3% by 2029. Theseenergy sources are often produced in small-scale power plants located close to the end users, knownas distributed generation (DG). The use of DG is an excellent way to reduce greenhouse gases buthas also been found to reduce power quality and safety reliability through an increase in voltagevolatility. This paper performs a life-cycle cost analysis on the use of step voltage regulators (SVR) toreduce said volatility, simulating the impact they have on existing Korean solar photovoltaic (PV) DG.From the data collected on a Korean Electrical Power Corporation 30 km/8.2 megawatts (MW) feedersystem, SVRs were found to increase earnings by one million USD. SVR volatile voltage mitigationincreased expected earnings by increasing the estimated allowable PV power generation by 2.7 MW.While this study is based on Korean PV power generation, its findings are applicable to any DGsources worldwide.
Keywords: renewable energy; solar photovoltaic; distributed generation; net present value; life-cyclecost analysis; step voltage regulator
1. Introduction
In January 2015, United Nation members agreed to 17 sustainable development goals. Theseincluded substantially increasing the share of renewable energy worldwide [1]. In accordance withthis goal, the Korean Ministry of Commerce announced they would increase electricity generatedthrough renewable sources to 5.3% by 2029 [2]. Furthermore, Korea aims to generate 12.5% of their totalelectricity through distributed generated (DG) power, as opposed to through conventional centralizedgenerated power [2]. DG energy sources generate less than 10 megawatts (MW), are located neartheir end users, and tend to be in the form of renewable energy [3]. These sources are becomingpopular worldwide due to their potential to limit greenhouse gas emissions, reduce new transmissionline construction, enhance energy security, and lower investment risks [4]. However, they also oftencause reverse flow [5], voltage fluctuations, and harmonics occurrences which all result in systemwidepower distribution grid reliability and safety concerns [6]. These occurrences negatively impactthe management of harmonics, stand-alone operations, protection coordination, power factors, and
Energies 2019, 12, 652; doi:10.3390/en12040652 www.mdpi.com/journal/energies

Energies 2019, 12, 652 2 of 16
frequencies [7]. To cope with these problems, power and utility corporations such as the Korea ElectricPower Corporation (KEPCO) need to find ways to mitigate voltage fluctuation while still allowing anincrease in feeder DG capacity [8]. This paper performs a life-cycle cost analysis (LCCA) of mitigatingsolar photovoltaic (PV) DG voltage volatility through step voltage regulators (SVR), pillar transformers,and an on-load tap-changers (OLTC) on an existing 30 km/8.2 MW KEPCO feeder.
There has been significant research interest within the larger field of DG penetration and associatedvoltage management. Lopes et al. [4] present an overview of the key issues concerning DG penetration,suggesting best practice mitigating planning, operations, and active management processes. Chae [8],Barker [9], Kim [10], and Duong et al. [11] analyzed the voltage characteristics of consumers connectedto power networks with large DG penetration, finding load increases and power quality issues suchas over and under voltage. Quezada et al. [12] found a correlation between the increase of DGpenetration and a reduction in usable power. To this end, Viral and Khatod [13], Esmaili et al. [14],and Gkaidatzis et al. [15] have presented the optimal sizing and locations of DG penetration thatminimize system energy losses. Abdmouleh et al. [16] specifically optimized DG penetration asproduced by renewable energy sources to minimize annual energy loss considering constraintssuch as voltage limits, distribution network capacity, maximum penetration limit, and availableDG units. Concerning the benefits of DGs, Chiradeja and Ramakumar [17] quantified them asreduced line and transformer losses, reduced reserve requirements, improved system voltage profiles,increased system reliability, enhanced power quality, peak shaving, and relieved transmission anddistribution congestion.
In assessing differing methods of mitigating voltage fluctuations, Chae found the installationof SVR to be the most impactful [8]. Building off this finding, there have been multiple researchendeavors dedicated to the effectiveness of SVR. Lee et al. [18] proposed an optimal voltage adjustmentalgorithm for the use of OLTC and SVR to increase voltage stability. Takahashi [19] proposed a methodof automating the OLTC and SVR tap-changers from the central voltage control center via data fromthe information technology switch. Liu et al. [20] proposed a distributed energy storage systemwhich provides voltage rise management and relieves stresses on the OLTC and SVR tap-changers.Kojovic [21,22], Lee [23], and Kim [24,25] studied SVR’s integration into distribution networks withhigh DG penetration, finding them to have a positive effect on the line voltage control. Finally, Shin [26]investigated the delivery voltage of the OLTC such that a large-capacity DG would not create unsafevoltage variations when penetrating the distribution network.
There have also been studies dedicated to voltage fluctuation mitigation that do not include theuse of OLTC and SVR. Farag and El-Saadany [27] proposed a multi-agent voltage control structure foradjusting the voltage of a distribution line with high DG penetration. Thirugnanam et al. [28] is oneof many publications to propose the use of a battery energy management system for PV microgridsto smooth out the power fluctuations. Bjelic and Ciric [29] studied the impact combining hydro,combined heat and power, PV, and/or wind power generation has on optimizing DG planning at alocal level. While outside of the purview of this study, it is necessary to understand that tap-changingequipment is just one of the ways to mitigate DG voltage fluctuation.
Another area of DG research is the economics of power generation. Strbac et al. [30] found thecost of DG electricity to be two to three times more expensive to produce than traditional centralizedgenerated power [31]. This finding was mirrored by Audenaert et al. [32] who found PV powersystems to have a negative net present value (NPV). Alternatively, Kolhe et al. [33] Bernal-Augustinand Dufo-Lopez [34] found PV power generation economically viable. Kolhe et al. [33] compared theeconomic efficiency of a stand-alone solar PV system versus a conventional diesel-powered generationplant finding the PV system to be economically competitive. Bernal-Augustin and Dufo-Lopez [34]also conducted a financial analysis of PV systems, finding PV power generation plants to be financiallyviable but with long payback periods. Finally, from a more generalized approach, Muttaqi et al. [35]proposed an economic optimization of DG plant development which included the direct and indirectcosts of power supply quality, reliability, energy loss, total power operation, and DG investment. While

Energies 2019, 12, 652 3 of 16
all significant contributions to the body of knowledge, the existing DG economic literature restrictsthe boundaries of assessment to a singular power plant, often within renewable generation [36,37].Furthermore, there has yet to be an economic assessment on the feasibility of voltage mitigationmeasures [38]. As such, the novelty of this paper is in investigating what impact integrating voltageadjustment equipment (OLTC and SVR) has on a feeder distribution network system’s LCCA withand without solar PV power penetration.
2. Research Methodology and Data Collection
Figure 1 below depicts the data collection and research methodology required to achieve theabove research goals. The authors performed DG capacity analyses of existing KEPCO feeder lines,finding the maximum acceptable DG penetration with and without the use of SVRs. An LCCA wasperformed from these findings, taking into account economic variables such as the discount rate,service life, depreciation, tax rate, capital (CAPEX) and operational expenditures (OPEX), and revenueoptions. The final product is the internal rate of return (IRR), NPV, and profitability index (PI) of thefeeder system with and without the installation of an SVR. These processes are described in greaterdetail in the following sections.
1
Figure 1. Research methodology.
2.1. Data Collection
The authors collected data from KEPCO and their subsidiaries on feeder layouts,feeder node-to-node characteristics, existing solar power plant capacity, and general economic data.A distribution network was developed based on said KEPCO data collection, current Korea PVrenewable energy distribution market, and typical SVR and DG characteristics. This is representedbelow in Figure 2. The resultant network includes four feeders and is used to perform simulations ofvoltage characteristics through the matrix laboratory (MATLAB) software. The following assumptionswere used in the analysis:
1. The scheme of the selected simulated power distribution network is shown in Figure 2 [26].2. Although four feeders are shown, the authors only simulated Feeder 1, as it is the most complex.3. The load ratio, consistent for all feeders, is 1 at the maximum load and 0.3 at the minimum load.4. The load of the whole system is 32.8 MW and the power factor is 0.9.5. The distribution system consists of four feeders, each of which has a load of 8.2 MW and a
0.9 power factor, with a total load capacity of 32.8 MW.6. The section data of the high-voltage distribution line is shown in Table 1, below.

Energies 2019, 12, 652 4 of 16
7. The output voltage of the main transformer is adjusted by the line drop compensation (LDC)method presented in Section 2.2. The parameters of the main transformer, OLTC and SVR areshown below.
8. Pillar transformer taps shall be applied with 13,200 V taps when the voltage drop is less than 5%at full load, and 12,600 V taps when exceeding 5%.
9. The DG power supply is connected to the ends of Feeders 1 and 2 first, and the power factor is0.9. Thereafter, the location of the DG power supply is moved around along the feeder line oneand two between the branches to assess the criticality of the voltage fluctuation and regulation.This is needed to generalize the model in the case of a different DG being connected along theline, as recent research by Mahmud and Zahedi highlighted [39].
Table 1. High-voltage distribution line section data for Feeder 1.
Node No. Length (l)(km)
Load Ratio[%]
Pole Transformer Tap(V/V)From To
0 1 5 3 13,200/2301 2 4 3 13,200/2302 3 4 1 12,600/2304 5 2 3 12,600/2305 6 5 4 12,600/2306 7 4 7 12,600/2307 8 6 5 12,600/230
Energies 2019, XX, Y FOR PEER REVIEW 4 of 16
9. The DG power supply is connected to the ends of Feeders 1 and 2 first, and the power factor is 0.9. Thereafter, the location of the DG power supply is moved around along the feeder line one and two between the branches to assess the criticality of the voltage fluctuation and regulation. This is needed to generalize the model in the case of a different DG being connected along the line, as recent research by Mahmud and Zahedi highlighted [39].
Prior to performing calculations with a hypothetical SVR, the authors calculated existing feeder conditions and voltage, observing the required OLTC and pillar transformer tap changes to maintain the allowable voltage. The results of this are shown in Table 5 in the Findings Section. The allowable voltage was assumed to be between 0.94 percentage units (p.u.) to 1.06 p.u. of the main transformer voltage [40]. This showed the appropriateness of the configuration of the simulated distribution grid, seen below in Figure 2.
Figure 2. Hypothetical power distribution network scheme.
Table 1 provides the section length, load ratio, and pole transformer tap for Feeder 1 based on KEPCO data and Shin [26]. The line resistance (r) is 0.182 Ω/km and the line reactance (x) is 0.391 Ω/km for the entire feeder system [26].
Table 1. High-voltage distribution line section data for Feeder 1
Node No. Length (l) (km)
Load Ratio [%]
Pole Transformer Tap (V/V) From To
0 1 5 3 13,200/230 1 2 4 3 13,200/230 2 3 4 1 12,600/230 4 5 2 3 12,600/230 5 6 5 4 12,600/230 6 7 4 7 12,600/230 7 8 6 5 12,600/230
Main Transformer and OLTCFeeder 1 Feeder 4Feeder 2 Feeder 3
N1 N1 N1N1
N2N2N2
N2
N3
5km 5km 5km4 km
2 km
Pillar Transformer
4 km 4 km 5km
N3
5km5km
N4
6 kmN4
N5
2 km
3 km
3%
3%
5%
4%
6%
6%
6%
6%
6%
4%
6%
5%
5%
N3
4 km1%SVR
N4
2 km3%
N5
5km4%
N6
4 km7%
N7
6 km5%
DG
N3
4 km4%
SVR
N4
6 km3%
N5
6 km3%
N6
5km7%
DG
DG = Distributed Generation
N1= Node Number X% = Load
Ratio
Pillar Transformer Pillar Transformer Pillar Transformer
Key
Figure 2. Hypothetical power distribution network scheme.
Prior to performing calculations with a hypothetical SVR, the authors calculated existing feederconditions and voltage, observing the required OLTC and pillar transformer tap changes to maintain
Energies 2019, 12, 652 5 of 16
the allowable voltage. The results of this are shown in Table 5 in the Findings Section. The allowablevoltage was assumed to be between 0.94 percentage units (p.u.) to 1.06 p.u. of the main transformervoltage [40]. This showed the appropriateness of the configuration of the simulated distribution grid,seen below in Figure 2.
Table 1 provides the section length, load ratio, and pole transformer tap for Feeder 1 basedon KEPCO data and Shin [26]. The line resistance (r) is 0.182 Ω/km and the line reactance (x) is0.391 Ω/km for the entire feeder system [26].
The parameters of the main transformer, OLTC, and SVR are as presented below:
• Main Transformer:
# Base voltage = 229.kV [26]# Base power = 100MVA base power [26]# Impedance = 0.0042 + j0.15 (p.u.) [26]
• OLTC:
# Tap step value = ±0.0125 (p.u.) [26]# Zeq = 0.95 (p.u.) [26]# Vce = 0.24 (p.u.) [26]
• SVR:
# Tap step value = ±0.00625 (p.u.) [26]# Zeq = 0.95 (p.u.) [26]# Vce = 0.24 (p.u.) [26]
2.2. Maximum DG Capacity Analysis
In general, the OLTC, SVR, and pillar transformer regulators adopted a line drop compensation(LDC) method to maintain end user voltage within permissible limits. In the LDC method, as the bankload (Ibank) increases or decreases beyond an acceptable limit due to an equivalent impendence (Zeq),a voltage regulation element (Vce) compensates [41]. In this method, the sending-end reference voltageis given by the following equation [42,43]:
Vser = Vce + Zeq ∗ Ibank (1)
where Vser is the sending-end reference voltage, Vce is the load center voltage, Zeq is the equivalentimpedance of LDC device (ex. OLTC), and Ibank is the main transformer bank current.
For the purposes of this paper, the voltage regulation element (Vce) shown in Figure 3 will be thetap-changer setting of the OLTC, pillar transformer, and/or SVR. The tap-changer allows variable turnratios to be selected in discrete steps. The variable turn ratios are obtained by connecting to a numberof access points, known as taps, along either the primary or secondary winding. OLTCs are used whenan interruption during a tap change is unacceptable. Both the OLTC and SVR typically include 32 taps,16 to increase and 16 to decrease voltage, each tap equating to a 0.625% voltage variation for a total ofa ± 10% voltage variation [44]. The pillar transformer tap works in the same way but is often set andinfrequently changed [45]. Using the tap changer as the voltage regulation element, Equation (1) canbe modified as follows [6]:
Vser = Vtap,k + Zk ∗ Ibank (2)
where, Vser is the sending-end reference voltage, Vtap,k is the secondary voltage when the tap is locatedat the k-th position, Zk is the equivalent impedance when the tap is located at the k-th position, and Ibankis the main transformer bank current.
Energies 2019, 12, 652 6 of 16
Energies 2019, XX, Y FOR PEER REVIEW 9 of 16
that the SVR still reduced the maximum to minimum voltage ranges. This is evidence of the SVR effectively improving the power quality of a distribution network with DG penetration.
Table 5. Existing distributed generation (DG) penetration, and step voltage regulators (SVR) installation voltage characteristics.
Power Penetration Without SVR With SVR
Consumer voltage Consumer voltage
Distributed Generation penetration: 0 MW
Minimum load Maximum 1.0345 Maximum 1.0345 Minimum 0.9774 Minimum 0.9774
Maximum load Maximum 1.0420 Maximum 1.0420 Minimum 0.9546 Minimum 0.9706
Distributed Generation penetration: 3 MW
Minimum load Maximum 1.0717 Maximum 1.0379 Minimum 0.9662 Minimum 0.9662
Maximum load Maximum 1.0566 Maximum 1.0420 Minimum 0.9779 Minimum 0.9779
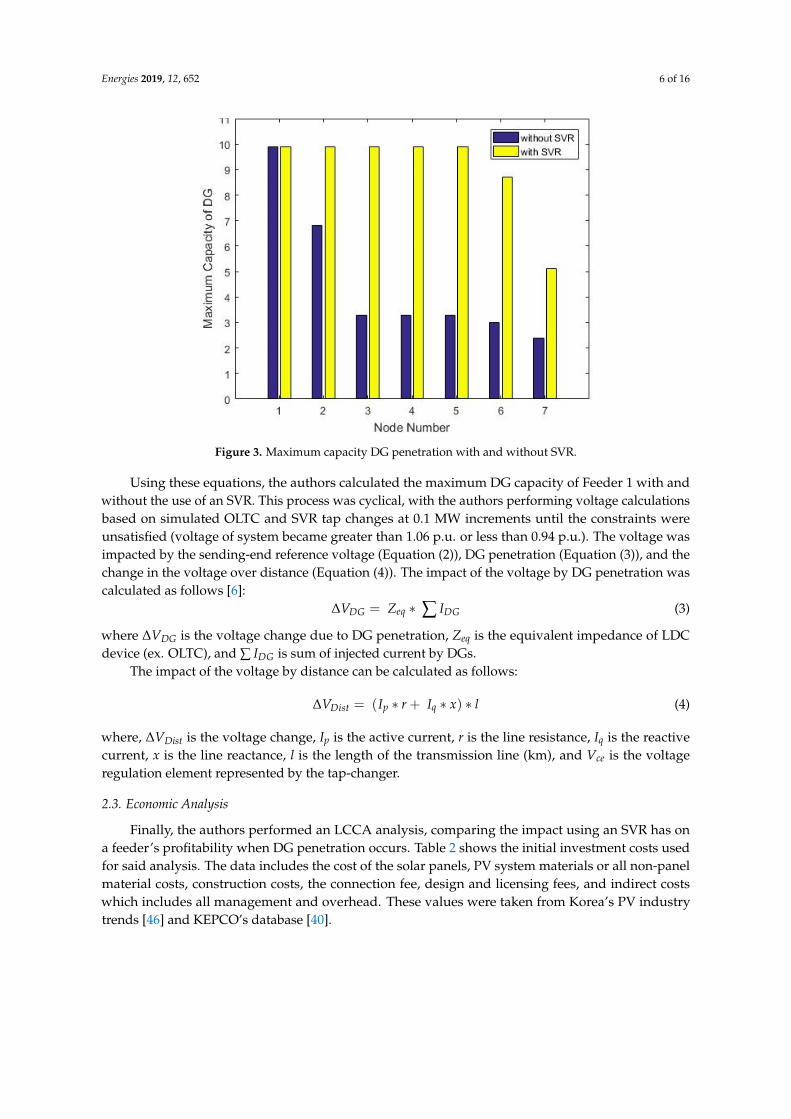
Figure 3, below, depicts the result of the maximum penetration capacity analysis. The authors found that Feeder 1 had the capacity to be at 2.4 MW of DG penetration without an SVR and at 5.1 MW of DG penetration with an SVR prior to exceeding allowable voltage fluctuations
Figure 3. Maximum capacity DG penetration with and without SVR.
Using a DG penetration of 2.4 MW for a system without SVR and 5.1 MW DG for a system with SVR installations, the authors performed a Monte Carlo analysis. Results are shown in Figures 4 and 5 These analyses use the most-likely or base case scenario in which KEPCO would receive revenue from SMP and REC. Figure 4 shows the results of the probabilistic analysis of the IRR, both when a power distribution network does not use an SVR (Figure 4a) and does use an SVR (Figure 4b). As can be seen, the probability that IRR is higher than the desired 5.5% was 96.6% without installing an SVR and 88.6% when the SVR was installed. This result means that not installing an SVR is more likely to be an attractive financial investment than installing an SVR. This is due to the more significant up-front installation costs associated with installing the SVR.
Figure 3. Maximum capacity DG penetration with and without SVR.
Using these equations, the authors calculated the maximum DG capacity of Feeder 1 with andwithout the use of an SVR. This process was cyclical, with the authors performing voltage calculationsbased on simulated OLTC and SVR tap changes at 0.1 MW increments until the constraints wereunsatisfied (voltage of system became greater than 1.06 p.u. or less than 0.94 p.u.). The voltage wasimpacted by the sending-end reference voltage (Equation (2)), DG penetration (Equation (3)), and thechange in the voltage over distance (Equation (4)). The impact of the voltage by DG penetration wascalculated as follows [6]:
∆VDG = Zeq ∗ ∑ IDG (3)
where ∆VDG is the voltage change due to DG penetration, Zeq is the equivalent impedance of LDCdevice (ex. OLTC), and ∑ IDG is sum of injected current by DGs.
The impact of the voltage by distance can be calculated as follows:
∆VDist = (Ip ∗ r + Iq ∗ x) ∗ l (4)
where, ∆VDist is the voltage change, Ip is the active current, r is the line resistance, Iq is the reactivecurrent, x is the line reactance, l is the length of the transmission line (km), and Vce is the voltageregulation element represented by the tap-changer.
2.3. Economic Analysis
Finally, the authors performed an LCCA analysis, comparing the impact using an SVR has ona feeder’s profitability when DG penetration occurs. Table 2 shows the initial investment costs usedfor said analysis. The data includes the cost of the solar panels, PV system materials or all non-panelmaterial costs, construction costs, the connection fee, design and licensing fees, and indirect costswhich includes all management and overhead. These values were taken from Korea’s PV industrytrends [46] and KEPCO’s database [40].

Energies 2019, 12, 652 7 of 16
Table 2. Initial investment costs.
Costs Detailed Criteria EstimatedValue
Cost Used forAnalysis *
Solar Panels • $0.4/Korean Won (KRW) in 2017 [46] $400/kW $400/kW
PV System Materials • $0.1/Korean Won (KRW) in 2017 [46] $1000/kW $1000/kW
Construction • KEPCO Domestic Performance [40]• Calculated as % of Total System Cost
10% $199/kW
Connection Fee • KEPCO Domestic Performance [40]• Calculated as % of Total System Cost
8% $159/kW
Design/Licensing • Assumption based on KEPCO data [40]• Calculated as % of Total System Cost
2% $40/kW
Indirect • KEPCO Domestic Performance [40]• Calculated as % of Total System Cost
9.50% $189/kW
Total Cost: $1987/kW
* All costs are shown in USD, using a Korean Won 1000 to $1 USD exchange rate.
Table 3 depicts the revenue calculations and key economic variables used for said analysis, mostof which were taken from the KEPCO database [40]. The analysis was performed on the penetration ofNode 7 at the end of Feeder 1 in the simulated power system with the maximum penetration capacityestimated using the process provided in Section 2.2. As a standard LCCA practice, the study assumedthe total cost defined as CAPEX + OPEX + Tax, as defined in the below Table 3.
Table 3. Key economic variables.
Parameter Value Remark
Discount Rate 5.50% Korea Development Institute for public investmentprojects
Service Life 25 years -Depreciation 20-year straight line Domestic Development Company Accounting Regulations
Tax Rate 24.2% -
Capacity 2.4 MW (No SVR)5.1 MW (SVR) Introduced limit capacity to Node 7 of Feeder 1
Days of operation 365 days -Availability 3.28 h/day 20-year average value of national solar power generation
CAPEX $2 M/MW (No SVR)$2.5 M/MW (SVR) PV equipment and power system entrance cost [47]
OPEX 1.0% O M cost average of general solar industryElectricity tariff $0.0803/kWh Average of November ’16 to October ’17 [48]
REC $0.1372/kWh Average of November ’16 to October ’17 [48]KCU $18.5/tCO2 16.11.9 Offset trading price
REC = renewable energy certificate; KCU = Korean offset credit.
Of the many economic variables shown in Table 3, the CAPEX provided the clearest insight intothe difference in initial investment required when installing an SVR. As can be seen, the CAPEX forsolar PV systems was estimated as $2.5 million per MW with and $2 million per MW without SVR,based on recent trend data from Korea’s electricity market [47]. An argument could be made that,with an increase in SVR use, production, and installation, there would be an expectant investmentsavings due to economies of scale. However, KEPCO practitioners and Korean renewable energyexperts involved with this research believe that the unit cost of SVR installation has stabilized as theinstallation of SVRs in tandem with solar PV power penetration is nearly common practice and beyondthe initial trial stage.
Along with the variables presented in Tables 2 and 3, the LCCA was based off worst case,most likely case, and best-case revenue generation scenarios. These scenarios represented KEPCO’s

Energies 2019, 12, 652 8 of 16
ability to achieve a system marginal price (SMP), a renewable energy certificate (REC), and/or Koreanoffset credit (KCU). For the worst-case or “low scenario: SMP”, the plant would receive only revenuefrom the electricity tariff, or SMP. For the most likely or “base scenario: SMP + REC”, the plant wouldreceive additional revenue from the REC transaction, which is expected under the current renewableportfolio standard (RPS) system in Korea. Finally, for the best-case or “high scenario: “SMP+ REC +KCU,” additional revenue would be received through the KCU, which is the CO2 emission tradingsystems (ETS) in Korea. Table 4 shows the six scenarios in which an LCCA was performed.
Table 4. Six scenarios for economic assessment.
Case Scenario Economics Analysis Condition
No SVRLow-scenario revenue: SMPBase-scenario revenue: SMP + RECHigh-scenario revenue: SMP + REC + KCU
SVR InstalledLow-scenario revenue: SMPBase-scenario revenue: SMP + RECHigh-scenario revenue: SMP + REC + KCU
To compare the economic performance of the scenarios, the authors calculated the NPV, IRR,and PI. The NPV calculated the present value of future cash flows using a chosen discount rate. Forthis paper, if the NPV was greater than $2 million, the investment was considered economically viable.The NPV is calculated in Equation (5):
NPV =n
∑t=0
CFI − CFO(1 + r)t (5)
where CFI denotes cash flow input, CFO denotes cash flow output, r is the discount rate, and t is thetime or payback period.
The IRR was the discount rate at which the present value of the future cash inflows from theinvestment was equal to the present value of the cash outflow. If the IRR was greater than the identifiedtarget return rate, 5.5% for this publication, the investment was considered to be economical. The IRRis calculated in Equation (6).
IRR = r When NPV =n
∑t=0
CFI − CFO(1 + r)t = 0 (6)
where, CFI denotes cash flow input, CFO denotes cash flow output, r is the discount rate, and t is thetime or payback period.
Finally, the PI was the ratio of the present value of future cash flows to the initial investments ofthe project. In essence, this was a cost/benefit analysis and projects were considered viable when thePI was greater than one. The PI is calculated in Equation (7).
PI =NPV
I(7)
where NPV denotes the net present value as defined in Equation (5), and I denotes the initialinvestment required.
A probabilistic Monte Carlo analysis was then performed with the @Risk software (MicrosoftExcel 2016, Microsoft, Redmond, WA, USA) using the variables found in Tables 2 and 3. Through the@Risk Monte Carlo simulation, the authors used a program evaluation and review technique (PERT)

Energies 2019, 12, 652 9 of 16
distribution (commonly known in probabilistic simulation approach), which used a weighted averagefor input parameters’ probability, as shown below [49].
te =to + 4tm + tp
6(8)
where, te denotes the weighted average of expected revenue; to denotes the high revenue; tm denotesthe base revenue; and tp denotes the low revenue.
The standard deviation was calculated using the following equation, which is commonly knownin the PERT probabilistic approach, [49]:
σ =tp − to
6(9)
where σ denotes the standard deviation; to denotes the high revenue; and tp low revenue.
3. Findings
The existing feeder conditions and consumer voltage characteristics at a maximum and minimumload can be seen in Table 5, below. The data within the ’without SVR’ column and the ‘distributedgeneration penetration: 0 MW’ row cells represent existing conditions. The authors then simulatedthe feeder adding 3 MW DG penetration and/or SVR installation. As can be seen, when there was noDG penetration, the voltage stayed within the allowable range and no SVR was needed. Alternatively,when 3 MW DG was penetrated at a minimum load, the voltage increased above the allowable voltageto 1.0717 p.u. due to reverse current flow. In this case, voltage quality degradation occurred, and amitigation plan was required to ensure a safe supply of power. Table 5 shows that the installation ofan SVR was an appropriate mitigation technique as the voltage experiences dropped from 1.0717 p.u.to an acceptable variation of 1.0420 p.u. Even when the voltage was within the acceptable limits, it canbe seen that the SVR still reduced the maximum to minimum voltage ranges. This is evidence of theSVR effectively improving the power quality of a distribution network with DG penetration.
Table 5. Existing distributed generation (DG) penetration, and step voltage regulators (SVR) installationvoltage characteristics.
Power PenetrationWithout SVR With SVR
Consumer Voltage Consumer Voltage
DistributedGeneration
penetration: 0 MW
Minimum loadMaximum 1.0345 Maximum 1.0345Minimum 0.9774 Minimum 0.9774
Maximum loadMaximum 1.0420 Maximum 1.0420Minimum 0.9546 Minimum 0.9706
DistributedGeneration
penetration: 3 MW
Minimum loadMaximum 1.0717 Maximum 1.0379Minimum 0.9662 Minimum 0.9662
Maximum loadMaximum 1.0566 Maximum 1.0420Minimum 0.9779 Minimum 0.9779
Figure 3, below, depicts the result of the maximum penetration capacity analysis. The authorsfound that Feeder 1 had the capacity to be at 2.4 MW of DG penetration without an SVR and at 5.1 MWof DG penetration with an SVR prior to exceeding allowable voltage fluctuations.
Using a DG penetration of 2.4 MW for a system without SVR and 5.1 MW DG for a system withSVR installations, the authors performed a Monte Carlo analysis. Results are shown in Figures 4 and 5These analyses use the most-likely or base case scenario in which KEPCO would receive revenue fromSMP and REC. Figure 4 shows the results of the probabilistic analysis of the IRR, both when a powerdistribution network does not use an SVR (Figure 4a) and does use an SVR (Figure 4b). As can beseen, the probability that IRR is higher than the desired 5.5% was 96.6% without installing an SVR and

Energies 2019, 12, 652 10 of 16
88.6% when the SVR was installed. This result means that not installing an SVR is more likely to bean attractive financial investment than installing an SVR. This is due to the more significant up-frontinstallation costs associated with installing the SVR.Energies 2019, XX, Y FOR PEER REVIEW 10 of 16
(a) (b)
Figure 4. Internal rate of return (IRR) Monte Carlo Analysis (a) without SVR and (b) with SVR.
Figure 6 shows the results of the probabilistic analysis of the NPV, both when a power distribution network does not use an SVR (Figure 5a) and does use an SVR (Figure 5b). As can be seen, installing an SVR equated to a 20% greater chance of a financially viable project, receiving an NPV of $2M USD. This finding is in disagreement with the IRR findings, as it depicts the installation of an SVR as more economically attractive. The IRR and NPV findings mean that installing an SVR is more likely to earn KEPCO more profit over the life-span of the project, but not installing the SVR is more likely to result in KEPCO earning a profit at an earlier date. This is due to the high initial costs of installing the SVR.
(a) (b)
Figure 5. Net present value (NPV) Monte Carlo Analysis (a) without SVR and (b) with SVR.
The authors also performed a Monte Carlo Analyses on Feeder 1 with and without installing an SVR across the differing revenue scenarios. Table 6, below, shows the average results of each study. As can be seen, at the lowest scenario in which no additional revenue sources are received, installing an SVR had a financially inferior performance compared to not installing an SVR across all economic measures. It should be noted that at the low scenario, allowing DG penetration was not economically viable for KEPCO whether an SVR was installed or not. The base scenario results are repeated from above and, as stated above, show that installing the SVR reduced the IRR but increased the NPV. This is also mirrored if both REC and KCU are received.
Figure 4. Internal rate of return (IRR) Monte Carlo Analysis (a) without SVR and (b) with SVR.
Energies 2019, XX, Y FOR PEER REVIEW 10 of 16
(a) (b)
Figure 4. Internal rate of return (IRR) Monte Carlo Analysis (a) without SVR and (b) with SVR.
Figure 6 shows the results of the probabilistic analysis of the NPV, both when a power distribution network does not use an SVR (Figure 5a) and does use an SVR (Figure 5b). As can be seen, installing an SVR equated to a 20% greater chance of a financially viable project, receiving an NPV of $2M USD. This finding is in disagreement with the IRR findings, as it depicts the installation of an SVR as more economically attractive. The IRR and NPV findings mean that installing an SVR is more likely to earn KEPCO more profit over the life-span of the project, but not installing the SVR is more likely to result in KEPCO earning a profit at an earlier date. This is due to the high initial costs of installing the SVR.
(a) (b)
Figure 5. Net present value (NPV) Monte Carlo Analysis (a) without SVR and (b) with SVR.
The authors also performed a Monte Carlo Analyses on Feeder 1 with and without installing an SVR across the differing revenue scenarios. Table 6, below, shows the average results of each study. As can be seen, at the lowest scenario in which no additional revenue sources are received, installing an SVR had a financially inferior performance compared to not installing an SVR across all economic measures. It should be noted that at the low scenario, allowing DG penetration was not economically viable for KEPCO whether an SVR was installed or not. The base scenario results are repeated from above and, as stated above, show that installing the SVR reduced the IRR but increased the NPV. This is also mirrored if both REC and KCU are received.
Figure 5. Net present value (NPV) Monte Carlo Analysis (a) without SVR and (b) with SVR.
Figure 5 shows the results of the probabilistic analysis of the NPV, both when a power distributionnetwork does not use an SVR (Figure 5a) and does use an SVR (Figure 5b). As can be seen, installingan SVR equated to a 20% greater chance of a financially viable project, receiving an NPV of $2M USD.This finding is in disagreement with the IRR findings, as it depicts the installation of an SVR as moreeconomically attractive. The IRR and NPV findings mean that installing an SVR is more likely to earnKEPCO more profit over the life-span of the project, but not installing the SVR is more likely to resultin KEPCO earning a profit at an earlier date. This is due to the high initial costs of installing the SVR.
The authors also performed a Monte Carlo Analyses on Feeder 1 with and without installing anSVR across the differing revenue scenarios. Table 6, below, shows the average results of each study.As can be seen, at the lowest scenario in which no additional revenue sources are received, installingan SVR had a financially inferior performance compared to not installing an SVR across all economicmeasures. It should be noted that at the low scenario, allowing DG penetration was not economicallyviable for KEPCO whether an SVR was installed or not. The base scenario results are repeated fromabove and, as stated above, show that installing the SVR reduced the IRR but increased the NPV.This is also mirrored if both REC and KCU are received.

Energies 2019, 12, 652 11 of 16
Table 6. A summary of life cycle cost analysis (LCCA) for all cases and scenarios.
LCCA Output Low Scenario(SMP)
Base Scenario(SMP + REC)
High Scenario(SMP + REC + KCU)
IRR (%)without SVR −1.6 8.41 9.36
with SVR −2.52 7.31 8.2
NPV ($M)without SVR −2.594 1.366 1.841
with SVR −6.644 1.945 2.954
PIwithout SVR 0.46 1.28 1.38
with SVR 0.41 1.17 1.26
4. Discussion
Traditionally, power generation has been through centralized units [50], large enough forautomatic voltage regulator systems (AVRS) to be economically viable [51]. However, the currenttrend is towards much smaller, geographically dispersed power generation or DG [50]. In ageneral sense, this trend is a result of a desire to decentralize power grids due to its potential toincrease the sustainability of power grids through the context of providing an even distribution ofpolitical, technological, economic, and social resources [3]. More specifically, this trend is guidedby the powerful international [1] and domestic [2] political/societal push to pursue renewable ornon-carbon-fueled power generation. Nuclear power has been a viable centralized alternative tothe traditional carbon-based power generation but, due to the Japanese Fukushima Daiichi disaster,countries worldwide are abandoning its expansion [52]. Governments are therefore resorting tosmaller, decentralized renewable power facilities or DG power generation as their non-carbon-fueledoptions [50]. Aside from the political and societal push, alternative power generation plants are alsoreaching grid parity, the point at which an alternative energy source can generate power at a cost lessthan or equal to the price of the existing power grid, making them attractive to investors regardlessof the societal/environmental benefits [53]. For example, one study found that PV modules havedecreased in cost by 75% between 2009 and 2014 [54]. With the financial, social, environmental, health,security, and general sustainable benefits [55], it is a near inevitability that DG penetration will riseexponentially in the upcoming years. This is most likely to be the case in sparsely settled countries(ex. Canada and Russia) and in countries with poor existing power grids (ex. developing nations) [55].
With the push towards DG, specifically renewable energy’s emerging grid parity, there is a highpressure on grid management internationally to mitigate the resultant reduction in power quality.This push equates to the utility operator and renewable power generation company having conflictinggoals: the utility operator wants a stable power system and the renewable power generation companywants to maximize power production. Korea is already feeling the impacts with KEPCO currentlyencountering problems with DG penetration and the associated reverse flow and reduced power qualitynationwide. Common solutions to this problem are policies to cap DG penetration [56]; requiring theplant to supply their own voltage regulators (ex. AVRS) [51]; combined heat and power [29]; batteryenergy management systems [28]; and/or feeder tap changer systems such as SVRs presented above.At the international scale, the utility operator’s response has often been to set caps on the allowableDG penetration when voltage readings become too high [56]. This solution limits renewable energygrowth, contrast to international [1] and domestic [2] policies; reduces energy security and efficiencyby reducing generation diversity [3]; minimizes the opportunities to reduce carbon emissions [51];and negatively impacts the economy at a national and individual level [57]. The PV market has becomeattractive to a wide range of investors ranging from the traditional electric utility industry to privatehomeowners [58]. Capping DG penetration also caps the PV market, reducing feeder-wide (andnationwide) economic efficiencies. It also impacts individual’s ability to increase economic efficiencyas ‘grid defection,’ when a consumer self-supplies reliable power and disconnects from the local utility,was found to be two times as expensive as tying into the existing feeder system [57]. In summary,placing caps on DG penetration appears to be unsustainable, if not inadvisable, solution.

Energies 2019, 12, 652 12 of 16
Concerning the alternative voltage mitigation measures, KEPCO has yet to require DG powergeneration facilities to provide their own voltage regulators (ex. AVRS). Due to the small scale inherentto DG power generation, this solution may not be economically feasible. KEPCO has found energystorage systems to be an overly expensive option, and the use of combined heat and power units,while considered a promising approach, is still in the pilot stages. As such, the solution that bestmitigates voltage fluctuation while still allowing free market DG power generation thus far has beenfor the utility operator to install SVRs to manage the voltage of the power system. As shown by theabove findings, with the introduction of an SVR in the power distribution network, the maximumDG penetration capacity increases. This allows the renewable power generation company to increaserevenues by investing in more facilities near the existing point of DG penetration. KEPCO has recentlydecided to implement voltage mitigation measures based on system simulations identical to thosepresented in the above paper. The findings of this paper support SVR installation becoming an industrytrend in voltage management as other utility operators perform similar system simulations and cometo the same conclusion.
5. Conclusions and Future Research
The results of this paper confirm that voltage fluctuations caused by the penetration of distributedgeneration (DG) in power distribution networks is mitigated through the use of on-load tap-changers(OLTC) and step voltage regulators (SVR). In the case of a 3 megawatt (MW) DG penetration,overvoltage outside the allowable range occurred when there was no SVR installed. Alternatively,when the SVR was installed, a 5% voltage drop was experienced. This resulted in the voltage loweringto an allowable range. This paper also conducted a study on the impact SVRs have on the maximumallowable DG penetration capacity. Simulating the impacts of DG penetration on 30 km of transmissionline, it was found that the SVR increased the allowable DG penetration from 2.4 MW to 5.1 MW.This was a result of the SVRs mitigating the increased voltage caused by DGs.
To understand what impact SVRs have on renewable energy profitability, this paper alsoperformed an LCCA on the feeder system without an SVR (2.4 MW) and with an SVR (5.1 MW).Since the installation of the SVR increased upfront costs and operation and maintenance expenditures,not installing SVR resulted in an approximate 10% greater likelihood of an economically viable project(internal rate of return discount rate) than if an SVR was installed. Alternatively, the net present value(NPV) was found to be 0.6–1.0 million USD greater at an 80% likelihood when an SVR was used versuswhen it was not used. In the most pessimistic scenario, which included no REC or KCU revenue,the installation of an SVR was not a financially viable option (NPV was $4 million less than without anSVR). This was because the proportion of SVR investment in total investment would increase as solarPV investment decreased. However, in the most likely scenario of receiving REC revenue, and theoptimistic scenario of receiving both REC and KCU, installing the SVR would lead to an increasein NPV.
Future Research
The study findings within this paper were based on a hypothetical power distribution network inKorea. To validate the findings, future research will include collecting field data for several distributionsystem models. This will include research on investments made in real-world applications based onthe needs of the renewable power generation company and utility operators. In addition, althoughin this study the LDC parameter is assumed as a fixed value for the purposes of simplicity, the effectof SVR implementation can be maximized further by applying it with the optimization method ofSVR LDC. This paper’s scope has also been limited to the binary assessment of using or not using anSVR. There are many voltage mitigation solutions and future research should include comparing theeconomic feasibility of all these options. Future research will also include an NPV analysis on privaterenewable power producers’ voltage mitigation solutions as the industry begins to shift responsibilityfrom KEPCO to those who supply solar PV to the power grid. Future research will include considering

Energies 2019, 12, 652 13 of 16
protection cooperation’s impact on DG penetration capacity. Studies will also be optimizing SVRconditions by minimizing the frequency of tap changes required, thereby improving the reliability ofthe power distribution network.
The reliance on OLTC transformers to mitigate voltage fluctuations caused by DG penetrationthrough PV energy production may reduce the lifespan of electrical devices. The OLTC transformersexperience many tap changes with DG penetration, as this is the main method of voltage fluctuationmitigation, which results in an increased maintenance requirement and decreased lifespan [59]. Futureresearch will incorporate this potential negative concern when more reliable data is available. Futureresearch will also incorporate EES control schemes, as battery back-up systems for solar PV, to studytheir impact on the value of electrical energy storage to network operations [60].
Author Contributions: Y.-C.J. developed the concept and drafted the manuscript. E.-B.L. reviewed and revisedthe manuscript and supervised the overall work. D.A. enhanced the study contents and added academic feedbackon the manuscript. All authors read and approved the final manuscript.
Funding: The authors acknowledge that this research was sponsored by the Ministry of Trade Industry and Energy(MOTIE/KEIT) Korea through the Technology Innovation Program funding for: (1) Artificial Intelligence Big-data(AI-BD) Platform for Engineering Decision-support Systems (grant number = 20002806); and (2) Intelligent ProjectManagement Information Systems (i-PMIS) for Engineering Projects (grant number = 10077606).
Acknowledgments: The authors would like to thank KEPCO EC for providing the data and information used forthis study. The authors would like to thank C. S. Hong (a researcher in POSTECH University) for his academicinputs and feedback on this research.
Conflicts of Interest: The authors declare no conflicts of interest.
Abbreviations
CAPEX Capital ExpendituresDG Distributed generationETS Emission Trading SystemIRR Internal Rate of ReturnKCU Korean Offset CreditKEPCO Korea Electric Power CorporationLCCA Life Cycle Cost AnalysisLDC Line Drop CompensationMATLAB Matrix LaboratoryNPV Net Present ValueOLTC On-load tap-changersOPEX Operation ExpenditurePV photovoltaicREC Renewable Energy CertificateRPS Renewable Portfolio StandardSMP System Marginal PriceSVR Step Voltage Regulators
References
1. United Nations. Ensure Access to Affordable, Reliable, Sustainable, and Modern Energy. SustainableDevelopment Goals. 2018. Available online: https://www.un.org/sustainabledevelopment/energy/(accessed on 14 November 2018).
2. The Government of the Republic of Korea. The 7th Basic Plan for Long-Term Electricity Supply and Demand;Ministry of Trade, Industry Energy: Sejong City, Korea, 2015.
3. Alanne, K.; Saari, A. Distributed energy generation and sustainable development. Renew. Sustain. EnergyRev. 2006, 10. [CrossRef]
4. Lopes, J.P.; Hatziargyriou, N.; Mutale, J.; Djapic, P.; Jenkins, N. Integrating distributed generation intoelectric power systems: A review of drivers, challenges and opportunities. Electr. Power Syst. Res. 2007, 77,1189–1203. [CrossRef]

Energies 2019, 12, 652 14 of 16
5. Sgouras, K.I.; Bouhouras, A.S.; Gkaidatzis, P.A.; Doukas, D.I.; Labridis, D.P. Impact of reverse power flowon the optimal distributed generation placement problem. IET Gener. Transm. Distrib. 2017, 11, 4626–4632.[CrossRef]
6. Song, I.K.; Jung, W.W.; Chu, C.M.; Cho, S.S.; Kang, H.K.; Choi, J.H. General and simple decision method forDG penetration level in view of voltage regulation at distribution substation transformers. Energies 2013, 6,4786–4798. [CrossRef]
7. Kim, J.E. Distributed Power Distribution System Voltage Analysis. Trans. Korean Inst. Electr. Eng. 2012.8. Chae, W.K. A Study on the Application of SVR at the Distribution Line Interconnected with Wind Turbine.
J. Korean Inst. Illum. Electr. Install. Eng. 2010, 24, 109–118. [CrossRef]9. Barker, P. Overvoltage considerations in applying distributed resources on power systems. In Proceedings
of the IEEE Power Engineering Society Summer Meeting, Chicago, IL, USA, 21–25 July 2002; Volume 1,pp. 109–114. [CrossRef]
10. Kim, S.H. A Study on the Analysis of Customer Voltage Characteristic with Distributed Generation. Trans.Korean Inst. Electr. Eng. 2010, 333–335. Available online: https://www.dbpia.co.kr/Journal/ArticleDetail/NODE01575855#/ (accessed on 5 December 2018).
11. Duong, M.Q.; Tran, N.T.; Sava, G.N.; Scripcariu, M. The impacts of distributed generation penetration intothe power system. InElectromechanical and Power Systems (SIELMEN). In Proceedings of the IEEE 2017International Conference, Boston, MA, USA, 11–14 December 2017; pp. 295–301. [CrossRef]
12. Quezada, V.M.; Abbad, J.R.; Roman, T.G. Assessment of energy distribution losses for increasing penetrationof distributed generation. IEEE Trans. Power Syst. 2006, 21, 533–540. [CrossRef]
13. Viral, R.; Khatod, D.K. An analy tical approach for sizing and siting of DGs in balanced radial distributionnetworks for loss minimization. Int. J. Electr. Power Energy Syst. 2015, 1, 191–201. [CrossRef]
14. Esmaili, M.; Firozjaee, E.C.; Shayanfar, H.A. Optimal placement of distributed generations consideringvoltage stability and power losses with observing voltage-related constraints. Appl. Energy 2014, 1, 1252–1260.[CrossRef]
15. Gkaidatzis, P.A.; Doukas, D.I.; Bouhouras, A.S.; Sgouras, K.I.; Labridis, D.P. Impact of penetration schemesto optimal DG placement for loss minimisation. Int. J. Sustain. Energy 2017, 36, 473–488. [CrossRef]
16. Abdmouleh, Z.; Gastli, A.; Ben-Brahim, L.; Haouari, M.; Al-Emadi, N.A. Review of optimization techniquesapplied for the integration of distributed generation from renewable energy sources. Renew. Energy 2017,113, 266–280. [CrossRef]
17. Chiradeja, P.; Ramakumar, R. An approach to quantify the technical benefits of distributed generation.IEEE Trans. Energy Convers. 2004, 19, 764–773. [CrossRef]
18. Lee, E.M.; Kim, M.Y.; Rho, D.S.; Sohn, S.W.; Kim, J.E.; Park, C.H. A Study on the Optimal Introduction of StepVoltage Regulator (SVR) in Distribution Feeders. Trans. Korean Inst. Electr. Eng. 2004, 53, 610–618. Availableonline: http://www.dbpia.co.kr/Journal/ArticleDetail/NODE01242881#/ (accessed on 5 December 2018).
19. Takahashi, S.; Hayashi, Y.; Tsuji, M.; Kamiya, E. Method of Optimal Allocation of SVR in Distribution Feederswith Renewable Energy Sources. J. Int. Council Electr. Eng. 2012, 2, 159–165. [CrossRef]
20. Liu, X.; Aichhorn, A.; Liu, L.; Li, H. Coordinated control of distributed energy storage system with tapchanger transformers for voltage rise mitigation under high photovoltaic penetration. IEEE Trans. SmartGrid 2012, 3, 897–906. [CrossRef]
21. Kojovic, L.A. Coordination of distributed generation and step voltage regulator operations for improveddistribution system voltage regulation. In Proceedings of the 2006 IEEE Power Engineering Society GeneralMeeting, Montreal, QC, Canada, 18–22 June 2006; p. 6. [CrossRef]
22. Kojovic, L.A. Modern techniques to study voltage regulator—DG interactions in distribution systems.In Proceedings of the 2008 IEEE/PES Transmission and Distribution Conference and Exposition, Chicago, IL,USA, 21–24 April 2008; pp. 1–6. [CrossRef]
23. Lee, H.O. A Study on Optimal Placement and Voltage Control Method of SVR in Smart Grid. SoongsilUniversity, Seoul. 2014. Available online: http://www.riss.kr/link?id=T13515858/ (accessed on 5December 2018).
24. Kim, M.Y. A Study for Influence of Step Voltage Regulator in Distribution Systems with DistributedGenerations. Trans. Korean Inst. Electr. Eng. 2009, 11, 284–285. Available online: http://www.dbpia.co.kr/Journal/ArticleDetail/NODE01394148#/ (accessed on 5 December 2018).

Energies 2019, 12, 652 15 of 16
25. Kim, M.Y.; Oh, Y.T.; An, J.Y.; Kim, J.E.; Kim, E.S.; Rho, D.S. A Study on the Optimal Voltage Regulation inDistribution Systems with Dispersed Generation Systems. Trans. Korean Inst. Electr. Eng. 2005, 54, 251–258.[CrossRef]
26. Shin, K.H. A Study on the Method for Controlling Sending-End Voltage for Voltage Regulation at theDistribution System with Large Distributed Generation. Master’s Thesis; Soongsil University: Seoul, Korea,2015. Available online: http://www.riss.kr/link?id=T13818300/ (accessed on 5 December 2018).
27. Farag, H.E.; El-Saadany, E.F. Voltage regulation in distribution feeders with high DG penetration: Fromtraditional to smart. In Proceedings of the 2011 IEEE Power and Energy Society General Meeting, Detroit,MI, USA, 24–29 July 2011; pp. 1–8. [CrossRef]
28. Thirugnanam, K.; Kerk, S.G.; Yuen, C. Battery integrated solar photovoltaic energy management system formicro-grid. In Proceedings of the Innovative Smart Grid Technologies-Asia (ISGT ASIA), Bangkok, Thailand,3–6 November 2015; pp. 1–7.
29. Bjelic, I.B.; Ciric, R.M. Optimal distributed generation planning at a local level—A review of Serbianrenewable energy development. Renew. Sustain. Energy Rev. 2014, 39, 79–86. [CrossRef]
30. Strbac, G.; Ramsay, C.; Pudjianto, D. Integration of Distributed Generation into the UK Power System.Summary Report. DTI Centre for Distributed Generation and Sustainable Electrical Energy. 2007. Availableonline: https://www.ofgem.gov.uk/ofgem-publications/55759/dgseeewpdgvaluepaperv30.pdf/ (accessedon 7 December 2018).
31. DECC. Review of the Generation Costs and Deployment Potential of Renewable Electricity Technologies inthe UK: Study Report. 2011. Available online: http://www.gov.uk/government/uploads/system/uploads/attachment_data/file/147863/3237-cons-ro-banding-arup-report.pdf (accessed on 14 November 2018).
32. Audenaert, A.; De Boek, L.; De Cleyn, S.; Lizin, S.; Adam, J.F. An economic evaluation of photovoltaic gridconnected systems (PVGCS) in Flanders for companies: A generic model. Renew. Energy 2010, 35, 2674–2682.[CrossRef]
33. Kolhe, M.; Kolhe, S.; Joshi, J.C. Economic viability of stand-alone solar photovoltaic system in comparisonwith diesel-powered system for India. Energy Econ. 2002, 24, 155–165. [CrossRef]
34. Bernal-Agustin, J.L.; Dufo-Lopez, R. Economical and environmental analysis of grid connected photovoltaicsystems in Spain. Renew. Energy 2006, 31, 1107–1128. [CrossRef]
35. Muttaqi, K.M.; Le, A.D.; Aghaei, J.; Mahboubi-Moghaddam, E.; Negnevitsky, M.; Ledwich, G. Optimizingdistributed generation parameters through economic feasibility assessment. Appl. Energy 2016, 165, 893–903.[CrossRef]
36. Calovic, M.-S. Modeling and analysis of under load tap changing transformer control system. IEEE Trans.Power Appar. Syst. 1984, 107, 1909–1915. [CrossRef]
37. Jordehi, A.R. Allocation of distributed generation units in electric power systems: A review. Renew. Sustain.Energy Rev. 2016, 1, 893–905. [CrossRef]
38. Allan, G.; Eromenko, I.; Gilmartin, M.; Kockar, I.; McGregor, P. The economics of distributed energygeneration: A literature review. Renew. Sustain. Energy Rev. 2015, 1, 543–556. [CrossRef]
39. Mahmud, N.; Zahedi, A. Review of control strategies for voltage regulation of the smart distribution networkwith high penetration of renewable distributed generation. Renew. Sustain. Energy Rev. 2016, 64, 582–595.[CrossRef]
40. KEPCO. Distributed Energy Resources Distribution System Interconnection Technology Standard. 2015.Available online: https://cyber.kepco.co.kr/ckepco/front/jsp/CY/H/C/CYHCHP00801.jsp (accessed on14 November 2018).
41. Seo, K.H. A Study on Output Voltage Method for Maintaining Line Voltage in High Capacity DistributedPower Distribution System Connection. Master’s Thesis, Graduate School of Soongsil University, Seoul,Korea, 2015.
42. Choi, J.H.; Kim, J.-C. Advanced voltage regulation method of power distribution systems interconnectedwith dispersed storage and generation systems. IEEE Trans. Power Deliv. 2001, 16, 329–334. [CrossRef]
43. Choi, J.H.; Moon, S.-I. The dead band control of LTC transformer at distribution substation. IEEE Trans.Power Syst. 2009, 24, 319–326. [CrossRef]
44. Siemens Energy Sector. Power Engineering Guide; Siemens: Erlangen, Germany, 2016; Available online: http://www.energy.siemens.com/hq/en/energy-topics/publications/power-engineering-guide/ (accessed on14 November 2018).
Energies 2019, 12, 652 16 of 16
45. Advanced Distribution System Engineering; Korean Institute of Electrical Engineers: Seoul, Korea, 2014.46. Korea Eximbank. Photovoltaic Industry Trend in the Second Quarter of 2017. Seoul, Korea, 2017. Available
online: http://keri.koreaexim.go.kr/site/program/board/basicboard/view?boardtext8=PA03currentpage=3menuid=007002001003pagesize=10boardtypeid=168boardid=57900 (accessed on 5 December 2018).
47. Rho, D.S.; Lee, E.M.; Park, C.H.; Kim, E.S. In Economic Evaluation of Step Voltage Regulator in DistributionSystems. Proceedings of the KIEE Conference, The Korean Institute of Electrical Engineers. Available online:http://www.dbpia.co.kr/Journal/ArticleDetail/NODE01339555#/ (accessed on 5 December 2018).
48. Jun, K.S. A Case Study on Decision-Making Process for Economic Feasibility under Uncertainty for SteelPlant Projects. Master’s Thesis, POSTECH, Pohang, Korea, 2014. Available online: http://www.riss.kr/link?id=T13405695/ (accessed on 5 December 2018).
49. Cottrell, W.D. Simplified program evaluation and review technique (PERT). J. Constr. Eng. Manag. 1999, 125,16–22. [CrossRef]
50. Gozde, H.; Taplamacioglu, M.C. Comparative performance analysis of artificial bee colony algorithm forautomatic voltage regulator (AVR) system. J. Frankl. Inst. 2011, 348, 1927–1946. [CrossRef]
51. Wolsink, M. The research agenda on social acceptance of distributed generation in smart grids: Renewableas common pool resources. Renew. Sustain. Energy Rev. 2012, 16, 822–835. [CrossRef]
52. Fam, S.D.; Xiong, J.; Xion, G.; Yong, D.L.; Ng, D. Post-Fukushima Japan: the continuing nuclear controversy.Energy Policy 2014, 68, 199–205. [CrossRef]
53. Karneyeva, Y.; Wüstenhagen, R. Solar feed-in tariffs in a post-grid parity world: The role of risk, investordiversity and business models. Energy Policy 2017, 106, 445–456. [CrossRef]
54. Taylor, M.; Daniel, K.; Ilas, A.; So, E.Y. Renewable Power Generation Costs in 2014; International RenewableEnergy Agency: Masdar City, Abu Dhabi, UAE, 2015.
55. Owusu, P.A.; Asumadu-Sarkodie, S. A review of renewable energy sources, sustainability issues and climatechange mitigation. Cogent Eng. 2016, 3, 1167990. [CrossRef]
56. Alyami, S.; Wang, Y.; Wang, C.; Zhao, J.; Zhao, B. Adaptive real power capping method for fair overvoltageregulation of distribution networks with high penetration of PV systems. IEEE Trans. Smart Grid 2014, 5,2729–2738. [CrossRef]
57. Hittinger, E.; Siddiqui, J. The challenging economics of US residential grid defection. Utilities Policy 2017, 45,27–35. [CrossRef]
58. Bergek, A.; Mignon, I.; Sundberg, G. Who invests in renewable electricity production? Empirical evidenceand suggestions for further research. Energy Policy 2013, 56, 568–581. [CrossRef]
59. Yan, R.; Marais, R.; Saha, T.K. Impacts of residential photovoltaic power fluctuation on on-load tap changeroperation and a solution using DSTATCOM. Electric Power Syst. Res. 2014, 111, 185–193. [CrossRef]
60. Wang, P.; Liang, D.H.; Yi, J.; Lyons, P.F.; Davison, P.J.; Taylor, P.C. Integrating Electrical Energy Storage IntoCoordinated Voltage Control Schemes for Distribution Networks. IEEE Trans. Smart Grid 2014, 5, 1018–1032.[CrossRef]
© 2019 by the authors. Licensee MDPI, Basel, Switzerland. This article is an open accessarticle distributed under the terms and conditions of the Creative Commons Attribution(CC BY) license (http://creativecommons.org/licenses/by/4.0/).