reduction of water soluble phosphorus in poultry litter using industrial co-products dr. gary...
TRANSCRIPT

REDUCTION OF WATER SOLUBLE PHOSPHORUS IN POULTRY LITTER USING INDUSTRIAL CO-PRODUCTS
Dr. Gary Felton, Kristen Hughes,
University of Maryland,
Biological Resources Engineering Dept.

Phosphorus in 1985
Agriculture (41%)
Mixed Open (7%)Urban & Septic (13%)
Point Source (32%)
Atmospheric (6%)Forest (1%)
Phosphorus in 2000
Agriculture (41%)
Mixed Open (10%)
Urban & Septic (20%)
Point Source (20%)
Atmospheric (7%)
Forest (2%)
Sources of Nutrient Loads to the Bay
28.6 Million Pounds 21.9 Million Pounds

Bay-Wide Concern
After 2000 it will be more of a problem to hold the line on phosphorus loadings than it will be for nitrogen. This is because we still
have a number of nitrogen-reduction methods for use at treatment plants, but we have pretty
well run out of ways to reduce the phosphorus. The phosphorus levels will begin to creep up unless we can find new
ways to achieve reductions

Agricultural Concern
• MD’s livestock and poultry industries generate copious amounts of manure which farmers spread on their land.
• Until recently, nitrogen (N)-based nutrient management systems were used exclusively.
• MD farmers use no-till and it is likely that NT practices can contribute to phosphorus saturation in surface soil.
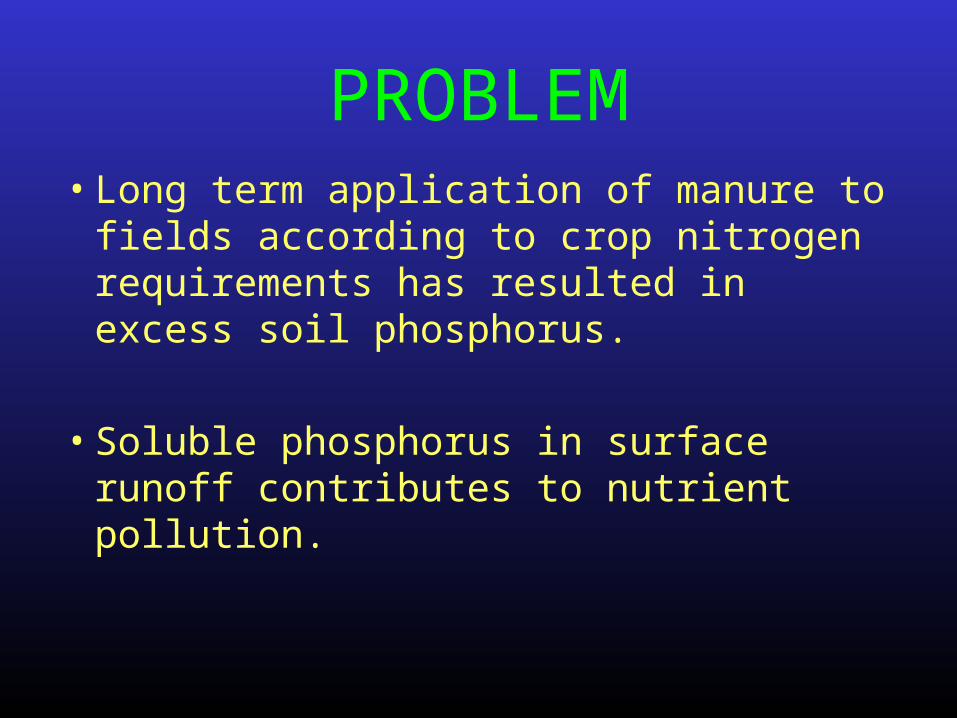
PROBLEM• Long term application of manure to fields
according to crop nitrogen requirements has resulted in excess soil phosphorus.
• Soluble phosphorus in surface runoff contributes to nutrient pollution.

Percent of field soil samples that tested
“optimum” or “excessive” for STP

HYPOTHESIS
• Previous research indicates that both Red Gypsum and Iron Rich Residue have a high P sorption capacity. We hypothesize that these co-products can be used as a manure amendment for the purpose of reducing soluble phosphorus in field runoff.
• Efficiency will be reduced from laboratory to field.
• Crop production will not be effected.

OBJECTIVES1) determine that the amendments will sorb P,
2) determine the reduction in WEP from a) individual amendments b) different litter:amendment ratios and c) compared to alum,
3) evaluate pH and EC of amendments as a function of initial P concentration,
4) evaluate trace metals in amendments to estimate any risk in using the products. Metal concentrations will be compared to any existing EPA limits for land application of biosolids.

OBJECTIVES5) explore incubation time as a factor in amendment efficacy,
6) obtain desired litter:amendment ratio to reduce WEP by 90%,
7) develop predictor equations for RG and FC that will estimate the appropriate litter:amendment ratio to obtain a desired WEP reduction,
8) evaluate the loss in efficiency from using “wet” amendments (as received) rather than dried and ground amendments, and
9) evaluate the effect of amendments on soil test P.

Laboratory Methods
• Amendment Characterization
• Litter Characterization
• Treatments
• Water Extractable Phosphorus (WEP)
• Statistical Methods

Amendment and Litter Characterization
• ICPES, AAS, CVAAS - trace metals
• Total C, N, H, Ca, Fe, S, P, NH3-N

Laboratory Treatments
• Poultry Litter (PL) only
• PL + Secondary Gypsum (SG)
• PL + Filter Cake (FC)
• PL + 50-50 mix of SG and FC (MIX)
• 10 reps for some experiments, 6 for others

Water Extractable Phosphorus (WEP)
• Dried, sieved material
• Roll tube for one hour
• Centrifuged, filtered
• Analyzed for total P

Statistics
• 3X(4X3+1) experiment (not conventional factorial experiment)
• Contrast statements
• Variance varied with PL:amendment ratio, therefore, Proc MIXED w/heterogenous Var
• Inverse regression problem to find WEP reduction of 50% and 90%

Purpose: Field Experiments
Field Experiments are being used to investigate and demonstrate the effect of co-product amended poultry litter on (a) crop production and yield under standard field conditions, and (b) soluble phosphorus in soil and surface runoff.

Field Methods
• Site Description
• Litter Nutrient Value
• Amendment Description
• Mixing & Spreading
• Soil Sampling
• Runoff

Site Description• Description
– Four half-acre fields– Flumes with samplers and stage recorders
• Treatment– No-till, Conventional herbicide– Approximately 3 tons/ac MANURE– 2:1 manure:amendment


Methods
• Site Description
• Litter Nutrient Value
• Amendment Description
• Mixing & Spreading
• Soil Sampling
• Runoff
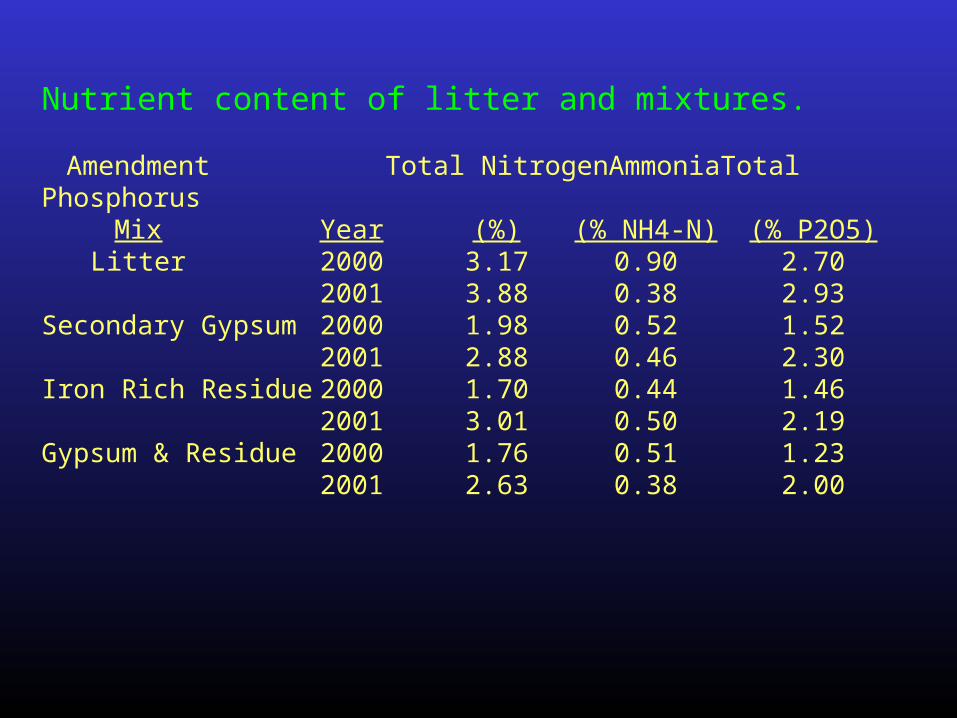
Nutrient content of litter and mixtures.
Amendment Total Nitrogen Ammonia Total PhosphorusMix Year (%) (% NH4-N) (% P2O5)
Litter 2000 3.17 0.90 2.702001 3.88 0.38 2.93
Secondary Gypsum 2000 1.98 0.52 1.522001 2.88 0.46 2.30
Iron Rich Residue 2000 1.70 0.44 1.462001 3.01 0.50 2.19
Gypsum & Residue 2000 1.76 0.51 1.232001 2.63 0.38 2.00

Nutrient application rates for each field (2000).
Application Rate N applied Available N P appliedPlot Treatment (dry tons/acre) (lbs/ac) (lbs/ac) (lbs/ac)1 Litter only 4.19 265.5 132.7 226.12 Red Gypsum 6.46 255.8 127.9 196.43 Red Gypsum-Iron Rich Residue 6.41 225.7 112.9 157.74 Iron Rich Residue 4.71 160.2 80.1 137.6

Methods
• Site Description
• Litter Nutrient Value
• Amendment Description
• Mixing & Spreading
• Soil Sampling
• Runoff


Methods
• Site Description
• Litter Nutrient Value
• Amendment Description
• Mixing & Spreading
• Soil Sampling
• Runoff

Soil Sampling• Five random locations in each field
• Six soil samples (0-2 in.) randomly collected about each location and composited
• Samples split for a) conventional Soil Test Lab analysis and b) soluble phosphorus analysis.

Methods
• Site Description
• Litter Nutrient Value
• Amendment Description
• Mixing & Spreading
• Soil Sampling
• Runoff

Laboratory Results
Element
SecondaryGypsum (mg/g)
Filter Cake
(mg/g)
Poultry Litter
(mg/g)
NH4-N 0 0 9
Total N 0 0 32
P2O5 0 0 27
Ca 231 48 13
Fe 111 189 19
S 126 2 7


Ratios of Litter to Amendment
• Control=100% litter
• PL:RG or PL:FC or PL:Mix
• 1:1, 2:1, 4:1, 8:1 on dry mass basis

Wat
er E
xtra
ctab
le P
hosp
horu
s (m
g/kg
)
Linear Plots
• 1/ratio vs log(WEP)– Most linear– Variance not uniform

Percent Reduction• Most calculations were done with WEP; the
raw data
• %reduction is what we are interested in in practice
• % reduction =WEP(treatment)/WEP(control)

log(
WE
P)
lo g (%re du c ti on )
WEP
%Reduction

Field Results
• Six water samples collected over two years


Results• Crop Yield
• Soils– Soil Test P– Soluble P
• Runoff– Design modification– Simulation results

Yie
ld (
bu/a
c)
Year
Crop Yield

0
100
200
300
1999 2000 2001
Iron Residue
Secondary Gypsum and Iron Residue
Secondary Gypsum
Control
Meh
lich
I P
hosp
horu
s(m
g P
/kg
soil
)
Year

Hypothesis: Yield in 2000 (2001) was equal to the average yield from 1990-1995
In all cases, null hypothesis was accepted.
There was no adverse effects from treatments
€
t=X_−μ
s n

Results• Crop Yield
• Soils– Soil Test P– Soluble P
• Runoff– Design modification– Simulation results

Soil test phosphorus and water extractable phosphorus after two cropping seasons.
Mehlich I Water Extractable
Soil Test Phosphorus Phosphorus
Treatment (mg/kg) (mg/kg)
Red Gypsum and Litter 285.8 5.2
Iron Rich Residue, Red Gypsum, and Litter 286.7 5.8
Iron Rich Residue and Litter 190.4 5.2
Litter 241.9 7.5
3
4
5
6
7
8
9
100 150 200 250 300 350
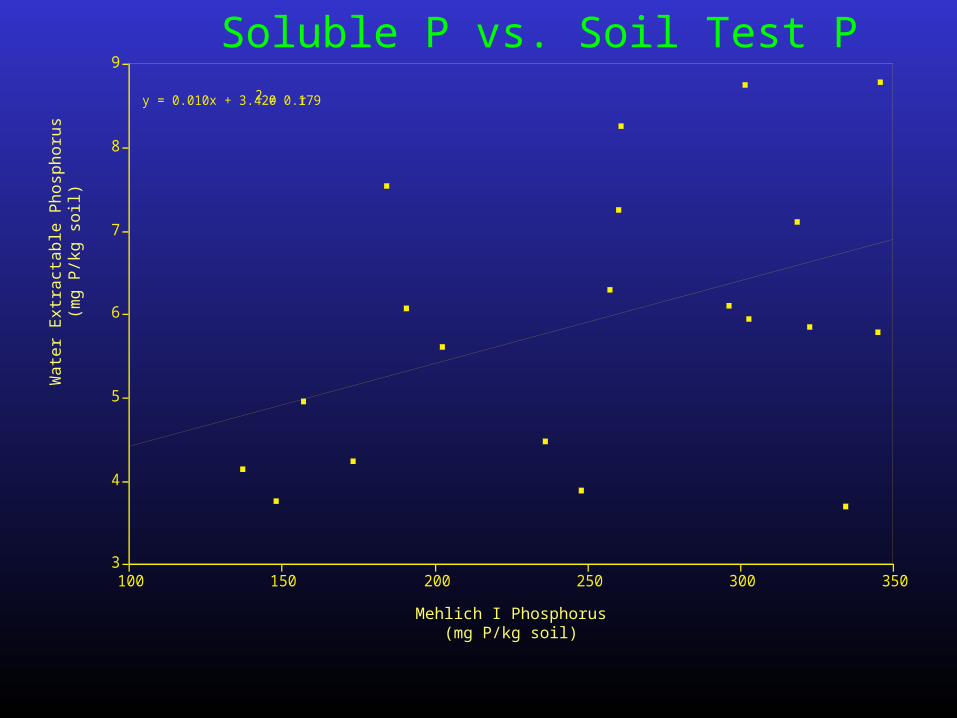
y = 0.010x + 3.420 r 2 = 0.179
Wat
er E
xtra
ctab
le P
hosp
horu
s(m
g P
/kg
soil
)
Mehlich I Phosphorus(mg P/kg soil)
Soluble P vs. Soil Test P
Results• Crop Yield
• Soils– Soil Test P– Soluble P
• Runoff– Design modification– Simulation results

0.0
0.5
1.0
1.5
2.0
2.5
0 20 40 60 80 100 120
Secondary Gypsum & Iron Rich Residue
Secondary Gypsum
Control
Re-run Secondary Gypsum
Iron Rich Residue
Time(min)
Ort
hoph
osp h
ate
Co n
c ent
rati
on(m
g P
O4/
L)

Findings• Secondary Gypsum and Iron Rich Residue treatment
means were equal treatments have similar effects on P concentration in surface runoff.
• Repeated run mean was not equal to mean of other treatments runs at a different time of year do not respond equally (i.e. there is a seasonal effect.)
• Control concentration was statistically less than treatments. This was not expected, to say the least.

Further Examination• Moore et al. (1999) found P in the range 1.90 to
6.77 mg P/L. We found P in the range 0.137 to 0.393 mg P/L. We had lower slopes and sandy soils. Does this change the predominant factor that controls P in runoff?
• Does the P in Maryland’s waters come from surface runoff?

Conclusions
Amendments do not adversely effect yields of corn.
Both the Red Gypsum and the Iron Rich Residue amendments reduced soluble phosphorus in field soils by approximately 30%. These amendments show promise for continuing the use of animal waste in agriculture.
The standard Mehlich extraction did not reflect the depression in soluble phosphorus.

Conclusions
All treatments had similar effects on the orthophosphate content of runoff water from intense precipitation events
There is a time of year effect in soluble phosphorus runoff.
Runoff from coastal plain soils may not be the major transport vector for soluble phosphorus found in aqueous systems.

Acknowledgements
Millennium Inorganic Chemicals, Inc. and the Maryland Industrial Partnerships program for providing funding and support.
Dr. Laurine Ottmar and Mr. Mike Robinson of Millennium Inorganic Chemicals, Inc.
Pat Conden of New Earth Services in Cambridge, Maryland for donations of both time and materials.
Mr. Ted Andrews for his work on chemical analysis.
Central Maryland Research and Education Center Upper Marlboro Farm Crew.