reductions of sf6 emissions from high and … · reductions of sf 6 emissions from high and medium...
TRANSCRIPT
REDUCTIONS OF SF6 EMISSIONS FROM HIGH AND MEDIUM VOLTAGE ELECTRICAL EQUIPMENT IN EUROPE
Final Report to CAPIEL
28 June 2005
Sina Wartmann and Jochen Harnisch Ecofys GmbH, Landgrabenstrasse 94, 90443 Nürnberg, Germany Contact: [email protected] Project No.: dm70047.2
All views expressed in this report are those of the authors and do not
necessarily represent the views of the organisations involved
I
Contents
Executive Summary I
1 Introduction 1 1.1 SF6 and Climate Policy 1 1.2 Properties and Uses of SF6 2 1.3 Scope of the Study 3
2 SF6 Electr ical Equipment 5 2.1 Power Transmission and Distribution 5 2.2 Equipment Categories 6 2.3 Overview on Switchgear Technologies 11 2.4 Reduced Energy Losses 13 2.5 Life-Cycle SF6 Emissions 15
3 Emission Reduction Potentials 17 3.1 Introduction 17 3.2 Existing Emission Estimates for SF6 Electrical Equipment 17 3.3 Expert Survey on Bank and Emission Development 18 3.4 Approach for Costing and Emission Determination 23 3.5 Selected Reduction Measures and Costs 23
4 Emission Development 1995-2020 41 4.1 Emission Development 1995-2003 41 4.2 Emission Projections 2003-2020 42
5 Evaluation of Voluntary Actions 44 5.1 Introduction 44 5.2 Specifics for SF6 Electrical Equipment 45 5.3 Achievements and the road ahead 47
6. Summary 49
7. References 52
8. Acknowledgements 54
Annex I Overview of national voluntary agreements 56
II
Executive Summary
This study addresses the relevance of SF6 electrical equipment in past, current and future greenhouse gas reduction efforts. The analysis was carried out by Ecofys on request of CAPIEL, the Coordinating Commitee for the Associations of Manufacturers of Industrial Electrical Switchgear and Controlgear in the European Union in cooperation with the Union of the Electricity Industry, EURELECTRIC representing the main utilities in the European Union. SF6 has unique, and currently irreplaceable, properties that allow the optimized operation of electrical switchgear and electricity networks. Electric equipment based on SF6-technology is used in the generation, transmission and distribution of electricity all over the world. The substance SF6 possesses a unique combination of properties such as non-toxicity, non-ozone-depletion, non-flammability and outstanding electrical properties. However, SF6 is one of the six greenhouse gases regulated under the Kyoto Protocol. Despite great research efforts, to date no equivalent alternative gas has been identified. The manufacturing of SF6 electrical equipment provides employment for about 30,000 people across the EU-25, Switzerland, Norway and Iceland (EU-25+3). The annual sales value of SF6 electrical equipment produced amounts to more than 3.5 billion € per year. About 60-70 % of SF6 electrical equipment produced in Europe is exported outside Europe. The discounted value of SF6 electrical equipment installed across Europe is estimated at 20 billion €. The study came to the following conclusions: In the EU-15 the contribution of SF6 from electrical equipment amounted to 0.05 % of the total greenhouse gas emissions in 2002. Total greenhouse gas emissions in the EU-15 in 2002 amounted to 4852 million tons of CO2-equivalent (EEA 2004). According to the most recent survey, at the same time the manufacturing, use and decommissioning of SF6 electrical equipment contributed 2.4 million tons of CO2-equivalent to EU-15 emissions, respectively. Although the electricity industry is a major user of SF6 it is only a minor source of SF6 emissions. Since 1995, voluntary actions by the European electricity industry have resulted in a reduction of 40 % of SF6 emissions. Most of the potential for emission reductions has already been realized. However there remains some scope for further reductions. Accepting climate change as a major challenge, the electricity industry – including both manufacturers and users of electrical equipment - started around the year 1995 to implement various measures to reduce SF6 emissions. These include enhanced tightness by design, gas recovery and re-use as well as training of personnel handling SF6. Specific reduction costs of the various measures voluntarily implemented by the sector since 1995 range up to 40 Euro per ton of avoided CO2–
I
equivalent, which is twice the current trading price of emission allowances in the mandatory EU emissions trading scheme. The electricity industry has managed the growing population of SF6 equipment in the EU-25+3 in order to reduce annual emissions from 4.8 million tons of CO2-equivalent to 2.9 million tons – delivering a reduction of nearly 40 % in less than ten years. While the action already taken covers most of the potential reduction measures, full coverage of these measures throughout the electrical industry in the EU-25+3 has not yet been achieved. Life-cycle-assessments show that the use of SF6 in electrical equipment can reduce the overall CO2-emissions from the electricity systems due to reduced network losses. The use of SF6 technology permits a compact design of equipment and thus allows for an optimized layout of power networks. High voltage networks can be located closer to the consumers of electrical energy, which leads to lower transmission losses. Less energy lost means also less CO2-emissions from power generation from fossil fuels. In 2003 this effect is estimated to have avoided emissions of about 1.7 million tons of CO2 across the EU-25+3. These savings therefore help to diminish the net-climate contribution of SF6-technology in any power generation system at least partly based on fossil fuels. The study shows that the voluntary actions taken by the electricity industry have resulted in significant emission reductions and proposes how to access the remaining reduction potential through further voluntary action.
II
1 Introduction
1 .1 SF 6 and C l imate Po l i cy
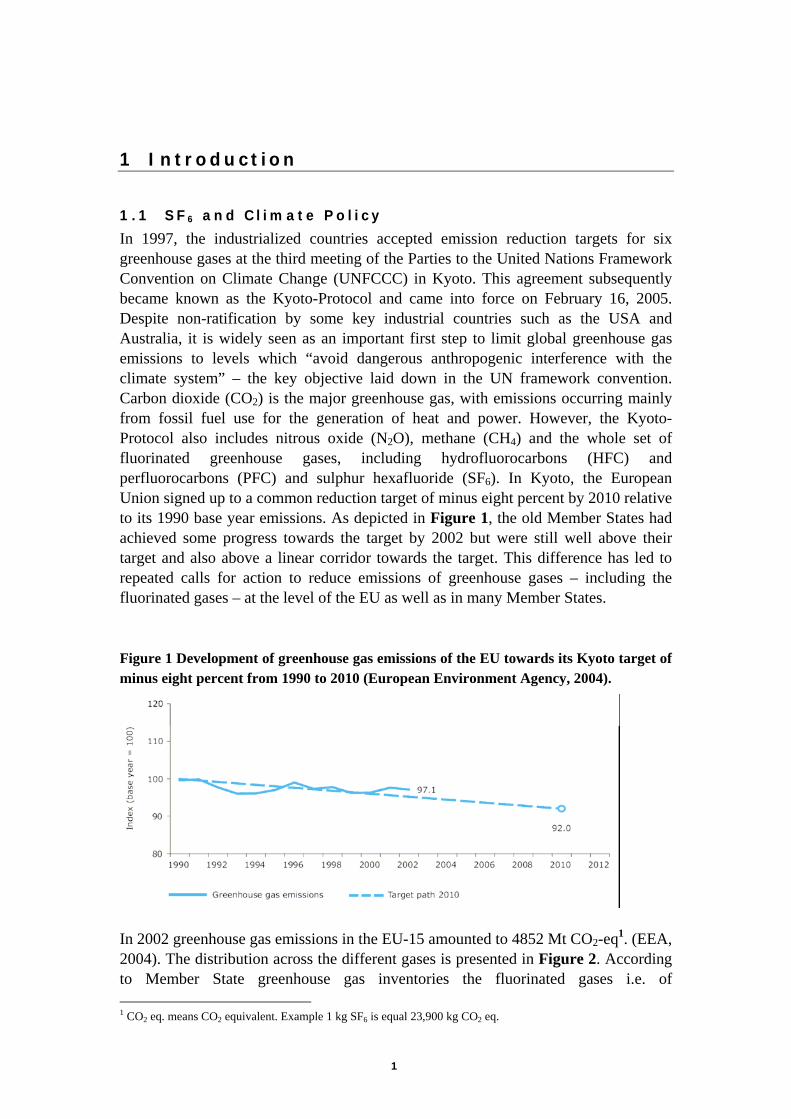
In 1997, the industrialized countries accepted emission reduction targets for six greenhouse gases at the third meeting of the Parties to the United Nations Framework Convention on Climate Change (UNFCCC) in Kyoto. This agreement subsequently became known as the Kyoto-Protocol and came into force on February 16, 2005. Despite non-ratification by some key industrial countries such as the USA and Australia, it is widely seen as an important first step to limit global greenhouse gas emissions to levels which “avoid dangerous anthropogenic interference with the climate system” – the key objective laid down in the UN framework convention. Carbon dioxide (CO2) is the major greenhouse gas, with emissions occurring mainly from fossil fuel use for the generation of heat and power. However, the Kyoto-Protocol also includes nitrous oxide (N2O), methane (CH4) and the whole set of fluorinated greenhouse gases, including hydrofluorocarbons (HFC) and perfluorocarbons (PFC) and sulphur hexafluoride (SF6). In Kyoto, the European Union signed up to a common reduction target of minus eight percent by 2010 relative to its 1990 base year emissions. As depicted in Figure 1, the old Member States had achieved some progress towards the target by 2002 but were still well above their target and also above a linear corridor towards the target. This difference has led to repeated calls for action to reduce emissions of greenhouse gases – including the fluorinated gases – at the level of the EU as well as in many Member States. Figure 1 Development of greenhouse gas emissions of the EU towards its Kyoto target of minus eight percent from 1990 to 2010 (European Environment Agency, 2004).
In 2002 greenhouse gas emissions in the EU-15 amounted to 4852 Mt CO2-eq1. (EEA, 2004). The distribution across the different gases is presented in Figure 2. According to Member State greenhouse gas inventories the fluorinated gases i.e. of 1 CO2 eq. means CO2 equivalent. Example 1 kg SF6 is equal 23,900 kg CO2 eq.
1
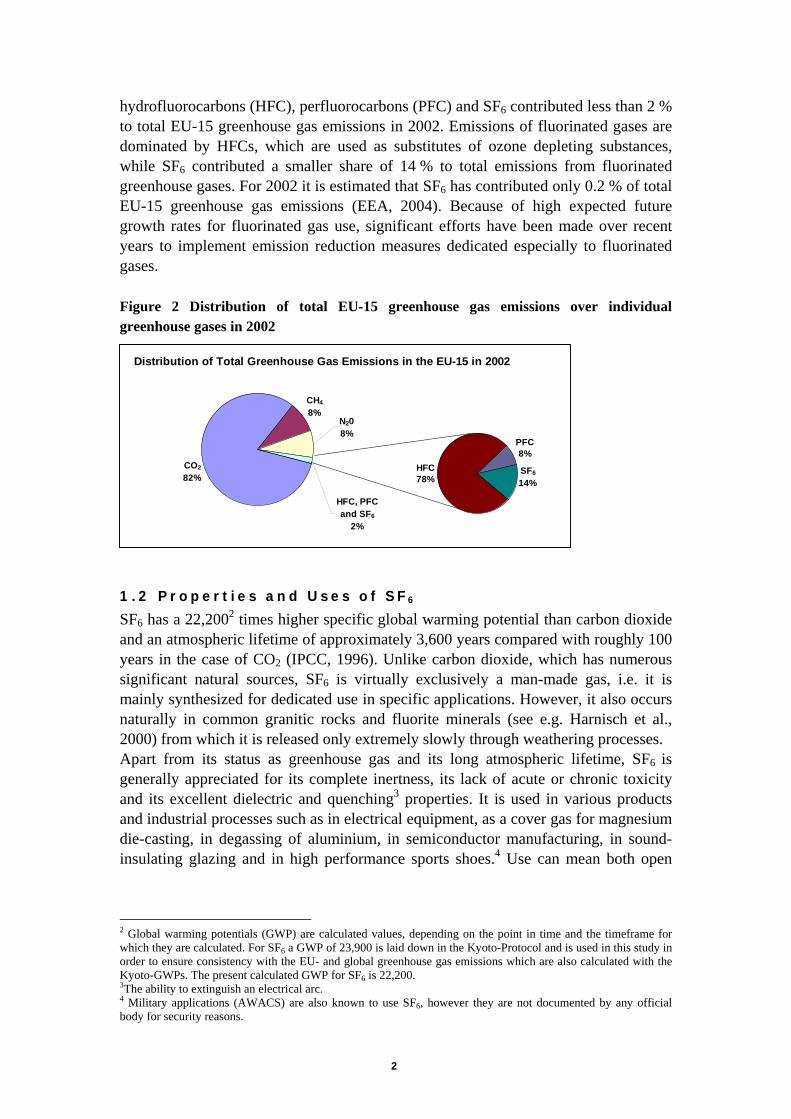
hydrofluorocarbons (HFC), perfluorocarbons (PFC) and SF6 contributed less than 2 % to total EU-15 greenhouse gas emissions in 2002. Emissions of fluorinated gases are dominated by HFCs, which are used as substitutes of ozone depleting substances, while SF6 contributed a smaller share of 14 % to total emissions from fluorinated greenhouse gases. For 2002 it is estimated that SF6 has contributed only 0.2 % of total EU-15 greenhouse gas emissions (EEA, 2004). Because of high expected future growth rates for fluorinated gas use, significant efforts have been made over recent years to implement emission reduction measures dedicated especially to fluorinated gases. Figure 2 Distribution of total EU-15 greenhouse gas emissions over individual greenhouse gases in 2002
CH4
8%
CO2
82%
N208%
HFC, PFC and SF6
2%
HFC78%
PFC8%
SF6
14%
Distribution of Total Greenhouse Gas Emissions in the EU-15 in 2002
1.2 Propert ies and Uses of SF6
SF6 has a 22,2002 times higher specific global warming potential than carbon dioxide and an atmospheric lifetime of approximately 3,600 years compared with roughly 100 years in the case of CO2 (IPCC, 1996). Unlike carbon dioxide, which has numerous significant natural sources, SF6 is virtually exclusively a man-made gas, i.e. it is mainly synthesized for dedicated use in specific applications. However, it also occurs naturally in common granitic rocks and fluorite minerals (see e.g. Harnisch et al., 2000) from which it is released only extremely slowly through weathering processes. Apart from its status as greenhouse gas and its long atmospheric lifetime, SF6 is generally appreciated for its complete inertness, its lack of acute or chronic toxicity and its excellent dielectric and quenching3 properties. It is used in various products and industrial processes such as in electrical equipment, as a cover gas for magnesium die-casting, in degassing of aluminium, in semiconductor manufacturing, in sound-insulating glazing and in high performance sports shoes.4 Use can mean both open
2 Global warming potentials (GWP) are calculated values, depending on the point in time and the timeframe for which they are calculated. For SF6 a GWP of 23,900 is laid down in the Kyoto-Protocol and is used in this study in order to ensure consistency with the EU- and global greenhouse gas emissions which are also calculated with the Kyoto-GWPs. The present calculated GWP for SF6 is 22,200. 3The ability to extinguish an electrical arc. 4 Military applications (AWACS) are also known to use SF6, however they are not documented by any official body for security reasons.
2
use, where the gas is emitted, as e.g. in the case of magnesium die-casting, as well as closed use, where the gas is banked in products, as in the case of electrical equipment. One approach to reduce SF6 emissions is obviously to substitute it in processes or applications by another substance with similar properties. Where no appropriate alternatives are available, the resulting costs of a transition could become prohibitive or the net environmental benefits be corrupted. As a consequence, a reduction of lifecycle emissions will generally be the goal. In the EU SF6 is being phased out in a few selected applications such as the gas cushioning in certain sports shoes or sound insulating glazing. Proposals have been placed before the European Parliament for use restrictions of SF6 in open applications for car tyres, the use as a cover gas in magnesium die-casting and for double glazing of windows. For these applications functionally equivalent alternatives without SF6 are available, such as air for car tyres and thicker glass, extra space between panes and different types of glass for the soundproofing functionality of double-glazed windows. For many other applications, including electrical equipment, this is not the case. In the field of electrical equipment a systematic search for environmentally friendly alternatives to SF6 started and is still ongoing within the International Scientific Community. For the time being, no suitable alternatives have been identified. 5
This study deals specifically with the use of SF6 technology in electrical equipment, mainly switchgear. Regarding a safe and reliable power supply, SF6 electrical equipment forms an integral part of the power networks throughout the world including most European countries. Proper containment of SF6 is a basic requirement for the use of this technology. The equipment can only function properly if no or only minimal emissions of SF6 exist, therefore gas tightness is a basic issue in design and manufacture of equipment. The level of emissions over the expected lifetime of 40-50 years depends on specific design elements of the equipment and the production process, but also on lifetime maintenance requirements, SF6 handling equipment and procedures. The EU’s proposed F-Gas-Regulation (Status March 2005) contains provisions also relevant to the control of SF6 emissions from electrical equipment. Relevant issues comprise labelling of the equipment, monitoring / reporting of SF6 amounts, qualification of staff and recovery of gas during decommissioning of equipment.
1.3 Scope o f the Study
The Coordinating Committee for the Associations of Manufacturers of Industrial Electrical Switchgear and Controlgear in the European Union (CAPIEL) has asked Ecofys for independent scientific advice and commissioned Ecofys to undertake this study. EURELECTRIC representing the major part of the user side for
5 See for example COST action “Alternative SF6” ENK6 CT 2000-0087, which is in the 5th Framework of the European Commission.
3
electrical equipment6 cooperated in the study in order to ensure full coverage of the life-cycle of the equipment. Cooperation included providing data on emissions and reduction measures during the use-phase in the EU-25+3. This study aims to provide political decision makers with information regarding the use of SF6 in the electricity industry. In doing so, the study has the following objectives:
• to give a brief and easy to understand overview on the technology and its characteristics,
• to estimate and project the amounts of SF6 emitted from and banked in electrical equipment for 1995, 2003, 2010, 2020,
• to quantify emission reductions already achieved since 1995 and to estimate remaining reduction potentials (including costs),
• to analyse the effectiveness of voluntary actions for the reduction greenhouse emissions over the various life-cycle phases of systems applying SF6 in electrical equipment.
The regional scope of the study is the EU-25 plus Switzerland, Norway and Iceland. This group is in the following referred to as “EU-25+3”. Within this region a more or less homogenous market regarding the available and installed technologies of electrical equipment is found. Other large markets for SF6 electrical equipment like the U.S.A. or Japan may differ widely from the European situation regarding used technologies and emission levels.
6 The only key-user group of SF6 electrical equipment not represented by EURELECTRIC are companies owning medium voltage switchgear equipment for power supply at production sites.
4
2 SF6 Electrical Equipment
While being basic to electricity supply, SF6 electrical equipment is not very well known to the end-users of power. In 2003 the industry sector has a turnover of roughly 3.5 Billion € in the EU-25+3, with an export rate between 60-70 % depending on the type of equipment. The number of employees amounts to roughly 30,000. The equipment installed presently in the EU-25+3 is estimated to have a value of at least 20 Billion €. This section gives a short overview on the basic functioning of electricity supply networks as well as on switchgear technologies. The potential of reducing transmission losses through the use of SF6 electrical equipment is presented, followed by an overview of equipment categories considered in this study as well as the equipment life-cycle.
2.1 Power Transmiss ion and Distr ibut ion
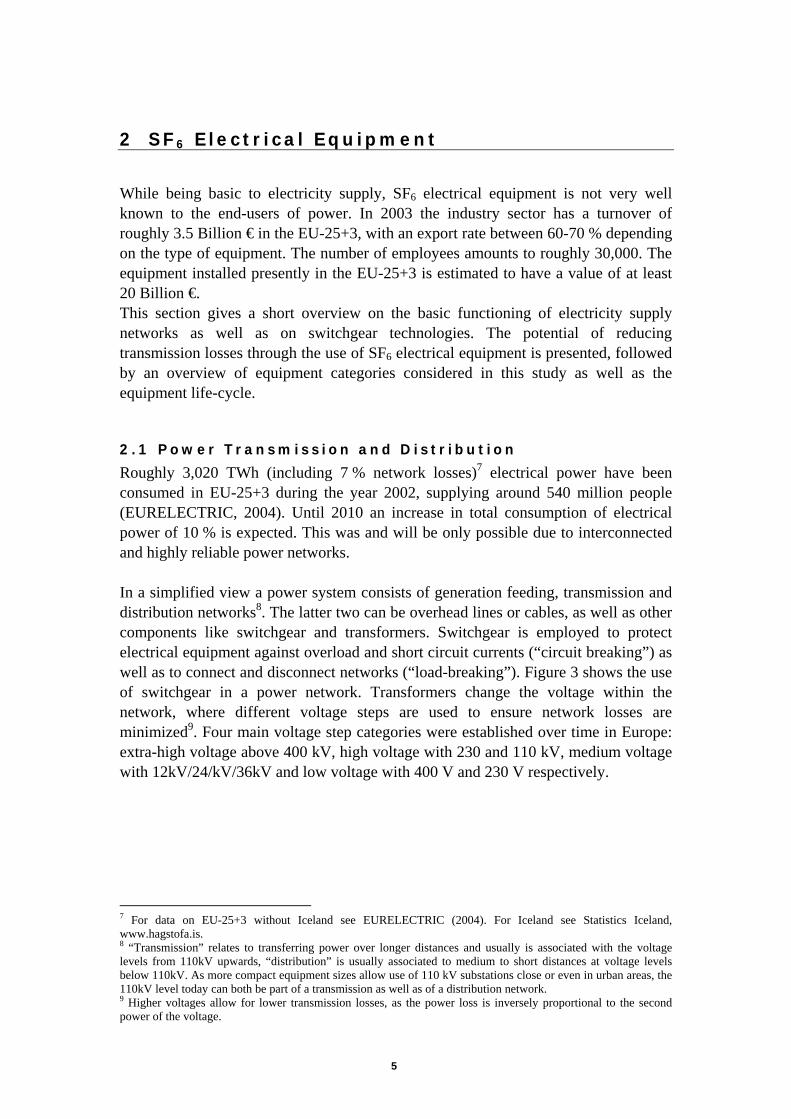
Roughly 3,020 TWh (including 7 % network losses)7 electrical power have been consumed in EU-25+3 during the year 2002, supplying around 540 million people (EURELECTRIC, 2004). Until 2010 an increase in total consumption of electrical power of 10 % is expected. This was and will be only possible due to interconnected and highly reliable power networks. In a simplified view a power system consists of generation feeding, transmission and distribution networks8. The latter two can be overhead lines or cables, as well as other components like switchgear and transformers. Switchgear is employed to protect electrical equipment against overload and short circuit currents (“circuit breaking”) as well as to connect and disconnect networks (“load-breaking”). Figure 3 shows the use of switchgear in a power network. Transformers change the voltage within the network, where different voltage steps are used to ensure network losses are minimized9. Four main voltage step categories were established over time in Europe: extra-high voltage above 400 kV, high voltage with 230 and 110 kV, medium voltage with 12kV/24/kV/36kV and low voltage with 400 V and 230 V respectively.
7 For data on EU-25+3 without Iceland see EURELECTRIC (2004). For Iceland see Statistics Iceland, www.hagstofa.is. 8 “Transmission” relates to transferring power over longer distances and usually is associated with the voltage levels from 110kV upwards, “distribution” is usually associated to medium to short distances at voltage levels below 110kV. As more compact equipment sizes allow use of 110 kV substations close or even in urban areas, the 110kV level today can both be part of a transmission as well as of a distribution network. 9 Higher voltages allow for lower transmission losses, as the power loss is inversely proportional to the second power of the voltage.
5
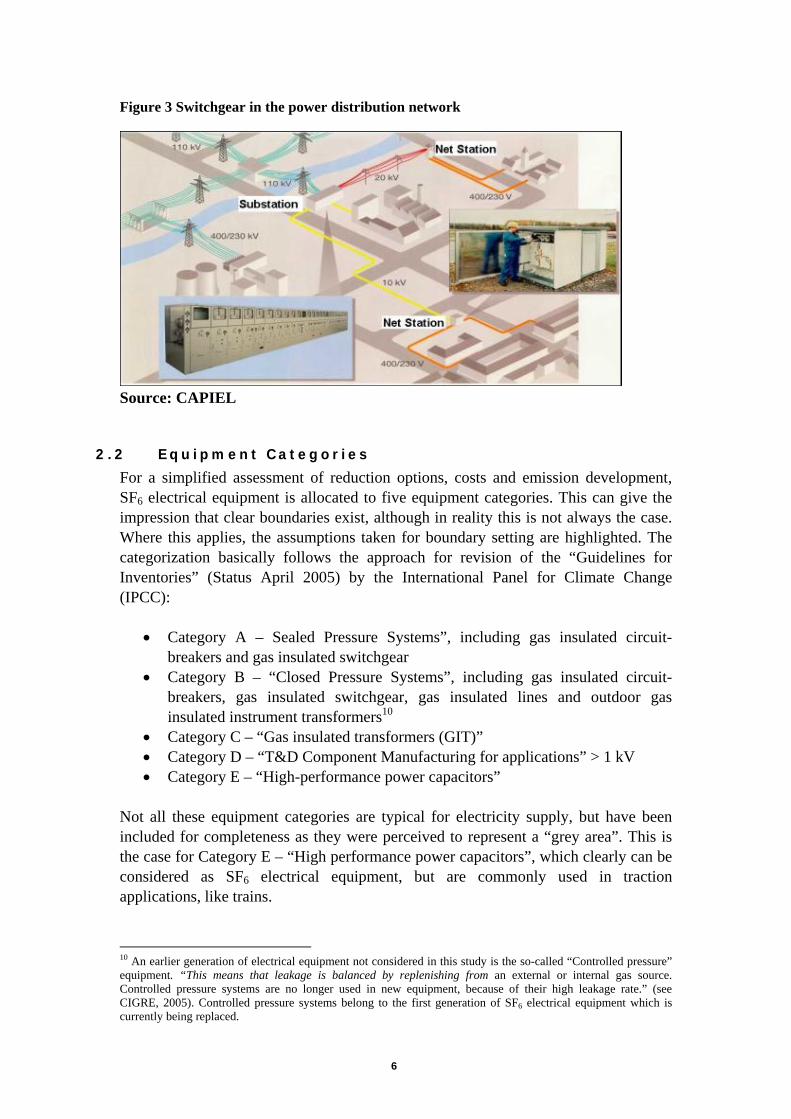
Figure 3 Switchgear in the power distribution network
Source: CAPIEL
2.2 Equipment Categor ies
For a simplified assessment of reduction options, costs and emission development, SF6 electrical equipment is allocated to five equipment categories. This can give the impression that clear boundaries exist, although in reality this is not always the case. Where this applies, the assumptions taken for boundary setting are highlighted. The categorization basically follows the approach for revision of the “Guidelines for Inventories” (Status April 2005) by the International Panel for Climate Change (IPCC):
• Category A – Sealed Pressure Systems”, including gas insulated circuit-breakers and gas insulated switchgear
• Category B – “Closed Pressure Systems”, including gas insulated circuit-breakers, gas insulated switchgear, gas insulated lines and outdoor gas insulated instrument transformers10
• Category C – “Gas insulated transformers (GIT)” • Category D – “T&D Component Manufacturing for applications” > 1 kV • Category E – “High-performance power capacitors”
Not all these equipment categories are typical for electricity supply, but have been included for completeness as they were perceived to represent a “grey area”. This is the case for Category E – “High performance power capacitors”, which clearly can be considered as SF6 electrical equipment, but are commonly used in traction applications, like trains.
10 An earlier generation of electrical equipment not considered in this study is the so-called “Controlled pressure” equipment. “This means that leakage is balanced by replenishing from an external or internal gas source. Controlled pressure systems are no longer used in new equipment, because of their high leakage rate.” (see CIGRE, 2005). Controlled pressure systems belong to the first generation of SF6 electrical equipment which is currently being replaced.
6
Categories A-E will be described in more detail in the following including also their contribution to SF6-emissions from electrical equipment11 in the EU-25+3. Category A: “Sealed Pressure Systems” Sealed pressure systems are defined as: “Sealed pressure system: a volume for which no further gas [...] processing is required during its expected operating life” (IEC 60694, 2002) For this study all switchgear between 1- 52 kV in the EU 25+3 is allocated to this category. Typical new (state-of-the-art) medium voltage equipment is of the sealed pressure type, while some older medium voltage equipment which is not of the sealed pressure type exists. The category “Sealed Pressure Systems” includes gas insulated circuit breakers and gas insulated switchgear. Sealed pressure equipment has been in service since the early 1980’s. It has a metal enclosure designed not to be opened during the lifetime of the equipment. Maintenance inside the gas compartment during the expected lifetime of about 40 years is not required under normal circumstances. The design ensures very low leakage rates during operation – presently less than 0.1 % annually. The average emission rate12 from the existing bank is about 0.24 % at present, as it also includes older equipment with slightly higher rates. About 80 % of the bank has a considerable lower average emission rate of 0.14 %. As the equipment is typically shipped at operating pressure and no topping-up of gas or maintenance action including gas handling is necessary during its lifetime, gas handling only takes place during manufacture and decommissioning. The amount of SF6 contained varies widely with the specific application, but 0.25-10 kg per gas compartment can be considered as a typical range. Figure 4 shows a substation at the secondary distribution level connecting medium-voltage and low-voltage distribution. It contains the sealed for life equipment (ring-main unit) belonging to the medium voltage level, the transformer and the equipment for low-voltage distribution. In the ring-main unit SF6 is used both for switching and insulation. In 2003 Category A contributed 14 % to total SF6-emissions from electrical equipment in the EU-25+3.
11 Including all emissions throughout the life-cycle, i.e. from manufacturing, use and decommissioning. 12 The emission rate includes the emissions from design-related leakage, as well as from gas handling and faults. As no gas handling takes place during the lifetime of sealed pressure equipment and faults are exceptional events, for sealed equipment the design related leakage is the main factor for emissions during use.
7
Figure 4 Sealed pressure equipment in a transformer substation
Source: CAPIEL
Category B “Closed Pressure Systems” Closed Pressure Systems are defined as: “A volume replenished only periodically by manual connection to an external gas source.”(IEC 60694, 2002) Any switchgear above 52 kV, i.e. high and extra-high voltage, in the EU-25+3 is assigned to Category B “Closed Pressure”. This category contains gas insulated circuit breakers, gas insulated switchgear, gas insulated lines and outdoor gas-insulated instrument transformers. For equipment designed since the mid-nineties maintenance including gas handling for closed pressure systems is commonly required every 20 to 25 years. Topping-up of SF6 can be required several times during the lifetime, depending on the leakage rate. Design-related leakage rates for new equipment are commonly far below 0.5 % p.a., with an overall emission rate – including design-related leakage, emissions from small leaks and handling losses - for the existing EU-25+3 banks of 1.8 % in 2003. Whenever technically feasible, continuous monitoring is used to enable early detection and elimination of small leaks. Operation pressure is in the range of 2-8 bar absolute pressure. The high operating pressure requires transport of the equipment with a lower pressure level and filling up to the operating pressure at the site of installation. Gas amounts can vary between a few kg and 200 kg SF6 per gas compartment. Switchgear dimensions and subsequently also the SF6 amount per piece of equipment have significantly decreased over time. Category B accounted for 73 % of SF6 emissions from electrical equipment in the EU-25+3 in 2003. Category C – “Gas insulated transformers (GIT)”: This application represented only a niche market in the EU, and is far more common on the Asiatic market. After 1999 gas insulated transformers were no longer in standard production in the EU-25+3. In the EU market insulating oil (high voltage) and dry type-transformers or equipment containing non flammable liquids for cooling- and insulating media are used today. The existing SF6 banks of gas insulated transformers equipment will
8
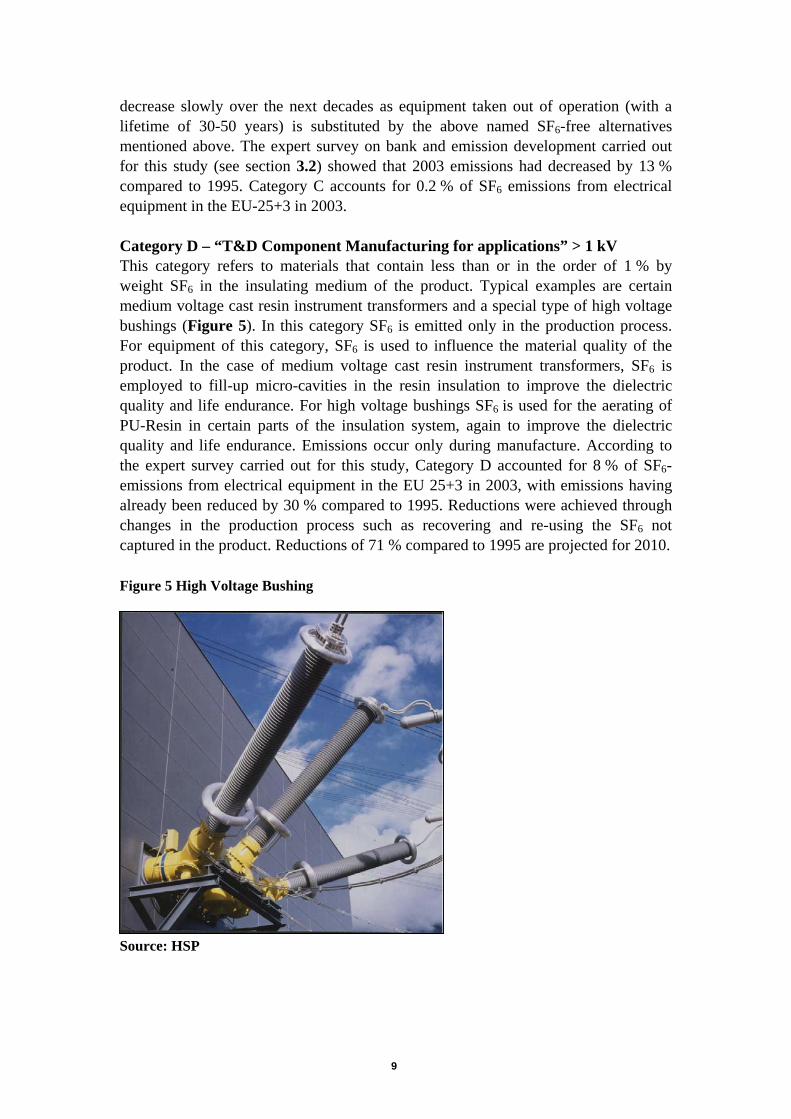
decrease slowly over the next decades as equipment taken out of operation (with a lifetime of 30-50 years) is substituted by the above named SF6-free alternatives mentioned above. The expert survey on bank and emission development carried out for this study (see section 3.2) showed that 2003 emissions had decreased by 13 % compared to 1995. Category C accounts for 0.2 % of SF6 emissions from electrical equipment in the EU-25+3 in 2003. Category D – “T&D Component Manufacturing for applications” > 1 kV This category refers to materials that contain less than or in the order of 1 % by weight SF6 in the insulating medium of the product. Typical examples are certain medium voltage cast resin instrument transformers and a special type of high voltage bushings (Figure 5). In this category SF6 is emitted only in the production process. For equipment of this category, SF6 is used to influence the material quality of the product. In the case of medium voltage cast resin instrument transformers, SF6 is employed to fill-up micro-cavities in the resin insulation to improve the dielectric quality and life endurance. For high voltage bushings SF6 is used for the aerating of PU-Resin in certain parts of the insulation system, again to improve the dielectric quality and life endurance. Emissions occur only during manufacture. According to the expert survey carried out for this study, Category D accounted for 8 % of SF6-emissions from electrical equipment in the EU 25+3 in 2003, with emissions having already been reduced by 30 % compared to 1995. Reductions were achieved through changes in the production process such as recovering and re-using the SF6 not captured in the product. Reductions of 71 % compared to 1995 are projected for 2010. Figure 5 High Voltage Bushing
Source: HSP
9
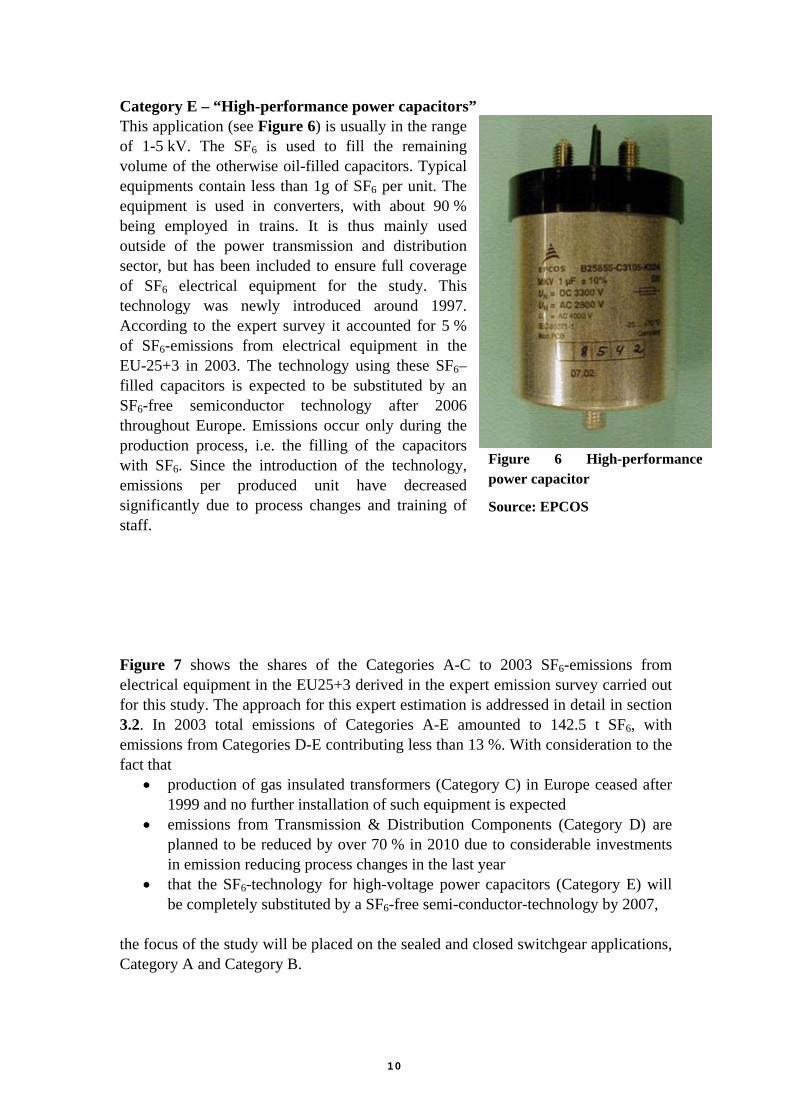
Category E – “High-performance power capacitors” This application (see Figure 6) is usually in the range
igure 7 shows the shares of the Categories A-C to 2003 SF6-emissions from
duction of gas insulated transformers (Category C) in Europe ceased after
• ategory D) are
• citors (Category E) will
e focus of the study will be placed on the sealed and closed switchgear applications,
of 1-5 kV. The SF6 is used to fill the remaining volume of the otherwise oil-filled capacitors. Typical equipments contain less than 1g of SF6 per unit. The equipment is used in converters, with about 90 % being employed in trains. It is thus mainly used outside of the power transmission and distribution sector, but has been included to ensure full coverage of SF6 electrical equipment for the study. This technology was newly introduced around 1997. According to the expert survey it accounted for 5 % of SF6-emissions from electrical equipment in the EU-25+3 in 2003. The technology using these SF6–filled capacitors is expected to be substituted by an SF6-free semiconductor technology after 2006 throughout Europe. Emissions occur only during the production process, i.e. the filling of the capacitors with SF6. Since the introduction of the technology, emissions per produced unit have decreased significantly due to process changes and training of staff. Felectrical equipment in the EU25+3 derived in the expert emission survey carried out for this study. The approach for this expert estimation is addressed in detail in section 3.2. In 2003 total emissions of Categories A-E amounted to 142.5 t SF6, with emissions from Categories D-E contributing less than 13 %. With consideration to the fact that
• pro
Figure 6 High-performancepower capacitor
Source: EPCOS
1999 and no further installation of such equipment is expected emissions from Transmission & Distribution Components (Cplanned to be reduced by over 70 % in 2010 due to considerable investments in emission reducing process changes in the last year that the SF6-technology for high-voltage power capabe completely substituted by a SF6-free semi-conductor-technology by 2007,
thCategory A and Category B.
10
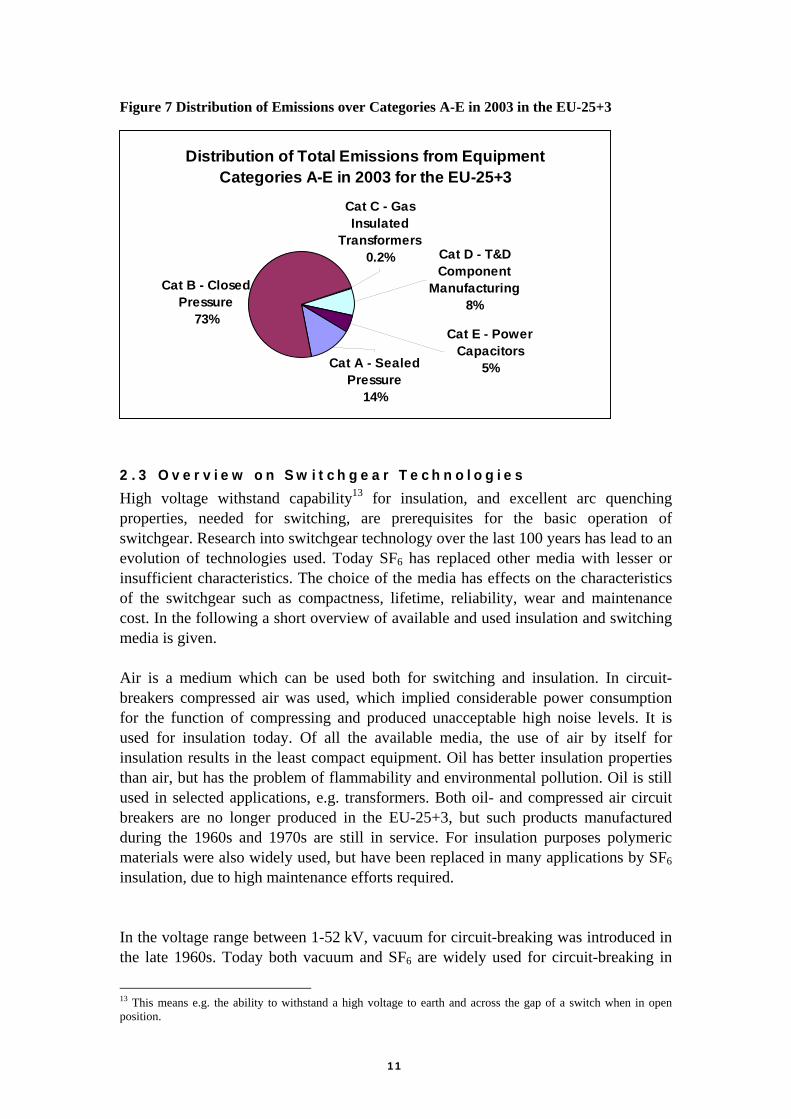
Figure 7 Distribution of Emissions over Categories A-E in 2003 in the EU-25+3
Distribution of Total Emissions from Equipment Categories A-E in 2003 for the EU-25+3
Cat B - Closed Pressure
73%Cat E - Power
Capacitors5%
Cat D - T&D Component
Manufacturing8%
Cat A - Sealed Pressure
14%
Cat C - Gas Insulated
Transformers0.2%
2.3 Overv iew on Switchgear Technolog ies
High voltage withstand capability13 for insulation, and excellent arc quenching properties, needed for switching, are prerequisites for the basic operation of switchgear. Research into switchgear technology over the last 100 years has lead to an evolution of technologies used. Today SF6 has replaced other media with lesser or insufficient characteristics. The choice of the media has effects on the characteristics of the switchgear such as compactness, lifetime, reliability, wear and maintenance cost. In the following a short overview of available and used insulation and switching media is given. Air is a medium which can be used both for switching and insulation. In circuit-breakers compressed air was used, which implied considerable power consumption for the function of compressing and produced unacceptable high noise levels. It is used for insulation today. Of all the available media, the use of air by itself for insulation results in the least compact equipment. Oil has better insulation properties than air, but has the problem of flammability and environmental pollution. Oil is still used in selected applications, e.g. transformers. Both oil- and compressed air circuit breakers are no longer produced in the EU-25+3, but such products manufactured during the 1960s and 1970s are still in service. For insulation purposes polymeric materials were also widely used, but have been replaced in many applications by SF6 insulation, due to high maintenance efforts required. In the voltage range between 1-52 kV, vacuum for circuit-breaking was introduced in the late 1960s. Today both vacuum and SF6 are widely used for circuit-breaking in
13 This means e.g. the ability to withstand a high voltage to earth and across the gap of a switch when in open position.
11
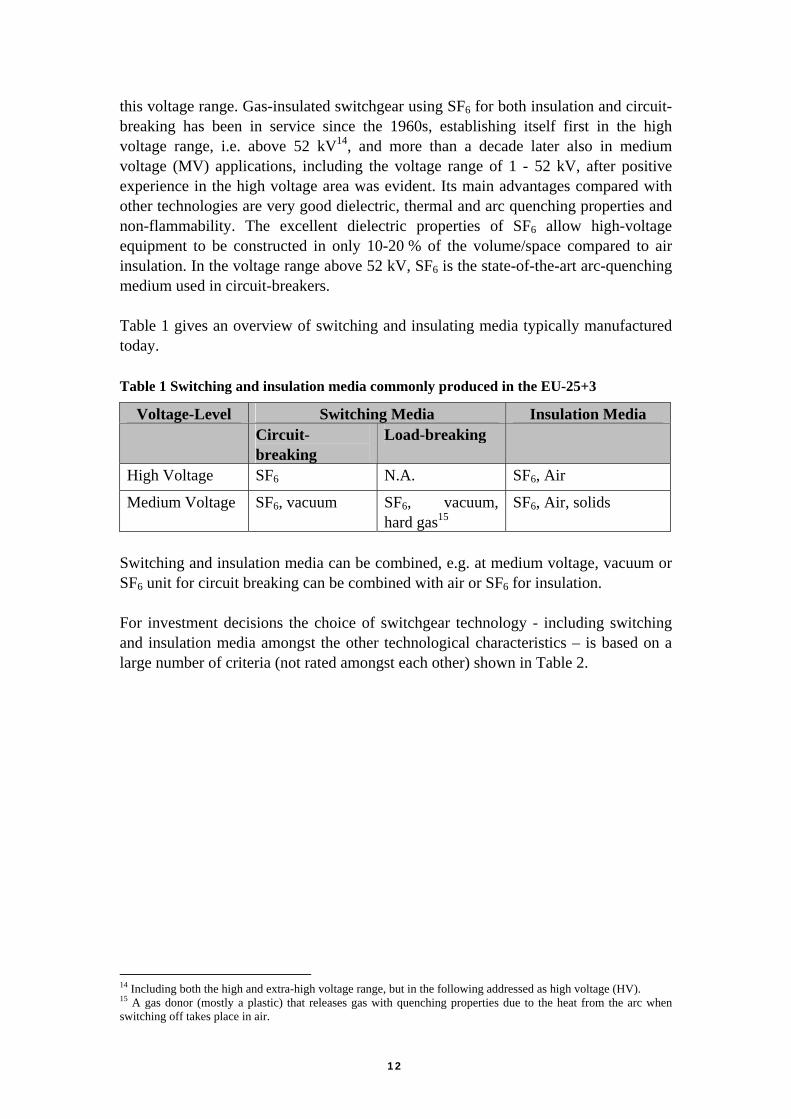
this voltage range. Gas-insulated switchgear using SF6 for both insulation and circuit-breaking has been in service since the 1960s, establishing itself first in the high voltage range, i.e. above 52 kV14, and more than a decade later also in medium voltage (MV) applications, including the voltage range of 1 - 52 kV, after positive experience in the high voltage area was evident. Its main advantages compared with other technologies are very good dielectric, thermal and arc quenching properties and non-flammability. The excellent dielectric properties of SF6 allow high-voltage equipment to be constructed in only 10-20 % of the volume/space compared to air insulation. In the voltage range above 52 kV, SF6 is the state-of-the-art arc-quenching medium used in circuit-breakers. Table 1 gives an overview of switching and insulating media typically manufactured today. Table 1 Switching and insulation media commonly produced in the EU-25+3
Voltage-Level Switching Media Insulation Media Circuit-
breaking Load-breaking
High Voltage SF6 N.A. SF6, Air
Medium Voltage SF6, vacuum
SF6, vacuum, hard gas15
SF6, Air, solids
Switching and insulation media can be combined, e.g. at medium voltage, vacuum or SF6 unit for circuit breaking can be combined with air or SF6 for insulation. For investment decisions the choice of switchgear technology - including switching and insulation media amongst the other technological characteristics – is based on a large number of criteria (not rated amongst each other) shown in Table 2.
14 Including both the high and extra-high voltage range, but in the following addressed as high voltage (HV). 15 A gas donor (mostly a plastic) that releases gas with quenching properties due to the heat from the arc when switching off takes place in air.
12
Table 2 Typical Investment Criteria for Electrical Equipment
Techno-economical Criteria System/Network optimization considering transmission losses Environmental conditions at the site of installation (climate,
humidity) Available space at Installation Flexibility regarding choice of installation site Simple erection and handling Stock-keeping Power Quality
Life-cycle costs (and influencing factors) Investment incl. costs for site and buildings Maintenance frequency/effort Expected Lifetime Failure rate/Availability of supply Decommissioning/Recycling
Ecological Criteria / Sustainability Cumulated emissions at system/equipment level Need for usable and sealed space Network structure of overhead lines and cable Suitability for re-use, re-cycling and decommissioning
Public Security and Safety at Work Personal safety Danger of fire events Electromagnetic fields Acoustic emissions Security of supply Training requirements
2.4 Reduced Energy Losses
The transmission and distribution of electricity from power plants to commercial and household consumers over long distances inevitably leads to significant losses of energy in the range of 4 % to over 10 % depending on country circumstances. As an average for the EU 25+3 countries a value of 7 % was determined for 2002 (EURELECTRIC, 2004). As power losses are inversely proportional to the square of the voltage for achieving lower losses, it is essential to maximise the voltage. Bringing the highest possible voltage close to the consumers of electricity is therefore extremely important in the design of power networks. The current European mix of high, medium and low voltage networks is close to an economic optimum in which costs from avoided losses and additional expenditure for higher voltages are roughly equal. Even so, across the EU about 7 % of electric power is lost due to transmission and distribution losses. For the 900 million tons of CO2 which were emitted in the year 2000 connected to electricity generation (EURELECTRIC, 2002), transmission and distribution network losses correspond to about 60 million tons of CO2. This
13
emission is one order of magnitude higher than the direct annual emissions from the use of SF6 electrical equipment within EU-15 in the same year. Because of the relation between the choice of technology used in electrical equipment and network-structure and losses, any assessment of greenhouse gas emissions has to consider indirect emissions (associated with electricity losses) along with direct emissions of the greenhouse gas SF6 from the equipment. Due to its compactness, SF6 insulated electrical equipment permits transmission and distribution networks to be designed differently, allowing high voltage networks to be brought closer to urban consumers. This minimizes energy losses connected to transmission and distribution. At the same time, resistance losses within the electrical equipment are also reduced due to their more compact design. Two recent lifecycle assessment (LCA) studies have compared in great detail net greenhouse gas emissions from specific transmission and distribution networks based on electrical equipment with and without SF6 (Krähling, 1999; Mersiowsky, 2003). In the former study (Krähling, 1999) which focussed on an exemplary high-voltage network-fraction based on SF6 equipment with an installed bank of 1.5 tons of SF6 , annual savings were shown to be roughly 1.2 GWh. The study focused on loss reduction in the high-voltage network as an indirect effect of SF6-insulated equipment. In the latter study (Mersiowsky, 2003), which focused on an exemplary mixed urban/rural medium-voltage network based on SF6 equipment with an installed bank of 0.35 tons of SF6, annual savings were shown to be roughly 140 MWh out of total resistance losses of roughly 1.3 GWh and out of a total of roughly 260 GWh distributed through that network. This study quantified the loss reduction by the switchgear itself, whereas potential effects from changed network topology resulting from using SF6-insulated equipment instead of air-insulated equipment were not considered. It is commonly discouraged to extrapolate the results of a specific LCA study to an entire sector. In absence of better data or models we here nevertheless used the results of the two recent LCAs (see details above) to estimate the contribution of SF6 technology to reducing transmission and distribution losses of electricity in Europe as general rules of thumb: accordingly, in HV applications 1 ton of installed SF6 would save 0.8 GWh per year and in MV applications 1 ton of installed SF6 would save 0.2 GWh per year. Applying the EU-15 generation mix value of 0.35 kg CO2/kWh (EURELECTRIC, 2004), one obtains emission reductions from decreased transmission and distribution losses for the installed EU-25+3 banks in 2003 of 5000 tons of SF6 in HV equipment and 2000 tons of SF6 in MV equipment of roughly 1.7 Mt CO2, annually. Based on the assumptions of the underlying studies, this confirms that indirect CO2 savings attributable to SF6 technology are of similar magnitude as projected life-cycle SF6 emissions for equipment with appropriately managed manufacture and end-of-life. Therefore measures to reduce net greenhouse gas emissions in this sector need to
14
be designed with particular care in order to yield true environmental benefits at reasonable costs.
2.5 L i fe-Cyc le SF 6 Emiss ions
In the manufacturing phase, components are produced and assembled and depending on the type of equipment, several test phases (for components as well as assembled equipment) are carried out regarding the gas tightness of the equipment. Sealed pressure equipment is usually filled and tested at the production site and is, in case of normal operation, only reopened for recovery of gas at decommissioning. Closed pressure systems are filled for testing at the production site. The gas is then recovered and the equipment is filled with SF6 or N2 at a pressure slightly above atmospheric for shipping. At the installation site they are then topped up (if filled with SF6 before) or evacuated (if filled with N2 before) and then filled to the rated filling pressure with SF6, respectively. During the manufacturing process – and of course also throughout the rest of the life-cycle - emissions can occur whenever gas is handled, this is predominantly during, filling/topping up, testing, and evacuation. During the use phase no gas handling is required for sealed equipment. Closed pressure equipment installed during the last ten years is designed to require maintenance including gas-handling only once every 20-25 years. During this kind of maintenance the SF6 is recovered from the equipment prior to opening for inspection. Afterwards the equipment is evacuated and refilled. Older equipment with higher design-related leakage rates might require topping up of gas additionally to the refilling during maintenance. Emissions in the use-phase include the design-related leakage of the equipment, increased leakage of faulty equipment, losses during gas handling action and emissions from failures and arc faults16. For this study, the emission rate during use-phase addresses all these emissions. In the decommissioning of equipment, SF6 is recovered and then directly reused on site, incinerated or, if not of appropriate quality to be immediately reused, it is recycled for re-use. In the incineration process the gas is converted into its basic elements. Re-use on site is presently more common than incineration, while some countries tend more towards incineration of gas then others.17 Recycling of SF6 is commonly carried out by the gas supplier. The evacuated equipment is dismantled and the materials are predominantly recycled, as a number of valuable raw materials such as stainless steel and aluminium are contained. As full recovery of the gas is not possible even when equipment is evacuated with state-of-the-art equipment, some emissions also occur during decommissioning, but remain below 2 % of the name plate capacity18 if the operation is carried out by appropriately qualified staff with the correct equipment.
16 Manufacturers assign a probability of one in 20,000 operating years (per unit) to failures/arc faults leading to the emission of SF6. This probability is included in the design related leakage rate. See Mersiowsky, 2003). 17 A comparison of the environmental effects of re-use/recycling and incineration respectively has not yet been carried out, but re-use/recycling is in general considered the more sustainable approach. (Personal communication with members of CAPIEL WG Environment, 23.02.2005) 18 Expert estimate 2004 / Calculation.
15
The parties who are in control of emissions change throughout the life-cycle. Manufacturers are in control of emissions during the production process and usually also during the first filling on site in the commissioning of closed pressure systems as well as of the design-related leakage rate of equipment during operation. Users, being transmission- and/or distribution-system operators in most cases, but also industrial production sites operating MV switchgear19, are in control of emissions related to topping up, maintenance including gas-handling and, repair or replacement in case of higher leakage rates through equipment faults. Maintenance by transmission and distribution operators is increasingly being sub-contracted to specialist companies. Gas recovery in decommissioning is carried out by the users, manufacturers20 or sometimes also by specialized disposal companies. In the case of closed pressure equipment, evacuation through the user is more common, as the equipment cannot be shipped at operating pressure. Sealed pressure equipment is often shipped back to the manufacturer, who then carries out gas recovery. While less than twenty companies are active in manufacturing of SF6-electrical equipment, 34 transmission system operators and 2817 distribution companies exist in the EU-25+3 (EURELECTRIC 2004). The number of industrial production sites operating medium-voltage equipment is difficult to estimate. At present less than ten specialized disposal companies exist.21
19 This is assumed to be the case for about 50% of sealed pressure equipment in the EU 25+3 (Expert Estimation 2004). 20 Manufacturers have committed themselves to take back the equipment for decommissioning. Often this is part of the agreed commercial conditions between manufacturer and user. (See also www.capiel-electric.com) 21 CAPIEL approached single disposal companies regarding their need of training and equipment. (Personal communication with members of CAPIEL WG environment, 18.11.2004)
16
3 Emission Reduction Potentials
3 .1 Introduct ion
This section analyzes the accessed and remaining reduction potentials in the life-cycle of SF6 electrical equipment as well as their respective costs. This facilitates an overview of the reductions already achieved and the costs involved. As a first step, the status of reported SF6-data on EU-25+3 level is discussed and the approach of the expert estimation on SF6 banks and emissions made for this study is presented together with the results. In the following the cost assessment method is described and single reduction measures are described in a qualitative and quantitative way. Finally reduction potentials and costs are presented and discussed.
3.2 Ex ist ing Emiss ion Est imates for SF 6 E lectr ica l Equipment
Because of the structure of the industries manufacturing and applying SF6 electrical equipment, it has proved to be difficult to obtain accurate emission estimates for the whole of Europe or even individual European countries. This problem, however, also applies to most other sectors in which major banks of fluorinated gases exist - be it refrigeration, air conditioning or insulation foams. In any case, respective emission estimates are commonly based on information on the amounts of a substance which has accumulated in relevant products over years, and respective emission rates for the different phases of the life cycle e.g. manufacturing, erection, use, service, maintenance and disposal – if necessary and possible for different vintages of equipment. Currently the Intergovernmental Panel on Climate Change (IPCC) is in the process of refining its inventory methods from which countries can choose when calculating their annual national emission inventories including SF6 from electrical equipment. The forthcoming “2006 IPCC Inventory Guidelines” will combine, correct and improve guidance given in previous guidance documents of the IPCC i.e. the “1996 Revised IPCC Inventory Guidelines” (IPCC, 1997) and the “2000 IPCC Good Practice Guidance”(IPCC, 2001). A recent overview prepared by the Secretariat of the United Nations Framework Convention on Climate Change (UNFCCC) indicates that most countries have found it difficult to apply the most challenging and accurate inventory methods to determine SF6 emissions from electrical equipment. Therefore, SF6 emission data even in the most recent Greenhouse Gas Emissions Inventory of the EU (EEA, 2004) needs to be used with caution. From the very beginning in the late 1990’s, EU estimates of emissions from SF6 equipment have relied heavily on activity data and emission rates provided by industry. In order to make use of a higher quality data base for this study, the electricity industry has set up a data set including bank and emission development of switchgear equipment in the EU-25+3, applying market data and expert knowledge about the various manufacturing processes and the technical performance of the products. The
17
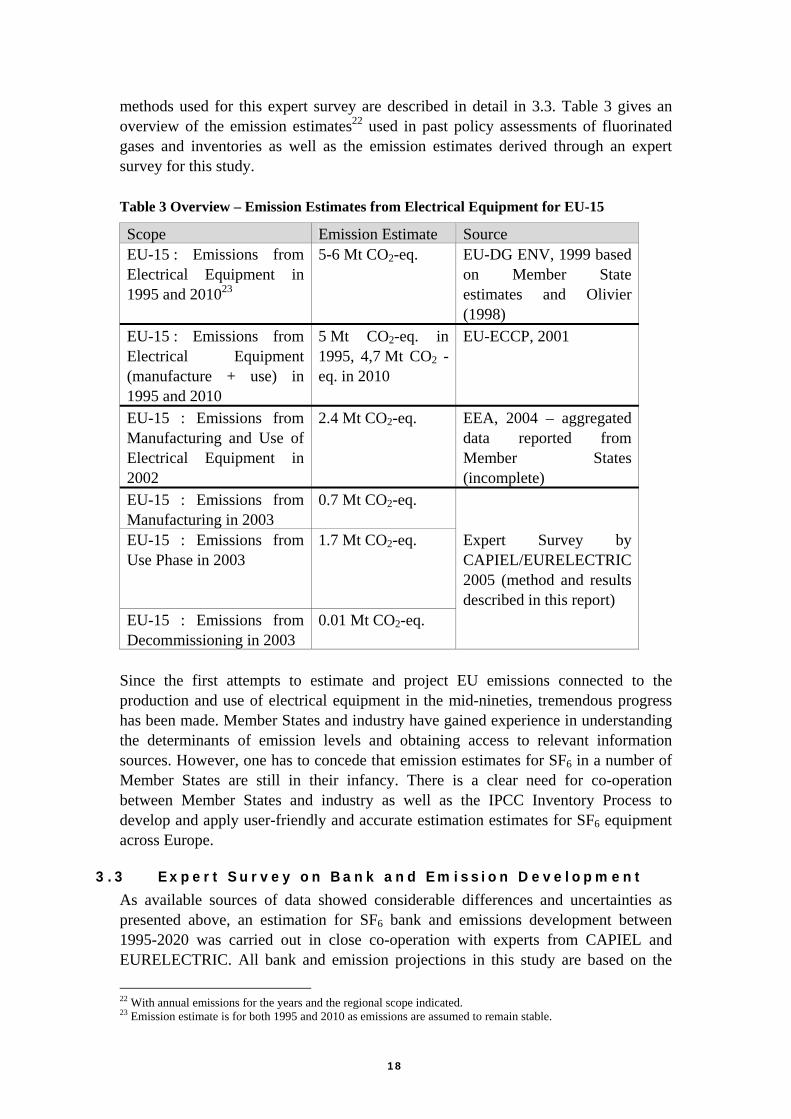
methods used for this expert survey are described in detail in 3.3. Table 3 gives an overview of the emission estimates22 used in past policy assessments of fluorinated gases and inventories as well as the emission estimates derived through an expert survey for this study. Table 3 Overview – Emission Estimates from Electrical Equipment for EU-15
Scope Emission Estimate Source EU-15 : Emissions from Electrical Equipment in 1995 and 201023
5-6 Mt CO2-eq. EU-DG ENV, 1999 based on Member State estimates and Olivier (1998)
EU-15 : Emissions from Electrical Equipment (manufacture + use) in 1995 and 2010
5 Mt CO2-eq. in 1995, 4,7 Mt CO2 -eq. in 2010
EU-ECCP, 2001
EU-15 : Emissions from Manufacturing and Use of Electrical Equipment in 2002
2.4 Mt CO2-eq. EEA, 2004 – aggregated data reported from Member States (incomplete)
EU-15 : Emissions from Manufacturing in 2003
0.7 Mt CO2-eq.
EU-15 : Emissions from Use Phase in 2003
1.7 Mt CO2-eq. Expert Survey by CAPIEL/EURELECTRIC 2005 (method and results described in this report)
EU-15 : Emissions from Decommissioning in 2003
0.01 Mt CO2-eq.
Since the first attempts to estimate and project EU emissions connected to the production and use of electrical equipment in the mid-nineties, tremendous progress has been made. Member States and industry have gained experience in understanding the determinants of emission levels and obtaining access to relevant information sources. However, one has to concede that emission estimates for SF6 in a number of Member States are still in their infancy. There is a clear need for co-operation between Member States and industry as well as the IPCC Inventory Process to develop and apply user-friendly and accurate estimation estimates for SF6 equipment across Europe.
3.3 Expert Survey on Bank and Emiss ion Deve lopment
As available sources of data showed considerable differences and uncertainties as presented above, an estimation for SF6 bank and emissions development between 1995-2020 was carried out in close co-operation with experts from CAPIEL and EURELECTRIC. All bank and emission projections in this study are based on the
22 With annual emissions for the years and the regional scope indicated. 23 Emission estimate is for both 1995 and 2010 as emissions are assumed to remain stable.
18
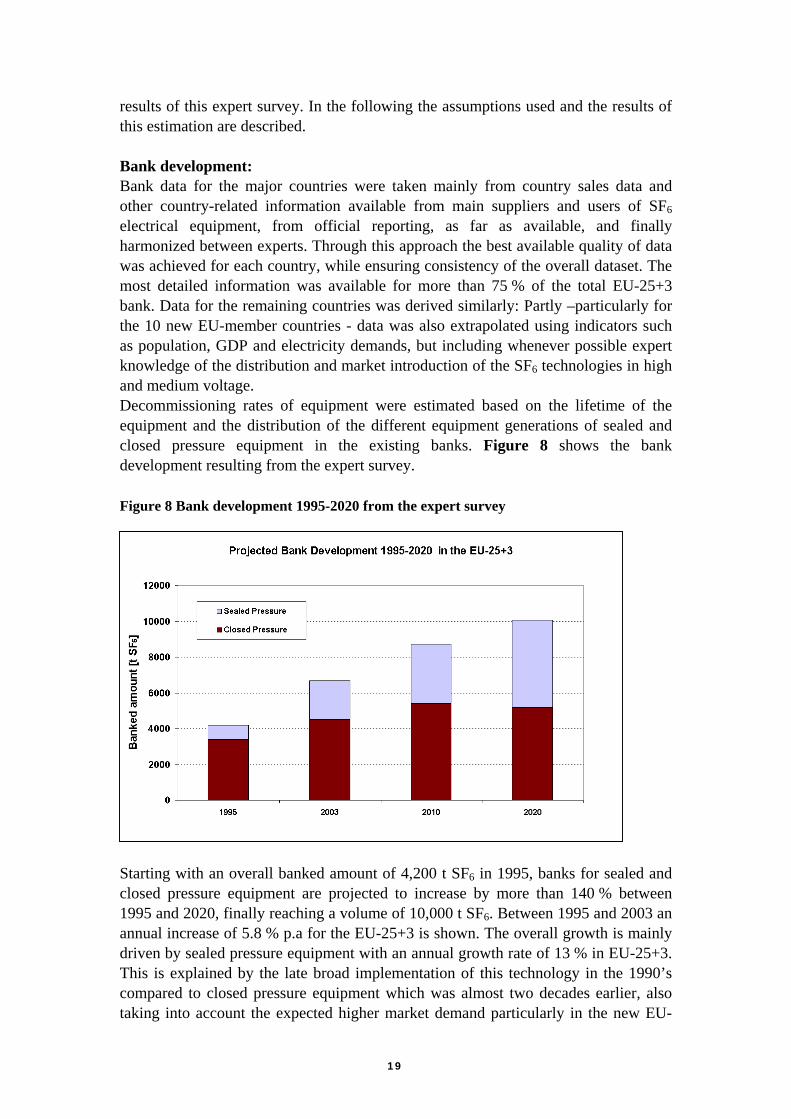
results of this expert survey. In the following the assumptions used and the results of this estimation are described. Bank development: Bank data for the major countries were taken mainly from country sales data and other country-related information available from main suppliers and users of SF6 electrical equipment, from official reporting, as far as available, and finally harmonized between experts. Through this approach the best available quality of data was achieved for each country, while ensuring consistency of the overall dataset. The most detailed information was available for more than 75 % of the total EU-25+3 bank. Data for the remaining countries was derived similarly: Partly –particularly for the 10 new EU-member countries - data was also extrapolated using indicators such as population, GDP and electricity demands, but including whenever possible expert knowledge of the distribution and market introduction of the SF6 technologies in high and medium voltage. Decommissioning rates of equipment were estimated based on the lifetime of the equipment and the distribution of the different equipment generations of sealed and closed pressure equipment in the existing banks. Figure 8 shows the bank development resulting from the expert survey. Figure 8 Bank development 1995-2020 from the expert survey
Starting with an overall banked amount of 4,200 t SF6 in 1995, banks for sealed and closed pressure equipment are projected to increase by more than 140 % between 1995 and 2020, finally reaching a volume of 10,000 t SF6. Between 1995 and 2003 an annual increase of 5.8 % p.a for the EU-25+3 is shown. The overall growth is mainly driven by sealed pressure equipment with an annual growth rate of 13 % in EU-25+3. This is explained by the late broad implementation of this technology in the 1990’s compared to closed pressure equipment which was almost two decades earlier, also taking into account the expected higher market demand particularly in the new EU-
19
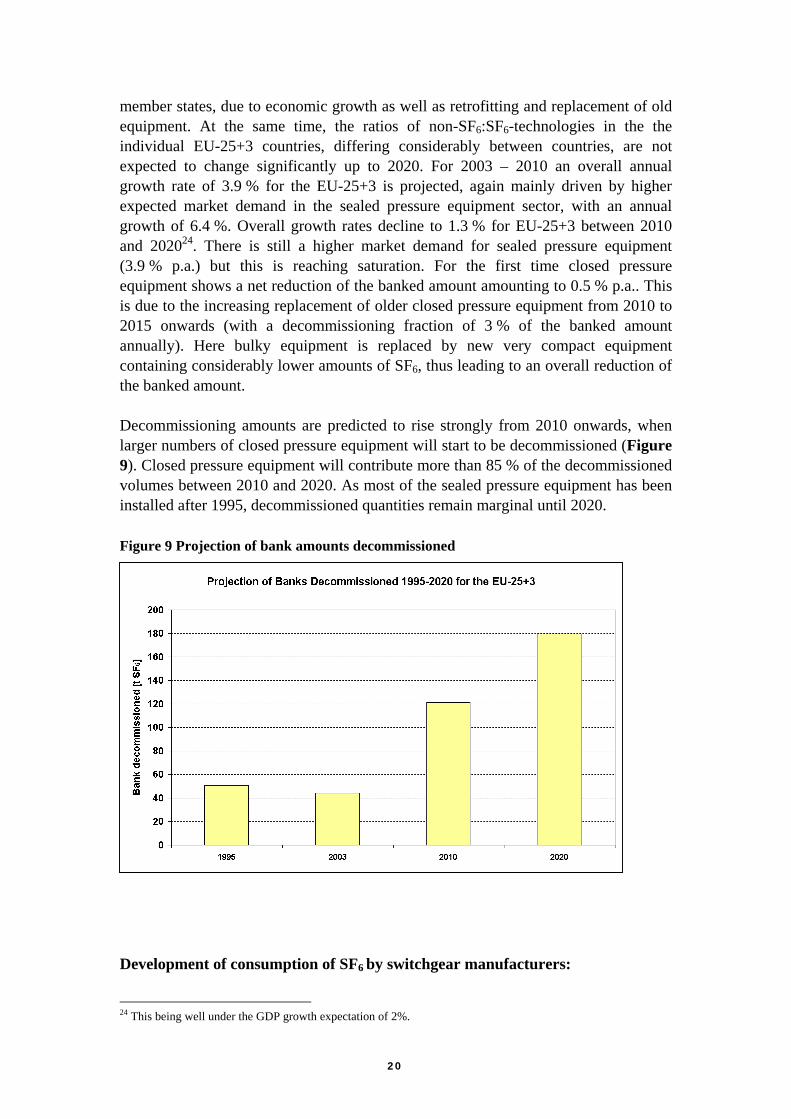
member states, due to economic growth as well as retrofitting and replacement of old equipment. At the same time, the ratios of non-SF6:SF6-technologies in the the individual EU-25+3 countries, differing considerably between countries, are not expected to change significantly up to 2020. For 2003 – 2010 an overall annual growth rate of 3.9 % for the EU-25+3 is projected, again mainly driven by higher expected market demand in the sealed pressure equipment sector, with an annual growth of 6.4 %. Overall growth rates decline to 1.3 % for EU-25+3 between 2010 and 202024. There is still a higher market demand for sealed pressure equipment (3.9 % p.a.) but this is reaching saturation. For the first time closed pressure equipment shows a net reduction of the banked amount amounting to 0.5 % p.a.. This is due to the increasing replacement of older closed pressure equipment from 2010 to 2015 onwards (with a decommissioning fraction of 3 % of the banked amount annually). Here bulky equipment is replaced by new very compact equipment containing considerably lower amounts of SF6, thus leading to an overall reduction of the banked amount. Decommissioning amounts are predicted to rise strongly from 2010 onwards, when larger numbers of closed pressure equipment will start to be decommissioned (Figure 9). Closed pressure equipment will contribute more than 85 % of the decommissioned volumes between 2010 and 2020. As most of the sealed pressure equipment has been installed after 1995, decommissioned quantities remain marginal until 2020. Figure 9 Projection of bank amounts decommissioned
Development of consumption of SF6 by switchgear manufacturers:
24 This being well under the GDP growth expectation of 2%.
20
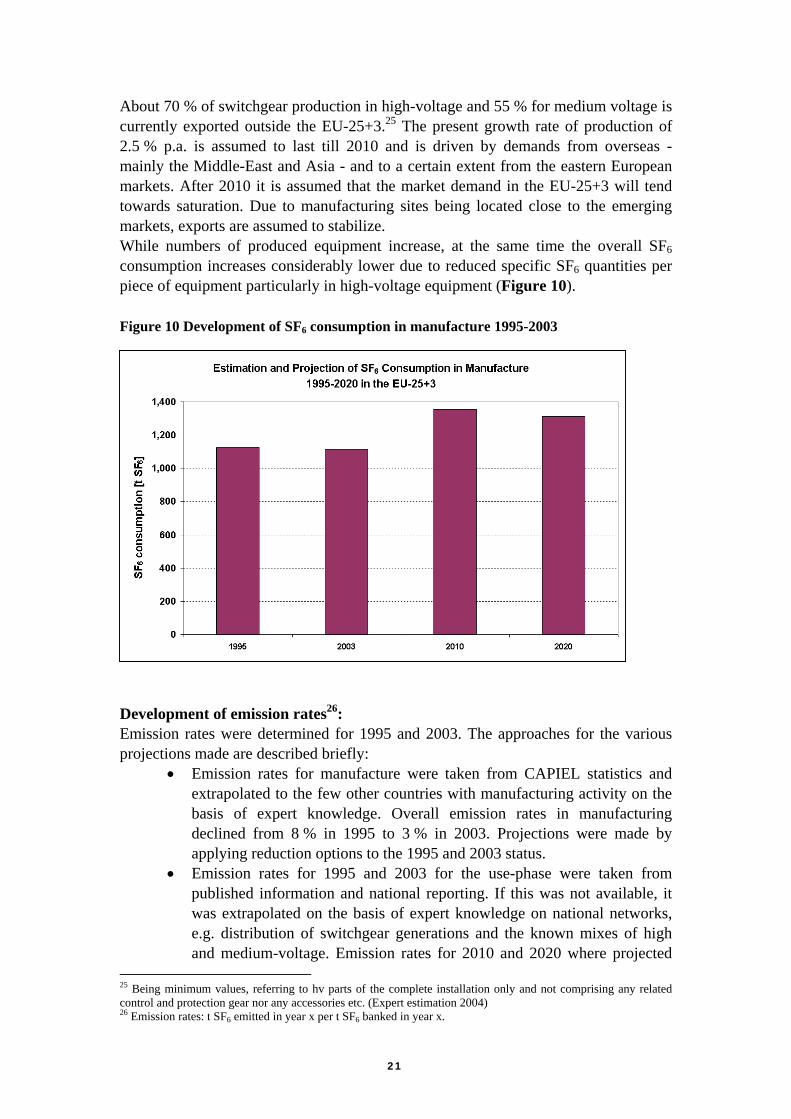
About 70 % of switchgear production in high-voltage and 55 % for medium voltage is currently exported outside the EU-25+3.25 The present growth rate of production of 2.5 % p.a. is assumed to last till 2010 and is driven by demands from overseas -mainly the Middle-East and Asia - and to a certain extent from the eastern European markets. After 2010 it is assumed that the market demand in the EU-25+3 will tend towards saturation. Due to manufacturing sites being located close to the emerging markets, exports are assumed to stabilize. While numbers of produced equipment increase, at the same time the overall SF6 consumption increases considerably lower due to reduced specific SF6 quantities per piece of equipment particularly in high-voltage equipment (Figure 10). Figure 10 Development of SF6 consumption in manufacture 1995-2003
Development of emission rates26: Emission rates were determined for 1995 and 2003. The approaches for the various projections made are described briefly:
• Emission rates for manufacture were taken from CAPIEL statistics and extrapolated to the few other countries with manufacturing activity on the basis of expert knowledge. Overall emission rates in manufacturing declined from 8 % in 1995 to 3 % in 2003. Projections were made by applying reduction options to the 1995 and 2003 status.
• Emission rates for 1995 and 2003 for the use-phase were taken from published information and national reporting. If this was not available, it was extrapolated on the basis of expert knowledge on national networks, e.g. distribution of switchgear generations and the known mixes of high and medium-voltage. Emission rates for 2010 and 2020 where projected
25 Being minimum values, referring to hv parts of the complete installation only and not comprising any related control and protection gear nor any accessories etc. (Expert estimation 2004) 26 Emission rates: t SF6 emitted in year x per t SF6 banked in year x.
21
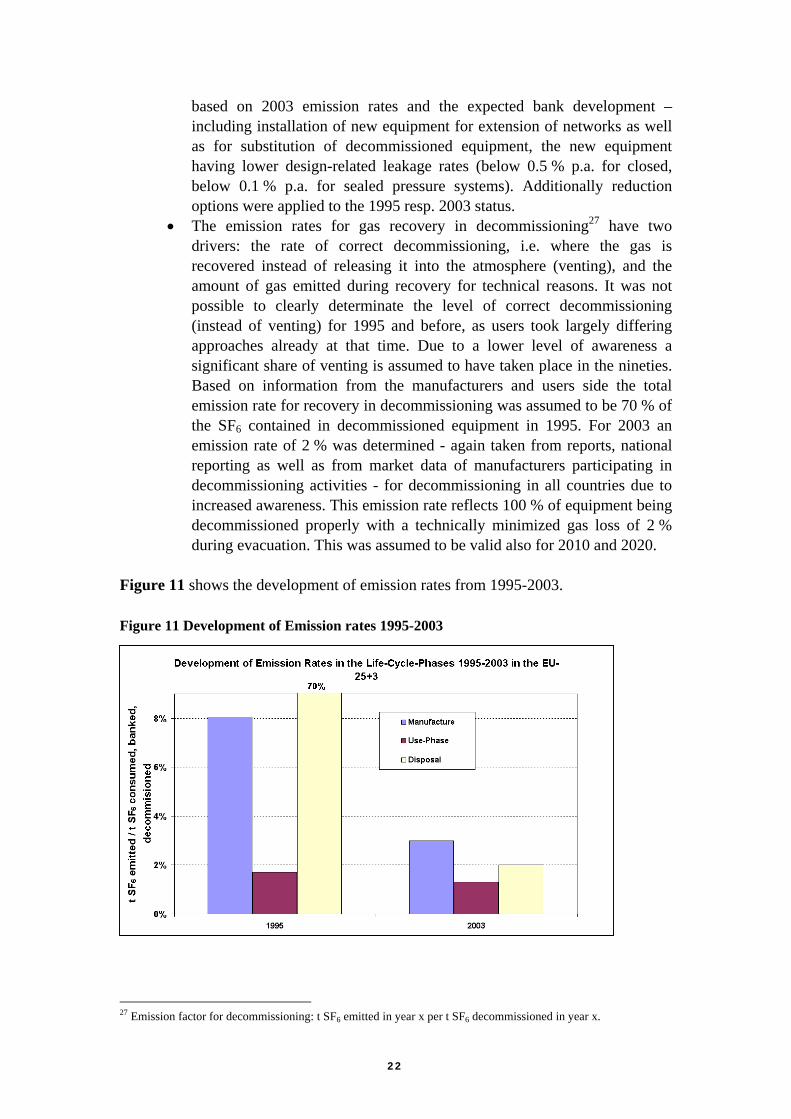
based on 2003 emission rates and the expected bank development – including installation of new equipment for extension of networks as well as for substitution of decommissioned equipment, the new equipment having lower design-related leakage rates (below 0.5 % p.a. for closed, below 0.1 % p.a. for sealed pressure systems). Additionally reduction options were applied to the 1995 resp. 2003 status.
• The emission rates for gas recovery in decommissioning27 have two drivers: the rate of correct decommissioning, i.e. where the gas is recovered instead of releasing it into the atmosphere (venting), and the amount of gas emitted during recovery for technical reasons. It was not possible to clearly determinate the level of correct decommissioning (instead of venting) for 1995 and before, as users took largely differing approaches already at that time. Due to a lower level of awareness a significant share of venting is assumed to have taken place in the nineties. Based on information from the manufacturers and users side the total emission rate for recovery in decommissioning was assumed to be 70 % of the SF6 contained in decommissioned equipment in 1995. For 2003 an emission rate of 2 % was determined - again taken from reports, national reporting as well as from market data of manufacturers participating in decommissioning activities - for decommissioning in all countries due to increased awareness. This emission rate reflects 100 % of equipment being decommissioned properly with a technically minimized gas loss of 2 % during evacuation. This was assumed to be valid also for 2010 and 2020.
Figure 11 shows the development of emission rates from 1995-2003. Figure 11 Development of Emission rates 1995-2003
27 Emission factor for decommissioning: t SF6 emitted in year x per t SF6 decommissioned in year x.
22
3.4 Approach for Cost ing and Emiss ion Determinat ion
All cost figures are based on current (2004) market prices. In case of capital goods, both interest and depreciation are taken into account. An interest rate of 4 % was applied. This value being lower than typical industrial interest rates was chosen in order to represent the costs as costs for the economy. Depreciation times were chosen according to the provisions the International Accounting Standards. Transaction costs (e.g. the cost of decision preparation and decision making) and external costs28 are not taken into account. The investment and operational costs considered were derived through interviews with experts from the manufacturers and users side as well as from companies involved in decommissioning of equipment. These costs are given in detail with the description of measures under 3.5.2. For the equipment an average value of 3,000 €/kg SF6 contained was assumed29. For working time, an average yearly wage of € 55,250 was used, which was calculated on the basis of EUROSTAT data and the distribution of activities over the countries. Costs are presented as annual costs for the specific years 2003, 2010 and 2020 and are calculated as follows: Cann = (α * (I + OM – S)) in which: I = investment costs required to implement the technology α = annuity factor dependent on interest rate r and depreciation time L; α = r / [ 1 - (1 + r )-L ] OM = annual operation and maintenance cost S = annual savings (e.g. saved SF6 purchase cost) Greenhouse gas emissions are calculated as global warming potential for the 100 year timeframe, being 23,900 t CO2-equivalent / t SF6 in accordance with the GWP-values of IPCC (1996) as prescribed for national reporting under the Kyoto Protocol.30 Emissions reductions are reported for the specific years under consideration – 2003, 2010 and 2020.
3.5 Se lected Reduct ion Measures and Costs
After the attention turned towards SF6 as a greenhouse gas after the UNFCCC was agreed in 1992, the approach towards the use of the gas changed. As it was and is a marginal cost factor in the production process (10 to15 €/kg31), as well as non-toxic and non-flammable, containment efforts were mainly restricted to the technical necessities. From the mid-nineties manufacturers and users became active regarding emission reduction and control. Efforts to find alternative fluids for SF6, showing the same functionality, but less overall environmental impact were not successful – which 28 An external cost is a cost (positive or negative) not included in the market price of the goods and services being produced, i.e. a cost not borne by those who create it. 29 This is assumed to be the minimum value (Expert estimation 2004). 30 This value is used – instead of the recalculated value of 22.200 - in order to ensure comparability with existing figures from national reporting. 31 Expert estimation 2004.
23
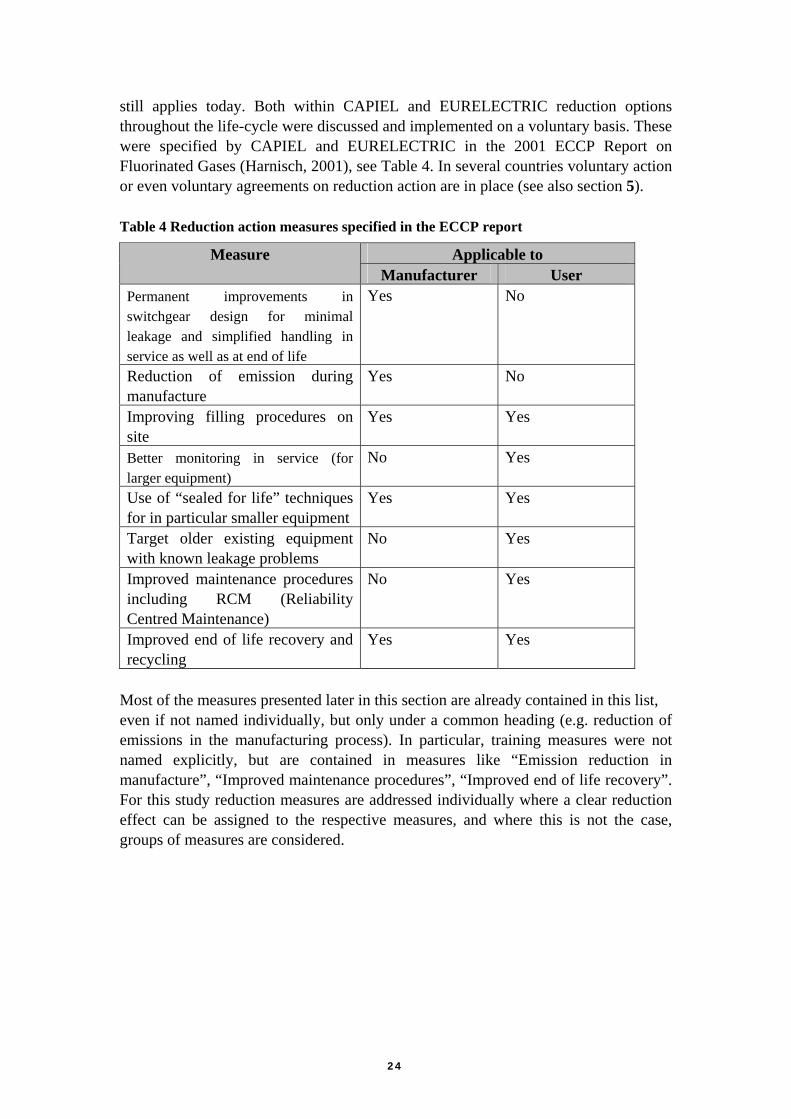
still applies today. Both within CAPIEL and EURELECTRIC reduction options throughout the life-cycle were discussed and implemented on a voluntary basis. These were specified by CAPIEL and EURELECTRIC in the 2001 ECCP Report on Fluorinated Gases (Harnisch, 2001), see Table 4. In several countries voluntary action or even voluntary agreements on reduction action are in place (see also section 5). Table 4 Reduction action measures specified in the ECCP report
Applicable to Measure Manufacturer User
Permanent improvements in switchgear design for minimal leakage and simplified handling in service as well as at end of life
Yes No
Reduction of emission during manufacture
Yes No
Improving filling procedures on site
Yes Yes
Better monitoring in service (for larger equipment)
No Yes
Use of “sealed for life” techniques for in particular smaller equipment
Yes Yes
Target older existing equipment with known leakage problems
No Yes
Improved maintenance procedures including RCM (Reliability Centred Maintenance)
No Yes
Improved end of life recovery and recycling
Yes Yes
Most of the measures presented later in this section are already contained in this list, even if not named individually, but only under a common heading (e.g. reduction of emissions in the manufacturing process). In particular, training measures were not named explicitly, but are contained in measures like “Emission reduction in manufacture”, “Improved maintenance procedures”, “Improved end of life recovery”. For this study reduction measures are addressed individually where a clear reduction effect can be assigned to the respective measures, and where this is not the case, groups of measures are considered.
24
3.5 .1 Reduct ion Measures over the L i fe-Cyc le
The following section describes reduction measures throughout the life-cycle including some information on the current level of implementation: a) Manufacturing In the past, it was common to use individual gas bottles for each work place in the production and also to shuttle bottles back and forth through the production site. This made monitoring of gas and assigning responsibilities for gas consumption difficult. A central supply system at the manufacturing site with a single gas tank and a pipe-system to the single working stations helps to reduce emissions significantly and allows for a good monitoring through flow meters at the workstations. Most larger manufacturers have installed such central supply systems in the last three years or are currently installing them. Gas bottles are usually equipped with self-closing valves. But when tubes are used for filling, a certain amount of gas remains in the tube and is released after the tube is disconnected from the filled application. These emissions are avoided through also equipping the tubes with self-closing couplings/valves or through process changes, such as evacuation of the tube after the filling process and recovery of the SF6 from the resulting gas/air-mix. Such measures for improved filling procedures have already taken place at the larger manufacturing sites. Leakage detection, i.e. tightness tests, can be carried out with Helium (in certain cases also with compressed air) instead of SF6. This avoids emissions during manufacture as gas handling is not necessary in the first place and during the use-phase, as Helium, with smaller molecules, also permits the detection of smaller leaks. Such systems are installed at most of the larger manufacturing sites. b) Use-phase Amounts of SF6 per piece of equipment of closed pressure equipment have significantly decreased over time – by up to 80 %. Sealed pressure equipment had a more compact design from the start, allowing only a reduction of around 10 % until today. In the future applications with a specific function are unlikely to become considerably more compact as a technical optimum has almost been reached. While remaining as compact as it is, equipment gains functionality, e.g. higher electrical ratings allow the use of smaller switchgear design. Reduced amounts of SF6 per piece of equipment of course affects bank growth when new equipment is installed, with lower banked gas amounts meaning also lower absolute emissions. Leakage of closed pressure equipment is monitored with temperature adjusted pressure meters. As the pressure level falls below the operating pressure, an alarm is sounded. Usually two alarm levels are used with typical values being 5 % and 10 %
25
below the operating pressure. Leakage above the design related leakage rate can thus be determined at an early stage allowing for timely action regarding repair or replacement. Today all closed pressure equipment is equipped with pressure meters, most older units have been re-equipped. Both online transmission of data and regular in-person checking of the pressure meters are common. Reaction times regarding repair or replacement of equipment still differ among users and among countries. A decrease of the design-related leakage rates has taken place over time and is still taking place, both for sealed and closed pressure equipment. Of course, as rates for new equipment are already below 0.5 % p.a. for closed and 0.1 % p.a. for sealed pressure equipment presently, future reductions of design related leakage rates will not yield significant additional reductions compared to today’s standard. But as existing banks include older equipment with significantly higher design-related leakage rates, installation of newer equipment will lead to a slow reduction of the specific leakage rate for the total EU-25+3 bank. Although maintenance for closed pressure systems installed during the last 10 years is required only after 25 years, operators have habitually carried out maintenance more frequently, to ensure reliability of the systems and for training purposes to keep their staff familiar with the equipment. Even with high awareness and good training, opening the systems as part of maintenance will always lead to emissions. Therefore reducing the frequency of maintenance for closed pressure equipment to the required minimum is also considered as an emission reduction option. In recent years a strong tendency can be seen towards decreasing the fixed maintenance frequencies or carrying out maintenance only if gas quality checks indicate the necessity (reliability centred/condition based maintenance). c) End-of-life: Recovery of gas in decommissioning of equipment: Creating a cost-efficient and reliable decommissioning structure is the most important option. When larger numbers of closed pressure equipment are expected to be taken out of operation after 2010 with increasing numbers of sealed pressure equipment following after 2020, a decommissioning infrastructure with clear competences and logistics, sufficient numbers of trained staff and up-to-date equipment has to be in place.32 In setting up the infrastructure, external issues, like the legal requirements for the transport of waste over national borders, also have to be taken into consideration. Manufacturers as well as gas producers have already developed an approach for the re-use of recovered gas from maintenance and decommissioning, which is used by a number of users (Solvay, 2004). CAPIEL and EURELECTRIC have recently set up a working group dealing with the future decommissioning infrastructure.
32 See also requirements in (CIGRE 2005).
26
d) Measures applying to all life-cycle phases: Training is a significant option for all phases of the life-cycle, as it ensures that staff are able to properly carry out all provisions for emission prevention and reduction. This includes not only the proper handling of the equipment but also the awareness that SF6 is a greenhouse gas and emissions have to be kept to a minimum. The International Council on Large Electric Systems (CIGRE) recently developed a guide for the preparation of customised SF6 handling instructions (CIGRE 2005). Both at manufacturers as well as at users “awareness raising” training has been carried out, staff involved in gas-handling are trained specifically for the gas handling tasks they have to perform and the equipment they have to handle. Monitoring of handled, installed or consumed gas amounts does not lead to emission reductions directly, but allows for identification of reduction potential and control of the effects of implemented reduction measures. It also raises awareness, as responsibility for emission development can then be assigned (e.g. to staff at single working stations in manufacturing). This is an option for all life-cycle-phases, which can be more or less promising depending on its scope and detail of implementation. Amounts of gas handled and consumed during production as well as amounts installed and handled are currently reported to the national authorities by manufacturers and users. Here no common provisions regarding the details of determination of the data exist. CAPIEL and EURELECTRIC have started to cooperate on a common inventory system to cover the above named areas. Labelling of equipment, i.e. among others the indication on the equipment that SF6 is contained as well as the contained amount in kg, does also not lead to emission reductions directly. Its main purpose is to create awareness in those handling the equipment and to identify the equipment for correct decommissioning. Labelling is practiced by all manufacturers throughout the EU-25+3. Moreover most new products currently show a separate label indicating that SF6 must not be released into the atmosphere. Minimization of emissions during evacuation of equipment can be achieved by evacuating the equipment to lower pressures. In the past, 50 mbar absolute pressure or higher was common, today below 20 mbar33 absolute pressure is standard both for sealed and closed pressure equipment, thus securing handling losses during evacuation are limited to 2 % maximum. At all larger manufacturing sites such equipment is already commonly used. Some users still employ the 50 mbar equipment, but at present a trend to upgrade the 50 mbar equipment can be seen. 33 Considering only the technical capability of the handling equipment, a residual pressure of 1 mbar can be achieved. But choice of the appropriate evacuation pressure, which is always below 20 mbar, depends on several factors to be considered in the practical case such as technical capability of the handling equipment including pipe connections, pressure limitations by the design of the gas containment, size of the individual gas compartment respectively its gas volume and cost effectiveness of the process to be applied.
27
Not all available measures were quantified regarding their potential and associated costs. Quantification was carried out only for measures fulfilling the following criteria:
• Reduction option is commercially available in the EU-25+3 in 2004 • Reduction effect can clearly be associated to the aim of emission reduction.
Product improvement or cost reducing measures which also yield an emission improvement are not assessed.
• The measures can be clearly described and the associated emission reduction can be quantified.
From the above named reduction measures the following were not quantified. These reduction measures were considered as mainly driven by optimization processes and cost reduction efforts, although, especially in the case of design related measures, a certain share of the reduction effect is also expected to stem from emission reduction efforts:
• Reduction of SF6 amount per single piece of equipment • Reduction of design-related leakage rates • Reliability centred maintenance.
These were included in a scenario depicting the business-as-usual development of SF6 emissions from sealed and closed pressure equipment, which is described in more detail in section 3.5.3.
3 . 5 . 2 Assessment o f Se lected Measures In the following, selected measures are described regarding their technical characteristics, reduction potential and costs. Apart from the available measures during the life-cycle, the use of alternative SF6-free technologies for sealed pressure systems are also considered. As addressed in section 2, fully SF6-free technologies for closed pressure systems are not available at present. Closed pressure systems with SF6 circuit-breakers and air insulation thus containing lower overall amounts of SF6 are available and also commonly used, but are far less compact, so that placing them inside or near to urban areas is often not possible. Again, depending on the regional circumstances, the ratio of air-insulated to SF6-insulated closed pressure equipment varies strongly throughout the EU-25+3 countries. Using only SF6-free technologies for insulation, would require high voltage equipment to be placed further outside of cities, where space is available. This would result in higher transmission losses, as described in section 2.4. Additional costs resulting from changed urban and sub-urban network layouts would be prohibitive. This option -also not being completely SF6-free- was therefore not considered further in this analysis. For easier presentations of reductions and costs in diagrams the measures are given a number, e.g. M1 (measure no. 1) for “Awareness”. As some measures apply to several life-cycle phases respectively the numbers are added a letter (“a” for manufacturing,
28
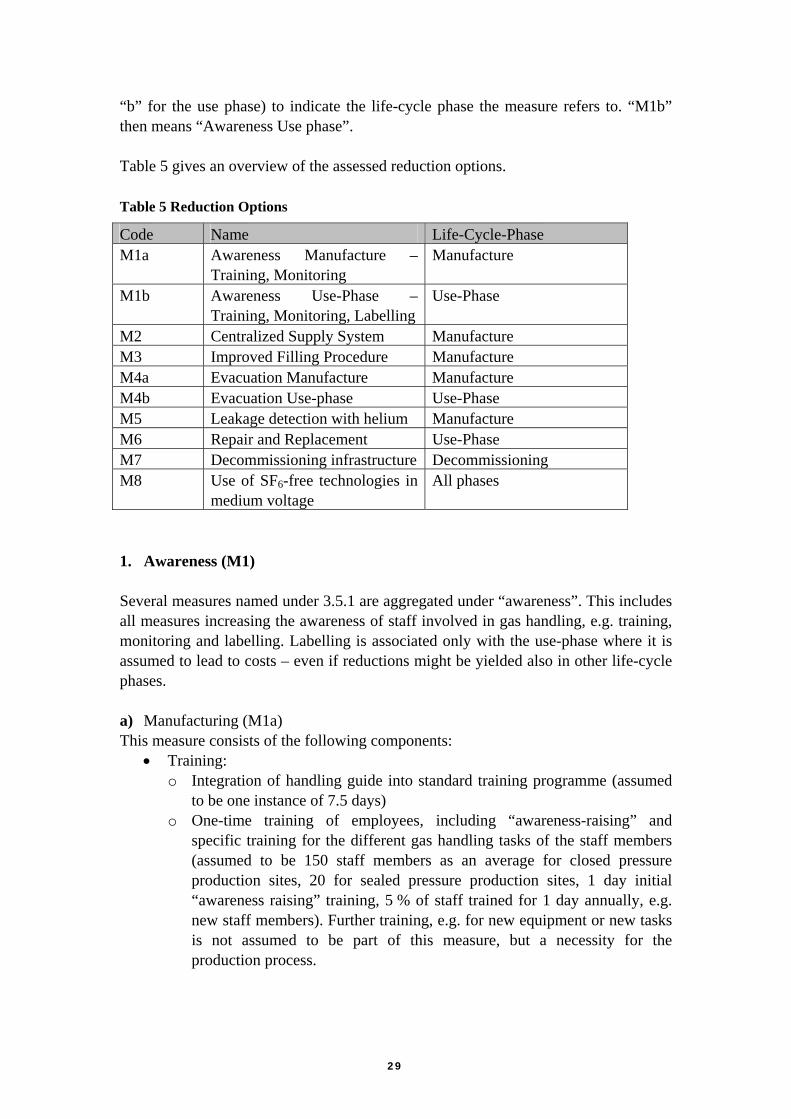
“b” for the use phase) to indicate the life-cycle phase the measure refers to. “M1b” then means “Awareness Use phase”. Table 5 gives an overview of the assessed reduction options. Table 5 Reduction Options
Code Name Life-Cycle-Phase M1a Awareness Manufacture –
Training, Monitoring Manufacture
M1b Awareness Use-Phase – Training, Monitoring, Labelling
Use-Phase
M2 Centralized Supply System Manufacture M3 Improved Filling Procedure Manufacture M4a Evacuation Manufacture Manufacture M4b Evacuation Use-phase Use-Phase M5 Leakage detection with helium Manufacture M6 Repair and Replacement Use-Phase M7 Decommissioning infrastructure Decommissioning M8 Use of SF6-free technologies in
medium voltage All phases
1. Awareness (M1) Several measures named under 3.5.1 are aggregated under “awareness”. This includes all measures increasing the awareness of staff involved in gas handling, e.g. training, monitoring and labelling. Labelling is associated only with the use-phase where it is assumed to lead to costs – even if reductions might be yielded also in other life-cycle phases. a) Manufacturing (M1a) This measure consists of the following components:
• Training: o Integration of handling guide into standard training programme (assumed
to be one instance of 7.5 days) o One-time training of employees, including “awareness-raising” and
specific training for the different gas handling tasks of the staff members (assumed to be 150 staff members as an average for closed pressure production sites, 20 for sealed pressure production sites, 1 day initial “awareness raising” training, 5 % of staff trained for 1 day annually, e.g. new staff members). Further training, e.g. for new equipment or new tasks is not assumed to be part of this measure, but a necessity for the production process.
29
• Monitoring: Various possibilities for internal monitoring exist. Here a very precise technical implementation is assumed, which allows the determination of gas amounts with high accuracy and for single production steps: a centralized SF6 supply system is combined with installation flow meters at the single workstations. Results are always cross-checked with the total amount of gas consumed which can be determined by an input-output calculation of gas acquired and returned to the gas supplier. Investment costs for the flow metering system are assumed to be 30,000 €, operational costs 5,000 € p.a. Regarding operational costs, a yearly effort of 2 days for data evaluation, internal reporting, etc. is assumed.
b) Use phase (M1b) This measure relates only to closed pressure equipment, as no gas handling is required during the use-phase of sealed pressure equipment and consists of the following components:
• Training It is assumed that the staff dealing with topping-up or maintenance including gas-handling of closed pressure equipment are trained one off for a day for the specific types of equipment to be handled. Training takes place when new types of electrical equipment are introduced. Only operational costs for training (13 employees per transmission system operator as average, 1day of initial training regarding awareness, 5 % of staff trained for 1 day annually, e.g. new staff members) and for the integration of the handling guide into the standard training programme (one off 5 days) occur as under M1a. Again further training, e.g. for new equipment or new tasks is not assumed to be part of this measure.
• Monitoring Due to the large number of applications spread over considerable areas, a mass-balance concept at the level of transmission operators seems most feasible. With this approach, an emission rate for the whole bank of the operator can be determined, instead of taking single pieces of equipment into consideration. For this approach SF6-bottles are weighed before and after topping-up or gas-handling during maintenance. This approach is already practiced by the majority of the utilities today. It is assumed that this does not require any investment but leads to additional working time of two days per 50 t closed pressure SF6 bank.
• Labelling: Marginal additional costs of 0.2 % of the sales price of equipment for labelling implementation are assumed to occur.
c) Decommissioning Training requirements for the future and monitoring of gas amounts recovered during decommissioning will depend greatly on the decommissioning infrastructure, which is still to be built up. It is thus not considered as a separate measure, but addressed as part of the measure of a decommissioning infrastructure (M7).
30
2. Centralized Supply System in manufacture (M2) Gas is stored centrally and distributed to the working-stations. Investment costs of 100,000 € per site, but also operational costs (for maintenance of pipes) of 15,000 € per site and year occur. 3. Improved filling procedures in manufacture (M3) The filling process is changed in order to prevent amounts of gas remaining in the filling tube from being released when the tube is disconnected. This can be achieved through several approaches having comparable investment costs (assumed investment costs per site: 60,000 €). 4. Evacuation to lower pressures (M4) This measure is of importance in all life-cycle phases, especially for closed pressure equipment. The evacuation pressure determines the amount of gas remaining in the equipment and subsequently being emitted. The equipment used is generally the same for all life-cycle phases. 50 mbar are assumed to be the 1995 baseline34, for this measure it is assumed that evacuation is to take place down to 20 mbar35 both in the case of sealed and closed pressure equipment. Costs have been assessed as follows: investment costs for upgrading of 50 mbar equipment to 1 mbar equipment or acquiring new equipment. Additional costs for power and working time for longer evacuation. Costs are specified for the individual life-cycle phases below. a) Manufacture (M4a) Existing 50 mbar piping equipment can be easily upgraded to 1 mbar capacity at an average cost of 10,000 € per tube. As 50 mbar equipment is assumed to be the baseline for 1995, i.e. all equipment will have to be upgraded and additional units have to be bought for the growing production. Resulting additional working time of 10 minutes per evacuation process for evacuation down to 20 mbar is assumed. b) Use phase (M4b) This applies only to closed pressure systems as no maintenance or topping-up during the lifetime is required for sealed pressure systems. For calculation of the amount of SF6 banks from closed pressure equipment to be maintained it is assumed that equipment installed between 1965-75 has a share of 15 % of the 1995 closed pressure equipment banks, equipment installed between 1976-85 of 25 % and between 1986-95 of 60 %. It is assumed that gas-relevant maintenance takes place 3 times within the lifetime of equipment installed in the first timeframe, 2 times for equipment installed in the second and one time for equipment installed in the third timeframe. Again all existing equipment is assumed to be upgraded to 1 mbar equipment. Additional operational costs for additional working
34 As in the mid-nineties both 200 mbar and 50 mbar equipment were common and a certain share of venting is also assumed to have taken place, 50 mbar was assumed as technological standard for the calculation of reduction potentials in order to prevent overestimation of emission reductions. 35 For calculation of the reduction potential evacuation down to 20 mbar is assumed, although under certain circumstances evacuation to values below 20mbar are feasible. This means that the existing reduction potential is slightly higher than the calculated one.
31
time are assumed (2.5 hrs/0.2 t SF6 closed pressure equipment bank under maintenance) to result from this measure. c) Decommissioning Piping equipment is considered to be part of the necessary investment cost for building up a decommissioning infrastructure. 5. Leakage detection with Helium (M5) This measure applies only to the manufacturing process. Using helium for leakage detection allows, besides avoiding process intrinsic SF6 emissions, to detect even smaller leaks than with SF6, as the helium molecules are smaller than SF6 molecules. This again permits to test for the very low leakage rate the equipment is designed for. The process takes place in a vacuum chamber in the case of integral leakage detection systems. Leaking equipment is taken back into the production process and welded or improved accordingly. This quality assurance method aims to secure a leakage rate of less than 0.1 % during the service life of sealed pressure systems. In the production of closed pressure equipment, where the applications are large and also less standardized, it is not possible to fully insert the equipment into a vacuum chamber. However, all pressurized components are subject to the leakage detection process. Considerable investment costs occur. Operational costs are assumed to differ only little from the previously used technology which in most cases is integral leakage detection with SF6, although there are also cases with integral leakage detection with helium substituted for manual leakage detection with SF6, which had higher operational costs due to longer testing times. Investment costs are assumed to be 500,000 € as an average per site with annual operational costs of about 50,000 €. 6. Repair and Replacement (M6) It is assumed that 3 % of closed pressure systems have leakage rates36 being 2.5 percentage points above their design-related leakage rates due to smaller leaks and that under the reference scenario (see 3.5.3) repair action would be taken only after one year. It is assumed that 90 % of the leaky equipment can be repaired, while 10 % have to be replaced, having only a lifetime of 30 years behind them. Repair of one unit is assumed to take one day. 7. Establishment of an efficient disposal infrastructure (M7) Several decommissioning processes and infrastructures for the end of life treatment of SF6 electrical equipment have been established because the decommissioning differs from product to product and manufacturer to manufacturer. As decommissioned amounts for closed pressure equipment will increase strongly after 2010 and for sealed pressure after 2020 respectively, disposal companies are expected to play a major role not only in metal recovery, but also in evacuation of gas in the future decommissioning infrastructure. Nevertheless the latter will also still be carried out by users or manufacturers.37 At present only a few disposal companies offering these services exist in the whole EU-25+3. 36 Not taking emissions from gas handling into account. 37 Personal communication with members of CAPIEL WG Environment on Feb 23 2005.
32
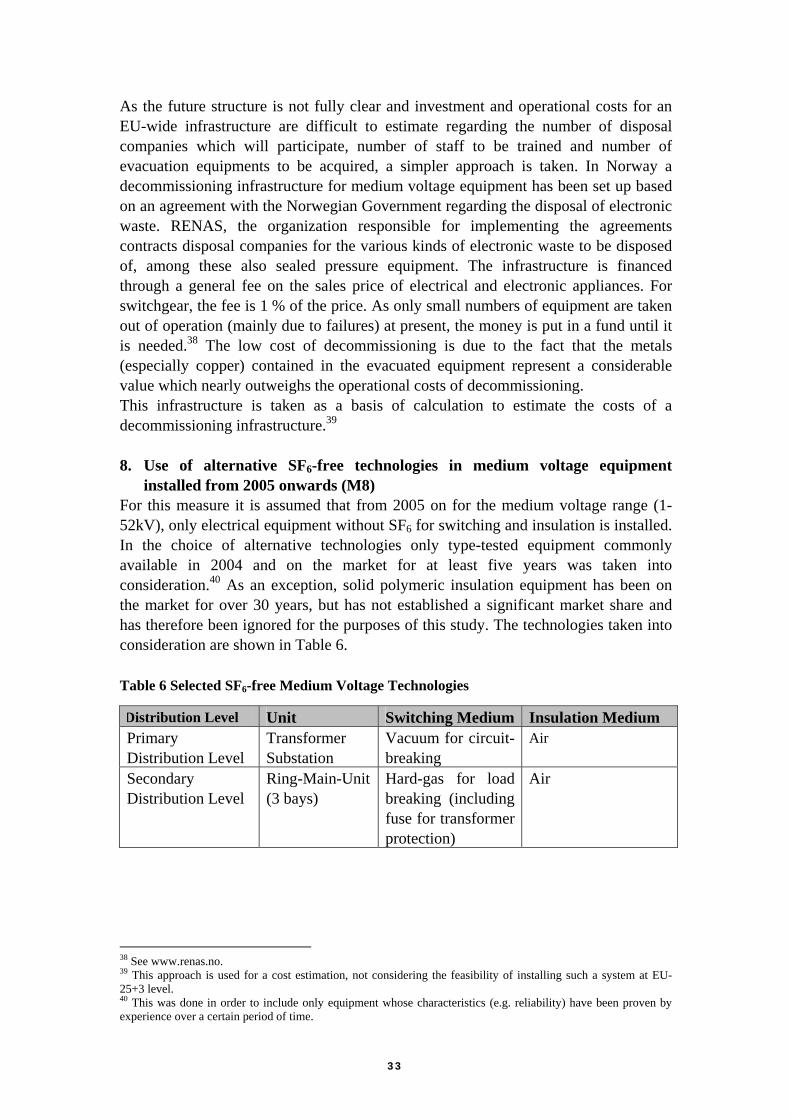
As the future structure is not fully clear and investment and operational costs for an EU-wide infrastructure are difficult to estimate regarding the number of disposal companies which will participate, number of staff to be trained and number of evacuation equipments to be acquired, a simpler approach is taken. In Norway a decommissioning infrastructure for medium voltage equipment has been set up based on an agreement with the Norwegian Government regarding the disposal of electronic waste. RENAS, the organization responsible for implementing the agreements contracts disposal companies for the various kinds of electronic waste to be disposed of, among these also sealed pressure equipment. The infrastructure is financed through a general fee on the sales price of electrical and electronic appliances. For switchgear, the fee is 1 % of the price. As only small numbers of equipment are taken out of operation (mainly due to failures) at present, the money is put in a fund until it is needed.38 The low cost of decommissioning is due to the fact that the metals (especially copper) contained in the evacuated equipment represent a considerable value which nearly outweighs the operational costs of decommissioning. This infrastructure is taken as a basis of calculation to estimate the costs of a decommissioning infrastructure.39 8. Use of alternative SF6-free technologies in medium voltage equipment
installed from 2005 onwards (M8) For this measure it is assumed that from 2005 on for the medium voltage range (1-52kV), only electrical equipment without SF6 for switching and insulation is installed. In the choice of alternative technologies only type-tested equipment commonly available in 2004 and on the market for at least five years was taken into consideration.40 As an exception, solid polymeric insulation equipment has been on the market for over 30 years, but has not established a significant market share and has therefore been ignored for the purposes of this study. The technologies taken into consideration are shown in Table 6. Table 6 Selected SF6-free Medium Voltage Technologies
Distribution Level Unit Switching Medium Insulation Medium Primary Distribution Level
Transformer Substation
Vacuum for circuit-breaking
Air
Secondary Distribution Level
Ring-Main-Unit (3 bays)
Hard-gas for load breaking (including fuse for transformer protection)
Air
38 See www.renas.no. 39 This approach is used for a cost estimation, not considering the feasibility of installing such a system at EU-25+3 level. 40 This was done in order to include only equipment whose characteristics (e.g. reliability) have been proven by experience over a certain period of time.
33
These technologies offer a comparable functionality to sealed pressure systems. Cost-related differences are encountered regarding size, maintenance frequency, time/effort for maintenance and lifetime. Cost categories considered The following cost categories were collected for sealed pressure systems as well as for SF6-free MV technologies:
• Investment costs (annualized over the lifetime) • Cost for surface area required: costs per m2 • Costs for construction of buildings: costs per m3 interior space • Commissioning costs: time/effort for commissioning • Maintenance costs: frequency and time/effort for maintenance, km driven by
maintenance staff, costs per km driven • Costs for operation of buildings: Heating costs and maintenance costs per m3
interior space, • Downtime costs: €/kWh downtime. A differentiated cost approach for industry
and transmission/distribution companies is taken. Downtimes are calculated as regular downtimes for maintenance plus unexpected downtimes in case of failures.
The following effects are assumed to take place:
• Effect on emissions: As around 55 % of Category A production within the EU-25+3 is intended for export outside the EU-25+3 it is assumed that production will be relocated towards growing or new markets (such as Asia) in a short time. After 2008, 100 % of production is assumed to be located outside of the EU-25+3. Emissions from manufacture decrease accordingly. Emissions through design-related leakage from the bank installed before 2005 are not affected and decrease only very marginally over time as small numbers of older equipment (less than 1 % of the bank per year) are taken out of operation and replaced by new equipment with lower design-related leakage rates. Emissions from decommissioning are not altered through this measure between 2005-2020 as only equipment installed in the 1980s reaches its end of life in this timeframe. Numbers of decommissioned sealed pressure applications are only expected to rise strongly after 2020, which exceeds the timeframe of this study. It has to be taken into consideration that only around 50 % of the estimated emission reduction in this measure stems from the use of SF6-free technologies instead of sealed pressure equipment. The remainder stems from the assumed relocation of sealed pressure equipment manufacturing plants outside the EU-25+3 borders. This means that these emissions still occur, but simply outside of the considered region.
• With the relocation of the manufacturing industry for sealed pressure equipment, around 15,000 jobs will be lost in the EU-25+3. The relocation is assumed to lead to additional costs of roughly 2 billion €. This amount was not included into the calculation of reduction costs.
• Globally active companies often have the same environmental standards for all their sites, irrespective of national legislation. Even so, it cannot be ensured
34
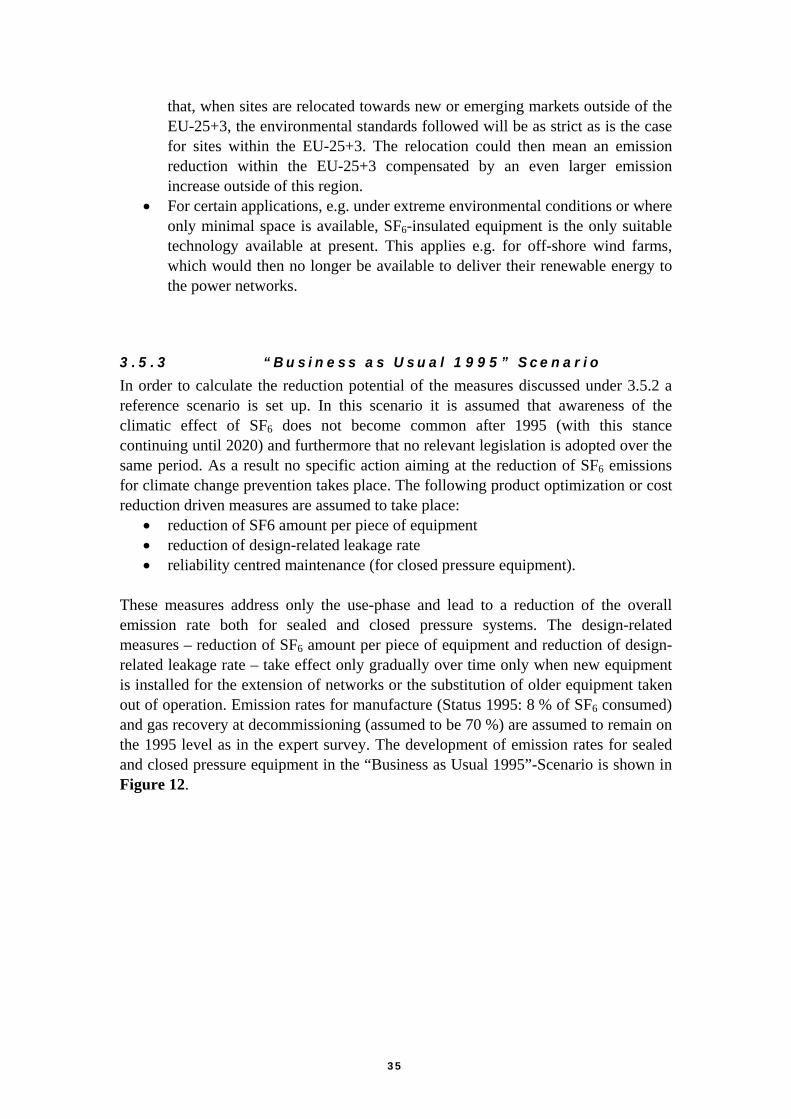
that, when sites are relocated towards new or emerging markets outside of the EU-25+3, the environmental standards followed will be as strict as is the case for sites within the EU-25+3. The relocation could then mean an emission reduction within the EU-25+3 compensated by an even larger emission increase outside of this region.
• For certain applications, e.g. under extreme environmental conditions or where only minimal space is available, SF6-insulated equipment is the only suitable technology available at present. This applies e.g. for off-shore wind farms, which would then no longer be available to deliver their renewable energy to the power networks.
3.5 .3 “Bus iness as Usual 1995” Scenar io
In order to calculate the reduction potential of the measures discussed under 3.5.2 a reference scenario is set up. In this scenario it is assumed that awareness of the climatic effect of SF6 does not become common after 1995 (with this stance continuing until 2020) and furthermore that no relevant legislation is adopted over the same period. As a result no specific action aiming at the reduction of SF6 emissions for climate change prevention takes place. The following product optimization or cost reduction driven measures are assumed to take place:
• reduction of SF6 amount per piece of equipment • reduction of design-related leakage rate • reliability centred maintenance (for closed pressure equipment).
These measures address only the use-phase and lead to a reduction of the overall emission rate both for sealed and closed pressure systems. The design-related measures – reduction of SF6 amount per piece of equipment and reduction of design-related leakage rate – take effect only gradually over time only when new equipment is installed for the extension of networks or the substitution of older equipment taken out of operation. Emission rates for manufacture (Status 1995: 8 % of SF6 consumed) and gas recovery at decommissioning (assumed to be 70 %) are assumed to remain on the 1995 level as in the expert survey. The development of emission rates for sealed and closed pressure equipment in the “Business as Usual 1995”-Scenario is shown in Figure 12.
35
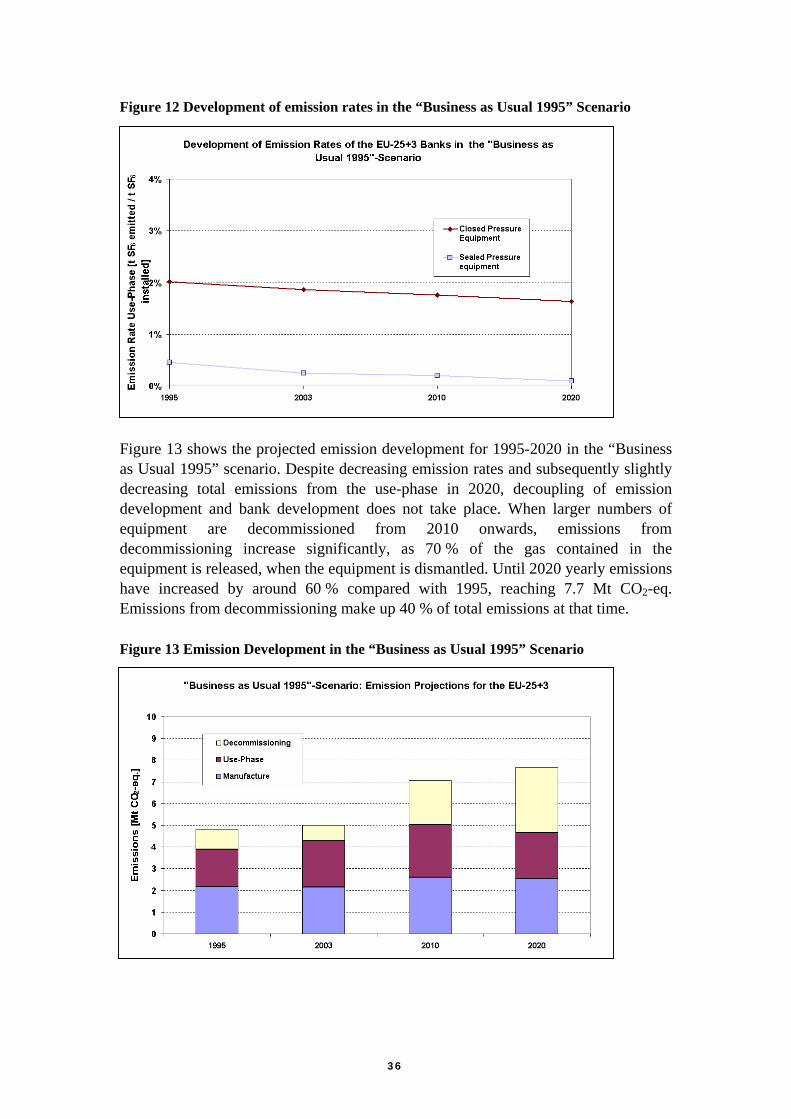
Figure 12 Development of emission rates in the “Business as Usual 1995” Scenario
Figure 13 shows the projected emission development for 1995-2020 in the “Business as Usual 1995” scenario. Despite decreasing emission rates and subsequently slightly decreasing total emissions from the use-phase in 2020, decoupling of emission development and bank development does not take place. When larger numbers of equipment are decommissioned from 2010 onwards, emissions from decommissioning increase significantly, as 70 % of the gas contained in the equipment is released, when the equipment is dismantled. Until 2020 yearly emissions have increased by around 60 % compared with 1995, reaching 7.7 Mt CO2-eq. Emissions from decommissioning make up 40 % of total emissions at that time. Figure 13 Emission Development in the “Business as Usual 1995” Scenario
36
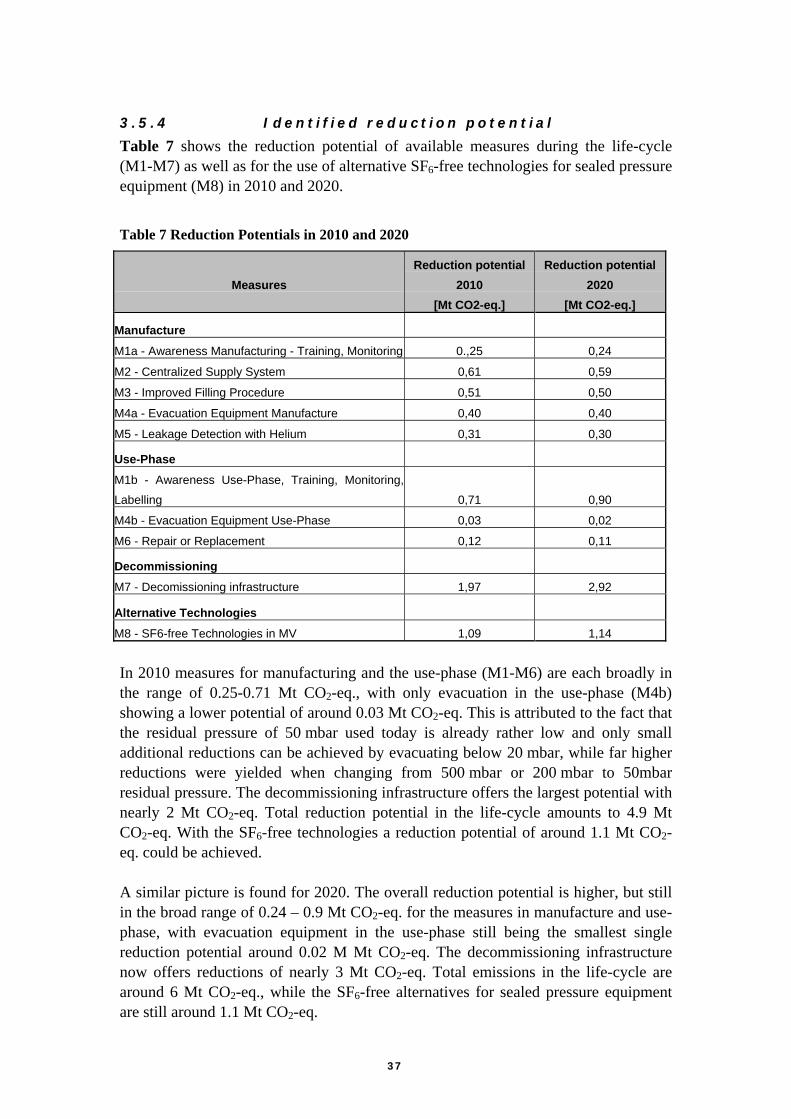
3.5 .4 Ident i f ied reduct ion potent ia l
Table 7 shows the reduction potential of available measures during the life-cycle (M1-M7) as well as for the use of alternative SF6-free technologies for sealed pressure equipment (M8) in 2010 and 2020.
Table 7 Reduction Potentials in 2010 and 2020
Measures Reduction potential
2010 [Mt CO2-eq.]
Reduction potential 2020
[Mt CO2-eq.]
Manufacture
M1a - Awareness Manufacturing - Training, Monitoring 0.,25 0,24
M2 - Centralized Supply System 0,61 0,59
M3 - Improved Filling Procedure 0,51 0,50
M4a - Evacuation Equipment Manufacture 0,40 0,40
M5 - Leakage Detection with Helium 0,31 0,30
Use-Phase
M1b - Awareness Use-Phase, Training, Monitoring, Labelling 0,71 0,90
M4b - Evacuation Equipment Use-Phase 0,03 0,02
M6 - Repair or Replacement 0,12 0,11
Decommissioning
M7 - Decomissioning infrastructure 1,97 2,92
Alternative Technologies
M8 - SF6-free Technologies in MV 1,09 1,14 In 2010 measures for manufacturing and the use-phase (M1-M6) are each broadly in the range of 0.25-0.71 Mt CO2-eq., with only evacuation in the use-phase (M4b) showing a lower potential of around 0.03 Mt CO2-eq. This is attributed to the fact that the residual pressure of 50 mbar used today is already rather low and only small additional reductions can be achieved by evacuating below 20 mbar, while far higher reductions were yielded when changing from 500 mbar or 200 mbar to 50mbar residual pressure. The decommissioning infrastructure offers the largest potential with nearly 2 Mt CO2-eq. Total reduction potential in the life-cycle amounts to 4.9 Mt CO2-eq. With the SF6-free technologies a reduction potential of around 1.1 Mt CO2-eq. could be achieved. A similar picture is found for 2020. The overall reduction potential is higher, but still in the broad range of 0.24 – 0.9 Mt CO2-eq. for the measures in manufacture and use-phase, with evacuation equipment in the use-phase still being the smallest single reduction potential around 0.02 M Mt CO2-eq. The decommissioning infrastructure now offers reductions of nearly 3 Mt CO2-eq. Total emissions in the life-cycle are around 6 Mt CO2-eq., while the SF6-free alternatives for sealed pressure equipment are still around 1.1 Mt CO2-eq.
37
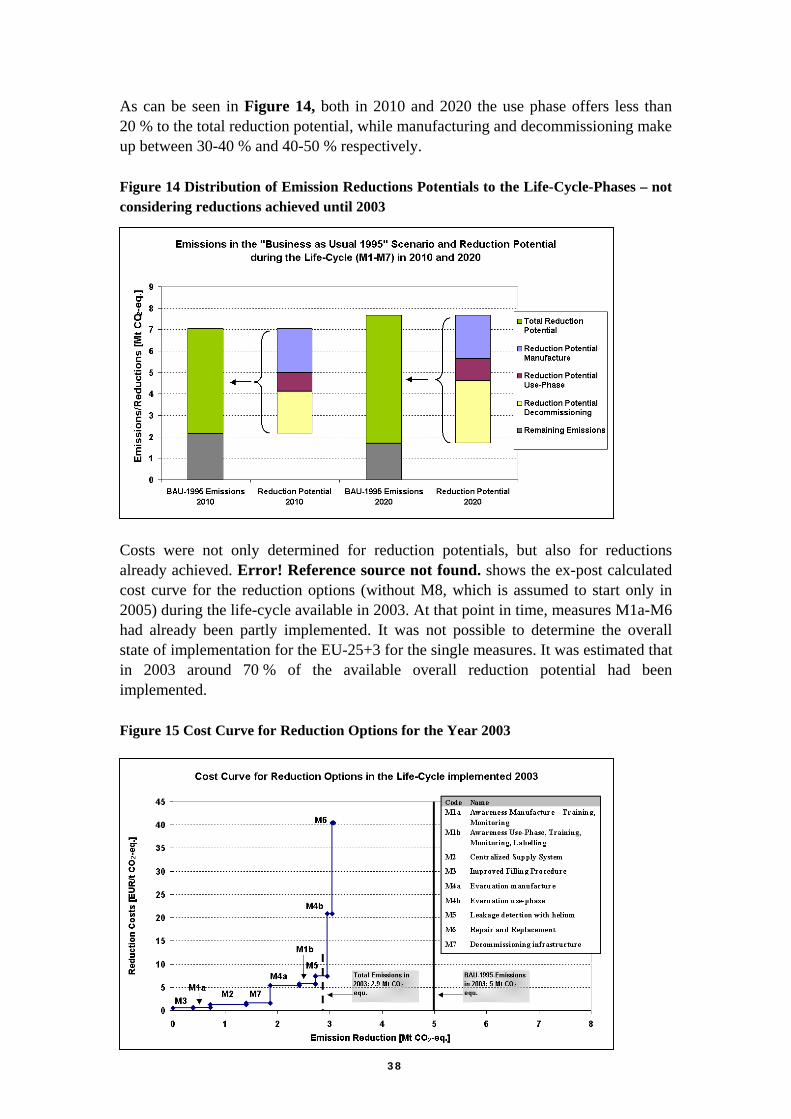
As can be seen in Figure 14, both in 2010 and 2020 the use phase offers less than 20 % to the total reduction potential, while manufacturing and decommissioning make up between 30-40 % and 40-50 % respectively. Figure 14 Distribution of Emission Reductions Potentials to the Life-Cycle-Phases – not considering reductions achieved until 2003
Costs were not only determined for reduction potentials, but also for reductions already achieved. Error! Reference source not found. shows the ex-post calculated cost curve for the reduction options (without M8, which is assumed to start only in 2005) during the life-cycle available in 2003. At that point in time, measures M1a-M6 had already been partly implemented. It was not possible to determine the overall state of implementation for the EU-25+3 for the single measures. It was estimated that in 2003 around 70 % of the available overall reduction potential had been implemented. Figure 15 Cost Curve for Reduction Options for the Year 2003
38
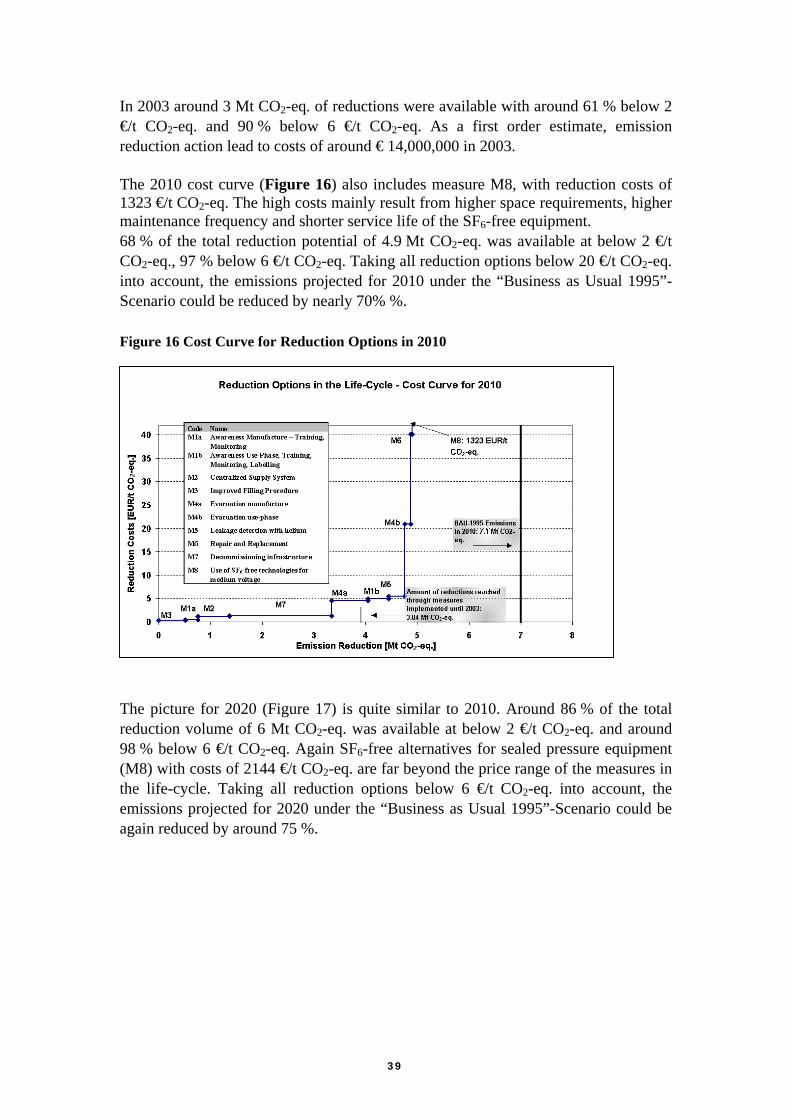
In 2003 around 3 Mt CO2-eq. of reductions were available with around 61 % below 2 €/t CO2-eq. and 90 % below 6 €/t CO2-eq. As a first order estimate, emission reduction action lead to costs of around € 14,000,000 in 2003. The 2010 cost curve (Figure 16) also includes measure M8, with reduction costs of 1323 €/t CO2-eq. The high costs mainly result from higher space requirements, higher maintenance frequency and shorter service life of the SF6-free equipment. 68 % of the total reduction potential of 4.9 Mt CO2-eq. was available at below 2 €/t CO2-eq., 97 % below 6 €/t CO2-eq. Taking all reduction options below 20 €/t CO2-eq. into account, the emissions projected for 2010 under the “Business as Usual 1995”-Scenario could be reduced by nearly 70% %. Figure 16 Cost Curve for Reduction Options in 2010
The picture for 2020 (Figure 17) is quite similar to 2010. Around 86 % of the total reduction volume of 6 Mt CO2-eq. was available at below 2 €/t CO2-eq. and around 98 % below 6 €/t CO2-eq. Again SF6-free alternatives for sealed pressure equipment (M8) with costs of 2144 €/t CO2-eq. are far beyond the price range of the measures in the life-cycle. Taking all reduction options below 6 €/t CO2-eq. into account, the emissions projected for 2020 under the “Business as Usual 1995”-Scenario could be again reduced by around 75 %.
39
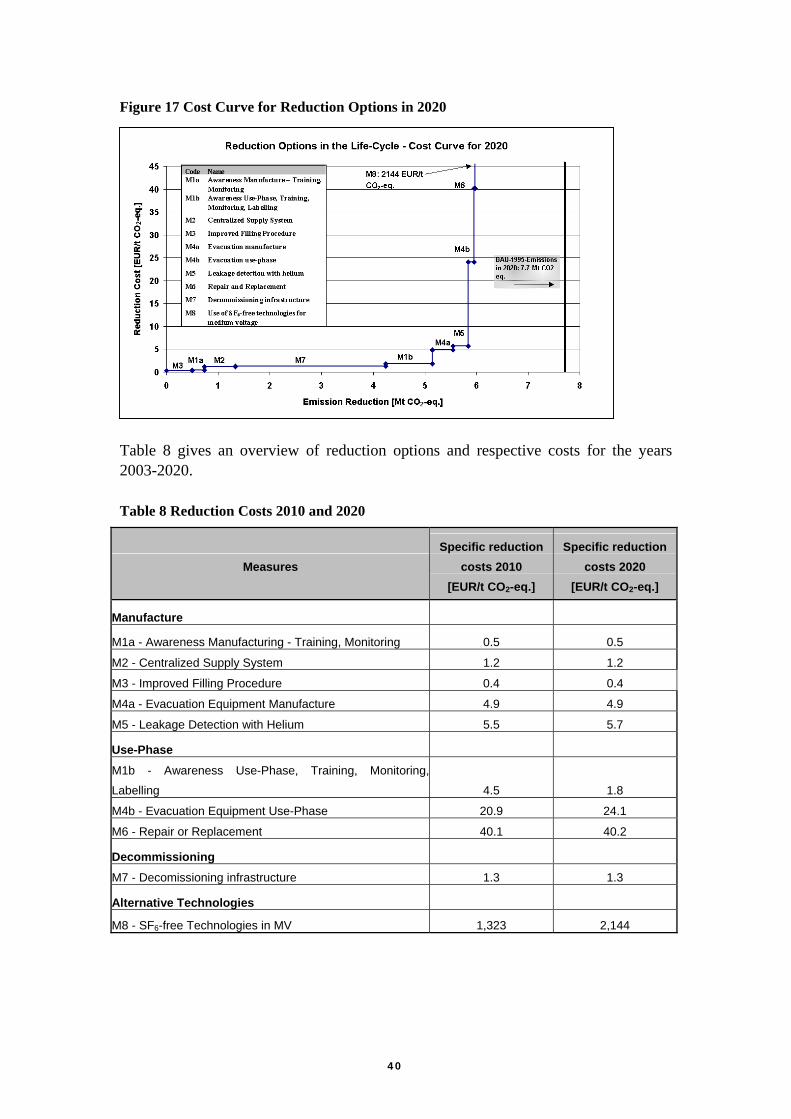
Figure 17 Cost Curve for Reduction Options in 2020
Table 8 gives an overview of reduction options and respective costs for the years 2003-2020. Table 8 Reduction Costs 2010 and 2020
Measures Specific reduction
costs 2010 [EUR/t CO2-eq.]
Specific reduction costs 2020
[EUR/t CO2-eq.]
Manufacture
M1a - Awareness Manufacturing - Training, Monitoring 0.5 0.5
M2 - Centralized Supply System 1.2 1.2
M3 - Improved Filling Procedure 0.4 0.4
M4a - Evacuation Equipment Manufacture 4.9 4.9
M5 - Leakage Detection with Helium 5.5 5.7
Use-Phase
M1b - Awareness Use-Phase, Training, Monitoring,Labelling 4.5 1.8
M4b - Evacuation Equipment Use-Phase 20.9 24.1
M6 - Repair or Replacement 40.1 40.2
Decommissioning
M7 - Decomissioning infrastructure 1.3 1.3
Alternative Technologies
M8 - SF6-free Technologies in MV 1,323 2,144
40
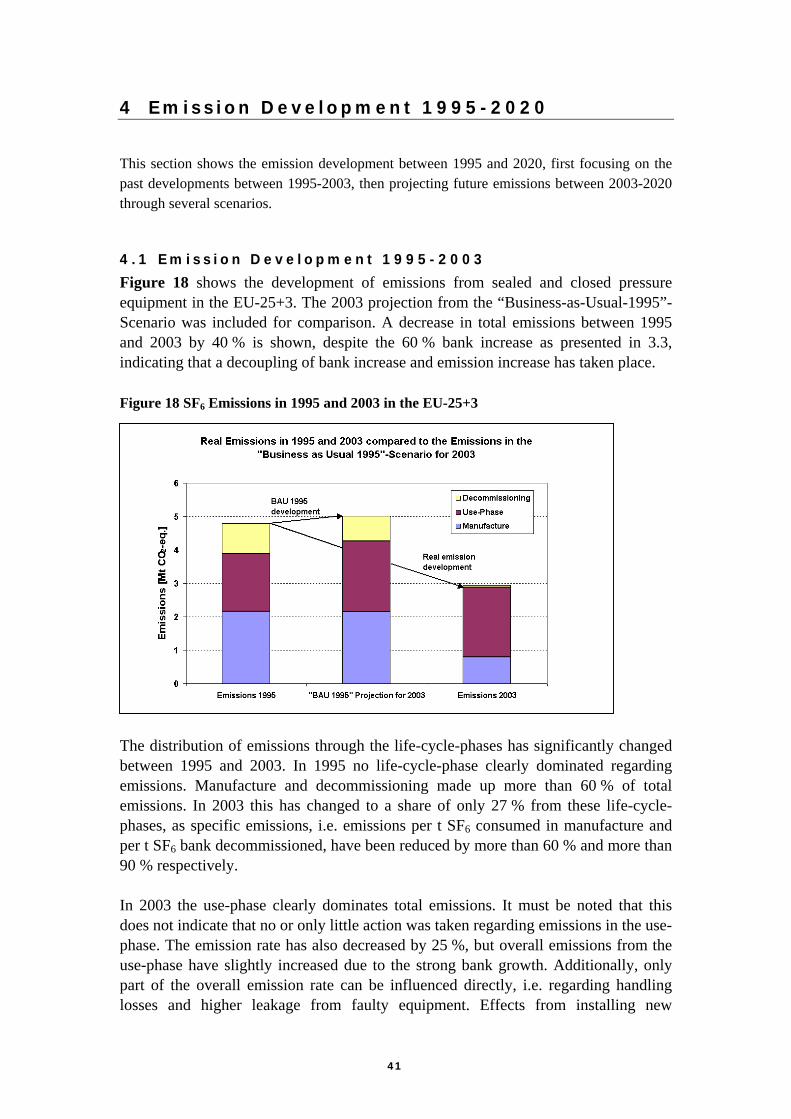
4 Emission Development 1995-2020
This section shows the emission development between 1995 and 2020, first focusing on the past developments between 1995-2003, then projecting future emissions between 2003-2020 through several scenarios.
4.1 Emiss ion Deve lopment 1995-2003
Figure 18 shows the development of emissions from sealed and closed pressure equipment in the EU-25+3. The 2003 projection from the “Business-as-Usual-1995”-Scenario was included for comparison. A decrease in total emissions between 1995 and 2003 by 40 % is shown, despite the 60 % bank increase as presented in 3.3, indicating that a decoupling of bank increase and emission increase has taken place. Figure 18 SF6 Emissions in 1995 and 2003 in the EU-25+3
The distribution of emissions through the life-cycle-phases has significantly changed between 1995 and 2003. In 1995 no life-cycle-phase clearly dominated regarding emissions. Manufacture and decommissioning made up more than 60 % of total emissions. In 2003 this has changed to a share of only 27 % from these life-cycle-phases, as specific emissions, i.e. emissions per t SF6 consumed in manufacture and per t SF6 bank decommissioned, have been reduced by more than 60 % and more than 90 % respectively. In 2003 the use-phase clearly dominates total emissions. It must be noted that this does not indicate that no or only little action was taken regarding emissions in the use-phase. The emission rate has also decreased by 25 %, but overall emissions from the use-phase have slightly increased due to the strong bank growth. Additionally, only part of the overall emission rate can be influenced directly, i.e. regarding handling losses and higher leakage from faulty equipment. Effects from installing new
41
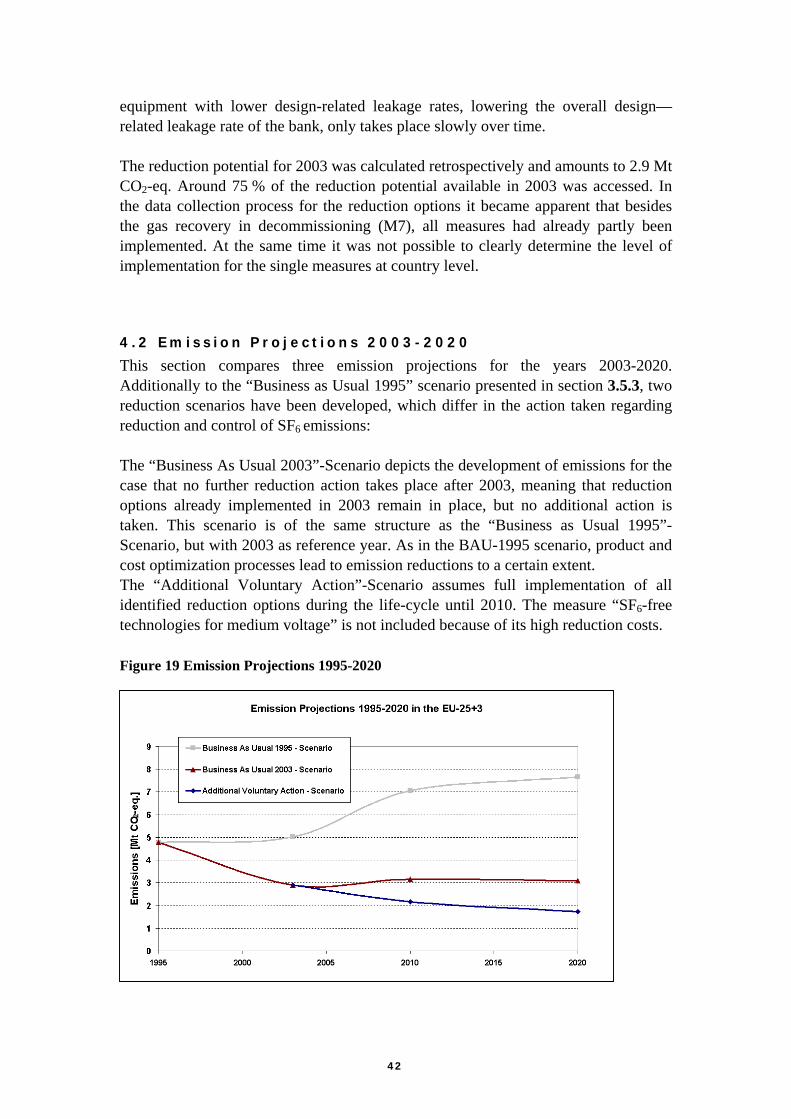
equipment with lower design-related leakage rates, lowering the overall design—related leakage rate of the bank, only takes place slowly over time. The reduction potential for 2003 was calculated retrospectively and amounts to 2.9 Mt CO2-eq. Around 75 % of the reduction potential available in 2003 was accessed. In the data collection process for the reduction options it became apparent that besides the gas recovery in decommissioning (M7), all measures had already partly been implemented. At the same time it was not possible to clearly determine the level of implementation for the single measures at country level.
4.2 Emiss ion Project ions 2003-2020
This section compares three emission projections for the years 2003-2020. Additionally to the “Business as Usual 1995” scenario presented in section 3.5.3, two reduction scenarios have been developed, which differ in the action taken regarding reduction and control of SF6 emissions: The “Business As Usual 2003”-Scenario depicts the development of emissions for the case that no further reduction action takes place after 2003, meaning that reduction options already implemented in 2003 remain in place, but no additional action is taken. This scenario is of the same structure as the “Business as Usual 1995”-Scenario, but with 2003 as reference year. As in the BAU-1995 scenario, product and cost optimization processes lead to emission reductions to a certain extent. The “Additional Voluntary Action”-Scenario assumes full implementation of all identified reduction options during the life-cycle until 2010. The measure “SF6-free technologies for medium voltage” is not included because of its high reduction costs. Figure 19 Emission Projections 1995-2020
42
Despite the reduction in specific as well as in total emissions achieved between 1995 and 2003, overall emissions in the “Business As Usual 2003” scenario slightly increase around 10 % in 2010 and 2020 compared to 2003 due to the strong bank growth (Figure 19). Comparing 2010 and 2020 emissions levels to the respective emission levels in the “Business as Usual 1995”-Scenario, reductions of 55% and 60% are achieved. Additional reductions in overall emissions can be achieved if the identified reduction options are fully implemented as in the “Additional Voluntary Action”-Scenario. Compared to the “Business as Usual 2003”-Scenario further reductions of around 1 Mt CO2-eq. in 2010 and 1.4 Mt CO2-equ in 2020 are available. Emissions levels of 2.2 and 1.7 Mt CO2-eq. could be achieved, equalling reductions of 70% and 75% compared to the respective emission levels in the “Business as Usual 1995”-Scenario.
43
5 Evaluation of Voluntary Actions
5.1 Introduct ion
In previous chapters it was shown that considerable emission reductions have been achieved since 1995 without any legal obligation. A combination of voluntary actions and voluntary commitments has apparently led to a more responsible use of SF6 in electrical equipment across Europe. Manufacturers and users of SF6 electrical equipment have been prepared to carry additional costs in order to demonstrate their ability to successfully manage the high global warming substance over the lifecycle of the equipment. With an eye to the future this chapter tries to summarize what has been achieved in the industry since the early 1990’s, what has worked well and why, and where there may be challenges in the future. Policy instruments are commonly evaluated regarding their suitability for a certain market by the following set of criteria:
• Environmental Effectiveness – Does the policy instrument lead to a significant reduction in greenhouse gas emissions?
• Probability of Success: Does the policy instrument provide reasonable certainty that emission reduction targets are met?
• Cost Effectiveness – What are the costs in € per tonne of CO2-eq. saved of a measure, what prices do other measures have?
• Administrative Burden – Will the policy instrument create a significant administrative burden for the involved administrations?
• Fairness - Does the policy instrument lead to an unfair burden to certain players within the sector (E.g. small and medium sized enterprises - SMEs)?
• International Competitiveness – Does the policy instrument significantly influence the competitiveness of manufacturing companies in international markets?
Based on these criteria the European Climate Change Programme (2001) stated that voluntary agreements (VAs) can be the most appropriate option to reduce emissions of fluorinated gases. Voluntary agreements on climate change are commonly closed between the emitters or their industry association and the competent national government authority. Voluntary agreements in this field frequently comprise an absolute or specific emission reduction target. These will often be augmented by more qualitative objectives e.g. in respect to training, communication, application of best-practice and requirements for monitoring and verification. In general voluntary agreements result in a low administrative burden and allow for cost-effectiveness, as they leave affected businesses a choice of the reduction measures to be applied. The environmental effectiveness of VAs is sometimes perceived as a problem, as the final
44
level of emission reduction cannot be predicted. A system including sanctions (the principle of “carrot and stick”) can help to increase the chances to achieve a reduction target and will increase public confidence that the agreement will deliver its promises. There are, however, many industry voluntary actions which are better termed “voluntary commitments” which may or may not have been endorsed by the competent authority. In any case, the probability of success is higher if a small number of entities have dominating influence on emissions – this allows for easy self-organization of the group and mutual control. In the longer term it is key to implement effective and credible measures to monitor progress towards targets and to demonstrate compliance with the defined requirements.
5.2 Spec i f ics for SF 6 E lectr ica l Equipment
As part of this analysis, Ecofys has carried out a survey about the status of voluntary agreements/commitments across Europe and also in the rest of the world. Detailed results are presented in Annex I of this report. It was found that voluntary agreements according to a strict definition are in place in the following European countries: Denmark, France, Germany, Italy, Norway, Sweden and Switzerland. The Netherlands has put into place a subsidy scheme to reduce emissions. Outside Europe, Japan provided a prominent example for a successful voluntary agreement. The USA possesses a very visible voluntary program with somewhat limited participation from the sector. Based on the limited published evidence, voluntary agreements and commitments seem to have proven their feasibility in the manufacture, but also the use of SF6 electrical equipment. Voluntary agreements and commitments for the use-phase and end-of-life are more difficult to manage because of the several hundreds of operators involved, however, successful examples for voluntary agreements including both manufacturers and users exist. The following section discusses details of how voluntary agreements and commitments can address the needs of each phase of the life-cycle: Manufacture: For the manufacturing process considerable emission reduction potential lies in the areas of training and technical measures. A significant fraction of this potential has already been accessed, as a general awareness of the problem has been reached at the manufacturers side Ensuring implementation of measures throughout the EU-member states now seems the next important step. Training contents vary widely according to the activities carried out by members of staff and the production technology applied. The same applies to the technologies used in manufacture. Here a voluntary agreement setting fixed reduction targets but leaving manufacturers the choice of the most cost-efficient way to reduce emissions seems most promising. From an organizational point of view a voluntary agreement seems also feasible, as the number of involved players is small (below 20). As CAPIEL consists of national associations, an EU-wide common approach for the voluntary agreement with a national implementation seems most promising. Voluntary agreements have already been set up at national level in the late nineties with reviewed versions being prepared at present. The voluntary agreement should address
45
the major reduction options available and the reductions to be commonly achieved within a certain timeframe, e.g. until 2010. Internal control and sanction mechanisms are often used in voluntary agreements to ensure compliance. The voluntary agreement will require an inventory system for offering comparability of data for the various countries and manufacturers. Through the national and UNFCCC reporting, inventory system activities for the individual life-cycle phases already exist. CAPIEL and EURELECTRIC started to cooperate on a common Inventory System. . In order to avoid undue efforts with several parallel reporting systems with different requirements, the results of this cooperation could serve as a basis for a harmonized inventory approach covering both national reporting for the F-Gas-Regulation as well as for the UNFCCC. Use-phase: Emissions in the use-phase mainly stem from design-related leakage, increased leakage of faulty equipment and losses during gas-handling. For sealed pressure equipment, which does not require maintenance and already has very low leakage rates of 0.1 % per year, only very minor emission reductions can be achieved through further decrease of the leakage rates by improved design. For closed pressure systems a larger reduction potential can be accessed through dissemination of new equipment with low design related leakage rates of 0.1-0.3 % and maintenance intervals of 25 years in the existing banks with higher overall emission rates - 1.8 % in 200341 -, due to older equipment with different leakage and maintenance characteristics. Further reduction of design related leakage rates for closed systems will only lead to minor reductions compared to present leakage rates. The key measures are gas handling in maintenance and repairing leaky equipment or taking it out of operation as considerable reduction potential is found here. Information dissemination in the form of training and general awareness raising seems to be the most appropriate instrument. Decommissioning: In the disposal phase a clear responsibility for decommissioning is needed. As well as clear responsibility and the availability of qualified personnel, an enforcement structure would be required, ensuring that the gas contained in the equipment is not simply left to escape in the atmosphere, which is of course the most cost-saving method. In order to avoid this a decommissioning infrastructure is needed, which allows for easy and cost-efficient decommissioning. With an infrastructure involving manufacturers, users and disposal companies knowledge about gas handling and disposal experience other than SF6 could be combined. CAPIEL in coordination with the International Council on large electric systems (CIGRE) currently has a working group active on the issue of disposal, which is working on a suitable approach regarding logistics, legal issues and technical requirements.
41 Stemming from design-relate leakage, but also from handling and maintenance action.
46
5.3 Ach ievements and the road ahead
Since the early 1990’s, manufacturers and users of SF6 electrical equipment have succeeded in significantly improving the technical standard according to which the equipment is produced, serviced, maintained and decommissioned. The overall technical performance of the systems has improved significantly as a result of this. SF6 emission levels have been drastically reduced from the large manufacturing sites and emissions have reduced during the use phase in electrical utility companies and industrial enterprises which own this growing population of systems. The results of the survey of established voluntary commitments and agreements as presented in Annex I of this report may simply reflect different political cultures across Europe or the lack of political pressure from government. However, they could also reflect differences of awareness or commitment to control the SF6 emissions from these applications. It is not clear to the authors of this report to which extent the reduction measures in the life-cycle of equipment assessed in section 3.5 are implemented in different European countries and companies of different sizes or cultures. In order to fully access the remaining emission reductions, full coverage of these reduction measures throughout the EU-25+3 has to be achieved. All voluntary agreements and commitments should be verifiable. For this purpose an integrated cradle-to-grave inventory system covering all life-cycle stages is recommended. Voluntary agreements should include provisions for verification of the reported results. Over the past few years it has been observed that visible efforts to control SF6 emissions have spread among equipment manufacturers and utilities, who have started to fully realize the benefits of this technology for the design and reliability of their networks as well as the value of their assets of existing SF6 equipment. However, part of the efforts to improve industry practice in order to control SF6 emissions from the electricity sector may have missed smaller manufacturers and users of this equipment such as smaller utilities or industrial companies. Achieving full coverage of reduction measures means ensuring implementation throughout the electricity industry. Because of the comparatively young age of most pieces of SF6 electrical equipment with only small numbers being decommissioned by 2010, the existing decommissioning structures will have to be extended or further developed in order to ensure a responsible management of the end of life of the equipment by all parties involved. This study proposes the following actions to the European electricity industry:
a) to expand their voluntary actions so as to fully cover the assessed reduction potential and to seek a consistent ambition level across all European countries,
b) to develop and implement a harmonized European voluntary reduction commitment,
47
c) to intensify efforts to establish a consistent European approach for the management of end-of-life of SF6-equipment,
d) to intensify European efforts to annually collect bottom-up data on the banks and emissions,
e) to co-operate with national inventory compilers to ensure consistency between national and industry reporting, and
f) to help to globally disseminate best-industry practice for the manufacture, use and decommissioning of SF6 equipment.
Because of the higher number of affected companies and less uniform technologies, the efforts in the electricity industry will need to take a different route than for example the highly publicized reduction commitment of the World Semiconductor Council42. Up to now, the European electricity industry has kept at a rather low profile its efforts to reduce SF6 emissions. However, if it continues to succeed in its efforts, its decentralized voluntary approach may turn out to become a global benchmark for voluntary industry action to combat climate change.
42 The World Semiconductor Council has committed itself on behalf of its members in North America, Japan,
Korea and Europe to globally reduce greenhouse gas emissions from semiconductor production by 10% against the
1995 base year despite rapidly growing production output.
48
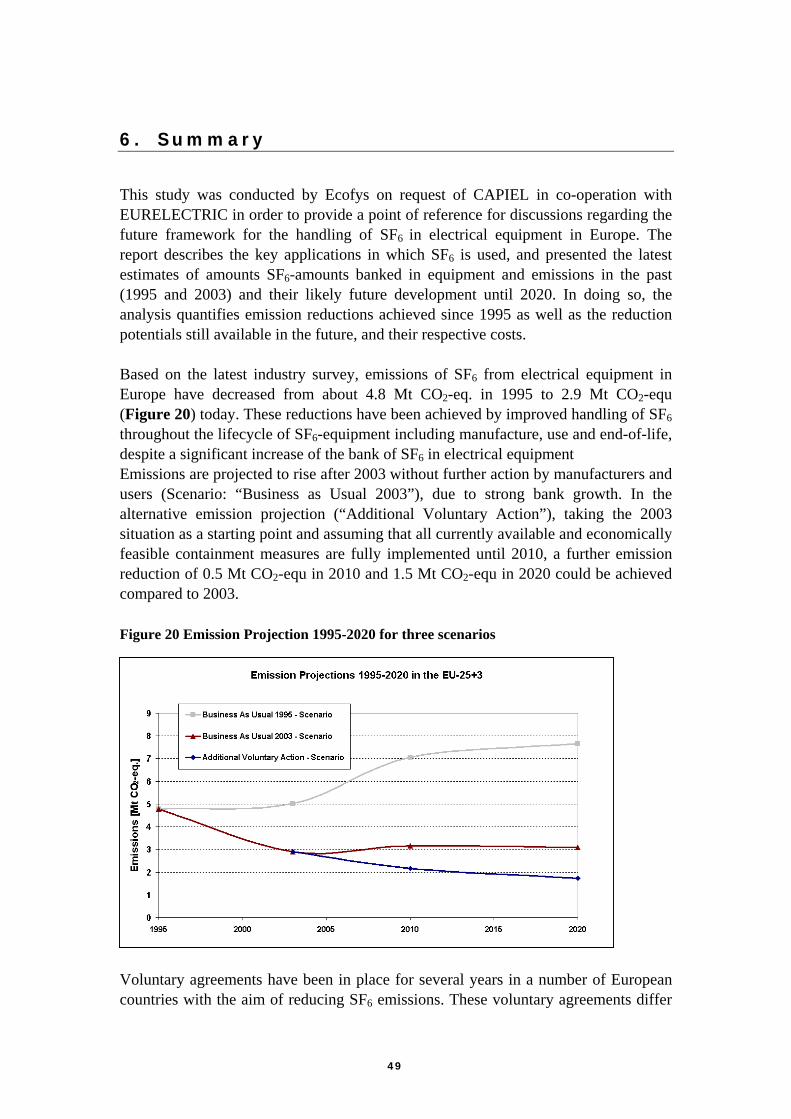
6. Summary
This study was conducted by Ecofys on request of CAPIEL in co-operation with EURELECTRIC in order to provide a point of reference for discussions regarding the future framework for the handling of SF6 in electrical equipment in Europe. The report describes the key applications in which SF6 is used, and presented the latest estimates of amounts SF6-amounts banked in equipment and emissions in the past (1995 and 2003) and their likely future development until 2020. In doing so, the analysis quantifies emission reductions achieved since 1995 as well as the reduction potentials still available in the future, and their respective costs. Based on the latest industry survey, emissions of SF6 from electrical equipment in Europe have decreased from about 4.8 Mt CO2-eq. in 1995 to 2.9 Mt CO2-equ (Figure 20) today. These reductions have been achieved by improved handling of SF6 throughout the lifecycle of SF6-equipment including manufacture, use and end-of-life, despite a significant increase of the bank of SF6 in electrical equipment Emissions are projected to rise after 2003 without further action by manufacturers and users (Scenario: “Business as Usual 2003”), due to strong bank growth. In the alternative emission projection (“Additional Voluntary Action”), taking the 2003 situation as a starting point and assuming that all currently available and economically feasible containment measures are fully implemented until 2010, a further emission reduction of 0.5 Mt CO2-equ in 2010 and 1.5 Mt CO2-equ in 2020 could be achieved compared to 2003. Figure 20 Emission Projection 1995-2020 for three scenarios
Voluntary agreements have been in place for several years in a number of European countries with the aim of reducing SF6 emissions. These voluntary agreements differ
49
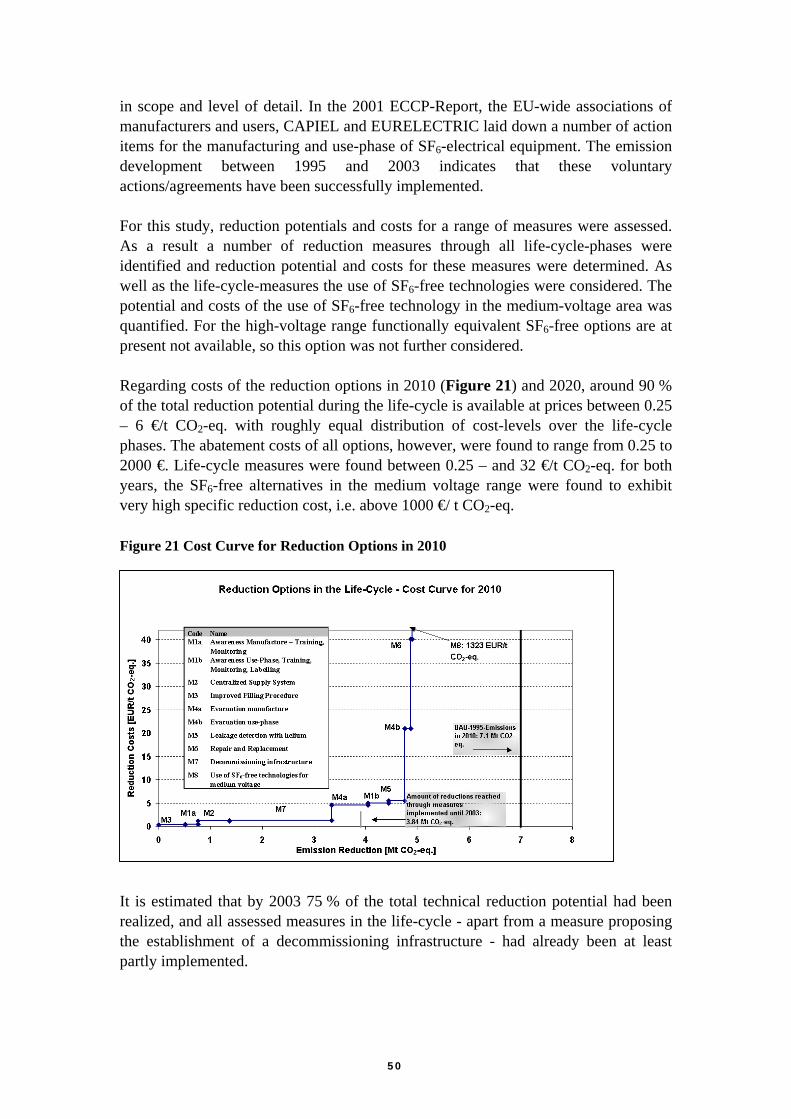
in scope and level of detail. In the 2001 ECCP-Report, the EU-wide associations of manufacturers and users, CAPIEL and EURELECTRIC laid down a number of action items for the manufacturing and use-phase of SF6-electrical equipment. The emission development between 1995 and 2003 indicates that these voluntary actions/agreements have been successfully implemented. For this study, reduction potentials and costs for a range of measures were assessed. As a result a number of reduction measures through all life-cycle-phases were identified and reduction potential and costs for these measures were determined. As well as the life-cycle-measures the use of SF6-free technologies were considered. The potential and costs of the use of SF6-free technology in the medium-voltage area was quantified. For the high-voltage range functionally equivalent SF6-free options are at present not available, so this option was not further considered. Regarding costs of the reduction options in 2010 (Figure 21) and 2020, around 90 % of the total reduction potential during the life-cycle is available at prices between 0.25 – 6 €/t CO2-eq. with roughly equal distribution of cost-levels over the life-cycle phases. The abatement costs of all options, however, were found to range from 0.25 to 2000 €. Life-cycle measures were found between 0.25 – and 32 €/t CO2-eq. for both years, the SF6-free alternatives in the medium voltage range were found to exhibit very high specific reduction cost, i.e. above 1000 €/ t CO2-eq. Figure 21 Cost Curve for Reduction Options in 2010
It is estimated that by 2003 75 % of the total technical reduction potential had been realized, and all assessed measures in the life-cycle - apart from a measure proposing the establishment of a decommissioning infrastructure - had already been at least partly implemented.
50
Against the “Business-as-usual”-scenario, with projected emissions of 7 and 7.8 Mt CO2-equ in 2010 and 2020 respectively, reduction options over the life-cycle of between 5 and 6 Mt CO2-eq. annually were identified. Here the largest potential is available for recovery of gas in decommissioning making up for nearly 40 % and 50 %, manufacture with 40 % and 30 %, use-phase around 20 % in 2010 and 2020 respectively. Further reductions are necessary to prevent emissions from rising again due to anticipated bank growth for the next years. Attention will need to be focused on achieving full implementation of all reduction options for the manufacturing and the use-phase and setting up an infrastructure ensuring appropriate recovery of gas in decommissioning.
51
7. References
ABB Calor EMAG; Switchgear Manual 10th edition; Mannheim; 2001.
Bessede; J-L., Inchausti, J. M., Knobloch, H., Theoleyre, S., Endre, T.: Management of SF6 Emissions from T&D HV equipment in the European Union. The updated inventory methodology; Presentation at the EPA Conference: SF6 and the Environment, Emission Reduction Strategies. Scottsdale, December 1-4, 2004
Blok K., H.L.F. de Groot, E.E.M. Luiten and M.G. Rietbergen, The Effectiveness of Policy Instruments for Energy-Efficiency Improvement in Firms, Kluwer Academic Publishers, Dordrecht, the Netherlands, 2004.
Courtin, W; Elektrische Energietechnik; Braunschweig/Wiesbaden; 1999.
European Environmental Agency; Annual European Community greenhouse gas inventory 1990–2002 and inventory report 2004, Submission to the UNFCCC Secretariat, Technical Report 2/2004.
Eurelectric, Environmental Statistics of the European Electricity Industry (2000-2002) - Trends in Environmental Performance, 2004.
European Union; DIRECTIVE 2002/96/EC of the European Parliamten and of the council of 27 January 2003 on waste electrical and electronic equipment (WEEE); Brussels; 2003.
Harnisch, J., M. Frische, R. Borchers, A. Eisenhauer, A. Jordan; Natural fluorinated organics in fluorite and rocks; Geophys. Res. Lett., Vol. 27 , No. 13 , pp. 1883-1886, 2000.
Harnisch J. and R. Gluckman: European Climate Change Programme, Working Group Industry, Work Item Fluorinated Gases; Brussels; 2001.
Heuck, K., Dettmann, K.; Erzeugung, Transport und Verteilung elektrischer energie für Studium und Praxis, Braunschweig/Wiesbaden; 2002.
International Council on large electric systems (CIGRE); Guide for the preparation of customised “Practical SF6 handling instructions”; 2005.
International Electrotechical Commission (IEC); Common specifications for high-voltage switchgear and controlgear standards (IEC 60694); 2002
IPCC; Climate Change 1995 - The second IPCC Scientific Assessment; Intergovern-mental Panel on Climate Change, World Meteorological Organization & United Nations Environmental Programme, Cambridge University Press, Cambridge, 1996.
Intergovermental Panel on Climate Change (IPCC); Revised 1996 IPCC Guidelines for National Greenhouse Gas Inventories; Bracknell; 1997.
52
Intergovernmental Panel on Climate Change (IPCC); Good Practice Guidance and Uncertainty Management in National Greenhouse Gas Inventories; Bracknell; 2000.
Luxa, A.: The CAPIEL Cradle-to-Grave Inventory Methodology for SF6 –Insulated Electrical High Voltage Switchgear in Europe; Paper for the EPA Conference: SF6 and the Environment, Emission Reduction Strategies. San Diego, November 21-22, 2002
Mersiowsky, I.; Life Cycle Assessment. SF6-GIS-Technology for Power Distribution – Medium Voltage; Hannover, 2003.
Nelles, D., Tutas, Ch.: Elektrische Energietechnik, Stuttgart, 1998.
Neumann, C.; National und international eingesetzte und jährlich emittierte SF6-Mengen heutiger Stand und erwartete Entwicklungen; Proceedings of VDEW-Informationstag on June 8, 1999; German Association of Electricity Producers, Frankfurt, 1999.
O’Connell et al; SF6 in the Electric Industry, Status 2000; Baden-Daetwil; 2001.
Olivier, J.; 1998; EDGAR V0, Preliminary data; January 1998.
Pittroff, Schütte, Meier; SF6 ReUse Concept and New Applications; 8th Int. Symp. On Gaseous Dielectrics; 1998 p. 465 – 470.
Krähling, H., Römer, S.; Live Cycle Assessment Study “Electricity supply using SF6 Technology”, 1999.
Reuter, E.; The Ecologically Effective and Economically Efficient Aspects of Using SF6 Heavy Gas in Medium-Voltage Power Distribution Switchgear; Hamburg; 2004.
Solvay; Konzept zur Wiederverwendung von genutztem SF6-Gas (Solvay Reuse Concept); Hannover; 2004.
Sorensen et. al.; Life Assessment (LCA) for overhead lines; Electra No. 217, Dec. 2004.
Union of the Electricity Industry – EURELECTRIC, Union for the Co-ordination of Transmission of Electricity (UCTE): European Interconnection: State of the Art 2002 (SYSTINT Annual Report); Brussels; 2002.
Verband der Netzbetreiber (VDN), Zentralverband Elektrotechnik- und Elektronikindustrie (ZVEI); SF6 in Mittel- und Hochspannungsschaltanlagen. Gemeinsame Stellungnahme des ZVEI und des VDN zum Eckpunktepapier; 24.10.2002.
53
8. Acknowledgements
The authors would like to acknowledge the support und input received from a range of experts who have helped to make this study as comprehensive and balanced as possible. The following, non-exhaustive list of names comprises important contributors to the study: Guillermo Amann (Ormazabal), Nadi Assaf (CAPIEL), Hallgeir Betele (Renas), Peter Bunke (N-Ergie),. David Crawley (EURELECTRIC), Mr. Däumling (Ritz), Michel Duret (Schneider Electric), Jarmo Elovaara (Fingrid), Tony Headley (BEAMA / VATECH), Thor Endre(ABB), Leslie Falkingham(Areva), André Giboulet (Vatech), Gerard Gueneau (Schneider Electric), Vasco de Janeiro (EURELECTRIC), Mr. Leeman (BELIA), Andreas Luxa (Siemens), Mr. Merl (Epcos), Ivo Mersiowsky (Solvay), Giuliano Monizza (ABB), Giuseppe Montesano (ENEL), Claus Neumann (RWE), Enrique Otegui, (Ormazabal), Francisco Parada (REN), Friedrich Plöger (Siemens), Mr. Prucker (Trench), Christoph Rammratt (Driescher Moosburg), Andreas Reimüller (ABB), Mr. Riedl (Dilo); Armin Schnettler (RWTH Aachen), Katja Schwaab (Federal Environmental Agency - Germany); Winfried Schwarz (Oekorecherche), Libero Sfondrini (ABB), Johannes Stein (ZVEI), Silvio Stangherlin(ABB); Serge Theoleyre (Schneider Electric), George Valentin (EDF) The work for this analysis was funded by: CAPIEL “Coordinating Commitee for the Associations of Manufacturers of Industrial Electrical Switchgear and Controlgear in the European Union” 11-17 rue Hamelin 75783 Paris cedex 16 France and the following of its national associations: ANIE Via Gattamelato 34 20149 Milano Italy ANIMEE Avenida Guerra Junqueiro, 11 - 2° Esq 1000-16 Lisboa Portugal
54
BEAMA Power Ltd Westminster Tower 3 Albert Embankment London SE1 7SL United Kingdom ELEC PROMOTION Association 11-17 rue Hamelin 75783 Paris cedey 16 France FEEI Mariahilfer Strasse 37-39 A-1060 Wien Austria SERCOBE Principe de Vergara, 74 28006 Madrid Spain ZVEI Postfach 701261 60591 Frankfurt am Main Germany
55
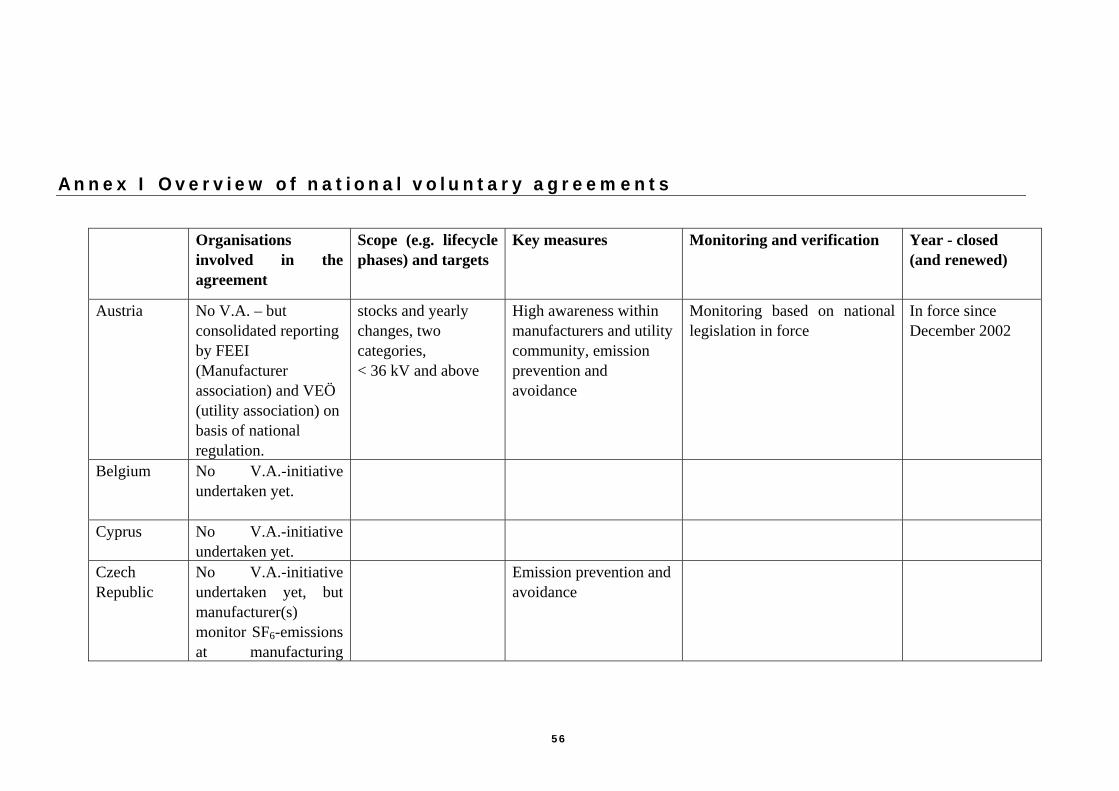
Annex I Overview of national voluntary agreements
Organisations involved in theagreement
Scope (e.g. lifecycle phases) and targets
Key measures Monitoring and verification Year - closed (and renewed)
Austria
No V.A. – but consolidated reporting by FEEI (Manufacturer association) and VEÖ (utility association) on basis of national regulation.
stocks and yearly changes, two categories, < 36 kV and above
High awareness within manufacturers and utility community, emission prevention and avoidance
Monitoring based on national legislation in force
In force since December 2002
Belgium No V.A.-initiative undertaken yet.
Cyprus No V.A.-initiative undertaken yet.
Czech Republic
No V.A.-initiativeundertaken yet, but manufacturer(s) monitor SF
6-emissions at manufacturing
Emission prevention andavoidance
56
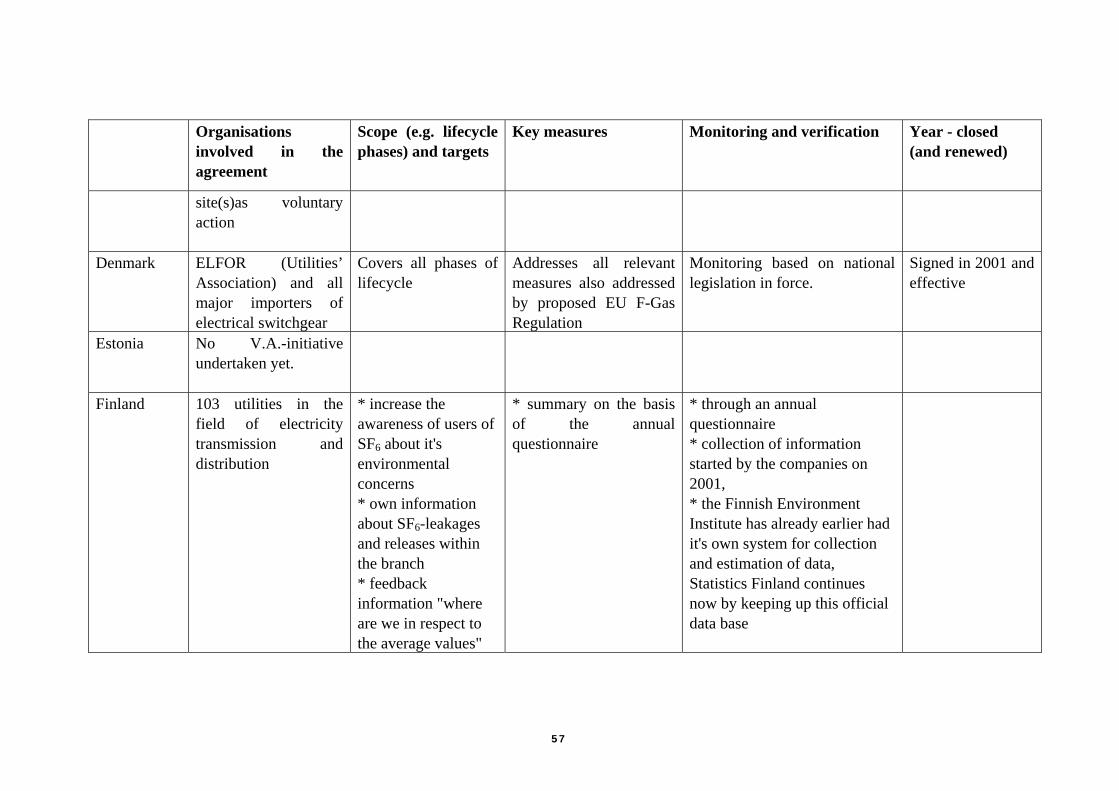
Organisations involved in the agreement
Scope (e.g. lifecycle phases) and targets
Key measures Monitoring and verification Year - closed (and renewed)
site(s)as voluntary action
Denmark
ELFOR (Utilities’Association) and all major importers of electrical switchgear
Covers all phases of lifecycle
Addresses all relevant measures also addressed by proposed EU F-Gas Regulation
Monitoring based on national legislation in force.
Signed in 2001 and effective
Estonia
No V.A.-initiativeundertaken yet.
Finland
103 utilities in the field of electricity transmission anddistribution
* increase the awareness of users of SF6 about it's environmental concerns * own information about SF6-leakages and releases within the branch * feedback information "where are we in respect to the average values"
* summary on the basis of the annualquestionnaire
* through an annual questionnaire * collection of information started by the companies on 2001, * the Finnish Environment Institute has already earlier had it's own system for collection and estimation of data, Statistics Finland continues now by keeping up this official data base
57
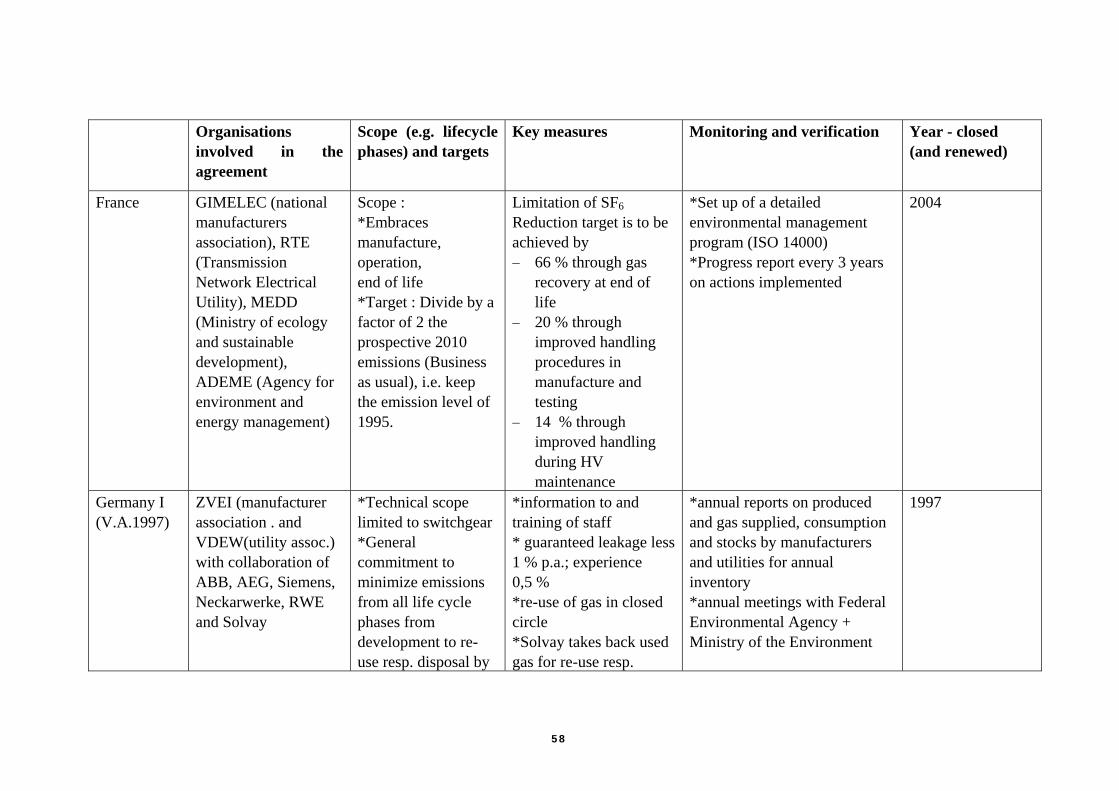
Organisations involved in the agreement
Scope (e.g. lifecycle phases) and targets
Key measures Monitoring and verification Year - closed (and renewed)
France
GIMELEC (national manufacturers association), RTE (Transmission Network Electrical Utility), MEDD (Ministry of ecology and sustainable development), ADEME (Agency for environment and energy management)
Scope : *Embraces manufacture, operation, end of life *Target : Divide by a factor of 2 the prospective 2010 emissions (Business as usual), i.e. keep the emission level of 1995.
Limitation of SF6
Reduction target is to be achieved by − 66 % through gas
recovery at end of life
− 20 % through improved handling procedures in manufacture and testing
− 14 % through improved handling during HV maintenance
*Set up of a detailed environmental management program (ISO 14000) *Progress report every 3 years on actions implemented
2004
Germany I (V.A.1997)
ZVEI (manufacturer association . and VDEW(utility assoc.) with collaboration of ABB, AEG, Siemens, Neckarwerke, RWE and Solvay
*Technical scope limited to switchgear *General commitment to minimize emissions from all life cycle phases from development to re-use resp. disposal by
*information to and training of staff * guaranteed leakage less 1 % p.a.; experience 0,5 % *re-use of gas in closed circle *Solvay takes back used gas for re-use resp.
*annual reports on produced and gas supplied, consumption and stocks by manufacturers and utilities for annual inventory *annual meetings with Federal Environmental Agency + Ministry of the Environment
1997
58
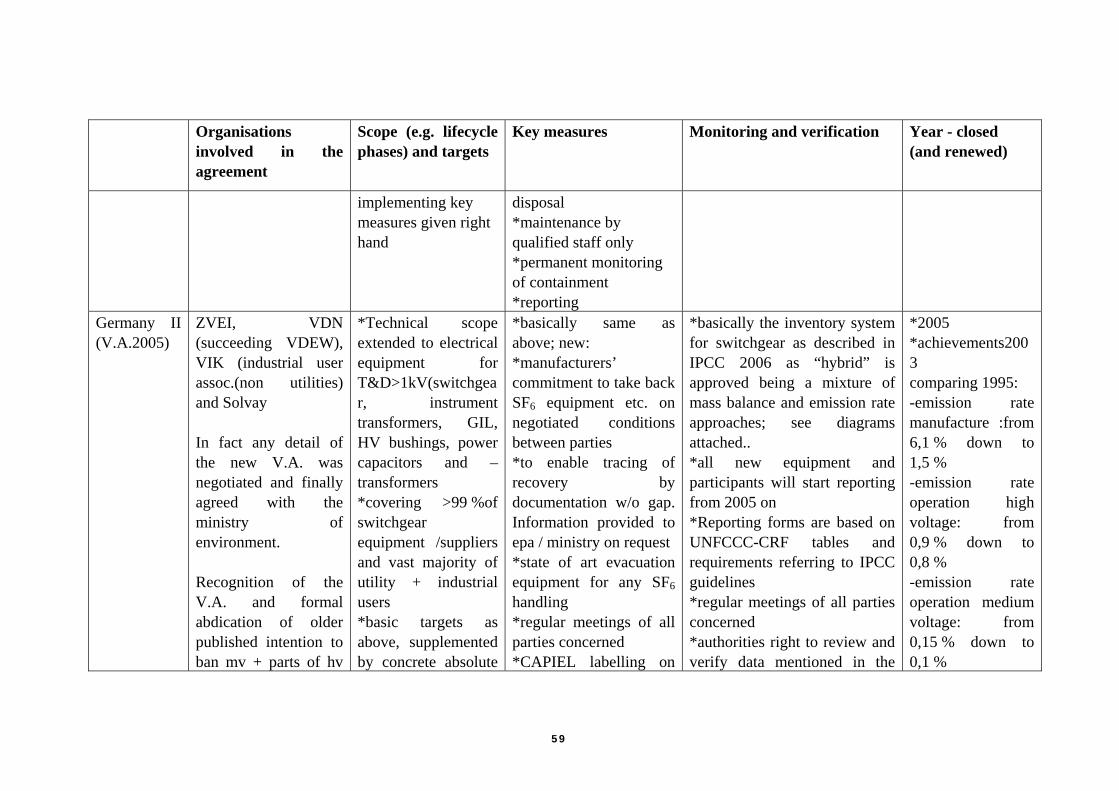
Organisations involved in the agreement
Scope (e.g. lifecycle phases) and targets
Key measures Monitoring and verification Year - closed (and renewed)
implementing key measures given right hand
disposal *maintenance by qualified staff only *permanent monitoring of containment *reporting
Germany II (V.A.2005)
ZVEI, VDN(succeeding VDEW), VIK (industrial user assoc.(non utilities) and Solvay
*Technical scopeextended to electrical equipment forT&D>1kV(switchgear, instrumenttransformers, GIL, HV bushings, power capacitors and – transformers
In fact any detail of the new V.A. was negotiated and finally agreed with theministry ofenvironment.
*covering >99 %of switchgear equipment /suppliers and vast majority of utility + industrial users
Recognition of the V.A. and formal abdication of older published intention to ban mv + parts of hv
*basically same as above; new:
*manufacturers’ commitment to take back SF
*basic targets as above, supplemented by concrete absolute
6 equipment etc. on negotiated conditionsbetween parties
*basically the inventory system for switchgear as described in IPCC 2006 as “hybrid” is approved being a mixture of mass balance and emission rate approaches; see diagrams attached.. *all new equipment and participants will start reporting from 2005 on
*to enable tracing of recovery bydocumentation w/o gap. Information provided to epa / ministry on request *state of art evacuation equipment for any SF6 handling *regular meetings of all parties concerned *CAPIEL labelling on
*Reporting forms are based on UNFCCC-CRF tables and requirements referring to IPCC guidelines *regular meetings of all parties concerned *authorities right to review and verify data mentioned in the
*2005 *achievements2003 comparing 1995: -emission rate manufacture :from 6,1 % down to 1,5 % -emission rate operation high voltage: from 0,9 % down to 0,8 % -emission rate operation medium voltage: from 0,15 % down to 0,1 %
59
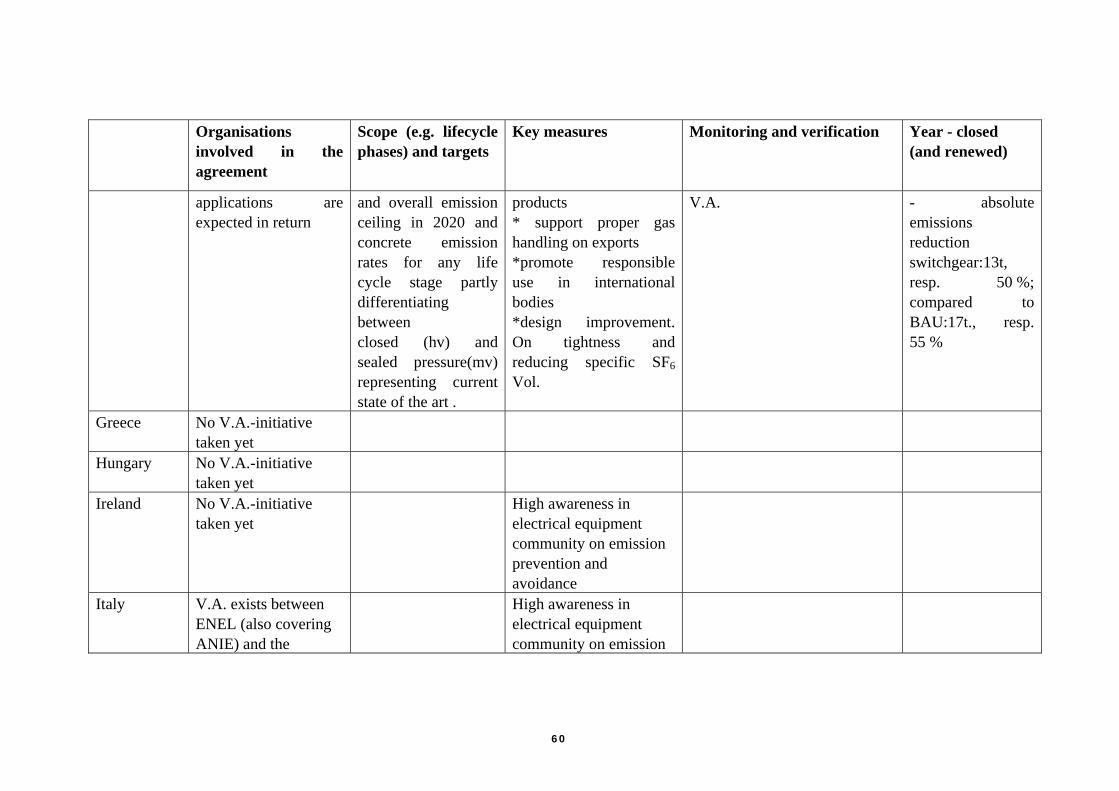
Organisations involved in the agreement
Scope (e.g. lifecycle phases) and targets
Key measures Monitoring and verification Year - closed (and renewed)
applications areexpected in return
and overall emission ceiling in 2020 and concrete emissionrates for any life cycle stage partly differentiating between
products * support proper gas handling on exports
closed (hv) and sealed pressure(mv) representing current state of the art .
*promote responsible use in international bodies *design improvement. On tightness and reducing specific SF6 Vol.
V.A.
- absolute emissions reduction switchgear:13t, resp. 50 %; compared to BAU:17t., resp. 55 %
Greece
No V.A.-initiative taken yet
Hungary
No V.A.-initiative taken yet
Ireland
No V.A.-initiative taken yet
High awareness in electrical equipment community on emission prevention and avoidance
Italy
V.A. exists between ENEL (also covering ANIE) and the
High awareness in electrical equipment community on emission
60
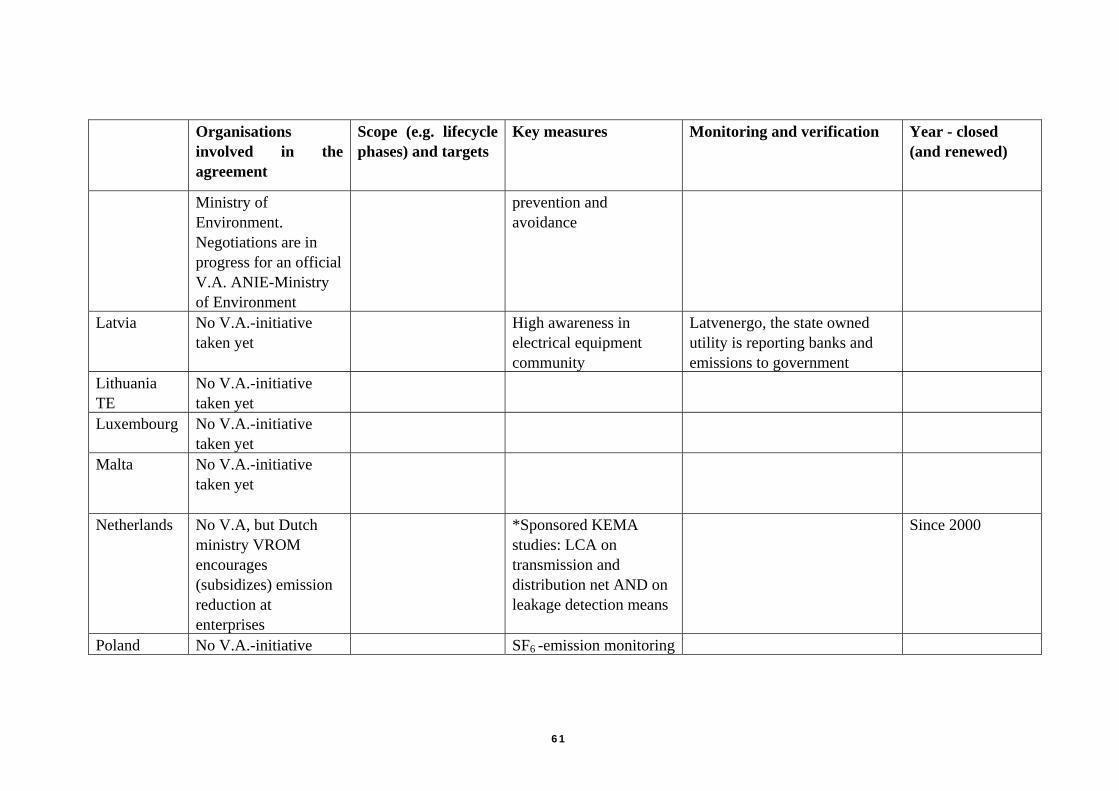
Organisations involved in the agreement
Scope (e.g. lifecycle phases) and targets
Key measures Monitoring and verification Year - closed (and renewed)
Ministry of Environment. Negotiations are in progress for an official V.A. ANIE-Ministry of Environment
prevention and avoidance
Latvia
No V.A.-initiative taken yet
High awareness in electrical equipment community
Latvenergo, the state owned utility is reporting banks and emissions to government
Lithuania TE
No V.A.-initiative taken yet
Luxembourg
No V.A.-initiative taken yet
Malta
No V.A.-initiative taken yet
Netherlands
No V.A, but Dutch ministry VROM encourages (subsidizes) emission reduction at enterprises
*Sponsored KEMAstudies: LCA on transmission and distribution net AND on leakage detection means
Since 2000
Poland No V.A.-initiative SF6 -emission monitoring
61
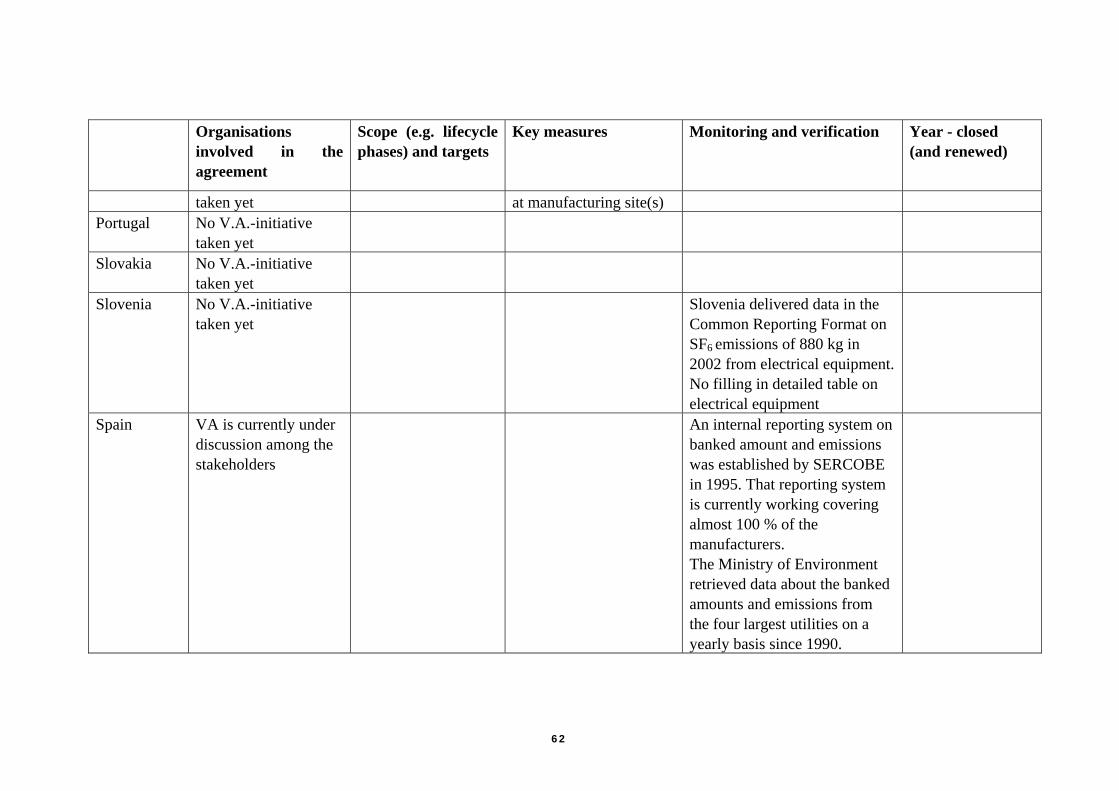
Organisations involved in the agreement
Scope (e.g. lifecycle phases) and targets
Key measures Monitoring and verification Year - closed (and renewed)
taken yet at manufacturing site(s) Portugal
No V.A.-initiative taken yet
Slovakia
No V.A.-initiative taken yet
Slovenia
No V.A.-initiative taken yet
Slovenia delivered data in the Common Reporting Format on SF6 emissions of 880 kg in 2002 from electrical equipment. No filling in detailed table on electrical equipment
Spain
VA is currently under discussion among the stakeholders
An internal reporting system on banked amount and emissions was established by SERCOBE in 1995. That reporting system is currently working covering almost 100 % of the manufacturers. The Ministry of Environment retrieved data about the banked amounts and emissions from the four largest utilities on a yearly basis since 1990.
62
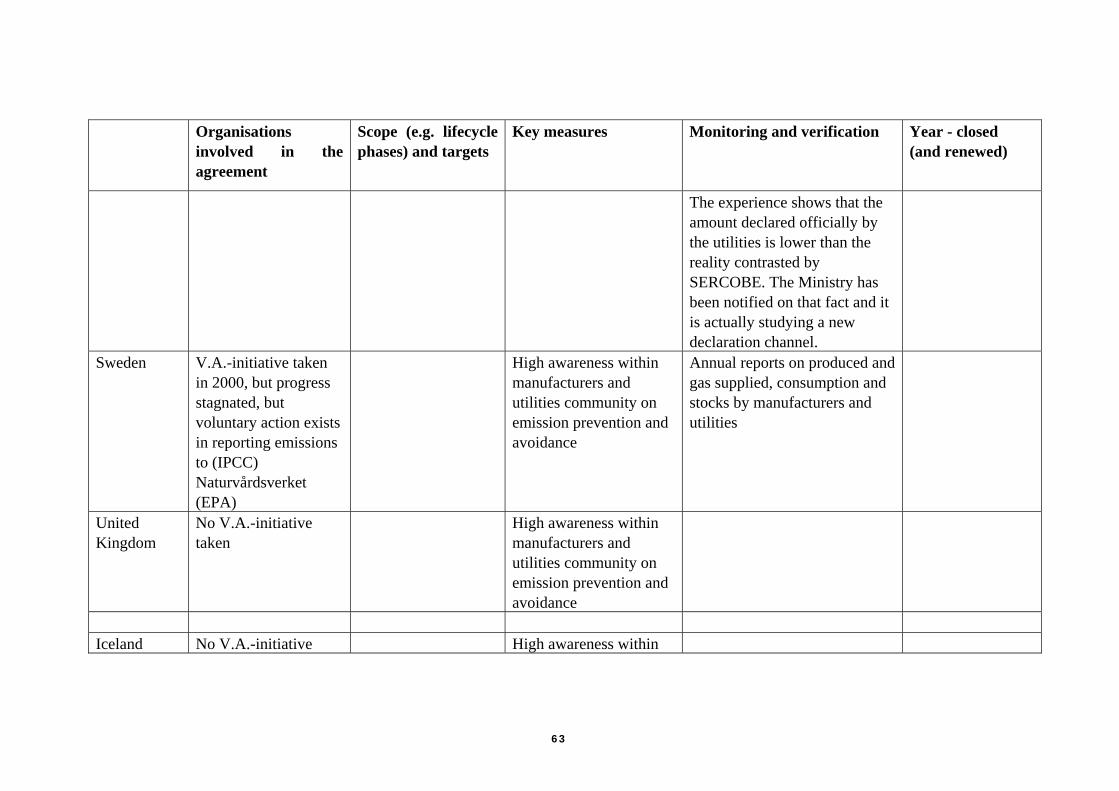
Organisations involved in the agreement
Scope (e.g. lifecycle phases) and targets
Key measures Monitoring and verification Year - closed (and renewed)
The experience shows that the amount declared officially by the utilities is lower than the reality contrasted by SERCOBE. The Ministry has been notified on that fact and it is actually studying a new declaration channel.
Sweden
V.A.-initiative taken in 2000, but progress stagnated, but voluntary action exists in reporting emissions to (IPCC) Naturvårdsverket (EPA)
High awareness within manufacturers and utilities community on emission prevention and avoidance
Annual reports on produced and gas supplied, consumption and stocks by manufacturers and utilities
United Kingdom
No V.A.-initiative taken
High awareness within manufacturers and utilities community on emission prevention and avoidance
Iceland No V.A.-initiative High awareness within
63
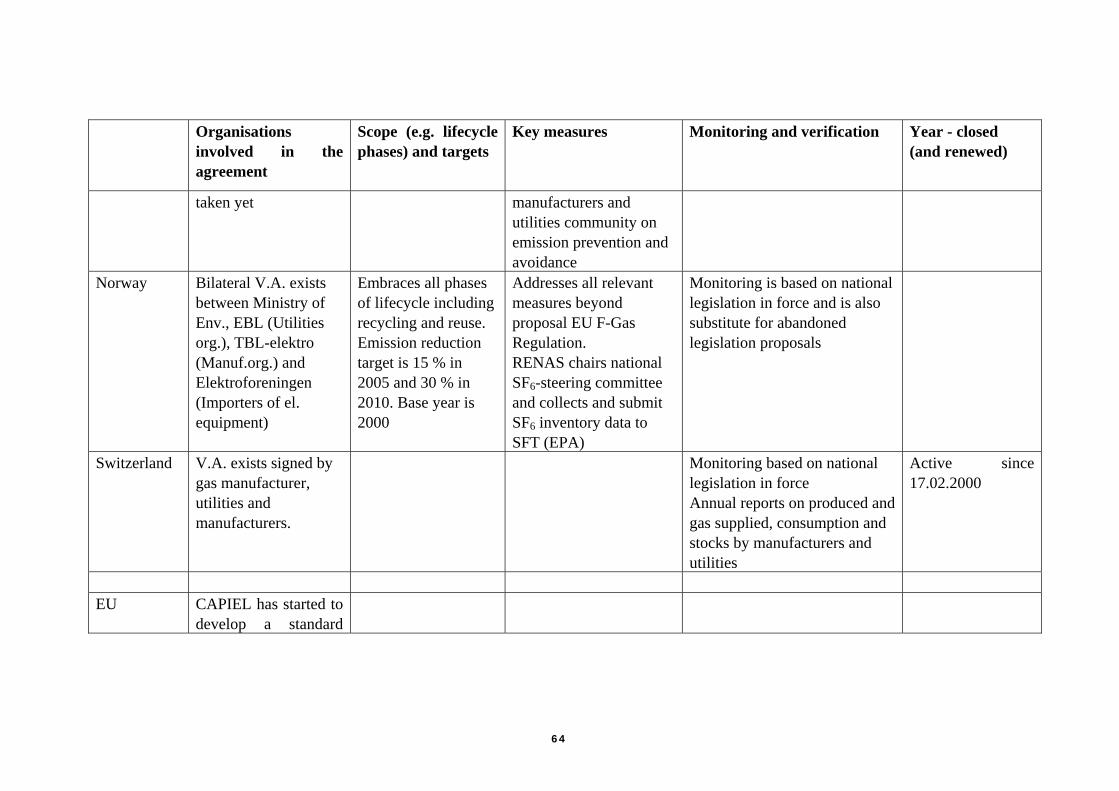
Organisations involved in the agreement
Scope (e.g. lifecycle phases) and targets
Key measures Monitoring and verification Year - closed (and renewed)
taken yet manufacturers and utilities community on emission prevention and avoidance
Norway
Bilateral V.A. exists between Ministry of Env., EBL (Utilities org.), TBL-elektro (Manuf.org.) and Elektroforeningen (Importers of el. equipment)
Embraces all phases of lifecycle including recycling and reuse. Emission reduction target is 15 % in 2005 and 30 % in 2010. Base year is 2000
Addresses all relevant measures beyond proposal EU F-Gas Regulation. RENAS chairs national SF6-steering committee and collects and submit SF6 inventory data to SFT (EPA)
Monitoring is based on national legislation in force and is also substitute for abandoned legislation proposals
Switzerland
V.A. exists signed by gas manufacturer, utilities and manufacturers.
Monitoring based on national legislation in force Annual reports on produced and gas supplied, consumption and stocks by manufacturers and utilities
Active since 17.02.2000
EU
CAPIEL has started to develop a standard
64
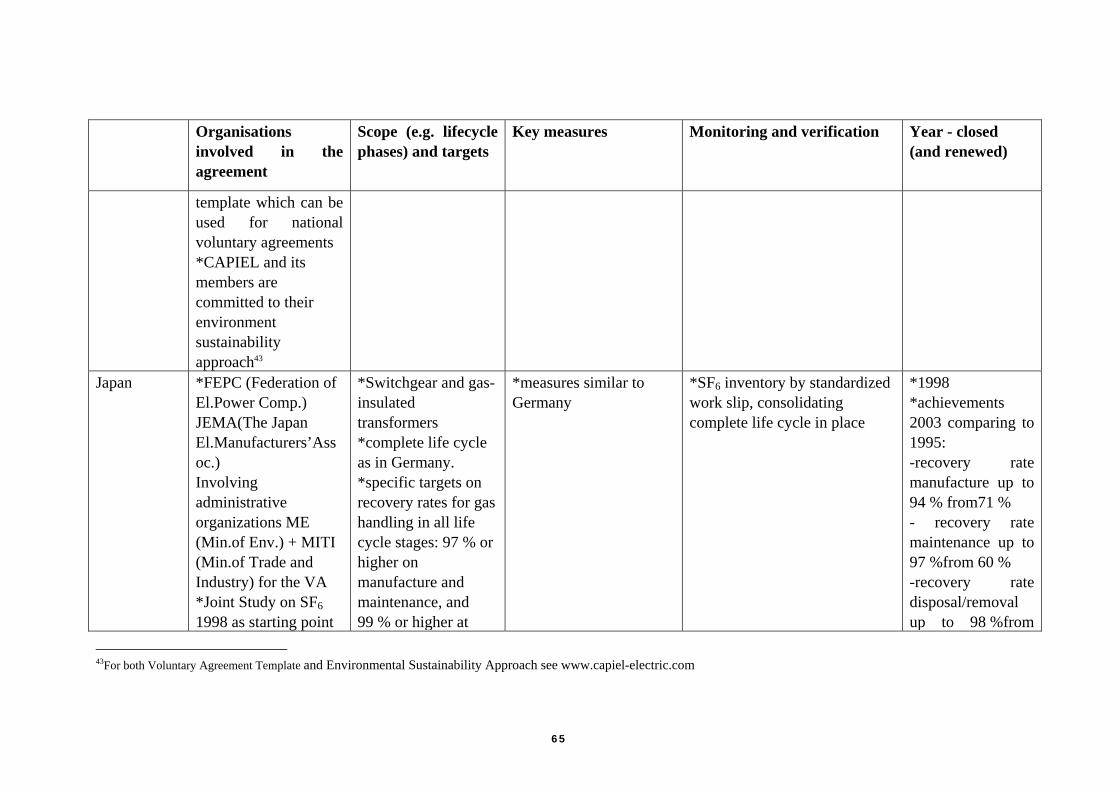
Organisations involved in the agreement
Scope (e.g. lifecycle phases) and targets
Key measures Monitoring and verification Year - closed (and renewed)
template which can be used for national voluntary agreements *CAPIEL and its members are committed to their environment sustainability approach43
Japan
*FEPC (Federation of El.Power Comp.) JEMA(The Japan El.Manufacturers’Assoc.) Involving administrative organizations ME (Min.of Env.) + MITI (Min.of Trade and Industry) for the VA *Joint Study on SF6 1998 as starting point
*Switchgear and gas-insulated transformers *complete life cycle as in Germany. *specific targets on recovery rates for gas handling in all life cycle stages: 97 % or higher on manufacture and maintenance, and 99 % or higher at
*measures similar to Germany
*SF6 inventory by standardized work slip, consolidating complete life cycle in place
*1998 *achievements 2003 comparing to 1995: -recovery rate manufacture up to 94 % from71 % - recovery rate maintenance up to 97 %from 60 % -recovery rate disposal/removal up to 98 %from
43For both Voluntary Agreement Template and Environmental Sustainability Approach see www.capiel-electric.com
65
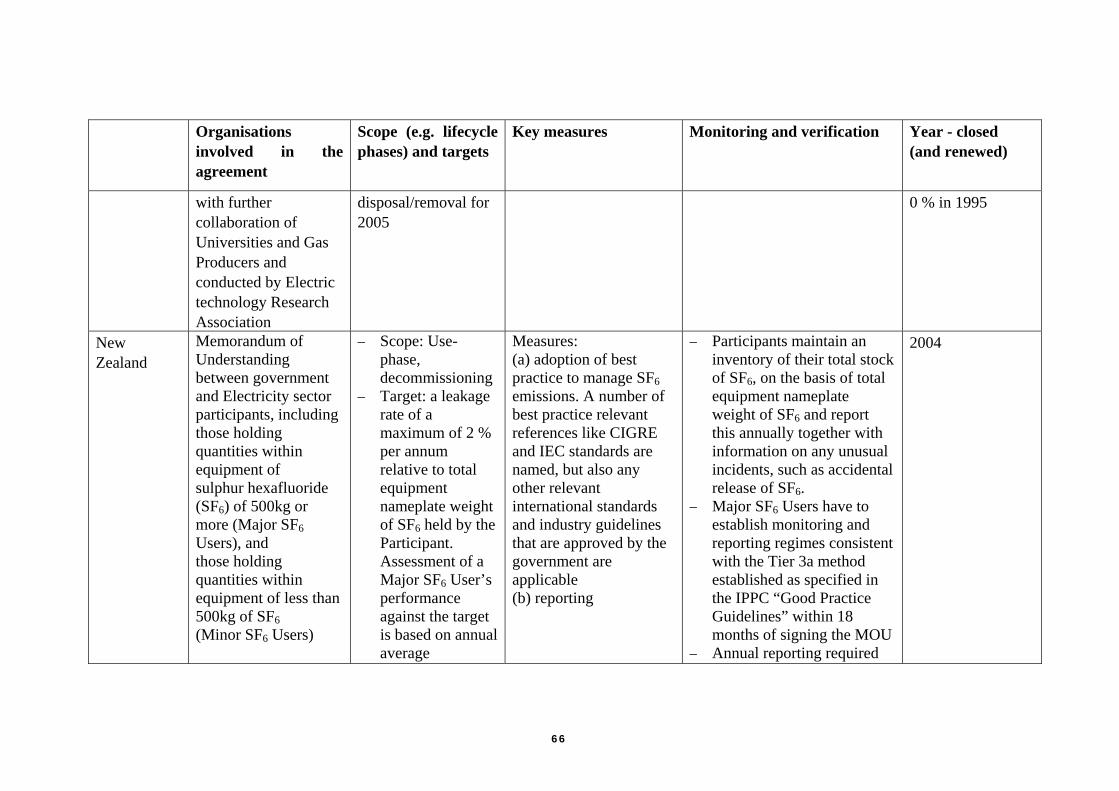
Organisations involved in the agreement
Scope (e.g. lifecycle phases) and targets
Key measures Monitoring and verification Year - closed (and renewed)
with further collaboration of Universities and Gas Producers and conducted by Electric technology Research Association
disposal/removal for 2005
0 % in 1995
New Zealand
Memorandum of Understanding between government and Electricity sector participants, including those holding quantities within equipment of sulphur hexafluoride (SF6) of 500kg or more (Major SF6 Users), and those holding quantities within equipment of less than 500kg of SF6(Minor SF6 Users)
− Scope: Use-phase, decommissioning
− Target: a leakage rate of a maximum of 2 % per annum relative to total equipment nameplate weight of SF6 held by the Participant. Assessment of a Major SF6 User’s performance against the target is based on annual average
Measures: (a) adoption of best practice to manage SF6 emissions. A number of best practice relevant references like CIGRE and IEC standards are named, but also any other relevant international standards and industry guidelines that are approved by the government are applicable (b) reporting
− Participants maintain an inventory of their total stock of SF6, on the basis of total equipment nameplate weight of SF6 and report this annually together with information on any unusual incidents, such as accidental release of SF6. Major SF− 6 Users have to establish monitoring and reporting regimes consistent with the Tier 3a method established as specified in the IPPC “Good Practice Guidelines” within 18 months of signing the MOU Annual reporting required −
2004
66
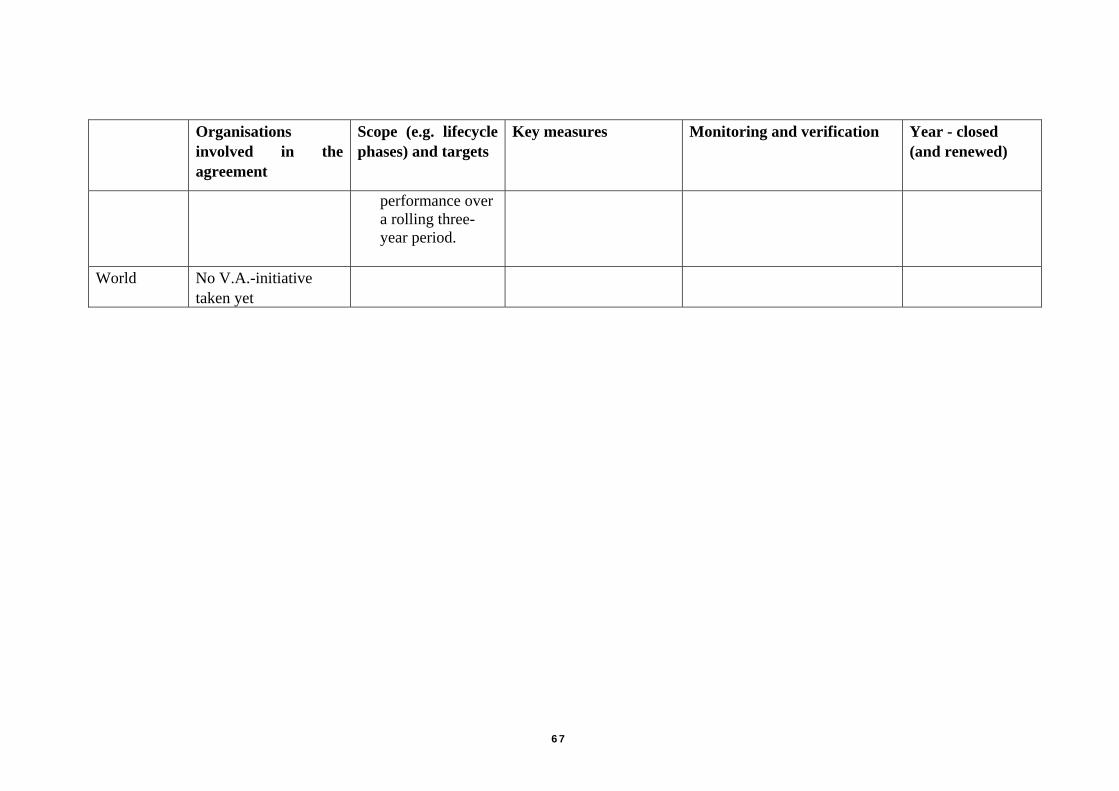
Organisations involved in the agreement
Scope (e.g. lifecycle phases) and targets
Key measures Monitoring and verification Year - closed (and renewed)
performance over a rolling three-year period.
World No V.A.-initiativetaken yet
67