reemployment of older workers - c g a pri study on reemployment of... · programs with an on -the...
TRANSCRIPT

Staff Findings and Recommendations
Reemployment of Older Workers
December 18, 2013
Legislative Program Review
and Investigations Committee Connecticut General Assembly

2013-2014 Committee Members
Senate
John A. Kissel, Co-Chair
John W. Fonfara
Steve Cassano
Eric D. Coleman
Anthony Guglielmo
Joe Markley
House
Mary M. Mushinsky, Co-Chair
Christie M. Carpino
Brian Becker
Marilyn Giuliano
Brenda L. Kupchick
Diana S. Urban
(860) 240-0300
Committee Staff on Project
Miriam P. Kluger, Principal Analyst
Jennifer Proto, Associate Legislative Analyst
Legislative Program Review and Investigations Committee
Connecticut General Assembly
State Capitol Room 506
Hartford, CT 06106
www.cga.ct.gov/pri/index.asp [email protected]

PRI Staff Findings and Recommendations Highlights December 2013
Reemployment of Older Workers
Background
In June 2013, the program review committee authorized a study to examine the challenges facing unemployed older workers (aged 50 and older) and the strategies available to assist with reentry into the workforce.
Although older workers are the least likely to become unemployed, they are also the most likely to experience long-term unemployment (27+ weeks). Once faced with job loss, their continued unemployment is detrimental personally and to the state economy. The problem is further exacerbated by the increased need and desire to continue working and retire at an older age.
Reported advantages of older workers are stronger English language skills, work ethic, and workplace professionalism.
Challenges to reemployment for older workers include skills deficits, and increased family and financial demands such as college age children and mortgage payments. Negative perceptions about the long-term unemployed are also more likely to be faced by the older unemployed.
PRI staff developed a framework and identified occupations that might be a good fit for unemployed older workers, applying CT DOL information to the following factors: estimated annual job openings (demand); current pool of trained candidates (supply); physical activity requirements of the occupation (physicality index); and adequacy of wage (above the self-sufficiency standard).
PRI staff identified and analyzed information on 18 programs and services applicable to the reemployment of older workers. Where available, staff examined program components to address particular barriers to reemployment and program benefits, costs, and outcomes.
Main Staff Findings
There are a multitude of programs and services to assist with the reemployment of unemployed workers, including older workers; however, only a few programs are specifically for older adults. Both the state’s technical high schools and community colleges provide resources to assist in the reemployment of adult workers. Although not limited to unemployed older adults, the more generally targeted programs can still be beneficial.
With programs and services scattered across many labor agencies, educational settings, nonprofit organizations and other resources, there is no comprehensive, easily accessible way for unemployed residents to find out about these resources.
Not all 50+ year olds looking to become reemployed have the same needs, and there are program and service options available depending on the barriers to reemployment. Also, for unemployed older persons struggling emotionally and financially, preparatory assistance to address these barriers is required before the person can become reemployed.
Some programs have higher reemployment rates than others. On average, programs with an on-the-job-training component had a higher reemployment rate of 74 percent compared with 50 percent for programs without the component.
PRI Staff Recommendations
Prohibit potential employers from publishing job vacancy advertisements that discriminate against the long-term unemployed.
Develop summary sheets and informational campaigns to inform job seekers of the resources available, address misperceptions about the Apprenticeship Program, and publicize the advantages of hiring older workers.
The CTWorks Career Centers should consider requirement of a professional resume writer credential and expansion of online learning. With some modifications, the STEP UP program should be reauthorized.
Non-credit vocational programs should be defined, outcomes uniformly monitored, and financial options for students explored.
The feasibility of expanding the Plus 50 Initiative to all community colleges, and the Advanced Manufacturing Center model to other high-demand career areas, should be explored.
The CT Technical High School System should collect and report outcome information on adult students enrolled in vocational programs.
Legislative Program Review and Investigations Committee Staff Office
State Capitol * 210 Capitol Avenue * Room 506 * Hartford, CT 06106-1591 P: (860) 240-0300 * F: (860) 240-0327 * E-mail: [email protected]

Acronyms
AACC American Association of Community Colleges
ACC Asnuntuck Community College
BOR Board of Regents for Higher Education
CAD Computer Aided Design
CCSU Central Connecticut State University
CETC Connecticut Employment and Training Commission
CHRO Commission on Human Rights and Opportunities
CMM Coordinate Measuring Machine
CNC Computer Numeric Control
CPS Current Population Survey (Census)
CTDOL Connecticut Department of Labor
CTHSS Connecticut Technical High School System
CTWBS Connecticut Works Business System (management information system)
EWIB Eastern Workforce Investment Board
FIRST Focused, Intensive, Reemployment Success Training Program
HCC Housatonic Community College
HVAC Heating, Ventilating and Air Conditioning
ICF International Coach Federation
ITA Individual Training Account
ITBD Institute of Technology and Business Development
JETS Jewish Employment Transition Services
JFS Jewish Family Services
NEG National Emergency Grant
NhN Neighbors-helping-Neighbors
NVCC Naugatuck Valley Community College
OJT On-The-Job Training
O*NET Occupational Information Network
OWC Office of Workforce Competitiveness
P2E Platform to Employment
QVCC Quinnebaug Valley Community College
SCSEP Senior Community Service Employment Program
STEP UP Subsidized Training and Employment Program
TEC Technical Education Center
TEPS Training and Education Planning System
WIA Workforce Investment Act
WIB Workforce Investment Board
YNHH Yale-New Haven Hospital
Table of Contents
REEMPLOYMENT OF OLDER WORKERS
PRI Report Highlights
List of Acronyms Used in Report
Executive Summary………………………………………………………………………..…i
Introduction …………………….……………………….…….……………………..……....1
I. Descriptive Information and Job Opportunities for Unemployed Older Workers ..5
II. Barriers to Reemployment for Older Workers ..........................................................11
III. Assessment of Labor Programs to Promote the Reemployment of
Older Workers ..............................................................................................................25
Overview of Connecticut Labor Employment and Training System…………………..25
CTWorks Career Centers (One-Stops)……………… ...................................................30
General Core One-Stop Services ..............................................................................31
Intensive Services for WIA Dislocated Workers ......................................................34
FIRST Program .........................................................................................................40
Online Learning Services ..........................................................................................43
STEP UP Program……………………………………………………………………...47
Apprenticeship Program………………………………………………………………..53
IV. Department on Aging: Senior Community Service Employment
Program (SCSEP) .........................................................................................................61
V. Evaluation of Higher Education Assistance to Target Population ...........................67
Overview of Community College System……………………………………………...67
Manufacturing Technology Centers …………………………………………………...69
Plus 50 Initiative ……………………………………………………………………...73
Encore!Hartford ……………………………………………………………………...77
Advanced Leadership Training Program ……………………………………………...79
VI. Potential Use of Technical High Schools as a Resource for Older
Worker Retraining........................................................................................................83
VII. Alternatives to Public Sector Programs ......................................................................89
AARP ………………………………………………………………………………….89
Platform to Employment (P2E)………………………………………………………...92
Jewish Employment Transition Services (JETS)………………………………………98

Neighbors-Helping-Neighbors (NHN)…………………………………………………103
Career Coaches …………………………………………………………………………104
Temporary Employment Agencies ……………………………………………………..107
VIII. Programs and Services Findings and Conclusions ………………………………...111
APPENDICES
A. Defining the Problem
B. Job Loss in the Great Recession and Opportunities in the Recovery

Program Review and Investigations Committee Staff Findings and Recommendations: December 18, 2013
i
Executive Summary
Reemployment of Older Workers
Since the beginning of the Great Recession in late 2007, the number of older workers
(ages 50 and older) experiencing long-term unemployment has increased significantly. More
than half (53 percent) of unemployed workers ages 50 and older nationally have been out of
work for longer than six months—a higher percentage than any other age group. Job loss for
older workers has a deleterious impact on health, finances, and general well-being.
In June 2013, the PRI committee authorized a study of the Reemployment of Older
Workers. The purpose of the study was to examine the challenges facing older unemployed
workers, including barriers to reemployment such as competing demands to have an income
while completing needed job-related training. In addition to describing the older workers,
workforce shortage areas that aligned with this target population were to be identified. Although
the focus of this study was on the needs of the unemployed ages 50 and older, many of the
findings and recommendations apply to all unemployed, regardless of age.
Programs and services within the Connecticut Departments of Labor and Aging, and
Workforce Investment Boards were assessed for their ability to meet the needs of unemployed
older workers. The role of the state’s community colleges in assisting this target population was
also to be evaluated, along with the potential use of the state’s technical high schools as a
resource for unemployed older adults. Lastly, best practices or model programs used successfully
for the reemployment of older workers were to also be identified.
BARRIERS TO REEMPLOYMENT
Unemployed older workers may face a host of barriers to reemployment. Some face skill-
set deficits, with out-of-date skills particularly for those with a high school education or less,
some of whom may have been working in manufacturing for many years, doing the same job.
For many older workers, it may have been 20 or 30 years since they last looked for a job, and the
landscape has changed; these lack of current job search skills create another barrier to
reemployment. This new long-term unemployment experience has a deleterious effect on the
older workers immediate financial situation, and physical and mental health, areas that need to
be addressed before searching for employment.
Some employers have negative stereotypes about older workers, such as believing they
would be less productive and more expensive employees. In addition to some of the challenges
unique to the older unemployed, there are also negative perceptions about the long-term
unemployed, a category that many older unemployed fall into. Employers may think those
currently employed have a stronger work ethic than the unemployed.

Program Review and Investigations Committee Staff Findings and Recommendations: December 18, 2013
ii
RESOURCES AVAILABLE
In examining the resources available to overcome barriers to the reemployment of older
workers, PRI staff found there are a multitude of programs to assist with the reemployment of
unemployed workers, including older workers. PRI examined 18 programs and other alternatives
available in the areas of labor, education, and other resources. Both the state’s technical high
schools and state community colleges, as well as a state college, and University of Connecticut,
provide resources to assist in the reemployment of adult workers. Staff also found a number of
programs had waiting lists, meaning demand exceeded capacity.
Only a few programs are specifically designed for older adults. For the most part, this
lack of programs specifically for the older unemployed is not a major barrier to reemployment
because, regardless of age, there are often similarities in the needs of the unemployed. Thus,
more generally targeted programs can still be beneficial to older adults. Some programs, while
not specifically limited to a certain age, have significant proportions of participants aged 50 and
over, such as the JETS program, FIRST program, and P2E.
Not all 50+ year olds looking to become reemployed have the same needs and there are
options available depending on their circumstances. There are various programs that have the
potential for participants to earn income while enrolled in the program or service (e.g., STEP UP,
Apprenticeship Program), and others that are targeted to certain unemployed populations (e.g.,
career professionals, those impacted by facility closure).
In examining the 18 programs and services as part of this study, PRI staff identified
several possible program components:
Assessment of job skills and/or interests
Online training
Support group or job club
On-the-job training (paid)
Workshops and other classroom training related to job search skills
Workshops and other classroom training related to job skills
Some programs are more comprehensive than others, containing many components and
addressing many barriers to reemployment (i.e., P2E program). As underscored by the P2E
program, for unemployed older persons struggling emotionally and financially, preparatory
assistance to address these barriers is required before the person can become reemployed.
Depending on the individual’s barriers to reemployment, there are options available to
address the older adult’s needs better than others. Also, a barrier to reemployment may be
addressed in multiple ways. Education and training, for example, may occur via on-the-job
training, online, at a technical high school, community college, state university, or workshop at
CTWorks Career Centers.
There were many challenges in examining program outcomes such as tracking
employment placement, wage information, and retention after participants exited the program.

Program Review and Investigations Committee Staff Findings and Recommendations: December 18, 2013
iii
Due to lack of resources, several non-government programs relied on participant self-reporting,
and as a result, had estimates rather than exact statistics available. Also, some programs serve
older workers with more barriers to reemployment (e.g., SCSEP). With these caveats in mind,
programs with on-the-job components were associated with higher reemployment rates. On
average, programs with an OJT component had an average reemployment rate outcome of 74
percent compared with 50 percent for the programs without the component.
RECOMMENDATIONS
Based on this review of programs and services to address barriers to reemployment for
older workers, program review committee staff makes 16 recommendations:
(1) The Connecticut Employment and Training Commission (CETC) shall
coordinate a web-based state hiring campaign for older workers to be housed within
the Department of Labor’s website. CETC is encouraged to utilize relevant national
and state stakeholders to assist in this initiative and incorporate “success stories”
from employers hiring and retaining older workers. CETC shall report on the
progress of this initiative to the legislative committee with cognizance of workforce
development by January 1, 2015.
(2) Potential employers shall be prohibited from publishing, in print or on the Internet, an
advertisement for a job vacancy that: (1) lists current employment as a required
qualification, (2) states unemployed candidates will not be considered, or (3) states only
employed candidates will be considered.
(3) The Connecticut Department of Labor should develop a one-page quick reference sheet
with a summary of available public and private resources for the older unemployed to find
out what programs and services are available to help with their reemployment.
(4) The United Way of Connecticut 2-1-1 should use the Connecticut Department of Labor
developed one-page quick reference sheet with a summary of available resources for the
older unemployed caller or visitor to the website, to find out what programs and services
are available to help with their reemployment.
(5) The Apprenticeship Program should develop an informational campaign targeted to
Workforce Investment Board and One-Stop Career Center staff to reduce misperceptions
about the Apprenticeship Program and encourage apprenticeship opportunities.
(6) The Connecticut Department of Labor and Workforce Investment Boards should form
a workgroup to consider requirement of a professional résumé writer credential for those
providing résumé writing assistance at the CTWorks Career Centers.
(7) The use of online learning at the CTWorks Career Centers should be expanded and
considered a resource available to any unemployed Connecticut resident, within available
funding constraints.
(8) The STEP UP program shall be reauthorized for FY 15 and FY 16.

Program Review and Investigations Committee Staff Findings and Recommendations: December 18, 2013
iv
(9) The requirement for STEP UP Small Business Wage Subsidy Program participants to
reside in a municipality with a higher than average unemployment rate, or which has a
population of 80,000 or more, shall be eliminated.
(10) The STEP UP Small Business Wage Subsidy Program and the STEP UP Small
Manufacturer Training Grant Program shall be merged into a single program.
Requirements for the two programs shall remain in place, and funding combined for the
two STEP UP programs.
(11) The Board of Regents shall conduct a feasibility study to examine the potential for
expanding the Advanced Manufacturing Center model to create centers of excellence for
other high-demand career areas. The results of this study shall be reported to the
legislative committee with cognizance of higher education no later than January 1, 2015.
(12) The Plus 50 Initiative model shall be expanded to all Connecticut Community
Colleges.
(13) The Board of Regents of Higher Education shall establish a shared definition for what
constitutes a non-credit vocational “program” and record this information in its
information systems.
The Board of Regents shall require all institutions of the Connecticut State Colleges &
Universities system to collect and report the following information on non-credit vocational
programs: 1) course and program enrollment and completion; 2) participant information,
including age and Social Security Numbers for subsequent tracking; 3) employment status,
retention, and wages prior to and after participation.
(14) The Board of Regents of Higher Education shall explore financial options for students
of non-credit vocational courses and programs. Examples might include low interest loans
which would be paid back upon employment and a sliding scale dependent on income. The
results of its findings shall be reported to the legislative committee with cognizance of
higher education no later than January 1, 2015.
(15) The Connecticut Technical High School System shall collect and report the following
information on adult students enrolled in vocational programs: 1) course and program
enrollment and completion; 2) participant information, including age and Social Security
Numbers for subsequent tracking; 3) employment status, retention, and wages prior to and
after participation for completers as well as non-completers.
(16) CETC should consider inclusion of the reemployment of older workers as part
of its strategic planning process.

Program Review and Investigations Committee Staff Findings and Recommendations: December 18, 2013
1
Introduction
Reemployment of Older Workers
Since the beginning of the Great Recession in late 2007, the number of older workers
(ages 50 and older) experiencing long-term unemployment has increased significantly. More
than half (53 percent) of unemployed workers ages 50 and older nationally have been out of
work for longer than six months—a higher percentage than any other age group. Job loss for
older workers has a deleterious impact on health, finances, and general well-being.
SCOPE OF STUDY
In June 2013, the PRI committee authorized a study of the Reemployment of Older
Workers. The purpose of the study was to examine the challenges facing older unemployed
workers (ages 50 and older), including barriers to reemployment such as competing demands to
have an income while completing needed job-related training. In addition to describing the
population of older workers, workforce shortage areas that aligned with this target population
were to be identified.
Programs and services within the Connecticut Departments of Labor and Aging, and
Workforce Investment Boards were assessed for their ability to meet the needs of unemployed
older workers. The role of the state’s community colleges in assisting this target population was
also to be evaluated, along with the potential use of the state’s technical high schools as a
resource for unemployed older adults. Lastly, best practices or model programs used successfully
for the reemployment of older workers were to also be identified.
METHODOLOGY
PRI committee staff collected and analyzed information from more than 30 interviews
and visits to programs and other alternative resources available to assist in the reemployment of
older workers. The sources of data used to develop the findings and recommendations are now
described.
Interviews
Labor related. PRI staff interviewed personnel from the Connecticut Department of
Labor: Office of Research; Performance and Accountability Unit; Workforce Investment Act
(WIA) Unit; and North Central WIB Regional Job Center Director. Staff also met with personnel
from the Office of Workforce Competitiveness, and the Office of Apprenticeship Training.
Interviews were conducted at the workforce investment boards (WIBs), including tours of
CTWorks Career Centers (one-stops), within each of the five regions: the north central WIB,
Capital Workforce Partners (Hartford and Enfield one-stops); the eastern WIB, EWIB (New
London one-stop); the northwest WIB, NRWIB (Waterbury one-stop); the south central WIB,
Workforce Alliance (New Haven one-stop); the southwestern WIB, The WorkPlace (Bridgeport
one-stop).

Program Review and Investigations Committee Staff Findings and Recommendations: December 18, 2013
2
Members of the Commission on Aging were interviewed as were staff from the State
Department on Aging overseeing the Senior Community Service Employment Program
(SCSEP). Also, two Connecticut Employment and Training Commission (CETC) meetings were
attended.
Education related. PRI staff conducted interviews with personnel from the American
Association of Community Colleges, the Board of Regents of Higher Education, and the
Asnuntuck Community College Manufacturing Technology Center.
Personnel from the University of Connecticut’s Encore!Hartford program were
interviewed, as was the Advanced Leadership Training program housed within the Central
Connecticut State University Institute of Technology and Business Development.
A number of Connecticut Technical High Schools were visited and personnel interviewed
at: central office, Bristol TEC, Platt Tech (Milford), Prince Tech (Hartford), and Vinal Tech
(Middletown).
Alternatives to public sector programs. PRI staff attended two workshops of the
Jewish Employment Transition Services (JETS) program and interviewed several people
associated with the program. Staff also interviewed Platform to Employment (P2E) program
personnel, and observed a focus group of primarily older adults in Bridgeport who were new to
the P2E program.
The Hartford Foundation for Public Giving is funding a planning grant to examine the
challenges people over age 50 face in becoming reemployed. PRI staff observed two focus
groups of older unemployed adults, and one focus group of employers held in the Greater
Hartford area as part of this planning grant. PRI also met with AARP Connecticut personnel, and
observed a focus group of AARP members looking to become reemployed.
PRI staff interviewed the founder and director of the Neighbors Helping Neighbors
program. Additionally, two career coaches were interviewed, and staff met with personnel from a
temporary employment agency. Staff also visited and interviewed personnel at Yale-New Haven
Hospital, the only in-state employer to be honored by AARP national in FY 13 as one of the Best
Employers for Workers over 50.
Literature research
Information relating to the reemployment of older workers was obtained from articles,
books, websites, and blogs.
Public hearing
Testimony was received at the October 3, 2013 PRI Committee public hearing held in
Hartford on the reemployment of older workers study.
Program Review and Investigations Committee Staff Findings and Recommendations: December 18, 2013
3
Data development and analysis
National census data was examined as was Connecticut Labor Market Information. The
CTDOL Office of Research provided requested data sets, ranging from demographic information
on exhaustees of unemployment insurance benefits, to usage and employment outcome data for
specific programs broken out by age. The Office of Apprenticeship Training prepared summary
information on apprentices and apprenticeship sponsors that was analyzed as part of this study.
Staff also worked with the WIBs to develop statistics on the FIRST program and Metrix
Online Learning program. The Manufacturing Technology Centers also developed information
for the reemployment of older workers study.
Staff met and worked with the State Department on Aging to develop detailed
information for the SCSEP program analysis. Similarly, JETS program personnel provided
outcome information and survey results to PRI staff.
Lastly, the legislative Offices of Legislative Research and Fiscal Analysis provided
information to PRI regarding the Connecticut labor system, and budgetary and expenditure
information related to particular programs.
STUDY LIMITATIONS
There were several limitations encountered during the course of this study. First, there is
no standard definition for older workers, with various age ranges used. Often, agency programs
do not analyze or maintain information on participant age, making it challenging to identify
outcomes specifically for older adults. Further, “older workers” is not a monolithic category, and
other than age, one with a wide variation of characteristics.
Most programs available to assist the unemployed in finding jobs do not have age limits.
In the current study, just a handful was specifically designed for older adults. Also several of the
programs examined were non-government, voluntary, grass-roots, community-based efforts
initiated by private organizations or foundations. Unlike many of the government-funded
programs, there were often estimates, but not exact statistics available, on participant
demographics and outcome data.
REPORT ORGANIZATION
This report is organized into eight chapters. Chapter I sets the stage for the study,
providing descriptive information and job opportunities for unemployed older workers. Chapter
II describes the barriers to reemployment for older adults. The programs and services to promote
the reemployment of older workers are assessed in Chapters III-VII. Each chapter focuses on a
particular category of program or service including Labor (Chapter III), Aging (Chapter IV),
Higher Education (Chapter V), Technical High Schools (Chapter VI), and Alternatives to Public
Sector Programs (Chapter VII). Chapter VIII concludes with an analysis of all the programs and
services, particularly as they address barriers to reemployment and employment outcomes for
older workers. The recommendations are contained at the end of the chapter.

This Page Intentionally Left Blank

Program Review and Investigations Committee Staff Findings and Recommendations: December 18, 2013
5
Chapter I
Descriptive Information and Job Opportunities for Unemployed Older
Workers
NATIONAL
Compared with previous economic downturns, the higher proportion, and duration of,
unemployment in the Great Recession and its recovery period has been significant. As of 2011,
workers age 50 and older made up 32 percent of the national labor force, yet had a long-term
unemployment rate (52 weeks or longer) of 41.6 percent.
With the lowest overall unemployment rate by age, 50+ workers are the least likely to be
unemployed; however, as Figure I-1 demonstrates, once older workers lose their jobs they are the
most likely age group to remain out of work for a year or longer. Appendix A provides a more
in-depth description on the target population.
Figure I-1 - Long-Term Unemployment: Before & After the Great Recession
CONNECTICUT
As of October 2013, the Connecticut labor force was estimated at 1,853,800, of which a
total of 147,100 were unemployed for an overall unemployment rate of 7.9 percent, compared to
the national rate of 7.3 percent.1 For 2013 Connecticut’s 50+ labor force is estimated at 662,849
(35.8 percent of the state workforce), of which 42,198 were unemployed (28.7 percent of the
state unemployed). Initial claims of regular unemployment by the 50+ population peaked in the
1 Seasonally adjusted. CT Department of Labor – Labor Force Data for the State of Connecticut & United States
(LAUS)

Program Review and Investigations Committee Staff Findings and Recommendations: December 18, 2013
6
first quarter of 2009, with Connecticut 50+ unemployed workers filing 27,076 claims (38 percent
of total claims for all age groups). From the last quarter of 2007 to the third quarter of 2013, the
state’s 50+ unemployed workers made up an average of 36.2 percent of total initial claims across
all age groups.
OLDER WORKER LABOR CHARACTERISTICS
Following national trends as well as fallout from the Great Recession, many workers now
expect to work longer before retirement than originally anticipated, two-thirds (67%) of whom
indicate they need to rebuild retirement savings. Connecticut is among the nation’s leading
states in the percentage of seniors (65 years and older) still in the workforce. As of 2011, the
overall percentage of women seniors in the workforce in Connecticut was 14.7% in 2011 and the
overall percentage of male seniors in the workforce is 23.8 percent.2 Connecticut’s highly
educated workforce, including its older workers, may play a role in this longevity, as workers
with better educational credentials tend to work longer, have higher median earnings, and lower
rates of unemployment as compared to their less educated counterparts (Figure I-2).3
3
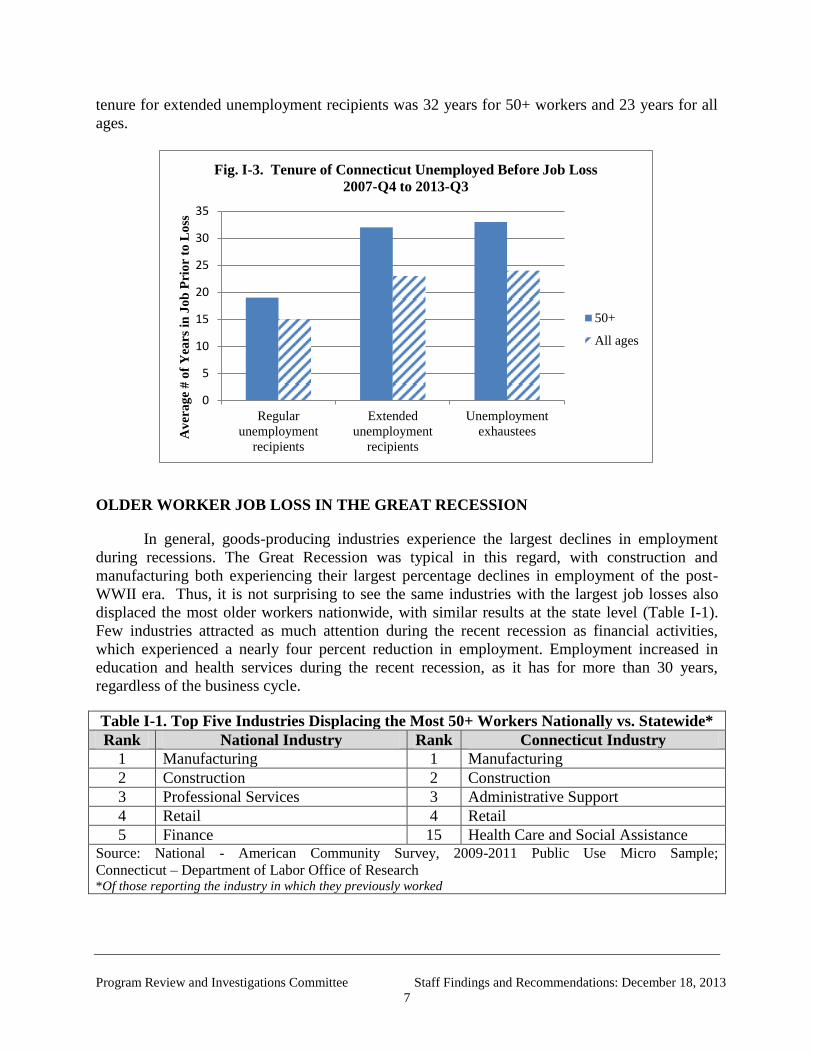
Not surprisingly, Connecticut’s older unemployed workers had longer tenure before their
job loss. From the fourth quarter of 2007 to the third quarter of 2013 average tenure for regular
unemployment recipients was 19 years for 50+ workers and 15 years for all ages.4 Interestingly,
longer job tenure appears to be indicative of longer durations of unemployment, as the average
2 http://www.bloomberg.com/visual-data/best-and-worst/most-male-seniors-at-work-states Accessed on November
1, 2013. 3 Source: Current Population Survey (CPS). 2013 data based on 12 months (Sept. 2012 through Aug. 2013).
Calculations by Connecticut Department of Labor - October 28, 2013 4 CT Department of Labor – Office of Research
Less than
H.S. diploma
H.S.
Diploma or
GED
Some
college or
Associate's
Bachelor's
degree or
more
50+ unemployed 3,984 13,308 12,146 12,760
50+ employed 31,287 167,283 150,079 272,002
0
50,000
100,000
150,000
200,000
250,000
300,000
Figure I-2. Connecticut's 50+ Labor Force by Education Level
2013
12.7%
8.0% 8.1%
4.7%
Program Review and Investigations Committee Staff Findings and Recommendations: December 18, 2013
7
tenure for extended unemployment recipients was 32 years for 50+ workers and 23 years for all
ages.
OLDER WORKER JOB LOSS IN THE GREAT RECESSION
In general, goods-producing industries experience the largest declines in employment
during recessions. The Great Recession was typical in this regard, with construction and
manufacturing both experiencing their largest percentage declines in employment of the post-
WWII era. Thus, it is not surprising to see the same industries with the largest job losses also
displaced the most older workers nationwide, with similar results at the state level (Table I-1).
Few industries attracted as much attention during the recent recession as financial activities,
which experienced a nearly four percent reduction in employment. Employment increased in
education and health services during the recent recession, as it has for more than 30 years,
regardless of the business cycle.
Table I-1. Top Five Industries Displacing the Most 50+ Workers Nationally vs. Statewide*
Rank National Industry Rank Connecticut Industry
1 Manufacturing 1 Manufacturing
2 Construction 2 Construction
3 Professional Services 3 Administrative Support
4 Retail 4 Retail
5 Finance 15 Health Care and Social Assistance Source: National - American Community Survey, 2009-2011 Public Use Micro Sample;
Connecticut – Department of Labor Office of Research *Of those reporting the industry in which they previously worked
0
5
10
15
20
25
30
35
Regular
unemployment
recipients
Extended
unemployment
recipients
Unemployment
exhausteesAv
era
ge
# o
f Y
ears
in
Jo
b P
rio
r to
Lo
ss
Fig. I-3. Tenure of Connecticut Unemployed Before Job Loss
2007-Q4 to 2013-Q3
50+
All ages

Program Review and Investigations Committee Staff Findings and Recommendations: December 18, 2013
8
ISSUES WITH ALIGNMENT
Matching persons who are unemployed and the skills they possess with industry and
occupational fields with openings is an ongoing challenge, particularly for older workers. While
the projected numbers of job openings is an important factor in determining demand, it is
ultimately a best guess, and has not been very accurate in the past. Assuming projections are
somewhat close, employers within the same industry may respond to filling the demand with a
range of hiring decisions – some choosing highly skilled workers, others choosing lower skilled
workers.
Even assuming relative accuracy between projected workforce demands and actual job
openings, supply cannot be created overnight. The average turnaround time for new graduates
(two years for an Associate’s degree, four years for a Bachelor’s) can result in supply being out
of sync with current demands, particularly in fields involving rapidly changing technologies.
Thus, older workers must consider the possibility that investment in education or training may
not result in reemployment. With this risk in mind, potential job opportunities at the national as
well as state level are provided in Appendix B because they are currently projected to be in-
demand and/or may be suitable for the older worker population.
JOB OPPORTUNITIES IN THE RECOVERY
Since 2006, Manpower Group has surveyed more than 1,000 U.S. employers during the
first quarter of each year as part of its annual Talent Shortage Survey. According to its 2013
survey, 39 percent of U.S. employers are having difficulty finding staff with the right skills,
down from 49 percent in 2012 (Figure I-4).
40%
26%
55%
54%
44%
48%
33%
32%
27%
24%
Lack of technical competencies (hard
skills)
Lack of workplace competencies (soft
skills)
Lack of available applicants/no applicants
Looking for more pay than is offered
Lack of experience
Figure I-4. Reasons U.S. Employers Cite Regarding
Difficulty Filling Jobs
2013 2012
Program Review and Investigations Committee Staff Findings and Recommendations: December 18, 2013
9
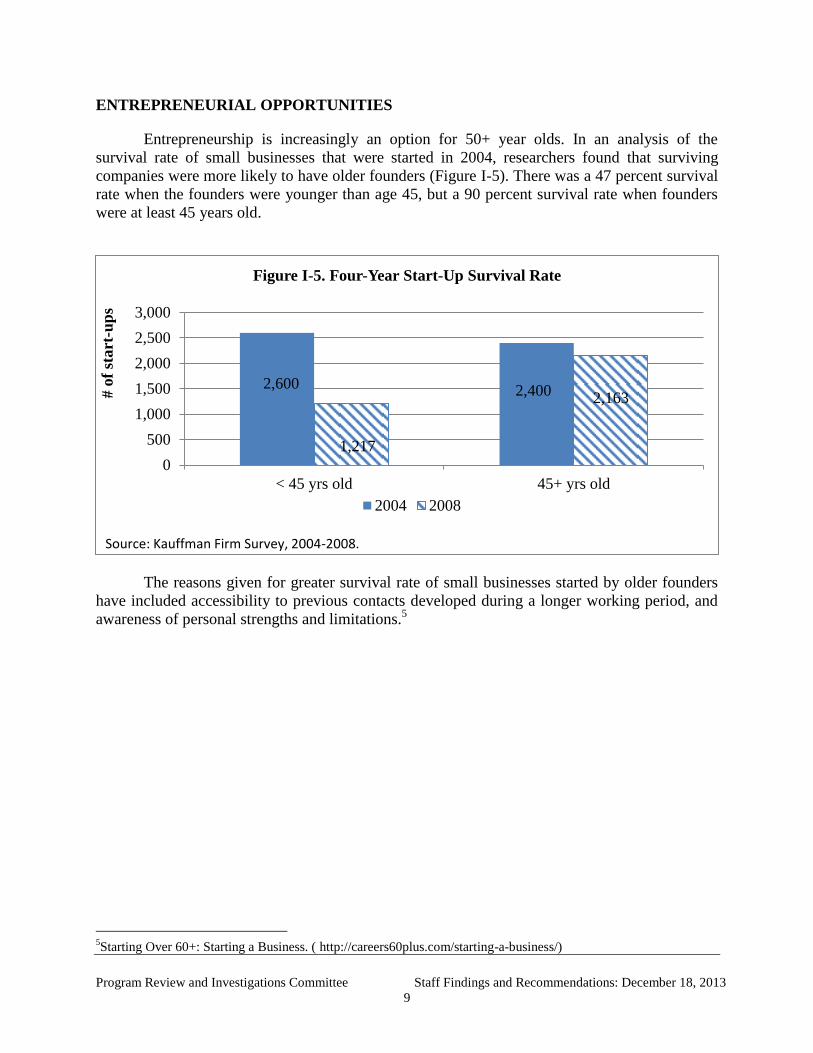
ENTREPRENEURIAL OPPORTUNITIES
Entrepreneurship is increasingly an option for 50+ year olds. In an analysis of the
survival rate of small businesses that were started in 2004, researchers found that surviving
companies were more likely to have older founders (Figure I-5). There was a 47 percent survival
rate when the founders were younger than age 45, but a 90 percent survival rate when founders
were at least 45 years old.
The reasons given for greater survival rate of small businesses started by older founders
have included accessibility to previous contacts developed during a longer working period, and
awareness of personal strengths and limitations.5
5Starting Over 60+: Starting a Business. ( http://careers60plus.com/starting-a-business/)
2,600 2,400
1,217
2,163
0
500
1,000
1,500
2,000
2,500
3,000
< 45 yrs old 45+ yrs old
# o
f st
art
-up
s
Figure I-5. Four-Year Start-Up Survival Rate
2004 2008
Source: Kauffman Firm Survey, 2004-2008.

Program Review and Investigations Committee Staff Findings and Recommendations: December 18, 2013
10
The Page Intentionally Left Blank

Program Review and Investigations Committee Staff Findings and Recommendations: December 18, 2013
11
Chapter II
Barriers to Reemployment for Older Workers
This chapter describes the possible barriers to reemployment faced by older workers.
Barriers range from skill-set deficits to perceptual challenges faced by this population.
SKILL-SET DEFICITS
Older workers are sometimes viewed as having out-of-date skills. In a 2009 survey by
MetLife of over 1,200 55-70 year olds, they found that just 27 percent of those seeking work
reported pursuing additional skills or training to improve their future job prospects.6 This was
especially so for those with a high school education or less, some of whom may have been
working in manufacturing for a long time, doing the same job. It is also possible that older
workers did not see a need to pursue additional skills or training because their skills were
currently up-to-date in terms of relevant job openings.
DECREASING PHYSICAL ABILITIES
It is also possible that older workers may not have the stamina or physical ability to
continue standing or doing the same repetitive tasks as they age. However, the shift to a
knowledge economy has decreased the physical demands of many occupations, allowing people
to continue working to later ages.
Also, people in their 50s and 60s are more physically fit than they were in the past.
According to the Federal Interagency Forum on Aging-Related Statistics7, self-rated health
status—which correlates with risk of mortality—has been improving over the years. More than
three-quarter of persons age 65 and older (76 percent) rated their health status as “good” to
“excellent” during the period 2008-2010.8
Workers aged 55 and older, however, have identified several physical work challenges,
including lifting, being on their feet for several hours at a time, and other ergonomic issues.9
LACK OF TIME TO RECOUP HIRING AND TRAINING COSTS
Some potential employers may have concerns about recouping hiring and training costs
for older workers.10
However, these concerns may be unfounded as, according to the Bureau of
Labor Statistics, younger workers stay at their jobs for shorter periods of time than older
6 MetLife Mature Market Institute, October 2009, “Buddy, Can You Spare a Job?”, David DeLong & Associates.
7 The Federal Interagency Forum on Aging-Related Statistics was founded in 1986 to foster collaboration among
Federal agencies that produce or use statistical data on the older population. 8 Older Americans 2012, Key Indicators of Well-Being, Federal Interagency Forum on Aging Related Statistics.
9 Policy Recommendations to Increase Older Worker Engagement in the Massachusetts Workforce, April 2011,
prepared by the Policy Taskforce of the MA Partnership to Promote the Civic Engagement and Employment of
Older Adults. 10
The Urban Institute, Age Differences in Job Loss, Job Search, and Reemployment, by Richard Johnson and
Corina Mommaerts, January 2011.
Program Review and Investigations Committee Staff Findings and Recommendations: December 18, 2013
12
workers.11
For example, today’s 25-34 year old averages three years on the job, and expects to
hold 15-20 jobs in a lifetime. On the other hand, 55+ year old workers have a median of 10 years
of tenure with their current employers. In reviewing these findings, it is important to keep in
mind that, from a statistical perspective, it is highly unlikely for a 25-year-old, for example, to
have had the opportunity to be employed for 10 years with a single employer.
Longer job tenure for older workers is confirmed by winners of the 2013 AARP Best
Employers for Workers Over 50 awards12
, cosponsored by the Society for Human Resource
Management. The winners reported that older workers were loyal and remained with their
companies longer than younger workers.
EROSION OF EXISTING SKILLS THE LONGER ONE IS UNEMPLOYED
Another barrier to reemployment for all age workers is the erosion of current skills the
longer one is unemployed. The Congressional Budget Office described skill erosion as losing
familiarity with technical aspects of a job, including use of certain computer programs or
equipment.13
This occurrence is exacerbated in fields where technology changes fairly rapidly,
and unemployed workers lack experience with the newer technologies.
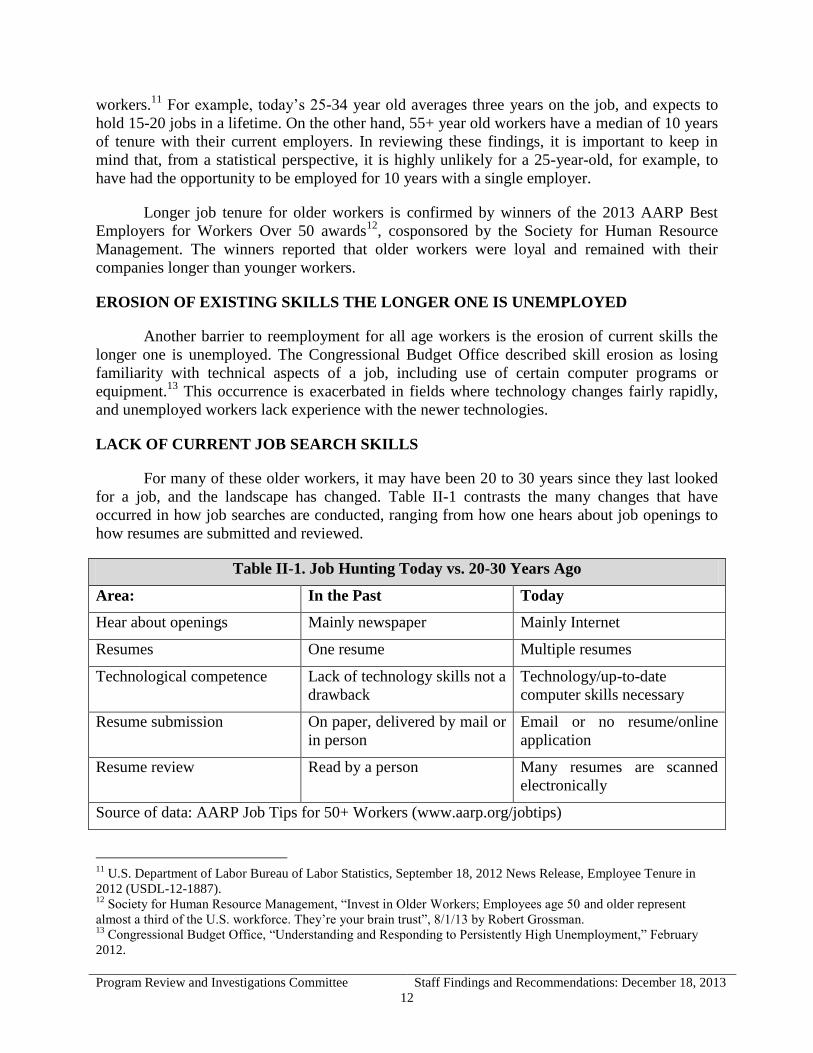
LACK OF CURRENT JOB SEARCH SKILLS
For many of these older workers, it may have been 20 to 30 years since they last looked
for a job, and the landscape has changed. Table II-1 contrasts the many changes that have
occurred in how job searches are conducted, ranging from how one hears about job openings to
how resumes are submitted and reviewed.
Table II-1. Job Hunting Today vs. 20-30 Years Ago
Area: In the Past Today
Hear about openings Mainly newspaper Mainly Internet
Resumes One resume Multiple resumes
Technological competence Lack of technology skills not a
drawback
Technology/up-to-date
computer skills necessary
Resume submission On paper, delivered by mail or
in person
Email or no resume/online
application
Resume review Read by a person Many resumes are scanned
electronically
Source of data: AARP Job Tips for 50+ Workers (www.aarp.org/jobtips)
11
U.S. Department of Labor Bureau of Labor Statistics, September 18, 2012 News Release, Employee Tenure in
2012 (USDL-12-1887). 12
Society for Human Resource Management, “Invest in Older Workers; Employees age 50 and older represent
almost a third of the U.S. workforce. They’re your brain trust”, 8/1/13 by Robert Grossman. 13
Congressional Budget Office, “Understanding and Responding to Persistently High Unemployment,” February
2012.
Program Review and Investigations Committee Staff Findings and Recommendations: December 18, 2013
13
FINANCIAL BARRIERS
In understanding the financial impact unemployment has had on the study population,
researchers from the Heldrich Center for Workforce Development at Rutgers University
interviewed a national sample of unemployed workers aged 55 and older.14
They found the
majority had less in savings compared to when the recession began, with almost two-thirds
saying they had “a lot less.”
Two-thirds (68 percent) of those surveyed expected either to go on Social Security as
soon as they were eligible for early retirement (age 62),15
or had already done so, resulting in a
potentially sizeable reduction in benefits during their lifetimes. Table II-2 shows some of the
other changes that occurred since becoming unemployed. They found, for example, that since
becoming unemployed, almost 4 in 10 had increased their credit card debt.
Table II-2. Actions Taken by Older Adults Since Becoming Unemployed
Action Taken Since Becoming Unemployed Percent
Increased credit card debt 39%
Sold some of your possessions to make ends meet 33%
Taken a job below your education or experience levels 26%
Borrowed money from family or friends, other than adult children 18% Source: “Older Workers, the Great Recession, and the Impact of Long-Term Unemployment” by Carl E.
Van Horn, Nicole Corre, and Maria Heidkamp, John J. Heldrich Center for Workforce Development,
February 2011.
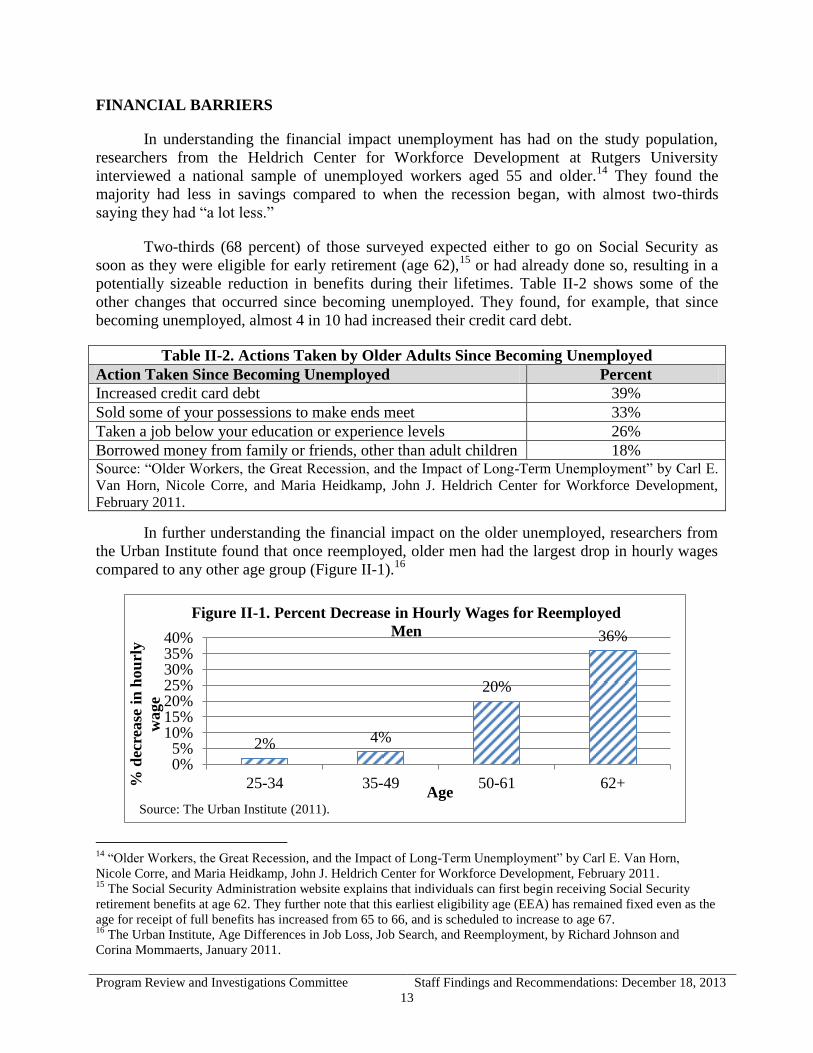
In further understanding the financial impact on the older unemployed, researchers from
the Urban Institute found that once reemployed, older men had the largest drop in hourly wages
compared to any other age group (Figure II-1).16
14
“Older Workers, the Great Recession, and the Impact of Long-Term Unemployment” by Carl E. Van Horn,
Nicole Corre, and Maria Heidkamp, John J. Heldrich Center for Workforce Development, February 2011. 15
The Social Security Administration website explains that individuals can first begin receiving Social Security
retirement benefits at age 62. They further note that this earliest eligibility age (EEA) has remained fixed even as the
age for receipt of full benefits has increased from 65 to 66, and is scheduled to increase to age 67. 16
The Urban Institute, Age Differences in Job Loss, Job Search, and Reemployment, by Richard Johnson and
Corina Mommaerts, January 2011.
2% 4%
20%
36%
0%5%
10%15%20%25%30%35%40%
25-34 35-49 50-61 62+% d
ecre
ase
in
hou
rly
wage
Age
Figure II-1. Percent Decrease in Hourly Wages for Reemployed
Men
Source: The Urban Institute (2011).

Program Review and Investigations Committee Staff Findings and Recommendations: December 18, 2013
14
PHYSICAL AND EMOTIONAL HEALTH BARRIERS
Besides the financial impact of unemployment for older workers, there is also a health
impact, including loss of health insurance, and shortened life span.
A study by the National Bureau of Economic Research found that workers who lost their
jobs at age 58 as a result of a recession, were expected to live as much as three fewer years than
58-year-olds who did not experience job loss.17
The impact of job loss on mental health is described by many in the field—it is not
uncommon for the long-term unemployed to become discouraged and depressed, regardless of
age. The American Association of Suicidology finds a clear and direct historical relationship
between unemployment and suicide—when unemployment rates increase, suicide rates also
increase. In general, the unemployed have a two-four times higher suicide rate compared with
the employed.18
In the previously mentioned study by the Heldrich Center for Workforce Development at
Rutgers University, 64 percent of older long-term unemployed individuals surveyed reported
their employment situation had caused stress in relationships with family and friends.19
Survey
respondents commented on damage to their self-esteem and feelings of self-worth following
unemployment. Figure II-2 shows ratings given by older unemployed survey respondents.
17
Recessions, Older Workers, and Longevity: How Long are Recessions Good for Your Health? From the National
Bureau of Economic Research, by Courtney C. Coile, Phillip B. Levene, Robin McKnight, NBER Working Paper
No. 18361, Issued in September 2012. 18
American Association of Suicidology, “The Economy and Suicide”
(http://www.suicidology.org/c/document_library/get_file?folderId=254&name=DLFE-437.pdf) 19
“The ‘New Unemployables’: Older Job Seekers Struggle to Find Work During the Great Recession.” The Sloan
Center on Aging & Work at Boston College, Maria Heidkamp, Nicole Corre, and Carl E. Van Horn, Issue Brief 25,
November 2010.
81%
66%
61%
54%
48%
40%
21%
0% 20% 40% 60% 80% 100%
Uneasiness/Restlessness
Strain in Family Relations
Change in Sleeping Patterns
Avoiding Social Situations
Loss of Contact with Close…
Quick to Anger
Substance Abuse
Source: Sloan Center on Aging & Work at Boston College, November 2010, Issue Brief 25.
Figure II-2. Reactions to the Stress of Unemployment by Older
Adults

Program Review and Investigations Committee Staff Findings and Recommendations: December 18, 2013
15
COMPETING DEMANDS OF 50+ YEAR OLDS
Those 50 and older, often have responsibilities that can put stressors on their finances.
They also may not have the flexibility to relocate or enroll in a long-term training program.
Besides the greater likelihood of having children near or of college age, there is also the
possibility that adult-age children, due to declining marriage rates and their own financial
difficulties are returning, or continuing to live with their parents. Instead of an empty nest, there
is now a crowded, or cluttered nest.20
According to the U.S. Census Bureau, there was an
increase from 2005 to 2011 in the proportion of 25-34 year olds living in their parents’ homes.
For example, the percent of men aged 25-34 living with parents increased from 14 percent in
2005, to 19 percent in 2011.
In addition to the increased likelihood of adult children living at home with their 50+ year
old parents, many of these homes have mortgages that require monthly mortgage payments. As
can be seen in Figure II-3, over three-quarters (77 percent) of 55-64 year olds, for example, own
homes, and likely have mortgages to pay. One report found also found older homeowners (aged
50-54) were more likely to be “underwater”21
and significantly behind in their mortgage
payments, compared with younger homeowners (aged 20-24).22
20
Kathleen Shaputi, “The Crowded Nest Syndrome: Surviving the Return of Adult Children,” 2004. 21
“Underwater” is a term used for situations where the homeowner owes more money on the home than the free-
market value of the home. 22
Cbsnews.com moneywatch, August 23, 2012.
22%
34%
48%
61%
72% 77%
81%
0%
10%
20%
30%
40%
50%
60%
70%
80%
90%
100%
< 25 25-29 30-34 35-44 45-54 55-64 65+
% o
wn
ing
ho
me
s in
20
12
Age
Figure II-3. Percent of Home Ownership by Age
Source: U.S. Census Bureau 2012
Program Review and Investigations Committee Staff Findings and Recommendations: December 18, 2013
16
AGE DISCRIMINATION
Besides competing demands for older workers’ time and finances, there are also age
discrimination challenges faced by this population. In a MetLife national survey of 55 to 70 year
olds either seeking work or retired and unable to find work, 43 percent said the primary reason
they have not been able to find work was that they could not find an employer who would hire
someone their age.23
This perception is supported by a study where the researcher sent out 4,000 resumes for
entry level positions, using fictional job applicants. The resumes were identical except for the
age of the applicant, which was indicated by date of high school graduation. The researchers
found that younger workers (aged 35-49 years old) were 40 percent more likely to be offered
interviews than older workers (aged 50-62 years old).24
The finding of age discrimination was also indicated in the results of a recent AARP
survey of its members who are working or looking for work.25
In this AARP survey,
approximately two-thirds (64 percent) of 45-74 year olds said they had seen or experienced age
discrimination in the workplace.
PRI staff examined the number of age discrimination complaints filed with the
Connecticut Commission on Human Rights and Opportunities (CHRO). The CHRO data did not
show an increasing pattern of age discrimination associated with employment. During FY 02 to
FY 10, the number of such cases ranged from a low of 411 (in FY 07) to a high of 536 (in FY
05). In FY 10, the most recent year for which published data was available on the CHRO
website, there were 464 complaints filed for age discrimination related to employment.
PERCEPTION THAT OLDER WORKERS ARE TAKING JOBS AWAY FROM
YOUNGER WORKERS
There is another concern about older workers taking jobs away from younger workers.
For example, within the past few years, articles have appeared in newspapers and magazines
such as U.S. News and World Report, The New York Times, and Time Magazine.26
The perception of older workers taking jobs away from younger workers, however, is not
supported by data. A statistical analysis was done using national census data to see if there was
empirical support for this belief.27
Researchers from the Center for Retirement Research at
Boston College examined employment rates for younger workers (aged 20-24) and 55-64 year
old workers (referred to as “elderly” in the study). The dots in Figure II-4 represent the
employment rates for younger and older workers in each of the 50 states. Similar to findings for
23
MetLife Mature Market Institute, October 2009, “Buddy, Can You Spare a Job?”, David
DeLong & Associates. 24
“Do Older Workers Face Discrimination?” by Joanna N. Lahey, An Issue in Brief Center For Retirement
Research at Boston College, July 2005, Number 33. 25
“AARP: Staying Ahead of the Curve 2013: AARP Multicultural Work and Career Study Perceptions of Age
Discrimination in the Workplace—Ages 45-74” (www.aarp.org). 26
“Will Delayed Retirement by the Baby Boomers Lead to Higher Unemployment Among Younger Workers,” by
Alicia Munnell and April Yanyuan Wu, Center for Retirement Research at Boston College, October 2012. 27
Ibid.

Program Review and Investigations Committee Staff Findings and Recommendations: December 18, 2013
17
the years 1977-2007, during 2008-2011, employment rates for the young increased as
employment rates for the older increased, taking into account differences in education level and
state of residence. The positive association between the two age groups shown on this graph does
not support the claim that older workers are “crowding out” or taking jobs away from younger
workers.
Figure II-4. State Employment Rates in 2008-2011 for
Younger (20-24) and Older (55-64) Populations
STEREOTYPES ABOUT OLDER WORKERS
Based on a variety of national surveys of employers and/or hiring managers, there are
positive stereotypes used to describe older workers. Referred to as “soft skills,” 50+ year olds are
seen as having the following advantages over their younger counterparts:28
writing skills,
professionalism and work ethic,
valuable knowledge,
customer service skills, and
dedication and loyalty.
Several negative stereotypes or concerns have been mentioned regarding older workers.
The relative merits of these generalizations are explored in this next section. As becomes clear,
research findings often do not support these generalizations.
28
Appendix A provides more information about the soft skills advantages of the 50 and older workers.

Program Review and Investigations Committee Staff Findings and Recommendations: December 18, 2013
18
Lack of creativity
There is a general sense that older workers lack creativity. In one survey by the Center on
Aging and Work at Boston College, only 29 percent of employers rated their late-career
employees as creative, compared with 35 percent of employers rating their early-career, and 34
percent of their mid-career employees as creative.29
Another study surveyed subscribers to the Harvard Business Review, asking them how
they would handle various scenarios if they were managers, including making promotion
decisions. The scenarios involved either younger (aged 32) or older (aged 61) workers. They
found that respondents were less likely to promote older workers to jobs described as requiring
creativity (as well as flexibility and high motivation).30
Unwilling to learn new things
Another stereotype about older workers is that they are unwilling to learn new skills or
obtain job-related training. Some of this perception may be warranted--as noted in the discussion
of skills deficits, just 27 percent of MetLife survey respondents aged 55-70 years old who were
looking for work reported pursuing training opportunities to better their job prospects.31
However, in an online AARP survey of workers aged 50 and older, 93 percent reported
enjoying learning new things, with three-quarters (77 percent) specifically interested in work-
related training.32
Less productive
A national study by the Urban Institute identified the concern that older workers would
be less productive than younger workers as one of the reasons employers are reluctant to hire
older workers.33
The issue of productivity and worker age was examined by the Center for Retirement
Research at Boston College.34
They noted worker disability trends removed the less productive
workers from the workforce, potentially improving the overall level of productivity of workers
60 and older. Another trend the Center noted was that the later retirement age was more likely to
occur for workers with above-average productivity.
To obtain a better understanding of the employment prospects of older workers, the
Center for Retirement Research conducted a survey of 400 private sector employers regarding
29 “Managerial Attitudes Toward Older Workers: A Review of the Evidence,” by Richard W. Johnson, 2007,
Washington, D.C.: The Urban Institute. 30
Rosen, Benson, and Thomas H. Jerdee. 1977. “Too Old or Not Too Old?” Harvard Business Review 55(6): 97–
106. 31
MetLife Mature Market Institute, October 2009, “Buddy, Can You Spare a Job?”, David DeLong & Associates. 32
“Investing in Training 50+ Workers: A Talent Management Strategy,” by AARP, April 2008. 33
The Urban Institute, Age Differences in Job Loss, Job Search, and Reemployment, by Richard Johnson and
Corina Mommaerts, January 2011. 34
“The Impact of Population Aging and Delayed Retirement on Workforce Productivity,” by Gary Burtless, CRR
WP 2013-11, May 2013, Center for Retirement Research at Boston College.

Program Review and Investigations Committee Staff Findings and Recommendations: December 18, 2013
19
attitudes toward their employees or job candidates.35
Figure II-5 shows the majority thought
those aged 55 and older were equally or more productive than those less than 55 years of age.
Over half of employers said that older white collar managers and professionals were
more productive than their younger counterparts. Four out of five employers also thought that
older rank-and-file employees were at least as productive as younger workers.
Less healthy
While older workers may take longer to recover from injuries, studies have shown that
they use fewer sick days on the whole than younger workers.36
Another study found a modest,
but statistically significant correlation between avoidable absences and age, where the younger
the person, the greater the number of avoidable absences.37, 38
Employee age was not a factor,
however, when unavoidable absences were examined.
Today’s 65 year olds may also be healthier than 20 years ago. As noted previously, three-
quarters (76 percent) of people this age rated their health in census surveys conducted during
2008-2010 as “good,” “very good” or “excellent.”39
35
“Employer Attitudes Towards Older Workers: Survey Results,” by Alicia H. Munnell, Steven A. Sass, and
Mauricio Soto, An Issue Brief, Center for Retirement Research at Boston College, Series 3, June 2006. 36
“Age-Related Differences in Employee Absenteeism: A Meta-analysis,” by J.J. Martocchio, Psychology and
Aging (4), 1989: 409-414. 37
“Meta-analysis: Cumulating research findings across studies,” by J.E. Hunter, F.L. Schmidt, and G.B. Jackson
(1982), Beverly Hills, CA: Sage, Inc. 38
“avoidable absences” include employees calling in sick when medically fit for normal work duties. 39
“Older Americans 2012: Key Indicators of Well-Being,” by Federal Interagency Forum on Aging Related
Statistics.
6%
39%
56%
19%
41% 41%
0%
10%
20%
30%
40%
50%
60%
Less productive Equal More productive
Source: Center for Retirement Research at Boston College, June 2006.
Figure II-5. Productivity Levels of Older Workers
White-collar Rank-and-file

Program Review and Investigations Committee Staff Findings and Recommendations: December 18, 2013
20
More expensive, unrealistic salary requirements
One study traced employers’ reluctance to hire 50+ year olds to a concern that older
workers are more expensive than younger workers due to rigid seniority wage structures or
because their health and pension benefits are more expensive.40
The study also found another
cause of greater expense is employer belief that health and pension benefits are more costly for
older workers.
Another study surveyed 400 private sector employers and found that they viewed older
employees as more expensive than younger employees, regardless of whether the employees
were white-collar or rank-and-file employees.41
Figure II-6, for example, shows that a sizeable
proportion of surveyed employers (39 percent) viewed older managers and professionals as most
costly to the employer. The study also noted that the greater expense for older employees was
especially likely to be reported by respondents from large companies with over 1,000 employees,
and from companies with defined benefit pension plans.
40
The Urban Institute, Age Differences in Job Loss, Job Search, and Reemployment, by Richard Johnson and
Corina Mommaerts, January 2011. 41
Employer Attitudes Towards Older Workers: Survey Results, by Alicia H. Munnell, Steven A. Sass, and Mauricio
Soto, An Issue Brief Center for Retirement Research (CRR) at Boston College, Series 3, June 2006.
19%
42% 39%
0%
5%
10%
15%
20%
25%
30%
35%
40%
45%
Less Costly Equal More Costly
Source: 2006 survey by the Center for Retirement Research at Boston College.
Figure II-6. Perceived Cost of Older White Collar Workers

Program Review and Investigations Committee Staff Findings and Recommendations: December 18, 2013
21
Health care costs. The Health Care Cost Institute is an organization that reports on
changes in health care prices, utilization, and spending for employees covered by employer-
sponsored private health insurance. Although it is uncertain how costs may change under the
Affordable Care Act, the national per capita expenditures reported for 201142
show a rate for 55-
64 year olds that is more than double that of 19-44 year olds (Table II-3). Consider also that, as
workers get older, their number of dependents decreases, and they also become eligible for
Medicare (at age 65).
Table II-3. 2011 National Per Capita Cost for Employers of Employer-Sponsored Private
Health Insurance
Age Category Per Capita Employer Cost
18 and Under $2,347
19-44 $3,599
45-54 $5,927
55-64 $8,776
Source: Health Care Cost Institute, 2011 Report.
From another perspective, depending on state mandates, health care costs between
younger and older workers can vary substantially. In their analysis, researchers found the most
expensive mandates required by state governments tended to apply to younger workers, driving
up health care costs to cover, for example, infertility services, mental health coverage, and
alcohol and substance abuse treatment.43
Younger supervisors concerned about managing more experienced older workers
With an increasing number of younger supervisors, there is also concern that older
workers will be more difficult to manage. In one study, 88 percent of employers said they were
worried about hiring older workers because of conflicts with younger workers.44
They also
believed younger workers were more likely to avoid conflicts and less likely to give older
workers feedback, and use collaborative styles of managing conflicts when problems arise.
In a survey by the Society for Human Resource Management, nearly 60 percent of human
resources managers at big companies reported seeing significant office conflicts that resulted
from age-related differences, often between older subordinates and younger managers.45
42
“Health Care Cost and Utilization Report: 2011,” by Health Care Cost Institute, September 2012,
www.healthcostinstitute.org. 43
The Center on Aging & Work at Boston College, Does Health Insurance Affect the Employment of Older
Workers, by Joanna Lahey, Issue Brief 08, June 2007. 44
“Managing the Older Worker: How to Prepare for the New Organizational Order” by Peter Cappelli and Bill
Novelli, 2010, Boston, MA: Harvard Business Press 45
“The Generation Gap at Work,” CNNMoney.com, http://money.cnn.com/2007/11/01/pf/100710960.moneymag/.

Program Review and Investigations Committee Staff Findings and Recommendations: December 18, 2013
22
PERCEPTIONS ABOUT LONG-TERM UNEMPLOYED
In addition to some of the challenges unique to the older unemployed, there are also
negative perceptions about the long-term unemployed, a category that many older unemployed
fall into. Regardless of age, individuals who have been unemployed the longest are least likely to
find work. According to a report by the National Employment Law Project,46
those who have
been unemployed for more than one year, have a less than 1-in-10 chance for finding a job in a
given month (regardless of age).
Advertisements Requiring Employment to Seek Employment
As employers became increasingly inundated with applications during the Great
Recession, some began to specify in their job announcements that the “unemployed need not
apply,” or that the employer would only accept applications from the currently employed or
recently unemployed, creating yet another barrier to reemployment for the long-term
unemployed.
Possible reasons for excluding the unemployed from consideration for job openings were
identified in another study by the National Employment Law Project.47
With such an abundance
of applicants, the researchers came across media reports suggesting that screening out the
unemployed, or long-term unemployed, is a simple way to reduce the workload for those
involved with the hiring process. Another possible explanation is the employers believe that
those currently employed have a stronger work ethic than the unemployed.
Legislative Remedies to Advertising Practice
The Connecticut legislature considered legislation in 2012 intended to bar this advertising
practice, but no such provision was enacted. HB 5199 and SB 79, raised by the Labor and
Public Employees and the Commerce Committees respectively, both attempted to amend the
state’s discrimination law by adding unemployment status, i.e., making it a discriminatory
practice to:
“advertise employment opportunities in such a manner as to restrict such employment so
as to discriminate against [individuals] any individual because (A) of [their] such
individual’s race, color, religious creed, age, sex, gender identity or expression, marital
status, national origin, ancestry, present or past history of mental disability, intellectual
disability, learning disability or physical disability, including but not limited to,
blindness, or (B) such individual is unemployed.” (sSB 79 (File 29) amending C.G.S.
Sec. 46a-60(a)(6), 2012)48
46
National Employment Law Project (NELP) Scarring Effects: Demographics of the Long-Term Unemployed and
the Danger of Ignoring the Jobs Deficit, by Mike Evangelist and Anastasia Christman, Briefing Paper, April 2013. 47
National Employment Law Project (NELP), Hiring Discrimination Against the Unemployed: Federal Bill Outlaws
Excluding the Unemployed from Job Opportunities, as Discriminatory Ads Persist, July 12, 2011 Briefing Paper. 48
Originally both bills also contained another amendment to the state’s discrimination laws provisions: a prohibition
against refusing to consider for employment or refusing to offer employment based on a person being unemployed.
This language was removed from SB 79 after public hearing (and HB 5199 did not move along after public hearing.)

Program Review and Investigations Committee Staff Findings and Recommendations: December 18, 2013
23
The Connecticut Jobs Bill of 2012 (SB 1) also included the provision noted above until
removed as part of a strike-all amendment on the Senate Floor. The final jobs bill that was
ultimately passed during the Special Session did not contain language to address these
advertising practices directed at unemployed individuals.
Concerns raised during public hearings for these bills included:
subjecting employers/businesses to possible legal action that would be hard to
defend against
increasing an employer’s risk of liability and “chill” hiring just as businesses are
looking to add jobs
dealing with lack of available resources for the Commission on Human Rights
and Opportunities to process complaints for this newly protected class (i.e., the
unemployed)
The Senate bill (SB 79) passed the Senate, but did not proceed further. Before Senate
passage, an amendment was offered (but defeated) to address the advertising practice concern
outside the state discrimination laws, and in the process create a new statute.
“No person, employer, employment agency or labor organization, except in the case of a
bona fide occupational qualification or need, shall advertise employment opportunities in
such a manner as to prohibit individuals who are unemployed from applying for such
employment. The Labor Department may issue a cease and desist order against any
person, employer, employment agency or labor organization that advertises an
employment opportunity in violation of this section for the first such violation and may,
in addition to a cease and desist order, impose a fine of up to two hundred fifty dollars for
any subsequent employment opportunity advertised in violation of this section by the
same person, employer, employment agency or labor organization." Proposed Senate A
to sSB 79 (File 29) (rejected May 1, 2012).
Other states. A number of states have addressed this issue during the past few legislative
sessions. As summarized in Table II-4, as of July 2013, two states and the District of Columbia
states have passed legislation prohibiting discrimination against the unemployed (New Jersey
(passed in 2011), Oregon (passed in 2012), and District of Columbia (passed in 2012). In
addition, there were nine states that introduced bills during the 2013 legislative session (Florida,
Iowa, Maine, Massachusetts, Minnesota, New Hampshire, New York, Pennsylvania, and
Virginia).49
49
“Discrimination Against the Unemployed,” National Conference of State Legislatures, July 24, 2013.

Program Review and Investigations Committee Staff Findings and Recommendations: December 18, 2013
24
Table II-4. Summary of Successful Legislation in Other States: 1) Prohibiting Job
Advertisements to Provide Unemployed Persons Cannot Apply; and/or 2) Prohibiting
Employment Discrimination against Unemployed Persons
State Bill Number Bill Summary
New Jersey AB 3359
AAC employment
discrimination and
supplementing Title 34
of the Revised Statutes
Prevents potential employers from
publishing, in print or on the Internet, an
advertisement for any job vacancy that:
1) lists current employment as a
required qualification
2) states unemployed candidates will
not be considered
3) states only employed candidates will
be considered
Oregon S 1548 Prohibits potential employers from
publishing, in print or on the Internet, an
advertisement for a job vacancy that:
1) lists current employment as a
required qualification
2) states unemployed candidates will
not be considered
3) states only employed candidates will
be considered
District of Columbia B 486
Unemployed Anti-
Discrimination Act of
2012
Prohibits discrimination in employment on
the basis of an individual's status or history
of unemployment
Source: National Conference of State Legislatures, individual state legislative websites.
Federal legislation. In 2011, U.S. Congresswoman Rosa DeLauro (CT) and U.S. Senator
Richard Blumenthal (CT) introduced bills in their respective chambers to prohibit discrimination
in employment on the basis of an individual’s status or history of unemployment.
Congresswoman DeLauro’s bill (HR 2501) would have prevented employers with at least 15
employees from discriminating against the unemployed when posting job openings. Senator
Blumenthal’s bill (S 1471) would have prevented employment status to be used as criteria in
hiring or in advertising job openings.

Program Review and Investigations Committee Staff Findings and Recommendations: December 18, 2013
25
Chapter III
Assessment of Labor Programs to Promote the Reemployment of Older
Workers
As noted in the Introduction, there are very few reemployment programs that provide
services targeted only to older workers. However, apart from the non-age restricted services
available at the CTWorks Career Centers, there are programs that serve a significant proportion
of older adults.
This chapter will describe the Connecticut labor employment and training system,
followed by a review of general and intensive services available at the CTWorks Career Centers.
The remainder of the chapter will focus on several key programs that provide viable options for
unemployed older workers: the North Central Workforce Investment Board FIRST program, the
Eastern Workforce Investment Board (EWIB) online learning program, and statewide STEP UP
and Apprenticeship programs.
OVERVIEW OF CONNECTICUT LABOR EMPLOYMENT AND TRAINING SYSTEM
Figure III-1 provides a brief overview of the components of the Connecticut labor
employment and training system. Programs reviewed as part of this study are reflected in the
chart. The key labor-related entities are: Connecticut Department of Labor (CTDOL);
Connecticut Department on Aging; Connecticut Employment and Training Commission (CETC),
and the Office of Workforce Competitiveness (OWC); and the Regional Workforce Investment
Boards (WIBs), and the CTWorks One-Stop Career Centers (One-Stops).
CTDOL. The Connecticut Department of Labor (CTDOL) is the primary state agency
responsible for employment and training. Much of CTDOL operates within federal requirements.
Unlike many other state agencies, the structure and operation of CTDOL is prescribed by several
federal acts, the two most relevant to the current study being the Workforce Investment Act
(WIA) and the Wagner Peyser Act.50
As shown in the CTDOL organizational chart (Figure III-2), there are several initiatives
PRI reviewed as part of this study: the Apprenticeship program, an office within the CTDOL;
and the STEP UP program, which is operated by CTDOL in partnership with the WIBs.51
50
For a more comprehensive review of these laws, see OLR Backgrounder: Workforce Development (2012-R-0499). 51
The CTDOL-operated TAA and Rapid Response programs are not included due to limited available information.

26
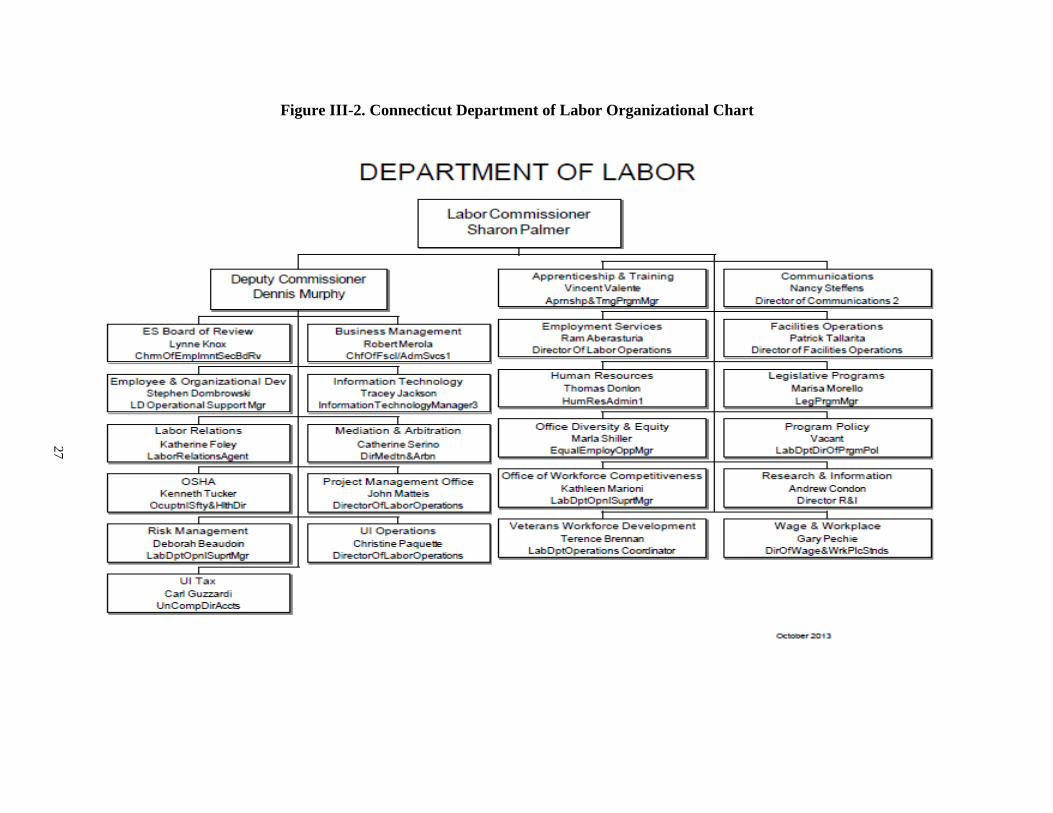
Figure III-2. Connecticut Department of Labor Organizational Chart
27
Program Review and Investigations Committee Staff Findings and Recommendations: December 18, 2013
28
CETC. The Connecticut and Employment Training Commission (CETC) was created in
1989 with a statutory mandate to plan, coordinate, and evaluate training programs.52
CETC is the
State Workforce Investment Board under federal law (Workforce Investment Act—WIA) and
governing state statutes (C.G.S. Sec. 31-3h). Members of the commission represent Connecticut
businesses, key state agencies, regional/local public entities, organized labor, community-based
organizations and other key stakeholders. Section 31-3bb of the Connecticut General Statutes
requires CETC to report on employment outcomes for employment and training programs. The
first report was issued in December 1998. The Office of Workforce Competitiveness (OWC)
operates as a quasi-independent office within the CTDOL, providing technical assistance to
support CETC’s efforts. Specifically, the commission must:
develop a 5-year strategic plan submitted to the U.S. secretary of labor,
advise the governor on developing a statewide workforce investment system,
assist the governor in reporting to the secretary of labor, and
monitor the statewide system.
In August 2011, CETC was restructured administratively, requiring members to have a
lead role in proposing policy and strategy to coordinate efforts to develop and maintain a state
workforce that is educated, skilled, and productive.
WIBs. The Workforce Investment Act requires each State to create local or regional
Workforce Investment Boards (WIBs). The WIBs administer and oversee the federal and state
resources that support the regional network of “one-stop” delivery systems and education and
training investments in each of the regions. Specifically, each of Connecticut’s five regional
WIBs is responsible for:
developing a local workforce development plan,
designating local “one-stop” operators,
designating eligible providers of training services,
negotiating local performance measures, and
assisting in developing a statewide employment statistics system.
As shown in Figure III-3, the five regional WIBs in Connecticut are:
Northwestern Regional WIB (3 one-stops)
North Central WIB/Capital Workforce Partners (4 one-stops)
Southwestern/The WorkPlace (3 one-stops)
Eastern/Eastern CT Workforce Investment Board EWIB (4 one-stops)
South Central/Workforce Alliance (3 one-stops)
52
The commission replaced the Job Training Coordinating Council, whose scope was limited to activities carried
out under the federal Job Training Partnership Act.

Figure III-3. Connecticut Workforce Investment Board Areas and One-Stop Career Centers
29

Program Review and Investigations Committee Staff Findings and Recommendations: December 18, 2013
30
The Connecticut Department of Labor and the Workforce Investment Boards recently
met to address duplication of efforts between the two entities. Occasionally, for example, the
same workshop will be held by both CTDOL staff and One-Stop operator staff (vendor) at a
CTWorks Career Center, with both workshops being cancelled due to under-enrollment. Had a
single offering occurred, it is likely there would have been enough enrolled to offer the
workshop.
An outcome of this meeting was to work on developing memorandums of understanding
regarding coordination of efforts between the WIBs and CTDOL. The Commissioner of the
CTDOL reported that, to her knowledge, no one has previously tried to address this duplication
of efforts and find a better way to coordinate the One-Stop services offered by both the CTDOL
and WIBs. Currently, each individual WIB director and CTDOL counterpart (CTDOL Job
Services Director) has started meeting to develop these MOUs and it will be several months
before any MOUs are completed.
CTWORKS CAREER CENTERS (ONE-STOPS)
One-Stops. The Workforce Investment Act of 1998 established local one-stop centers to
provide centralized access to employment and training services under a number of programs,
including those administered by the federal Departments of Labor, Education, Health and Human
Services, and Housing and Urban Development (Pub. L. No. 105-220, Sec. 121).53
During the
Great Recession, increasing numbers of unemployed persons turned to one-stop centers for
assistance, with the overall number of older workers seeking such assistance more than tripling.54
Connecticut currently has 17 CTWorks Career Centers, also referred to as One-Stop
Centers, which operate within the five regional workforce investment boards (Figure III-3).
Some services are available to any Connecticut resident (General Core One-Stop Services),
regardless of employment status and income, while other services are restricted to populations
meeting certain criteria (e.g., Intensive Services for WIA Dislocated Workers).
Funding
There are two main federal programs that fund the one-stop services described in this
chapter: the Workforce Investment Act of 1998 (WIA); and Wagner-Peyser. In FY 13, WIA
provided $29,153,112 and Wagner-Peyser $7,886,732 to Connecticut. Wagner-Peyser funds are
used to operate general core one-stop services, which were provided to approximately 218,900
53
On August 7, 1998, President Clinton signed the Workforce Investment Act of 1998 (WIA), comprehensive
reform legislation that supersedes the Job Training Partnership Act (JTPA) and amends the Wagner-Peyser Act.
WIA also contains the Adult Education and Family Literacy Act (title II) and the Rehabilitation Act Amendments of
1998 (title IV). Guidance or regulations implementing titles II and IV will be issued by the Department of
Education. 54
The overall number seeking one-stop services rose from 1 million in 2007 to over 3 million in
2010, and the number of older workers seeking one-stop services rose from 124,000 in 2007 to
441,000 in 2010. (United States Government Accountability Office, Report to the Chairman,
Special Committee on Aging, U.S. Senate, April 2012, Unemployed Older Workers: Many
Experience Challenges Regaining Employment and Face Reduced Retirement Security).

Program Review and Investigations Committee Staff Findings and Recommendations: December 18, 2013
31
individuals in FY 13. WIA funds are used to serve individuals more intensively (including the
following three populations: adults, dislocated workers, and youth),55
which were provided to
approximately 5,800 in FY 13.
General Core One-Stop Services
General core one-stop services are available to any Connecticut resident, regardless of
employment status and income. The Wagner-Peyser Act of 193356
established a nationwide
system of public employment offices, which fund the following universal one-stop services:
job search assistance;
career counseling;
job referrals;
job development; and
workshops and job clubs.
Workshops. The One-Stops offer workshops targeted to older adults, such as:
“Boomers Back to Work”
“Finding a Job: Concerns of ‘Older’ Applicants”
“Over 40 and Looking for Work”
“Job Search Techniques for the Over 50 Crowd”
Job search assistance. Apart from workshops and some online education available for
older adults, depending on the region, no other training is provided at this general level. Rather,
the emphasis is on job search assistance to individuals who have recently left the workforce but
may or may not have extensive work experience.
With a focus on self-help, both employers and job seekers have access to a job bank
called CT.jobs, Connecticut’s state labor exchange system. CT.jobs allows approved Connecticut
businesses to post job openings and search résumé banks for qualified candidates. CT.jobs also
allows job seekers to search thousands of employment opportunities, post résumés online for
approved business representatives to view, and refer themselves to job openings.
The CTDOL provides labor market information about employment, occupations, and
other data useful in career decision-making. Developed and maintained by the CTDOL Office of
Research, tools are universally available in paper (e.g., “Connecticut Career Paths”57
) and online
55
Although there may be some unemployed older adults within the WIA adult population, the older adults within
the WIA dislocated worker population were the one-stop client group of particular interest for this analysis. 56
The mission of the Wagner Peyser Act was to assist job seekers in finding jobs, and employers in finding qualified
workers. 57
Produced annually, containing information on: career strategies and job advice; education and training guide;
wages; job descriptions; and local, statewide and online resources.
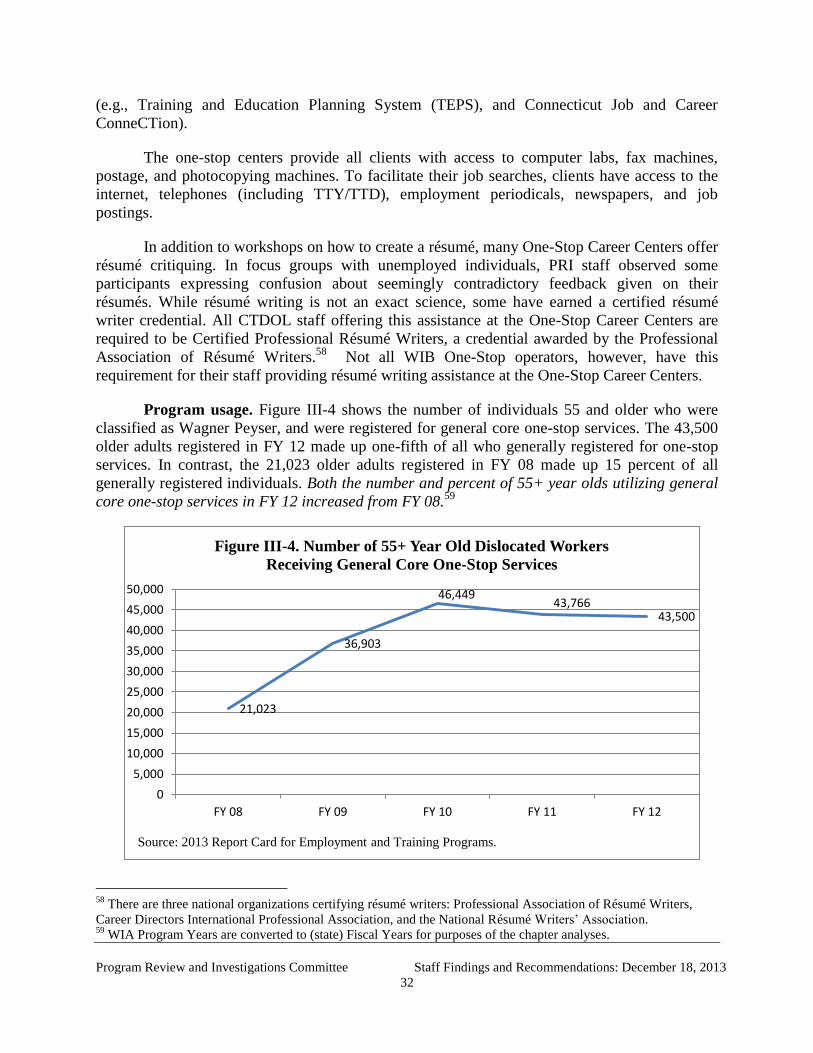
Program Review and Investigations Committee Staff Findings and Recommendations: December 18, 2013
32
(e.g., Training and Education Planning System (TEPS), and Connecticut Job and Career
ConneCTion).
The one-stop centers provide all clients with access to computer labs, fax machines,
postage, and photocopying machines. To facilitate their job searches, clients have access to the
internet, telephones (including TTY/TTD), employment periodicals, newspapers, and job
postings.
In addition to workshops on how to create a résumé, many One-Stop Career Centers offer
résumé critiquing. In focus groups with unemployed individuals, PRI staff observed some
participants expressing confusion about seemingly contradictory feedback given on their
résumés. While résumé writing is not an exact science, some have earned a certified résumé
writer credential. All CTDOL staff offering this assistance at the One-Stop Career Centers are
required to be Certified Professional Résumé Writers, a credential awarded by the Professional
Association of Résumé Writers.58
Not all WIB One-Stop operators, however, have this
requirement for their staff providing résumé writing assistance at the One-Stop Career Centers.
Program usage. Figure III-4 shows the number of individuals 55 and older who were
classified as Wagner Peyser, and were registered for general core one-stop services. The 43,500
older adults registered in FY 12 made up one-fifth of all who generally registered for one-stop
services. In contrast, the 21,023 older adults registered in FY 08 made up 15 percent of all
generally registered individuals. Both the number and percent of 55+ year olds utilizing general
core one-stop services in FY 12 increased from FY 08.59
58
There are three national organizations certifying résumé writers: Professional Association of Résumé Writers,
Career Directors International Professional Association, and the National Résumé Writers’ Association. 59
WIA Program Years are converted to (state) Fiscal Years for purposes of the chapter analyses.
21,023
36,903
46,449 43,766
43,500
0
5,000
10,000
15,000
20,000
25,000
30,000
35,000
40,000
45,000
50,000
FY 08 FY 09 FY 10 FY 11 FY 12
Source: 2013 Report Card for Employment and Training Programs.
Figure III-4. Number of 55+ Year Old Dislocated Workers
Receiving General Core One-Stop Services

Program Review and Investigations Committee Staff Findings and Recommendations: December 18, 2013
33
Entered employment. Results for the general core one-stop services (Wagner Peyser)
are captured as part of the report card prepared annually by CETC for certain Connecticut
employment and training programs. Table III-1 provides employment information for those who
exited the program, regardless of age. As the table shows:
demand for service increased by 62 percent from FY 08 to FY 11, with
participation increasing from 142,200 to 231,068;
39-43% exited to employment during FY 09-FY 11;
approximately 80 percent retained their employment for six months; and
weekly wages tended to average slightly above $500 during FY 09-FY 11.
Table III-1. Employment Information for General Core One-Stop Service Exiters
Result FY 08 FY 09 FY 10 FY 11
Total
program
participants
142,200 208,021 246,131 231,068
Total
program
exiters
106,174 75% 174,644 84% 213,915 87% 200,441 87%
Entered
employment
59,531 56.1% 74,560 42.7% 82,976 38.8% 82,887 41.4%
Retained
employment
for 6
months
49,114 82.5% 56,542 75.8% 65,556 79.0% 66,036 79.7%
Weekly
wages on
entering
employment
$483 $512 $500 $514
Change in
weekly
wages from
pre- to post-
program
services
$46 ($12) $81 $117
Source: 2013 Report Card for Employment and Training Programs Final Draft.
The CTDOL Office of Research provided outcome information by age on those who
exited the general core one-stop services in FY 11. Just 39 percent of the 50+ year olds exited
general core one-stop services for employment compared with 47 percent of the under 50 exiters.
Weekly wages for those who left the program for employment, however, were higher for
the 50+ year olds compared with those under age 50 ($729 vs. $481, respectively).
Approximately 80 percent in both age groups retained their jobs for six months in FY 11.

Program Review and Investigations Committee Staff Findings and Recommendations: December 18, 2013
34
Intensive Services for WIA Dislocated Workers
Service criteria. As described earlier, the Workforce Investment Act (WIA) allocates
certain funds to dislocated workers. To be eligible for WIA dislocated worker programs, the
individual must meet the following criteria:
have been terminated or laid off, or have received individual notice of
termination or layoff, from employment generally due to plant closures or
downsizing; or
received a general notice of the facility closure within 180 days; and
is unlikely to return to a previous industry or occupation; or
be a displaced homemaker60
Services offered. The WIA dislocated workers are able to receive more intensive
services at the one-stop career centers. Intensive services for WIA dislocated workers are
delivered at three levels: 1) staff-assisted core services; 2) intensive services; and 3) training
services. Of the 1,812 served in FY 12, Figure III-5 shows that 72 percent received intensive
services.
60
A displaced homemaker is defined as having provided unpaid services to family members in the home,
has been dependent on the income of another family member and is no longer supported by that income,
and is unemployed or underemployed and is experiencing difficulty in obtaining or upgrading employment.
Core, 902
Intensive, 1,305
Training, 644
Figure III-5. Levels of Service Received by WIA Dislocated
Workers: FY 12
Source: 2013 Report Card for Employment and Training Programs Final Draft.

Program Review and Investigations Committee Staff Findings and Recommendations: December 18, 2013
35
Staff-assisted core services. Staff-assisted core services provide one-on-one or small
group assistance. These services are available after job-seekers have used the general core one-
stop services and remain unemployed. Examples of staff-assisted core services are:
staff-assisted job search, job referral, and career counseling;
staff-assisted assessment, job placement assistance, and testing services;
staff-assisted job development; and
staff-assisted workshops and job clubs.
Intensive services. If staff-assisted core services do not result in employment, the WIA
dislocated worker qualifies for intensive services. Intensive services are also staff-assisted
services and include:
comprehensive and specialized assessment, such as diagnostic testing and
interviewing;
full development of individual employment plans (IEP), including evaluation
of employment barriers;
group or individual counseling;
case management;
short-term prevocational services; and
internships and work experience.
Training services. If these more intensive efforts fail to result in employment for WIA
dislocated workers, then individuals enrolled in WIA intensive services may apply for, and be
granted training scholarships or individual training accounts (ITAs). The maximum per person
amount for training varies by WIB region, depending on their regional policy. In the North
Central WIB region, for example, ITAs may go up to $4,000.
In order to receive the ITA, funds must be available and the applicant must meet the
following criteria:
have received at least one intensive service;
have a completed career assessment and formulated an IEP that specifies that
training is appropriate;
been unable to find suitable employment with existing skills and/or academic
credentials; and
have been determined to have medium or high priority consideration for
training via the priority rating scale—veterans receive priority of service for
training.

Program Review and Investigations Committee Staff Findings and Recommendations: December 18, 2013
36
If granted, the ITAs may be used to pay for training of their choice.61
Training may
include:
occupational skills training;
on-the-job training;
private sector training programs;
skill upgrading and retraining;
entrepreneurial training;
adult education, basic skills and/or literacy in combination with any other
training;
customized training; or
co-op.
Program usage. Figure III-6 shows the number of individuals 55 and older who were
classified as WIA dislocated workers, and were registered for intensive one-stop services. The
445 older adults registered in FY 12 made up nearly one-quarter (24 percent) of all WIA
registered dislocated workers. In contrast, the 795 older adults registered in FY 10 made up 22
percent of all WIA registered dislocated workers.62
61
This training program must be chosen from a Statewide Eligible Training Program (provider) list. ITAs may be
used for training at a community college, participation in Encore!Hartford, and many other options. 62
There were approximately 120 to 158 additional older adults who received intensive one-stop services during this
same time period, but under the WIA adult services classification, which is not reviewed here.
348
227
795
668
445
0
100
200
300
400
500
600
700
800
900
FY 08 FY 09 FY 10 FY 11 FY 12
Source: 2013 Report Card for Employment and Training Programs.
Figure III-6. Number of 55+ Year Old Dislocated Workers
Receiving Intensive One-Stop Services

Program Review and Investigations Committee Staff Findings and Recommendations: December 18, 2013
37
Entered employment. Table III-2 provides training completion and employment
information for those who exited the WIA/Intensive Services one-stop program, regardless of
age. The table shows:
demand for service increased by 55 percent from FY 08 to FY 11, with
participation increasing from 1,692 to 2,629;
58-67% of those who exited had completed training or education programs;
67-72% of the exiters who had completed training/education left for
employment during FY 09-FY 11;
approximately 95 percent retained their employment for six months; and
weekly wages averaged slightly above $600 in FY 11.
Table III-2. Employment and Training Information for Dislocated Workers Exiters who
Received Intensive One-Stop Services
Result FY 08 FY 09 FY 10 FY 11
Total program
participants
1,692 1,900 3,529 2,629
Total program
exiters
642 37.9% 790 41.6% 810 23.0% 1,927 73.3%
Completed
Training/Education
430 67.0% 529 67.0% 516 63.7% 1,123 58.3%
Entered
employment
344 80.0% 353 66.7% 373 72.3% 791 70.4%
Retained
employment for 6
months
330 95.9% 326 92.4% 351 94.1% 743 93.9%
Weekly wages on
entering
employment
$596 $518 $670 $608
Change in weekly
wages from pre- to
post-program
services
$36 $63 $30 $120
Source: 2013 Report Card for Employment and Training Programs Final Draft.
The CTDOL Office of Research prepared information contrasting outcomes for WIA
dislocated workers who were under age 50 vs. 50+ years old for FY 11. One caveat is that there
is some duplication in this dataset. An individual who received staff-assisted core, intensive, and
training services, for example, will be counted three times (and as three exiters) in the dataset.
Those who exited from training services, almost certainly received staff-assisted core and
intensive services, thus, experiencing the full complement of intensives services available to
WIA dislocated workers.

Program Review and Investigations Committee Staff Findings and Recommendations: December 18, 2013
38
Of the 2,629 who received intensive services as WIA dislocated workers in FY 11, there
were 1,927 (73 percent) who exited services. Figure III-7 shows the percent of WIA dislocated
workers who were employed at the time they exited from the one-stop intensive services in FY
11. The data shows:
Regardless of level of service intensity, the under age 50 are more likely to be
employed when they exit compared with 50+ year olds.
For both younger and older participants, training results in the greatest
percent employed at time of exit.
Cost Effectiveness Analysis
Cost. In FY 11, funding (after the federal rescission) was $4,352,052 for WIA dislocated
workers and $7,843,690 for Wagner Peyser (no rescission). These figures are for all individuals
served, regardless of age.
As described earlier, the Wagner Peyser funding is used to support the general core one-
stop services, regardless of age. In FY 11, 231,068 individuals received general core one-stop
services. Approximate cost for the clients served is estimated at $34 per client. The cost to serve
43,766 older (55+ years old) dislocated workers would be approximately $1,488,044 (43,766 x
$34).
52% 47%
78%
44% 41%
69%
0%
10%
20%
30%
40%
50%
60%
70%
80%
90%
Staff-assisted core Intensive Training
% E
mplo
yed
at
Tim
e of
Exit
Source: CTDOL Office of Research.
Figure III-7. Percent of WIA Dislocated Workers by Age who
Exited for Employment: FY 11
Under 50 50+ years old

Program Review and Investigations Committee Staff Findings and Recommendations: December 18, 2013
39
Using information obtained from the WIA Annual Reports (July 2010-June 2011, and
July 2011-June 2012),63
the cost per participant in the intensive services for WIA dislocated
workers was $1,791 in FY 11, and $2,613 in FY 12. The estimate on cost per participant exiter
was $3,459 in FY 11, and $4,154 in FY 12. The cost to serve 668 older dislocated workers would
be approximately $2,310,612 ($3,459 x 668).
Benefit. It is assumed that some benefit was derived from individuals who completed
training or education programs through the WIA dislocated worker funding. With finding a job
being the ultimate goal for one-stop clients, the number who exited into employment would be
another benefit that could be measured.
In FY 11, there were 1,123 out of 1,927 (58 percent) who completed training or education
programs. Also in FY 11, there were 231,068 clients who received the general core one-stop
services.
In FY 11, there were 82,887 out of 200,441 general core one-stop recipients who became
employed (41 percent). In FY 11, there were 791 out of 1,123 intensive services recipients who
became employed (70 percent).
Cost per reemployed program participant. Combining the cost and benefit
information, it is estimated to have cost $95 per participant to become employed following
participation in the general core one-stop services ($7,843,690 / 82,887). It is also estimated to
have cost $2,543 per participant to become employed following participation in the intensive
services ($2,011,293 / 791). Note, the program costs are paid from federal funds, through the
Wagner Peyser and Workforce Investment Act.
Model program. The state of Ohio changed its one-stop system to improve results. Their
“demand–facing service delivery model”64
makes meeting employer needs its top priority. With
the use of federal stimulus funding, the one-stops hired employees with experience in sales and
recruitment. They marketed to employers the benefits of having the one-stops screen and match
job candidates with hiring needs, such as less turnover and reduced hiring expenses. Functioning
as an employment agency, one-stop workers follow up with employers to make sure the hire was
a good match. These efforts have resulted in employers relying on the one-stops as places to find
well-qualified employees.
The impact of this shift to a demand-facing service delivery model has resulted in an
increase in the job placement rate for dislocated workers, from 62 percent in FY 10 to 87 percent
in FY 12. The Ohio state legislature recently passed bills requiring all its one-stops to use this
demand-facing service delivery model, and be rebranded as OhioMeansJobs sites.
63
State of Connecticut Workforce Investment Act Annual Report (July 2010-June 2011, October 2011and July
2011-June 2012, October 2012) 64
Rather than focusing on the needs of the one-stop client, the model focuses on filling the needs of employers.
“Employment Connection: Demand –driven model increases job placement,” Policy Matters Ohio, April 2013.

Program Review and Investigations Committee Staff Findings and Recommendations: December 18, 2013
40
FIRST Program
This section describes the Focused, Intensive, Reemployment Success Training program
(FIRST) that is offered at the One-Stop centers in the North Central Workforce Investment
Board region (Hartford, Manchester, Enfield, and New Britain). FIRST is intended for
unemployed career professionals, many with 15-30 years of work experience. This 90-day
program begins with an intensive, one-week “boot camp.” Areas covered in the program include
career branding, cover letters and targeted résumés, networking, social media, interviewing,
strengths identification, and career matching.
Funding. FIRST participants are classified as dislocated workers under the federal
Workforce Investment Act (WIA), and the program is fully funded by WIA. The FIRST program
recently expanded its qualification criteria beyond WIA dislocated workers to include low
income adults who are unemployed career professionals who otherwise meet the program criteria
for educational degree or longevity with progressive advancement (WIA adults).
Population served. All participants are enrolled in either the adult or dislocated worker
federal WIA program. From January 1, 2013 through November 5, 2013, the FIRST program
served 112 individuals. Although there are no age restrictions for participation in the FIRST
program, almost half (49 percent) were 56+ years old, and an additional 29 percent were 46-55
years old. Figure III-8 shows the increase in age for the first 411 participants (October 2009-
December 2012) compared with the most recent FIRST participants (January-November 2013).
The population served is workers who lost white collar, professional jobs. Participants are
considered skilled workers (must have at least a bachelor’s degree or 15+ years of experience
with a history of advancement) who lack up-to-date credentials, lack current job seeker skills, or
are in need of changes to their self-marketing (“re-branding”). Many of the FIRST participants
are currently receiving, or have run out of, unemployment benefits.
11%
22%
44%
22%
0%
9% 12%
29%
44%
5%
0%5%
10%15%20%25%30%35%40%45%50%
<36 36-45 46-55 56-65 66+
Source: Capital Workforce Partners.
Figure III-8. Age of FIRST Participants: 2009-2012 vs. 2013
2009-2012 2013

Program Review and Investigations Committee Staff Findings and Recommendations: December 18, 2013
41
Program Description. The FIRST program was developed by the North Central WIB
Capital Workforce Partnership in collaboration with its one-stop operator, KRA Corporation.
The program began in 2009 as individual workshops to address the needs of this educated
workforce that had been laid off from white collar jobs. Over time, 14 workshops were created
for the FIRST program, a sampling of which is shown in Table III-3.
Table III-3. Sampling of FIRST Program Workshops
FIRST Impressions
FIRST Class Résumés
FIRST Place Interviews
Twenty-FIRST Century Job Search Technology
FIRST Social Media 1
FIRST Advanced Networking and How to Read a Job Lead
Source: State of Connecticut Workforce Investment Act Annual Report: July 2009-June 2010 (October
2010).
The FIRST program addresses several barriers to unemployment for professionals
including:65
lack of job search skills due to length of consistent employment;
need for career change if previously-held occupation is no longer in demand;
age discrimination possibilities; and
lack of the technical skills and confidence necessary to compete in today’s job
market.
FIRST addresses these barriers through four program components:
1. one-on-one reemployment consultation;
2. FIRST program workshop series;
3. impact networking cohorts; and
4. job development.
The program is conducted by the one-stop operator’s motivational reemployment coaches
who have a specialization in such areas as workshop facilitation and one-on-one consultation.
Between 6-16 people go through the experience together with a new group beginning each
month. During the first week of the program, participants experience an intensive boot camp
65
State of Connecticut Workforce Investment Act Annual Report: July 2009-June 2010 (October 2010).

Program Review and Investigations Committee Staff Findings and Recommendations: December 18, 2013
42
“day” of six hours, working through a prepared manual. During boot camp, participants explore
four career questions:
1. Who am I?
2. What do I do?
3. How do I do it?
4. Why should you hire me?
Related to these questions, boot camp participants explore professional value statements,
differentiation statements, core competencies, skills, and personality information. Importance is
placed on self-awareness and the use of introversion/extroversion, sensing/intuition,
thinking/feeling, and perception/judgment, particularly as they relate to making mid-life career
choices.
People hear about the FIRST program during the twice-weekly workshop, “Career
Services Information Session,” which is the entry point to the One-Stop services. Potential
FIRST participants are also identified and referred to the program by One-Stop career agents
who believe their clients are good matches with the FIRST program. The Re-Employment
Coaches also attend the JETS Schmoozer’s Networking events (described in Chapter VII) to
familiarize attendees with the FIRST program.
Program Outcomes. A total of 523 clients have been served by the FIRST program from
its inception in October 2009 through November 2013. Information was obtained on the 112
FIRST participants served during January 1, 2013-November 5, 2013. During that time, 84
completed the program (75 percent) while 27 (24 percent) remain in the program and are in the
process of completing their scheduled activities. Nearly all participants (97 percent) completed
FIRST during the January-November 2013 time, with just three percent withdrawing from the
program.
Of the 84 who completed the FIRST program in 2013, over half (55 percent) became
employed. The most likely to become employed were in the 36-45 age group (Figure III-9);
however, at least half of participants aged 46-65 also became employed. The majority went into
full-time employment (72 percent).
FIRST program staff noted that FIRST participants who became successful in becoming
reemployed, were more likely to take advantage of the offerings and resources available, learn
new skills, and start participating sooner rather than later relative to the time they became
unemployed. Less successful FIRST participants tended to have never used computers and had
no interest in doing so now, were resistant to technology in general, and had negative attitudinal
issues.

Program Review and Investigations Committee Staff Findings and Recommendations: December 18, 2013
43
Cost. As described earlier, FIRST is funded under the federal Workforce Investment Act.
The program is estimated to cost approximately $150,000 annually. This covers the costs for two
FTE career agents, each responsible for 50-60 participants each. Approximate cost for the 112
clients served in CY 2013 would be estimated at $1,339 per client.
Benefit. According to recent 2013 data, 46 participants in the FIRST program obtained
employment thus far. Given that 27 participants have not yet completed the program, and there is
an overall employment rate of 55 percent for program completers, PRI estimates that an
additional 15 will obtain employment for a total of 61 FIRST participants reemployed in
calendar year 2013.
Cost per reemployed program participant. Combining the cost and benefit
information, regardless of age, the estimated cost to help the (predicted) 61 FIRST participants
become reemployed was approximately $2,459 per reemployed program participant in calendar
year 2013 ($150,000 / 61).
Online Learning Services
This section describes the online learning that is offered at many of the One-Stop centers.
Particular focus is given to the Metrix Online Learning program initially introduced in 2006 at
the Eastern Connecticut Workforce Investment Board (EWIB). Online learning provides
retraining or a skills upgrade, and is one way to address the skill-set deficits identified earlier as a
barrier to reemployment for older workers. Access to a wide array of online courses is offered
free of charge to the learner, providing the flexibility of learning at a convenient time and
location (often in one’s own home) rather than in the formal classroom setting.
Funding. Online learning is primarily funded by the federal Workforce Investment Act
(WIA). Given an estimated cost of $100-$130 per online learner license, an estimated $100,000-
$130,000 in WIA funds would be required for 1,000 online learners.
60%
70%
58%
50%
40%
0%
10%
20%
30%
40%
50%
60%
70%
80%
26-35 36-45 46-55 56-65 66+
Source: Capital Workforce Partners.
Figure III-9. Percent FIRST Completers Employed by Age

Program Review and Investigations Committee Staff Findings and Recommendations: December 18, 2013
44
Population Served. The Eastern WIB region, for example, reported that 73 percent of
individuals enrolled in their online training were 40+ years old, including 21 percent who were
55+ years old. Figure III-10 provides an age profile for the 1,955 online learners compared with
all 13,000-14,000 persons estimated to use one of the Eastern Workforce Investment Board One-
Stop Centers annually during 2011-2012. The online trainees are older compared with all clients
of the One-Stop Centers.
Program Description. The Metrix online learning program gives users access to over
5,000 courses. Based on the experience of EWIB, clients are required to select either a
business/information technology or healthcare track. If the business/information technology track
is chosen, then the user receives online training through SkillSoft, training software used by the
Army, Navy, and some companies. If the healthcare track is chosen, then access to
Medcom/Trainex software is provided. Online training topics range from nursing to home health
aide skills to medical assisting. Medcom/Trainex is especially recognized in the nursing field by
the American Nurses Credentialing Center’s Commission on Accreditation as a provider of
continuing nursing education.
Beyond these two tracks, EWIB online users also have access to courses focused on math
foundations, skill assessments and career planning. Industry certification preparation courses are
also available, such as Microsoft Office Suite (Word, Excel, PowerPoint, Access and Outlook)
and QuickBooks. Additionally, EWIB received approval from the American Council on
Education (ACE), a national organization that assesses on-line coursework for college credit, that
certain successfully completed courses would be recognized by Three Rivers Community
College and Quinebaug Valley Community College, as well as all other Connecticut state
community colleges and universities. Additionally, EWIB recently became an authorized
Under 21 yrs old, 9% 2%
22-29 yrs old, 21%
8%
30-39 yrs old, 21%
30-39 yrs old, 17%
40-54 yrs old, 36%
40-54 yrs old, 52%
55+ yrs old, 13% 55+ yrs old,
21%
0%
10%
20%
30%
40%
50%
60%
70%
80%
90%
100%
All Center Traffic Online Trainees
Source: Eastern Connecticut Workforce Investment Board.
Figure III-10. Age Comparison of All One-Stop Clients with Online
Trainees

Program Review and Investigations Committee Staff Findings and Recommendations: December 18, 2013
45
Certiport Testing Center, which allows those who completed Metrix online courses to locally
take any exams required for industry certification.
For the Eastern Workforce Investment Board Region, people hear about the online
learning program when they visit the One-Stop centers. Other regions, such as the North Central
Workforce Investment Board, limit use of the Metrix online learning program to clients eligible
for services provided under the Workforce Investment Act.
EWIB is currently exploring new ways to expand online learning, including
implementation of a self-directed or self-service track for those with computer experience. Such
individuals could explore online training courses and planning tools, identify at least three
courses to begin their learning plans, and submit online applications for 90-day Metrix licenses.
Program Outcomes. In a federal STEM grant program66
which included the Metrix
Online learning program—and where more than half the participants were 50+ years old--758 of
the 1,117 unemployed (68 percent) got jobs. Clients who completed the CT STEM Jobs
satisfaction survey rated the Metrix online learning component as the most useful resource
offered by this grant program.
Some information was available on the 426 STEM grant participants (38 percent of all
grant participants) who took online courses:
3,788 online courses were completed by the 426 STEM grant participants; and
376 of the 426 (88 percent) passed the exit exams for the courses.
The current MIS system (CTWBS) does not link completion of online learning courses
with employment outcome, and therefore, the association between the courses and future
employment is not readily available.
The Eastern WIB did, however, gather some information on earnings following an earlier
pilot of the Metrix Online Training that occurred during 2010-2011. As shown in Figure III-11,
the online learners had higher average earnings than either One-Stop clients receiving general
core services (“Wagner-Peyser Group”) or participants in a national study containing
reemployment statistics (“Hamilton Project”67
).
The EWIB also conducted a client satisfaction survey in 2011 for One-Stop customers
who had used the Metrix Online Learning program. Overall, feedback from the approximately 90
respondents was positive. Three-quarters (78 percent) rated their overall satisfaction with the
Metrix Learning program as “good” or “excellent,” and a large majority (87 percent) would
recommend Metrix Learning to a friend. Some additional responses are shown in Table III-4.
66
Funded by a grant to the five Connecticut WIBs from the U.S. Department of Labor, Employment and Training
Administration, the project sought to promote expansion of the pipeline of skilled workers to support economic
growth in Connecticut. 67
The Hamilton Project is an economic policy initiative at the Brookings Institute that explores such topics as the
experiences of workers who became unemployed during the Great Recession (“Unemployment and Earnings
Losses: The Long-Term Impacts of the Great Recession on American Workers”)

Program Review and Investigations Committee Staff Findings and Recommendations: December 18, 2013
46
Table III-4. One-Stop Client Feedback on the Metric Online Learning Program
Survey Item % Rating Item “Good”
or “Excellent”
What client hoped to accomplish by enrolling in Metrix Learning:
Upgrade existing skills 71%
Learn new skills 67%
Get a new job 47%
Explore new careers 32%
Prepare for a professional certification exam 23%
Ease of signing up and selecting course rated “Good” or “Excellent” 87%
Activities (courses and tests) considered engaging 85%
Ease in finding relevant courses rated “Easy” or “Extremely Easy” 80% Source: EWIB, 2011.
Cost. Limited information is available on the cost of online learning. In general, if a
license is required to access the course, then a licensing fee—good for 90 days—is estimated to
cost approximately $130.68
This cost includes the orientation workshop in using the online
learning, technical assistance (for mechanical difficulties such as password assistance), and
unlimited access to the online learning for 90 days.
68
Personal communication with EWIB Executive Director (10/31/13).
$25,812
$36,400
$45,498
$0
$5,000
$10,000
$15,000
$20,000
$25,000
$30,000
$35,000
$40,000
$45,000
$50,000
Wagner-Peyser Group Hamilton Project(National Data)
EWIB Pilot Group of MetrixOnline Learning
Source: Eastern Connecticut Workforce Investment Board.
Figure III-11. Average Earnings by Program: 2010-2011

Program Review and Investigations Committee Staff Findings and Recommendations: December 18, 2013
47
Benefit. While some individuals may prefer to receive training in a classroom setting,
others may choose to take advantage of available online training for the following reasons:
online training offers flexibility as to when and where to complete the training
(especially convenient for those needing to take a low-paying job to pay living
expenses);
students have the option of going at their own pace, reviewing material to
increase their comfort level, etc.; and
there is no cost to clients for the online training at the One-Stops whereas
community colleges charge tuition fees.
Some of the online training is recognized and awarded college credit. Table III-5
provides examples of online coursework completion certificates that receive college credit from
Quinebaug Community College.69
Table III-5. Examples of Online Coursework Completion Certificates that Receive College
Credit From Quinebaug Community College
Applied Management Certificate
Applied Accounting Certificate
Business Office Technology: Medical Secretary Certificate
Advanced Management Certificate
Advanced Accounting Certificate
Lean Manufacturing Certificate
Senior Network Specialist Certificate
Source: Eastern Connecticut Workforce Investment Board.
Cost per reemployed program participant. As noted earlier, the current MIS system
(CTWBS) does not link completion of online learning courses with employment outcome, and
therefore, the association between the courses and future employment is not readily available.
Given the relatively modest cost to WIBs, and client benefits (particularly to unemployed
older adults), all the CTWorks Career Centers could expand the offering of online learning to
more clients.
STEP UP PROGRAM
This section describes the Subsidized Training and Employment Program (STEP UP).
Established in 2011 as part of Public Act 11-1,70
the program promotes economic growth by
69
An articulation agreement between Eastern Connecticut Workforce Investment Board and Quinebaug Valley
Community College was executed on April 15, 2012 to award academic credit for certain completed online courses. 70
An Act Promoting Economic Growth And Job Creation In The State
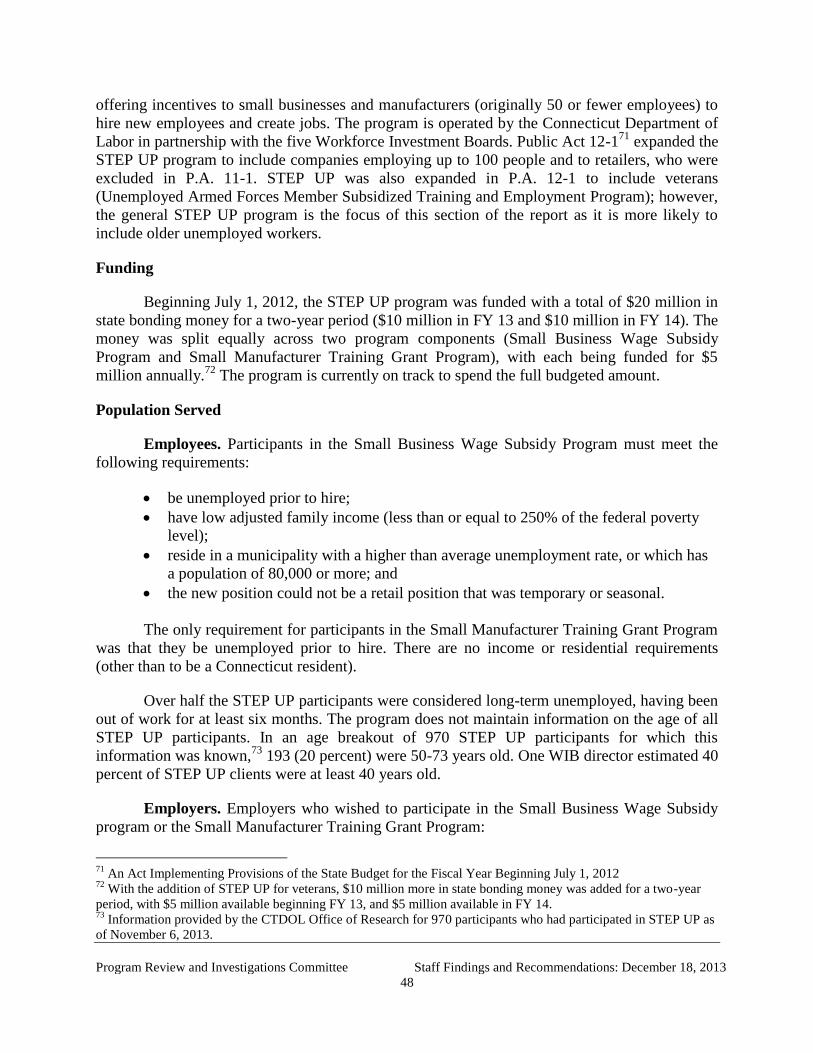
Program Review and Investigations Committee Staff Findings and Recommendations: December 18, 2013
48
offering incentives to small businesses and manufacturers (originally 50 or fewer employees) to
hire new employees and create jobs. The program is operated by the Connecticut Department of
Labor in partnership with the five Workforce Investment Boards. Public Act 12-171
expanded the
STEP UP program to include companies employing up to 100 people and to retailers, who were
excluded in P.A. 11-1. STEP UP was also expanded in P.A. 12-1 to include veterans
(Unemployed Armed Forces Member Subsidized Training and Employment Program); however,
the general STEP UP program is the focus of this section of the report as it is more likely to
include older unemployed workers.
Funding
Beginning July 1, 2012, the STEP UP program was funded with a total of $20 million in
state bonding money for a two-year period ($10 million in FY 13 and $10 million in FY 14). The
money was split equally across two program components (Small Business Wage Subsidy
Program and Small Manufacturer Training Grant Program), with each being funded for $5
million annually.72
The program is currently on track to spend the full budgeted amount.
Population Served
Employees. Participants in the Small Business Wage Subsidy Program must meet the
following requirements:
be unemployed prior to hire;
have low adjusted family income (less than or equal to 250% of the federal poverty
level);
reside in a municipality with a higher than average unemployment rate, or which has
a population of 80,000 or more; and
the new position could not be a retail position that was temporary or seasonal.
The only requirement for participants in the Small Manufacturer Training Grant Program
was that they be unemployed prior to hire. There are no income or residential requirements
(other than to be a Connecticut resident).
Over half the STEP UP participants were considered long-term unemployed, having been
out of work for at least six months. The program does not maintain information on the age of all
STEP UP participants. In an age breakout of 970 STEP UP participants for which this
information was known,73
193 (20 percent) were 50-73 years old. One WIB director estimated 40
percent of STEP UP clients were at least 40 years old.
Employers. Employers who wished to participate in the Small Business Wage Subsidy
program or the Small Manufacturer Training Grant Program:
71
An Act Implementing Provisions of the State Budget for the Fiscal Year Beginning July 1, 2012 72
With the addition of STEP UP for veterans, $10 million more in state bonding money was added for a two-year
period, with $5 million available beginning FY 13, and $5 million available in FY 14. 73
Information provided by the CTDOL Office of Research for 970 participants who had participated in STEP UP as
of November 6, 2013.

Program Review and Investigations Committee Staff Findings and Recommendations: December 18, 2013
49
could not have more than 100 full-time employees;
must have been registered to conduct business for at least 12 months with
operations in Connecticut; and
had to be in good standing with the payment of state and local taxes.
Additionally, employers who wished to participate in the Small Manufacturer Training
Grant Program had to hold the training at the business site.
Program Description
Both the Small Business Wage Subsidy Program and the Small Manufacturer Training
Grant Program offer employer incentives to create jobs by hiring new employees, and both
programs subsidize wages related to on-the-job training. In addition to the financial benefit to
employers, STEP UP offers pre-screening of potential workers so that candidate skills match
company needs. One-Stop staff conduct initial screenings to assess job readiness and possible fit
with certain positions.
Employers74
who are aware of STEP UP may request subsidies for job candidates they
believe are eligible for the program. Alternatively, persons deemed eligible for STEP UP
subsidies may present proof of this eligibility to potential employers during job interviews (“blue
cards”) as incentive to be selected for the position. Business service consultants in the One-Stops
provide the linkage between the employers and STEP UP employees.
Small Business Wage Subsidy Program. This program provides a subsidy for new hires
of up to $20 per hour, and up to $12,000 over a 180-day period. Table III-6 shows the formula
used for the wage subsidy reimbursed to the employer for STEP UP. As can be seen, the
percentage of wages that is subsidized decreases over time.
Table III-6. Percent of Wage Provided by STEP UP Small Business Wage
Subsidy Program
Month Percent of Wage
1 100%
2 75%
3 75%
4 50%
5 50%
6 25% Source: C.G.S. Sec. 31-3pp(c)(2).
Small Manufacturer Training Grant Program. This program offers training grants of
up to $12,500 for six months for each new hire. The training grants are used to subsidize wages
while the new hire is receiving on-the-job training. Table III-7 shows the formula used for the
74
Employers must be pre-approved for STEP UP prior to hiring each STEP UP participant. The pre-approval
process requires companies to meet the employer requirements described above and sign an agreement with the
WIBs specifying their responsibilities for participation in the program.

Program Review and Investigations Committee Staff Findings and Recommendations: December 18, 2013
50
training grants in the Small Manufacturer Training Grant Program. Like the Small Business
Wage Subsidy Program, subsidies for the Small Manufacturers also decrease over time.
Table III-7. Amount of Training Grant Provided by STEP UP Small
Manufacturer Training Grant Program
Month Amount
1 up to $2,500
2 up to $2,400
3 up to $2,200
4 up to $2,000
5 up to $1,800
6 up to $1,600 Source: C.G.S. Sec. 31-3pp(d)(2).
Program Outcomes
From March 2012 through November 20, 2013, a total of 556 employers took advantage
of either the STEP UP Small Business Wage Subsidy Program, or the Small Manufacturer
Training Grant Program. Combined, they hired 1,976 unemployed Connecticut residents for six
months of on-site training. Figure III-12 shows the outcomes for the 1,976 STEP UP
participants.
1,976 enrolled in STEP UP
Completed six months of STEP UP program?
Still working with STEP UP employer in the seventh month?
(Info known for 711 completers)
Yes874 (53%)
No763 (47%)
Yes668 (94%)
No43 (6%)
Figure III-12. STEP UP Program Outcomes for Participants from March 2012- November 20, 2013
339 still active in STEP UP1,637 no longer active in STEP UP
A total of 1,213 (61 percent) either completed the full six months or are currently active in the
STEP UP program. In instances where this information is known, almost all (94 percent) who

Program Review and Investigations Committee Staff Findings and Recommendations: December 18, 2013
51
completed the full six months continued to work for the STEP UP employer at least into the
seventh month. Of the 763 who terminated employment with their initial STEP UP employers,
program staff estimate approximately half (381) continued to be employed, but with different
employers. One CTDOL regional job center director said the STEP UP wage subsidies made a
difference for employers who were on the fence about whether they wanted to hire additional
employees.
The jobs paid wages that ranged from $8.25 to $48.08 per hour. As of November 20,
2013, the average wage for the 502 participants who completed the STEP UP Small
Manufacturing Training Grant program was $15.07 per hour, and $14.13 per hour for the 372
participants who completed the STEP UP Small Business Wage Subsidy program. For the 874
STEP participants who completed the six months of on-site training, the average reimbursement
to the company was $10,042. Table III-8 shows some examples of the types of jobs STEP UP
participants secured.
Job retention. Based on information known about 711 individuals, 94 percent of those
in both the Small Manufacturing and the Small Business programs were with the same employer
in the month following completion of the STEP UP program.75
It is unknown if the six percent
no longer with the STEP UP employer became employed elsewhere.
Table III-8. Examples of Types of Jobs STEP UP Participants Secured
Account and Production Manager Graphic Designer
Assembly Supervisor Help Desk Technician
Carpenter Insurance Agent
CNC Machine Operator Mechanic
Customer Service Representative Office Assistant
Dispatch Manager Process Engineer
Equipment Installer Sheet Metal Installer
Fabricator Web Developer Source: STEP UP staff at Workforce Investment Boards.
Cost Effectiveness Analysis
Cost. As described earlier, each company participating in STEP UP could receive up to
$12,500 per small manufacturer participant, and $12,000 per small business wage subsidy. The
overall average employer reimbursement through November 20, 2013 was $10,042.
Program administration costs of approximately four percent of total STEP UP funding are
provided to the five WIBs primarily for:
75
STEP UP program personnel obtain this information by contacting the employer directly or through employer-
submitted timesheets showing hours worked after the program ended.

Program Review and Investigations Committee Staff Findings and Recommendations: December 18, 2013
52
STEP UP regional coordinators in each WIB
STEP UP assistant regional coordinators in each WIB
two accountants (to handle wage subsidy disbursement)
Benefit. A recently available count (as of November 20, 2013 Status Report), found there
had been a total of 1,976 STEP UP participants in the Small Manufacturing and Small Business
programs. When participating in STEP UP, the person is considered employed on Day 1. Thus,
100 percent of participants were employed.
Cost per reemployed program participant. Combining the cost and benefit
information, the subsidies are estimated to cost an average of $10,042 for each of the 874
employed STEP UP participants who remained in the on-site training for the full six months.
Because not all program participants complete the six months, the total cost for the program is
greater than the $8,776,708 to date ($10,042 x 874).
Total expenditures for STEP UP program. Table III-9 provides information on
expenditures for the individual STEP UP programs from inception through to FY 14. The STEP
UP program was funded for a two-year period, and is set to expire on June 30, 2014.
Table III-9. Step- Up Status Report Summary
AGGREGATE since 2/15/12 (State of STEPUP Contracts with WIBs)
Grant to date ending 6-30-13
Full Grant Grant to Date Grant to Date
Components Budget Expenditure Obligated
Small Manufacturers Training Grant 9,223,000 5,632,249 7,971,118
Small Business Wage Subsidy Program 9,223,000 3,259,871 6,454,899
Grand Total (Sm Bus + Sm Mfg) $18,446,000 $8,892,120 $14,426,016
Armed Forces Total 9,223,000 54,348 179,669
Total Subsidies Grant $27,669,000 $8,946,468 $14,605,685 Source: Connecticut Department of Labor.
As mentioned by program staff and shown in Table III-9, wage subsidies for the STEP
UP Small Manufacturer Training Grant Program were expended at a faster rate than they were
for the STEP UP Small Business Wage Subsidy Program. The wage subsidies for the STEP UP
Veterans Program were the least utilized, reportedly because they have more options for
assistance through the G.I. bill and other veterans programs.

Program Review and Investigations Committee Staff Findings and Recommendations: December 18, 2013
53
APPRENTICESHIP PROGRAM
This section describes the Apprenticeship Program overseen by the Connecticut
Department of Labor Office of Apprenticeship Training.76
Apprentices receive on-the-job
training from approved employers, thereby earning required credentials in a variety of trades,
leading to eligibility to sit for licensing exams. Combining hands-on experience with classroom
or online training, the apprenticeship program uses an “earn-while-you-learn” model, where
participants are paid an increasing wage over the period of the apprenticeship. Upon program
completion, all apprentices receive the nationally recognized Certificate of Completion from the
CTDOL Office of Apprenticeship Training. Almost all apprentices (91-98 percent) are
subsequently hired as journeymen by either the employer who provided the on-the-job training
or a different employer.
Funding
A total of $595,867 was budgeted for FY 13 for the Apprenticeship Program. This
funding supports program administration and seven CTDOL positions. There are four additional
CTDOL positions funded through annual fees paid by program participants ($50 from
apprentices, $60 from employers (“sponsors”)). There is also federal funding for the
apprenticeship program, bringing the combined total budgeted funding to just under $1 million
($979,790).
Population Served
Apprentices. According to the Connecticut Department of Labor (CTDOL) website and
assorted brochures, the following minimum requirements are generally needed to become an
apprentice:
Age: be at least 16 years old (no maximum age);
Education: High School Diploma or GED may be required by the employer
(sponsor); sometimes algebra or some other coursework completion may also
be required; and
Physical: ability to perform the essential functions of the trade.
Age. The CTDOL system for monitoring the apprenticeship program does not maintain
information on the age of apprentices. The program manager of the CTDOL Office of
Apprenticeship Training, however, estimates that one to two percent of apprentices are at least
50 years old when they begin the program. Given there are currently 4,581 registered
apprentices, approximately 46-92 would have been 50+ years old when they began the program.
The program manager further speculated, however, that the average age of an apprentice is
getting older. Whereas, in the past an apprentice was typically 18-26 years old, it is now not
uncommon to see 30+ year olds in the apprenticeship program.
76
The CT Department of Labor Office of Apprenticeship Training regulates the program to meet both state and
federal regulatory requirements. All apprentices and employers (sponsors) must register with the Office of
Apprenticeship Training.

Program Review and Investigations Committee Staff Findings and Recommendations: December 18, 2013
54
Employers (sponsors). According to CTDOL, employers participating in the
apprenticeship program are responsible for:
instructing the apprentice in safe and healthful work practices that are in
compliance with state and federal occupational safety and health standards;
maintaining a minimum ratio of journeypersons;
employing full time staff available to train any apprentices; and
periodic review and evaluation of the apprentice’s progress.
Table III-10 provides a listing of the trades with the most apprentices as of December 3,
2013. Trades with the most apprenticeships are reported for electrical, heating and cooling, and
plumbing. A listing of both active and inactive employer sponsors can be found on the CTDOL
website. There are currently 1,491 active employer sponsors and up to 2,000 inactive sponsors,
who may register apprentices in the future. The locations with the greatest number of active
apprentices as of September 24, 2013, are listed in Table III-11.
Table III-10. Trades with Most Apprentices Registered with CTDOL
Trade Number of Registered Apprentices
Electrician (E-2) 1,515
Heating & Cooling Mechanic (S-2, S-4) 472
Plumbing Mechanic (P-2) 463
Limited Heating and Cooling (D-2, B-2/B-4) 416
Carpenter 277
Sheet Metal Worker (HVAC) (SM-2) 212
Electrician Low Voltage (C-6, L-6, T-2) 177
Roofer/Waterproofer 176
Sprinkler Fitter 115
Construction Craft Laborer 106 Source: Connecticut Department of Labor Office of Apprenticeship Training, SAC Report December 5,
2013.
Program Description
An apprenticeship is a voluntary employer-employee relationship regulated by the Office
of Apprenticeship Training. It combines on-the-job training with relevant classroom or online
instruction. Apprenticeships last a minimum of one year, including 2,000 hours of on-the-job
training and 144 hours of related instruction. While apprentices typically take the classroom or
online instruction over the course of their full apprenticeships, others may choose to enroll
fulltime for two semesters at a community college to complete the necessary classroom hours for
up to a four-year apprenticeship.

Program Review and Investigations Committee Staff Findings and Recommendations: December 18, 2013
55
Table III-11. Cities and Towns with the Most Registered Apprentices
City/Town Number of
Registered
Apprentices
City/Town Number of
Registered
Apprentices
Wallingford 477 Milford 67
Rocky Hill 172 New Britain 61
Meriden 162 Manchester 57
Hartford 156 South Windsor 53
Berlin 142 Vernon 50
North Haven 139 Naugatuck 44
Pomfret 115 Windsor Locks 41
Danbury 104 New Haven 39
Stratford 92 Norwalk 38
Plainville 91 Torrington 36
Stamford 82 Middletown 34
East Hartford 79 Wolcott 32
Waterbury 74 Farmington 31
Southington 72 Cheshire 31
Hamden 71 Bristol 30
Bridgeport 67 New Milford 25 Source: Connecticut Department of Labor Office of Apprenticeship Training, Apprentice Count by Town,
as of September 24, 2013.
Most apprenticeships range from three to five years. Approximately 2,000 hours of on-
the-job training can be completed in one year. Examples of the time required for certain trades
are shown in Table III-12.
Table III-12. Examples of Hours of On-The-Job-Training Required for Various Trades
Trade Hours of On-The-Job-Training Required
Auto Glass Technician (AG-2) 2,000
Low Voltage Electrical (L-6, C-6, T-2) 4,000
Photovoltaic Electrician (PV-2) 4,000
CNC Production Machinist 6,000 or 8,000
CATV Electronic Technician 6,000
Plastic Mold Repairer 6,000
Electrician (E-2) 8,000 Source: Connecticut Department of Labor Work Schedules-Apprenticable Trades.
Participants hear about the apprenticeship program through the CTDOL website, one-
stops, technical high schools, community colleges, and unions.
Apprenticeship salaries. The progressive wage scale for apprentices is based on the
number of on-the-job-training hours completed, and is calculated as a percent of the journey
worker rate for that trade. The Office of Apprenticeship Training sets minimum starting and

Program Review and Investigations Committee Staff Findings and Recommendations: December 18, 2013
56
completion rates for apprenticeships. The minimum starting rates for all apprenticeships is $11
per hour. The completion rate for four-year apprenticeships in construction, for example, is $22
per hour.77
An example of an apprenticeship wage schedule for an Electrician (E-2) is shown in
Table III-13.
Table III-13. Apprenticeship Wage Schedule for Electrician (E-2)
Hours Percent of Wage
0-1,000 50%
1,001-2,000 55%
2,001-3,000 60%
3,001-4,000 65%
4,001-5,000 70%
5,001-6,000 75%
6,001-7,000 80%
7,001-8,000 85%
8,001+ 100% Source: Connecticut Department of Labor Apprentice Handbook & Progress Report.
In conducting this study, PRI interviewed personnel from workforce investment boards
and one-stop career centers. The interviews revealed that staff may be limiting older worker
involvement in apprenticeship programs because of certain perceptions. These perceptions are
listed in Table III-14, and are largely disproved by the studies and statistics cited in the right-
hand column.
Table III-14. Misperceptions about Apprenticeships
Fact or Fiction? Answer:
Apprenticeships take a long time, up to 10
years
Depending on the trade, apprenticeship length
ranges from 1-5 years1
50+ year olds are too old to apprentice—
they’ll retire before the employer-sponsor has
time to recoup costs
People are working to increasingly older ages--In
a 2013 Gallop Survey, just 26% planned to retire
before age 65
Only unions sponsor apprenticeships Approximately half of all apprenticeships are
sponsored by non-union employers2
The apprenticeship trades are physically
demanding, and are not suitable for older
people
There are apprenticeship trades that are not as
physically demanding, such as electricians and
CNC Production Machinists
Some apprenticeships require classroom
training during daytime hours, creating lost
work time for the employer
Online training is available after work hours,3
and evening/weekend classes are held at some
technical high schools and community colleges 1 For a complete list of trades, go to: www.ctdol.state.ct.us/progsupt/appren/WorkSchedules/apptoc.htm.
2 See CTDOL Apprenticeship Sponsor List: http://www.ctdol.state.ct.us/progsupt/appren/SponsorReport.htm.
3 See Penn Foster online learning: www.pennfoster.edu
77
According to the CTDOL Apprenticeship program director, most pay higher than minimum journey worker rates,
with $25 per hour a typical pay rate for skilled occupations, excluding health and retirement benefits also paid by the
employer (sponsor).

Program Review and Investigations Committee Staff Findings and Recommendations: December 18, 2013
57
Program Outcomes
There are currently 4,581 individuals in apprenticeships (an 8.5 percent increase from the
4,222 registered at this time one year ago). Based on information contained in the 2013 Program
Report Card for the Apprenticeship Program, upon completion of the on-the-job training and
instructional requirements, 619 to 695 were awarded credentials (i.e., passed the licensing exam)
annually during FY 08-FY 12 (665 average for the five years).
During fiscal years 2008-2012, approximately 600-700 people completed full
apprenticeships annually (Table III-15). The CTDOL program staff estimate approximately 52
percent complete their full apprenticeships (e.g., all three years of a trade requiring a three-year
apprenticeship were fulfilled). It should be noted there are challenges in capturing the percent of
apprentices who completed full apprenticeships. For example, apprenticeships are multi-year
processes of varying lengths, depending on the trade. Apprenticeship program staff report many
apprentices switch employer-sponsors during the process, beginning with one employer and
ending with another. When those changes occur, the apprentice is considered to have terminated
with the first employer-sponsor, and program completion with the new employer-sponsor is not
linked to the individual.
Table III-15. Apprenticeship Program Completions: FYs 09-12
State Fiscal Year Number of Apprenticeship Completions
2008 665
2009 694
2010 619
2011 691
2012 656
Total 3,325 Source: CTDOL Apprenticeship Program.
In a survey of apprenticeship sponsors, the main reasons given for failure to complete an
apprenticeship program were: transfer to another apprenticeship program; taking another job
before apprenticeship completion; performance issues; and personal issues.78
Post-Apprenticeship. Upon completion of the required classroom and on-the-job
training hours, approximately three-quarters are required to pass a trade licensing exam.79
The
CTDOL Office of Apprenticeship Training reports 99 percent of exam takers pass the trade
licensing exam.
As noted earlier, upon program completion, almost all apprentices (91-98 percent) are
hired as journeymen by the employer who provided the on-the-job training or a different
employer. Annual earnings for apprentices following program completion are approximately
78
“The Benefits and Challenges of Registered Apprenticeship: The Sponsors’ Perspective,” by Robert Lerman,
Lauren Eyster, and Kate Chambers, The Urban Institution Center on Labor, Human Services, and Population (March
2009). 79
Manufacturing is not a licensed area, and some of the construction trades, such as roofer and carpenter, do not
require a license.
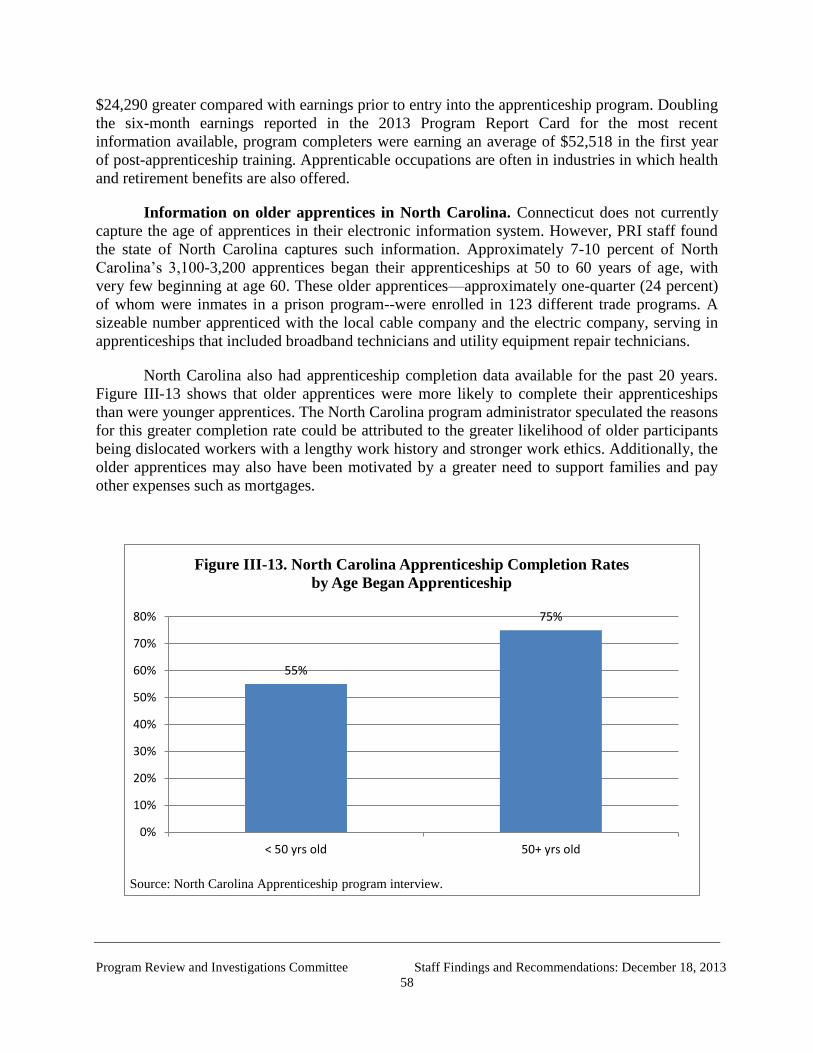
Program Review and Investigations Committee Staff Findings and Recommendations: December 18, 2013
58
$24,290 greater compared with earnings prior to entry into the apprenticeship program. Doubling
the six-month earnings reported in the 2013 Program Report Card for the most recent
information available, program completers were earning an average of $52,518 in the first year
of post-apprenticeship training. Apprenticable occupations are often in industries in which health
and retirement benefits are also offered.
Information on older apprentices in North Carolina. Connecticut does not currently
capture the age of apprentices in their electronic information system. However, PRI staff found
the state of North Carolina captures such information. Approximately 7-10 percent of North
Carolina’s 3,100-3,200 apprentices began their apprenticeships at 50 to 60 years of age, with
very few beginning at age 60. These older apprentices—approximately one-quarter (24 percent)
of whom were inmates in a prison program--were enrolled in 123 different trade programs. A
sizeable number apprenticed with the local cable company and the electric company, serving in
apprenticeships that included broadband technicians and utility equipment repair technicians.
North Carolina also had apprenticeship completion data available for the past 20 years.
Figure III-13 shows that older apprentices were more likely to complete their apprenticeships
than were younger apprentices. The North Carolina program administrator speculated the reasons
for this greater completion rate could be attributed to the greater likelihood of older participants
being dislocated workers with a lengthy work history and stronger work ethics. Additionally, the
older apprentices may also have been motivated by a greater need to support families and pay
other expenses such as mortgages.
55%
75%
0%
10%
20%
30%
40%
50%
60%
70%
80%
< 50 yrs old 50+ yrs old
Source: North Carolina Apprenticeship program interview.
Figure III-13. North Carolina Apprenticeship Completion Rates
by Age Began Apprenticeship
Program Review and Investigations Committee Staff Findings and Recommendations: December 18, 2013
59
Cost Effectiveness Analysis
Cost. Connecticut budgeted $595,867 of its own dollars in FY 13 to support the
apprenticeship program. Program participant wages are not a cost to the State, as the employer
sponsors pay the graduated wages of their apprentices.
There is a manufacturing apprenticeship tax credit available of up to $4,800 or 50 percent
of actual wages, whichever is less, if the apprenticeship meets certain requirements specified in
statute (C.G.S. Sec. 12-217g). Thus, there is some tax revenue lost to the state due to this tax
credit. In 2010, for example, 13 large corporations claimed $625,791 for the manufacturing
apprenticeship tax credit.80
Benefit. The “earn-while-you-learn” model is beneficial to apprentices, who begin
earning income from Day 1 of their enrollment in this alternative educational program.
Additionally, the employer grows an employee to fill a needed position in the company. As the
apprentice accumulates hours of on-the-job training in the program, productivity and
contributions to the company also increase.
Cost per reemployed program participant. Based on the $595,867 budgeted state
funds needed in FY 13 and the average 665 obtaining licenses upon completion of the
apprenticeship program, it is estimated to cost the state of Connecticut $896 for each person who
completed the apprenticeship program.81
Note this analysis is for the apprenticeship program, regardless of age of participant.
Assuming the findings from the North Carolina Apprenticeship Program are applicable to
Connecticut, then it is more likely that the older apprentices will successfully complete the full
apprenticeship program in comparison with their younger counterparts.
80
State of Connecticut Department of Revenue Services: Fiscal Year 2011-2012 Annual Report. 81
Additional tuition costs are incurred by the apprentice and employer sponsor.

Program Review and Investigations Committee Staff Findings and Recommendations: December 18, 2013
60
This Page Intentionally Left Blank

Program Review and Investigations Committee Staff Findings and Recommendations: December 18, 2013
61
Chapter IV
Department on Aging: Senior Community Service Employment Program
(SCSEP)
This chapter describes the federally funded Senior Community Service Employment
Program (SCSEP) in Connecticut. Established in 1965, and incorporated under the Older
Americans Act (Title V) in 1973, the program is operated by the U.S. Department of Labor
Employment and Training Administration. The purpose of the program is to provide job skills
training to low-income individuals aged 55 and older who are unemployed. Participants are
placed in temporary training assignments for 20 hours per week to gain on-the-job (OJT) training
(paid minimum wage) and work experience needed to lead to unsubsidized employment. With
emphasis placed on serving those with significant barriers to employment, SCSEP takes a
holistic approach, addressing social, emotional, and mental health issues in conjunction with the
OJT placements.
FUNDING
There are three SCSEP grantees in Connecticut that combined, have been awarded a total
of $4,574,037 in federal funding for FY 14. Approximately $927,000 was awarded to the state
grantee, the State Department on Aging, for 101 program slots. The State Department on Aging
in turn, sub-contracted with the following five organizations to directly provide the SCSEP
services:
Agency on Aging of South Central CT (New Haven)
Education Connection (Litchfield)
Jewish Family Service of Stamford
Southwestern CT Agency on Aging (Bridgeport)
Thames Valley Council for Community Action (Norwich)
There are also two national grantees: Easter Seals Capital Area and Eastern Connecticut
($1,813,385 for 145 program slots, or $12,506 per slot) and Associates for Training and
Development82
($1,832,780 for 159 program slots, or $11,527 per slot). In total, federal funding
provided 405 slots (101 + 145 + 159) for the SCSEP program.
POPULATION SERVED
Age. Program participants must be at least 55 years of age and Connecticut residents.
With no maximum age, there are currently 18 SCSEP participants who are over 75 years old.
According to program staff, the typical age of SCSEP participants has been decreasing, from 65-
70 years old several years ago, to 55-60 years old today. Figure IV-1 shows the age at enrollment
for FY 13 SCSEP participants.
82
In SFY 2013, the Vermont-based Associates for Training and Development organization received the grant
previously held by the Bridgeport-based The Workplace.

Program Review and Investigations Committee Staff Findings and Recommendations: December 18, 2013
62
Income level. Program participants must be unemployed and have an annual family
income that is not greater than 125 percent of the federal poverty income guidelines. For
example, $14,363 is the maximum income for a family of one, $19,388 for a family of two, and
$24,413 for a family of three.83
Race/ethnicity, gender, and education. SCSEP program participants in FY 13 were
primarily Caucasian (50 percent) or African American (44 percent), and 14 percent were
Hispanic. Participants were more likely to be female (62 percent in FY 13), and education level
ranged from eighth grade and under, to doctoral degree. The majority of SCSEP participants had
at least a high school diploma or equivalent (82 percent), and over one-third (38 percent) had at
least some college.
PROGRAM DESCRIPTION
Participants hear about the program through outreach, marketing, other senior service
programs, the Connecticut Department of Labor, and word of mouth. There are officially 405
slots available when combining the program slots from the state Department on Aging, Easter
Seals Capital Area and Eastern Connecticut, and Associates for Training and Development. With
some exiting the program, however, and new people entering to take their places, 566
participants received SCSEP services in FY 13, with an additional 16 on a waiting list for the
state grantee administered portion of the SCSEP program alone.
SCSEP allows a maximum of 48 months of program participation. The services received
by participants vary, with an emphasis on tailoring services to the particular needs of the
83
The SCSEP program does not have a maximum family size.
47%
30%
12%
7%
3%
0%
5%
10%
15%
20%
25%
30%
35%
40%
45%
50%
55-59 60-64 65-69 70-74 75+
Source: SCSEP Quarterly Progress Reports.
Figure IV-1. Age of SCSEP Participants in FY 13

Program Review and Investigations Committee Staff Findings and Recommendations: December 18, 2013
63
individual. All participants receive an assessment of job skills and interests, culminating in the
development of an individual employment plan targeted toward getting the individual ready for
available jobs. Some of the employment plans include SCSEP-funded OJT placements at host
agencies. These services and experiences help prepare participants to ultimately find
unsubsidized employment.
Some SCSEP participants receive classroom training. This training time is counted as
part of the 20 hours per week (so they are receiving minimum wage payment during their
classroom training time). Some participants may attend Goodwin College, for example, to be
trained as Certified Nursing Assistants (CNAs). Other examples of classroom education include
computer courses and training to obtain a CDL to drive a truck, bus or limousine. While
participants may be learning in a classroom setting, they are also able to apply this knowledge in
an actual job setting.
In addition to classroom training for some participants, SCSEP also provides OJT
placements for 20 hours per week, with stipends paid at the minimum wage level. Examples of
OJT settings or experiences include food preparation, retail in a thrift shop, and office services.
OJT placements are frequently located at social service agencies (e.g., Goodwill) at no cost to the
host agencies. Table IV-1 shows the various categories of host agencies where the OJT is
currently taking place.
Table IV-1. Types of Host Agencies for SCSEP Participants
Type of Host Agency Number Percent
Social Services 82 41%
State/Municipal 22 11%
Employment (i.e., One Stops) 19 10%
Senior Services/Senior Centers 18 9%
Housing 14 7%
Education 14 7%
Health Care/Hospitals 13 6%
Arts/Culture 7 4%
Other (e.g., Libraries, Faith Based) 9 5%
Total 198 100%
Source: Connecticut State Department on Aging.
According to state Department on Aging personnel, SCSEP staff is careful to correctly
place or match the participant with the employer/host agency for OJT purposes. The OJT
placements cannot be available open jobs at the organization because SCSEP OJT may not be
used to replace paid openings. Instead, the OJT experience occurs in areas of the organization

Program Review and Investigations Committee Staff Findings and Recommendations: December 18, 2013
64
where help is needed, and the organization is willing to invest time in training the person to do
the activities.
Sometimes OJT placements lead to hiring into unsubsidized employment positions within
the same organization as a result, according to program staff, of the organization appreciating the
value of the person they have invested time in training during the OJT experience.
Job Clubs are also held once a month as part of the SCSEP program. Job Clubs provide
participants with an opportunity to be with a group of peers of similar age and unemployment
status.
With the comprehensive approach taken by SCSEP, assistance to participants has
included assistance finding housing and the purchase of hearing aids.
PROGRAM OUTCOMES
Community service measures. The U.S. Department of Labor Employment and
Training Administration assesses SCSEP client participation in community service activities for
the general community, and the older adult community in particular. As shown in Table IV-2, for
FY 13, a total of 564 SCSEP participants provided 268,553 hours of community service at host
agencies (subsidized at minimum wage).
Table IV-2. Participation in SCSEP Community Service Assignments for FY 2013
Community Service
Assignments
# of Participants # of Hours Avg Hrs Per
Participant
General community 387 (69%) 184,707 452 hrs
Older adult community 177 (31%) 83,846 448 hrs
Total community 564 (100%) 268,553 451 hrs
Source: SCSEP Annual Progress Reports (SFY 2013) submitted to U.S. Department of Labor
Employment and Training Administration.
Reasons for SCSEP program exit. There were 207 SCSEP participants who exited the
program in FY 2013. Besides unsubsidized employment, SCSEP participants left the program for
other reasons such as reaching the 48 month lifetime program time limit, and medical/health-
related reasons (Table IV-3). Out of the 102 participants who completed the program (those who
exited for unsubsidized employment plus those who reached the 48-month program time limit
without finding a job), 60 (59 percent) became employed.

Program Review and Investigations Committee Staff Findings and Recommendations: December 18, 2013
65
Table IV-3. Reason for SCSEP Program Exit: FY 2013
Reason for SCSEP Program Exit: Number Percent
Unsubsidized employment 60 29%
Reached 48-month program time limit 42 20%
Medical/health-related reason 61 29%
Voluntarily left program (remained unemployed) 14 7%
For cause 21 10%
Othera
9 4%
Total 207 99%b
aOther includes moved, deceased, and family care obligations.
bTotal percent does not total to 100% due to rounding.
Source: State Department on Aging personnel.
Core performance measures. The U.S. Department of Labor Employment and Training
Administration established six core performance measures for all SCSEP programs. The
measures include the percent that exited the program with unsubsidized employment and
employment retention.
SCSEP exiters with unsubsidized employment. Program staff noted that SCSEP
participants who were successful in becoming employed had the following characteristics:
more marketable (they were willing to gain the necessary familiarity with
computers);
had updated skills;
were self-motivated, wanted to get a job;
were willing to put in the time, wanted to succeed; and
they may have had fewer barriers when they entered the program (e.g., had a
car, other resources).
Table IV-4 shows the barriers identified for the 60 participants who left the program for
unsubsidized employment. In general, for those who exit with an outcome of unsubsidized
employment, program staff estimates it takes approximately two years for participants to reach
this goal.
Among the SCSEP exiters who left for unsubsidized employment, two of the most
prevalent barriers these individuals faced were homelessness or risk of homelessness, and low
literacy skills. In comparison to all SCSEP participants, those who left for unsubsidized
employment were less likely to have low/severely low employment prospects, or to be a veteran.
However, many of the other barriers, including homeless or at risk of homelessness, were just as
likely to be found in those participants who exited with unsubsidized employment.

Program Review and Investigations Committee Staff Findings and Recommendations: December 18, 2013
66
Table IV-4. Barriers to Employment for SCSEP Exiters to Unsubsidized Employment vs.
All FY 13 Participants
Exited with
Unsubsidized
Employment (N=60)
All Participants
(N=566)
Barrier Number Percent Number Percent
Homeless or at risk of homelessness 21 35% 155 27%
Low literacy skills 20 33% 198 35%
Disability 10 17% 114 20%
Low/Severely low employment prospects 10 17% 531 94%
Displaced homemaker 7 12% 66 12%
Limited English 6 10% 77 14%
Veteran 1 2% 63 11%
No Barriers 15 25% unknown Source: State Department on Aging.
Overall, the average number of barriers to employment for SCSEP participants was 2.5 in
FY 13.
Employment retention. Of the 60 who secured unsubsidized employment, 84 percent
were still employed nine months later. In addition, 82.5 percent were still employed one year
after exiting the program with unsubsidized employment.
COST EFFECTIVENESS ANALYSIS
Cost. As described earlier, the SCSEP program is federally funded, with the three
Connecticut grantees receiving a total of $4,783,097 in FY 13.
Benefit. In FY 13, there were 60 out of the 207 program exiters who left for unsubsidized
employment (29 percent). Given that SCSEP attempts to reach many of the hardest to employ
older adults, this relatively low employment rate may represent great success.
Cost per reemployed program participant. Combining the cost and benefit
information, it is estimated to have cost $79,718 for each of the 60 SCSEP program exiters who
became employed in FY 13 ($4,783,097 / 60).

Program Review and Investigations Committee Staff Findings and Recommendations: December 18, 2013
67
Chapter V
Evaluation of Higher Education Assistance to Target Population
This chapter evaluates higher education programs available to assist older workers with
reentry into the workforce, with a particular emphasis on the state’s community colleges, as
workforce development is central to their founding missions. Two additional programs at the
university level, however, were identified as being particularly successful in serving a large
proportion of older workers and therefore are also included in the assessment.
Community colleges educate almost half of the country's undergraduate students,
providing open access to postsecondary education, preparing students for transfer to four-year
institutions, providing workforce development and skills training, and offering noncredit
programs ranging from English as a second language to skills retraining to community
enrichment programs or cultural activities. Each community college is a distinct educational
institution with its own mission, linked by the shared goals of access and service. Open
admissions and the low tuition fees are among the practices they have in common.
Connecticut’s regional two-year public college system was created in 1965 to promote
access to higher education opportunities and help meet the state’s demand for a skilled
workforce. Community colleges provide two types of educational programs: credit and
noncredit. Credit programs lead to associate degrees or certificates and require a high school
diploma or GED for admission. Only for-credit course tuition and expenses are eligible for Pell
grant financial support. Admission to noncredit courses at community colleges does not require a
secondary school credential but there may be other prerequisites for certain classes. Noncredit
courses can be generally classified as either workforce or personal development.
Connecticut's 12 two-year public colleges are:
Asnuntuck (Enfield),
Capital (Hartford),
Gateway (New Haven),
Housatonic (Bridgeport),
Manchester (Manchester),
Middlesex (Middletown),
Naugatuck Valley (Waterbury),
Northwestern Connecticut
(Winsted),
Norwalk (Norwalk),
Quinebaug Valley (Danielson),
Three Rivers (Norwich), and
Tunxis (Farmington).
Mandated since 1989, C.G.S. Sec. 10a-73 requires each of the 12 community colleges
have a regional advisory board. The president of each college recommends individuals to the
board, which must be representative of the geographic area served. The purpose of each board is
to advise the college about appropriate educational programs to meet the needs of its community.
In addition, each community college professional program has a Program Advisory Council.
Advisory councils are composed of employers and industry leaders who help the college stay
aware of the needs of its regional businesses in a particular program area. The councils offer

Program Review and Investigations Committee Staff Findings and Recommendations: December 18, 2013
68
input to program curriculum and are concentrated in the professions, business, and financial
areas.84
ENROLLMENT TRENDS
BOR data show that only a small fraction of the higher education system is used by
students age 50 or older to pursue credit-based degree and certificate programs. Non-credit
programs, however – especially at the community college level – reflect higher utilization by
older students. In 2011, 31,067 students participated in non-credit coursework system wide, of
which an estimated 30 percent were age 50 or older.85
Some community colleges report even
higher utilization. For example, of the 3,300 non-credit workforce seats at Manchester
Community College in 2012-2013, more than half were students age 45 and older. Non-credit
courses at Norwalk Community College garnering more than 50 percent enrollment by students
over age 50 all share one thing in common – computer technology.
Non-credit programs do not lead to formal awards, so students are not eligible for federal
Title IV/Pell Grant financial aid. For more than five years non-credit program enrollments at the
community colleges have declined, likely due in part to decreasing state funding resulting in
increased costs to individual students.86
ASSESSMENT PRACTICES
The wide variety of non-credit programming has resulted in inconsistencies in monitoring
program effectiveness, if measured at all. For example, some programs register students upon
completion of the course, thus overestimating completion rates. From 2005-2012 completion job
placement, and wage data was available consistently for only 11 percent of participants, due to
their involvement in federally funded programs with reporting requirements.87
It should be noted the Department of Labor’s Office of Research is working with the
Board of Regents and the State Department of Education to institute a pilot program permitting
the linking of student records across the P – 20 spectrum and DOL wage records as students
enter the workforce. This “longitudinal data system” will enable research that links student
outcomes in the education system with success in the workforce, while protecting the
confidential information of individuals. The pilot is scheduled for implementation in August of
2013.88
RECENT RELEVANT LEGISLATION
Special Act 13-17 (AAC Non-Degree Certificate Programs and Technical Training
Courses Provided By The Regional Community-Technical Colleges And A Report On The
Budget, Expenditures, And Revenues Of The Constituent Units) requires the Office of Higher
84
2009 PRI report - Alignment of Postsecondary Education and Employment, P. 54. 85
Board of Regents for Higher Education October 3, 2013 PRI public hearing testimony 86
2013 RBA Report Card – Non-Degree Vocational Training Programs (Board of Regents: Community Colleges) 87
2013 RBA Report Card – Non-Degree Vocational Training Programs (Board of Regents: Community Colleges) 88
2013 RBA Report Card – Labor Market Information (CT Department of Labor)

Program Review and Investigations Committee Staff Findings and Recommendations: December 18, 2013
69
Education, in consultation with the Board of Regents for Higher Educaiton, to develop a list of
non-degree certificate programs and technical training courses offered by the community
colleges that directly correlate with workforce shortage areas in the state and report to the
legislature’s higher education committee by January 1, 2014.
ASSESSMENT OF PROGRAMS: MANUFACTURING TECHNOLOGY CENTERS
Established in 1998, the Advanced Manufacturing Technology Center at Asnuntuck
Community College (Enfield) has served as a model for the recent creation of three additional
manufacturing centers located at Housatonic Community College (Bridgeport), Naugatuck
Valley Community College (Waterbury), and Quinebaug Valley Community College
(Danielson). Following a solicitation for proposals, these colleges were selected by the Board of
Regents for Higher Education (BOR) based on their ability to establish or expand manufacturing
technology programs and their commitment to precision manufacturing. The BOR plans to
create a statewide advisory panel to support and guide the manufacturing centers. The new
Manufacturing Centers opened their doors in August 2012. The four Advanced Manufacturing
Technology Programs prepare students for a career in manufacturing by providing classroom
instruction, computer, and hands-on training in a lab environment.
Funding
State bond funding of $17.8 million ($8.9 million in each of FY 12 and FY 13) for the
development of the three manufacturing centers was provided for in the bipartisan Jobs Bill (P.A.
11-1, October Special Session), intended to encourage new job creation, while developing and
strengthening the state’s workforce competitiveness. This funding includes capital equipment
purchases as well as the renovation and expansion of existing college facilities to accommodate a
manufacturing center. Also included in the Jobs Bill package was $2.2 million in bonding
authorization ($1.1 million in each of FY 12 and FY 13) to expand Asnuntuck’s precision
manufacturing program.
The total annual operating budget for Asnuntuck’s manufacturing center is approximately
$1.8 million dollars, with the State contributing $790,500. The balance is earned through tuition
and a major employer-funded program of incumbent worker training with companies like Pratt
and Whitney and Sikorsky (approximately $300,000). The State’s annual budget contribution to
each of the new center start-ups is $300,000. Operating costs at each community college are
anticipated to be approximately $800,000 per year once renovations and capital expansions are
completed.
Tuition, fees, books and tools for the one-year manufacturing program at Asnuntuck
Community College (ACC) costs in-state students $7,050, with comparable costs at the other
community college manufacturing center programs. Scholarships, financial aid, and Pell grants
are available for students who qualify. Unemployed adults may qualify for WIA or TAA89
funding. ACC also established a high school scholarship program in the 2006-2007 school year.
Sponsoring employers provide full payment for tuition, fees, and books. During the second
semester, participants are employed two days a week while continuing their studies.
89
TAA, or Trade Adjustment Assistance, funds are made available to workers displaced by import competition and
offshore outsourcing.

Program Review and Investigations Committee Staff Findings and Recommendations: December 18, 2013
70
Population Served
Program participants are recruited through marketing, word of mouth, and referrals from
workforce investment boards. There are no age requirements for participants, which include
unemployed persons, dislocated workers, incumbent workers, returning veterans, high school
students exploring manufacturing careers, and out-of-school youth. For the Fall 2013 semester,
the average age for participants of the Advanced Manufacturing Centers is as follows:
Housatonic: 28.6 years old
Asnuntuck: 30.9 years old
Naugatuck Valley: 33.5 years old
Quinnebaug Valley: 39.5 years old
All students need to complete the program information package and admissions process. Once
admitted, students are required to maintain a grade of "C" in each program course for
advancement in the program.
Program Description
The Advanced Manufacturing Technology Program consists of two certificates, Basic
Level I and Advanced Level II. The standard core curriculum is a thirty-five hour per week,
thirty-four college credits program designed to provide students with the manufacturing skills
needed by today's manufacturers. Students spend approximately half their time in the classroom
and half engaged in hands-on activities and can choose between a day and night schedule.
Students can earn industry recognized credentials via a one-year certificate, a two-year
associate's degree, or transfer to a four-year university for a Bachelor of Science. Internships at
manufacturing companies – both paid and unpaid - are available for qualified students meeting
attendance standards and course prerequisites. Typically, scholarship students are paid interns,
earning $12 per hour for two days/16 hours each week. The timeframe is typically eight to 10
weeks in the second semester. Dislocated workers generally take unpaid internships to avoid
complications with their unemployment insurance compensation status.
The Basic Manufacturing: Machine Level Technology I Certificate (16 credits) provides
essential entry level skills by combining theory with hands-on practice. Students receive a
thorough grounding in Computer Aided Design (CAD), blueprint reading I, manufacturing
machining - drill press and saw, grinding, benchwork, lathe I, milling I, and Computer Numeric
Control (CNC) I.
The Advanced Manufacturing: Machine Level Technology II Certificate (18 credits) is
designed to provide students with the advanced manufacturing skills for those seeking
employment in machine technology and Computer Numerical Control (CNC) manufacturing
environments. Building on the skills developed in the Basic Manufacturing: Machine Level I
Technology Certificate, students develop advanced manufacturing skills in mathematics,
blueprint reading II, principles of quality control, lathe II, milling II, and CNC II.

Program Review and Investigations Committee Staff Findings and Recommendations: December 18, 2013
71
In addition, non-credit instruction in Metrology90
, Lean Manufacturing, Math, Computer
Applications, Careers in Manufacturing, Solid Works, and Coordinate Measuring Machine
(CMM) are incorporated into the program.
Housatonic Community College (HCC)
Housatonic has developed a 2,400-square-foot state-of-the-art manufacturing lab for
credit and non-credit programs. The HCC Advanced Manufacturing Center includes computer
labs, milling and lathe machines, CNC machines, rapid prototypers, a welding center, and
engineering design studio. This expansion enables the college to significantly broaden its
technology programs and course offerings.
HCC plans to upgrade the manufacturing laboratories at its partner vocational-technical
schools (Platt Technical High School in Milford and Emmett O’Brien Technical High School in
Ansonia). The college delivers its manufacturing processes course in the evening at Platt Tech,
while O’Brien Tech is working with HCC to strengthen math and English courses to increase
college readiness. In addition, through its “Bridges” high school initiative, the college has
created a link with all comprehensive and technical high schools in its 11 town service region
offering workshops and providing opportunities for curriculum alignment.
Naugatuck Valley Community College (NVCC)
The center was planned for a student enrollment increase of 100 percent in two years
(approximately 90 enrollees) and another 100 percent in five years (approximately 180
enrollees). As a result, NVCC anticipates purchasing additional additive manufacturing
machines, mills, new water jet stations and additional CNC equipment.
The NVCC Community and Economic Development Division will also provide
complementary non-credit courses so manufacturing students will be well-prepared to enter the
workplace as effective employees with manufacturing knowledge and skills. In addition, close
collaborations with NVCC’s Job Placement Center and the Northwest Regional Workforce
Investment Board will provide students with internships and industry partnerships producing
highly skilled graduates.
Quinnebaug Valley Community College (QVCC)
QVCC’s Manufacturing Technology Center encompasses the renovation and expansion
of its manufacturing laboratory into three distinct areas totaling approximately 5,300 square-feet.
The center delivers advanced manufacturing education focused on CNC machining and
programming, quality inspection and metrology, and mechatronics91
. The center offers paid
summer manufacturing internships and apprenticeships, as well as career placement.
In addition, QVCC and the Harvard H. Ellis Technical High School in Danielson have
partnered to ensure adequate capacity for the CNC Machining and Programming portion of the
90
Metrology is the scientific study of units of measurement. 91
Mechatronics unites the principles of mechanics, electronics, and computing.

Program Review and Investigations Committee Staff Findings and Recommendations: December 18, 2013
72
center. The combined Manufacturing Technology Centers at both QVCC and Ellis Tech will
have the capacity to serve 300 to 400 students annually.
Outcomes
Asnuntuck Community College
More than 1,000 students have graduated from Asnuntuck’s technology programs and
have transitioned to the private sector with the technological abilities that benefit local industry.
ACC’s technology programs typically graduate 90 percent of enrollees and place 90 percent of
its graduates within three months. Entry level employment for manufacturing technology
graduates provide incomes ranging from $35,000 to $40,000 annually. Table V-1 contains
information on the number of CMT graduates by age for the last three years.
Table V-1. Asnuntuck Community College
Manufacturing Technology Center Graduates by Age
ACC MFG Class '11 Class '12 Class '13
Age # % # % # %
18-22 10 15% 26 30% 51 34%
23-29 5 7% 15 17% 32 21%
30-39 11 16% 16 18% 14 9%
40-49 15 22% 13 15% 20 13%
50+ 26 39% 18 20% 35 23%
Total 67
88
152
*If a student received more than one certificate or degree in the
Same year, the student is only counted once in his/her age category.
Inmates and non-CMT run awards were excluded.
Table V-2 provides participation and outcome data for Asnuntuck Manufacturing students age 50
and older.
Table V-2. Asnuntuck Community College
Manufacturing Technology Center Data for Participants 50 and Older
YEAR YEAR YEAR
50+ Students 2011 2012 2013
Enrollments 32 22 38
Graduates 26 18 35
Graduation Rate 81.3% 81.8% 92.1%
Placed 22 16 31
Placement Rate 84.6% 88.9% 88.6%
The three new manufacturing centers are responsible for providing these same outcome measures
—which include students graduating from the program and final job placement in the state’s
manufacturing industry.
Program Review and Investigations Committee Staff Findings and Recommendations: December 18, 2013
73
Housatonic Community College (HCC)
Enrollment in HCC’s technical programs has increased over the last several years, as they
provide pathways for students interested in engineering, manufacturing and technology to
transfer to four-year programs at Central Connecticut State University, the University of
Connecticut, and Fairfield University.
Naugatuck Valley Community College (NVCC)
Current enrollment and graduation trends indicate a resurgence in NVCC manufacturing
programs. There has been a 425 percent increase in the number of students enrolled in
manufacturing certificate programs between 2006 and 2010.
Quinnebaug Valley Community College (QVCC)
Since the fall of 2005, QVCC has had an enrollment increase of 32 percent for
manufacturing majors and achieved 100 percent successful manufacturing job placement or
university transfer for its manufacturing graduates.
Cost Effectiveness Analysis
Cost. After accounting for revenues from tuition and employer-funded training programs, net
operating costs for the Asnuntuck Manufacturing Technology Center totaled $790,500 in FY 13.
Outcome. There were 152 graduates in 2013 from Asnuntuck’s Manufacturing Technology
Center, of which approximately 90 percent were placed in employment for a total of
approximately 137 job placements.
Cost per reemployed program participant. It is estimated to cost $5,770 for each of the 137
participants at Asnuntuck Manufacturing Center who became employed ($790,500 / 137).
ASSESSMENT OF PROGRAMS: PLUS 50 INITIATIVE
Organized in 2008 by the American Association of Community Colleges (AACC), the
Plus 50 Initiative is a national project to benchmark the most current and innovative programs at
community colleges that engage learners age 50 and over. A significant aspect of this initiative
is to facilitate information sharing and best practices in serving the unique instructional and
academic support needs of older learners. The project is focused on workforce training and
preparing the 50 plus population for new careers. Three of Connecticut’s community colleges
have recently joined this initiative – Middlesex, Naugatuck, and Norwalk.
Funding
Due to its early record of success, the program has continually attracted new grant
funding and interest from additional community colleges. In addition to grant funds (typically

Program Review and Investigations Committee Staff Findings and Recommendations: December 18, 2013
74
$15,000 per award), participating colleges gain access to marketing materials, evaluation
expertise, a Web-based planning and implementation process, toolkits, and resource materials.
The Plus 50 Initiative
The project began in 2008 with a three-year $3.2 million grant from The Atlantic
Philanthropies and involved 15 community colleges chosen by a competitive RFP process.
The Plus 50 Completion Strategy
Leveraging funding from The Atlantic Philanthropies, Lumina Foundation supported this
expansion with $800,000 in funding over four years.
The Plus 50 Encore Completion Program
This project is tripling in size the Plus 50 Initiative to 100 community colleges from 2012
to 2015. A $3.2 million grant provided by Deerbrook Charitable Trust supports this expansion.
The $15,000 grant funding will provide these new plus 50 colleges with tools and resources,
funds and expertise needed to build successful plus 50 programs.
Population Served
Through the original program and the subsequent expansions the Plus 50 Initiative has
served more than 32,580 community college students age 50 and older nationwide.
Program Description
The Plus 50 Initiative
The Plus 50 Initiative invests in community colleges to create or expand campus
programs that engage the plus 50 student. The project began with a focus on learning, training
and retraining, and civic engagement however quickly re-tooled in 2009 as a result of the
economic recession to focus on workforce training and preparing for new careers. This first
expansion welcomed an additional 12 colleges to the initiative.
The Plus 50 Completion Strategy
From 2010 to 2014, the second expansion has focused on increasing the number of 50
plus students, especially those with prior college credits, to complete degrees, certificates or not-
for-credit credentials in high-value occupations that can help them get hired. To leverage
resources as efficiently as possible, the initiative employed a peer learning model that provides
community colleges the opportunity to share knowledge on starting and sustaining quality
educational programs for plus 50 students.
The Plus 50 Encore Completion Program
Program Review and Investigations Committee Staff Findings and Recommendations: December 18, 2013
75
From 2012 to 2015, the third and most recent initiative expansion aims to triple
participation to 100 community colleges and help 10,000 baby boomers earn high-value degrees
or certificates in fields that give back (education, health care, social services) and are hiring. To
increase capacity, AACC consolidated its model into a Web-based, 5-step planning and
implementation process. Participating colleges offer skill updates to prepare older adults to
transition into careers such as pharmacy technicians, clinical dental assistants, early childhood
educators, medical billing and coding specialists, certified nursing assistants, substance abuse
counselors, adult basic education instructors, human resources specialists, and positions in other
in-demand fields.
Recently, three Connecticut community colleges applied and were selected to join the initiative:
Middlesex Community College (2013) - The college prepares older adults for careers as
certified nursing aides, medical billing and coding specialists, ophthalmic medical
assistants, patient care technologists, and pharmacy technician assistants.
Naugatuck Valley Community College (2013) - The college prepares plus 50 adults for
careers in human services and social work, nursing, and early childhood education.
Norwalk Community College (2012) - The college prepares older adults for such careers
as medical or dental assistants, home health aides, nursing assistants, and child
development associates.
Outcomes
Due to recent implementation, outcomes data for the three Connecticut community
colleges is not yet available.
At the national level, AACC engaged an independent evaluator to measure college
grantees implementation progress and participant satisfaction. Grantee successes and challenges,
as well as information on practices contributing to plus 50 student successes, are provided for use
by other community colleges.
During the first three years of the initiative, the number of workforce training courses that
were targeted specifically to plus 50 students increased dramatically - from 54 to 1,147.
Evaluators found that enrollment in courses associated with the Plus 50 program more than
doubled, increasing by more than 15,000 students from baseline to the end of the program’s
second year. About 90 percent of plus 50 students in workforce training programs agree that their
plus 50 courses have helped them acquire new skills or improve upon their current job skills.
Seventy-two percent of students agreed that their workforce training program had helped them
get hired for a job.
The primary goal of the Plus 50 Completion Strategy is that grantee community colleges
would serve 9,000 adult students over the age of 50 across four years, with 3,600 (40%)
completing a degree, certificate, or not-for-credit certificate. To date, evaluators found that the
colleges involved in the Plus 50 Completion Strategy have exceeded those goals, as they have
Program Review and Investigations Committee Staff Findings and Recommendations: December 18, 2013
76
served 16,507 plus 50 students, and 7,192 (44%) of these students have completed a degree or
credential. Furthermore, of the 12 colleges able to collect employment data, 715 of these
students have secured employment since completing their program. This number significantly
undercounts employment outcomes, even within this 12 college subset due to difficulty of
obtaining job placement information after students complete their programming.
Best Practices
The early colleges involved in the initiative learned a great deal about how colleges could
better engage and support 50 plus students (as well as students of all ages), which are
documented in The Plus 50 Initiative: Standards of Excellence:
Offer learner-centered programming
o Tailor instructional delivery to meet the needs of plus 50 students
Examples include accelerated courses plus 50 students who need to re-enter
the job market quickly, flexible scheduling options to accommodate work and
family demands, and providing online/distance learning courses to increase
accessibility and allow students to progress at their own pace
o Take into account the learning styles of the plus 50 student
For example, encourage instructors to make classes more interactive
Promising Practice: Career Changers Course
o Offer a short course for plus 50 students that provides career exploration and
assessment tools, and provides students access to occupational trend projections and
data on employer demand in the local labor market
Learner Support Services offer a wide range of “system navigator” supports:
o Additional services that enable a plus 50 learner to more easily navigate the
community college system including new student orientations for plus 50 students;
registration support; or guidance to sources of financial aid
Provide accessible and accommodating materials and environments:
o Ensure physical comfort and accessibility by leveraging the technology at the
college—for example, using smart rooms with technological supports, such as dual
monitors and microphones and speakers, enhances audio and visual content
o Be mindful of transportation access and options—choose event and course locations
close to public transportation or provide transportation services to facilitate plus 50
students’ access to courses and services
o Make community college more affordable—if possible, offer direct financial aid.
Design referrals to sources of financial aid and financial assistance workshops that are
tailored to plus 50 students
Also, data on program effectiveness are not presently available to measure performance of non-
credit vocational programs, particularly in regards to the primary goal of attaining employment.

Program Review and Investigations Committee Staff Findings and Recommendations: December 18, 2013
77
ASSESSMENT OF PROGRAMS: ENCORE!HARTFORD (UCONN)
Encore!Hartford is a program of the University of Connecticut Department of Public
Policy Nonprofit Leadership Program (UConn NLP). Established in 2010, Encore!Hartford was
designed to achieve two goals: the re-employment of Connecticut’s seasoned corporate and
public service professionals and the filling of professional-level and managerial human resource
needs of Connecticut’s nonprofit sector.
The program was designed and implemented in partnership with Leadership Greater
Hartford, Connecticut Department of Labor, Capital Workforce Partners,92
CTWorks,93
United
Way of Central and Northeastern Connecticut, Connecticut Association of Nonprofits, Jewish
Family Services, over 100 nonprofit partners and its newest partner, AARP Connecticut. The
16-week training program consists of 64 hours of educational training held at different nonprofit
agencies with facilitation by experienced nonprofit professionals and consultants followed by an
8-week fellowship project at a nonprofit in professional-level management.
Funding
The current program fee is $2,850 per participant.94 Approximately half of each class
has paid this fee out-of-pocket, while the remaining half has been eligible for full scholarships
through the Workforce Investment Act (WIA). For scholarship consideration participants must
first apply for WIA eligibility at his or her local One-Stop. In addition, AARP Connecticut is
providing a total of $8,000 in financial assistance for up to five Fairfield County residents who
have been accepted into the 2014 Class. Final financial assistance from AARP CT awards may
be for the full or partial program fee. Awards will be determined by a university review
committee based on merit and financial need.
Direct costs to the program are approximately $35,000 per year. Indirect costs include
staff salaries and benefits, office space, electricity, and administrative support and are also
estimated at approximately $35,000. Thus, the total program cost is an estimated $70,000
annually. Each Encore!Hartford class has generated sufficient revenue, comprised of student
course fees95
and organization fellowship host fees ($100 to $300 each based on a sliding scale),
to cover the cost of the program.
Population Served
Although there are no age requirements, the program is targeted to 40-75 year-old
unemployed or underemployed mid-career and traditional retirement-aged professionals. These
former corporate and public service professionals hear about the program through media
coverage, referrals from partners and word of mouth. To date, participant ages have ranged from
35 to 72, with the majority of participants being over age 50 and unemployed for over one year.
Chosen through a competitive application and selection process based on their skill-sets and
92
North Central Connecticut Workforce Investment Board 93
One-stop career guidance and training center 94
Due to projected increased costs it is anticipated that the program fee will increase to $3,000 after the upcoming
Spring 2014 class. 95
Maximum 25 participants x $2,850 = $71,250.

Program Review and Investigations Committee Staff Findings and Recommendations: December 18, 2013
78
potential for success in the nonprofit sector, a maximum of 25 candidates are selected for the
program each year. While Encore!Hartford currently receives more applications than it can
serve, program staff estimate replication in another area of the state is feasible with the addition
of one full-time staff member.
Program Description
Encore!Hartford assists unemployed corporate professionals transition their skill sets and
experience into successful professional and managerial employment in the nonprofit sector. The
64-hour classroom component of the program focuses on the similarities as well as differences in
best practices between corporate and nonprofit business management. Beginning in March of
each year, the four-hour classes meet twice a week for two months. Topics covered include
nonprofit leadership, program management, finance, governance, funding strategies,
organizational management, program outcome measurement, and job search strategies. Using a
practitioner-based learning model, each session is facilitated by seasoned nonprofit executives
and expert consultants serving the sector. To aid in the participants’ immersion into the sector,
classes are hosted in a diverse selection of nonprofit agencies.
The capstone of the program is a two-month, 30-hour per week unpaid fellowship,
scheduled from mid-April to mid-June at a Connecticut nonprofit. Encore Fellows are carefully
matched with a vetted host nonprofit to work on a professional-level project that meets the career
goals of the fellow and the specific needs of the nonprofit organization. During the fellowship
period, fellows meet as a group, facilitated by the Nonprofit Leadership Program, to share and
process their experiences. In a few cases, a fellow becomes employed with the organization
where the fellow completed his or her project, however this is an expectation.
Networking is emphasized throughout the program. Participants select organizations
from a wide range of identified nonprofits including those representing the arts, culture and
history, social services, youth and education, health, and environment as informational contacts.
Upon completion of both the education and fellowship components, graduates work with
program staff to prepare and connect with employment opportunities. As the program has gained
recognition, staff has been routinely contacted about job openings, asking if there are any
Encore!Hartford graduates who might be suitable for the position. Through CTWorks, WIA
participants are provided with a reemployment coach and job developer for assistance with
updating résumés, interview coaching, and job placement.
Outcomes
Since it began in 2010, Encore!Hartford has enrolled and graduated 93 participants
resulting in a 100% graduation rate for each of the four completed program years. The average
overall (full-time and part-time) employment rate for the 70 who graduated in 2010 through 2012
is 87 percent. Average full-time employment for the 2010 to 2012 graduates is 67 percent, with a

Program Review and Investigations Committee Staff Findings and Recommendations: December 18, 2013
79
96 percent retention rate.96
As of November, 12 of 23 graduates from the June 2013 class have
been employed (7 full-time, 5 part-time) within five months for an employment rate of 52
percent. Factoring in this newest class, the average overall (full-time and part-time) employment
rate for the 93 graduating from 2010 to 2013 is 78.5 percent.
In addition to employment outcomes, surveys are used to gauge program satisfaction and
make necessary improvements each year. Encore Fellows are asked to complete three
comprehensive evaluations: two focused on the classroom component of the program and one on
the fellowship. Encore Fellowship Hosts are asked to complete one comprehensive evaluation
covering their experience as a host organization.
Cost Effectiveness Analysis
Cost. Costs for the Encore!Hartford program are estimated at $70,000 per year. The program
has run for four years.
Outcome. 78.5 percent of graduates (73 of 93) have been placed in full-time or part-time
employment (2010-2013).
Cost per reemployed program participant. Combining the cost and primary outcome
information for the past four years, it is estimated to cost a total of $3,836 for each of the
participants who became employed ($70,000 x 4 yrs = $280,000) / 73 job placements).
ASSESSMENT OF PROGRAMS: ADVANCED LEADERSHIP TRAINING PROGRAM
(CCSU)
The result of a collaboration between the Central Connecticut State University Institute of
Business Development (ITBD)97
and Capital Workforce Partners98
, the Advanced Leadership
Training Program equips and empowers dislocated professionals to transition into leadership and
upper management positions. The program covers five modules: Six Sigma, Project
Management, Emotional Intelligence, Lean Enterprise, and 21st Century Leadership.
Funding
National Emergency Grant (NEG)99
funds were utilized to cover the cost of tuition
(approximately $6,000) for a package of training courses at the ITBD, resulting in no out-of-
96
The full-time retention rate assesses retention at any job at a nonprofit (if someone moved
around to several jobs at nonprofits, that would still count as job retention, as long as the person
is working at a job. 97
Since 1986, ITBD has been supporting Connecticut businesses and organizations by providing a full spectrum of
training, technology, and manufacturing process assistance, government procurement services, small business
development, and conferencing services. 98
CWP is the workforce investment board for Connecticut’s North Central region. 99
National Emergency Grants (NEGs) temporarily expand the service capacity of Workforce Investment Act
Dislocated Worker training and employment programs at the state and local levels by providing funding assistance
in response to large, unexpected economic events that cause significant job losses.

Program Review and Investigations Committee Staff Findings and Recommendations: December 18, 2013
80
pocket costs to student participants. Although these NEG funds have expired, the individual
courses are still available through the ITBD. Students may be eligible for WIA funding through
their workforce development board. If not eligible, tuition costs are paid out-of-pocket.
Population Served
The ideal candidates have a Bachelor’s degree or equivalent experience, employment
experience in insurance, banking, finance, information technology and/or manufacturing, and are
seeking management positions within their respective industries. There are no age requirements;
however, participants in the NEG-funded (now expired) Advanced Leadership Program had to
be unemployed. Admission to courses is on a rolling basis, with classes held once a sufficient (at
least 6-8) number of students has enrolled.
Program Description
This 12-week, graduate-level training program is designed to equip participants with the
knowledge, skills, and abilities needed to succeed in transitioning into management positions.
Training modules include:
Six Sigma
Six Sigma Black Belt Certification assists individuals in being able to utilize statistical
tools and measures to reduce and control variation and waste in a business’s processes.
The format allows participants to work on projects between classes, either individually or
in teams, utilizing the tools learned.
Fifteen-day course.
$2,495
Project Management
The objective of this program is to provide project leaders with planning skills, and the
confidence to effectively manage project teams of one or twenty – even when there is
little formal authority over human and other resources. This workshop is highly
interactive and discussion-oriented. Participants are encouraged to plan a near-term
project that they will manage.
Three-day course
$995
Lean Enterprise
The focus of Lean Enterprise is to reduce waste in business processes, improve lead times
and on-time-delivery, reduce inventory levels, cut costs and provide better customer
service. Students learn the methods to implement Lean Enterprise process improvement
in organizations.
Four-day course
$1,195

Program Review and Investigations Committee Staff Findings and Recommendations: December 18, 2013
81
21st Century Leadership
A three-day course covering the following topics:
o Leading the Organization
o Leadership ‘Presence’ and Interpersonal Skill Development
o Setting Expectations to Enable Performance
o Managing and Improving Performance
o Developing Your Organization/Promoting Teamwork
o $695
Since the training program meets the education requirements for Six Sigma Black Belt
and Project Management Institute’s Project Management Professional certifications, participants
who complete the program obtain in-demand management credentials.
Outcomes100
Data were not readily available for trainees funded with National Emergency Grant
money, although was collected. Of the 95 dislocated workers trained at ITBD between April
2009 and April 2013 under regular WIA Dislocated Worker funding:
95 were trained
72 reported employment – 76%
60 reported working 37 hours/week or more – 85% of employment
11 reported an hourly wage of $50 or more (annualized salary $104,000+) – 15%
11 reported an hourly wage of $38 - $47 (annualized salary = $80,000+) – 15%
9 reported an hourly wage of $30 - $36 (annualized salary = $62,400 - $74,880) - 13%
17 reported an hourly wage of $20 - $28 (annualized salary = $41,600 - $58,240) – 24%
23 reported an hourly wage less than $20 (annualized salary below $41,600) – 33%
1 person reported hours but not the wage.
The average reported hourly wage was $28.38.
Cost Effectiveness Analysis
Cost. Costs for the Advanced Leadership Training program are estimated at $6,000 per
participant. There were 95 participants for a total cost of $570,000.
Outcome. 76 percent of graduates (72 of 95) reported employment.
Cost per reemployed program participant. Combining the cost and primary outcome
information, it is estimated to cost a total of $7,916 for each of the participants who became
employed ($570,000 / 72 employed).
100
Outcomes data provided by Capital Workforce Partners.

Program Review and Investigations Committee Staff Findings and Recommendations: December 18, 2013
82
This Page Intentionally Left Blank

Program Review and Investigations Committee Staff Findings and Recommendations: December 18, 2013
83
Chapter VI
Potential Use of Technical High Schools as a Resource for Older Worker
Retraining
This chapter evaluates the state’s technical high school system as a resource for the
reemployment of older workers. Current uses for adult learners, after hours use and potential
collaborative opportunities are discussed.
The Connecticut Technical High School System (CTHSS) consists of seventeen technical
high schools located throughout the state, one technical education center located in Bristol, and
two aviation centers (Hartford and Stratford) (Figure VI-1). The mission of the Connecticut
Technical High School System is to “provide a unique and rigorous high school learning
environment that: ensures both student academic success, and trade/technology mastery and
instills a zest for lifelong learning; prepares students for post-secondary education, including
apprenticeships, and immediate productive employment; and responds to employers' and
industries' current and emerging and changing global workforce needs and expectations through
business/school partnerships.”101
Technical high schools serve both traditional-aged high school
students and adult students (post-high school graduates).
Like the community colleges, each career cluster within the technical high schools is
statutorily required to have an industry advisory committee.102
Advisory committees assist in
establishing specific skills standards, curriculum and a career ladder.
FUNDING & GOVERNANCE
The state of Connecticut funds and operates the Connecticut Technical High School
System. High school students attend free of charge. Tuition costs for adult students for 2012-
2013 are $3,500 for a 1-year program and $4,100 for the 1.5 year LPN program.103
The
Connecticut Technical High School System offers financing options including104
:
Title IV/Pell Grant – may be available to eligible full-time students;
tuition waivers are available for veterans, students age 62 and over (subject to seat
availability), and students enrolled in the Certified Nurse Assistant program that are
experiencing financial hardship;
funding from other state agencies (i.e. Dept. of Labor via WIA); and
G.I. Bill Veteran Education Benefits
Alternatively, adult students can also apply for a private student loan or inquire in their
communities about local scholarships and grants.
101
http://www.cttech.org/central/about-us/mission.htm Accessed on November 4, 2013. 102
CGS Sec. 4-124gg. 103
CTTHS 2011-2012 Gainful Employment Disclosures 104
http://www.cttech.org/AdultED/index-Financial-Aid.htm Accessed on November 29, 2013.

Program Review and Investigations Committee Staff Findings and Recommendations: December 18, 2013
84
Until FY 13 the CTHSS was under the jurisdiction of the Connecticut State Board of
Education, which appointed four of its members to the CTHSS Committee. Effective July 1,
2012, in accordance with Public Act 12-116, a new 11-member Connecticut Technical High
School System Board was created. The new board includes members from education and
industry as well as the commissioners from the Departments of Labor and Economic and
Community Development.
POPULATION SERVED
In 2012-13, a total of 11,195 students were enrolled in technical high schools: 10,652 (95
percent) secondary students were enrolled full time and an additional 96 (1 percent) secondary
students were enrolled in Bristol Technical Education Center (TEC) (11th and 12th graders
only), and 447 (4 percent) adult students were enrolled in programs across the district, as of
October 2012. The only general requirement for adult students is a high school diploma or its
equivalent.
PROGRAM DESCRIPTION
Current Uses
Technical program relevance is ensured through an extensive network of technology
advisory committees, assessments and adaptive response to the implementation of emerging
technologies of the workplace. The secondary school program offers 30 trade/technologies,
however not all programs are available at each school (Table VI-1). The median number of trade
programs available at any given secondary school is eleven. The trade/technologies with the
most number of shop locations are as follows:
1. Culinary Arts (17)
2. Automotive Technology (17)
3. Carpentry (16)
4. Electrical (16)
5. Hairdressing/Barbering (14)
6. Manufacturing Technology (13)
7. Plumbing and Heating (12)
8. Computer Aided Drafting & Design (11)
9. Heating, Ventilation & A/C (10)
10. Automotive Collision Repair &
Refinishing (9)
Adult students are offered full-time post-secondary day programs and part-time evening
apprentice and extension programs for retraining and upgrading skills. Adult full-time day
programs at Bristol TEC105
are Automotive Technology, Culinary Arts, Electronics Technology,
HVAC (Heating, Ventilating and Air Conditioning), Manufacturing Technology, and Welding
and Metal Fabrication. Eligible students can qualify for the Work Based Learning Program in
which they earn wages from an employer in an industrial setting. The program reinforces
students’ classroom theory with actual experience in a work environment. Students can also earn
credit hours toward apprenticeships.106
Employers are required to pay the minimum wage,
105
Adult students at Bristol TEC attend classes with junior and senior high school students. 106
See Chapter III for further discussion of the apprenticeship program.
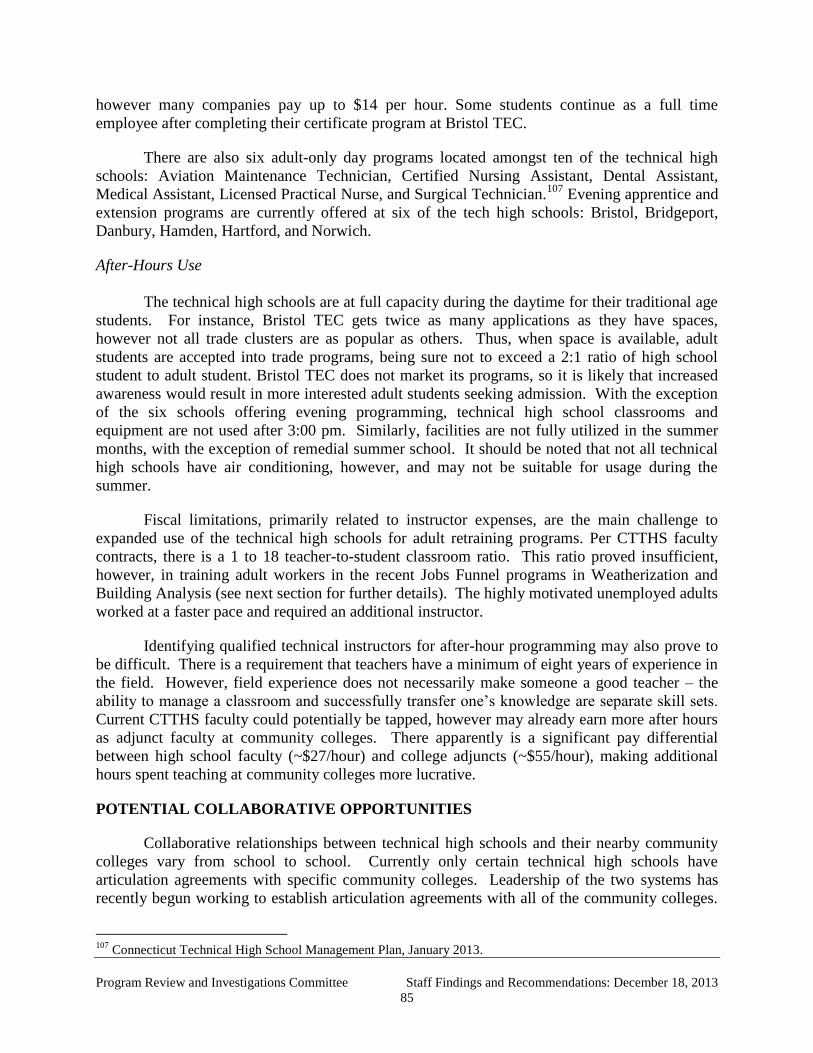
Program Review and Investigations Committee Staff Findings and Recommendations: December 18, 2013
85
however many companies pay up to $14 per hour. Some students continue as a full time
employee after completing their certificate program at Bristol TEC.
There are also six adult-only day programs located amongst ten of the technical high
schools: Aviation Maintenance Technician, Certified Nursing Assistant, Dental Assistant,
Medical Assistant, Licensed Practical Nurse, and Surgical Technician.107
Evening apprentice and
extension programs are currently offered at six of the tech high schools: Bristol, Bridgeport,
Danbury, Hamden, Hartford, and Norwich.
After-Hours Use
The technical high schools are at full capacity during the daytime for their traditional age
students. For instance, Bristol TEC gets twice as many applications as they have spaces,
however not all trade clusters are as popular as others. Thus, when space is available, adult
students are accepted into trade programs, being sure not to exceed a 2:1 ratio of high school
student to adult student. Bristol TEC does not market its programs, so it is likely that increased
awareness would result in more interested adult students seeking admission. With the exception
of the six schools offering evening programming, technical high school classrooms and
equipment are not used after 3:00 pm. Similarly, facilities are not fully utilized in the summer
months, with the exception of remedial summer school. It should be noted that not all technical
high schools have air conditioning, however, and may not be suitable for usage during the
summer.
Fiscal limitations, primarily related to instructor expenses, are the main challenge to
expanded use of the technical high schools for adult retraining programs. Per CTTHS faculty
contracts, there is a 1 to 18 teacher-to-student classroom ratio. This ratio proved insufficient,
however, in training adult workers in the recent Jobs Funnel programs in Weatherization and
Building Analysis (see next section for further details). The highly motivated unemployed adults
worked at a faster pace and required an additional instructor.
Identifying qualified technical instructors for after-hour programming may also prove to
be difficult. There is a requirement that teachers have a minimum of eight years of experience in
the field. However, field experience does not necessarily make someone a good teacher – the
ability to manage a classroom and successfully transfer one’s knowledge are separate skill sets.
Current CTTHS faculty could potentially be tapped, however may already earn more after hours
as adjunct faculty at community colleges. There apparently is a significant pay differential
between high school faculty (~$27/hour) and college adjuncts (~$55/hour), making additional
hours spent teaching at community colleges more lucrative.
POTENTIAL COLLABORATIVE OPPORTUNITIES
Collaborative relationships between technical high schools and their nearby community
colleges vary from school to school. Currently only certain technical high schools have
articulation agreements with specific community colleges. Leadership of the two systems has
recently begun working to establish articulation agreements with all of the community colleges.
107
Connecticut Technical High School Management Plan, January 2013.

Program Review and Investigations Committee Staff Findings and Recommendations: December 18, 2013
86
For example, the Board of Regents for Higher Education (BOR) is spearheading the
collaboration between the Connecticut Technical High School System and the Manufacturing
Center community colleges to determine a process for approving college credits for technical
high school graduates who graduate with National Institute for Metalworking Skills (NIMS)
credentials.108
CTTHS and BOR are also working on developing a memorandum of agreement
regarding the availability of several technical high schools to support after-hours education and
training for community college programs.
A recent successful collaboration between the technical high schools and the community
colleges developed in providing Jobs Funnel programs in Weatherization and Building Analysis
to instruct unemployed adults designated by the five workforce regions in Connecticut. CTTHS
faculty designed, and students built, the mockups utilized for the program. Programs were
offered at four technical high schools (Ansonia, Bridgeport, Hartford, and Norwich) and one
community college (NVCC - Waterbury). Another successful collaboration exists between Ellis
Tech and Quinnebaug Valley Community College. They have partnered to ensure adequate
capacity for the CNC Machining & Programming portion of the college’s new advanced
manufacturing center.
OUTCOMES109
In 2012, 79 percent of the more than 2,400 technical high school graduates were eligible
for either national or state certifications and/or licensing credentials in their trade, in addition to
earning a high school diploma and trade endorsement. Twenty one percent of students earned a
diploma and trade endorsement, but their trade curriculum did not have an association to a
national or state certification at that time. According to a survey of high school graduates four
months following graduation, 58.5% were pursuing additional education, 34.6% had entered the
workforce or armed services, and 6.9% were unemployed.
Outcomes data on adult students had not been collected until 2012. Of the 119 adult
student respondents, 86 students (72%) reported being employed. In general, there is a lack of
data to measure performance of adult student vocational programs, particularly in regards to the
primary goal of attaining employment.
108
College credits were previously awarded by Charter Oak regarding the NIMS credentials.
109 Connecticut Technical High School System (Dept of Education): 2013 Program Report Card

Figure VI-1. Connecticut Technical High Schools

Program Review and Investigations Committee Staff Findings and Recommendations: December 18, 2013
88
Table VI-1. Offerings at Connecticut Technical High School System 2013-14

Program Review and Investigations Committee Staff Findings and Recommendations: December 18, 2013
89
Chapter VII
Alternatives to Public Sector Programs
Besides the state-run programs and services previously reviewed in labor, aging, and
education areas, there are additional resources available to assist in the reemployment of older
workers. This chapter describes nonprofit, volunteer, and privately funded initiatives.
Information on the use of career coaches and temporary agencies is also provided as potentially
viable resources for unemployed older workers.
AARP
AARP is a nonprofit, nonpartisan organization, with a membership of more than 37
million persons 50 years and older. The organization advocates to enhance the quality of life for
older persons. AARP offers many resources dedicated to older jobseekers and entrepreneurs via
its national website content and a variety of strategic partnerships, including:
The AARP Best Employers for Workers Over 50 Award, cosponsored by the Society for
Human Resource Management (SHRM), is a biennial program that recognizes employers
with exemplary practices for recruiting and retaining mature workers.
Life Reimagined for Work (formerly Work Reimagined), a project of AARP powered by
LinkedIn, is a national online effort to help employers solve their current and future
staffing challenges, provide older workers with job search tools and networking
opportunities, and direct them to employers that value and are hiring experienced
workers.
Encore Entrepreneurs, co-sponsored with AARP and the Small Business Administration
(SBA), is a self-paced, easy-to-follow 30-minute online course designed to help people
over 50 get the information they need to start and grow a business as a second career.
The AARP Foundation has supported Platform to Employment (discussed in-depth later
in this chapter) through grant funding. At the state level, AARP Connecticut also provides
targeted funds and often in-kind support for workforce development programs targeted to older
job seekers, including Bridges to Employment through the Workplace, Inc.110
and
Encore!Hartford (discussed in-depth in Chapter V). AARP CT also supports entrepreneurialism
through free seminars with the local Small Business Administration and collaborations and with
reSET: Social Enterprise Trust.
Population Served
Anyone 50 or over can be a member of AARP for $16 a year. Membership covers one’s
spouse or partner, for no additional charge. Membership benefits include access to group
discounts, state and national advocacy, and subscriptions to AARP’s bulletin and bimonthly
110
The Workplace, Inc. is the workforce investment board for southwestern Connecticut.

Program Review and Investigations Committee Staff Findings and Recommendations: December 18, 2013
90
magazine. Anyone younger than 50 may join AARP as an associate member for $12.50 per year;
however, would not have access to group discounts. AARP’s website content is free and
available to anyone regardless of age.
Any U.S.-based employer with at least 50 employees is eligible to apply for the AARP
Best Employers for Workers Over 50 Award.
Bridges to Employment
For this pilot program, participation was limited to 20 to 25 unemployed individuals age
50+ residing in the Bridgeport and Stamford labor market area. AARP Connecticut funded the
pilot and assisted with recruitment.
Program Description
AARP Best Employers for Workers Over 50 Award
Since its inception in 2001, this award has recognized employers who have set the
standard for innovative programs that help recruit, retain, and engage older workers. One of the
goals of the program is the share the best practices of the award winners with the business
community at large. As a result, all applicants receive a benchmarking report comparing their
scores with those of other applicants.
Applying for recognition is voluntary. Key areas of consideration include: recruiting
practices, opportunities for training, education and career development; workplace
accommodations; alternative work options, such as flexible scheduling, job sharing, and phased
retirement; employee health and retirement benefits and retiree work opportunities. The list of
2013 winners includes employers from a variety of sectors, including for-profit and nonprofit,
health care, education, insurance, utilities, industrial, and government. Three industries - health
care, education and government made up 64 percent of the winning list:
Health Care (36%) As the U.S. population ages, health care continues to be an area of
high demand and a good place for older workers. In 2013, 18 hospitals and/or health care
systems made AARP’s list representing organizations around the country. Six of these
employers made the top 10.
Education (18%) Educational institutions, primarily within higher education, are also top
employers for older workers and are well represented – with 9 of the 50 spots on the
AARP list.
Government (10%) Generous health and retirement benefits offered by government jobs
are an attraction to older workers, even if the pay is often lower than in the private sector.
Government agencies made up 5 of AARP’s 50 award winners.
Representing Connecticut, Yale-New Haven Hospital (YNHH) was the only in-state
employer to be honored on the current list of Best Employers for Workers over 50. YNHH was
previously recognized with this award in 2005 and 2006. Nearly 30 percent of YNHH
employees are age 50 plus with an average tenure of 18 years. With 500 to 600 job openings at

Program Review and Investigations Committee Staff Findings and Recommendations: December 18, 2013
91
any given time, YNHH recruits its workforce on a large scale and values mature workers for
their experience, as well as their willingness to mentor less experienced co-workers. YNHH
offers a number of programs and benefits to attract and support mature workers, including tuition
reimbursement and training opportunities, flexible work schedules and alternative work
arrangements, free health screenings and wellness programs, financial and retirement planning
and dependent care benefits.
Aside from YNHH, only two other Connecticut companies have been recognized on the
Best Employers for Workers over 50 list – Pitney Bowes in Stamford (2004, 2005) and The
Hartford Financial Services Group in Hartford (2002, 2005).
Bridges to Employment
The 16-week pilot program, funded by AARP CT and run by The Workplace Inc. from
December 2012 to April 2013, was customized to meet the specific needs of older workers by
increasing their skills and marketability to better position them to return to the workforce.
Through a series of one-on-one counseling, seminars, interactive workshops, and job clubs,
participants received training on the most important skills and aptitudes sought by today's
employers, learned how to use technology effectively as a job search tool, and created an
individualized development plan to assist in meeting their employment goals. The Bridges to
Employment program also addressed topics such as self-employment, wellness and financial
planning. Additionally, participants engaged in volunteer opportunities that could help them
gain relevant experience to fill the gap in employment on their resumes.
Outcomes
Nationally, a total of 130 employers applied for consideration for the 2013 Best
Employers for Workers Over 50 Award. Of the Top 50 winners, a great number indicated they
are reaching out to recruit retirees, according to AARP. For example, 88 percent of 2013
winners, versus 78 percent in the previous contest in 2011, offer consulting or contract work to
retirees. And 78 percent this year, versus 70 percent in 2011, are reaching out to retirees with
offers of full-time work.
As of November 1st, it is estimated there were more than 4.5 million year-to-date online
visits to the AARP webpages featuring resources for jobseekers.111
Bridges to Employment – Outcomes data is not yet available.
111
Source: AARP Connecticut.

Program Review and Investigations Committee Staff Findings and Recommendations: December 18, 2013
92
PLATFORM TO EMPLOYMENT (P2E)
This section describes Platform to Employment (P2E), a program that originated in 2011
at The WorkPlace, the regional workforce investment board in southwestern Connecticut.
Funded by the AARP Foundation and other private funds, the purpose of the program is to help
the long-term unemployed who have exhausted their unemployment insurance benefits--many of
whom are older adults--become reemployed. P2E takes a comprehensive approach, beginning
with the restoration of confidence and emotional preparedness to take on reemployment efforts.
Upon completion of a five-week preparatory phase, program participants have the opportunity to
go into eight-week P2E-paid work experiences at organizations that have job openings. The P2E
program philosophy is that job searchers need a “platform” of any employment from which to
move up to a better job.
Funding
The President and Chief Executive Officer of The WorkPlace spearheaded the
development of the P2E program, including fundraising with businesses in lower Fairfield
County. No state or federal government funding is used to support this program. Over 40
businesses, private foundations, and individuals provided financial support.
Approximately $600,000 was raised to support 100 pilot program participants (about 20
participants for five classes, at $6,000 per participant). Corporate donors included AT&T,
Northeast Utilities, and Xerox. In addition to individual contributors, several foundations helped
to fund the original P2E pilot program including: Wells Fargo Foundation, Fairfield County
Community Foundation, and JP Morgan Chase Foundation. Beyond the five classes (i.e.,
cohorts) that occurred as part of the pilot, two more classes were funded by the AARP
Foundation in southwestern Connecticut. Additional private funds were raised for the eighth
class, just completed this summer, also in southwestern Connecticut. Confirmed by two years of
experience, replications of P2E cost approximately $120,000 per class size of 20 participants.
Additional P2E classes will be offered in Connecticut as funds are raised to support the program.
The Hartford Foundation for Public Giving is funding a planning grant to examine the
challenges people over age 50 face in becoming reemployed. The Foundation has a goal of
replicating P2E in the Greater Hartford area by January 1, 2014. The five partners in the
initiative are AARP, Capital Workforce Partners, CBIA, CREC, and Career Resources. A series
of focus groups held separately for employers and unemployed individuals were conducted in the
fall 2013. The potential P2E program planned for the Greater Hartford area may be shorter, with
the preparatory phase taking three to four weeks rather than the current five weeks.
Population Served
The P2E program is open to unemployed persons who have already, or are at imminent
risk of exhausting their unemployment benefits. Participants have been unemployed for at least
six months. Participants in the original pilot program were from urban and suburban
communities in the southwest part of Connecticut (e.g., Greenwich, Bridgeport, Darien, and
Derby).

Program Review and Investigations Committee Staff Findings and Recommendations: December 18, 2013
93
Age. Of the 100 who participated in the pilot program, 69 percent were 50+ years old. In
the two classes funded by AARP, all 42 participants were 50+ years old. In general, P2E does
not have an age minimum, and some P2E funders, such as the Walmart Foundation, have a
commitment to veterans, who may be aged 30 or younger.
Education. Of the 100 participants in the P2E pilot program, 46 percent had Bachelor’s
or Master’s degrees. Similarly, for the subsequent two classes funded by AARP, 40 percent of
the 42 participants had Bachelor’s or Master’s degrees.
Previous employment. P2E participants come from a variety of employment
backgrounds. There is a higher than average proportion of participants with backgrounds in
marketing, administration, accounting, and financial services. Table VII-1 provides a sampling
of job titles previously held by P2E participants.
Table VII-1. Former Job Titles of P2E Participants
Account Manager Office Manager
Administrative Assistant/Office Manager Procurement/Purchasing-Manufacturing
Claims Processor/Data Entry-Insurance Project Coordinator
Community Relations & Marketing Sales Manager
Customer Relations Sales Representative
Customer Service Senior Credit Analyst
Distribution & Transportation Supervisor Senior Test Engineer
Facility Use & Special Events VP Retail Banking & Branch Managers-
Banking Source: The WorkPlace.
Program Description
The Platform to Employment (P2E) program contains two phases: 1) preparatory
program; and 2) placement in a paid work experience for up to eight weeks. The five week
preparatory program provides mental health and financial education services to assist
participants. Services also include skills assessments to define abilities, and career readiness
workshops. If needed, financial counseling and credit rebuilding assistance is also provided.
Individual employment plans are developed and participants work with P2E career
coaches who also conduct weekly follow-up contacts with participants. P2E is a full-time
commitment, and participants are in class four days per week during the preparatory phase.
Following completion of the preparatory phase, P2E helps participants find paid work
experiences with local companies that have job openings. This program may be appealing to
employers because it has the advantage of removing the risk often associated with hiring new
workers by providing a risk-free trial, and does not require completion of the paperwork often a
part of on-the-job training programs.
If the employer is satisfied with the performance of the P2E participant, then the
expectation is that a full-time job with the employer will ensue following the paid work
experience. The work experience provides the participant with an opportunity to demonstrate

Program Review and Investigations Committee Staff Findings and Recommendations: December 18, 2013
94
their skills to employers who might be reluctant to hire an older worker and/or someone who has
been unemployed for a long period of time.
Participants hear about the program through letters sent out by the local CTDOL office to
all in the Southwestern WIB region who had exhausted their unemployment insurance benefits.
The initial recruitment for P2E occurred by mailing letters to more than 1,400 long-term
unemployed workers in the Southwest WIB region. Additional ways participants hear about P2E
is through web postings and news stories about the program. For example, a recent news story
about the program that ran over a weekend generated approximately 200 emails inquiring about
the program by the following Monday morning. There are hundreds of individuals on the P2E
waiting list at any given time. National and local publicity112
also helped make people aware of
the program.
Program Outcomes
Program demand. In the initial recruitment for P2E, nearly 400 applications (392) were
received in response to the CTDOL letter, and 164 candidates were interviewed. A pilot program
initiated in fall 2011 enrolled 100 workers. Given that class size for P2E has ranged from 18-28,
demand far exceeds capacity.
Program completion. Of the original 100 accepted into the P2E pilot program, all but
nine completed the five-week preparatory program, which is the first phase of P2E (91 percent
completion rate). Figure VII-1 shows that 80 percent of the 91 participated in eight-week work
experiences, while the remainder continued to search for job placements or received training. Of
the 73 who entered the eight-week work experiences, 65 (89 percent) moved into full-time
employment with that company. The salaries for the reemployed ranged from $23,000 to
$72,000, with all having to take pay cuts compared with their positions just prior to
unemployment.
Overall, the percent of P2E pilot participants who became employed full-time was:
65 percent for the 100 who enrolled in the P2E program
71 percent for the 91 enrollees who completed the P2E preparatory program
112
National media coverage included a segment on the Connecticut Platform to Employment program televised
February 19, 2012 on a 60 Minutes Special, “Trapped in Unemployment.” P2E was also a segment on the May 3,
2013 PBS NewsHour Special, “Brutal Job Search Reality for Older Americans Out of Work for Six Months or
More.”

Program Review and Investigations Committee Staff Findings and Recommendations: December 18, 2013
95
100 enrolled in P2E
Completed 5-week prep program?
Entered 8-week work experience?
Yes91 (91%)
No9 (9%)
Yes73 (80%)
No18 (20%)
Hired by work experience company?
Yes65 (89%)
No8 (11%)
Figure VII-1. Platform to Employment Outcomes for Pilot Participants
A separate analysis was performed for P2E participants who were at least 50 years old.
Results for the 69 older pilot participants and the 42 participants in the AARP sponsored classes
are shown in Figure VII-2. The success rate is similar to the outcomes for the mixed-age pilot
program participants.
Overall, the percent of P2E participants 50 and older who became employed full-time
was:
65 percent for the 111 who enrolled in the P2E program
68 percent for the 105 enrollees who completed the P2E preparatory program
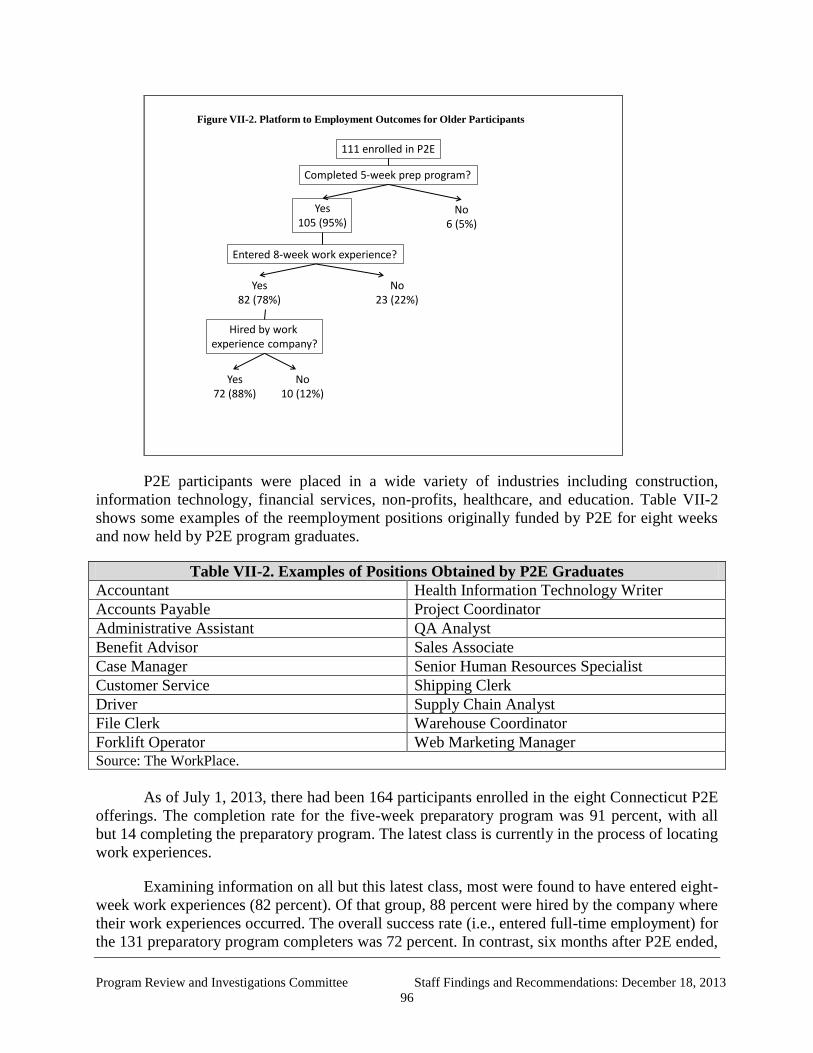
Program Review and Investigations Committee Staff Findings and Recommendations: December 18, 2013
96
111 enrolled in P2E
Completed 5-week prep program?
Entered 8-week work experience?
Yes105 (95%)
No6 (5%)
Yes82 (78%)
No23 (22%)
Hired by work experience company?
Yes72 (88%)
No10 (12%)
Figure VII-2. Platform to Employment Outcomes for Older Participants
P2E participants were placed in a wide variety of industries including construction,
information technology, financial services, non-profits, healthcare, and education. Table VII-2
shows some examples of the reemployment positions originally funded by P2E for eight weeks
and now held by P2E program graduates.
Table VII-2. Examples of Positions Obtained by P2E Graduates
Accountant Health Information Technology Writer
Accounts Payable Project Coordinator
Administrative Assistant QA Analyst
Benefit Advisor Sales Associate
Case Manager Senior Human Resources Specialist
Customer Service Shipping Clerk
Driver Supply Chain Analyst
File Clerk Warehouse Coordinator
Forklift Operator Web Marketing Manager Source: The WorkPlace.
As of July 1, 2013, there had been 164 participants enrolled in the eight Connecticut P2E
offerings. The completion rate for the five-week preparatory program was 91 percent, with all
but 14 completing the preparatory program. The latest class is currently in the process of locating
work experiences.
Examining information on all but this latest class, most were found to have entered eight-
week work experiences (82 percent). Of that group, 88 percent were hired by the company where
their work experiences occurred. The overall success rate (i.e., entered full-time employment) for
the 131 preparatory program completers was 72 percent. In contrast, six months after P2E ended,

Program Review and Investigations Committee Staff Findings and Recommendations: December 18, 2013
97
there was a 21 percent employment rate for the P2E program candidates who applied for, but
were not selected for P2E.
With the support of the AARP Foundation, Citi Community Development, and the
Walmart Foundation, the P2E program is currently being expanded to the following 10 cities
outside of Connecticut:
Chicago, IL
Cincinnati, OH
Dallas, TX
Denver, CO
Detroit, MI
Minneapolis, MN
Newark, NJ
Orlando, FL
San Diego, CA
San Francisco, CA
Cost Effectiveness Analysis
Cost. As described earlier in the chapter, the cost per P2E participant is $6,000, or
$120,000 for a class size of 20 participants in P2E. This figure includes:
“Career Edge,” the five-week preparatory program (facilitated by contractor
Career Team)
Financial education classes, provided by nonprofit organizations associated
with the One-Stops
Behavioral health services (minimum of one session), provided by contractor
Behavioral Health Services
Eight weeks of wages (amount varies, depending on the wages paid by the
position)
A few employers reportedly did not take the wage subsidies because they were satisfied
with the P2E candidates at the time of the interviews. There were also instances where P2E paid
100 percent of the salary for the first four weeks of the placement and then requested--and was
granted--a cost share with the employer for the subsequent four weeks.
Benefit. Focusing on the 50+ year old participants, the majority of P2E preparatory
program completers became reemployed (69 percent). This is similar to the 72 percent
reemployment rate for all P2E participants, regardless of age. More importantly, 88 percent of
those who entered the eight-week work experience and had an opportunity to demonstrate their
skills to employers, were hired by the company where their work experiences occurred. Salaries
for the reemployed ranged from $23,000 to $72,000, with all having to take pay cuts compared
with their positions just prior to unemployment.

Program Review and Investigations Committee Staff Findings and Recommendations: December 18, 2013
98
Cost per reemployed program participant. The following analysis is for all program
participants within the first seven classes, regardless of age, and assumes all employers accepted
the wage subsidies offered by P2E. The cost for the first seven classes was estimated to be
$840,000 (7 classes @ $120,000 each). Regardless of age, a total of 94 participants from the
seven classes became reemployed. The cost to help 94 P2E participants become reemployed was
approximately $8,936 per reemployed program participant ($840,000 / 94).
JEWISH EMPLOYMENT TRANSITION SERVICES (JETS)
This section describes a grassroots employment outreach and support program launched
in 2009 in response to the Great Recession and increasing requests for help received by Jewish
Family Services (JFS)113
from people who had become unemployed or underemployed. The
Jewish Employment Transition Services (JETS) program is a nonsectarian program that was
started by a volunteer who acts as the moderator/facilitator, leading twice monthly meetings.
JETS attracts 100-160 individuals per meeting, with approximately 30-50 of these participants
new to JETS. A two-hour career-related presentation takes up the bulk of the meeting, with a one
hour attendee networking session occurring just prior to the presentation. Additional support
services are also made available to JETS participants, ranging from resume assistance, job search
work teams, and financial counseling.
Funding
The JETS program relies primarily on in-kind contributions and volunteers who have
made long-term commitments to the program. The program founder and moderator/program
facilitator, for example, spends approximately 40 hours per week on this initiative. Given her
background in human resources and her full-time dedication to JETS, the moderator/program
facilitator: identifies and recruits presenters, works with the presenters to shape workshop topics
covered, and personally provides resume assistance, career counseling, and interview coaching to
JETS participants.
In addition to the full-time volunteer moderator/program facilitator, there are human
resources consultants who volunteer their time to help with resume assistance, interview
preparation, career counseling, and LinkedIn sessions. The human resources professionals often
meet with JETS participants several times to provide this one-on-one assistance free of charge. A
“Money Coach” volunteers his time to provide free financial counseling.
All the presenters provide their workshops free of charge. Also donated are time by the
JFS executive director, director of finance, and director of operations for JETS staff supervision,
oversight of program finances, and grant writing.
There is a paid, part-time JETS program manager. A paid professional counselor also
offers six to eight week emotional transitions support groups two to three times per year to help
people with the emotional side of job loss. A technical company is paid to provide sound, audio-
visual, and PowerPoint during the presentations held at Beth El Temple, the location of the JETS
meetings.
113
Jewish Family Services is a nonsectarian agency providing behavioral health and other human services to people
of all faiths residing in Greater Hartford/North Central Connecticut communities.
Program Review and Investigations Committee Staff Findings and Recommendations: December 18, 2013
99
There is no cost to JETS participants. Donations from both the Jewish Federation of
Greater Hartford and RBC-Wealth Management ($39,000 in FY 12) support the part-time JETS
manager position, the professional counselor-led emotional transitions support groups, and audio
visual support for presentations.
Population Served
The JETS program attracts 100-160 attendees per workshop (average 120 participants per
workshop). Although located in West Hartford, attendees come from as far away as Bridgeport,
Waterbury, Danbury, and Springfield, MA. JETS participants hear about the program from word
of mouth, brochures, CTDOL, libraries, other networking groups, through Jewish Family
Services, and private outplacement firms (e.g., Lee Hecht Harrison). Social media, including
Facebook and LinkedIn, websites, and email newsletters are also used to publicize JETS
program presentations.
Although the JETS program does not maintain a database on attendees, it is estimated
that over 60 percent are 50+ years old. The participants are also described as highly educated
with many years of employment experience, who lost their jobs primarily due to layoffs and
company closings that occurred during the Great Recession.
Program Description
The JETS program is considered unique in its use of a volunteer moderator/program
facilitator, and was the recipient of a 2009 Innovation Award from the Jewish Federation of
Greater Hartford. The volunteer founder remains the current moderator/program facilitator of the
JETS program, and organizes, researches, and coordinates all programs and speakers.
The part-time JETS program manager identified the following four JETS program goals:
1. To identify and build on individual strengths
2. To develop skills in the areas of networking and job search
3. To access appropriate community support and resources
4. To improve functioning in daily activities at home, at work, and in the community
There are five components to the JETS program: 1) workshops; 2) networking; 3) job
search work teams; 4) human resources services; and 5) support services available through
Jewish Family Services of West Hartford.
JETS workshops. During its five years of operation, JETS has offered more than 150
workshops with guest experts donating their time to present information on career-related topics
relevant to today’s job search environment. The workshops often combine lecture style with an
interactive component. Workshops are usually held twice a month on Wednesday mornings from
9 to 11 am at Beth El Temple in West Hartford.

Program Review and Investigations Committee Staff Findings and Recommendations: December 18, 2013
100
Table VII-3 provides a flavor for the array of topics covered by the various presenters.
Table VII-3. Sample of Titles and Presenters of JETS Workshops
“Highly Effective Job Search in a Difficult Job Market” (Orville Pierson, Author/Sr. V.P.
at Lee Hecht Harrison)
“Advanced LinkedIn—Tips No One Knows” (Patrick O’Malley, Social Media and
Internet expert)
“Searching for Jobs Online—Indeed.Com” (The Team from Indeed.Com)
“Insider Secrets & Tools to Using the DOL’s Online 100 Job Sites” (Karen Quesnel,
Business Services Specialist, CTDOL)
“Eliminated! Now What? Finding Your Way from Job-Loss Crisis to Career Resilience”
(Jean Baur, Career Coach/Author)
“Connecticut Employment Trends: Some New and Some Déjà vu” (Patrick Flaherty,
Economist, CTDOL)
“How to Negotiate Salary and Benefits: Everything You Want to Know Before Your
Next Interview” (Marcia LaReau, Career Counseling/Job Search) Source: JETS testimony submitted at the October 3, 2013 PRI public hearing.
Schmoozers networking. Also held twice a month at Beth El Temple, the JETS
Schmoozer’s networking usually occurs from 8 to 9 am (with a two-hour career-oriented
presentation immediately following the networking hour). The hourly sessions provide an
opportunity for participants to exchange job leads and business cards, and informally network
and build contacts with others. Participants can strengthen their networking approaches and
connections as well as offer one another feedback about actual job interview occurrences.
Ranging from 100 to 160 participants, it is estimated that an average of 120 individuals take part
in the networking hour.
Job search work teams. The JETS program has been offering job search work teams for
the past three years. The concept of job search work teams was created by Orville Pierson, an
author and Senior Vice President at Lee Hecht Harrison, considered a nationally recognized
outplacement company. Consisting of 10-15 members, job search work teams meet for two hours
once a week, and offer a systematic approach to the job search process. Participants are held
accountable, tracking their job searches using specific measures.
Free of charge, there are teams currently meeting in West Hartford, Glastonbury and
Avon. Previous teams have taken place in West Hartford, Simsbury, Wethersfield, and
Middletown. Table VII-4 outlines benefits of the JETS job search work teams as viewed by the
work teams coordinator. Team leaders are volunteers and trained in the techniques pioneered by
Orville Pierson.

Program Review and Investigations Committee Staff Findings and Recommendations: December 18, 2013
101
Table VII-4. Benefits of JETS Job Search Work Teams
Team members are immersed in a positive environment, surrounded by supportive people
who understand member’s current situation
Structure given by attending weekly meetings
Resource to get questions answered
Accountability created by being part of a group, leading to greater likelihood of following
through on actions
Receive and give honest and candid feedback about presentation, resume, answers to
interview questions, etc.
Personal satisfaction in being able to help others Source: Personal communication from volunteer coordinator of the JETS job search work teams program,
September 20, 2013.
Human resources services. The JETS program has human resources professionals who
volunteer their time to provide resume assistance, interview preparation, job profiling, and career
counseling. It is estimated that approximately 150 individuals received human resources services
from the JETS program during January-June 2013, and 800-900 people since program inception
in 2009.
Support services available through Jewish Family Services of West Hartford, CT. JETS program participants are made aware of services available through Jewish Family Services
(JFS), a non-profit social services agency in West Hartford. Through JFS, participants may
access the agency’s food pantry, energy programs, support groups for the unemployed, and
counseling services. The JETS program also has a volunteer “Money Coach” available to answer
individual financial questions.
Program Outcomes
There are estimated to have been over 3,000 JETS participants during the five years that
the program has been in existence. It is further estimated that 800-900 received human resources
services (e.g., resume writing assistance, interview preparation, and career counseling), and 50
participated in five emotional support groups.
It is further estimated that, during the five years the program has been in existence,
between 1,000-1,500 (200-300 annually) have found jobs (33-50 percent success rate). This rate
equates to approximately 200-300 JETS participants gaining employment annually, with an
estimated 450 becoming employed in calendar year 2012.
As noted earlier, a roster of JETS participant names is not maintained by the program,
and the JETS program manager only becomes aware that a program participant found
employment if, as requested, the person notifies JETS by letter or informally.

Program Review and Investigations Committee Staff Findings and Recommendations: December 18, 2013
102
While the JETS program does not generally track which services participants received,
data on employment for the JETS job search work team participants is more readily available.
Over the three years the work teams have been in existence, approximately 100 of the 200
participants (50 percent) have found employment.
A survey was distributed in September 2011 by email to 835 current and former JETS
participants. The survey asked respondents to rate the JETS program in terms of learning,
application and, well-being. A total of 247 JETS participants (30 percent) responded to the
survey. Every survey item was rated positively by at least two-thirds of respondents. The items
with the highest ratings are shown in Table VII-5.
Table VII-5. JETS Survey Items with Most Positive Ratings
Survey Item Percent Agree Percent Neutral Percent Disagree
Learned new ideas from JETS
speakers
93.2% 4.8% 2.0%
Applied principles (from JETS
presenters) to my own situation
92.0% 7.2% 0.8%
Learned about resources available to
job seekers & how to access
86.4% 10.8% 2.8%
Developed better understanding about
the job search process
86.0% 11.2% 2.8%
I developed renewed enthusiasm for
my job search
86.4% 8.9% 4.4%
Source: JETS program manager.
Cost Effectiveness Analysis
Cost. As previously indicated, the JETS program is supported primarily by volunteers
and pro bono/in-kind donations, including the full-time volunteer moderator/program facilitator,
and human resources professionals (resume assistance, interview preparation). There is one part-
time, paid JETS program manager position. The total budget for the JETS program is
approximately $39,000. To replicate this program at this cost would require the same high level
of volunteer commitment as currently occurs with the JETS program.
Benefit. As described in the program outcomes section, many JETS participants have
benefited in ways other than employment, ranging from assistance with food and financial
issues, and counseling support services. It is estimated that 450 JETS participants became
employed in calendar year 2012.
Cost per reemployed program participant. Combining the cost and benefit
information, the cost to help 450 JETS participants become reemployed was approximately $87
per reemployed program participant in calendar year 2012 ($39,000 / 450).
Program Review and Investigations Committee Staff Findings and Recommendations: December 18, 2013
103
NEIGHBORS-HELPING-NEIGHBORS (NHN)
This section describes a model program operating in several states which has received
national attention and has the potential to be expanded to serve Connecticut.
Founded in River Edge, New Jersey in January 2011, Neighbors-helping-Neighbors
(NhN) is a cost-free network of job search support and networking groups that follow a
community-based approach to help under-employed and unemployed residents get back to work.
During volunteer-led weekly meetings, group members assist each other in techniques and
suggestions to improve one’s job search and offer support and help with personal and
professional networking.
Funding
Led by volunteers, the program is free to its members. NhN recently became a 501(c)(3)
non-profit organization, and is working on finalizing its federal tax status. The organization
relies upon donations, fundraising, sponsorships and advertising to cover the costs of its website
and materials for its meeting and training activities ($2,000 to $3,000).
Population Served
There are no age requirements for participation. Membership is open to anyone in career
transition, including unemployed or underemployed individuals and recent college graduates as
well as people re-entering the job market, struggling small business owners and anyone looking
for part time or volunteer work. The group is primarily composed of professionals, many of
whom are over the age of 50.
Program Description
The organization currently has 27 meeting locations throughout New Jersey and has
expanded into Boston (January 2013) and Washington, DC (September 2013). Approximately
200 to 250 of the 1,200 total members regularly attend weekly meetings. Meetings are typically
held in public libraries, but also on college campuses and can be held in Microsoft stores. Some
of the topics covered during meetings include: Resumes, Interviewing, Job Searches,
Networking, and LinkedIn.
NhN has fostered a “pay-it-forward” organizational culture. Members are expected to
contribute to other members by “sharing job search techniques, related professional career
development resources, personal referrals and generally providing a forum where members
feeling empowered, energized and focused on the job search.”114
114
Excerpt from NhN mission statement. http://www.neighbors-helping-neighbors.com/mission.html Accessed on
11/27/13.

Program Review and Investigations Committee Staff Findings and Recommendations: December 18, 2013
104
Outcomes
The organization relies upon member self-reporting for employment outcomes. Current
total membership is estimated at 1,200 members, of which 355, or 30 percent, have reported
finding employment to date.
Cost Effectiveness Analysis
Cost. As described earlier in the chapter, costs for the Neighbors-helping-Neighbors
program are estimated at $2,000 to $3,000 per year.
Outcome. 355 members have found employment (2011-2013).
Cost per reemployed program participant. Combining the cost and primary outcome
information, it is estimated to cost between $17 to $25 for each of the participants who became
employed (($2,000 x 3 yrs) / 355 job placements) to ($3,000 x 3 yrs) / 355 job placements)).
CAREER COACHES
This section describes career coaches, a potential resource to assist in the reemployment
of older workers. According to one article on the subject,115
career coaches can help their clients
with presentation, negotiation, and communication skills. They may also assist professionals in
leveraging their expertise and talents as they search for employment opportunities. Career
coaches are not a regulated industry, meaning there are no requirements for calling oneself a
career coach. One professional association for career professionals listed over 150
individuals/organizations in Connecticut alone.116
Funding
In a large survey by the International Coach Federation (ICF),117
coaches from North
America estimated slightly more than half (55 percent) of their primary clients pay for their own
coaching while the remainder have the coaching paid for by a third party, such as a corporation.
The average fee for one hour of coaching was $214. A recent AARP article reported career
coaches charged an average of $100-250 per hour.118
Beyond paid career coaches, the AARP Foundation has a virtual job coach volunteer
team. The team helps 50+ year old job seekers via weekly telephone and email conversations.
Approximately half of the virtual job coaches are retired. They offer advice about resumes,
interviewing, and networking. These volunteer coaches are also available to guide job seekers
through AARP’s WorkSearch online assessment tool.
115
“Should you Hire a Career Coach?” February 19, 2010, www.forbes.com 116
The International Coach Federation. www.coachfederation.org 117
2012 International Coach Foundation Survey Results. 118
“How to Choose and Use a Career Counselor or Coach” AARP, Updated January 2012.

Program Review and Investigations Committee Staff Findings and Recommendations: December 18, 2013
105
Population Served
There is no descriptive information available on the number or age of Connecticut
residents using career coaches. The expense involved may be a limiting factor in who is
accessing this resource. In interviews with career coaches, it was further noted that not all clients
seeking the services of career coaches are unemployed.
In the earlier referenced ICF survey of career coaches, approximately 59 percent of
clients of United States coaches were female. The age of coaches’ active clients is shown in
Figure VII-3. Individuals 46+ years old make up an estimated 46 percent of career coach clients
in the U.S.
Program Description
The coaches. Of the 4,000+ U.S. coaches responding to the ICF survey, nearly two-
thirds (62 percent) had earned a master’s degree or doctorate, and 32 percent had at least a
bachelor’s degree. The U.S. coaches had a range of time practicing, with over half (56 percent)
practicing at least five years. Assuming the survey respondents are representative of all coaches,
three-quarters of coaches responding from the United States were female. Over two-thirds of the
U.S. coaches responding (69 percent) were 46-65 years old.
Coaching process. Based on the ICF survey, telephone is the main method used to coach
active clients (53 percent) with the remainder primarily using face-to-face meetings.119
Given the
available technology, career coaches may work with clients that live thousands of miles away.
119
Other occasionally used methods include voice over internet/audio-video platform, and email/instant messaging.
4%
16%
34% 34%
11%
1%
0%
5%
10%
15%
20%
25%
30%
35%
40%
< 26 yrs old 26-35 yrs old 36-45 yrs old 46-55 yrs old 56-65 yrs old 66+ yrs old
Source: 2012 International Coach Survey Results.
Figure VII-3. Age of Clients of Coaches
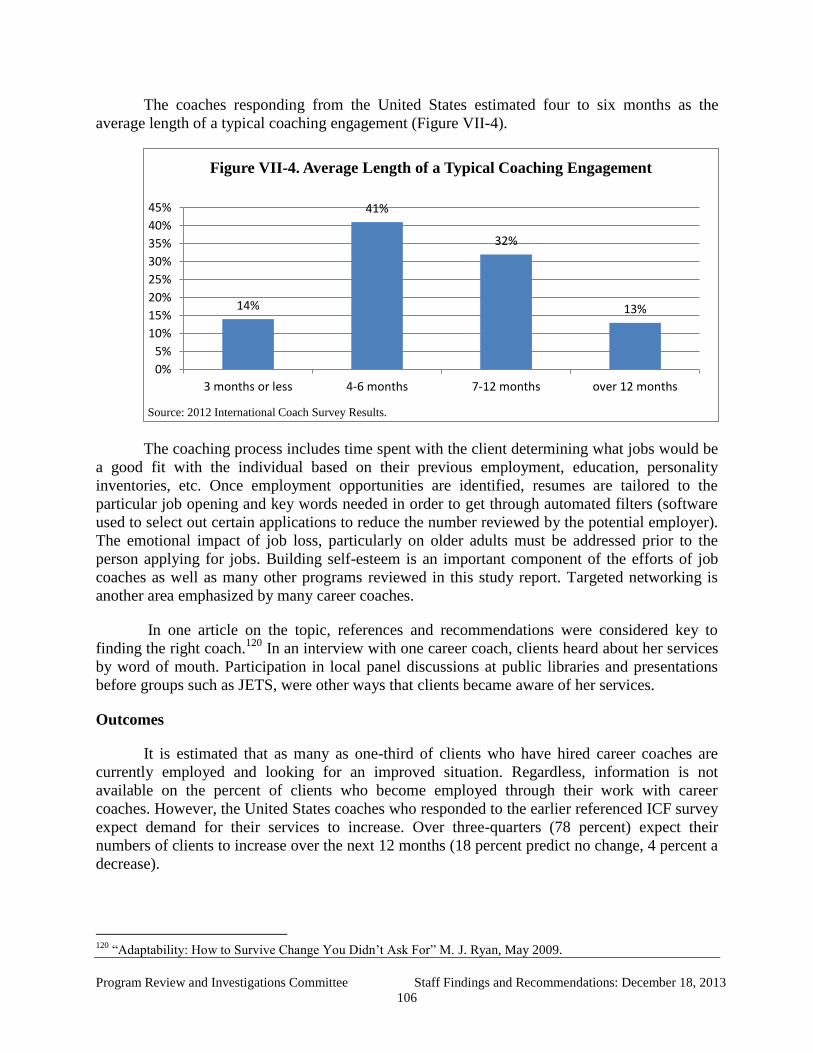
Program Review and Investigations Committee Staff Findings and Recommendations: December 18, 2013
106
The coaches responding from the United States estimated four to six months as the
average length of a typical coaching engagement (Figure VII-4).
The coaching process includes time spent with the client determining what jobs would be
a good fit with the individual based on their previous employment, education, personality
inventories, etc. Once employment opportunities are identified, resumes are tailored to the
particular job opening and key words needed in order to get through automated filters (software
used to select out certain applications to reduce the number reviewed by the potential employer).
The emotional impact of job loss, particularly on older adults must be addressed prior to the
person applying for jobs. Building self-esteem is an important component of the efforts of job
coaches as well as many other programs reviewed in this study report. Targeted networking is
another area emphasized by many career coaches.
In one article on the topic, references and recommendations were considered key to
finding the right coach.120
In an interview with one career coach, clients heard about her services
by word of mouth. Participation in local panel discussions at public libraries and presentations
before groups such as JETS, were other ways that clients became aware of her services.
Outcomes
It is estimated that as many as one-third of clients who have hired career coaches are
currently employed and looking for an improved situation. Regardless, information is not
available on the percent of clients who become employed through their work with career
coaches. However, the United States coaches who responded to the earlier referenced ICF survey
expect demand for their services to increase. Over three-quarters (78 percent) expect their
numbers of clients to increase over the next 12 months (18 percent predict no change, 4 percent a
decrease).
120
“Adaptability: How to Survive Change You Didn’t Ask For” M. J. Ryan, May 2009.
14%
41%
32%
13%
0%
5%
10%
15%
20%
25%
30%
35%
40%
45%
3 months or less 4-6 months 7-12 months over 12 months
Source: 2012 International Coach Survey Results.
Figure VII-4. Average Length of a Typical Coaching Engagement

Program Review and Investigations Committee Staff Findings and Recommendations: December 18, 2013
107
TEMPORARY EMPLOYMENT AGENCIES
Temporary employment agencies act as an intermediary, helping businesses fulfill
staffing needs while helping workers find temporary, or in some cases, long-term employment
assignments. These temp agencies, sometimes referred to as staffing companies, have
established connections with many employers. Thus, using a temp agency can offer many
benefits to unemployed older workers: generating much-needed income, updating skills,
networking and building one’s resume – all of which can increase the chances of getting a
permanent job. In some instances, workers may qualify for paid time off and health and
retirement income benefits while employed by a staffing firm. A temporary job assignment can
also lead directly to a permanent job opportunity with the host employer.
Funding
Temporary employment agencies pay their employees an hourly rate and charge the
client company a mark-up. The mark-up includes costs such as statutory employment taxes
(Social Security and Medicare), unemployment insurance, workers compensation insurance, and
the cost of recruiting, training and screening employees. Some agencies may also provide
recruitment and permanent placement of full-time employees for a one-time fee to the client
company. These one-time fees are often based on a percentage of an employee's first-year
income, although some have flat-fee arrangements with their clients.
Population Served
Other than meeting applicable state and federal work eligibility and authorization
requirements, there is no age or other requirements for registering and working with a temporary
agency. Temporary agencies do not maintain information on the age of placed workers or
individuals registered and available for work. However, in an interview with personnel from a
temporary agency, they believe that the age of temporary workers had gotten older in the past
few years.
Resource Description
Temporary agencies help companies deal with their fluctuating labor needs ranging from
an employee’s leave of absence to sudden expansions, cyclical busy periods, backlogs, and
special projects. As a result, the duration of temporary positions can vary significantly, and in
some cases, can eventually lead to permanent job opportunities. In other instances, companies
looking to fill a permanent full-time position may first turn to a temp agency. This strategy,
often referred to as “try-before-you-buy,” allows businesses to avoid the liability of hiring an
employee who may not perform well over time. Eighty percent of staffing clients say temporary
agencies offer a good way to find people who can become permanent employees.121
In similar fashion, temporary job assignments offer low-commitment career exploration
for workers transitioning from a different field and unsure of their next career move. For career
changers who have already identified their new career field but are unable to attain an interview,
temporary jobs can serve to get their “foot in the door” and begin building their resume. In order
121
http://www.americanstaffing.net/statistics/facts.cfm Accessed on November 29, 2013.

Program Review and Investigations Committee Staff Findings and Recommendations: December 18, 2013
108
to match all of the various staffing needs of their clients, temporary agencies may value
transferrable skills more than an employer looking to direct-hire someone with industry-specific
experience.
Before placement, temp agencies often evaluate a worker’s skills with a series of tests
such as word processing speed and accuracy, math, specific software applications, and even
personality. According to the American Staffing Association, 90 percent of staffing companies
provide free training to their temporary and contract employees.122
For example, Kelly Services
has an online learning center where registrants can learn Microsoft software before placement.
In other instances, workers may be advised to address a skills gap outside of the temp agency
before a placement can occur. Some temporary assignments offer on-the-job training by the
client employer as well.
Although most temp agencies began with a primary focus on traditional administrative
services, they now typically encompass a breadth of specialty businesses. Kelly Services assigns
professional and technical employees in the fields of finance and accounting, education,
engineering, information technology, law, science, and healthcare. Similarly, Robert Half
International divisions include: accounting and finance (Accountemps), office and administrative
(OfficeTeam), information technology, legal, and marketing. Thus temp jobs can provide
excellent networking opportunities because assignments may result in working not just in one,
but many companies in a worker’s desired field. Annually, Manpower Group serves 400,000
clients worldwide and places 3.4 million workers into job placements.123
The contacts made
through temp assignments can act as mentors, future references or help you connect with other
professionals in the field.
Some major temporary staffing agencies voluntarily applied for, and received, national
recognition for valuing older workers as employees. Adecco Group has received the AARP Best
Employers for Workers Over 50 distinction four times since 2002. Robert Half has been
awarded RetirementJobs.com's Age-Friendly Employer Certification, an initiative to identify
employers who maintain policies, practices and programs consistent with employment of people
age 50 and older based solely on their proficiency, qualifications and contribution.124
In
addition, Adecco Group, Kelly Services, and Manpower Group have all signed the Work
Reimagined pledge, a national initiative with AARP, and agree to actively counter age bias and
consciously consider the 50+ applicant and the value of mature employees.
122
http://www.americanstaffing.net/statistics/facts.cfm Accessed on November 29, 2013. 123
http://www.manpowergroup.com/wps/wcm/connect/manpowergroup-en/home/why-manpowergroup/capabilities-
and-expertise/ Accessed on November 29, 2013. 124
http://retirementjobs.com/about-us/certified-age-friendly-employer-program/ Accessed on November 29, 2013.
Program Review and Investigations Committee Staff Findings and Recommendations: December 18, 2013
109
Outcomes
According to American Staffing Association data:125
2.91 million people are employed by staffing companies every business day.
11.5 million temporary and contract employees are hired by U.S. staffing firms over the
course of a year.
79 percent of employees placed by temp agencies work full time.
88 percent of staffing employees say that temporary or contract work made them more
employable.
77 percent of staffing employees say it's a good way to obtain a permanent job.
65 percent of staffing employees say they developed new or improved work skills
through their assignments.
125
http://www.americanstaffing.net/statistics/facts.cfm Accessed on November 29, 2013.

Program Review and Investigations Committee Staff Findings and Recommendations: December 18, 2013
110
This Page Intentionally Left Blank

Program Review and Investigations Committee Staff Findings and Recommendations: December 18, 2013
111
Chapter VIII
Programs and Services Findings and Conclusions
This study examined 18 programs, services and other alternatives available to overcome
barriers to the reemployment of older workers (described in greater detail in Chapter II):
skill-set deficits;
erosion of existing skills the longer one is unemployed;
lack of current job search skills;
emotional and financial barriers; and
age discrimination by prospective employers.
The study looked at both public and private sector initiatives. As the study was focused
on people who were 50+, PRI staff attempted to obtain participant age data from all of the
initiatives. However, participant age information was often not collected by the programs or was
unavailable. Thus, data for all program participants, especially those who completed the
programs, was analyzed, regardless of age. Where age information was available, it was
highlighted.
MANY PROGRAMS ARE AVAILABLE FOR THE UNEMPLOYED
There are a multitude of programs to assist with the reemployment of unemployed
workers, including older workers.
The multitude of programs and services examined by PRI staff are shown in Table VIII-
1. The 18 programs and other alternatives available fall into three categories: labor, education,
and other resources.
Table VIII-1. Programs or Other Alternatives Available to Assist in the Reemployment of
Older Workers
Labor, Aging
(public sector) General Core One Stop Svcs
Intensive Svcs WIA One Stop
Apprenticeship Program
STEP UP Program
Online Learning
FIRST Program
SCSEP Program
Education
(public sector) Manufacturing Technology
Centers
Plus 50 Initiative
Encore!Hartford
Advanced Leadership Training
Program
CT Technical High School Adult
Day Programs
Other
Resources
(private sector)
AARP
P2E
JETS
Neighbors Helping Neighbors
Career Coaches
Temporary Agencies
PRI staff was asked to evaluate the role of the state’s technical high schools and
community colleges in assisting unemployed older workers. As shown in Table VIII-1, both the

Program Review and Investigations Committee Staff Findings and Recommendations: December 18, 2013
112
state’s technical high schools and state community colleges, as well as a state college, and
University of Connecticut, provide resources to assist in the reemployment of adult workers.
The programs grouped into the labor category range from the Apprenticeship program, to
the general and intensive services at the 17 CTWork Career Centers (One-Stops). Education and
training occurs in a multitude of settings. Some of the Connecticut community colleges, for
example, offer the Plus 50 Initiative and the Manufacturing Technology Center program. A
variety of programs offering education and training are sponsored by nonprofit organizations
such as JETS and AARP. Temporary agencies and career coaches are additional education and
training resources available for unemployed older adults.
Although there are many resources, a number of the programs reviewed had waiting lists,
meaning demand exceeded capacity, regardless of age. The many resources also span labor,
education, and the private sector, and there is no comprehensive, easily accessible way for
unemployed residents to find out about these resources. The United Way of Connecticut 2-1-1
has limited material for older adults on its website page “Where to turn in Connecticut when you
become unemployed?” The resources for older adults are primarily limited to the Senior
Community Service Employment Programs (SCSEP), CTWorks Career Centers, Seniors Job
Bank, and Utilize Senior Energy.
The Connecticut Department of Labor provides information on the CTDOL website and
in paper pamphlets and booklets, some of it targeted to unemployment insurance claimants, but
none of the information is targeted for older unemployed workers. The information focuses on
the resources at the CTWorks Career Centers. A pamphlet intended for distribution at Rapid
Response Team presentations126
lists websites for career planning and job search advice.
FEW PROGRAMS ARE SPECIFICALLY GEARED TO 50+ YEAR OLDS; HOWEVER,
MORE GENERALLY TARGETED PROGRAMS CAN STILL BE BENEFICIAL
While there are many programs for the unemployed, only a few of the unemployment
programs are specifically designed for older adults. In review of the programs and services
specifically targeted to older adults, there was just one labor program (SCSEP) that required
participants be unemployed and at least 55 years old (with income limits). Another program, the
Plus 50 Initiative, invests in community colleges to create or expand campus programs that
engage students aged 50 and older.
For the most part, this lack of programs specifically for the older unemployed is not a
major barrier to reemployment because, regardless of age, there are often similarities in the
needs of the unemployed. For example, one career coach interviewed pointed out that no matter
the person's age, a reason workers are having difficulty becoming reemployed is not having a
smart job search strategy (e.g., job seekers should not spend hours applying to online job
openings). There are also different needs for some unemployed older workers, particularly as
they relate to technological challenges, making sure they have basic computer skills necessary
for any job in the 21st century.
126
Rapid Response Teams, consisting of CTDOL and WIB/One-Stop partners, are available to employers
contemplating or experiencing layoffs and plant closings. The teams describe benefits and services available to the
affected workers.

Program Review and Investigations Committee Staff Findings and Recommendations: December 18, 2013
113
As noted earlier, participant age information was often not collected by the programs.
There were, however, programs where age information was provided, and showed a significant
proportion of participants aged 50 and older. For example:
Over 60 percent of participants in the JETS program were estimated to be at
least 50 years old.
Almost half (49 percent) of FIRST participants were 56+ years old, and an
additional 29 percent were 46-55 years old.
Of the 100 who participated in the P2E pilot program, 69 percent were 50+
years old.
The majority of the 93 Encore!Hartford participants have been 50+ years old.
These figures demonstrate that older adults are aware of these programs and are taking advantage
of these resources.
THERE ARE OPTIONS AVAILABLE DEPENDING ON THE NEEDS OF THE OLDER
ADULT
Table VIII-2 shows potential options for those who must have an income while job-
searching or completing job-related training. Shaded entries indicate private sector offerings.
Table VIII-2. Potential to Earn Income while Participating in Programs or Other
Alternatives
Program or Other Alternative Option to Earn Income
Apprenticeship Program “earn while you learn model”
Participants paid an increasing wage over period of
apprenticeship
Manufacturing Technology
Centers
Paid and unpaid internships are available for qualified
students for 8 to 10 weeks in the second semester. Typically,
scholarship students are paid interns, earning $12 per hour for
two days/16 hours each week. Dislocated workers generally
take unpaid internships to avoid complications with their
unemployment insurance compensation status.
Platform to Employment (P2E) Placement in a paid work experience for up to 8 weeks (P2E
pays salary of position)
Senior Community Service
Employment Program (SCSEP)
On-the-job placements for 20 hours per week, with stipends
paid at the minimum wage level
Subsidized Training and
Employment Program (STEP
UP)
Wage subsidies paid to small businesses or manufacturers to
hire unemployed workers
CT Technical HS Adult Day
Programs
Eligible Bristol TEC students can qualify for the Work Based
Learning Program in which they earn wages from an
employer in an industrial setting. Some students continue as a
full time employee after completing their certificate program.
Temporary Agencies Temporary employment agencies pay their employees an
hourly rate.

Program Review and Investigations Committee Staff Findings and Recommendations: December 18, 2013
114
Even if there were additional programs targeting older workers, as was pointed out
earlier, this is not a monolithic group where one type of program will address all needs of older
workers. Some programs are intended for specific populations, and these options are shown in
Table VIII-3. Shaded entries indicate private sector offerings.
Table VIII-3. Target Populations for Some Programs
Targeted Population(s) Program
have been terminated or laid off, or have received individual notice
of termination or layoff, from employment generally due to plant
closures or downsizing; or
received a general notice of the facility closure within 180 days;
and
are unlikely to return to a previous industry or occupation; or
be a displaced homemaker127
Intensive Services for
WIA Dislocated
Workers (at One-
Stops)
For Small Business Wage Subsidy STEP UP program:
be unemployed prior to hire;
have low adjusted family income (less than or equal to 250% of the federal
poverty level);
reside in a municipality with a higher than average unemployment rate, or
which has a population of 80,000 or more; and
the new position could not be a retail position that was temporary or
seasonal.
For the Small Manufacturer STEP UP program, only required to be unemployed
prior to hire
STEP UP program
Unemployed career professionals
Must be enrolled in either the Adult or Dislocated Worker Federal WIA
program
FIRST
(North Central WIB)
Must be at least 55 years old
Must be unemployed and have an annual family income no greater than
125% of federal poverty income guidelines
SCSEP
Unemployed persons who have already, or are at imminent risk of
exhausting unemployment benefits
Competitive program admission application process
P2E
No age requirements, but targeted to 40-75 year-olds mid-career and
traditional retirement-aged professionals.
Must be unemployed or underemployed
Encore!Hartford
(UConn)
Community college students age 50 and older Plus 50 Initiative
Bachelor’s degree or equivalent experience
Employment experience in insurance, banking, finance, information
technology and/or manufacturing
Seeking management positions within their respective industries.
There are no age requirements, but participants in the NEG-funded
Advanced Leadership Program need to be unemployed.
Advanced Leadership
Training
Program (CCSU)
127
A displaced homemaker is defined as having provided unpaid services to family members in the home,
has been dependent on the income of another family member and is no longer supported by that income,
and is unemployed or underemployed and is experiencing difficulty in obtaining or upgrading employment.

Program Review and Investigations Committee Staff Findings and Recommendations: December 18, 2013
115
Further, the study found that, depending on the individual’s barriers to reemployment,
some available options to address the older adult’s needs are better than others (Table VIII-4). As
shown, a barrier to reemployment may be addressed in multiple ways. Education and training,
for example, may be delivered via on-the-job training, online, at a technical high school,
community college, state university, or workshop at CTWorks Career Centers. As noted earlier,
some programs had waiting lists (e.g., P2E and SCSEP), meaning demand exceeded capacity.
Table VIII-4. Barriers to Reemployment Addressed by Programs or Other Alternatives
Program Barrier Skill-set
deficits
Erosion of
existing skills
the longer
one is
unemployed
Lack of
current
job
search
skills
Emotional
barriers
Financial
barriers
Age
discrimination
by prospective
employers
Apprenticeship
Program
Manufacturing
Technology
Centers
Advanced
Leadership
Training Program
Encore!Hartford
P2E
Intensive
Services WIA
One-Stop
SCSEP
FIRST
STEP UP
JETS
General Core
One-Stop
Services
Neighbors
Helping
Neighbors
Plus 50 Initiative
Technical HS
Adult Day
Programs
Temporary
Agencies
AARP
Career Coaches
Online Learning
The comprehensiveness of programs and services is revealed not only in the barriers
being addressed, but also in the program components (Table VIII-5). For example, the P2E

Program Review and Investigations Committee Staff Findings and Recommendations: December 18, 2013
116
program offers participants assessments of job skills and interests, support, boot camp, paid work
experience, and workshops related to job searches. For unemployed older persons struggling
emotionally and financially, preparatory assistance is required before the person can become
reemployed.
Table VIII-5. Components of Programs or Other Alternatives Examined by PRI Staff
Program Component
Assess
ment
of Job
Skills
Interes
ts
Online
Training
Support
Group
or Job
Club
Boot Camp
and/or
Accelerated
Program
On-
The-Job
Trng
(paid)
Classroom
Training/
Workshops
Job Search
Related
Classroom
Training/
Workshops
Job Skills
Related
Apprenticeship
Program
Manufacturing
Technology
Centers
Advanced
Leadership
Training Program
Encore!Hartford (unpaid
)
P2E
Intensive Services
WIA One-Stop
SCSEP
FIRST
STEP UP
JETS
General Core One-
Stop Services
Neighbors Helping
Neighbors
Plus 50 Initiative
Technical HS
Adult Day
Programs
Temporary
Agencies
AARP
Career Coaches
Online Learning

Program Review and Investigations Committee Staff Findings and Recommendations: December 18, 2013
117
Note the program components fall along a continuum of personal assistance provided to
the unemployed older worker, ranging from self-service (e.g., online learning) to job placement
(e.g., Manufacturing Technology Centers).
OUTCOMES ASSESSMENT ISSUES
Many programs and alternatives examined had challenges in monitoring program
performance, particularly in tracking employment placement, wage information, and retention
after participants exited the program. State agency programs often do not maintain or analyze
information on participant age, making it challenging to identify outcomes specifically for older
adults. Educational institutions, while doing an excellent job of measuring academic credit-based
programming, have little information on non-credit vocational programming. Due to lack of
resources, several non-government programs relied on participant self-reporting, and as a result,
had estimates rather than exact statistics available.
SOME PROGRAMS HAVE HIGHER REEMPLOYMENT RATES THAN OTHERS
Some programs serve older workers with more barriers to reemployment (e.g., SCSEP).
Also, some programs provide benefits that would not be captured in reemployment figures, such
as earning a credential that could lead to reemployment. However, with these caveats in mind,
Table VIII-6 summarizes the estimated costs and reemployment outcomes available for some of
the reemployment programs under review.
Table VIII-6. Reemployment Rates and Costs for Some Programs
Program Avg Percent of
Completers
Employed
Avg Annual #
Completed
Program
Estimated Program
Cost Per Employed
Completer
Apprenticeship Program 94% 636 $896
Manufacturing Technology
Centers
90% 137 $5,770
Advanced Leadership Training
Program
75% 24 $8,028
Encore!Hartford 74% 17 $3,836
P2E 72% 47 $8,936
Intensive Services WIA One-
Stop
70% 791 $2,543
SCSEP 59% 60 $79,718
FIRST 55% 61 $2,459
STEP UP 53% 874 $10,042
JETS 42% 450 $87
General Core One-Stop
Services
41% 82,887 $95
Neighbors Helping Neighbors 30% 118 $21
Plus 50 Initiative 10%* 715* Unknown
*Rates are significantly undercounted as represent outcomes of a small subset.

Program Review and Investigations Committee Staff Findings and Recommendations: December 18, 2013
118
Analyzing the relationship between program components and reemployment rates, PRI
staff found that programs with an on-the-job component were associated with higher
reemployment rates. On average, programs with an OJT component had a higher average
reemployment rate outcome of 74 percent compared with 50 percent for the programs without
that component.
PRI STAFF FINDINGS AND RECOMMENDATIONS
Based on this review of programs and services to address barriers to reemployment for
older workers, program review committee staff makes 16 recommendations in the areas of:
negative stereotypes held by some employers; improved communication of available resources to
assist in the reemployment of older workers; and programmatic recommendations in the areas of
labor and education.
Negative Stereotypes are Held by Some Employers About Unemployed Older Workers and
the Long-Term Unemployed
As the barriers to reemployment for older workers showed, some employers have
negative stereotypes about unemployed older workers. This report described some of the
advantages to hiring older workers, and the value of older employees should be made known to
potential employers. Therefore, program review committee staff recommends:
(1) The Connecticut Employment and Training Commission (CETC) shall
coordinate a web-based state hiring campaign for older workers to be housed
within the Department of Labor’s website. CETC is encouraged to utilize
relevant national and state stakeholders to assist in this initiative and
incorporate “success stories” from employers hiring and retaining older
workers. CETC shall report on the progress of this initiative to the legislative
committee with cognizance of workforce development by January 1, 2015.
In addition to some of the challenges unique to the older unemployed, there are also
negative perceptions about the long-term unemployed, a category that many older unemployed
fall into. Some employers, for example, specify in their job announcements that the “unemployed
need not apply,” or that the employer would only accept applications from the currently
employed or recently unemployed. To address this barrier to reemployment, program review
committee staff recommends:
(2) Potential employers shall be prohibited from publishing, in print or on
the Internet, an advertisement for a job vacancy that: (1) lists current
employment as a required qualification, (2) states unemployed candidates
will not be considered, or (3) states only employed candidates will be
considered.
Improvement is Needed in the Communication of Available Resources to Assist in the
Reemployment of Older Workers
There are many programs and services to assist with the reemployment of unemployed
workers, including older workers. These resources are scattered across many agencies,

Program Review and Investigations Committee Staff Findings and Recommendations: December 18, 2013
119
organizations, and settings, and there is no comprehensive, easily accessible way to find out
about this assistance. Since programs and services can only be useful if potential participants are
aware of them, program review committee staff recommends:
(3) The Connecticut Department of Labor should develop a one-page quick
reference sheet with a summary of available public and private resources for
the older unemployed to find out what programs and services are available to
help with their reemployment.
Additionally, many Connecticut residents turn to the United Way of Connecticut 2-1-1
for assistance, and a similar document to assist with the reemployment of older workers could be
beneficial for callers to that organization. Therefore, the program review committee staff
recommends:
(4) The United Way of Connecticut 2-1-1 should use the Connecticut
Department of Labor developed one-page quick reference sheet with a
summary of available resources for the older unemployed caller or visitor to
the website, to find out what programs and services are available to help with
their reemployment.
During the course of study interviews with personnel from workforce investment boards
and one-stop career centers, several misperceptions were voiced about the Apprenticeship
Program (see Table III-14). These inaccuracies may be preventing older workers and others from
considering potentially viable reemployment options. To assure that the unemployed, including
those 50+ years old, are aware of apprenticeship opportunities, the program review committee
staff recommends:
(5) The Apprenticeship Program should develop an informational campaign
targeted to Workforce Investment Board and One-Stop Career Center staff
to reduce misperceptions about the Apprenticeship Program and encourage
apprenticeship opportunities.
This informational campaign dovetails with a recommendation in the Connecticut
Employment and Training Commission 2013 Annual Plan to develop a strategy to expand the
apprenticeship model to certain occupations within targeted industries, such as manufacturing,
allied health, and energy.
Some Changes Related to Labor-Related Programs Are Needed
The CTWorks Career Centers provide assistance to unemployed Connecticut residents,
regardless of age. In addition to workshops on how to create a résumé, many One-Stop Career
Centers offer résumé critiquing. In focus groups with unemployed individuals, some expressed
confusion about seemingly contradictory feedback given on their résumés. While résumé writing
is not an exact science, some have earned a certified résumé writer credential. As a way to
encourage some uniformity and standards when providing such assistance to One-Stop Career
Center clients, the program review committee staff recommends:

Program Review and Investigations Committee Staff Findings and Recommendations: December 18, 2013
120
(6) The Connecticut Department of Labor and Workforce Investment
Boards should form a workgroup to consider requirement of a professional
résumé writer credential for those providing résumé writing assistance at the
CTWorks Career Centers.
Some CTWorks Career Centers make over 5,000 online learning courses available free of
charge to unemployed Connecticut residents. With a relatively modest cost to WIBs, the
program review committee staff recommends:
(7) The use of online learning at the CTWorks Career Centers should be
expanded and considered a resource available to any unemployed
Connecticut resident, within available funding constraints.
The STEP UP program was established as part of the Jobs Bill.128
STEP UP promotes
economic growth by offering wage subsidies to small businesses, manufacturers, and veterans to
fill newly created jobs with unemployed workers. Although not broken out by age of
participants, in its first two years, the program has had overall favorable outcomes, and the
program review committee staff recommends:
(8) The STEP UP program shall be reauthorized for FY 15 and FY 16.
The STEP UP Small Business Wage Subsidy Program currently requires participants to
reside in municipalities with higher than average unemployment rates, or in cities with
populations of at least 80,000. Removal of these restrictions will allow more unemployed
Connecticut residents to benefit from this program. Therefore, the program review committee
staff recommends:
(9) The requirement for STEP UP Small Business Wage Subsidy Program
participants to reside in a municipality with a higher than average
unemployment rate, or which has a population of 80,000 or more, shall be
eliminated.
Wage subsidies for the STEP UP Small Manufacturer Training Grant Program were
expended at a faster rate than they were for the STEP UP Small Business Wage Subsidy
Program. To promote ease of utilization and maximize participation rates, the program review
committee staff recommends:
(10) The STEP UP Small Business Wage Subsidy Program and the STEP UP
Small Manufacturer Training Grant Program shall be merged into a single
program. Requirements for the two programs shall remain in place, and
funding combined for the two STEP UP programs.
128
P.A. 11-1 AN ACT PROMOTING ECONOMIC GROWTH AND JOB CREATION IN THE STATE.

Program Review and Investigations Committee Staff Findings and Recommendations: December 18, 2013
121
Some Changes to Education-Related Programs Are Needed
Within the Connecticut community college system, there are currently four Advanced
Manufacturing Technology Centers to prepare students for careers in manufacturing. The success
of the Advanced Manufacturing Center model leads the program review committee staff to
recommend:
(11) The Board of Regents shall conduct a feasibility study to examine the
potential for expanding the Advanced Manufacturing Center model to create
centers of excellence for other high-demand career areas. The results of this
study shall be reported to the legislative committee with cognizance of higher
education no later than January 1, 2015.
The Plus 50 Initiative is another program within the Connecticut community college
system that was found to be successful nationwide. It is currently offered at three of the
Connecticut community colleges, and the program review committee staff recommends:
(12) The Plus 50 Initiative model shall be expanded to all Connecticut
Community Colleges.
With the focus of the Connecticut higher education system primarily on for-credit
offerings, attention needs to be given to non-credit vocational offerings. Data does not currently
exist, for example, to measure performance of non-credit vocational programs, particularly in
regards to the primary goal of attaining employment, which leads the program review
committee staff to recommend:129
(13) The Board of Regents of Higher Education shall establish a shared
definition for what constitutes a non-credit vocational “program” and record
this information in its information systems.
The Board of Regents shall require all institutions of the Connecticut State
Colleges & Universities system to collect and report the following
information on non-credit vocational programs: 1) course and program
enrollment and completion; 2) participant information, including age and
Social Security Numbers for subsequent tracking; 3) employment status,
retention, and wages prior to and after participation.
129
This recommendation is based on BOR proposed action in its 2013 RBA Report Card.

Program Review and Investigations Committee Staff Findings and Recommendations: December 18, 2013
122
While there are financial assistance options available to higher education students
enrolled in for-credit courses and programs, there are few, if any, financial assistance options for
students enrolled in non-credit vocational programs. They are ineligible, for example, for federal
Title IV financial aid. Decreasing enrollment trends are also being attributed to the increase in
student costs. Therefore, the program review committee staff recommends:
(14) The Board of Regents of Higher Education shall explore financial
options for students of non-credit vocational courses and programs.
Examples might include low interest loans which would be paid back upon
employment and a sliding scale dependent on income. The results of its
findings shall be reported to the legislative committee with cognizance of
higher education no later than January 1, 2015.
The Connecticut technical high school programs for adult learners were reviewed as part
of this study. In general, PRI staff found a lack of data to measure performance of adult student
vocational programs, particularly in regards to the primary goal of attaining employment. To
address this absence of data, the program review committee staff recommends:130
(15) The Connecticut Technical High School System shall collect and report
the following information on adult students enrolled in vocational programs:
1) course and program enrollment and completion; 2) participant
information, including age and Social Security Numbers for subsequent
tracking; 3) employment status, retention, and wages prior to and after
participation for completers as well as non-completers.
Finally, given the serious toll being unemployed at an older age can have on a person’s
health and financial condition as well as the impact to Connecticut’s overall workforce, and the
lack of publicly-sponsored reemployment programs targeted to older workers, program review
committee staff recommends:
(16) CETC should consider inclusion of the reemployment of older workers
as part of its strategic planning process.
130
This recommendation is based on BOR proposed action in its 2013 RBA Report Card.

Appendices

This Page Intentionally Left Blank
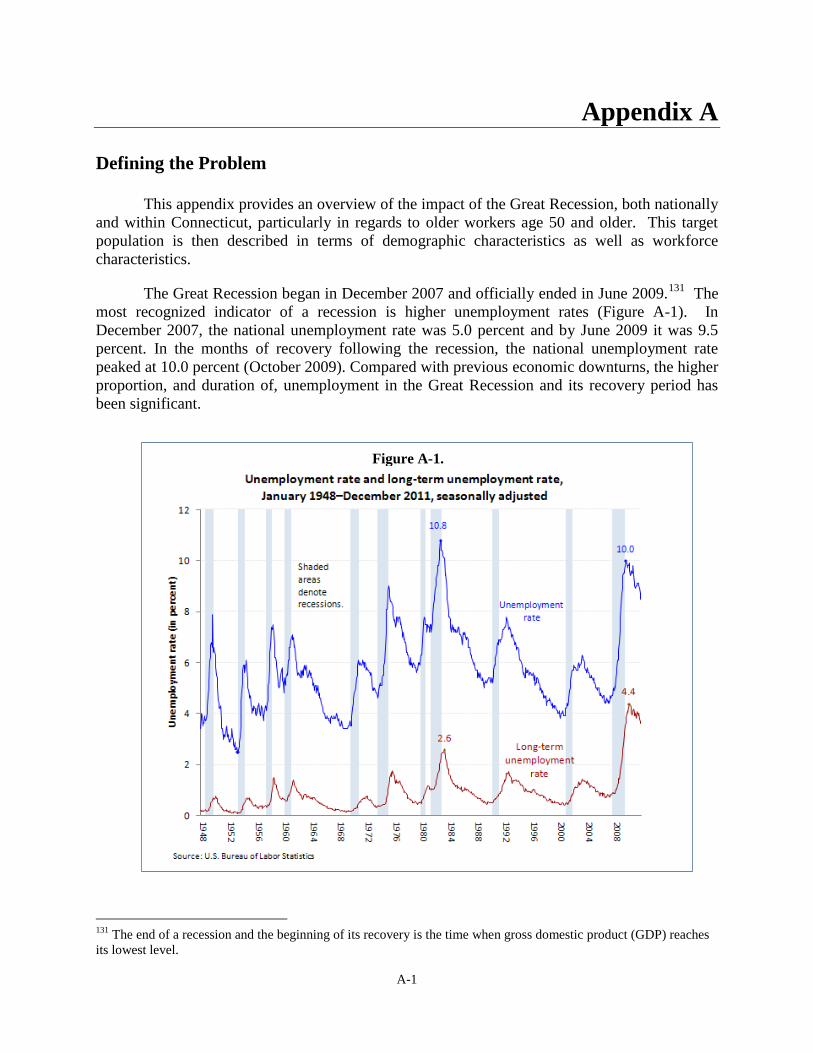
A-1
Appendix A
Defining the Problem
This appendix provides an overview of the impact of the Great Recession, both nationally
and within Connecticut, particularly in regards to older workers age 50 and older. This target
population is then described in terms of demographic characteristics as well as workforce
characteristics.
The Great Recession began in December 2007 and officially ended in June 2009.131
The
most recognized indicator of a recession is higher unemployment rates (Figure A-1). In
December 2007, the national unemployment rate was 5.0 percent and by June 2009 it was 9.5
percent. In the months of recovery following the recession, the national unemployment rate
peaked at 10.0 percent (October 2009). Compared with previous economic downturns, the higher
proportion, and duration of, unemployment in the Great Recession and its recovery period has
been significant.
131
The end of a recession and the beginning of its recovery is the time when gross domestic product (GDP) reaches
its lowest level.
Figure A-1.

A-2
Figure A-2 demonstrates the composition of the national labor force, broken out by age
group.132
The labor force is made up of the employed (depicted in blue), reflecting anyone with a
job, whether it is full-time, part-time, or temporary work and the unemployed (depicted in
red).133
Workers age 50 and older make up 32 percent of the national labor force. With the
lowest unemployment rate of all age groups, the chart shows that 50+ workers are the most likely
workers to have a job.
As of October 2013, the Connecticut labor force was estimated at 1,853,800, of which a
total of 147,100 were unemployed for an overall unemployment rate of 7.9 percent, compared to
the national rate of 7.3 percent.134
For 2013 Connecticut’s 50+ labor force is estimated at
662,849 (35.8 percent of the state workforce), of which 42,198 were unemployed (28.7 percent
of the state unemployed). Initial claims of regular unemployment by the 50+ population peaked
in the first quarter of 2009, with Connecticut 50+ unemployed workers filing 27,076 claims (38
percent of total claims for all age groups). From the last quarter of 2007 to the third quarter of
2013, the state’s 50+ unemployed workers made up an average of 36.2 percent of total initial
claims across all age groups.
Source: American Community Survey, 2009-2011 Public Use Micro Sample
132
The Bureau of Labor Statistics conducts a monthly survey, the Current Population Survey (CPS), of 60,000 U.S.
households to estimate the unemployment rate. People are classified as unemployed if they do not have a job, have
actively looked for work in the prior four weeks, and are currently available for work. The unemployment rate is the
number of unemployed persons as a percent of the labor force. (The labor force is the total number of employed and
unemployed persons.) Applying the same criteria, the long-term unemployment rate is the number of persons
unemployed for 27 weeks or longer as a percent of the labor force. 133
It should be noted there are alternative measures of labor under-utilization that can be used to define
unemployment more narrowly or more broadly. For instance, discouraged workers, who have given up looking for
work because they believe no jobs are available for them, are not captured in the official unemployment rate. 134
Seasonally adjusted. CT Department of Labor – Labor Force Data for the State of Connecticut & United States
(LAUS)
16 to 24 25 to 34 35 to 49 50+
Unemployed 4,243,355 3,077,556 3,804,579 3,369,862
Employed 16,836,049 26,406,030 43,288,236 42,143,172
0
5,000,000
10,000,000
15,000,000
20,000,000
25,000,000
30,000,000
35,000,000
40,000,000
45,000,000
50,000,000
Figure A-2. Labor Force Composition by Age - National Data
2011
20.1%
10.4%
8.1% 7.4%
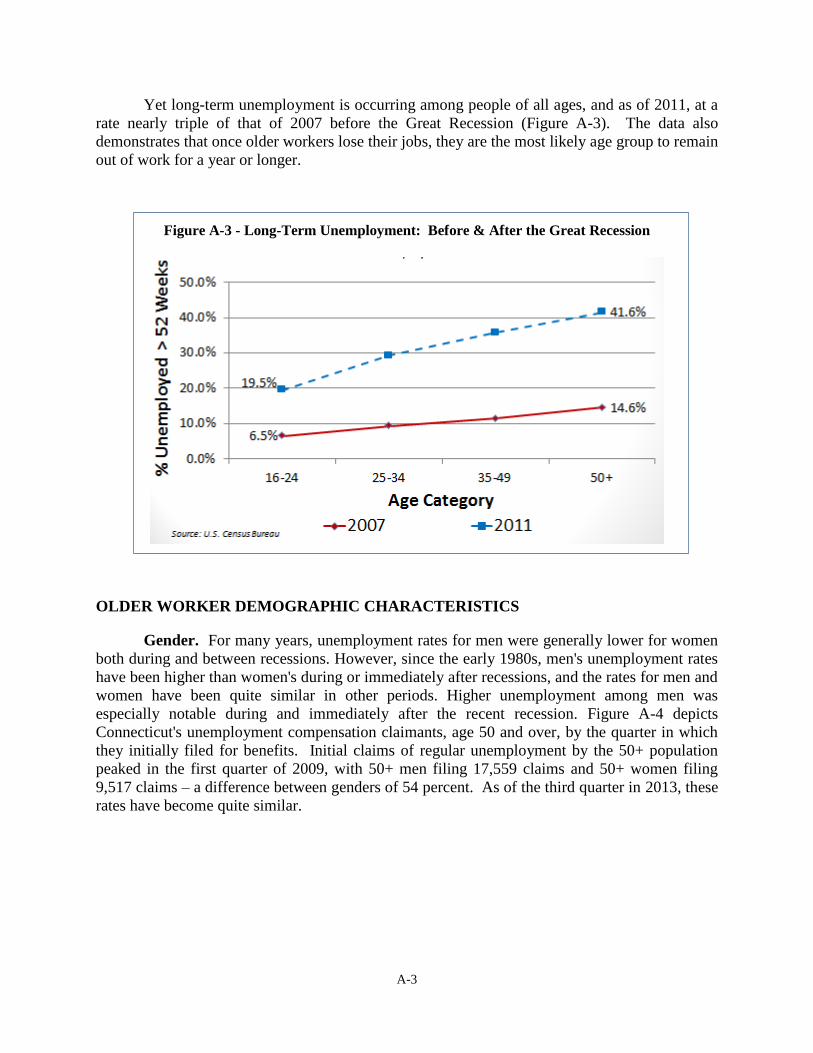
A-3
Yet long-term unemployment is occurring among people of all ages, and as of 2011, at a
rate nearly triple of that of 2007 before the Great Recession (Figure A-3). The data also
demonstrates that once older workers lose their jobs, they are the most likely age group to remain
out of work for a year or longer.
Figure A-3 - Long-Term Unemployment: Before & After the Great Recession
OLDER WORKER DEMOGRAPHIC CHARACTERISTICS
Gender. For many years, unemployment rates for men were generally lower for women
both during and between recessions. However, since the early 1980s, men's unemployment rates
have been higher than women's during or immediately after recessions, and the rates for men and
women have been quite similar in other periods. Higher unemployment among men was
especially notable during and immediately after the recent recession. Figure A-4 depicts
Connecticut's unemployment compensation claimants, age 50 and over, by the quarter in which
they initially filed for benefits. Initial claims of regular unemployment by the 50+ population
peaked in the first quarter of 2009, with 50+ men filing 17,559 claims and 50+ women filing
9,517 claims – a difference between genders of 54 percent. As of the third quarter in 2013, these
rates have become quite similar.
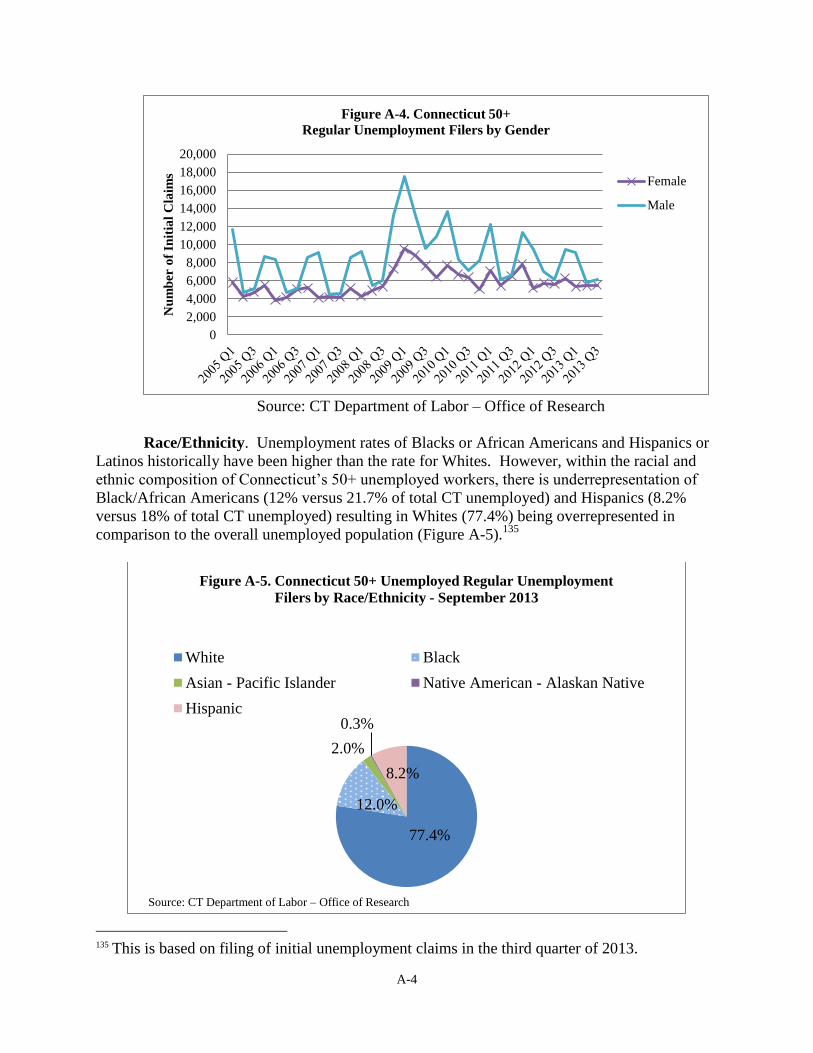
A-4
Source: CT Department of Labor – Office of Research
Race/Ethnicity. Unemployment rates of Blacks or African Americans and Hispanics or
Latinos historically have been higher than the rate for Whites. However, within the racial and
ethnic composition of Connecticut’s 50+ unemployed workers, there is underrepresentation of
Black/African Americans (12% versus 21.7% of total CT unemployed) and Hispanics (8.2%
versus 18% of total CT unemployed) resulting in Whites (77.4%) being overrepresented in
comparison to the overall unemployed population (Figure A-5).135
135
This is based on filing of initial unemployment claims in the third quarter of 2013.
0
2,000
4,000
6,000
8,000
10,000
12,000
14,000
16,000
18,000
20,000N
um
ber
of
Init
ial
Cla
ims
Figure A-4. Connecticut 50+
Regular Unemployment Filers by Gender
Female
Male
77.4%
12.0%
2.0%
0.3%
8.2%
Figure A-5. Connecticut 50+ Unemployed Regular Unemployment
Filers by Race/Ethnicity - September 2013
White Black
Asian - Pacific Islander Native American - Alaskan Native
Hispanic
Source: CT Department of Labor – Office of Research

A-5
OLDER WORKER LABOR CHARACTERISTICS
Retirement Age. In addition to higher and long-term unemployment among older
workers, there is a growing national trend of people working longer before retiring. In the early
1990s, the average age at retirement was 57. The average is now 61 years of age. Figure A-6
compares results between 1995 and the most recent annual Gallop survey. In 1995 when workers
were asked when they planned on retiring, 49 percent said they would retire before age 65. In
2013, just 26 percent are planning to retire before age 65. Following the Great Recession, many
workers now expect to retire later than originally anticipated, two-thirds (67 percent) of whom
indicate they need to rebuild retirement savings.
Figure A-6. Trends in Retirement Age
Connecticut is among the nation’s leading states in the percentage of senior citizens (65
years and older) still in the workforce, and showed increases in the senior workforce compared
with 2000, reflecting a national trend. Using U.S. Census data, Bloomberg.com ranked states
based on the percentage of seniors employed. Figures are calculated by dividing the number of
employed 65+ by the total population of 65+. In Connecticut, 9.2 percent of women age 65-69
are working, 3.3 percent of women age 70-74, and 2.2 percent of women 75 years old or older.136
The overall percentage of women seniors in the workforce in Connecticut increased from 9.9
percent in 2000 to 14.7 percent in 2011. Data for male senior citizens indicate that in
Connecticut, the overall percentage in the workforce is 23.8 percent, with 13.3 percent of those
age 65-69, 5.6 percent of those 70-74 and 4.4 percent of male seniors age 75 or older still
working.137
136
http://www.bloomberg.com/visual-data/best-and-worst/most-female-seniors-at-work-states Accessed on
November 1, 2013. 137
http://www.bloomberg.com/visual-data/best-and-worst/most-male-seniors-at-work-states Accessed on November
1, 2013.

A-6
Education. As the country’s economy has evolved into a more knowledge based one, a
greater percentage of the population have college degrees (especially true in Connecticut). Thus,
another reason people may be retiring at a later age is due to the higher education level of the
current population over previous generations of older workers, as workers with better
educational credentials tend to work longer. The circled-line in Figure A-7 shows the percent of
40-44 year olds with college degrees. In the 1980s and early 1990s, 40-44 year olds were better
educated than older workers—however, that educational difference has narrowed.
Figure A-7. Education Level of Older Male Workers
Research consistently shows that with increased education, median earnings rise and
average rates of unemployment fall (Figure A-8). A similar pattern is found for Connecticut
residents 50+ years old (Figure A-9).

A-7
Figure A-8. Earnings and Unemployment Rates by Educational Attainment
Source:Current Population Survey – August 2012 – September 2013
Less than
H.S.
diploma
H.S.
Diploma or
GED
Some
college or
Associate's
Bachelor's
degree or
more
50+ unemployed 3,984 13,308 12,146 12,760
50+ employed 31,287 167,283 150,079 272,002
0
50,000
100,000
150,000
200,000
250,000
300,000
Figure A-9. Connecticut's 50+ Labor Force by Education Level
2013
12.7%
8.0% 8.1%
4.7%

A-8
Tenure or Work Experience. Nationwide, over half of employed workers age 55 to 64
and those age 65 and over had 10 years or more of tenure with their current employer in 2012,
compared with less than 1 in 10 workers age 25 to 34 (Figure A-10).138 The median national
tenure figures also reflect this pattern; the medians for employed workers age 55 to 64 (10.3
years) and 65 and over (10.3 years) in 2012 were more than 3 times the median tenure for
workers age 25 to 34 years (3.2 years).139
Not surprisingly, Connecticut older unemployed workers had longer tenure before their
job loss. From the fourth quarter of 2007 to the third quarter of 2013 average tenure for regular
unemployment recipients was 19 years for 50+ workers and 15 years for all ages.140
Interestingly, longer job tenure appears to be indicative of longer durations of unemployment, as
the average tenure for extended unemployment recipients was 32 years for 50+ workers and 23
years for all ages (Figure A-11).
138
U.S. Bureau of Labor Statistics, Spotlight on Statistics, “Tenure of American Workers”,
September 2013. Steven F. Hipple and Emy Sok 139
U.S. Bureau of Labor Statistics, Spotlight on Statistics, “Tenure of American Workers”,
September 2013. Steven F. Hipple and Emy Sok 140
CT Department of Labor – Office of Research
Figure A-10.

A-9
Source: CT DOL Office of Research
Soft Skills. Besides demographic characteristics, another way to describe the study population
is by looking at what are considered some of the soft skills advantages of the 50 and older
workers. Soft skills refer to areas such as punctuality, interpersonal skills, teamwork, leadership
ability, and work ethic.141
Overall, Table A-1 shows qualities of older workers most highly rated
in an AARP survey of human resources executives.142
As shown, many of the top qualities of
older employees are considered desirable in any employee, regardless of age.
141
Connecticut Business and Industry Association (CBIA) 2013 Hartford-Springfield Business Survey. 142
AARP, 2000. “American Business and Older Employees.” Washington, DC: AARP.
0
5
10
15
20
25
30
35
Regular
unemployment
recipients
Extended
unemployment
recipients
Unemployment
exhausteesAv
era
ge
# o
f Y
ears
in
Jo
b P
rio
r to
Lo
ss
Fig. A-11. Tenure of Connecticut Unemployed Before Job Loss
2007-Q4 to 2013-Q3
50+
All ages

A-10
Table A-1. Top Seven Qualities That Companies Desire in Any Employee, Compared with
the Top Seven Qualities Perceived in Older Employees
Employee Qualities Most Desired Overall (According to HR Managers)
Top Qualities of Older Employees (According to HR Managers)
Rank Quality Rank Quality
1 Commitment to doing quality work 1 Loyalty and dedication to the company
2 Get along with coworkers 2 Commitment to doing quality work
3 Solid performance record 3 Someone you can count on in a crisis
4 Basic skills in reading, writing,
arithmetic
4 Solid performance record
5 Someone you can count on in a crisis 5 Basic skills in reading, writing,
arithmetic
6 Willing to be flexible about doing
different tasks
6 Solid experience in job and/or industry
7 Loyalty and dedication to the
company
7 Get along with coworker
Source: AARP, 2000. “American Business and Older Employees.” Washington, DC: AARP.
Writing skills. In a joint study between AARP and the Society for Human Resource
Management, 51 percent of the 430 human resources professionals surveyed thought workers
aged 50 and older were more likely to have better writing skills than workers 31 and younger.143
In particular, survey respondents referred to English language writing capabilities, grammar and
spelling skills.144
Professionalism and work ethic. Over half (52 percent) of those surveyed also thought
older workers showed stronger professionalism and work ethic.145
In a study of attitudes toward
older workers, the Society for Human Resource Management found 60 percent of personnel
managers surveyed said that older workers were more reliable than younger workers.146
In the
same survey, 59 percent of personnel managers rated older workers as having a stronger work
ethic than younger workers. In another survey of employers, three-quarters of respondents (74
143
SHRM (Society for Human Resource Management), Concerns Grow over Workforce Retirements and Skills
Gaps, 4/9/12, by Theresa Minton-Eversole. 144
The ‘Sliver Tsunami’: Why Older Workers Offer Better Value Than Younger Ones, December 6, 2010, website
Knowledge@Wharton (UPenn). 145
SHRM (Society for Human Resource Management), Concerns Grow over Workforce Retirements and Skills
Gaps, 4/9/12, by Theresa Minton-Eversole. 146
The ‘Sliver Tsunami’: Why Older Workers Offer Better Value Than Younger Ones, December 6, 2010, website
Knowledge@Wharton (UPenn).

A-11
percent) said that mature workers have a “very significant advantage” in being reliable and
dedicated.147
Valuable knowledge. Many of the employers surveyed (88 percent) also said that mature
workers have a “very significant advantage” in having valuable knowledge.148
A survey of
private-sector employers by the Center of Retirement Research at Boston College found support
for older workers having valuable knowledge, with more than four of five managers surveyed
reporting older workers have an advantage in knowledge of procedures and other aspects of the
job.149
Dedication and loyalty. Worker dedication and loyalty in this age group was supported
by the findings from another joint survey conducted by AARP and the Society for Human
Resource Management, where 77 percent of the 1,004 workers aged 50 and older said they
planned to remain in their current jobs until they stopped working completely.150
Dedication and
loyalty were also mentioned among the benefits of hiring older workers in a recent article by the
online magazine, corpmagazine.151
Customer service skills. The survey of private-sector employers by the Center of
Retirement Research at Boston College found more than four of five managers surveyed
indicated older workers had an advantage over younger workers in their abilities to interact with
customers.152
A recent article attributed these enhanced customer service skills to sharing a demographic with
certain customers and helping to create credibility and empathy with this segment of the
market.153
The advantage was also attributed to lifetime experience helping the employee better
at interacting with customers.
147
“The Real Talent Debate: Will Aging Boomers Deplete the Workforce?” April 2007, A WorldatWork Research
Report. 148
“The Real Talent Debate: Will Aging Boomers Deplete the Workforce?” April 2007, A WorldatWork Research
Report. 149
Employer Attitudes Towards Older Workers: Survey Results, by Alicia H. Munnell, Steven A. Sass, and
Mauricio Soto, An Issue Brief Center for Retirement Research (CRR) at Boston College, Series 3, June 2006. 150
“What are Older Workers Seeking?: An AARP/SHRM Survey of 50+ Workers,” by S. Kathi Brown, June 2012. 151
Six Benefits of Hiring Older Workers, by Debi Ritter, April 19, 2012, www.corpmagazine.com. 152
Employer Attitudes Towards Older Workers: Survey Results, by Alicia H. Munnell, Steven A. Sass, and
Mauricio Soto, An Issue Brief Center for Retirement Research (CRR) at Boston College, Series 3, June 2006. 153
“Are Older Workers Better Workers?” by Matt Sedensky, Associated Press, September 13, 2013.

This Page Intentionally Left Blank

B-1
Appendix B
Job Loss in the Great Recession and Opportunities in the Recovery
This appendix describes the areas most impacted by job loss in the Great Recession,
discusses the challenges of aligning the target population with suitable job opportunities in the
recovery, and identifies various jobs that may be suitable for older workers. In addition to
general requirements, in-demand jobs identified below take into account supply offsets, wage
sufficiency, and physical demands appropriate for the 50+ population. It should be noted that
several of these criteria could be utilized for other age groups as well.
Figure B-1 provides a historical overview of the impact of the six most recent U.S.
recessions on several key industries. In general, goods-producing industries experience the
largest declines in employment during recessions. The Great Recession was typical in this
regard, with construction and manufacturing both experiencing their largest percentage declines
in employment of the post-WWII era. Thus, it is not surprising to see the same industries that
incurred the largest job losses also displaced154
the most older workers nationwide (Table B-1).
However, few industries attracted as much attention during the recent recession as financial
activities, which experienced a nearly four percent reduction in employment. Before 2007, only
one recession since 1939 saw job losses in this sector. Only one segment of the economy saw
increases in employment -- education and health services -- during the recent recession. In fact,
employment has increased in these sectors for more than 30 years, regardless of the business
cycle.
154
The Bureau of Labor Statistics defines a displaced worker as "persons 20 years of age and older who lost or left
jobs because their plant or company closed or moved, there was insufficient work for them to do, or their position or
shift was abolished."

B-2
Table B-1. Top Ten Industries Displacing the Most 50+ Workers Nationally 2009-2011*
Rank Industry Rank Industry
1 Manufacturing 6 Medical
2 Construction 7 Entertainment & Leisure
3 Professional Services 8 Education
4 Retail 9 Transportation
5 Finance 10 Personal Services
Source: American Community Survey, 2009-2011 Public Use Micro Sample
*Of those reporting the industry in which they previously worked
Figure B-
1.
Source: Bureau of Labor Statistics

B-3
In Connecticut, displacements of 50+ workers followed a similar pattern, with the most
affected industries being: manufacturing, construction, administrative support, retail, and health
care and social assistance.155
The following ten categories represent nearly 80 percent of the older unemployed
nationwide, with Office/Admin, Construction, Sales, Management, and Production in the top
five. Occupational-level data for Connecticut’s 50+ unemployed workers was not obtainable.
Table B-2. Top Ten Occupational Categories of 50+ Displaced Workers Nationally
2009-2011*
Rank Occupation Rank Occupation
1 Office/Administration 6 Transportation
2 Construction 7 Cleaning
3 Sales 8 Repair
4 Managerial 9 Culinary
5 Production 10 Education
Source: American Community Survey, 2009-2011 Public Use Micro Sample
*Of those reporting the industry in which they previously worked
ISSUES WITH ALIGNMENT
Matching persons who are unemployed and the skills they possess with industry and
occupational fields with openings is an ongoing challenge, particularly for older workers. While
the projected number of job openings is an important factor in determining demand, it is
ultimately a best guess, and has not been very accurate in the past. Assuming projections are
somewhat close, employers within the same industry may respond to filling the demand with a
range of hiring decisions – some choosing highly skilled workers, others choosing lower skilled
workers.
Even assuming relative accuracy between projected workforce demands and actual job
openings, supply cannot be created overnight. The average turnaround time for new graduates
(two years for an Associate’s degree, four years for a Bachelor’s) can result in supply being out
of sync with current demands, particularly in fields involving rapidly changing technologies.
The information technology (IT) industry offers a good example. After the 1991
recession and subsequent sharp decline in IT jobs, engineering students switched to other
academic majors. Thus, a smaller class of IT majors graduated just as the dot-com boom began,
driving intense demand for their skills. As a result, current college students mass-enrolled in IT
155
Connecticut Department of Labor, Office of Research

B-4
programs and graduated around 2001 as the IT market began its collapse.156
Thus, older workers
must consider the possibility that investment in education or training may not result in
reemployment. With this risk in mind, the following job opportunities at the national as well as
state level are provided because they are currently in-demand and/or may be suitable for the
older worker population.
JOB OPPORTUNITIES IN THE RECOVERY
Since 2006, Manpower Group has surveyed more than 1,000 U.S. employers during the
first quarter as part of its annual Talent Shortage Survey. According to its 2013 survey, 39
percent of U.S. employers are having difficulty finding staff with the right skills, down from 49
percent in 2012. In the U.S. employers report that skilled trades positions are the most difficult to
fill, the fourth consecutive year this job has topped the list. The top 10 hardest jobs to fill are:
1. Skilled Trades
2. Sales Representatives
3. Drivers
4. IT Staff
5. Accounting & Finance Staff
6. Engineers
7. Technicians
8. Management/Executives
9. Mechanics
10. Teachers
Respondents cited candidates’ lack of technical competencies/hard skills (48 percent); lack of
workplace competencies/soft skills (33 percent); lack of applicants/no available candidates (32
percent); and candidates looking for more pay than is offered (27 percent) as the top reasons why
they are having difficulty filling open positions (Figure B-2).157
156
Cappelli, P. (2012). Why Good People Can't Get Jobs: The Skills Gap and What Companies Can Do About It.
Philadelphia: Wharton Digital Press.
157
Source: Manpower Group

B-5
Source: Manpower Group
A 2010 study conducted by Northeastern University examined the social sector industry
(defined in the report as covering health care, social assistance, educational services, nonprofit
community, religious organizations, the performing arts, museums, libraries, and government)
and identified the following current jobs that are anticipated to provide the most new job
opportunities in the coming decade for older workers (Table B-3). However, there are some
flaws with how these job opportunities were selected. First, they do not take into account
supply. For instance, the demand for particular occupations can be more than offset by an
overwhelming supply of graduates looking for work in those occupations. Also, athough the
researchers did exclude occupations that scored in the top 30th
percentile on a scale of physical
demands, 17 occupations originally excluded were added back to the list. As a result, five of the
15 identified positions below may be quite physically taxing and not an appropriate match for
certain older workers. Finally, some positions are low-paying jobs that would not enable an older
worker to meet basic living expenses.
40%
26%
55%
54%
44%
48%
33%
32%
27%
24%
Lack of technical competencies (hard skills)
Lack of workplace competencies (soft skills)
Lack of available applicants/no applicants
Looking for more pay than is offered
Lack of experience
Figure B-2. Reasons U.S. Employers Cite Regarding
Difficulty Filling Jobs
2013 2012

B-6
Table B-3. Social Sector Jobs Expected to Provide the
Most New Job Opportunities for U.S. Older Workers 2008-
2018158
Industry Number
(in Thousands)
Primary, secondary and special education teachers 647.3
Registered nurses 581.5
Home health aides 460.9
Personal and home care aides 375.8
Nursing aides, orderlies and attendants 276.0
Medical assistants 163.9
Licensed practical and licensed vocational nurses 155.6
Business operations specialists 147.2
General and operations managers 143.2
Child care workers 142.1
Teacher assistants 134.9
Receptionists and information clerks 132.7
Medical and health service managers 100.8
Clergy 85.1
Social and human service assistants 79.4
Source: After the Recovery: Help Needed: The Coming Labor Shortage and How
People in Encore Careers Can Help Solve It, Barry Bluestone & Mark Melnik.
JOB OPPORTUNITIES FOR 50+ WORKERS IN CONNECTICUT
For purposes of identifying jobs specific to Connecticut’s labor market, staff incorporated
certain appropriateness factors -- market demand versus supply; wage sufficiency, and physical
requirements -- to provide a more comprehensive screening of potential job opportunities for the
50+ population in Connecticut. PRI staff arrayed the appropriateness factors in Table B-4.
Again, it should be noted that several of these criteria could be utilized for other age groups as
well.
158
After the Recovery: Help Needed: The Coming Labor Shortage and How People in Encore Careers Can Help
Solve It, Barry Bluestone & Mark Melnik.

B-7
Market Demand vs. Supply. Potential in-demand jobs are shown in the first column of
Table B-4. Projected workforce demands must also be balanced with available supply. The
Training and Education Planning System (TEPS), a tool comparing annual job openings and
numbers of graduates, includes data from many CT sources, including the Department of Labor,
Office of Higher Education, and State Department of Education, to compare the numbers of in-
state graduates and annual job openings.
Wage Sufficiency. C.G.S. Sec. 4-66e requires OPM to develop an interagency self-
sufficiency standard, defined as a calculation of the income an employed adult may need to meet
basic needs such as housing, food, transportation and medical costs. The measure has to account
for geographical variations and household size. As a result, there is no single statewide measure.
The 2013 standard for a single adult ranges from an annual income of $21,000 to $32,000, and
for a household of two adults and two school-aged children, the standard ranges from an annual
household income of $53,000 to $76,000. Average annual salary information is provided in the
second column.
Physical Requirements. The Occupational Information Network (O*NET) is being
developed under the sponsorship of the U.S. Department of Labor. For the purpose of this study
the occupational requirements domain was utilized, which rates jobs on a 100-point scale
according to the general physical activity level required (see column 6). Staff chose to exclude
occupations rating a score of 50 or greater -- such as firefighters (89), auto mechanics (69), and
correctional officers (67) –as being too physically demanding.

B-8
Table B-4. Potential In-Demand CT Jobs Suitable for 50+ Workers
Job Title
Avg.
Annual
Salary
Degree Req.
Years of
Work
Experience
On-The-Job-
Training
Physical
Rating
Office/Administrative Support
Medical Secretaries $38,114 Diploma/GED n/a Moderate
(1-12 mos)
21
Customer Service Representative $39,209 Diploma/GED n/a Short-term
(up to 1 mo)
14
Insurance Claims & Policy
Processing Clerks
$39,675 Diploma/GED n/a Moderate 17
Secretaries & Administrative
Assistants (excl. legal, med, exec)
$40,091 Diploma/GED n/a Short-term 26
Billing & Posting Clerks $40,618 Diploma/GED n/a Short-term 10
Bill and Account Collectors $41,521 Diploma/GED n/a Moderate 12
Executive Secretaries & Executive
Administrative Assistants
$56,233 Diploma/GED 1-5 years n/a 23
First-Line Supervisors of Office &
Administrative Support Workers
$58,312 Diploma/GED 1-5 years n/a 28
Construction Trades
Painters, Construction &
Maintenance
$38,859 Less than
Diploma
n/a Moderate 47
Operating Engineers & Other
Construction Equipment Operators
$55,051 Diploma/GED n/a Moderate 57*
First-Line Supervisors of
Construction Trades & Extraction
Workers
$71,887 Diploma/GED 5+ years n/a 57*
Wholesale & Retail Sales
First-Line Supervisor of Retail Sales
Workers
$45,483 Diploma/GED 1-5 years n/a 42
Insurance Sales Agents $65,032 Diploma/GED n/a Moderate 11
Wholesale & Manufacturing Sales
Representatives (excl.
Technical/Scientific Products)
$77,969 Diploma/GED n/a Moderate 35
Securities, Commodities, and
Financial Services Sales Agents
$162,426 Bachelor’s n/a Moderate 14
(continued)

B-9
(continued) Table B-4. Potential In-Demand CT Jobs Suitable for 50+ Workers
Job Title
Avg.
Annual
Salary
Degree Req.
Years of
Work
Experience
On-The-Job-
Training
Physical
Rating
Managerial
Property, Real Estate & Community
Association Managers
$59,640 Diploma/GED 1-5 years n/a 18
Administrative Services Managers $89,162 Diploma/GED 1-5 years n/a 33
Education Administrators, Post-
Secondary
$101,662 Master’s 1-5 years n/a 21
Construction Managers $106,537 Associates 5+ years n/a 32
Medical & Health Services
Managers
$109,743 Bachelor’s n/a n/a 27
Sales Managers $114,537 Bachelor’s 1-5 years n/a 24
Education Administrators,
Elementary & Secondary
$117,591 Master’s 1-5 years n/a 40
Computer & Information Services
Managers
$118,572 Bachelor’s 5+ years n/a 39
Production & Operations
Team Assemblers $32,122 Diploma/GED n/a Moderate 59*
Machinists $43,209 Diploma/GED n/a Long-Term
(1 year or
more)
57*
First-Line Supervisors of Production
& Operations Workers
$67,087 Post-
Secondary
Non-Degree
Award
1-5 years n/a 49
Source: CT DOL Occupational Projections 2010-2020; O*NET Work Activities – General Physical
*Meets all other criteria; however score above 50 for physical activity requirement.
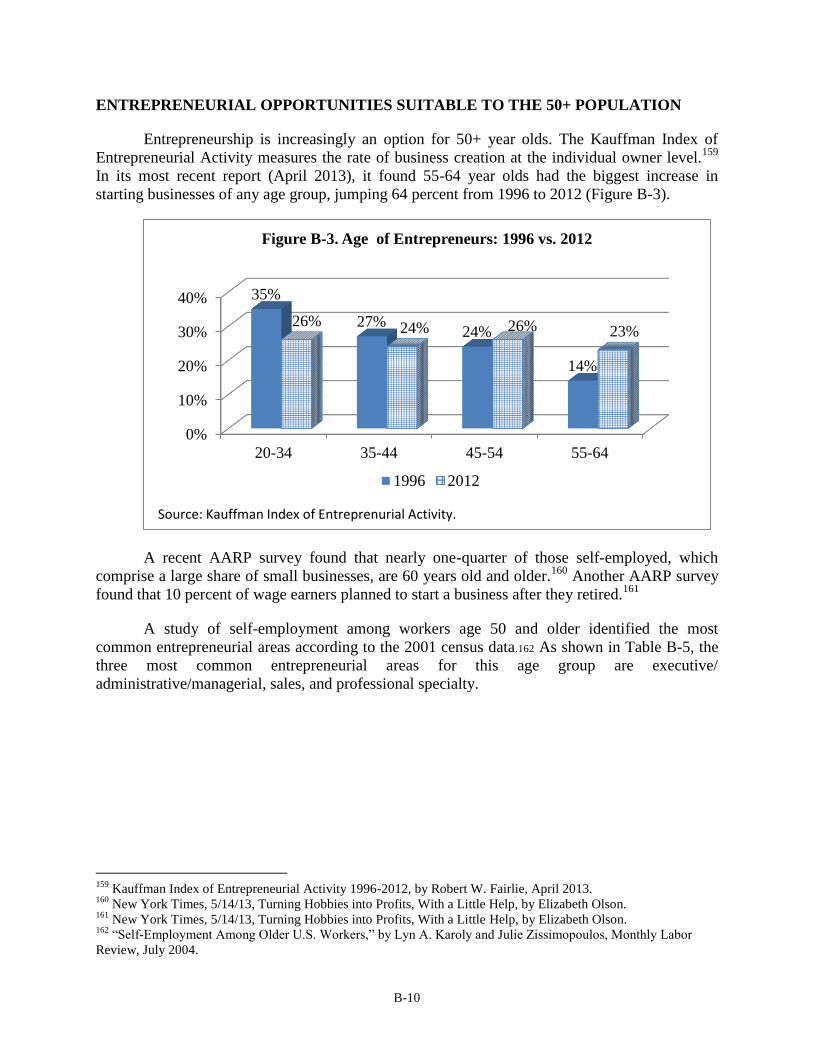
B-10
ENTREPRENEURIAL OPPORTUNITIES SUITABLE TO THE 50+ POPULATION
Entrepreneurship is increasingly an option for 50+ year olds. The Kauffman Index of
Entrepreneurial Activity measures the rate of business creation at the individual owner level.159
In its most recent report (April 2013), it found 55-64 year olds had the biggest increase in
starting businesses of any age group, jumping 64 percent from 1996 to 2012 (Figure B-3).
A recent AARP survey found that nearly one-quarter of those self-employed, which
comprise a large share of small businesses, are 60 years old and older.160
Another AARP survey
found that 10 percent of wage earners planned to start a business after they retired.161
A study of self-employment among workers age 50 and older identified the most
common entrepreneurial areas according to the 2001 census data.162 As shown in Table B-5, the
three most common entrepreneurial areas for this age group are executive/
administrative/managerial, sales, and professional specialty.
159
Kauffman Index of Entrepreneurial Activity 1996-2012, by Robert W. Fairlie, April 2013. 160
New York Times, 5/14/13, Turning Hobbies into Profits, With a Little Help, by Elizabeth Olson. 161
New York Times, 5/14/13, Turning Hobbies into Profits, With a Little Help, by Elizabeth Olson. 162
“Self-Employment Among Older U.S. Workers,” by Lyn A. Karoly and Julie Zissimopoulos, Monthly Labor
Review, July 2004.
0%
10%
20%
30%
40%
20-34 35-44 45-54 55-64
35%
27% 24%
14%
26% 24% 26% 23%
Figure B-3. Age of Entrepreneurs: 1996 vs. 2012
1996 2012
Source: Kauffman Index of Entreprenurial Activity.

B-11
Table B-5. Most Common Entrepreneurial Areas for 50+ Year Olds
Entrepreneurial Area Percent
Executive, administrative, managerial 28%
Sales 23%
Professional specialty 17%
Precision production, craft, repair 12%
Other service 8%
Transportation and material moving 3%
Source: Current Population Survey (CPS) 2001.
In a 2012 article,163
the U.S. Small Business Administration suggested several encore
entrepreneurship ideas:
remaking a hobby, interest, or passion into a money-producing enterprise;
consulting in previous industry, including to former employer;
developing a business that serves an unfilled niche in a community or industry;
and
starting a business that does something better or different than the competition
In an analysis of the survival rate of small businesses that were started in 2004,
researchers found that 68 percent were still in existence four years later, in 2008.164
The
researchers found that the surviving start-ups were more likely to have older founders (Figure B-
4). For example, there was a 47 percent survival rate when the founders were younger than age
45, but a 90 percent survival rate when founders were at least 45 years old.
163
“Senior Entrepreneurship—How to Tap a Lifetime of Experience into Business Success,” April 30, 2012, by
Caron Beesley, U.S. Small Business Administration. 164
“An Overview of the Kauffman Firm Survey: Results from the 2004-2008 Data, May 2010,” prepared by Alicia
Robb, E.J. Reedy, Janice Ballou, David DesRoches, Frank Potter, Zhanyun Zhao.
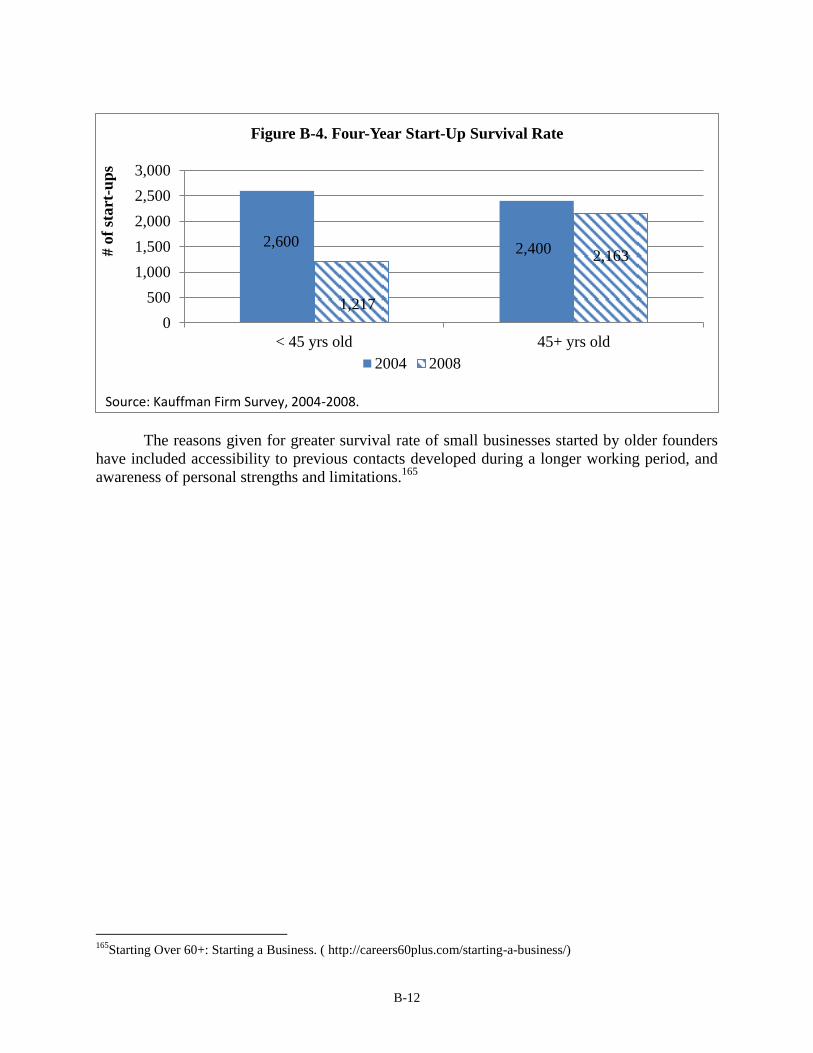
B-12
The reasons given for greater survival rate of small businesses started by older founders
have included accessibility to previous contacts developed during a longer working period, and
awareness of personal strengths and limitations.165
165
Starting Over 60+: Starting a Business. ( http://careers60plus.com/starting-a-business/)
2,600 2,400
1,217
2,163
0
500
1,000
1,500
2,000
2,500
3,000
< 45 yrs old 45+ yrs old
# o
f st
art
-up
s
Figure B-4. Four-Year Start-Up Survival Rate
2004 2008
Source: Kauffman Firm Survey, 2004-2008.