reexamining advanced manufacturing in a … · reexamining advanced manufacturing in a networked...
TRANSCRIPT

Reexamining advanced manufacturing in a networked world Prospects for a resurgence in New England
New England Council and Deloitte Consulting LLP December 2009

Introduction December 2009 Dear Council Members, Over the last year the New England Council has undertaken a joint study with Deloitte Consulting LLP, a management consulting firm and a member of the New England Council. The objective of this study was to determine appropriate strategies and solutions to capitalize on, and sustain potential growth in the advanced manufacturing industry in New England by assessing business capabilities, addressing barriers to growth, and identifying opportunities for development. Deloitte completed this study on a pro bono basis, and I am pleased to present the results of their efforts. The report, “Reexamining Advanced Manufacturing in a Networked World — Prospects for Resurgence in New England” identifies five subsectors within the New England manufacturing industry that are poised for growth, discusses the challenges these industry subsectors face, and identifies the opportunities for sustainable economic growth even during these difficult economic times. The report debunks the myth that advanced manufacturing is a dying industry. In particular, it highlights positive examples of efforts that are currently underway to increase manufacturing innovation and productivity in the region. This demonstrates that the manufacturing industry, particularly the advanced subsectors that are highly networked with the region’s engineering, science, finance, and other talent clusters, present economic opportunities for generations to come. With this report, we present an unequivocal call to action. It is now up to all stakeholders to move forward and capitalize on these opportunities. The New England Council is looking forward to working together with industry specialists, policymakers, educators, economists, and others to help sustain growth in New England’s manufacturing industry. Yours sincerely, James T. Brett President and CEO The New England Council


Table of contents
Executive overview 1
Study objectives 2
Summary of key findings 3
Study approach 5
Understanding advanced manufacturing in New England 6
Network dynamics — the new competitive advantage 17
Challenges and opportunities 20
Emerging recommendations 27
Appendix 32

Copyright © 2009 New England Council and Deloitte Development LLC. All rights reserved. 1
Executive overview
For centuries, the manufacturing industry has been a primary employer in New England. Despite a decline in recent decades, the industry has showed remarkable longevity even without the likelihood that it will return to its former prominence. On the other hand, advanced manufacturing has evolved, becoming a vibrant and growing sector. Key sub-sectors that are particularly distinctive in New England include signal processing, optics, aerospace, medical devices, sophisticated electronic assemblies, and advanced materials. Unfortunately, the promise of these industries has not been reflected in the actions of both the private and public sectors. Media coverage is dominated by job losses in traditional manufacturing and many political leaders seem to lack awareness of the vast potential within the advanced manufacturing arena. Educators, counselors, and parents have shunned the “make industries.” Successful manufacturers often find it difficult to establish their position with policy makers, and do not receive the support they need to convert opportunity into sustainable growth.
“Advanced manufacturing” is not dark, dirty, dangerous, or declining. The reality of the industry is quite the opposite — computer- savvy employees, a highly skilled and compensated workforce, and innovative products are the norm. Unlike its traditional counterparts, advanced manufacturing does not rely on low cost labor and scale/volume, but rather on skills and creativity to produce highly specified and complex products. Additionally, the industry does not exist as a set of isolated individual firms, but resides in a talent-rich network of engineers, business developers, entrepreneurs, scientists, financiers, machinists, and other experienced professionals that collaborate and wrap their creative powers around innovative customer solutions. Few regions can match this talent cluster in depth or diversity — it is truly a New England advantage. Traditional linear terms like “R&D pipeline” and “supply chain” are no longer accurate descriptions of how things are done. A cluster of advanced capabilities moves faster, solves problems more accurately, and leverages resources and insights more quickly among its members. Network interaction trumps the linear.
We have the opportunity to leverage the current focus on the economy and build on the earlier successes of the industry. This will allow New England to capitalize on the predicted economic upswing. Through a more focused collaboration of industry, government, and education, advanced manufacturing can be enhanced and expanded. Industry specialists can share best practices and services, government agencies can better target financial and workforce development support, and educators can play active roles in promoting the brand and enthusiasm for advanced manufacturing as part of the economy. In an advantaged network the bigger the talent cluster gets, the faster the growth. To be specific there is an opportunity to add between 7,500 and 8,500 advanced manufacturing jobs annually, with total compensation approaching $80,000, on average.
The recommendations outlined in this report must be implemented quickly in order to take advantage of the significant growth opportunities represented by advanced manufacturing as the economy rebounds.
Copyright © 2009 New England Council and Deloitte Development LLC. All rights reserved. 2
Study objectives
The New England Council (NEC) commissioned a joint study with Deloitte in 2008 to examine the potential for industry growth in advanced manufacturing within New England. The objective of the study was to determine appropriate strategies and solutions to capitalize on and sustain growth in advanced manufacturing sector by working with NEC members, regional state governments, industry leaders, and other interested stakeholders to assess business capabilities, address barriers to growth, and identify opportunities for growth.
More specifically, the study was structured to:
• Examine the potential for industry growth within advanced manufacturing in New England
• Provide a fact-based analysis of the industry sector using primary and secondary data
• Complete an analysis of stakeholder needs and concerns by conducting a series of interviews and workshops with regional state government agencies and officials, manufacturers, educational institutions, economists, and other interested parties
• Identify and articulate sustainable growth strategies to capitalize on potential growth opportunities
• Introduce options for public and private sector stakeholders to collaborate on efforts to drive growth
• Raise the profile of advanced manufacturing in New England
Copyright © 2009 New England Council and Deloitte Development LLC. All rights reserved. 3
Summary of key findings
Advanced manufacturing potential 1. The advanced manufacturing sector is large, vibrant, and highly-networked in New England
− Prior to the current economic downturn, job losses in advanced manufacturing had stabilized and were showing signs of growth
− Productivity is accelerating with high value-add per employee gains
− Advanced manufacturing operates in a complex network of suppliers, skill sets, and innovators
− There is a high concentration of capabilities: engineering, manufacturing, finance, research and development, systems engineering, machinists, business development, and other creative and experienced professionals
2. The most attractive advanced manufacturing subsectors in New England include:
− Signal processing/optics/measurement tools
− Aerospace and defense
− Medical devices
− Semiconductors and related high-end electrical components
− Material sciences (e.g., plastics, nanotechnology, plasma tools, etc.)
3. Innovative networks, which are clusters of experienced and creative professionals, surrounding advanced manufacturing subsectors is a significant regional competitive advantage
− Regional innovation networks enhance the overall learning curve as their cumulative volume increases — allowing network volumes to surpass any individual firm’s economies of scale
− Regional innovation networks promote the simultaneous development of design, manufacturing, and supply chain capabilities needed to create a product or service — building linkages between each of those components, allowing for continuous improvement and efficiency gains throughout the development and manufacturing processes
− Regional innovation network creates the reinforcing ideas and joint problem solving efforts needed to spur innovation
− Regional innovation networks can solve the “first unit” problem (i.e., the costs for manufacturing is highest for the production of the first unit) by collaborating in a network to design the first unit to a lower cost — it will not need large volumes to become cost competitive because the starting point is much more competitive. Additionally, innovative networks can deliver “first to market,” allowing for both market share gains and price premiums over late-comers.
− Regional innovation networks make it easier for participants to add and share services; allowing players to “do less and profit more”
Copyright © 2009 New England Council and Deloitte Development LLC. All rights reserved. 4
Challenges to overcome 4. Advanced manufacturing has achieved success even though it faces serious branding, education, state policy
and industry challenges
− Manufacturing is currently perceived to be “dark, dirty, dangerous and declining”
− Many schools prioritize academic subjects over hands-on learning, reducing opportunities for workforce development in the “make” industries
− Many state incentives were created in the 1950s and remain relatively unchanged
− There is insufficient collaboration among manufacturers, and between manufacturers and other industry partners
Achieving the resurgence 5. The further success of the advanced manufacturing sector will depend on a focused and collaborative approach
between the private, public, and education stakeholders within the new regional innovation framework.
− Creating a network of shared services providers — i.e., a linked grouping of the best workforce development, management training, and financing players — will more efficiently and effectively deliver the value of these services to advanced manufacturers than the current non-networked approach
− This framework allows for a “reconnaissance in force” where the successful advanced manufacturing networks combine with the most highly skilled shared services networks creating an environment that nurtures innovation and promotes economic growth
− Industry collaboration must increase; management needs to be on an accelerated learning and investment curve to continuously improve and gain market share
− Governments should take a more targeted and specific approach to providing industry support
− Educational institutions (e.g., high schools, community colleges, and universities) should be encouraged to play active roles in promoting the advanced manufacturing knowledge-economy
− Branding efforts should focus both on New England as a knowledge capital and the opportunities that exist for employees within specific industries
− The federal government should be encouraged to take a closer look at the immediate opportunities this sector presents for job growth and sustainable economic prosperity
− With focused support we would expect a job creation in advanced manufacturing of 8,000 annually in New England. There have been periods in the recent past in which this has occurred without the support described above, but never on a sustained basis
Copyright © 2009 New England Council and Deloitte Development LLC. All rights reserved. 5
Study approach
A detailed analysis of primary and secondary data was conducted to build a comprehensive picture of industry and labor trends in New England’s advanced manufacturing industry. Data from the United States Census Bureau, the Bureau of Labor Statistics, and the Bureau of Economic Analysis, as well as publicly available sources from state agencies and industry organizations was analyzed to determine baselines, detect industry trends, and identify industry subsectors poised for growth. This data analysis was supplemented with findings collected during interviews and workshops with individuals representing private and public sector interests. Together, quantitative analysis and qualitative review were used to develop insights into barriers to success and opportunities for growth in advanced manufacturing subsectors. This combined approach facilitated the development of recommended action steps to create incentives to spur growth and raise the profile of advanced manufacturing across New England.
To gain a clear understanding of the state’s competitive business environment, the study examined each state’s economy. From a macroeconomic level, location quotients — the percentage of jobs provided by a particular industry in a selected region as compared to the nationwide percentage of jobs in that same sector — were used as a proxy to identify the advanced manufacturing subsectors that were particularly well-represented in the region. These calculations were combined with an analysis of productivity data to pinpoint subsectors with the potential for economic growth. To complement this macro-analysis, the team conducted a microeconomic review of industry clusters that exist to support growing subsectors in the region. A cluster refers to all of the components of an industry’s value chain linking suppliers, partners, collaborators, and customers.
After these subsectors were identified, the team assessed both the core drivers and barriers to advanced manufacturing growth in the region. These issues included educational and workforce development, economic development policies, and industry branding. To validate initial findings and enhance analysis, the study team held interactive workshops with policymakers, economists, educators, service providers, business advocacy groups, and industry leaders on the following areas: overall industry trends, economic development policies, workforce development, and branding. In each workshop, a diverse group of stakeholders discussed the region’s manufacturing environment and identified key issues that the manufacturers were facing.
The final phase of this study focused on developing recommendations for the region to create an actionable economic development strategy to improve New England’s competitiveness in advanced manufacturing, increasing the region’s ability to grow, retain, and attract support.
These findings and recommendations were based on both the quantitative analysis of available data and the qualitative review of information provided by industry stakeholders.

Copyright © 2009 New England Council and Deloitte Development LLC. All rights reserved. 6
Understanding advanced manufacturing in New England
Advanced versus traditional manufacturing Advanced manufacturing is distinctive from traditional manufacturing in three ways: (1) volume and scale economics, (2) labor and skill content, and (3) the depth and diversity of the network surrounding the industry. Large volume product manufacturers (both process and fabrication industries) that compete traditionally by leveraging scale and low cost structures, and often include very advanced manufacturing technologies, are not defined in this study as advanced manufacturing. We call this traditional manufacturing, with automobile manufacturing and steel making being representative industries. Advanced manufacturing is characterized by:
1. Firms that innovate, co-create solutions, and create significant value by transforming raw materials into specific, highly specialized product solutions. Volumes are normally medium to low but highly complex
2. Firms that compete with high standards of operational excellence in the design, production, delivery, and management of the product life cycle
3. Firms that require a highly-skilled, highly compensated workforce that is essential for creating these complex product solutions (i.e., in the tradeoff between skills and labor rate, skills prevail)
4. A network or talent cluster consisting of scientist, researchers, precision machinists, engineers, financiers, business developers, entrepreneurs, and a number of other innovative, experienced professionals that wrap around advanced manufacturers to create customer solutions that solve both the “first unit” problem (i.e., the excess costs associated with producing the first unit or prototype which is critical since there are insufficient volumes to drive learning curves) and “first to market”
5. An ecosystem that rejects linear notions of R&D pipelines and supply chains as accurate descriptions of how things are done, rather they believe the strength of innovation and problem solving is in a robust network where cumulative volumes enhance learning across the entire membership
The complexity of the product solutions, skills, and the depth and diversity of the talent network makes advanced manufacturing more sustainable in New England and less prone to offshore outsourcing to low cost countries where the network is less advanced.
Sizing advanced manufacturing in New England The manufacturing industry has enabled Americans to explore the boundaries of science, technology, and commerce, and to achieve a high standard of living that is envied around the world. Advanced manufacturing remains a driving force of economic growth, productivity, and innovation in America and serves as a foundation for many other industries including retail, health care, technology, and professional services.
Advanced manufacturing has a strong history in New England and continues to play a significant role in the New England economy. New England’s current core manufacturing capabilities include precision machining, complex electronics assembly, tooling, prototyping, and engineering-manufacturing collaboration. The table below

Copyright © 2009 New England Council and Deloitte Development LLC. All rights reserved. 7
highlights the importance of manufacturing, specifically advanced manufacturing to the regional economy. For example, manufacturing contributes 13% of gross domestic product (GDP) and accounts for nearly 10% of all jobs to the economies of each of the New England states. Advanced manufacturing contributes nearly 9% of total GDP to the region, ranging from 4. 5% to 11% in the individual states, and nearly 5% of total jobs1.
The following map provides a general overview of the impact of advanced manufacturing on each of the six New England states. Advanced manufacturing jobs account for over half of those manufacturing jobs in four of the six New England states.
In addition to its concentration of advanced manufacturing capabilities, New England is a technological powerhouse. Just recently, four of the six New England states were ranked in the top ten in the Milken Institute’s
1 For the purposes of our analysis, advanced manufacturing includes the clusters identified in the following section.
New England CT ME MA NH RI VT
GDP ($billion) $623.1 $176.9 $39.36 $298.9 $49.23 $38.61 $20.9
Manufacturing GDP ($billion)
$82.713.3% of GDP
$24.113.6% of GDP
$5.0 12.8% of GDP
$39.213.2% of GDP
$6.58 13.9% of GDP
$4.110.6% of GDP
$3.3 16.0% of GDP
Advanced Manufacturing GDP
$53.798.6% of GDP
$13.2 7.5% of GDP
$2.1 5.3% of GDP
$28.69.6% of GDP
$4.37 8.9% of GDP
$1.72 4.5% of GDP
$2.3 11% of GDP
Total Population 14.3 million 3.5 million 1.3 million 6.4 million 1.3 million 1.07 million 607,067
Total Jobs 7.6 million 1.7 million 703,196 3.40 million 648,900 493,000 307,800
Total Manufacturing Jobs
710,5009.34% of labor force
190,82911.32% of labor force
59,2648.43% of labor force
295,1968.7% of labor force
77,619 12.3% of labor force
50,90410.6% of labor force
35,80011.8% of labor force
Total Advance Manufacturing Jobs
348,1404.58% of labor force
130,5527.74% of labor force
9,2981.3% of labor force
171,2495.1% of labor force
45,463 7.2% of labor force
28,7036.0% of labor force
11,9603.95 of labor force

Copyright © 2009 New England Council and Deloitte Development LLC. All rights reserved. 8
Science and Technology index of 20082. Massachusetts was ranked number one in the index as best positioned to economic growth due to its dominance in science and technology assets3.
As a final confirmation, foreign investment, primarily from European manufacturers, is flowing into New England at a significantly greater rate than the rest of the country. As indicated below, Connecticut and New Hampshire are leading the way.
2 DuVol, Ross et al. “State Technology and Science Index: Enduring Lessons for the Intangible Economy,” Milken Institute, 2008, pg. 1-2; http://www.milkeninstitute.org/pdf/StateTechScienceIndex.pdf 3 Ibid
3.70%
4.30%
4.50%
4.70%
5.50%
5.90%
6.60%
7.10%
Vermont
US Average
Rhode Island
Maine
New England
Massachusetts
New Hampshire
Connecticut
Foreign investment is 22% of all
manufacturing jobs in NH And 14% in CT
Percent of jobs resulting from foreign investment
Source: The Office of Trade and Industry Information; (http://www.ita.doc.gov/td/industry/otea/state_reports-2006

Copyright © 2009 New England Council and Deloitte Development LLC. All rights reserved. 9
Measuring growth in advanced manufacturing As part of the study, the team hosted a series of workshops with industry leaders, state officials, educators, economists, and business advocates. Their observations, combined with an analysis of primary and secondary source data, enabled us to determine the appropriate metrics for economic growth in advanced manufacturing.
While the drivers of economic growth and the measurement thereof was a topic of much debate, for this study, we have chosen — in simplified terms — to adopt the view that economic growth can be measured in three ways:
• Employment — the traditional measure of growth that tracks the year-to-year rate of change in the number of
manufacturing jobs
• Productivity — state GDP contributions from manufacturing
• Value of Shipments — per capita value of manufacturing shipments or output that reflects both productivity and increased value-add content per worker
A focus on productivity gains and value of shipments, in addition to employment growth, is particularly important in the manufacturing industry, where technology and continuous improvement has allowed for exponential increases in productivity without the correlated increase in jobs. That is not to say that these increases will not lead to job growth, but rather it reflects the lag between productivity gains and the increased employment that will result when those gains are invested back in that industry. Additionally, an increase in productivity or gross domestic product will increase labor income, business taxes, and capital income, thereby increasing state revenues. While job growth may be ideal from a state’s economic development perspective, the other measures should not be discounted as important components of the economy that can be influenced by state policies. In addition to these direct economic benefits, growth in productivity and output signal a vibrant business climate, making the region more competitive overall.
Finally, technological advancement and productivity improvements in the region have made New England competitive in the export market for manufactured goods. The highly-specialized products manufactured in the region and its reputation for a high-quality workforce and strong advanced manufacturing base have not only allowed some of the New England states to become export leaders, but have also attracted foreign business investment. If fostered, this growth potential could result in substantial gains for manufacturing in New England.

Copyright © 2009 New England Council and Deloitte Development LLC. All rights reserved. 10
Employment trends While jobs continue to decline overall in manufacturing, this trend is less pronounced in advanced subsectors. As shown in the figure below, by 2006, the decline in advanced manufacturing was below 2% and had been decreasing steadily since 2003. During our interviews in early 2008, many advanced manufacturers were complaining about manpower shortages that were constraining growth prospects. We estimated that between 3,200 and 4,000 jobs remained vacant do to a lacking skill base. Obviously, the current recession halted progress, the trends are nevertheless encouraging.
-12.00%
-10.00%
-8.00%
-6.00%
-4.00%
-2.00%
0.00%
2003 2005 2006
Perc
enta
ge C
hang
e fr
om P
revi
ous
Year
Manufacturing Job Trends
New England - Advanced Manufacturing
New England - All Manufacturing
Productivity The real Gross Domestic Product (GDP) contribution by state from advanced manufacturing sub-sectors has increased in the region, reflecting an advantaged competitive position. The chart below depicts the astonishing growth in real GDP for advanced manufacturing subsectors from 1998 through 2006, while providing the comparison to the relative stagnant growth in real GDP contributions from general manufacturing.
0
10000
20000
30000
40000
50000
60000
1997 1998 1999 2000 2001 2002 2003 2004 2005 2006
Total GD P ($
-
Millions)
Real GDP Growth for New England
Advanced Manfucturing
All Other Manufacturing
Source: Bureau of Economic Analysis, Deloitte Analysis
+ 70% increase

Copyright © 2009 New England Council and Deloitte Development LLC. All rights reserved. 11
Value of shipments In advanced manufacturing subsectors, the per capita value of shipments has risen in recent years in all states. In addition, most state values are higher than the national per capital value. In addition, as shown in the chart below, per capita productivity in most New England states is near or exceeds per capita productivity in advanced manufacturing nationally. The only exception is Vermont, partly due to incomplete data.
0.00
1000.00
2000.00
3000.00
4000.00
5000.00
6000.00
7000.00
2002 2003 2005 2006
Per C
apit
a V
alue
($s)
Per Capita Value of Shipments for Advanced Manufacturing Subsectors
US
New England
MA
CT
RI
NH
ME
VT
Source: US Census Bureau, Deloitte analysis Note: The value of shipments calculations for the state of Vermont are skewed by the fact that the Census Bureau does not provide state shipments data for NAICS codes that are only represented by a limited number of companies in that state, to prevent information about individual companies from being represented in the data.
Advanced manufacturing industry clusters poised for growth The growth trends discussed above are encouraging but are even more meaningful from a regional competition point of view when examining the concentration of capabilities. To assess New England’s competitiveness we used a location quotient — the concentration of jobs in an industry subsector as compared to the national proportion for that same subsector.4 This proxy for the economic strength of an industry subsector was used by the team to identify advanced manufacturing clusters with the highest potential for growth in New England. Using data from both public and private sources, we identified five advanced manufacturing clusters that currently make up a substantial portion of the economy and appear to offer significant opportunity for further economic development:
• Signal-processing, navigational, optic, and measurement tools
• Aerospace and defense
• Semiconductors and related complex electrical components/assemblies
• Medical devices
4 This comparison between the ratios of concentration of a certain industry in a region as compared to that same ratio for a much larger geographical area, such as the entire nation, is commonly referred to as the location quotient, a measure of economic base analysis. A location quotient greater than 1 indicates that a region’s economic strength in that sector or sub-sector is larger than average.

Copyright © 2009 New England Council and Deloitte Development LLC. All rights reserved. 12
• Material sciences (e.g., plastics, nanotechnology, plasma tools, etc.)
Our findings were significant. As measured by the location quotient, there is a higher job concentration in these advanced manufacturing clusters in New England states than in the nation as a whole, with particular dominance in signal processing, aerospace and defense, and complex electronics. All New England states have exceptional concentration in at least two of the clusters. In summary New England has a strong base of capabilities (both scale and scope) in these clusters.
The tables below provide information on the concentration of each of these clusters regionally and across the New England states and highlight the per capita shipments produced by each subsector.
Cluster 1: Signal-processing, navigational, optic, and measurement tools
Defense electronics contractors dominate the signal-processing, navigational, optic, and measurement tools cluster. Prominent companies in this cluster include large multinational firms such as Raytheon, headquartered in Waltham, Massachusetts (MA) which develops defense technology and security tools, as well as smaller, emerging firms, such as Insight Tech-Gear headquartered in Londonderry, New Hampshire (NH,) which is a leading military supplier of optical instruments. Firms like Perkin Elmer and Waters Corporation compete in measurement tools, instruments and sensors.
As shown below, several New England states, notably New Hampshire, have a high concentration of jobs in this subsector, as indicated by a location quotient greater than 1. In addition, the per capita value of shipments for companies in this cluster exceeds the national per capita value of shipments, highlighting the region’s strength in these high precision technologies.
2006 Location quotients – signal-processing, navigational, optic, and measurement tools cluster
Region 2.68 NH 8.32 RI 3.60 MA 2.77 CT 1.29 VT 1.20
0.00
500.00
1000.00
1500.00
2000.00
2500.00
2002 2003 2005 2006
Per C
apit
a V
alue
($s)
Per Capita Value of Shipments for Signal-Processing, Navigational, Optic, & Measurement Tools Cluster
US
New England
MA
CT
RI
NH
Regional economic base
Productivity growth
Source: US Census Bureau, Deloitte analysis Note: The Census Bureau did not provide value of shipments data for Vermont for the NAICS codes included in our cluster analysis to protect the identity of companies in that cluster, that is, there are not enough companies operating under this code to disguise the value of shipments for individual companies.

Copyright © 2009 New England Council and Deloitte Development LLC. All rights reserved. 13
Cluster 2: Aerospace and defense
Historically, New England has been a leader in the aerospace and defense industry. Ship-building in the region dates to colonial times, and aircraft engine production rose to prominence in Connecticut beginning in the 1920s. Currently, regional players in this cluster include large multinational corporations such as United Technologies (UTC), a leading producer of aircraft engines, aircraft sub-systems and helicopters headquartered in Hartford, Connecticut (CT) and the smaller machine shops and parts manufacturers that supply the materials needed to build those products. From a marine perspective, two of General Dynamics’ largest ship and submarine-building subsidiaries are based in New England — Electric Boat has locations in Groton, CT, and Quonset Point, Rhode Island (RI); while Bath Iron Works is based in Bath, Maine (ME.)
Connecticut leads the way in this cluster. The state’s dominance in the aerospace industry, led by UTC-owned Sikorsky, Hamilton Sundstrand, and Pratt & Whitney, is well-known. As the figure below indicates, not only does the state have a location quotient of 6.86, or a proportion of jobs approximately 686% larger than the national proportion, the state’s per capita value of shipments is four times the national value.
0.00
500.00
1000.00
1500.00
2000.00
2500.00
3000.00
2002 2003 2005 2006
Per C
apit
a V
alue
($)
Per Capita Value of Shipments for Aerospace & Marine Industries Cluster
US
New England
CT
ME
Regional economic base
2006 Location quotients – Aerospace and military shipbuilding
Region 2.22 CT 6.86 ME 3.41
Productivity growth
Source: US Census Bureau, Deloitte analysis
Cluster 3: Medical devices
New England is known for its leadership in medical research and innovation. That strength combined with the regional strengths in materials sciences, including high-tech polymers and plastics, and its capabilities in design have increased the prominence of medical device manufacturing in the region. The strong medical foundations that exist in Boston, MA, Providence, RI, and New Haven, CT, have inspired large and small manufacturers to establish a home in New England. Many small medical device manufacturers such as Concordia in Coventry, RI, have been growing in recent years, strengthening the base for this subsector in the region that had originally been fostered by larger players such as Boston Scientific in Natick, MA. In addition, other manufacturing companies, notably Nypro, a plastics manufacturer based in Clinton, MA that previously supported other industries, have begun to integrate themselves into the supply chain for medical devices.
Copyright © 2009 New England Council and Deloitte Development LLC. All rights reserved. 14
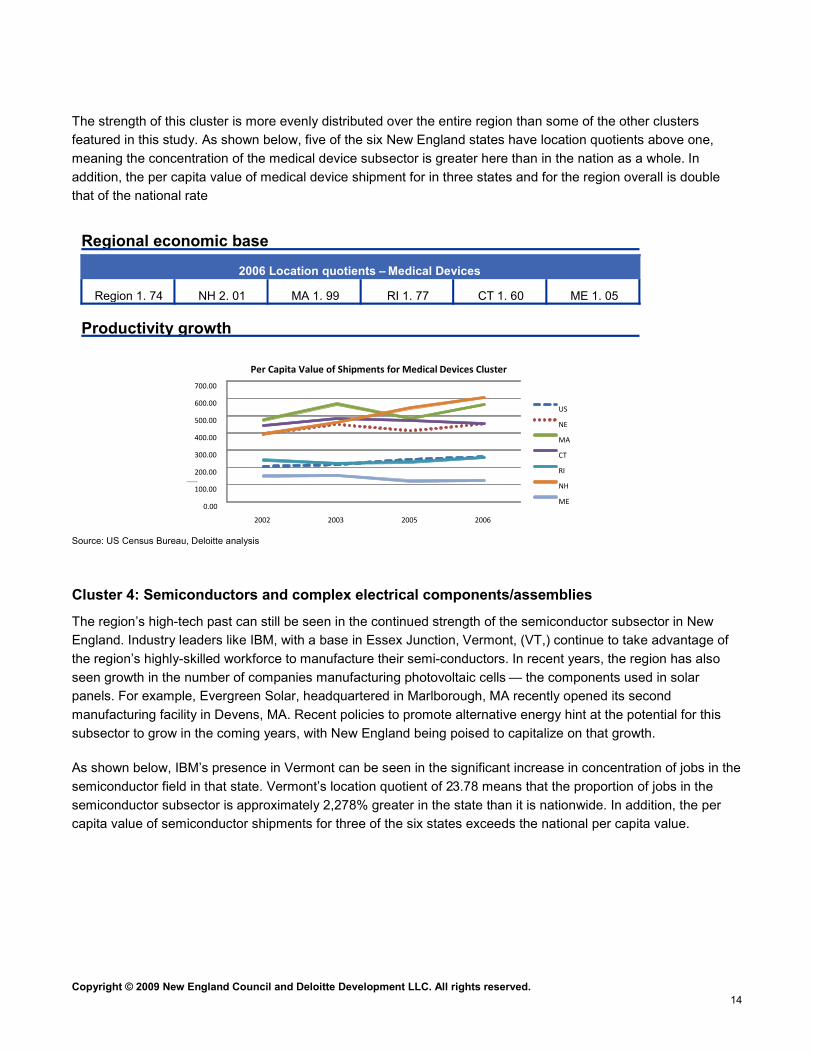
The strength of this cluster is more evenly distributed over the entire region than some of the other clusters featured in this study. As shown below, five of the six New England states have location quotients above one, meaning the concentration of the medical device subsector is greater here than in the nation as a whole. In addition, the per capita value of medical device shipment for in three states and for the region overall is double that of the national rate
Source: US Census Bureau, Deloitte analysis
Cluster 4: Semiconductors and complex electrical components/assemblies
The region’s high-tech past can still be seen in the continued strength of the semiconductor subsector in New England. Industry leaders like IBM, with a base in Essex Junction, Vermont, (VT,) continue to take advantage of the region’s highly-skilled workforce to manufacture their semi-conductors. In recent years, the region has also seen growth in the number of companies manufacturing photovoltaic cells — the components used in solar panels. For example, Evergreen Solar, headquartered in Marlborough, MA recently opened its second manufacturing facility in Devens, MA. Recent policies to promote alternative energy hint at the potential for this subsector to grow in the coming years, with New England being poised to capitalize on that growth.
As shown below, IBM’s presence in Vermont can be seen in the significant increase in concentration of jobs in the semiconductor field in that state. Vermont’s location quotient of 23.78 means that the proportion of jobs in the semiconductor subsector is approximately 2,278% greater in the state than it is nationwide. In addition, the per capita value of semiconductor shipments for three of the six states exceeds the national per capita value.
Regional economic base
Productivity growth
2006 Location quotients – Medical Devices
Region 1. 74 NH 2. 01 MA 1. 99 RI 1. 77 CT 1. 60 ME 1. 05
0.00
100.00
200.00
300.00
400.00
500.00
600.00
700.00
2002 2003 2005 2006
Per Capita Value ($)
Per Capita Value of Shipments for Medical Devices Cluster
US NE
MA
CT RI
NH ME

Copyright © 2009 New England Council and Deloitte Development LLC. All rights reserved. 15
Regional economic base
Productivity growth
2006 Location quotients – Semiconductors
Region 2.39 VT 23.78 ME 4.11 MA 1.84 NH 1.12
0.00
200.00
400.00
600.00
800.00
1000.00
1200.00
1400.00
2002 2003 2005 2006
Per C
apita
Valu
e ($
)
Per Capita Value of Shipments for Semiconductors Cluster
US
NE
MA
NH
ME
Source: US Census Bureau, Deloitte analysis
Note: The Census Bureau did not provide value of shipments data for Vermont for the NAICS codes included in our cluster analysis to protect
the identity of companies in that cluster; that is, there are not enough companies operating under this code to disguise the value of shipments
for individual companies. Consequently, revenues for IBM’s Essex Junction, VT location were used as a proxy for value of shipments in
Vermont, as IBM is the state’s largest employer. It should also be noted that because the NAICS codes do not yet include a classification for
photovoltaic cell manufacturing, shipments from firms producing those types of products, like Evergreen Solar, are likely not represented in
these value of shipments calculations.
Material sciences cluster Small- and mid-sized materials sciences manufacturers have made up the traditional base of manufacturing in New England for decades. Materials sciences producers ranging from precision machine shops through advanced nanotechnology manufacturers continue to call New England home. In addition, many of these companies possess the agility necessary to innovate in response to market conditions.
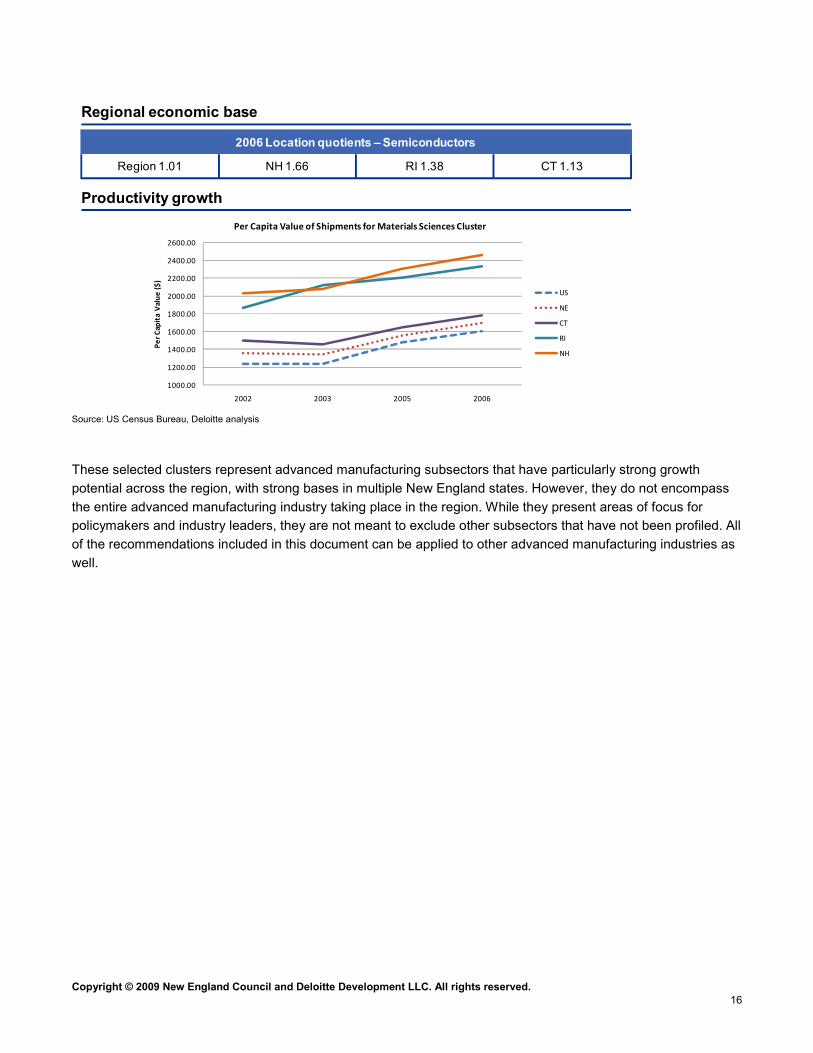
While the economic base, as indicated in the location quotient, in this cluster is not as significantly different from the national average as some of the other clusters, three states in the region show a noticeably higher proportion of jobs in this subsector. In addition, the per capita value of materials sciences shipments for New Hampshire and Rhode Island is double the national value, highlighting the productivity potential in this cluster.
Copyright © 2009 New England Council and Deloitte Development LLC. All rights reserved. 16
1000.00
1200.00
1400.00
1600.00
1800.00
2000.00
2200.00
2400.00
2600.00
2002 2003 2005 2006
Per C
apit
a V
alue
($)
Per Capita Value of Shipments for Materials Sciences Cluster
US
NE
CT
RI
NH
Regional economic base
Productivity growth
2006 Location quotients – Semiconductors
Region 1.01 NH 1.66 RI 1.38 CT 1.13
Source: US Census Bureau, Deloitte analysis
These selected clusters represent advanced manufacturing subsectors that have particularly strong growth potential across the region, with strong bases in multiple New England states. However, they do not encompass the entire advanced manufacturing industry taking place in the region. While they present areas of focus for policymakers and industry leaders, they are not meant to exclude other subsectors that have not been profiled. All of the recommendations included in this document can be applied to other advanced manufacturing industries as well.

Copyright © 2009 New England Council and Deloitte Development LLC. All rights reserved. 17
Network dynamics — the new competitive advantage
Linear thinking is an old paradigm. Terms like “R&D pipeline” suggest a slow, step- by- step approach of discovery with multiple handoffs. Supply chains imply a similar linking of capabilities and planning. We believe in New England, networks provide multiple points of connection, a diversity of perspectives and problem solving, and prospects for greater discovery and alignment of capabilities. The world is much more dynamic and fluid than a linear progression. Initially, these networks were developed around the supply, research, and service needs of larger advanced manufacturing firms. Over time they have become more interconnected and innovative.
The breadth of innovation networks As seen below, the innovation network that has grown up around Sikorsky and Pratt & Whitney not only spans almost the entire New England region, but also includes suppliers of all levels and types, from sub-assemblers who provide large, complex parts that are used to assemble the engines and airframes produced by these two companies, down to companies that provide shared support such as employee training.
Sample New England Aerospace Innovation Network
3 8
8 7
2 2 0
2 3 4
1 8 0
2 5 3
1 7 7
1 1 0
1 2 3
2 1 7
1 8 6
1 9 4
1 9 3
1 9 0
1 1 8
1 4 1
1 4 8
2 2 45 5
2 3 8
1 0 9
3 9
1 5 4
1 8 5
2 0 8
1 9 5
8 9
1 3 21 2 9
2 4 4
6 1
2 3 1
2 2 6
1 2 8
1 1 6
6
1 4 9
1 7 6
1 3 1
1 6 6
2 4 8
1 9 9
1 8 2
1 5 8
1 9
2 6
4 7
6 6
2 4 0
2 3 9
6 4
1 2 7
1 3 3
5 2
2 2 5
4 0
3 5
4 4
1 4 41 2 5
3 2
5 3
1 8 4
2 2 1
1 2 1
2 1 4
2 4 1
1 4 0
2 0
7 7
9 1
8 42 3 7
1 6 5
7 8
2 4 9
2 2 7
8 2
1 8 8
1 0 1
1 1 1
1 1 3
1 1 43 0
5 9
4 3
7 1
8 5
2 4 3
1 6 2
1 7 2
1 7 9
6 9
5 7
1 0 4
1 3 0
2 1 2
1 3 4
4 8
2 5 1
1 9 6
1 4 5
1 5 6
1 0 0
1 4 7
2 2 8
1 0 3
1 5 7
1 2 2
2 2
1 6 9
2 1 9
2 5 2
2 5 0
1 0 2
2 4 2
1 2 4 1 8 1
2 1
3 3
7 3
1 82 0 5
2 3
7 9
1 3 6
1 7
1 7 3
1 7
1 9 1
1 9 8
2 0 4
1 6 3
1 5 5
1 3 7
1 6 0
6 0
2 0 3
2 4
2 0
72 2 4
2 0 2
1 0
7 2
1 5 3
1 0 5
1 6 1
1 7 4
2 3 2
9 7
8
9 6
1 7 0
1 7 5
2 4 6
3 6
2 4 7
1 5 1
2 2 3
1
7 0
9 5
9 8
2 0 1
1 6 4
1 8 3
9 9
2
4 6
5
5 8
1 3
4 5
5 0
8 1
1 5
1 6
4 9
9 2
2 0 0
2 1 3
1 6 8
1 4 61 8 9
5 4
6 7
2 2 6
2 3 6
1 4 2
1 1 7
1 2 6
1 3 8
1 1 9
1 5 0
1 0 8
1 5 2
1 0 6
2 0 9
6 8
1 0 7
1 2 9
2 9
6 3
8 8
7 5
2 8
2 5
6 5
1 1 2
1 2 0
2 1 6
2 1 0
2 5 5
8 0
2 1 1
3 1
1 7 8
2 3 3 1 9 2
2 1 8
2 3 5
1 6 7
9
3 7
7 6
4 1
6 2
3 4
1 5 9
1 1 5
1 3 5
3
1 4
4
7 4
4 2
2 4 5
1 2
2 3 0
2 5 42 0 6
8 6
1 4 3
9 4
1 12 2 2
9 07
5 6
2 1 5
1 9 7
9 31 8 7
8 3
1 6 6
Represents 254 companies in the New England area*
State Tier 1 Tier 2 Tier 3 OSP Logistics Shared Support %
MA 8 27 5 16 0 1 22%
RI 1 1 1 3 0 0 2%
VT 1 2 1 1 0 0 2%
NH 3 11 2 4 0 0 8%
CT 27 71 17 49 1 1 65%
% 16% 44% 10% 29% 0% 1% 100%
Legend ColorsOEM Manufacturer
Tier 1 Sub- Assembly
Tier 2 Parts Provider
Tier 3 Materials Provider
Outside Service Provider
Logistics Provider
Product Design/Innovation
Shared Support/Access Education
Sikorsky
Pratt & Whitney
Both OEMs
*These companies represent a sampling of the Sikorsky and Pratt & Whitney supply chains in the regionSource: Sikorsky, Pratt & Whitney; Deloitte Analysis
Copyright © 2009 New England Council and Deloitte Development LLC. All rights reserved. 18
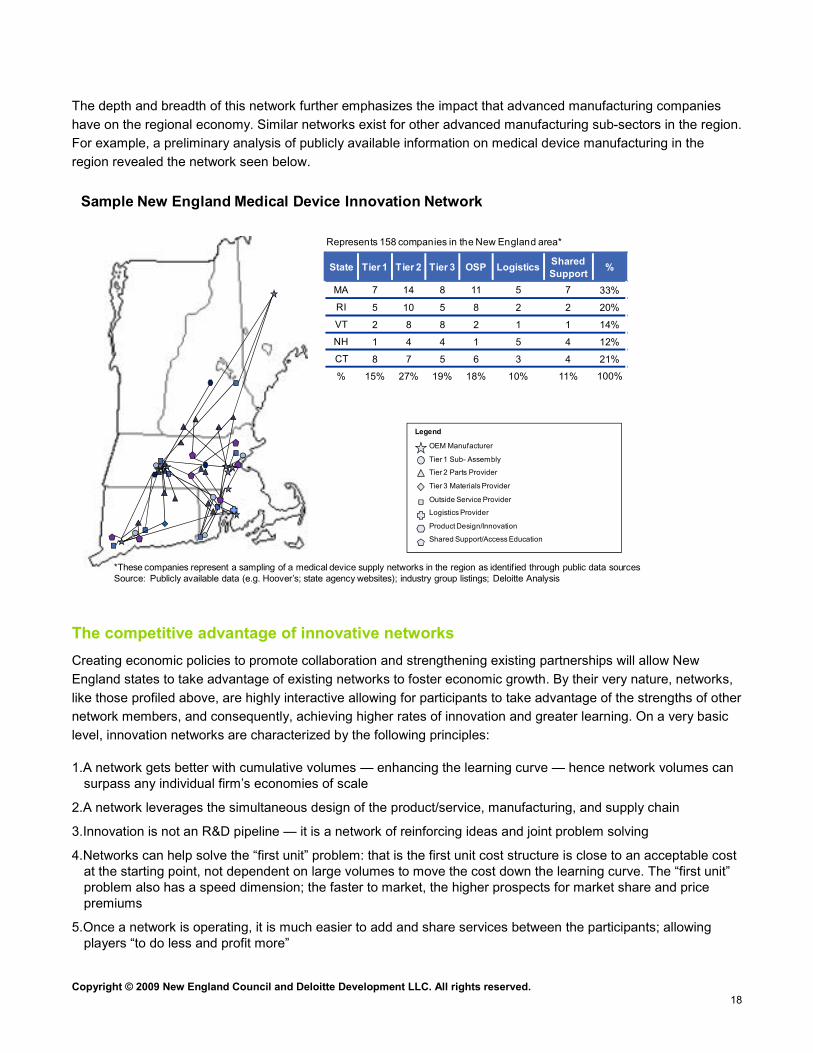
The depth and breadth of this network further emphasizes the impact that advanced manufacturing companies have on the regional economy. Similar networks exist for other advanced manufacturing sub-sectors in the region. For example, a preliminary analysis of publicly available information on medical device manufacturing in the region revealed the network seen below.
Sample New England Medical Device Innovation Network
Legend
OEM Manufacturer
Tier 1 Sub- Assembly
Tier 2 Parts Provider
Tier 3 Materials Provider
Outside Service Provider
Logistics Provider
Product Design/Innovation
Shared Support/Access Education
Represents 158 companies in the New England area*
State Tier 1 Tier 2 Tier 3 OSP Logistics Shared Support %
MA 7 14 8 11 5 7 33%
RI 5 10 5 8 2 2 20%
VT 2 8 8 2 1 1 14%
NH 1 4 4 1 5 4 12%
CT 8 7 5 6 3 4 21%
% 15% 27% 19% 18% 10% 11% 100%
*These companies represent a sampling of a medical device supply networks in the region as identified through public data sourcesSource: Publicly available data (e.g. Hoover’s; state agency websites); industry group listings; Deloitte Analysis
The competitive advantage of innovative networks Creating economic policies to promote collaboration and strengthening existing partnerships will allow New England states to take advantage of existing networks to foster economic growth. By their very nature, networks, like those profiled above, are highly interactive allowing for participants to take advantage of the strengths of other network members, and consequently, achieving higher rates of innovation and greater learning. On a very basic level, innovation networks are characterized by the following principles:
1. A network gets better with cumulative volumes — enhancing the learning curve — hence network volumes can surpass any individual firm’s economies of scale
2. A network leverages the simultaneous design of the product/service, manufacturing, and supply chain
3. Innovation is not an R&D pipeline — it is a network of reinforcing ideas and joint problem solving
4. Networks can help solve the “first unit” problem: that is the first unit cost structure is close to an acceptable cost at the starting point, not dependent on large volumes to move the cost down the learning curve. The “first unit” problem also has a speed dimension; the faster to market, the higher prospects for market share and price premiums
5. Once a network is operating, it is much easier to add and share services between the participants; allowing players “to do less and profit more”

Copyright © 2009 New England Council and Deloitte Development LLC. All rights reserved. 19
Because innovation networks reinforce themselves, they present opportunities for exponential levels of growth. Consequently, they can serve as prime drivers of business innovation and transformation. Both of these characteristics will be necessary for advanced manufacturing to survive and thrive during economic downturns like the one the world is currently facing.

Copyright © 2009 New England Council and Deloitte Development LLC. All rights reserved. 20
Challenges and opportunities
Business leaders, state officials, educational leaders, and economists who were interviewed separately or participated in the study’s workshops identified a number of challenges to doing business in New England. Many shared similar concerns about the threats confronting the growth of advanced manufacturing in the region. In particular, the following issues were identified as the primary industry challenges:
• A lack of educational alignment with business training needs and an inadequate talent pipeline
• Outdated economic policies that don’t meet the needs of current manufacturers and focus solely on promoting job growth
• The lack of a positive brand to counteract the reputation that manufacturing is a dying industry with limited career potential
• The need for management to simultaneously achieve operational excellence and develop new markets and customers with limited resources of time, talent, and money
The following discussion explores each of these issues in more detail providing insights into the challenges facing manufacturers and identifying opportunities for tackling them head-on to promote industry growth.
The growth observed in these advanced subsectors has, in part, been driven by economic clustering and foreign investment, both of which strengthen the reputation of existing companies and encourage other companies to locate to region. However, this growth also developed through a collaborative effort between developers, industry leaders, and policy makers to foster the creativity and economic incentives necessary to foster innovation. This experience highlights the fact that building partnerships between state agencies, industry groups, educational institutions, and business leaders is the most effective way to foster growth in advanced manufacturing. The lessons learned from companies in these clusters on facilitating innovation, moving up the value chain, and improving operations can also be used to help less-advanced industries to build a foundation for growth.
Education and workforce development As they seek to grow, manufacturers are facing a series of challenges in building a talent pipeline and maintaining their skills in the face of an aging workforce. At a high-level these challenges include the following:
• An assumption that workforce development is seen as a state responsibility, leading to limited engagement from the business community to address and fund such programs
• A lack of alignment between manufacturers’ business needs, which require training programs that are being constantly updated to reflect technological advances, and educational timelines, in that training programs often take time to develop and in many cases, there are limited resources to provide state-of-the-art training facilities
• Changing demographics, including an aging workforce and reduced pool of replacements to fill attrition needs
• Biases in the education system that may be pushing more students towards college attendance over “hands-on” careers and lower-than-expected interest on the part of students in Science, technology, engineering, and mathematics (STEM) careers

Copyright © 2009 New England Council and Deloitte Development LLC. All rights reserved. 21
Managing talent issues
To address these challenges, businesses, educational leaders, and policy makers will have to take a collaborative and strategic approach toward workforce development. A successful workforce development plan needs to address both operational training needs and strategic goals for workforce and economic development.
Training & Education
Industry Labor Needs
Workforce Development
Economic Development
Operational Strategic
Training and educational challenges are primarily two-fold encompassing both the reluctance of students to enter a profession with a negative image and manufacturers’ needs to attract experienced employees to replace an aging workforce.
For many students entering the workforce — Generation Y — manufacturing is viewed as an unstable industry that does not provide high-reward career opportunities. What Generation Y doesn’t know, is that contrary to their perception, the job of a modern manufacturing employee requires advanced technology and problem-solving skills, and provides opportunities for career flexibility and innovation. Advanced manufacturing jobs are particularly far removed from the old image of manufacturing as dark and dangerous. In addition, there is a growing volume of service-related occupations within manufacturing, including sales, marketing, research and development, customer service, financial, and legal services.
The second component of the training challenge highlights a misalignment between industry needs and the existing talent pipeline. Many of the manufacturers and industry experts who participated in this study mentioned that the highly-skilled, management-level manufacturing staff that many companies need is particularly scarce. Due to the nature of the work and the precision required, all workers new to the manufacturing industry require a certain amount of training and apprenticeship time in order to become fully-operational staff members. Many companies, particularly the smaller manufacturers, often lack the resources needed to train incoming workers. In addition, projected increases in retirements among the so-called “Baby Boomer” generation will leave many manufacturing companies with gaps at their most senior levels of staff.
These circumstances present a significant opportunity for state policymakers, educational leaders, and manufacturers themselves to work together to develop a comprehensive workforce and economic development strategy. For example, state programs should be developed to promote manufacturing careers among students and to work with companies to recruit, train, and maintain highly-skilled and experienced labor. In addition, there is an opportunity to develop better relationships between industry leaders and local educational institutions in the development and provision of management training and internship or apprenticeship programs.
Copyright © 2009 New England Council and Deloitte Development LLC. All rights reserved. 22
Leading practices in education and workforce development
Some examples of collaborative and strategic approaches that have been implemented to facilitate workforce development in manufacturing include:
• Hypertherm Technical Training Institute — Lebanon, NH
− On-site training facility used to provide skills training for new hires and helping current machinists learn the required skills to advance in their profession
• Regional NetWorks (RENEW) — Western MA (Pioneer Valley)
− A network-building initiative around workforce development to raise the profile of manufacturing in the region
• Next Generation Commission — VT
− Created by government leaders to design strategies which integrate and strengthen secondary and postsecondary workforce training programs
State economic development policies Manufacturing is a significant component of the economy in each of the New England states. This reason alone provides incentives for economic development offices to craft policies targeting this industry. However, policymakers, economists, and industry leaders all agreed that existing policies relevant to manufacturing don’t always address industry needs and in many cases are outdated. In particular, they identified the following challenges around state economic development policies:
• Many of the financial incentives currently offered by states were created in the 1950s and are now outdated
• In many instances state agencies or officials are too cautious to promote the innovation needed to drive growth in manufacturing
• Existing policies often taken a passive approach centered around tax credits rather than providing the services many firms, particularly smaller firms, need to modernize operations and build the capacity necessary for innovation
• Industry trends, such as the movement toward multinational firms and away from locally owned and operated companies, have diminished the amount of community involvement and attachment at many firms; consequently, they are less likely to lobby for their interests with state and local governments
• Regulatory issues (e.g., zoning, environmental management, etc.) and the cost of doing business (e.g., utility costs) present a challenge are cited as a challenge in most New England states
• Coordination among states is often politically challenging, making it difficult to build a comprehensive approach to development for industry clusters that cross state lines
Promoting public and private partnerships to address industry needs
Despite these challenges, many states have begun to build partnerships with other public, private, and non-profit entities to foster economic development in manufacturing. A prime example of this partnership is the Manufacturing Extension Partnerships (MEPs) that exist in all New England states. The MEPs are sponsored by the National Institute of Standards and Technology (NIST) and provide business advisory services to manufacturing companies, enabling them to “enhance growth, improve productivity, and expand capacity.5” These organizations have enabled countless small and medium-sized firms in the region to streamline processes, reduce operational costs, and build the capacity for innovation. The partnership approach not only builds
5 Homepage for the Hollings Manufacturing Extension Partnership http://www.mep.nist.gov/

Copyright © 2009 New England Council and Deloitte Development LLC. All rights reserved. 23
opportunities for networking across sectors and service areas, but also spreads the benefits of the policies among many members. In addition, by involving varied stakeholders in the development of policies and strategies to promote growth, this approach incorporates multiple perspectives and taps the expertise of a wider group of experts.
Leading practices
Some examples of the partnership approach to economic development include:
• Manufacturing Extension Partnership Programs
− MA MEP, RIMES, CONNSTEP, ME MEP, NH MEP, VMEC
− Provide business support services to enhance growth, increase productivity, expand capacity, and promote innovation; targeted at small and medium-sized manufacturers
• Connecticut Department of Economic and Community Development (DECD)
− Serves as single point of contact between manufacturers and state support services
− Links quasi-public and public-private service providers (e.g., CERC, CCAT, CII)
• Team New England
− Coordinates business development efforts for all New England states, presenting a united message at trade shows
− Facilitates cross-state partnerships such as the Springfield-Hartford Economic Partnership
• Massachusetts Technology Leadership Council Cluster Program
− “Communities of interest” focusing on issues, opportunities, and emerging technologies in the region grouped by industry, technology, and entrepreneurial characteristics
− Brings industry leaders together to share insights, exchange information, and explore opportunities for growth
• Vermont Center for Emerging Technologies (VCET)
− Provides business incubation services (e.g., office and laboratory space, business consultation, shared office equipment, administrative support, business education, and workshops) for early stage businesses
− Facilitates linkages between emerging technology companies and the University of Vermont
Branding Economic incentives and investments in industry are only part of what is needed to achieve industry growth and entice high-end manufacturers to stay in the region. A focused branding and a fresh marketing campaign are also needed to facilitate this transition. A campaign focused on the opportunities can and will stimulate the industry by transforming perceptions and undermining existing stereotypes. More specifically, the following challenges exist to branding manufacturing both to potential employees and the public at large:
• There is a need to promote “new and advanced manufacturing” among students, their parents, and those in career services
• Schools and colleges must be part of an effort to reframe and resell advanced manufacturing as an appealing and favorable career choice
• An emphasis of seemingly more enticing fields, such as life sciences, often detracts from efforts to promote advanced manufacturing
Copyright © 2009 New England Council and Deloitte Development LLC. All rights reserved. 24
• A lack of understanding of the level of growth opportunity advanced manufacturing presents undermines the level of support for economic development policies targeted at the industry
As industry analysis has shown, the perception of advanced manufacturing as a declining sector in advanced economies is mistaken. Indeed, such defeatism needs to be strongly challenged. Despite the continued vibrancy of the advanced manufacturing sector, it still has an image problem that is constraining its capacity to attract highly educated and talented people.
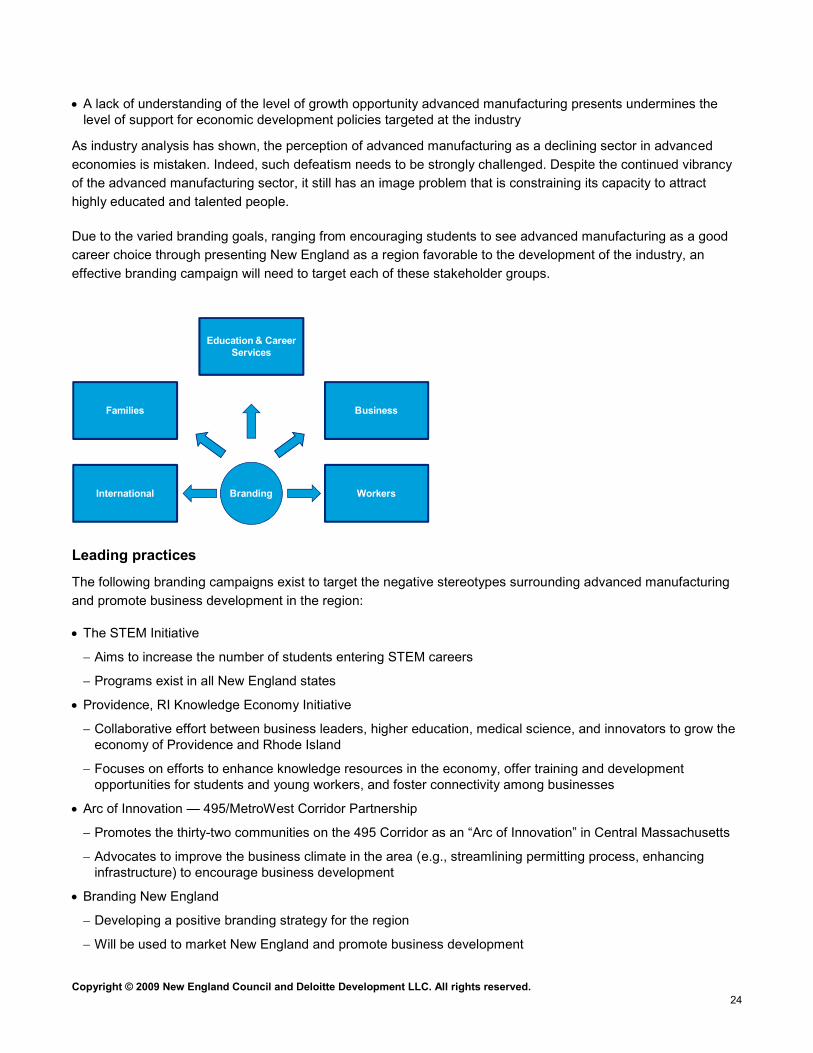
Due to the varied branding goals, ranging from encouraging students to see advanced manufacturing as a good career choice through presenting New England as a region favorable to the development of the industry, an effective branding campaign will need to target each of these stakeholder groups.
Education & Career Services
Families Business
International WorkersBranding
Leading practices
The following branding campaigns exist to target the negative stereotypes surrounding advanced manufacturing and promote business development in the region:
• The STEM Initiative
− Aims to increase the number of students entering STEM careers
− Programs exist in all New England states
• Providence, RI Knowledge Economy Initiative
− Collaborative effort between business leaders, higher education, medical science, and innovators to grow the economy of Providence and Rhode Island
− Focuses on efforts to enhance knowledge resources in the economy, offer training and development opportunities for students and young workers, and foster connectivity among businesses
• Arc of Innovation — 495/MetroWest Corridor Partnership
− Promotes the thirty-two communities on the 495 Corridor as an “Arc of Innovation” in Central Massachusetts
− Advocates to improve the business climate in the area (e.g., streamlining permitting process, enhancing infrastructure) to encourage business development
• Branding New England
− Developing a positive branding strategy for the region
− Will be used to market New England and promote business development

Copyright © 2009 New England Council and Deloitte Development LLC. All rights reserved. 25
− Advocates to improve the business climate in the area (e.g., streamlining permitting process, enhancing infrastructure) to encourage business development
Management practices Particularly in difficult economic times, businesses are driven to make strategic changes in what they do and how they operate as their industries are reshaped by external forces. New competitors and substitute products and services remain ever-present threats. Customers want reduced prices, demanding just-in-time delivery and better service, and can more easily take their business elsewhere if their demands aren’t met. Supply-chains are being ruthlessly streamlined to cut out fat, minimize inventories, and maximize productivity. Product cycles are decreasing — making speed to market and innovation are increasingly the key to success. Meeting these challenges often requires difficult organizational transformations and significant investments of resources and management time. Business leaders have to execute on multiple dimensions, simultaneously.
These leaders must make resource and time investments on a number of fronts simultaneously as illustrated below. Improving productivity and business processes drive lower costs. Design excellence renews the product portfolio using appropriate design-to-cost methods and network collaboration. For most manufacturers, the manufacturing assets are larger, old, slow, and fully depreciated but for advanced manufacturing, assets need to be refreshed and distinctive in performance. Supply chain network management requires great planning and integration skills to take advantage of its total capabilities. All these investments will certainly drive competitiveness; however, to retain and grow employment, significant attention must be paid to developing new product markets and customers. Obviously, to execute the above imperatives is difficult for the larger firms. For the tier two and tier three suppliers, small service providers, and other smaller firms, it would be impossible to execute superbly without sharing learning, leveraging best practices, and partnering to share investments and capabilities. Management must develop new trust models within the network that can protect intellectual property but spur collaboration.
Multiple investment requirements in advanced manufacturing
Investment drives
Workforce productivity
Process excellence
Design excellence
New products, new customers
Supply chain network
Manufacturing technology
distinctiveness
Sustainable growth
High cumulative throughputQuick response/flexibility
Low first product costAccelerated capital investment (CI)
Low total cost

Copyright © 2009 New England Council and Deloitte Development LLC. All rights reserved. 26
During our interviews of smaller firms, several management challenges were surfaced:
• Small-and medium-sized firms don’t have the depth of management to preempt major business issues or to move from small to mid-size or mid-size to large companies
• Cost of capital still high for smaller but highly entrepreneurial firms — debt restructuring, R&D, and growth and working capital financing remain significant barriers; tax credits are not often helpful for small firms
• Parts of New England are known for having some of the highest structural costs — energy, housing, and health care
• Businesses want to be part of a network but need examples of how to build relationships and need OEMs and tier one companies to help develop their capabilities
• Limited capital equipment investments, technology access, and development funding often constrains productivity increases, innovation capacity, and economic growth
• Infrastructure issues remain — some areas don’t have the broadband necessary for collaboration, lack the transportation required for fast, responsive movements of goods and services, and need urban renewal to enhance the working environment in legacy general manufacturing areas

Copyright © 2009 New England Council and Deloitte Development LLC. All rights reserved. 27
Emerging recommendations
Advanced manufacturing has reversed the decline associated with traditional manufacturing in spite of significant challenges. In New England there is a concentration of capabilities in several industry sub-sectors that double the national average. Productivity improvements have not been incremental but have been transformational. The value of shipments has exceeded or met the national average in all but one state. Most importantly, the cluster of talent and capabilities surrounding advance manufacturing has the depth, breadth, and degree of connectivity that few regions could replicate.
On the other hand there a significant challenges and barriers that have been inhibiting further growth and a real takeoff in employment opportunities. They include workforce development, state economic policy development, and branding.
However, by taking advantage of the existing innovative networks and their introduction to new services across the network participants, a new way to introduce value-add services can be constructed. Rather than one-on-one introductions, there can be many on many interactions (non-linear approach). Perhaps the best description is a “reconnaissance in force” — industry network meets a cluster of workforce, economic stimulants, and best management practices: the best firms being augmented by the best service providers.
In summary, by lowering the barriers to growth and by providing effective service support we can expect employment growth in advanced manufacturing to reach 7,500 to 8,500 new jobs annually. Looking back to recent history, we have seen that type of growth (actually higher) in the period 2004–6 (p.10) with a simultaneous jump in productivity or output per worker. This was done without support or addressing the barriers. With determined action by all parties — business, education, government, that type of growth could be sustained. Additionally, these jobs are wealth-creating. Total compensation could range from $75,000 to $85,000, a much higher wage structure than in most other industries. However, developing the pool of skilled workers remains a critical first step as just prior to the economic downturn there were approximately 4,000 vacancies that were never filled.
Copyright © 2009 New England Council and Deloitte Development LLC. All rights reserved. 28
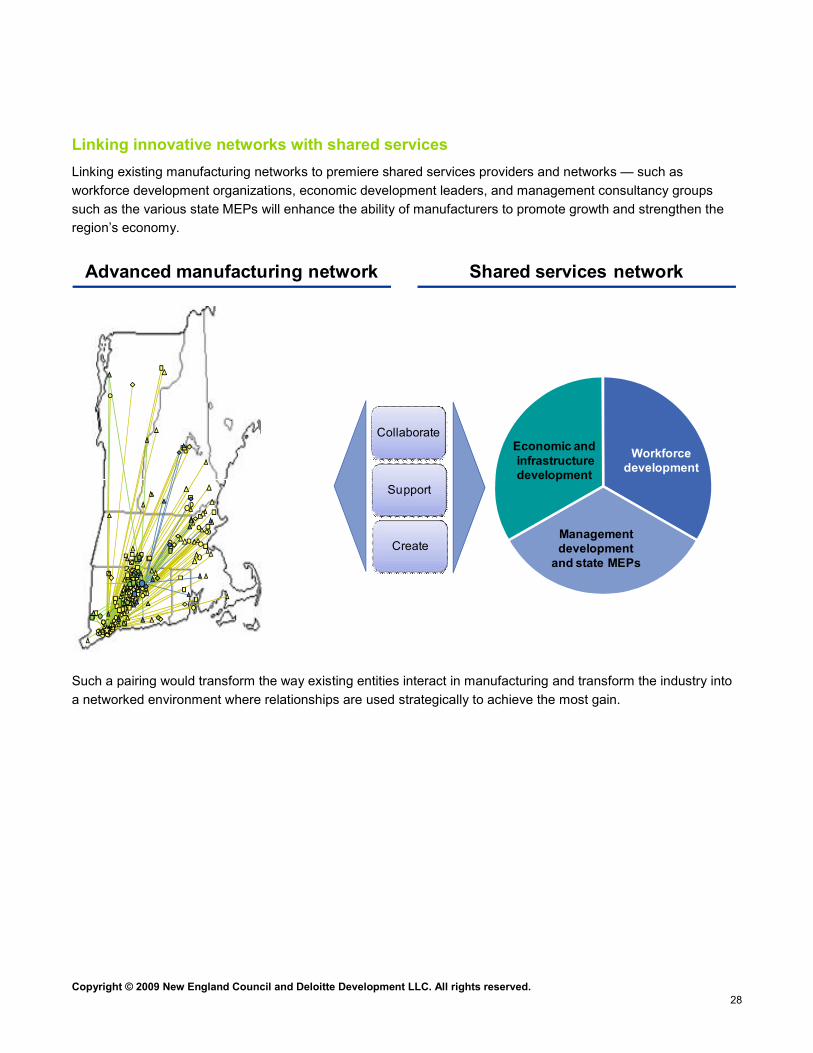
Linking innovative networks with shared services Linking existing manufacturing networks to premiere shared services providers and networks — such as workforce development organizations, economic development leaders, and management consultancy groups such as the various state MEPs will enhance the ability of manufacturers to promote growth and strengthen the region’s economy.
Economic andinfrastructuredevelopment
Managementdevelopment
and state MEPs
Workforcedevelopment
Advanced manufacturing network Shared services network
Create
Support
Collaborate
3 8
8 7
2 2 0
2 3 4
1 8 0
2 5 3
1 7 7
1 1 0
1 2 3
2 1 7
1 8 6
1 9 4
1 9 31 9 0
1 1 8
1 4 1
1 4 8
2 2 45 5
2 3 8
1 0 9
3 9
1 5 4
1 8 5
2 0 8
1 9 5
8 9
1 3 21 2 9
2 4 4
6 1
2 3 1
2 2 6
1 2 8
1 1 6
6
1 4 9
1 7 6
1 3 1
1 6 6
2 4 8
1 9 9
1 8 2
1 5 8
1 9
2 6
4 7
6 6
2 4 0
2 3 9
6 4
1 2 7
1 3 3
5 2
2 2 5
4 0
3 5
4 4
1 4 41 2 5
3 2
5 3
1 8 4
2 2 11 2 1
2 1 4
2 4 1
1 4 0
2 0
7 7
9 1
8 42 3 7
1 6 5
7 8
2 4 9
2 2 7
8 2
1 8 8
1 0 1
1 1 1
1 1 3
1 1 43 0
5 9
4 3
7 1
8 5
2 4 3
1 6 2
1 7 2
1 7 9
6 9
5 7
1 0 4
1 3 0
2 1 2
1 3 4
4 8
2 5 1
1 9 6
1 4 5
1 5 6
1 0 0
1 4 7
2 2 8
1 0 3
1 5 7
1 2 2
2 2
1 6 9
2 1 9
2 5 2
2 5 0
1 0 2
2 4 2
1 2 4 1 8 1
2 1
3 3
7 3
1 82 0 5
2 3
7 9
1 3 6
1 7
1 7 31 7
1 9 1
1 9 8
2 0 4
1 6 3
1 5 5
1 3 7
1 6 0
6 0
2 0 3
2 4
2 0
72 2 4
2 0 2
1 0
7 2
1 5 3
1 0 5
1 6 1
1 7 4
2 3 2
9 7
8
9 6
1 7 0
1 7 5
2 4 6
3 6
2 4 7
1 5 1
2 2 3
1
7 0
9 5
9 8
2 0 1
1 6 4
1 8 3
9 92
4 6
5
5 8
1 3
4 5
5 0
8 1
1 5
1 6
4 9
9 2
2 0 0
2 1 3
1 6 8
1 4 61 8 9
5 46 7
2 2 6
2 3 6
1 4 2
1 1 7
1 2 6
1 3 8
1 1 9
1 5 0
1 0 8
1 5 2
1 0 6
2 0 9
6 8
1 0 7
1 2 9
2 9
6 3
8 8
7 5
2 8
2 5
6 5
1 1 2
1 2 0
2 1 6
2 1 0
2 5 5
8 0
2 1 1
3 1
1 7 8
2 3 3 1 9 2
2 1 8
2 3 5
1 6 7
9
3 7
7 6
4 1
6 2
3 4
1 5 9
1 1 5
1 3 5
3
1 4
4
7 4
4 2
2 4 5
1 2
2 3 0
2 5 42 0 6
8 6
1 4 3
9 4
1 12 2 2
9 07
5 6
2 1 5
1 9 7
9 31 8 7
8 3
1 6 6
Such a pairing would transform the way existing entities interact in manufacturing and transform the industry into a networked environment where relationships are used strategically to achieve the most gain.

Copyright © 2009 New England Council and Deloitte Development LLC. All rights reserved. 29
The table below compares the current role of entities that interact with the manufacturing industry to their potential role in a networked system.
Entity Current role Potential networked role
State economic development agencies • Tax incentives• Regulatory compliance• New business generation
• Single point of contact• Strategic planning• Technical guidance• Set focus areas for public sector
investment – targeted and prioritized• Define inclusive education agenda• Support network efficiency
Public / non-profit / private industry groups and associations
• Business guidance• Economic research
• Strategic planning • Leading practices• Government advocacy• New network initiatives
Educational institutions • Education and training• Research / Innovation
• Workforce planning / development• Partnership development• Educational program alignment
Manufacturers • Invest, innovate, produce, sell • Drive investments and link them more closely to network opportunities
• Coordinate shared resource planning through strong, cooperative leadership
The value proposition of the innovation network
The innovation network presents a framework to target these varied needs by presenting at least three interrelated opportunities: broader services, integrated regional services, and more integrated services.
Broader services
Change always creates new service opportunities. Looking through a wider lens reveals opportunities that have minimal direct connection to “pure” manufacturing: but nevertheless neatly complement the industry. Back office functions, joint R&D, sharing outside service providers, logistics, and transportation are examples of services that can be aggregated across networks for effectiveness. Together, these service opportunities combine to create a more complete and valuable offering, lower costs, and higher service levels.
Integrated regional services
The value proposition of integrating services across a network means that New England would be best served by state collaboration. Competing as a region rather than as individual states would make for interesting politics. But regional matters and pooling, and the integration of economic development efforts would raise the game.
Copyright © 2009 New England Council and Deloitte Development LLC. All rights reserved. 30
Extended networks
In an extended enterprise, the boundaries between separate entities blur. The participating entities often share systems and information and may even be co-located — for example, a strategic supplier may have a permanent presence at the customer’s site. Innovation networks facilitate the development of such partnerships allowing entities in a value chain to build a seamless relationship, reducing costs and increasing productivity
Next Steps — Building a platform for economic growth The following list of recommendations provides a starting point for specific actions for public, private and educational stakeholders.
Short-term recommendations 1. Ensure the New England manufacturing industry plays an active role in supporting projects that receive
funding under the American Recovery and Reinvestment Act — providing key support for targeted and specific infrastructure investments
2. Develop position paper and actively communicate value proposition of the advanced manufacturing sector to ensure its inclusion in the industry sector areas of focus areas within state economic development plans
3. Create an inventory of advanced manufacturers in each state — building on existing studies and research
4. Activate a branding campaign focused on parents, students, and teachers to highlight success stories
5. Identify and leverage the best, most highly effective service providers
6. Use industry cluster analysis to determine overlap and synergies in order to facilitate partnership-building efforts
7. Pilot a case study focused on one sub-region or state — For example, Rhode Island would be a strong choice for a innovation network pilot study due to the existing networks in the state and its relatively small size, which would allow for scalability and transferability of programs within its geographic boundaries and beyond.
Medium Term Recommendations 1. Enhance industry relationships — Ensure “support and shared networks” are enhanced — create a forum for
joint industry and shared service providers to develop strategic relationships.
2. Establish a New England forum for Advanced Manufacturing — Develop guiding charter which focuses on innovation, collaboration, and job creation. Establish a branding message that addresses workforce, industry, and policy needs
3. Build a virtual “one-stop shop” system — Provide shared services including workforce, economic, and management development programs; pilot small and focused programs to be used as a stepping stone for flexible and sustainable programs
4. Hunt in packs — Develop and implement strategic plans for cross-state partnership centered on industry cluster locations — leverage and learn from existing efforts such as Team New England
5. Measure, manage, and be transparent — Develop and implement a framework for measuring success that focuses on value created, efficiency, effectiveness, and quality of innovation — i.e., measurement criteria that include job numbers but also account for other sustainable economic benefits

Copyright © 2009 New England Council and Deloitte Development LLC. All rights reserved. 31
Implementation — immediate action steps To capitalize on the opportunities presented a number of actions must be taken now.
It is no longer acceptable to waver, hesitate, or debate whether there is a future for advanced manufacturing in New England. Throughout this study we have been fortunate to meet with over 150 interested stakeholders. Their overwhelming response has been that there is indeed a future, and a bright one at that, for advanced manufacturing.
The following seven action steps will move the region closer to that bright future:
1. Follow a specific plan — use actionable recommendations
− Use existing mechanisms (e.g., New England Council) to communicate the initial plan and facilitate links between constituencies
− Leverage leaders — include them in pilot studies and focus on getting commitment for targeted funding to strengthen partnerships and networks
2. “Advanced Manufacturing — growth through Innovation Networks”
− Communicate plan to a wider audiences of policy makers, educational institutions, and industry leaders
− Generate stakeholder buy-in for identified strategies
− Develop coordinated plan to implement strategies
3. Leverage successful service providers and introduce them to the networks
− Build a leadership network of workforce development leaders
− Facilitate innovation partnerships among supply chain members
− Use existing shared networks and develop models for new targeted investments
4. Raise level of awareness of the current and future role of advanced manufacturing
− Publicize industry’s contributions to state and regional economies
− Highlight success stories (i.e., companies and programs that are thriving and contributing positively to in the region and advanced manufacturing)
5. Fix the brand — define the branding opportunity
− Develop a media strategy to raise awareness of industry successes
− Develop internship/externship programs for students and teachers to experience “new” manufacturing
6. Define the opportunity
− Define and describe tangible action plans and outcomes
− Market the opportunity — “An industry of opportunities”
7. Act now — provide for the future
− The economic crisis will enable a recalibration of focus
− There is scope for optimism — focus on positives
− Address the skeptics, be honest but don’t underestimate the opportunity
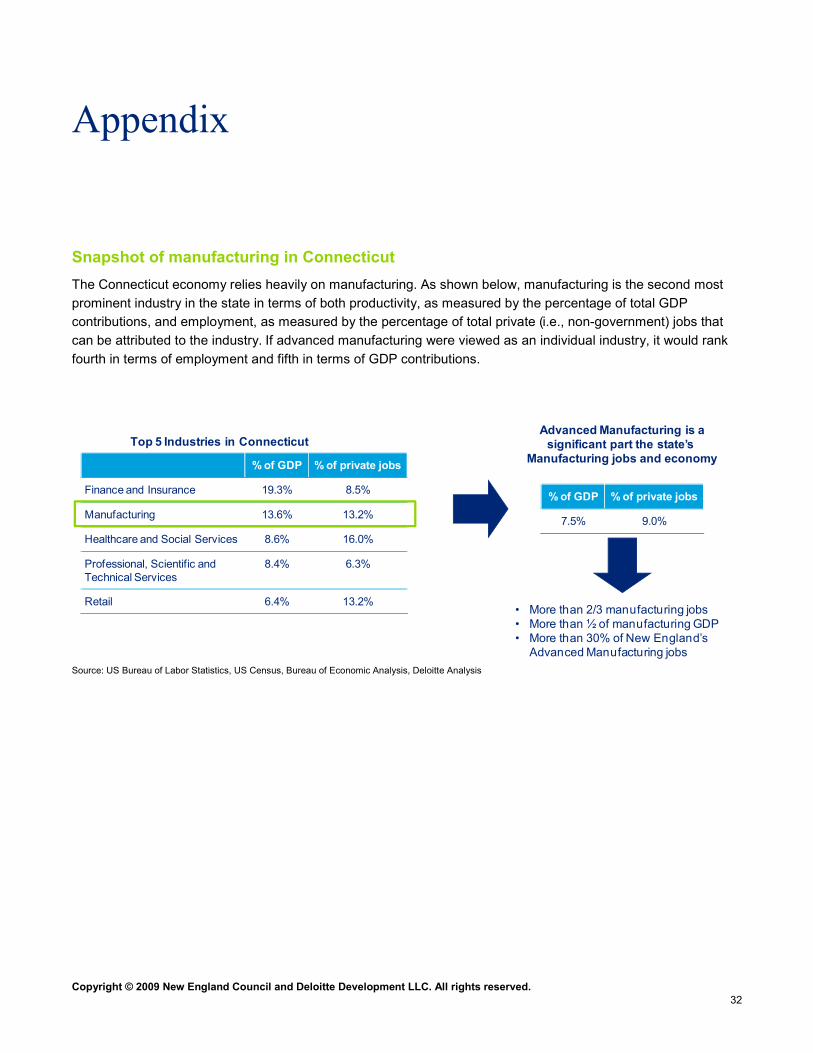
Copyright © 2009 New England Council and Deloitte Development LLC. All rights reserved. 32
Appendix
Snapshot of manufacturing in Connecticut The Connecticut economy relies heavily on manufacturing. As shown below, manufacturing is the second most prominent industry in the state in terms of both productivity, as measured by the percentage of total GDP contributions, and employment, as measured by the percentage of total private (i.e., non-government) jobs that can be attributed to the industry. If advanced manufacturing were viewed as an individual industry, it would rank fourth in terms of employment and fifth in terms of GDP contributions.
% of GDP % of private jobs
Finance and Insurance 19.3% 8.5%
Manufacturing 13.6% 13.2%
Healthcare and Social Services 8.6% 16.0%
Professional, Scientific and Technical Services
8.4% 6.3%
Retail 6.4% 13.2%
% of GDP % of private jobs
7.5% 9.0%
Top 5 Industries in ConnecticutAdvanced Manufacturing is a
significant part the state’s Manufacturing jobs and economy
• More than 2/3 manufacturing jobs• More than ½ of manufacturing GDP• More than 30% of New England’s
Advanced Manufacturing jobs Source: US Bureau of Labor Statistics, US Census, Bureau of Economic Analysis, Deloitte Analysis

Copyright © 2009 New England Council and Deloitte Development LLC. All rights reserved. 33
As seen in the map below, manufacturing employment is prominent in all Connecticut counties with particularly significant (i.e., greater than 20%) in Litchfield and Windham Counties. In addition, advanced manufacturing accounts for over 65% of all manufacturing jobs in six of the state’s eight counties.
77%
69%
70%
81%
80%
17%
65% 41%
Connecticut ProfilePopulation 3.5 million
Total Jobs 1.7 million
Total Manufacturing jobs 190,800
Total Advanced Manufacturing Jobs 130,552
•Percentage of County’s Manufacturing Jobs that are classif ied as Advanced
Source: US Bureau of Labor Statistics, US Census, Bureau of Economic Analysis, Deloitte Analysis

Copyright © 2009 New England Council and Deloitte Development LLC. All rights reserved. 34
Snapshot of manufacturing in Maine Manufacturing plays a significant role in Maine’s economy, contributing the largest percentage of GDP and ranking third in terms of employment, for all non-government industries in the state. Advanced manufacturing subsectors account for a significant portion of this activity, including nearly half of all manufacturing GDP and nearly ¼ of all manufacturing jobs.
% of GDP % of private jobs
Manufacturing 12.8% 11.7%
Healthcare and Social Services 12.7% 19.2%
Retail 10.6% 17.4%
Finance and Insurance 8.0% 5.2%
Construction 6.2% 6.1%
% of GDP % of private jobs
5.3% 2.8%
Top 5 Industries in MaineAdvanced Manufacturing is a
significant part the state’s Manufacturing jobs and economy
• Almost ¼ of all manufacturing jobs• Almost ½ of manufacturing GDP• More than 5% of state’s total GDP
Source: US Bureau of Labor Statistics, US Census, Bureau of Economic Analysis, Deloitte Analysis
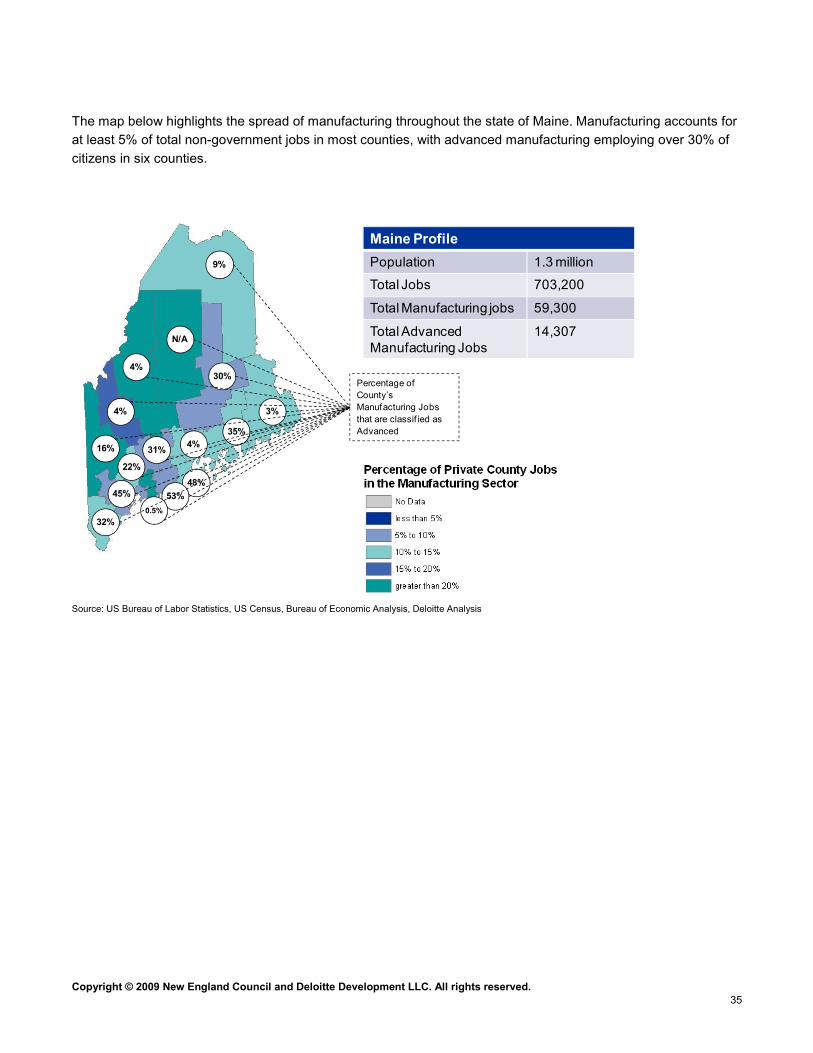
Copyright © 2009 New England Council and Deloitte Development LLC. All rights reserved. 35
The map below highlights the spread of manufacturing throughout the state of Maine. Manufacturing accounts for at least 5% of total non-government jobs in most counties, with advanced manufacturing employing over 30% of citizens in six counties.
9%
4%
N/A
3%
22%
45%
4%
31%
48%53%
16%
32%
30%
0.5%
4%35%
Maine ProfilePopulation 1.3 million
Total Jobs 703,200
Total Manufacturing jobs 59,300
Total Advanced Manufacturing Jobs
14,307
Percentage of County’s Manufacturing Jobs that are classif ied as Advanced
Source: US Bureau of Labor Statistics, US Census, Bureau of Economic Analysis, Deloitte Analysis

Copyright © 2009 New England Council and Deloitte Development LLC. All rights reserved. 36
Snapshot of manufacturing in Massachusetts Manufacturing is also a dominant industry in Massachusetts. The industry contributes the most of any industry to state GDP and employs nearly 10% of all non-government employees. Of those contributions, advanced subsectors account for 75% of GDP and 60% of jobs. On its own, advanced manufacturing would be the fifth most prominent industry in the state based on GDP contributions.
% of GDP % of private jobs
Manufacturing 13.2% 9.9%
Professional Scientific, and Technical Services
12.4% 8.3%
Finance and Insurance 11.8% 6.1%
Healthcare and Social Services 10.1% 15.6%
Retail 5.8% 11.7%
% of GDP % of private jobs
9.6% 6.1%
Top 5 Industries in MassachusettsAdvanced Manufacturing is a
significant part the state’s Manufacturing jobs and economy
• Nearly 60% of manufacturing jobs• Nearly ¾ of manufacturing GDP• More than 40% of New England’s
Advance Manufacturing jobs Source: US Bureau of Labor Statistics, US Census, Bureau of Economic Analysis, Deloitte Analysis

Copyright © 2009 New England Council and Deloitte Development LLC. All rights reserved. 37
The map below shows that as a percentage of total county jobs, manufacturing is fairly evenly distributed throughout the Commonwealth with most counties employing between 5% and 20% in the industry. In addition, advanced manufacturing accounts for over half of all manufacturing jobs in six counties.
37%
36%
48%
N/A
N/A
69%
59%
8%
51%
73%
66%
46%
34%
61%
Massachusetts ProfilePopulation 6.4 million
Total Jobs 3.4 million
Total Manufacturing jobs 295,200
Total Advanced Manufacturing Jobs 171,250
Percentage of County’s Manufacturing Jobs that are classif ied as Advanced
Source: US Bureau of Labor Statistics, US Census, Bureau of Economic Analysis, Deloitte Analysis
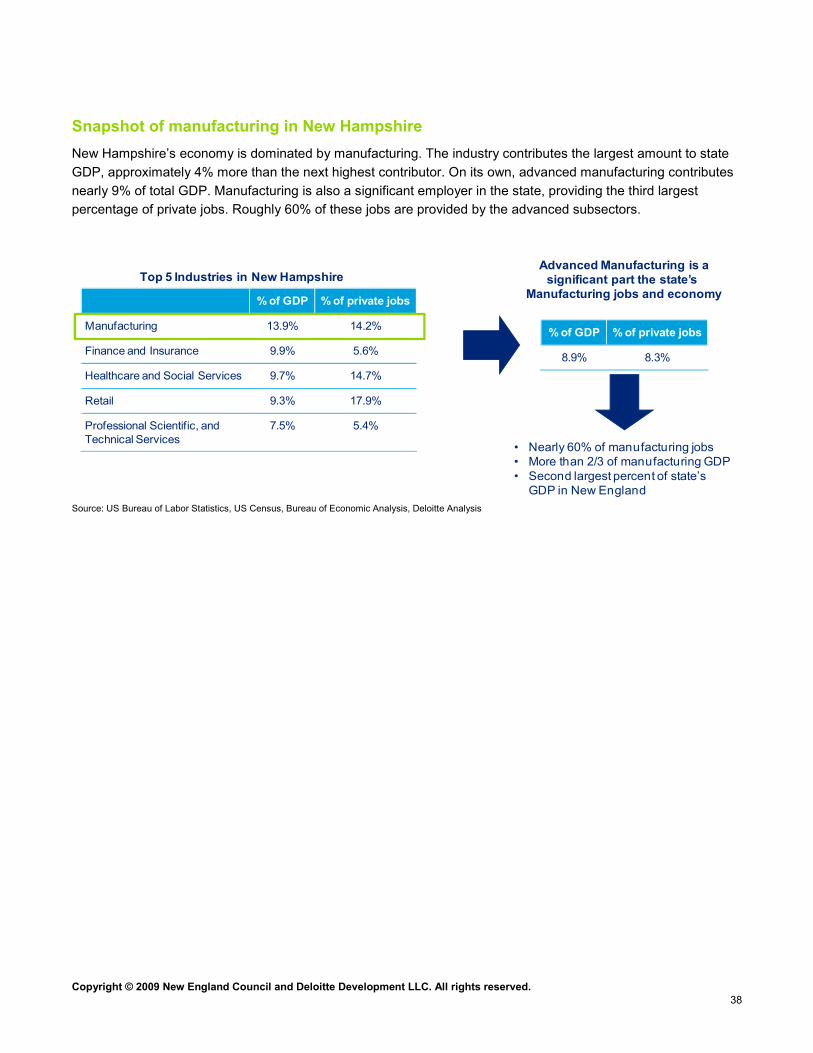
Copyright © 2009 New England Council and Deloitte Development LLC. All rights reserved. 38
Snapshot of manufacturing in New Hampshire New Hampshire’s economy is dominated by manufacturing. The industry contributes the largest amount to state GDP, approximately 4% more than the next highest contributor. On its own, advanced manufacturing contributes nearly 9% of total GDP. Manufacturing is also a significant employer in the state, providing the third largest percentage of private jobs. Roughly 60% of these jobs are provided by the advanced subsectors.
% of GDP % of private jobs
Manufacturing 13.9% 14.2%
Finance and Insurance 9.9% 5.6%
Healthcare and Social Services 9.7% 14.7%
Retail 9.3% 17.9%
Professional Scientific, and Technical Services
7.5% 5.4%
% of GDP % of private jobs
8.9% 8.3%
Top 5 Industries in New HampshireAdvanced Manufacturing is a
significant part the state’s Manufacturing jobs and economy
• Nearly 60% of manufacturing jobs• More than 2/3 of manufacturing GDP• Second largest percent of state’s
GDP in New England Source: US Bureau of Labor Statistics, US Census, Bureau of Economic Analysis, Deloitte Analysis

Copyright © 2009 New England Council and Deloitte Development LLC. All rights reserved. 39
The map below highlights the fact that for the most part, manufacturing employment as a percentage of total county employment, is evenly distributed throughout the state. As would be expected, southern counties have a higher concentration of manufacturing jobs. Advanced manufacturing accounts for more than 50% of manufacturing jobs in six of the ten counties.
New Hampshire ProfilePopulation 1.3 million
Total Jobs 648,900
Total Manufacturing jobs 77,600
Total Advanced Manufacturing Jobs
45,463
75%
23%
60%
4%
64%
78%
38%
63%
73%
54%
Percentage of County’s Manufacturing Jobs that are classif ied as Advanced
Source: US Bureau of Labor Statistics, US Census, Bureau of Economic Analysis, Deloitte Analysis
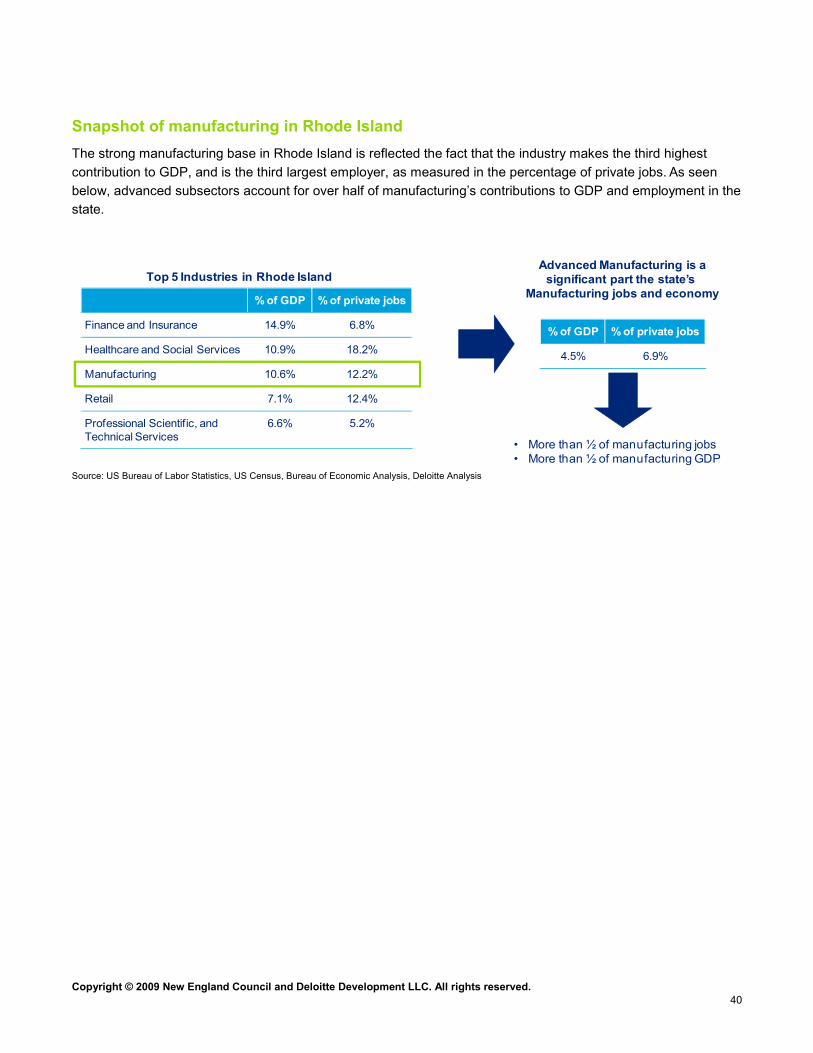
Copyright © 2009 New England Council and Deloitte Development LLC. All rights reserved. 40
Snapshot of manufacturing in Rhode Island The strong manufacturing base in Rhode Island is reflected the fact that the industry makes the third highest contribution to GDP, and is the third largest employer, as measured in the percentage of private jobs. As seen below, advanced subsectors account for over half of manufacturing’s contributions to GDP and employment in the state.
% of GDP % of private jobs
Finance and Insurance 14.9% 6.8%
Healthcare and Social Services 10.9% 18.2%
Manufacturing 10.6% 12.2%
Retail 7.1% 12.4%
Professional Scientific, and Technical Services
6.6% 5.2%
% of GDP % of private jobs
4.5% 6.9%
Top 5 Industries in Rhode IslandAdvanced Manufacturing is a
significant part the state’s Manufacturing jobs and economy
• More than ½ of manufacturing jobs• More than ½ of manufacturing GDP
Source: US Bureau of Labor Statistics, US Census, Bureau of Economic Analysis, Deloitte Analysis

Copyright © 2009 New England Council and Deloitte Development LLC. All rights reserved. 41
As seen in the map below, manufacturing jobs are evenly distributed throughout Rhode Island, with advanced manufacturing accounting for over half of all manufacturing employment in four of the five counties.
Rhode Island ProfilePopulation 1.1 million
Total Jobs 493,000
Total Manufacturing jobs 50,900
Total Advanced Manufacturing Jobs
28,703
51%
50%
86%
61%
34%
Percentage of County’s Manufacturing Jobs that are classif ied as Advanced
Source: US Bureau of Labor Statistics, US Census, Bureau of Economic Analysis, Deloitte Analysis

Copyright © 2009 New England Council and Deloitte Development LLC. All rights reserved. 42
Snapshot of manufacturing in Vermont Manufacturing is the leading contributor to Vermont’s GDP and the third largest industry in terms of private employment. If advanced manufacturing were viewed as a single industry, it would be the second largest contributor to state GDP, second only to manufacturing in general.
% of GDP % of private jobs
Manufacturing 16.0% 14.3%
Healthcare and Social Services 10.9% 17.5%
Retails 9.4% 15.9%
Finance and Insurance 6.7% 3.9%
Professional Scientific, and Technical Services
6.7% 5.2%
% of GDP % of private jobs
11.0% 4.8%
Top 5 Industries in VermontAdvanced Manufacturing is a
significant part the state’s Manufacturing jobs and economy
• More than 1/3 of manufacturing jobs• More than 2/3 of manufacturing GDP
Source: US Bureau of Labor Statistics, US Census, Bureau of Economic Analysis, Deloitte Analysis

Copyright © 2009 New England Council and Deloitte Development LLC. All rights reserved. 43
As with the other New England states, manufacturing is well-represented in most of Vermont’s counties, with advanced manufacturing making up a significant portion of total manufacturing employment in Chittenden and Windsor counties.
Vermont ProfilePopulation 607,100
Total Jobs 307,800
Total Manufacturing jobs 35,900
Total Advanced Manufacturing Jobs
1,96046%
33%
33%76%
0%7%0%
2%
18%
0%
16%
10%
28%
54%
Percentage of County’s Manufacturing Jobs that are classif ied as Advanced
Source: US Bureau of Labor Statistics, US Census, Bureau of Economic Analysis, Deloitte Analysis

About Deloitte Deloitte refers to one or more of Deloitte Touche Tohmatsu, a Swiss Verein, and its network of member firms, each of which is a legally separate and independent entity. Please see www.deloitte.com/about for a detailed description of the legal structure of Deloitte Touche Tohmatsu and its member firms. Please see www.deloitte.com/us/about for a detailed description of the legal structure of Deloitte LLP and its subsidiaries. Copyright © 2009 Deloitte Development LLC. All rights reserved. Member of Deloitte Touche Tohmatsu