reference manual on the iaea jrq correlation monitor … correlation monitor steel for irradiation...
TRANSCRIPT

IAEA-TECDOC-1230
Reference manual on the IAEA JRQ correlation monitor steel
for irradiation damage studies
July 2001

The originating Section of this publication in the IAEA was:
Nuclear Power Engineering Section International Atomic Energy Agency
Wagramer Strasse 5 P.O. Box 100
A-1400 Vienna, Austria
REFERENCE MANUAL ON THE IAEA JRQ CORRELATION MONITOR STEEL FOR IRRADIATION DAMAGE STUDIES
IAEA, VIENNA, 2001 IAEA-TECDOC-1230
ISSN 1011–4289
© IAEA, 2001
Printed by the IAEA in Austria July 2001

FOREWORD
The reactor pressure vessel (RPV) is a key component in most nuclear power plants (NPPs) and since it is usually considered to be impossible to replace, its operating life can therefore determine the lifetime of the NPPs. It is therefore necessary to understand those mechanisms which affect the mechanical properties of the component in order to be able both to follow the current status and to predict the remaining lifetime.
One of the major mechanisms affecting the RPV material properties is radiation embrittlement due to the exposure of the RPV and its welds to neutron irradiation.
Information on irradiation effects on the mechanical properties of RPV steels is usually gained from research and surveillance programmes using fluence normalizing features taking also into account the neutron energy spectrum.
The effect of irradiation on the mechanical properties can be followed by irradiation of specimens taken from representative archive samples of an operational RPV (or research samples or candidate materials for future RPVs) under representative neutron fluences and irradiation temperatures.
The uncertainties resulting from calibration of fluence could be lessened by the use in the surveillance programmes of a ‘standard’ reference material, i.e. material which has a ‘known’ response in terms of its change of mechanical properties to neutron irradiation. A well characterized reference material may be used to provide a correlation between different irradiation rigs, material test reactors and power reactors. A standard reference material is generally included in irradiation capsule loadings in power reactors to aid in the interpretation of the results.
The IAEA has carried out a number of projects dealing with studies of RPV steel behaviour under neutron irradiation. At the very early stage of those studies it was recommended that the use of a ‘reference steel’ should be encouraged for a reliable comparison of results obtained during the studies.
This TECDOC serves as an initial description of such a reference steel, designated as ‘JRQ’, introduced by the IAEA in the Co-ordinated Research Project on “Optimizing Reactor Pressure Vessel Surveillance Programmes and their Analysis”, which began in 1983. The use of JRQ material has since then been internationally recognized and explored by a number of Member States. This report represents a reference collection of available material properties for the JRQ material to aid in its use for both experimental and surveillance programmes.
The main contributor to the drafting of this TECDOC was M. Brumovsky and his work is greatly appreciated. The IAEA officer responsible for the preparation of the report was V. Lyssakov of the Division of Nuclear Power.

EDITORIAL NOTE
The use of particular designations of countries or territories does not imply any judgement by the publisher, the IAEA, as to the legal status of such countries or territories, of their authorities and institutions or of the delimitation of their boundaries.
The mention of names of specific companies or products (whether or not indicated as registered) does not imply any intention to infringe proprietary rights, nor should it be construed as an endorsement or recommendation on the part of the IAEA.

CONTENTS
1. INTRODUCTION...................................................................................................................1
1.1. Objective.....................................................................................................................1 1.2. Background.................................................................................................................1 1.3. Structure of the report.................................................................................................1
2. MANUFACTURING PROCESS ...........................................................................................1
3. CUTTING SCHEME OF TEST PLATES..............................................................................2
4. ACCEPTANCE TEST RESULTS .........................................................................................5
4.1. Chemical composition ................................................................................................5 4.2. Mechanical properties.................................................................................................5 4.3. Microstructure ............................................................................................................7 4.4. Evaluation of acceptance tests ....................................................................................7
5. RESULTS FROM THE IAEA CO-ORDINATED RESEARCH PROJECTS........................................................................................................................8
5.1. Chemical composition ................................................................................................8 5.2. Tensile properties .....................................................................................................14 5.3. Impact properties ......................................................................................................18 5.4. Fracture properties ....................................................................................................24
6. CONCLUSION AND RECOMMENDATIONS..................................................................27
REFERENCES .........................................................................................................................28
CONTRIBUTORS TO DRAFTING AND REVIEW ..............................................................29


1
1. INTRODUCTION
1.1. Objective
The objective of this report is to provide information on the mechanical properties of the ASTM A533 grade B class 1 steel that was designated as ‘JRQ reference steel’ and for many years served as a radiation/mechanical property correlation monitor in a number of international and national studies of irradiation embrittlement of reactor pressure vessel steel. This report provides the most comprehensive listing of material test data obtained on the JRQ manufacturing history and material properties in the initial, and as delivered condition during the implementation of two IAEA co-ordinated research projects (CRPs) on behaviour of reactor pressure vessel steels under neutron irradiation.
1.2. Background
After completion of the two initial CRPs, the IAEA initiated the Co-ordinated Research Project on “Optimizing Reactor Pressure Vessel Surveillance Programmes and their Analysis” (CRP-3) with the aim of obtaining useful data on neutron irradiation embrittlement. For this purpose the IAEA requested Japanese steelmakers to provide materials of plates, forgings and welded joints. This request was strongly supported by the Atomic Energy Research Committee of Japan Welding Engineering Society and accepted by major Japanese steelmakers, resulting in the provision of 18 types of laboratory heats and steels for the study.
Among these, a large sample of 25 t of steel with sensitivity to neutron irradiation, later designated by the code JRQ, was provided by the Kawasaki Steel Corporation [1].
This report describes the manufacturing history and properties of JRQ plates in the unirradiated, as delivered conditions as they were received by the IAEA for use in the IAEA Co-ordinated Research Projects on “Optimizing Reactor Pressure Vessel Surveillance Programmes and their Analysis” (CRP-3) and “Assuring Structural Integrity of Reactor Pressure Vessels” (CRP-4).
1.3. Structure of the report
A description of the manufacturing history and overview of material preparation for testing, subsequent acceptance testing results, and results obtained during the Co-ordinated Research Projects are given in Sections 2–5. Section 6 gives conclusions and recommendations for further use of this reference material.
2. MANUFACTURING PROCESS
Table 2.1 shows the scheme of the manufacturing process of the plates. The steel was produced by the BOF-LRF process. After rolling, the plates were heat treated normalizing at 900oC, quenching from 880oC and tempering at 665oC for 12 hours, then stress relieving at 620oC for 40 hours.

2
TABLE 2.1. SCHEME OF MANUFACTURING PROCESS
Process Manufacturing condition
Primary refining
Degassing and final refining
Pouring
Slabbing
Annealing
Reheating
Plate rolling
NDE
Heat treatment
NDE
Flame cutting
Acceptance testing
180 t BOF
Ladle refining furnace (ASEA-SKF Process)
Bottom pouring, big end up ingot
Dimensions (mm):
2 slabs – 340 × 2300 × 3430
Batch type reheating furnace: 1200oC
Dimensions (mm):
2 plates – 225 × 2500 × 3000
Ultrasonic tests (straight beam method)
Normalising: 900oC
Quenching: 880oC
Tempering: 665oC – 12 h
Stress relief: 620oC – 40 h
Ultrasonic tests (straight beam method)
Each plate was gas-cut into 6 pieces (225 mm × 1000 mm × 1000 mm) and tests pieces
Chemical composition
Tensile test
Charpy impact test
Drop weight test
Hardness distribution
Sulphur print and macrostructure
Microstructure
3. CUTTING SCHEME OF TEST PLATES
Each plate (dimensions: 2000 mm × 3000 mm × 225 mm) was cut into test blocks with the dimensions 1000 mm × 1000 mm × 225 mm and sent to the Paul Scherrer Institute, Switzerland, where they were stored — see Table 3.1. One test block, 3JRQ made from Plate A, was cut into small test blocks with the dimensions of 150 mm × 150 mm × 225 mm and distributed to participants of CRP-3.

3
TABLE. 3.1. CUTTING DIAGRAM OF PLATES INTO TEST PLATES WITH DIMENSIONS 1 m × 1 m (PLATE A)
PLATE A
1JRQ
2JRQ 3JRQ
2000 4JRQ
5JRQ 6JRQ
3000
PLATE B
7JRQ
8JRQ 9JRQ
2000 10JRQ
11JRQ 12JRQ
3000
4
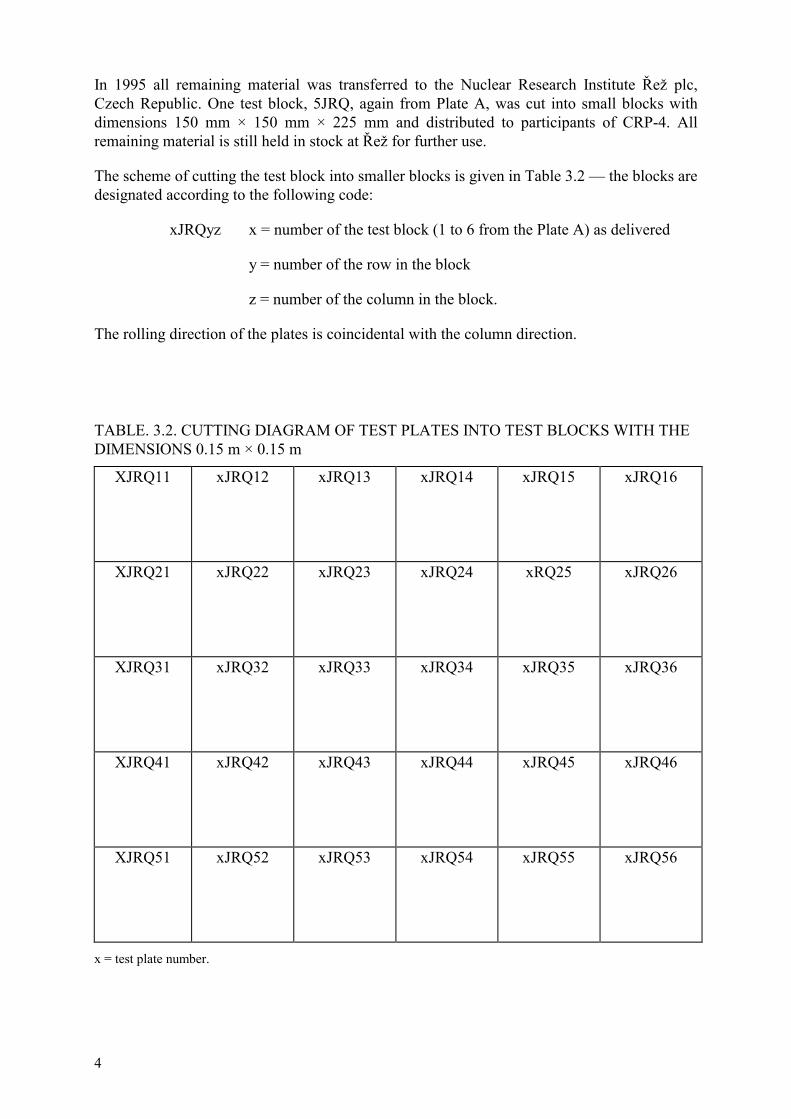
In 1995 all remaining material was transferred to the Nuclear Research Institute Řež plc, Czech Republic. One test block, 5JRQ, again from Plate A, was cut into small blocks with dimensions 150 mm × 150 mm × 225 mm and distributed to participants of CRP-4. All remaining material is still held in stock at Řež for further use.
The scheme of cutting the test block into smaller blocks is given in Table 3.2 — the blocks are designated according to the following code:
xJRQyz x = number of the test block (1 to 6 from the Plate A) as delivered
y = number of the row in the block
z = number of the column in the block.
The rolling direction of the plates is coincidental with the column direction.
TABLE. 3.2. CUTTING DIAGRAM OF TEST PLATES INTO TEST BLOCKS WITH THE DIMENSIONS 0.15 m × 0.15 m
XJRQ11
xJRQ12
xJRQ13
xJRQ14
xJRQ15
xJRQ16
XJRQ21
xJRQ22
xJRQ23
xJRQ24
xRQ25
xJRQ26
XJRQ31
xJRQ32
xJRQ33
xJRQ34
xJRQ35
xJRQ36
XJRQ41
xJRQ42
xJRQ43
xJRQ44
xJRQ45
xJRQ46
XJRQ51
xJRQ52
xJRQ53 xJRQ54 xJRQ55
xJRQ56
x = test plate number.

5
4. ACCEPTANCE TEST RESULTS
Acceptance test results were performed by the manufacturer in accordance with the scheme in Table 2.1 and were summarized in [1].
4.1. Chemical composition
Table 4.1 shows the chemical composition as from the ladle and from both Plates A and B.
TABLE 4.1. CHEMICAL COMPOSITION (MASS %)
Location C Si Mn P S Cu Ni Cr Mo V Alsol
Ladle – 0.18 0.24 1.42 0.017 0.004 0.14 0.84 0.12 0.51 0.002 0.014
Top 0/4t 0.19 0.25 1.41 0.017 0.004 0.14 0.84 0.12 0.50 0.003 0.012
Plate A 2/4t 0.20 0.26 1.43 0.019 0.004 0.14 0.85 0.12 0.51 0.003 0.012 Bottom 1/4t 0.18 0.25 1.39 0.017 0.003 0.14 0.83 0.12 0.50 0.003 0.012
2/4t 0.18 0.25 1.38 0.019 0.004 0.14 0.82 0.12 0.49 0.003 0.012
Top 0/4t 0.19 0.25 1.39 0.019 0.004 0.14 0.83 0.12 0.50 0.003 0.012
Plate B 2/4t 0.20 0.25 1.41 0.019 0.004 0.14 0.84 0.12 0.50 0.003 0.012
Bottom 0/4t 0.18 0.25 1.37 0.018 0.004 0.13 0.82 0.12 0.49 0.003 0.012
2/4t 0.16 0.25 1.35 0.019 0.003 0.13 0.80 0.12 0.49 0.003 0.012
t = plate thickness (225 mm).
4.2. Mechanical properties
Table 4.2 summarizes results from room temperature tensile tests (specimens according to ASTM E 370) of Plate A, while Table 4.3 gives similar results for Plate B.
TABLE 4.2. TENSILE TEST RESULTS (PLATE A)
Location Yield strength[MPa]
Tensile strength[MPa]
Elongation [%]
Reduction of area [%]
0/4t 564 688 26 82
Top 1/4t 487 635 25 77
2/4t 482 630 24 77
0/4t 548 678 27 81
Bottom 1/4t 467 624 27 76
2/4t 465 611 27 77
t = plate thickness.
6
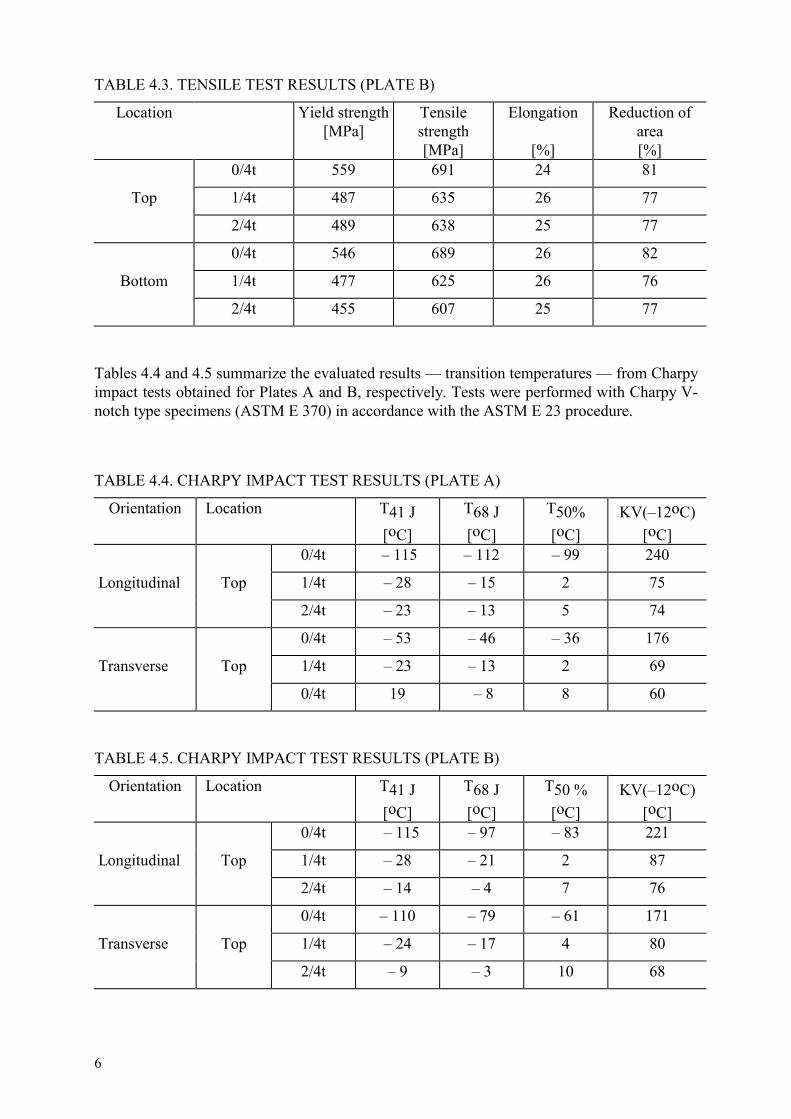
TABLE 4.3. TENSILE TEST RESULTS (PLATE B)
Location Yield strength[MPa]
Tensile strength [MPa]
Elongation
[%]
Reduction of area [%]
0/4t 559 691 24 81
Top 1/4t 487 635 26 77
2/4t 489 638 25 77
0/4t 546 689 26 82
Bottom 1/4t 477 625 26 76
2/4t 455 607 25 77
Tables 4.4 and 4.5 summarize the evaluated results — transition temperatures — from Charpy impact tests obtained for Plates A and B, respectively. Tests were performed with Charpy V-notch type specimens (ASTM E 370) in accordance with the ASTM E 23 procedure.
TABLE 4.4. CHARPY IMPACT TEST RESULTS (PLATE A)
Orientation Location T41 J
[oC]
T68 J
[oC]
T50%
[oC] KV(–12oC)
[oC] 0/4t – 115 – 112 – 99 240
Longitudinal Top 1/4t – 28 – 15 2 75
2/4t – 23 – 13 5 74
0/4t – 53 – 46 – 36 176
Transverse Top 1/4t – 23 – 13 2 69
0/4t 19 – 8 8 60
TABLE 4.5. CHARPY IMPACT TEST RESULTS (PLATE B)
Orientation Location T41 J
[oC]
T68 J
[oC]
T50 %
[oC] KV(–12oC)
[oC] 0/4t – 115 – 97 – 83 221
Longitudinal Top 1/4t – 28 – 21 2 87
2/4t – 14 – 4 7 76
0/4t – 110 – 79 – 61 171
Transverse Top 1/4t – 24 – 17 4 80
2/4t – 9 – 3 10 68
7
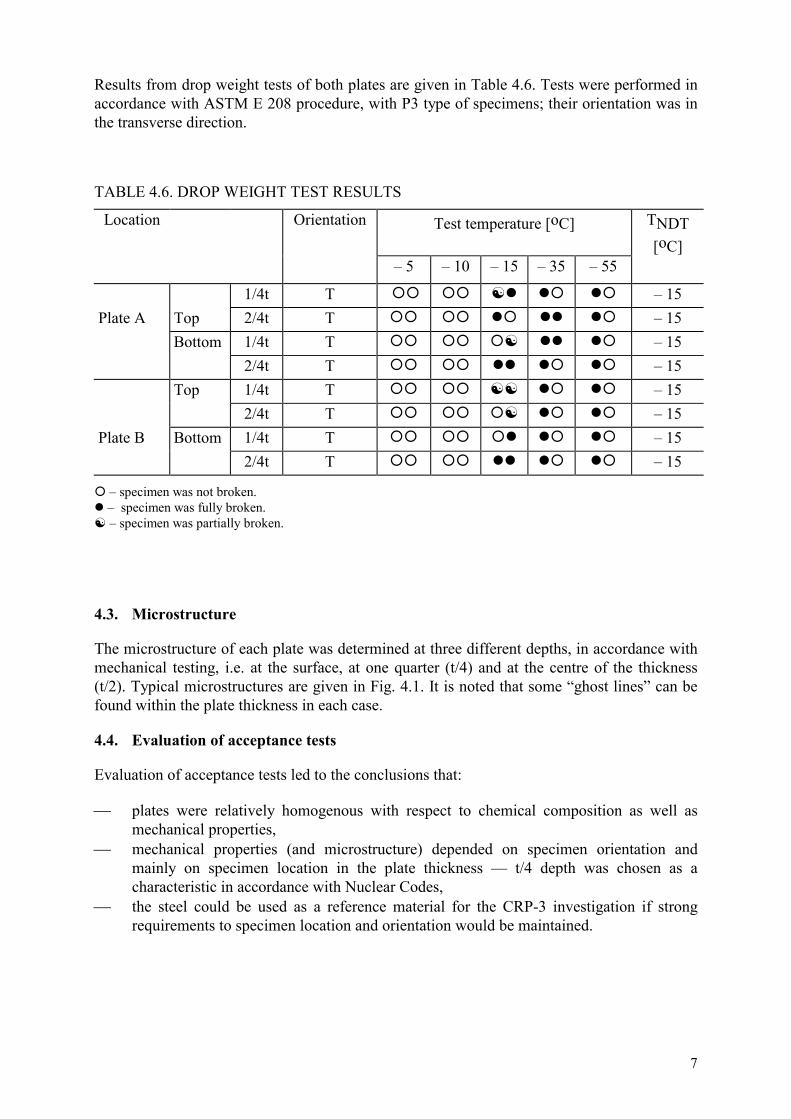
Results from drop weight tests of both plates are given in Table 4.6. Tests were performed in accordance with ASTM E 208 procedure, with P3 type of specimens; their orientation was in the transverse direction.
TABLE 4.6. DROP WEIGHT TEST RESULTS
Location Orientation Test temperature [oC]
TNDT
[oC] – 5 – 10 – 15 – 35 – 55
1/4t T �� �� �� �� �� – 15 Plate A Top 2/4t T �� �� �� �� �� – 15 Bottom 1/4t T �� �� �� �� �� – 15 2/4t T �� �� �� �� �� – 15 Top 1/4t T �� �� �� �� �� – 15 2/4t T �� �� �� �� �� – 15 Plate B Bottom 1/4t T �� �� �� �� �� – 15 2/4t T �� �� �� �� �� – 15
� – specimen was not broken. � – specimen was fully broken. � – specimen was partially broken. 4.3. Microstructure
The microstructure of each plate was determined at three different depths, in accordance with mechanical testing, i.e. at the surface, at one quarter (t/4) and at the centre of the thickness (t/2). Typical microstructures are given in Fig. 4.1. It is noted that some “ghost lines” can be found within the plate thickness in each case.
4.4. Evaluation of acceptance tests
Evaluation of acceptance tests led to the conclusions that:
�� plates were relatively homogenous with respect to chemical composition as well as mechanical properties,
�� mechanical properties (and microstructure) depended on specimen orientation and mainly on specimen location in the plate thickness — t/4 depth was chosen as a characteristic in accordance with Nuclear Codes,
�� the steel could be used as a reference material for the CRP-3 investigation if strong requirements to specimen location and orientation would be maintained.

8
5. RESULTS FROM THE IAEA CO-ORDINATED RESEARCH PROJECTS
Both Co-ordinated Research Projects — CRP-3 and CRP-4 — were directed towards the mechanical testing of the reference material JRQ: Steel JRQ in CRP-3 was chosen as a strict reference material for comparison results from different laboratories in unirradiated as well as irradiated conditions. This steel has been chosen as the main material for the mandatory part of CRP-4. CRP-3 focused mainly on Charpy impact testing (and fracture toughness testing was only of the second priority for some participants), while CRP-4 was fully devoted to fracture toughness testing with Charpy impact tests being a comparative test. Thus, a large data set of material properties has been collected during a period of several years, based on tests from two test blocks — 3JRQ and 5JRQ. Relatively good homogeneity of results points to the fact that these data sets can readily characterize the reference material JRQ, as the differences with the acceptance tests are also small.
5.1. Chemical composition
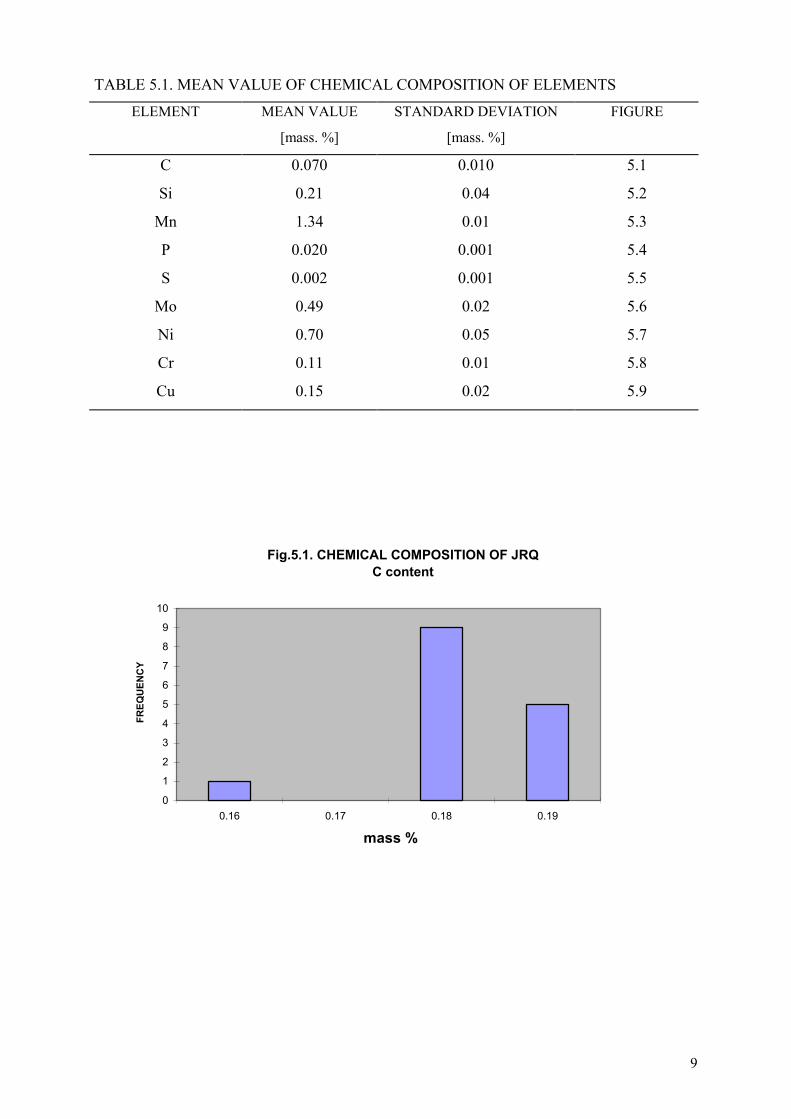
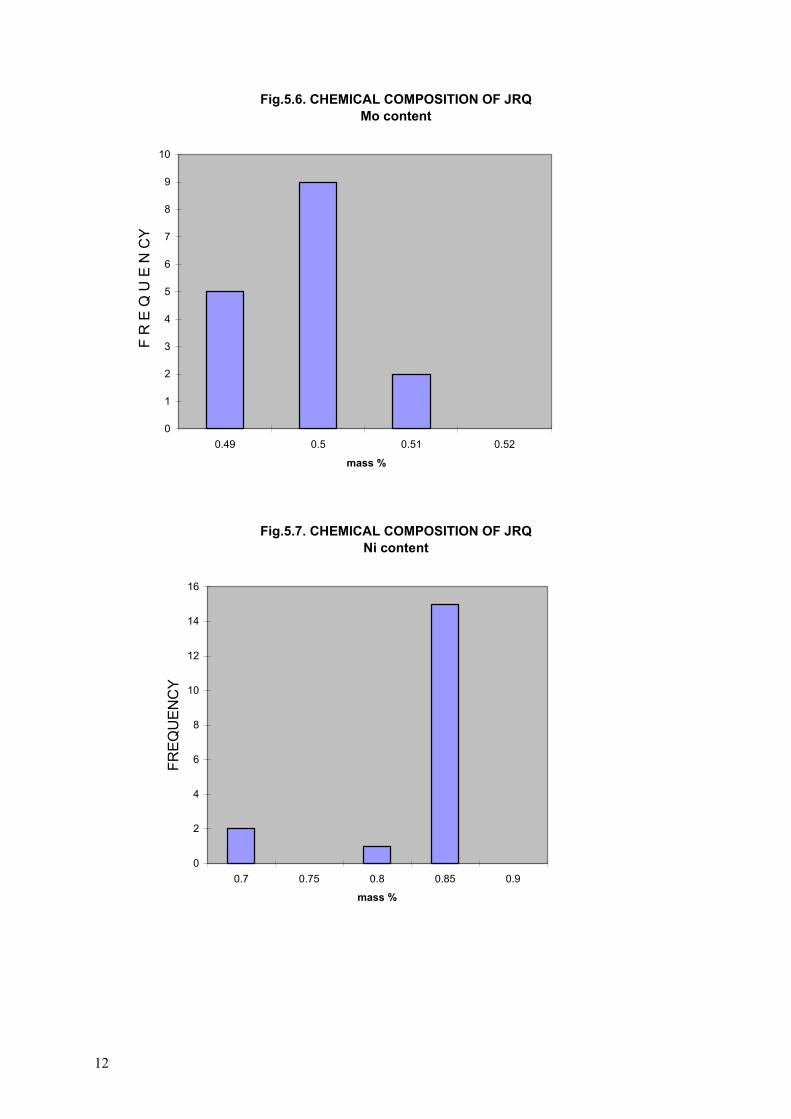
The chemical composition was determined by several participants of CRP-3. All results, together with acceptance tests, are summarized as histograms of individual chemical element concentration in Figs 5.1 to 5.9. Mean values of individual element concentration together with their standard deviations are given in Table 5.1.
9
TABLE 5.1. MEAN VALUE OF CHEMICAL COMPOSITION OF ELEMENTS
ELEMENT MEAN VALUE
[mass. %]
STANDARD DEVIATION
[mass. %]
FIGURE
C 0.070 0.010 5.1
Si 0.21 0.04 5.2
Mn 1.34 0.01 5.3
P 0.020 0.001 5.4
S 0.002 0.001 5.5
Mo 0.49 0.02 5.6
Ni 0.70 0.05 5.7
Cr 0.11 0.01 5.8
Cu 0.15 0.02 5.9
Fig.5.1. CHEMICAL COMPOSITION OF JRQC content
0
1
2
3
4
5
6
7
8
9
10
0.16 0.17 0.18 0.19
mass %
FREQ
UEN
CY

10
Fig.5.2. CHEMICAL COMPOSITION OF JRQSi content
0
2
4
6
8
10
12
14
0.2 0.22 0.24 0.26 mass %
FREQ
UEN
CY
Fig.5.3. CHEMICAL COMPOSITION OF JRQMn content
0
1
2
3
4
5
6
7
8
1.3 1.35 1.4 1.45 1.5
mass %
F R
E Q
U E
N C
Y

11
Fig.5.4. CHEMICAL COMPOSITION OF JRQP content
0
1
2
3
4
5
6
7
8
9
10
0.017 0.018 0.019 0.02 0.021
mass %
F R
E Q
U E
N C
Y
Fig.5.5. CHEMICAL COMPOSITION OF JRQS content
0
2
4
6
8
10
12
0.001 0.002 0.003 0.004 0.005
mass %
F R
E Q
U E
N C
Y
12
Fig.5.6. CHEMICAL COMPOSITION OF JRQMo content
0
1
2
3
4
5
6
7
8
9
10
0.49 0.5 0.51 0.52
mass %
F R
E Q
U E
N C
Y
Fig.5.7. CHEMICAL COMPOSITION OF JRQNi content
0
2
4
6
8
10
12
14
16
0.7 0.75 0.8 0.85 0.9
mass %
FREQ
UEN
CY

13
Fig.5.8. CHEMICAL COMPOSITION OF JRQCr content
0
2
4
6
8
10
12
14
0.1 0.11 0.12 0.13 0.14
mass %
FREQ
UEN
CY
Fig.5.9. CHEMICAL COMPOSITION OF JRQCu content
0
2
4
6
8
10
12
14
0.14 0.15 0.16 0.17
mass %
FREQ
UEN
CY

14
5.2. Tensile properties
Tensile properties, mainly on small size specimens (with diameters between 3 and 6 mm) have been determined in three ways:
�� effect of specimen orientation on room temperature tests, �� temperature dependence of tensile properties, �� thickness effect on tensile properties, i.e. effect of specimen location in the depth of
plate thickness even though one quarter of the thickness was chosen and strongly recommended for reference purposes.
Both specimen orientations — longitudinal (L) as well as transverse (T) — were tested, mainly in the CRP-3. Test temperature dependencies of tensile properties (from one quarter of the thickness) are shown in Fig. 5.10 (yield strength and ultimate strength properties — Rp0.2 and Rm, respectively) while Fig. 5.11 shows results from plasticity properties (elongation and reduction in area – A5 and Z, respectively). Tests were performed with specimens of both orientations – L and T; there is no statistical difference between these orientations. Scatter of the data is within a standard test distribution.
Fig.5.10. TENSILE PROPERTIES OF JRQ DEPTH = 56 mm = T/4
0
200
400
600
800
1000
1200
-200 -100 0 100 200 300
TEST TEMPERATURE,T, oC
STR
ENG
TH, M
Pa Rp0.2/LRm/LRp0.2/TRm/T

15
Fig.5.11. TENSILE PROPERTIES OF JRQ DEPTH = 56 mm = T/4
0
10
20
30
40
50
60
70
80
-200 -150 -100 -50 0 50 100 150 200 250 300
TEST TEMPERATURE, oC
PLA
STIC
ITY,
% Z/L
A5/L
Z/T
A5/T
Statistical evaluation of tensile properties (in depth equal to T/4 = 55 mm) gives the following relationship for yield strength (with a correlation coefficient R2 = 0.9875):
Rp0.2 = 4 × 10⁻⁸ T4 = 2 × 10⁻⁵ T3 + 0.0036 T2 – 0.543 T + 490.29
Where yield strength Rp0.2 is in MPa and temperature T in oC.
Location of specimens in the plate thickness is very important for a precise and reproducible test results. Figs 5.12 to 5.15 summarize results from this effect. While Figs 5.12 and 5.13 give results from one laboratory only, Figs 5.14 and 5.15 show results obtained in several laboratories within the projects. In all cases it is clearly seen that results obtained from specimens located within the outer one quarter of the thickness (i.e. between 0 and t/4 and between 3t/4 and 4t/4) are strongly affected by the quenching effect of the steel. Strength properties are increasing in the direction to the surface, while plasticity is decreasing. Thus, the recommendation of testing specimen only from t/4 is strongly supported. In general, location of t/4 and two layers of Charpy size specimens in the direction to the plate centre are accepted.

16
Fig.5.12. TENSILE PROPERTIES OF JRQROOM TEST TEMPERATURE
400
450
500
550
600
650
700
0 25 50 75 100 125
DEPTH, mm
Rp,
Rm
, MPa Rp
Rm
Fig.5.13. TENSILE PROPERTIES OF JRQROOM TEST TEMPERATURE
0
25
50
75
100
0 25 50 75 100 125
DEPTH, mm
A5,
Z, %
Z
A

17
Fig.5.14. TENSILE PROPERTIES OF JRQ ROOM TEST TEMPERATURE
0
100
200
300
400
500
600
700
0 25 50 75 100 125
DEPTH, mm
STR
ENG
TH, M
Pa Rp0.2/L
Rm/L
Rp0.2/T
Rm/T
Fig.5.15. TENSILE PROPERTIES OF JRQ ROOM TEST TEMPERATURE
0
10
20
30
40
50
60
70
80
90
0 25 50 75 100 125
DEPTH, mm
PLA
STIC
ITY,
% Z/L
A5/L
Z/T
A5/T

18
5.3. Impact properties
Impact properties, mainly Charpy impact test results as raw data as well as their evaluation as transition temperatures, are of main interest to the current reactor pressure vessel materials evaluation in unirradiated as well as irradiated conditions.
Thus, similarly to tensile properties, Charpy impact tests were performed to determine different effects on transition temperatures:
�� effect of specimen orientation, �� effect of specimen location in the plate thickness.
data of notch toughness (absorbed energy), KV, fibrous fracture, FA, and lateral expansion, LE, are given for both specimens orientations — T-L and L-T. Test results for orientation T-L
Fig.5.16. NOTCH IMPACT TOUGHNESS OF JRQ DEPTH=T/4=55 mm ORIENTATION T-L
0
50
100
150
200
250
300
-200 -100 0 100 200 300 400
T, C
KC
V, J
.cm
-2
Figures 5.16 to 5.21 summarize test results obtained by CRP-3, i.e. on test block 3JRQ. Raw
were obtained in both CRPs, while data for orientation L-T come from CRP-3, only.

19
Fig. 5.17. LATERAL EXPANSION OF JRQ DEPTH=T/4=55mmORIENTATION T-L
0
0.5
1
1.5
2
2.5
3
-200 -100 0 100 200 300 400
T, C
L.E.
, mm
ORIENTATION T-L
0
20
40
60
80
100
120
-200 -100 0 100 200 300 400
T, C
S.F.
, % KV,J
Fig.5.18. SHEAR FRACTURE OF JRQ DEPTH=T/4=55mm

20
Fig.5.19. NOTCH IMPACT ENERGY OF JRQ DEPTH=T/4=55mm ORIENTATION L-T
0
50
100
150
200
250
300
-200 -100 0 100 200 300 400
T, C
KC
, C
Fig.5.20. FIBROUS FRACTURE OF JRQ DEPTH=T/4=55mmORIENTATION L-T
0
20
40
60
80
100
120
-200 -100 0 100 200 300 400
T, C
F.A
., %

21
Fig.5.21. LATERAL EXPANSION OF JRQ DEPTH=T/4=55mmORIENTATION L-T
0.00
0.50
1.00
1.50
2.00
2.50
3.00
-200 -100 0 100 200 300 400
T, C
L.E.
, mm
Figure 5.22 evaluates the effect of specimen orientation on transition temperature T41J as a histogram where the scatter of results can be seen from the following mean values:
CRP-3 – T41J (T-L, 55 mm) = - 15.9 � 8.2 oC
T41J (L-T, 55 mm) = - 23.7 � 4.8 oC
T41J (55 mm) = - 19.5 ���� 7.8 oC
CRP-4 - T41J (T-L, 55 mm) = - 23,8 � 6,5oC
At the same time, the following upper shelf energies (USE) have been determined:
CRP-3 - USE (T-L, 55 mm) = 187.8 � 11.1 J
USE (L-T, 55 mm) = 213.6 � 12.2 J
USE (55 mm) = 198.6 ���� 17.2 J

22
Fig.5.22. TRANSITION TEMPERATURES OF JRQ, DEPTH=55mm=T/4, ORIENTATION T-L
0
2
4
6
8
10
12
-39/-30 -29/-20 -19/-10 -9/0
T41J, oC
FREQ
UEN
CY
JRQ-3/LTJRQ-3/TLJRQ-4/TL
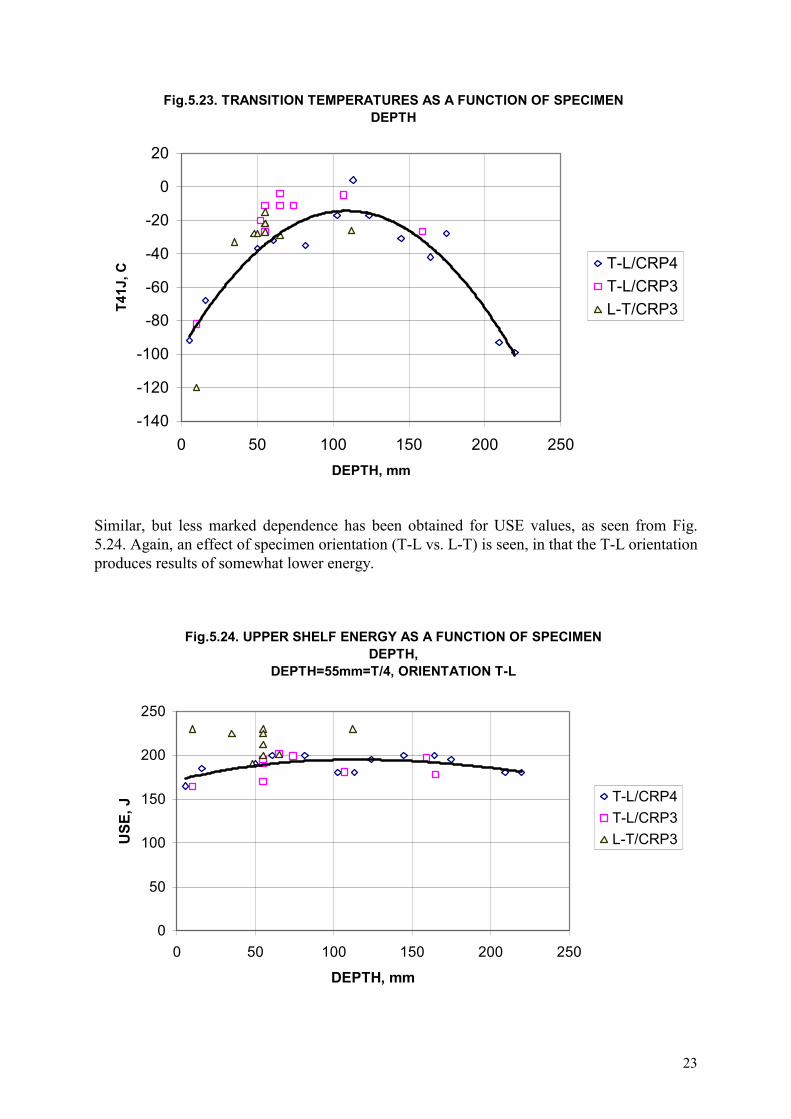
The effect of specimen location in the plate thickness was also determined. Figure 5.23 summarizes all the results of transition temperature T41J from different depths of plate — both specimen orientations are mentioned. It is clearly seen that the depth dependence is much stronger in comparison with tensile properties – only results within the central half of the plate thickness show some relevant scatter of data. The transverse orientation (T-L) is less favourable in comparison with longitudinal one (L-T) which is in a good agreement with the aforementioned mean values of transition temperatures. Again, these results strongly support the recommendation for the use of specimen from one quarter of the thickness, only for reference use.
23
Fig.5.23. TRANSITION TEMPERATURES AS A FUNCTION OF SPECIMEN DEPTH
-140
-120
-100
-80
-60
-40
-20
0
20
0 50 100 150 200 250DEPTH, mm
T41J
, C
T-L/CRP4T-L/CRP3L-T/CRP3
Similar, but less marked dependence has been obtained for USE values, as seen from Fig. 5.24. Again, an effect of specimen orientation (T-L vs. L-T) is seen, in that the T-L orientation produces results of somewhat lower energy.
Fig.5.24. UPPER SHELF ENERGY AS A FUNCTION OF SPECIMEN DEPTH,
DEPTH=55mm=T/4, ORIENTATION T-L
0
50
100
150
200
250
0 50 100 150 200 250
DEPTH, mm
USE
, J
T-L/CRP4T-L/CRP3L-T/CRP3
24
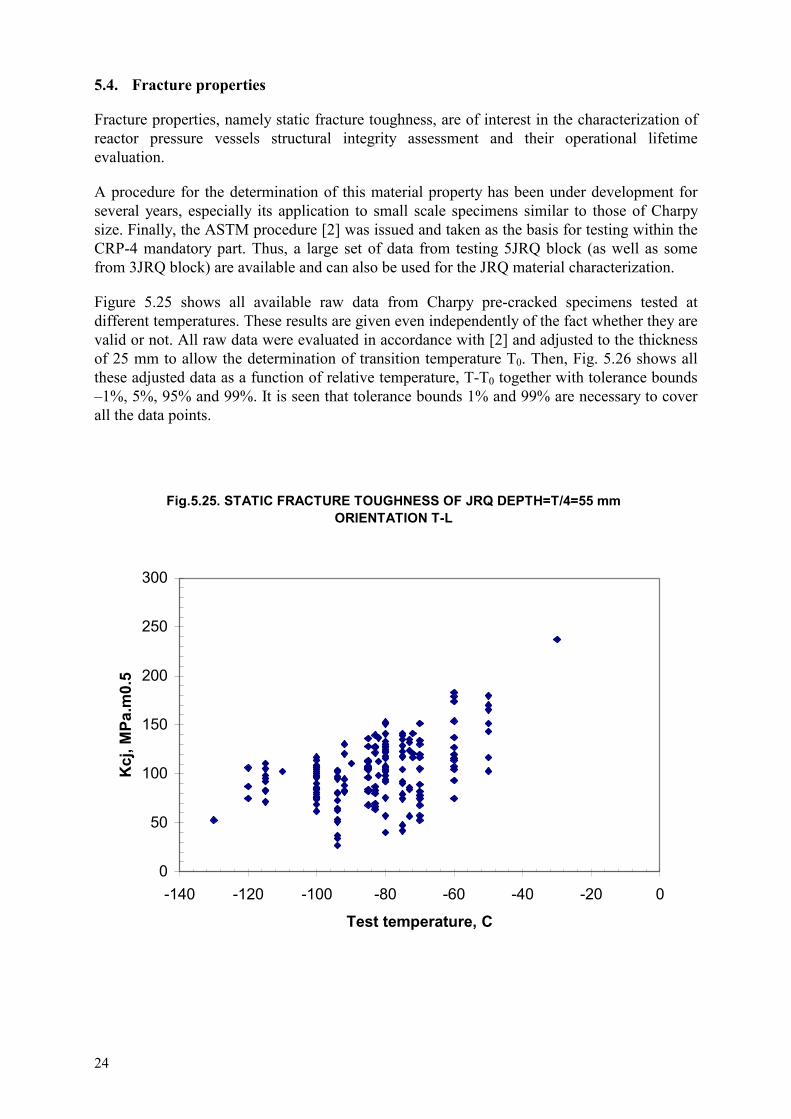
5.4. Fracture properties
Fracture properties, namely static fracture toughness, are of interest in the characterization of reactor pressure vessels structural integrity assessment and their operational lifetime evaluation.
A procedure for the determination of this material property has been under development for several years, especially its application to small scale specimens similar to those of Charpy size. Finally, the ASTM procedure [2] was issued and taken as the basis for testing within the CRP-4 mandatory part. Thus, a large set of data from testing 5JRQ block (as well as some from 3JRQ block) are available and can also be used for the JRQ material characterization.
Figure 5.25 shows all available raw data from Charpy pre-cracked specimens tested at different temperatures. These results are given even independently of the fact whether they are valid or not. All raw data were evaluated in accordance with [2] and adjusted to the thickness of 25 mm to allow the determination of transition temperature T0. Then, Fig. 5.26 shows all these adjusted data as a function of relative temperature, T-T0 together with tolerance bounds –1%, 5%, 95% and 99%. It is seen that tolerance bounds 1% and 99% are necessary to cover all the data points.
Fig.5.25. STATIC FRACTURE TOUGHNESS OF JRQ DEPTH=T/4=55 mm ORIENTATION T-L
0
50
100
150
200
250
300
-140 -120 -100 -80 -60 -40 -20 0
Test temperature, C
Kcj
, MPa
.m0.
5

25
Fig.5.26 STATIC FRACTURE TOUGHNESS OF JRQ DEPTH=T/4=55 mm, ORIENTATION T-L
SPECIMEN SIZE 10x10 mm
0
50
100
150
200
250
300
-100 -50 0 50 100
RELATIVE TEMPERATURE,T-T0, C
KC
J(ad
just
ed to
25
mm
), M
Pa.m
0.5
KCJ(25mm)KCJ(mean)KCJ(5%)KCJ(95%)KCJ(1%)KCJ(99%)
Figure 5.27 gives a histogram of all values of transition temperature T0 – specimens have orientation T-L and were located in one quarter of the thickness, in both cases.
Mean value of all these tests is equal to T0 = 71 � 10oC.
Similarly to Charpy impact transition temperatures, Fig. 5.28 shows depth dependence of transition temperature T0. The results show the same tendency, with some plateau in the middle part of the plate thickness.

26
Fig.5.27. REFERENCE TEMPERATURE T0 IN DEPTH=55mm=T/4,ORIENTATION T-L
0
1
2
3
4
5
6
7
8
9
10
-90/-81 -80/-71 -70/-61 -60/-51 -50/-41
TEMPERATURE,C
FREQ
UEN
CY
Fig.5.28. TRANSITION TEMPERATURE T0 AS A FUNCTION OF SPECIMEN DEPTH
-150
-125
-100
-75
-50
0 50 100 150 200 250
DEPTH, mm
T 0, C

27
6. CONCLUSION AND RECOMMENDATIONS
Results obtained showed that the JRQ plate is comparatively homogenous (difference between acceptance tests and results from two test blocks are small) and can be used as a reference steel, if the following requirements are fulfilled:
�� specimen location must be at one quarter of the plate thickness (plus a maximum up to two layers for Charpy size specimens in the direction to the plate centre),
�� specimen orientation must be standardized, T-L orientation is recommended (in accordance with Nuclear Codes as well as with the maximum amount of data collected),
�� specimen preparation for Charpy impact tests must be done in accordance with a chosen standard, i.e. ASTM or ISO, as departure can produce different results,
�� specimen preparation for fracture toughness tests must be done in accordance with a chosen standard, i.e. ASTM or ISO especially in fatigue pre-cracking and test temperature determination.
This report summarizes all the available data on manufacturing and properties of the reference steel JRQ which was chosen as reference material by the IAEA for use in co-ordinated research projects. The above results are not limited to the IAEA but could also be useful for national and international studies of reactor pressure vessel material behaviour – surveillance programmes, studies of radiation damage in these steels as well as for various round robin exercises, e.g. in fracture mechanics, etc.

28
REFERENCES
[1] Manufacturing History and Mechanical Properties of Japanese Materials Provided for the International Atomic Energy Agency, CRP Sub-Committee, Atomic Energy Research Committee, Japan Welding Engineering Society, October 1986.
[2] AMERICAN SOCIETY FOR TESTING AND MATERIALS, ASTM Standards Test Method for Determination of Reference Temperature, To, for Ferritic Steels in Transition Range, ASTM E-1021-97.

29
CONTRIBUTORS TO DRAFTING AND REVIEW
Brumovsky, M. Nuclear Research Institute Řež plc, Czech Republic
Davies, L.M. LMD Consultancy, United Kingdom
Kryukov, A. Kurchatov Institute, Russian Federation
Lyssakov, V.N. International Atomic Energy Agency
Nanstad, R.K. Oak Ridge National Laboratory, United States of America

01-0
1156