reference vgstudio max - our research -...
TRANSCRIPT


Release 2.0 myVGL Manual 1
. . . . .
. . . . . . . . . . . . . . . . . . . . . . . . . . . . . . . . . . .Contents
1 Welcome 1-1About this product 1-1
Before first usage 1-1Preparations/Warnings 1-2Additional information 1-2Conventions used in the documentation 1-2
2 Workspace 2-13D Window 2-2
Object selection 2-2Move / Rotate mode 2-2
Move mode 2-3Rotate mode 2-3
Preview 2-34 / 2 / 1 pixels per ray 2-4Freeze rendering 2-4Center and focus camera 2-4Toggle fullscreen state 2-4
Context menu of 3D window 2-4Annotations 2-4Freeze rendering 2-4Tripod/Box > Show tripod 2-4Tripod/Box > Show box 2-4Tripod/Box > Configure 2-4Clipping > Create clipping plane 2-5Clipping > Create clipping box 2-5Clipping > Create aligned clipping box 2-5Text overlay > Default / Preset 2-5Text overlay > Configure ... 2-5Background color 2-5Reset 2-5Copy to clipboard 2-5Properties 2-5
2D Windows 2-5Focus selected object 2-6

2 myVGL Manual Release 2.0
Reset zoom 2-6Zoom in / out 2-6Lock slice position 2-6Set brightness 2-6Original display mode 2-7Color mode / Color and Opacity mode 2-7Create clipping plane 2-7Toggle fullscreen state 2-7
Context menu of 2D window 2-7Zoom > Zoom in/out 2-7Zoom > Fit object to window 2-7Zoom > Fit scene to window 2-7Zoom > Reset 2-7Coordinate system 2-7Display mode 2-8Slice step width 2-8Level/Window mode 2-8Background 2-8Annotations 2-8Text overlay 2-8Clipping > Create clipping plane 2-8Interpolation mode 2-8Tripod overlay > Show tripod 2-8Tripod overlay > Configure 2-8Reset 2-8Copy to clipboard 2-9Properties 2-9
Tooldocks 2-9Icon bars 2-9
Display unit 2-10
3 File menu 3-1New 3-2Open... 3-2
Open options 3-3Open Project 3-3import single volume 3-3Load scene 3-3File Selection 3-4Load as... 3-4ROI and Skip selection 3-6Manipulation 3-7
Histogram (Import) 3-7Preview (Import) 3-8

. . .
. .
Release 2.0 myVGL Manual 3
Save image(s)... 3-9Save AVI/image stack ... 3-10Print image(s)... 3-11Quit 3-12
4 Edit menu 4-1Undo / Redo 4-1Clear undo queue 4-2Delete 4-2Preferences 4-2
General 4-2General 4-2Annotation arrangement 4-3Coordinate system display 4-3Snap frame 4-4Textoverlay 4-4Unit 4-4
Slice elements 4-4Isosurface 4-4Region of Interest 4-4
Analysis 4-4Coordinate measurement 4-4Defect detection 4-5Nominal/actual comparison 4-6Wall thickness 4-7
5 Instruments menu 5-1General 5-1
Handling of instruments 5-1Display of instruments 5-2Annotations 5-3
Indicator 5-3Distance instrument 5-3Angle instrument 5-4Polyline instrument 5-4Caliper instrument 5-5Activate navigation cursor 5-5Snap 5-6
Snap modes > Min 5-6Snap modes > Max 5-6Snap modes > Gradient 5-6Snap modes > Nearest 5-6Snap modes > Local 5-6
4 myVGL Manual Release 2.0
6 Object menu 6-1Rotate / Move 6-1Clipping 6-1Properties 6-2
7 Result menu 7-1Nominal/Actual comparison 7-1Wall thickness 7-1Defect detection 7-1CM Reporting 7-1
8 Tools menu 8-1
9 Window menu 9-1Slices Left/Right/Below 9-2Quad 9-2Background 9-2Coordinate System 9-2Zoom 9-2Ruler 9-2Display mode 9-3
Original 9-3Color 9-3Color and Opacity 9-3
Annotations 9-3Level/Window mode 9-3Slice step width 9-3Text overlay 9-3
10Help Menu 10-1About 10-1Show manual 10-1
11Volume Rendering tool 11-1Preset selection 11-1Opacity manipulation area 11-2
Manipulation of the opacity transfer function 11-2Gray value histogram and zoom 11-2Intervals 11-3
Appearance 11-3

. . .
. .
Release 2.0 myVGL Manual 5
Ambient 11-3Diffuse 11-4Specular 11-4Transparency 11-4Swap 11-5
Rendering settings 11-5Isosurface renderer 11-5Volume renderer (Phong) 11-5Volume renderer (Scatter HQ) 11-5Hardware renderer (Scatter HQ) 11-6X-Ray 11-6Sum along Ray 11-6Maximum Projection 11-6Scatter (v1.2) 11-6Scatter HQ (v1.2) 11-6Scatter Gradient (v1.2) 11-6
Remarks on renderers 11-6Oversampling 11-7Normalize gradients 11-7
Limitations of specific renderers 11-7
12Scene Tree tool 12-1Entries in the Scene Tree 12-1
Delete 12-1Rename 12-1Visibility 12-1Status indicators 12-2Elements 12-2
Menu options 12-3New > 12-3
General options 12-3Analysis and measurement options 12-3
Import > 12-4Align slices to object 12-4Visibility on / off 12-4Delete 12-4Rename 12-4Reset 12-4Properties 12-4
General properties (volume objects) 12-4General properties (Polygon models) 12-5File list 12-5

6 myVGL Manual Release 2.0
13Clipping tool 13-1General 13-1
Clipping plane 13-1Rotate mode 13-1Move mode 13-2
Clipping box 13-2Rotation mode 13-2Translation mode 13-2
Aligned clipping box 13-2Status Information 13-3General 13-3
Appearance 13-3Opacity 13-3Reset 13-3
Aligned Clipping box 13-3Boundary 13-3Reset 13-3
14Transform tool 14-1Status information 14-1Coordinate system 14-1Position (Pos) 14-1Rotation (Rot) 14-1Center 14-2Resolution 14-2
15Polygon Rendering tool 15-1Status information 15-1General 15-1
Preset selection 15-1Render solid 15-2
Shading model 15-2Cull face 15-2
Render wireframe 15-2Render point cloud 15-3
Material 15-3Material face settings 15-4Color and Intensity 15-4Slice color 15-4
16Light tool 16-1Status information 16-1
. . .
. .
Release 2.0 myVGL Manual 7
General 16-1Preset selection 16-1Type 16-1Color and Intensity 16-3Shadow mode 16-4
Advanced 16-4Attenuation 16-4Spot 16-5
17Camera tool 17-1General 17-1
Camera Orientation 17-1Default camera views. 17-1Position 17-1Focal point 17-1Up vector 17-1
Projection mode 17-2Perspective 17-2Parallel 17-2Stereo-perspective 17-2
View Angle 17-2Stereo 17-2
Image mode 17-2Anaglyph image red-green, red-blue, red-cyan 17-2Interlaced 17-2Left image only 17-2Right image only 17-3OpenGL 17-3
Settings mode 17-3Fixed focal depth 17-3Fixed viewer-scene scaling 17-3
Eye distance 17-3Display distance 17-3Focal depth 17-3Scene Zoom 17-3
18Text Overlay Editor 18-1Slice Views (and Scene View) 18-1
Preset Selection 18-1Text labels 18-2
Available default text labels: 18-2Preview 18-3
8 myVGL Manual Release 2.0
19Measurements menu 19-1Point 19-1Line 19-1Circle 19-2Pplane 19-2Sphere 19-2Cylinder 19-2Cone 19-2Dialog: Reference object properties 19-2
Properties 19-3Description 19-3Construction method 19-3Size status 19-3Fit status 19-3Position / Radius / Conicity / Direction / Normal 19-4Deviations 19-4
Fit points 19-4Histogram 19-4
Binning 19-4Cumulated 19-5Colors 19-5
CM Reporting 19-5General remarks 19-6
Table selection 19-6Editing 19-6Screenshots 19-6Context menu 19-6Column-order 19-6Row-sorting 19-7Special columns 19-7
Features 19-7Feature list 19-7
Reference objects 19-11Reference object list 19-11
Capture images 19-12Report 19-12
Report sections 19-13Detail images settings 19-13Logo 19-13Cells 19-13
20Nominal/actual comparison module 20-1Settings 20-2
Preset Selection 20-2

. . .
. .
Release 2.0 myVGL Manual 9
Calculation parameters 20-2Options 20-2
Colors 20-2LUT 20-2Sections 20-3Options 20-3Clamp colors 20-4Tickmarks on color bar 20-4Preset selection 20-4
Histogram 20-4Type 20-4Binning 20-4Context menu 20-4
Cumulated 20-5Type 20-5Cumulation 20-5Deviation / Percentage 20-5Context menu 20-5
General table features 20-6Annotations 20-6Capture images 20-8Report 20-8
Report sections 20-8Detail images settings 20-8Logo 20-8Cells 20-8
21Defect detection module 21-1Settings 21-2
Preset Selection 21-2Algorithm 21-2Calibration parameters 21-3Defect mask selection 21-4Analysis parameters 21-4Additional defect properties 21-7Process 21-8
Colors 21-8LUT 21-8Sections 21-8Options 21-9Other colors 21-9Tickmarks on color bar 21-9Preset selection 21-10

10 myVGL Manual Release 2.0
General table features (Context Menus) 21-10Defects 21-11Statistics 21-13
Options 21-13Defects 21-13Material 21-13
Annotations 21-14Capture images 21-15Report 21-15
Report sections 21-15Detail images settings 21-15Logo 21-15Cells 21-15
22Wall thickness module 22-1Settings 22-2
Preset Selection 22-2Material 22-2Wall thickness 22-2Component analysis 22-3Algorithm details 22-3
Colors 22-3LUT 22-3Sections 22-4Options 22-4Tickmarks on color bar 22-5Preset selection 22-5
General table features 22-5Components 22-6Annotations 22-7Capture images 22-9Report 22-9
Report sections 22-9Detail images settings 22-9Logo 22-9Cells 22-9
23Shortcuts 23-1Shortcuts in 2D / 3D window 23-1
<Ctrl> + scroll wheel 23-1double-click middle mouse button 23-1
Shortcuts in 2D window 23-1
. . .
. .
Release 2.0 myVGL Manual 11
scroll wheel 23-1hold middle mouse button + move mouse 23-1
Shortcuts in 3D window 23-1hold middle mouse button and move mouse up/down 23-1<Ctrl> + move/rotate object 23-1<Shift> + move/rotate object 23-1double-click object 23-1<Ctrl> + double-click object 23-2scroll wheel (if light source selected) 23-2
Shortcuts in Scene Tree 23-2double-click object 23-2
Shortcuts for menu entries 23-2<Ctrl> + N 23-2<Ctrl> + O 23-2<Ctrl> + Z 23-2<Ctrl> + Y 23-2<Del> 23-2<Ctrl> + <Shift> + R 23-2<Ctrl> + <Shift> + M 23-2
24Glossary 24-1C 24-1E 24-1P 24-1R 24-2
25File Extensions 25-1

12 myVGL Manual Release 2.0

Release 2.0 myVGL Manual 1-1
. . . . .
. . . . . . . . . . . . . . . . . . . . . . . . . . . . . . . . . . .WELCOME 1
hank you for choosing V o l u m e G r a p h i c s products. This document is the main manual of myVG L 2 . 0 and contains a reference guide to the options, menus and dialogs as well as a guide to further resources
such as instructions for (un)installation and maintenance and help/support options.
All documentation is part of the product, please read it carefully. Make sure to have the complete documentation available throughout the lifetime of this product. In case of change of ownership (as far as compliant with the terms and conditions) make sure to provide the new user with the full installation package including all supplementary material. Updating your software installation might include a new documentation version or addi-tional material. Please make sure to always use matching versions of both product and supplementary materials.
. . . . . . . . . . . . . . . . . . . . . . . . . . . . . . . . . . . . . . . . . . . . . . . . . . . . About this product
myVG L is a software package for the visualization and documentation of voxel data projects (.vgl files) created in VG Studio MAX 2 .0 or VG Studio 2 .0 . It is used in a variety of application areas such as industrial CT, medical research, life sciences, and many other.
Before f i rs t usageThe installation instructions will tell you how to install myVG L 2 . 0 .
Feature Description. . . . . . . . . . . . . . . . . . . . . . . . . . . . . . . . . . . . . . . . . . . . . . . . . . . . Product name
myVGL
Release 2.0Scope of delivery
Installation package (download or CD-ROM), platform-specific as ordered, online documentation and supple-mentary material such as sample data. . . . . . . . . . . . . . . . . . . . . . . . . . . . . . . . . . . . . . . . . . . . . . . . . . . .
TABLE 1-1: PRODUCT DETAILS
T

WE L C O M EAbout this product
1-2 myVGL Manual Release 2.0
1
Preparat ions/WarningsWorking with voxel data requires considerable system resources. Shut down all other applications using large amounts of main memory or pro-cessor power before launching myVG L .
Your work with myVG L might be subject to legal restrictions or company-specific conditions. Contact your supervisors for details.
Addi t ional in format ionThis manual is part of the documentation of myVG L . Refer to the installation directory of myVG L to browse the documentation.
Related documents:
If you are interested in more extensive functionality than the one offered by myVG L , you have the chance to evaluate our other products, VG S tud io 2 .0 or VG Stud io MAX 2 .0 :
www.volumegraphics.com/products/evaluation/form.html
For further questions about our product portfolio, please contact
Convent ions used in the documentat ionThroughout the documentation, you will find the following conventions:
• Main menus and tools have their own chapter.
• Cross-references like “see chapter...” are linked, click the link to follow it.
• Menu entries, labels, etc. are highlighted with a sans-serif font and blue color.
If you are looking for... ... refer to:. . . . . . . . . . . . . . . . . . . . . . . . . . . . . . . . . . . . . . . . . . . . . . . . . . . . Installation instructions <documents in installation direc-
tory>Tutorials <documents in installation direc-
tory>. . . . . . . . . . . . . . . . . . . . . . . . . . . . . . . . . . . . . . . . . . . . . . . . . . . . TABLE 1-2: AVAILABLE DOCUMENTATION

Release 2.0 myVGL Manual 2-1
. . . . .
. . . . . . . . . . . . . . . . . . . . . . . . . . . . . . . . . . . . . . . . . .WORKSPACE 2
he workspace of myVG L 2 . 0 is divided into several workspace win-dows with which you inspect and manipulate the objects you are visualizing. Access the tools you need for your tasks from the Icon
bars or the Tooldocks (see Tooldocks on page 2-9 and Icon bars on page 2-9).
Resize the different workspace windows by moving the mouse cursor over their respective window borders. The cursor will change to a resize cursor indicating by its shape the directions in which you can drag it to resize the workspace window.
Clicking inside a workspace window will mark it as currently selected workspace window. This is indicated by the blue frame around the selected workspace window.
Each workspace window is decorated with a set of controls allowing you to modify the content or the behavior of a workspace window. For an over-view of the available controls see Table 2-1: Workspace Window Controls on page 2-1.
Option Icon Description. . . . . . . . . . . . . . . . . . . . . . . . . . . . . . . . . . . . . . . . . . . . . . . . . . . . Toggle fullscreen state
Toggle fullscreen state of respective window
Focus selected object
Focus on selected object
Reset zoom Resets zoom of 2D windowZoom in Zoom into 2D windowZoom out Zoom out of 2D windowLock slice posi-tion
Locks the slice position.
Set brightness Set the Level/Window (aka Brightness/Con-trast) values for the 2D windows
Original display mode
Select original color mode to display the slice image in its original, brightness and contrast settings.
Color mode/ Color and Opacity mode
Switch between Color mode and Color and Opac-ity mode.
. . . . . . . . . . . . . . . . . . . . . . . . . . . . . . . . . . . . . . . . . . . . . . . . . . . . TABLE 2-1: WORKSPACE WINDOW CONTROLS
T

WO R K S P A C E3D Window
2-2 myVGL Manual Release 2.0
2
. . . . . . . . . . . . . . . . . . . . . . . . . . . . . . . . . . . . . . . . . . . . . . . . . . . . 3D Window
The 3D window shows the result image of the rendering process. Specify rendering parameters for voxel data sets with the Volume Rendering tool (see Volume Rendering tool on page -1). Specify rendering parameters for polygonal models with the Polygon Rendering tool (see chapter Polygon Ren-dering tool).
The coordinate system tripod in the lower left corner of the 3D window indi-cates the orientation of the currently chosen coordinate system. Select a coordinate system from the Coordinate system icon bar to change the cur-rently selected coordinate system.
Object se lect ionIf you select an object in the Scene Tree (and it is chosen to be visible by activating the checkbox in front of it), the corners of a box surrounding it will be shown in the 3D window. Most of these corners will be bright red if you are in the Rotate mode and bright green if you are in Move mode. The lines that are not in that respective color represent the x (dark red), y (dark green) and z (blue) axes of the object’s coordinate system.
Tips and tricks You can also select an object by double-clicking onto it in the 3D window with the left mouse button. By holding down <Ctrl> while doing so you, you can select multiple objects. Double-Click the background to deselect all objects.
Move / Rotate modeThere are two basic modes for the 3D window: The Rotate mode and the Move mode. Choose a mode by clicking the respective icon in the icon bar
, by choosing the respective entry from the Object menu or by using the <Ctrl>+<Shift>+R / <Ctrl>+<Shift>+M shortcuts.
Create/replace clipping plane
Create/replace a clipping plane based on the current slice view.
4/2/1 pixels per ray
Specify the amount of downsampling in the 3D window.
Freeze render-ing
Enable/disable the rendering process.
Center and Focus camera
Centers the selected objects and makes them fully visible.
Option Icon Description. . . . . . . . . . . . . . . . . . . . . . . . . . . . . . . . . . . . . . . . . . . . . . . . . . . .
. . . . . . . . . . . . . . . . . . . . . . . . . . . . . . . . . . . . . . . . . . . . . . . . . . . . TABLE 2-1: WORKSPACE WINDOW CONTROLS
. . .
. .WO R K S P A C E3D Window
Release 2.0 myVGL Manual 2-3
Tips and tricks You can also switch between the Rotate mode and the Move mode by double-clicking into the 3D window with the middle mouse button.
. . . . . . . . . . . . . . . . . . . . . . . . . . . . . . . . . . . . . . . . . . . . . . . . . . . . M O V E M O D E
When in Move mode, drag the selected object by using the left mouse but-ton. To move the object in smaller steps, hold <Ctrl> while doing so.
Hold down the middle mouse button and move the mouse up or down to zoom into or out of the scene.
Tips and tricks If you want to zoom in on a specific point of the object, position the mouse pointer over it, hold <Ctrl> and rotate the mouse wheel.
Hold down <Shift> in Move mode to move the object along either the vertical or horizontal direction of the 3D window image plane.
. . . . . . . . . . . . . . . . . . . . . . . . . . . . . . . . . . . . . . . . . . . . . . . . . . . . R O T A T E M O D E
When in the Rotate mode, left-click the selected object, hold it and move the mouse to rotate the object into the respective direction. To rotate the object in smaller steps, hold <Ctrl> while doing so.
Hold down the middle mouse button and move the mouse up / down to rotate the object clockwise / counter-clockwise.
Hold down <Shift> in Rotate mode to rotate the object along either the vertical or horizontal direction of the 3D window image plane.
An object will always be rotated around its center: see Center in chap-ter Transform tool on page 14-2.
Warning An object can only be transformed (i.e. moved/rotated) within the scene if it is unlocked in the Scene Tree. If it is locked, you will transform the camera instead. If there is only one object visible, you might not notice a difference between the two cases, but it becomes important when there are multiple objects involved, when you perform measurements or when you are in the Scene coordinate system.
You can also transform objects through keyboard input: See chapter Trans-form tool.
PreviewThe Preview factor is a reduction factor by which the rendering of voxel data sets is reduced while manipulating a scene. Higher reduction factors

WO R K S P A C EContext menu of 3D window
2-4 myVGL Manual Release 2.0
2
will lead to a smoother interaction. This is especially helpful on computers with a low overall performance.
4 / 2 / 1 p ixe ls per raySpecify if you want to render every 16th, every 4th or every pixel. The former option leads to the fastest rendering, the latter to the most accurate.
Freeze render ingClick this button to stop rendering of your object. This can be useful if you want to make changes to your data without showing the results in the 3D window after each step.
Center and focus cameraClick this button to center the currently selected object and make it become fully visible within the 3D window.
Toggle fu l lscreen stateToggle the fullscreen mode of this window.
Tips and tricks You can also use the F11 key to toggle the fullscreen mode.
. . . . . . . . . . . . . . . . . . . . . . . . . . . . . . . . . . . . . . . . . . . . . . . . . . . . Context menu of 3D window
Right-click anywhere in the 3D window to access its context menu.
Annotat ionsIn this submenu, you can Minimize, Maximize or automatically Arrange anno-tations. You can also Configure the settings for this.
Freeze render ingStops the rendering process.
Tr ipod/Box > Show t r ipodToggles the display of the coordinate system tripod.
Tr ipod/Box > Show boxToggles the display of the grid box of the coordinate system with tick marks.
Tr ipod/Box > Conf igureBrings up the preference dialog for the coordinate system display.

. . .
. .WO R K S P A C E2D Windows
Release 2.0 myVGL Manual 2-5
Cl ipping > Create c l ipping planeCreates a clipping plane, see Clipping plane on page 13-1
Cl ipping > Create c l ipping boxCreates a clipping box, see Clipping box on page 13-2
Cl ipping > Create a l igned cl ipping boxCreates an aligned clipping box, see Aligned clipping box on page 13-2
Text over lay > Defaul t / PresetEither select the Default text overlay preset or a user defined text overlay preset.
Text over lay > Conf igure . . .Shows the Configure text overlay dialog see chapter Text Overlay Editor
Background colorDisplays a dialog window in which you can choose whether you want the background of the 3D window to be a single color, a horizontal or a vertical gradient and lets you pick the respective color(s).
ResetResets all transformations applied to the selected object.
Copy to c l ipboardCopy a screenshot of the 3D window to the clipboard.
Proper t iesDisplays information about the selected object. For more information, please refer to Properties on page 12-4 in chapter Scene Tree tool
. . . . . . . . . . . . . . . . . . . . . . . . . . . . . . . . . . . . . . . . . . . . . . . . . . . . 2D Windows
The 2D windows show slices of the currently visible objects as seen from the Front (along the y-axis), Top (along the z-axis), respectively Right (along the x-axis) of the current coordinate system.
Voxel data is shown in gray values, whereas polygonal models, ROIs and selections are displayed as colored outlines in the 2D windows.
You can scroll through sections in a certain direction by scrolling the mouse wheel while the mouse pointer is in the respective window or by changing the value in the text box in the lower left corner of the 2D win-dow.
WO R K S P A C E2D Windows
2-6 myVGL Manual Release 2.0
2
Use the scroll bars below and on the right hand side of each 2D window to move the content of the window.
Tips and tricks Using the middle mouse button, you can also drag the slice view around in the window.
Focus se lected objectBy clicking this button, you can center the slice view of the selected object in the 2D window.
Reset zoomUse this button to reset the zoom of the 2D window.
Zoom in / outUse these buttons to zoom into or out of the respective 2D window.
Tips and tricks If you want to zoom in on a specific point of the object, position the mouse pointer over it, hold <Ctrl> and rotate the mouse wheel.
Lock s l ice posi t ionLocks the slice position for this 2D window. That means that for example moving the Navigation cursor will not cause this 2D window to switch to the respective slice. However, it is possible to modify the slice position delib-erately by entering a value in slice position spin box.
Set br ightnessThis feature can be enabled/disabled in the Preferences: see General in chapter Edit menu on page 4-2
Click this button, if you are in Original display mode or Color mode. The Level/Window settings are set for a selected object in the 2D view.
A window appears in which you can specify the Level/Window (i.e. Bright-ness/Contrast) values for the 2D windows.Click the button to reset the Level/Window values for the selected object. Click the button to disable Brightness/Contrast rendering completely (The brightness button is shown crossed-out). Click the button to accept the Level/Window values and close the settings window.
Tips and tricks You can also hold down the left mouse button over a 2D window and move it vertically to modify the Level values and horizontally for the Window values.

. . .
. .WO R K S P A C EContext menu of 2D window
Release 2.0 myVGL Manual 2-7
Origina l d isplay modeToggle between displaying the slice images in their original brightness, contrast and color settings and showing them in the settings specified in Display mode.
Color mode / Color and Opaci ty modeChoose which of the user-defined Volume Rendering settings you want the 2D windows to display: only the colors or the colors and the opacity set-tings.
Create c l ipping p laneClick this button create a clipping plane aligned to the view represented by the selected 2D window. Use this to orientate yourself within the 3D win-dow or to show the interior of the object at the current slice position.
Toggle fu l lscreen stateToggle the fullscreen mode of this window.
Tips and tricks You can also use the F11 key to do so.
. . . . . . . . . . . . . . . . . . . . . . . . . . . . . . . . . . . . . . . . . . . . . . . . . . . . Context menu of 2D window
If you right-click anywhere in the 2D window, you can access its context menu.
Zoom > Zoom in /outZooms into or out of the 2D window.
Zoom > Fi t object to windowBy clicking this button, you can center the slice view of the selected object in the 2D window.
Zoom > F i t scene to windowBy clicking this button, you can center the slice view of the whole scene in the 2D window.
Zoom > ResetResets the zoom settings.
Coordinate systemHere you can specify a reference coordinate system for the respective 2D window. Other 2D windows will not be affected by this choice. Select Fol-
WO R K S P A C EContext menu of 2D window
2-8 myVGL Manual Release 2.0
2
low global coordinate system to reference the coordinate system active in the Coordinate system icon bar.
Display mode Choose if you want the display of the 2D windows in original settings, overlaid with colors defined in the Volume Rendering Tool or overlaid with both colors and opacity settings defined in the Volume Rendering Tool. See Display mode on page 9-3 in chapter Window menu.
Sl ice step widthHere, you can define the step width to be used when scrolling through slices in the 2D views. It is only active when you are not in a “Grid of ...” coordinate system.
Level /Window modeHere you can toggle the Set Brightness window. For further information please see Set brightness on page 2-6.
BackgroundSet the background color of the 2D windows here.
Annotat ionsIn this submenu, you can Minimize, Maximize or automatically Arrange anno-tations. You can also Configure the settings for this.
Text over lay Here you can toggle the display of text information (Show text overlay), choose from different Text Overlay presets and Configure those presets.
Cl ipping > Create c l ipping planesee Create clipping plane on page 2-7
In terpolat ion modeHere you can choose if you want myVG L 2 . 0 to always (On) interpolate between voxels, never (Off) or decide automatically when to do so.
Tr ipod over lay > Show t r ipodToggles the display of the coordinate system tripod.
Tr ipod over lay > Conf igureShows the preference dialog for the coordinate system display.
ResetResets all transformations applied to the selected object.

. . .
. .WO R K S P A C ETooldocks
Release 2.0 myVGL Manual 2-9
Copy to c l ipboardCopy a screenshot of the active window to the clipboard.
Proper t iesDisplays information about the selected object. For more information, please refer to Properties in chapter Scene Tree tool on page 12-4.
. . . . . . . . . . . . . . . . . . . . . . . . . . . . . . . . . . . . . . . . . . . . . . . . . . . . Tooldocks
The Tooldock, per default on the right hand side of the workspace, is used to dock tools. You can minimize the tools, close them or have them free floating over the workspace by clicking the respective icons in their upper right corner. You can arrange the tools in an arbitrary order by dragging & dropping non-minimized tools.
You can open further tool docks below or on the left hand side of the work-space by simply dragging & dropping tools there.
Due to their format, most tools can only be put in vertical tooldocks.
You can resize tooldocks or hide them completely by clicking the border between them and the workspace and moving them into the desired direc-tion.
. . . . . . . . . . . . . . . . . . . . . . . . . . . . . . . . . . . . . . . . . . . . . . . . . . . . Icon bars
The icon docks are used to dock icon bars. Icon bars consist of one or more icons that represent shortcuts to functions most of which are otherwise accessible via the menus. You can distribute icon bars in icon docks. Per default, there is only one icon dock at the top of the workspace. You can however open further icon docks below, on the left or right hand side of the workspace: Simply drag and drop an icon bar there.
By right-clicking an icon dock, you can choose which icon bars should be visible and which not by checking or unchecking the boxes in front of them.
Tips and tricks Once you are done organizing the icon bars, you can right-click the respective icon docks and choose Line up to align the icon bars without gaps.

WO R K S P A C EIcon bars
2-10 myVGL Manual Release 2.0
2
Display uni tIn the icon dock you can find the Display unit toolbar. You can use this to select the unit in which to display length, area and volume values. Set addi-tional parameters about units via Edit > Preferences.

Release 2.0 myVGL Manual 3-1
. . . . .
. . . . . . . . . . . . . . . . . . . . . . . . . . . . . . . . . . . . . . . . . .FILE MENU 3
he File menu of myVG L 2 . 0 provides basic features for loading projects as well as for saving images or image stacks. Thus the File menu allows you to handle the two basic file types: object files and
project files (and folders).
• Object filesThese files contain voxel data representing your real object, basically the output of the CT-scanner (after scanning and reconstruction) or some other device, or contain other data representing your real object, such as poly-gons.
The number of files per object varies. You might have one file containing the whole object (volume file formats) or an image stack (e.g., bitmaps or tiffs) where each file represents one slice of the scanned object. Scanner settings and additional information might be included in the data files or in separate files.
• Project files (and folders).vgl files contain basic information on the project including references to the object files and supplementary files belonging to the project. For sup-plementary files a project folder will be created as a subdirectory of the directory in which you saved the .vgl file.
Warning A .vgl file must always be accompanied by the project folder and the file(s) containing the object(s). You cannot open a .vgl file without the associated project folder, and you cannot load an object into the scene without the files containing the object data.
.vgl files and project folders replace the .vgi files of earlier versions of myVG L containing the scene.
The project will include references to all imported objects, modifications such as rotation, opacity settings and analysis results. Items in the Scene Tree (see chapter Scene Tree tool) like light sources or measurement fea-tures are saved as well as the layout of the 3D and 2D windows.
A scene can contain one or multiple objects. You can work with only one project at a time.
See Table 3-1: File menu options for a list of File menu options, to be described in the following. Menu entries currently not available are dis-
T

F I L E M E N UNew
3-2 myVGL Manual Release 2.0
3
abled and displayed in gray (e.g., saving is only possible after loading a project or an object).
. . . . . . . . . . . . . . . . . . . . . . . . . . . . . . . . . . . . . . . . . . . . . . . . . . . . New
Choose this option if you want to exit the current project and create a new empty scene. You would typically proceed by opening a project or a scene.
. . . . . . . . . . . . . . . . . . . . . . . . . . . . . . . . . . . . . . . . . . . . . . . . . . . . Open.. .
Opens a project saved in a .vgl file (or scene saved in a .vgi file). You can either open the file including the analyses, material settings etc., or load just a single volume from the file. If you open a .vgl file (or a .vgi file), make sure the project directory and object file(s) are available as well.
.vgl files are used for projects in myVG L 2 . 0 , but you can also read scenes from .vgi files which were used by previous versions of myVG L .
Throughout the entire open process, defaults will be set to the values you specified in the last process or, where applicable, to information automati-cally retrieved from the files (such as resolution which is included in some file formats).
Tips and tricks During the whole open process, myVG L will scan the data file(s) (e.g., to provide you with default values and a preview). Copy the files to your local harddisk to speed up the process as well as to avoid problems caused by networking or CD/DVD drive lags.
Option Icon Description. . . . . . . . . . . . . . . . . . . . . . . . . . . . . . . . . . . . . . . . . . . . . . . . . . . . New Create a new projectOpen... Open a complete scene (or a single volume)Save image(s)...
Save selected views (e.g., slice views) as images(several format options)
Save AVI/image stack
Save selected visible items of the scene into an image stack or .avi file
Print image(s)... Print selected views (e.g., slice views) as images
Quit Exit the application. . . . . . . . . . . . . . . . . . . . . . . . . . . . . . . . . . . . . . . . . . . . . . . . . . . . TABLE 3-1: FILE MENU OPTIONS

. . .
. .F I L E M E N UOpen...
Release 2.0 myVGL Manual 3-3
A sophisticated import wizard will lead you through the open process (see Open options on page 3-3) of volume data.
If the wizard has gathered enough information about the volume to be imported, it can display the Memory needed to load the data based on the specifications so far and the Memory available on your system. If the mem-ory needed exceeds the memory available, the field will be highlighted in red. Reduce the amount of data by mapping to a “smaller” data type, by applying a region of interest or a skip factor.
Warning Although you can load and display an object if the memory available is larger than the memory needed, analysis tasks require additional memory.
These options will be available during the open process and are explained below (see Open options on page 3-3) in the sections for the respective dia-logs. The memory values will be updated continuously.
Open opt ionsDepending on the file(s) you want to open and the options you specified so far, the myVG L import wizard will show you a series of dialogs. The dialogs and their options are explained below. Note that you will only see the dia-logs relevant to your object.
Tips and tricks After selecting a file , you can see the content of that file in the preview window on the left hand side of the import wizard.
. . . . . . . . . . . . . . . . . . . . . . . . . . . . . . . . . . . . . . . . . . . . . . . . . . . . O P E N P R O J E C T
This option will open the complete file, including analyses, material set-tings, reference objects etc.
. . . . . . . . . . . . . . . . . . . . . . . . . . . . . . . . . . . . . . . . . . . . . . . . . . . . I M P O R T S I N G L E V O L U M E
This option loads a single volume from the file, either completely or using a specified region of interest (ROI).
. . . . . . . . . . . . . . . . . . . . . . . . . . . . . . . . . . . . . . . . . . . . . . . . . . . . L O A D S C E N E
You can apply the Resolution reduction (skip) option to be able to load a very large object into a low capacity system.
Warning Applying a skip factor will reduce the resolution of the voxel data and thus lead to significantly less accurate analysis results.
Specify the number of voxels to be skipped in the respective direction. A skip rate of 0 applies no skipping. A skip rate of 1 for one axis will load

F I L E M E N UOpen...
3-4 myVGL Manual Release 2.0
3
only every other slice so that the memory needed is reduced by half. A skip rate of 5 will skip 5 slices, load one slice, then again skip 5 slices etc.
You can also reduce the memory needed by specifying the analyses you want to load. The Included analyses list shows all analyses of the project as well as the memory needed to load them. Deactivate the Load? checkbox for all analyses you don’t want to load.
. . . . . . . . . . . . . . . . . . . . . . . . . . . . . . . . . . . . . . . . . . . . . . . . . . . . F I L E S E L E C T I O N
Choose the volume you want to open from the list.
. . . . . . . . . . . . . . . . . . . . . . . . . . . . . . . . . . . . . . . . . . . . . . . . . . . . L O A D A S . . .
Several parameters determine how the data shall be loaded. For example, the type of data loaded can be different from the type stored on disk. The dialog will show you only the parameters applicable to your data.
Specify the voxel size in the resolution part of the dialog. Some data formats provide this information automatically. In this case the input field will be disabled and show the given numbers, you can correct/modify those num-bers if you activate the Override resolution checkbox.
If the data has significant differences (e.g., factor 3 or more) in voxel size for x, y, and z, the resulting pictures will show elongated steps in the respective dimension. In order to improve the visual appearance, you can activate the Force isotropic resampling checkbox. myVG L will then interpolate intermediate slices.
You can import data sets with varying slice distances. If the object has been scanned with small slice distances but in certain areas only, the resolution has wide differences. In this case you would probably not want to resample the data set. Use the option No slice interpolation beyond... . Slice distances larger than the number specified will not be padded with interpolated slices.
Warning Forcing isotropic resampling might change analysis results. Use this option only if you want to optimize the visual presentation of the data for creating screenshots, avi files etc.
Use the Data range mapping area to specify the interval of original gray val-ues to be imported and the interval they shall be mapped to. This interval must not exceed the number of gray values of the data type (to be specified in the same dialog). Voxels with gray values outside the interval will also be imported, but with assigned gray values inside the interval. The assigned gray value depends on the mapping specified, see Table 3-3: Gray value
. . .
. .F I L E M E N UOpen...
Release 2.0 myVGL Manual 3-5
handling on page 3-6. As an alternative, you can specify the intervals in the histogram.
Click the Histogram button to open another window showing the gray values and their numbers of occurrences. For details, see Histogram (Import) on page 3-7.
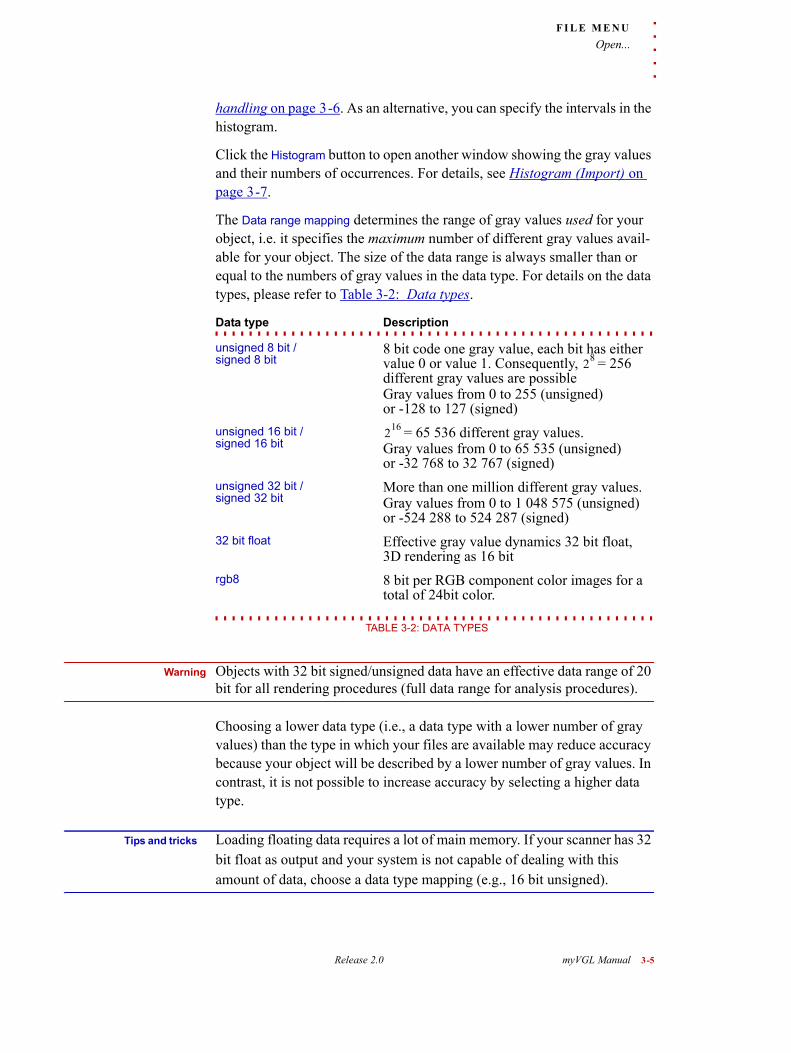
The Data range mapping determines the range of gray values used for your object, i.e. it specifies the maximum number of different gray values avail-able for your object. The size of the data range is always smaller than or equal to the numbers of gray values in the data type. For details on the data types, please refer to Table 3-2: Data types.
Warning Objects with 32 bit signed/unsigned data have an effective data range of 20 bit for all rendering procedures (full data range for analysis procedures).
Choosing a lower data type (i.e., a data type with a lower number of gray values) than the type in which your files are available may reduce accuracy because your object will be described by a lower number of gray values. In contrast, it is not possible to increase accuracy by selecting a higher data type.
Tips and tricks Loading floating data requires a lot of main memory. If your scanner has 32 bit float as output and your system is not capable of dealing with this amount of data, choose a data type mapping (e.g., 16 bit unsigned).
Data type Description. . . . . . . . . . . . . . . . . . . . . . . . . . . . . . . . . . . . . . . . . . . . . . . . . . . . unsigned 8 bit / signed 8 bit
8 bit code one gray value, each bit has either value 0 or value 1. Consequently, = 256 different gray values are possible Gray values from 0 to 255 (unsigned) or -128 to 127 (signed)
unsigned 16 bit / signed 16 bit
= 65 536 different gray values. Gray values from 0 to 65 535 (unsigned) or -32 768 to 32 767 (signed)
unsigned 32 bit / signed 32 bit
More than one million different gray values.Gray values from 0 to 1 048 575 (unsigned) or -524 288 to 524 287 (signed)
32 bit float Effective gray value dynamics 32 bit float, 3D rendering as 16 bit
rgb8 8 bit per RGB component color images for a total of 24bit color.. . . . . . . . . . . . . . . . . . . . . . . . . . . . . . . . . . . . . . . . . . . . . . . . . . . .
TABLE 3-2: DATA TYPES
28
216

F I L E M E N UOpen...
3-6 myVGL Manual Release 2.0
3
Select an option to determine how values outside the interval shall be han-dled. As a default, gray values below the lower interval limit will be set to the value of the lower interval limit, gray values higher than the upper interval limit will be set to the value of the upper interval limit. This is the option Ramp. The options are listed in Table 3-3: Gray value handling.
You can use this option to invert the data. If your data has low gray values for material and high gray values for air so that you would see black mate-rial and white air, apply the Inverse Ramp to see white material and a black background.
Click the Preview button for 2D previews of your object. The preview is also available in the following steps. For details, see Preview (Import) on page 3-8.
. . . . . . . . . . . . . . . . . . . . . . . . . . . . . . . . . . . . . . . . . . . . . . . . . . . . R O I A N D S K I P S E L E C T I O N
This dialog offers options to reduce the memory needed to load the object.
The scanned object will usually be surrounded by air. Reducing (but not eliminating) the surrounding air by applying a Region of Interest (ROI) reduces the memory needed. Only the slices from Min to Max (in x, y, and z direction) will be imported. Use the Preview for graphically supported ROI specification (see Preview (Import) on page 3-8 and How to define a ROI graphically in the preview on page 3-9).
Warning Do not apply a ROI directly on the object’s surface or even cutting into the object. This would destroy the partial volume effect and thus cause imprecise measurement results. Make sure to import the object including some surrounding air.
If your object is surrounded by a large number of background (air) voxels, applying a ROI reduces the memory needed very efficiently without nega-
Option ShapeLower gray values will be set to:
Higher gray values will be set to:. . . . . . . . . . . . . . . . . . . . . . . . . . . . . . . . . . . . . . . . . . . . . . . . . . . .
Ramp lower interval limit upper interval limit
Inverse Ramp
upper interval limit lower interval limit
Sawtooth lower interval limit lower interval limit
Inverse Sawtooth
lower interval limit lower interval limit
. . . . . . . . . . . . . . . . . . . . . . . . . . . . . . . . . . . . . . . . . . . . . . . . . . . . TABLE 3-3: GRAY VALUE HANDLING

. . .
. .F I L E M E N UOpen...
Release 2.0 myVGL Manual 3-7
tive effects on the quality. In other cases you might have to apply the Skip option to be able to load a very large object into a low capacity system.
Warning Applying a skip factor will reduce the resolution of the voxel data and thus lead to significantly less accurate analysis results.
Specify the number of voxels to be skipped in the respective direction. A skip rate of 0 applies no skipping. A skip rate of 1 for one axis will load only every other slice so that the memory needed is reduced by half. A skip rate of 5 will skip 5 slices, load one slice, then again skip 5 slices etc.
. . . . . . . . . . . . . . . . . . . . . . . . . . . . . . . . . . . . . . . . . . . . . . . . . . . . M A N I P U L A T I O N
You can swap or mirror axes in order to display the object in a preferred or real-world orientation.
Mirror axes will mirror the object along the chosen axis or axes (e.g., activat-ing the checkbox for the x-axis will place the voxel with the highest value for x at the origin of the x-axis). You can choose more than one axis to mir-ror.
Swap axes will change the axes in the coordinate system so that instead of xyz, the coordinates will be interpreted in the chosen sequence (e.g., choos-ing xzy instead of xyz will keep the position on the x-axis but change the y coordinate to z and vice versa. The result is a rotation by 90° around the x-axis followed by a mirroring along the y-axis).
Histogram ( Import )Click the Histogram button in the Load as dialog to open another window. The Histogram tab displays the number of occurrences of each gray value in the object as a diagram. The gray values of the object’s voxels are given on the axis of abscissae. The number of voxels with each gray value are given on the axis of ordinates. The dark gray area in the background of the dia-gram shows the number of occurrences of each gray value.
The histogram contains two vertical red lines, initially positioned at the very left and the very right of the diagram. Each red line is labeled with two numbers, the first indicating the gray value at the current position of the line, the second shows how many voxels in the object are of this gray value.
You can move the red lines by left-clicking them. Shift them left or right while holding the left mouse button pressed. Shifting a line to a new posi-tion will adapt the value in the Data range mapping area of the Load as dialog and vice versa. You can also change the ramp type in the Load as dialog while the Histogram is displayed.

F I L E M E N UOpen...
3-8 myVGL Manual Release 2.0
3
Use either of the methods to define an interval of significant gray values, i.e., the interval in which there is a high probability of gray values varying in accordance with a variation of the material. A typical histogram has one peak for each material in the data set plus one peak for the air. Make sure not to cut out any of those peaks. Always keep the air peak, myVG L needs surrounding air for the interpretation of the partial volume effect which is the basis for analysis results.
The Calibration tab allows you to perform a gray value calibration within the import process. Here you can dynamically select material and background gray values and assign them to destination gray values. Select either the Define background button or the Define material button. Move your mouse cursor over the preview window. Hold down the left mouse button and move the mouse to create a selection rectangle. The area inside the rectan-gle is considered for either background or material selection. By pressing the Apply button the acquired values are applied to the data range mapping on the Load as dialog.
Preview ( Import )The Preview button is available in a number of import dialogs. Click this button for 2D previews and projections of your object in order to:
• Control the parameters specified so farIf you only see black and white stripes or a grainy image, check the data type and/or size specified earlier.
• Define a Region of Interest (ROI)Modify the ROI settings by adapting the blue frame in the slice preview or one of the projections. For detailed instructions, see How to define a ROI graphically in the preview on page 3-9. You can also modify the settings in the dialog ROI and Skip selection (see ROI and Skip selection on page 3-6).
Click the tabs to select one of the views. The following views are available:
1 Slice Preview (top/right/front)
The main area of the Preview tab shows a single slice of your object. Spec-ify the slice number in the lower left input field by using either the number keys, arrow keys or the mouse.
Choose the axis along which to slice by clicking the buttons:
• Button T for top perspective
• Button R for right perspective
• Button F for front perspective
You can enhance the contrast automatically:

. . .
. .F I L E M E N USave image(s)...
Release 2.0 myVGL Manual 3-9
• Button C for auto contrast
By default, the preview will be rendered taking into account the data range settings (see Histogram (Import) on page 3-7). Activating auto contrast will analyze the data set and apply a ramp mapping to the data range cov-ered by the voxels in the current slice.
2 Projection preview (top/right/front)
Click the Top projection tab for a projection along the z-axis. All xy-planes of your object will be projected into one 2D view.
Click the Right projection tab for a projection along the x-axis. All yz-planes of your object will be projected into one 2D view.
Click the Front projection tab for a projection along the y-axis. All xz-planes of your object will be projected into one 2D view.
. . . . . . . . . . . . . . . . . . . . . . . . . . . . . . . . . . . . . . . . . . . . . . . . . . . . Save image(s). . .
Captures your current workspace area into an image. The Views area dis-plays the currently available workspace windows. By clicking the check-box beside each entry you can select the window to be taken into account for the final image. The Preview area shows the screenshot so far.
The Decorations area contains options for displaying additional information within the screenshot. By choosing the option show logo in headline you can define a custom logo that will appear above the headline specified inside the headline text field. By selecting show legend, the current slice position, the
HOW TO DEFINE A ROI GRAPHICALLY IN THE PREVIEWIf the scanned area contains a lot of background, importing the full data set would result in unnecessarily high memory consumption. To reduce memory load, define a Region of Interest (ROI) to be imported.
A ROI defined during import is always a cuboid. The maximum size for a ROI is the size of the scanned area.
You can define a ROI based on numerical input in a dialog (see ROI and Skip selection on page 3-6) or graphically in the preview (see Preview (Import) on page 3-8). Here, the graphical approach will be explained.
In any of the four preview tabs (slice preview, top/right/front projection), use the mouse to resize or move the blue frame surrounding the scanned area. If the blue
frame is not visible, use the +/- buttons and the scrollbars to adjust the view.
Resizing Left-click a corner or an edge of the blue frame surrounding the scanned area and draw the mouse pointer.
Moving Left-click into the area surrounded by the blue frame and draw the mouse pointer. You can only move the frame if the ROI is smaller than the scanned area.
Any modifications are always valid for all slices along the chosen axis.
The ROI should preferably be controlled in the projection views to ensure the full extent of the object is visible. Modifying the ROI in a single slice might accidentally cut off protruding parts of your object visible only in other slices.

F I L E M E N USave AVI/image stack ...
3-10 myVGL Manual Release 2.0
3
current coordinate system and the window type will be attached below the image for the respective window.
The Overlays area gives you the option to enable/disable graphical overlays like analyses results, reference objects, the isosurface and measurements. This does not influence the objects in your scene. Disabling for example the measurements will only disable them within the screenshot.
Within the Custom image size area you can specify an image size differing from the suggested one. Image width and height can be coupled to keep a reasonable aspect ratio for the image. The dpi value controls the size of han-dles, fonts and other display-relative elements. You can use it to save images at higher resolutions and still retain the proportions of these ele-ments.
Tips and tricks If you select only one window within the Views area, you can change the image width and height parameters independently from each other by clicking the lock/unlock button to the right of the width/height input fields.
Supported formats:
• Bitmap (*.bmp)
• JPEG (*.jpg)
• JPEG2000 (*.jp2)
• Portable Pixmap (*.ppm)
• Tiff (*.tif)
. . . . . . . . . . . . . . . . . . . . . . . . . . . . . . . . . . . . . . . . . . . . . . . . . . . . Save AVI/ image stack . . .
Saves the slices of one of the 2D views into an AVI movie or an image stack.
Select the 2D view to specify the orientation. The images will be created parallel to this view.
Select Display mode to specify the coloring of the resulting image (for details on display modes see Display mode in chapter Window menu on page 9-3).
The Overlays area gives you the option of enabling/disabling graphical overlays like analyses results, reference objects, the isosurface and mea-surements. This does not influence the objects in your scene. Disabling for example the measurements will only disable them within the screenshot.
Define the resulting Image size (in pixels). By clicking on the button to the right of the width/height parameters you can specify whether the image
. . .
. .F I L E M E N UPrint image(s)...
Release 2.0 myVGL Manual 3-11
size should be scaled uniformly or not. If uniform scaling is activated, changing the width will change the height of the image in proportion to the width (and vice versa). A larger image size leads to a better resolution.
The Boundary option allows you to define an additional offset applied to the original image. It does not change the image size, instead it enables you to zoom into or out of the current viewport.
The Stack settings specify the number of slices and the slice distance in the given unit. The stack settings apply to the complete data set in the current orientation. Modifying the number of slices will recalculate the slice dis-tance and vice versa:
The Slice range parameters specify the part of the slices to be exported. The slices will be resampled, applying the stack settings such that one of the slices will be positioned at the start value. The end value specifies the upper boundary of the slices. The first slice to be exported is defined by the start value, the second slice is at position (start value + slice distance).
You can also set the start and end values by navigating to the desired posi-tion in the Preview and clicking the s for start or e for end. If the end slice has a lower value than the start slice, the values will be swapped.
Modifying the Slice range will change the number of slices but not the slice distance. The number of slices and distance parameters specify how fine the data should be sampled within the given Slice range.
Supported formats:
• Bitmap (*.bmp)
• JPEG (*.jpg)
• JPEG2000 (*.jp2)
• Portable Pixmap (*.ppm)
• Tiff (*.tif)
• AVI movie (*.avi)
. . . . . . . . . . . . . . . . . . . . . . . . . . . . . . . . . . . . . . . . . . . . . . . . . . . . Print image(s). . .
Send a snapshot of the current workspace for documentation purposes to a printer. Select the 2D/3D views to be included into the image. Configure the image by adding Decorations (logo, legend, headline). Your company logo can be included if you activate show logo in headline. Specify a com-pany logo file by clicking the icon next to the field. This will open a file dialog. Add Overlays as needed (analyses, reference objects, measurements, isosurface). See also Save image(s)... on page 3-9.
distance number of slices 1–( )× height of complete data set=

F I L E M E N UQuit
3-12 myVGL Manual Release 2.0
3
. . . . . . . . . . . . . . . . . . . . . . . . . . . . . . . . . . . . . . . . . . . . . . . . . . . . Quit
Close the application.

Release 2.0 myVGL Manual 4-1
. . . . .
. . . . . . . . . . . . . . . . . . . . . . . . . . . . . . . . . . . . . . . . . .EDIT MENU 4
hrough the Edit menu of myVG L you can access the undo/redo and cut/copy/paste functions. The menu also enables you to edit general application settings.
Table 4-1: Edit menu options lists the menu entries with a brief descrip-tion. They will be explained in detail later in this chapter.
. . . . . . . . . . . . . . . . . . . . . . . . . . . . . . . . . . . . . . . . . . . . . . . . . . . . Undo / Redo
Most actions can be undone (and then redone to reestablish the situation before undo). Actions which change the underlying data or otherwise require a lot of memory (e.g., filtering) may not be available for undo/redo.
The amount of memory allocated for the undo queue can be set by editing the Preferences as described later in this chapter (see Preferences on page 4-2). Should the last issued command require more storage space within the undo queue than currently available, then myVG L will start eras-ing entries in the queue beginning with the oldest command in the queue and proceed chronologically until enough storage space becomes available. If a command requires more space than is available for the undo queue, then the command will not be stored and the current command history is erased.
If you think you might want to undo an action which requires a lot of mem-ory, save desired images or image stacks prior to the action.
Option Icon Description. . . . . . . . . . . . . . . . . . . . . . . . . . . . . . . . . . . . . . . . . . . . . . . . . . . . Undo Undo the latest action/commandRedo Redo the latest action/commandClear undo queue
Delete all entries stored in the undo queue
Delete Remove the currently selected object(s) from the scene (with partial buffering, see Undo/Redo)
Preferences...(+ dialogs)
Set general application parameters and options
. . . . . . . . . . . . . . . . . . . . . . . . . . . . . . . . . . . . . . . . . . . . . . . . . . . . TABLE 4-1: EDIT MENU OPTIONS
T
E D I T M E N UClear undo queue
4-2 myVGL Manual Release 2.0
4
. . . . . . . . . . . . . . . . . . . . . . . . . . . . . . . . . . . . . . . . . . . . . . . . . . . . Clear undo queue
The command history of the current myVG L 2 . 0 session is stored in the undo queue. Clear undo queue will erase the accumulated command history. The command history will be erased automatically if an action requires more memory than is available to the undo queue.
. . . . . . . . . . . . . . . . . . . . . . . . . . . . . . . . . . . . . . . . . . . . . . . . . . . . Delete
Deletes the selected object(s) from the scene. The object(s) can be (par-tially) restored using Edit > Undo. Analysis results (e.g., from a wall thick-ness analysis) are not restored.
. . . . . . . . . . . . . . . . . . . . . . . . . . . . . . . . . . . . . . . . . . . . . . . . . . . . Preferences
Set general application parameters and options according to your prefer-ences. These settings apply to myVG L in general and not only to a specific project.
You can save these settings as presets in order to load them at a later time. Presets can also be deleted, exported and imported.
General
. . . . . . . . . . . . . . . . . . . . . . . . . . . . . . . . . . . . . . . . . . . . . . . . . . . . G E N E R A L
• Dump core fileSpecify if a core dump should be executed if the program terminated unex-pectedly.
• Print / Save image(s)Specify if changes in the Save image(s) dialogue should be saved.
• UndoSpecify how much memory can be used by the Undo function.
• Rendering settings for imported dataSpecify which rendering algorithm and if shadows are to be used by default.
• Slice windowIf you choose Medical mode, the slices in the 2D window showing the xy-plane are looked upon from the Bottom instead from the Top. This only becomes effective if the window is in one of the standard layouts.
The Level/Window mode checkbox determines whether the Set bright-ness button is available in the slice views.

. . .
. .E D I T M E N UPreferences
Release 2.0 myVGL Manual 4-3
• Icon themeSpecify if you want large or small icons.
• Hardware rendererIn this section you see the Graphics Card that is used by the Hardware ren-derer and you can determine how much of its memory can be used for ren-dering.
• Application user interfaceSpecify if once message boxes should be displayed again after checking the “never show again” checkbox.
. . . . . . . . . . . . . . . . . . . . . . . . . . . . . . . . . . . . . . . . . . . . . . . . . . . . A N N O T A T I O N A R R A N G E M E N T
In this section you can determine the behaviour of the Annotations > Arrange function. The Allow overlap setting specifies, which objects may be con-cealed by the annotations: The Object only, the Colortable only, Both or None.
The Strategy parameter determines where the annotations should be posi-tioned: At the Window border or Around the object.
The Alignment X / Y settings determine how annotations of non-uniform size should be positioned with respect to each other.
The Center parameter specifies if the distribution of the annotations should be determined by the center of the Object, of the Window or Automatically.
The Margin values determine how much space should be between annota-tions, and the Border values determine how far away from the window bor-der the annotations should stay. For both parameters, the first setting determines the x value and the second setting the y value.
The Grid snap checkbox determines if the annotations snap to a grid when you shift them manually. If activated, you can determine the grid spacing by the Grid snap step setting and the grid origin by the Grid snap offset set-ting. For both parameters, the first setting determines the x value and the second setting the y value.
If the number of visible annotations in a window increases above the Max. visible annotations parameter, all annotations are hidden.
. . . . . . . . . . . . . . . . . . . . . . . . . . . . . . . . . . . . . . . . . . . . . . . . . . . . C O O R D I N A T E S Y S T E M D I S P L A Y
• BoxHere you can specify the look of the coordinate system box: You can mod-ify the font, color, outline, alignment and style of the labels. Furthermore, you can specify if you want to show the box frame, ticks, labels, grid and back-ground. You can also extend the box by a certain distance in each direction.
E D I T M E N UPreferences
4-4 myVGL Manual Release 2.0
4
The color of the box background, box frame, ticks and grid can also be specified.
• TripodHere you can specify the color of the tripod axes.
. . . . . . . . . . . . . . . . . . . . . . . . . . . . . . . . . . . . . . . . . . . . . . . . . . . . S N A P F R A M E
Here you can set the default mode of the snap frame. Furthermore, you can define its size, either in pixels (Display relative mode) or in physical units (e.g. mm; Scene relative mode).
. . . . . . . . . . . . . . . . . . . . . . . . . . . . . . . . . . . . . . . . . . . . . . . . . . . . T E X T O V E R L A Y
Here you can define the look of the text overlay: You can set the font size, color and type and specify the distance to the border of the 2D/3D window (Cell border). If you click the Configure button, the Text Overlay Editor will open (see chapter Text Overlay Editor).
. . . . . . . . . . . . . . . . . . . . . . . . . . . . . . . . . . . . . . . . . . . . . . . . . . . . U N I T
Here you can define with which precision a Length, Area, Volume, Angle, Time or Storage value should be displayed. You can do so by setting the number of decimal places or the respective absolute precision value.
Sl ice e lements
. . . . . . . . . . . . . . . . . . . . . . . . . . . . . . . . . . . . . . . . . . . . . . . . . . . . I S O S U R F A C E
Here you can define the look of the isosurface line in the 2D windows, both for selected and unselected volumes.
. . . . . . . . . . . . . . . . . . . . . . . . . . . . . . . . . . . . . . . . . . . . . . . . . . . . R E G I O N O F I N T E R E S T
Here you can define the look of the ROIs line in the 2D windows, both for selected and unselected volumes.
Analysis
. . . . . . . . . . . . . . . . . . . . . . . . . . . . . . . . . . . . . . . . . . . . . . . . . . . . C O O R D I N A T E M E A S U R E M E N T
• FeaturesIn the General section you can specify the size and type of Feature handles. Furthermore, you can decide if handles should Snap to a grid with a speci-fied Grid distance. You can also define the font type, color, size and outline for feature descriptions here.
In the Color, selected instrument section you can determine the look of Fea-tures that belong to a selected instrument: You can specify the color and

. . .
. .E D I T M E N UPreferences
Release 2.0 myVGL Manual 4-5
width of the respective Subsidiary lines, Handles, the selected Feature itself and unselected features belonging to the same selected instrument (Fea-ture). Each subsection allows you to set a specific style for items in the slice plane, behind the slice plane and in front of the slice plane.
Similarly, you can determine the look of Features that do not belong to a selected instrument in the Color, unselected instrument section.
• InstrumentsIn the General section you can specify the length of Instrument handles. Fur-thermore, you can decide if Indicator annotations should be visible in all slices. Also, you can set the size of the Navigation cursor here.
In the Color, selected section you can determine the look of Instruments with features, instruments without features (Instruments) and their Handles. Each subsection allows you to set a specific style for items in the slice plane, behind the slice plane and in front of the slice plane.
Similarly, you can determine the look of unselected Instruments in the Color, unselected section.
• Reference objectsIn the General subsection of both the 2D and 3D display settings sections, you can define how points are displayed in the respective windows. This includes both fit points and auxiliary points , for example the center pionts of cylinders. Furthermore, you can decide if you want to display annotations for selected reference objects in 2D or 3D windows. In the 3D display set-tings, you can also set the Reference object grid spacing and if you want Shaded reference objects (only applies if Fill mode in the Color subsection is set to On).
In the Fitpoint colorbar subsection of both the 2D and 3D display settings sec-tions, you can define how the Fitpoint colorbar is displayed in the respective windows: You can set its visibility, width, length, font style and title (Cap-tion).
In the Color subsection of both the 2D and 3D display settings sections, you can define the look of Selected, Highlighted and Unselected Reference Objects. Highlighted Reference Objects are those that belong to a selected feature. In the 2D display settings section, you can set a specific style for items in the slice plane, behind the slice plane and in front of the slice plane.
. . . . . . . . . . . . . . . . . . . . . . . . . . . . . . . . . . . . . . . . . . . . . . . . . . . . D E F E C T D E T E C T I O N
• 2D display settingsIn the Annotations section you can define the size of the annotation cursor in the 2D windows, whether a newly created annotation should be minimized

E D I T M E N UPreferences
4-6 myVGL Manual Release 2.0
4
or maximized (Default annotation size) and whether the annotations should be visible in all slices or just at their cursor position.
In the Colorbar section you can define whether you want the result colorbar displayed in the 2D windows and how you want it to look there: You can define its width, length, position and font style.
• 3D display settingsIn the Annotations section you can define the size of the annotation cursor in the 3D window and whether a newly created annotation should be mini-mized or maximized (Default annotation size).
In the Colorbar section you can define whether you want the result colorbar displayed in the 3D window and how you want it to look there: You can define its width, length, position and font style.
. . . . . . . . . . . . . . . . . . . . . . . . . . . . . . . . . . . . . . . . . . . . . . . . . . . . N O M I N A L / A C T U A L C O M P A R I S O N
• 2D display settingsIn the Annotations section you can define the size of the annotation cursor in the 2D windows, whether a newly created annotation should be minimized or maximized (Default annotation size) and whether the annotations should be visible in all slices or just at their cursor position.
In the Colorbar section you can define whether you want the result colorbar displayed in the 2D windows and how you want it to look there: You can define its width, length, position and font style.
In the Isosurface section you can define if you want the isosurface in the 2D windows colored according to the local variance value, if you want addi-tionally Haired lines whose length corresponds to the respective variance value or no color coding at all (No line). You can define the width of the col-ored line. For Haired lines, you can also specify the distance between hairs and the multiplication factor between the variance value and hair length (Hair scale factor).
• 3D display settingsIn the Annotations section you can define the size of the annotation cursor in the 3D window and whether a newly created annotation should be mini-mized or maximized (Default annotation size). The Cursor color follows overlay checkbox determines whether the 3D cursors should be colored according to their variance or not.
In the Colorbar section you can define whether you want the result colorbar displayed in the 3D window and how you want it to look there: You can define its width, length, position and font style.

. . .
. .E D I T M E N UPreferences
Release 2.0 myVGL Manual 4-7
. . . . . . . . . . . . . . . . . . . . . . . . . . . . . . . . . . . . . . . . . . . . . . . . . . . . W A L L T H I C K N E S S
• 2D display settingsIn the Annotations section you can define the size of the annotation cursor in the 2D windows, whether a newly created annotation should be minimized or maximized (Default annotation size) and whether the annotations should be visible in all slices or just at their cursor position.
In the Colorbar section you can define whether you want the result colorbar displayed in the 2D windows and how you want it to look there: You can define its width, length, position and font style.
• 3D display settingsIn the Annotations section you can define the size of the annotation cursor in the 3D window and whether a newly created annotation should be mini-mized or maximized (Default annotation size).
In the Colorbar section you can define whether you want the result colorbar displayed in the 3D window and how you want it to look there: You can define its width, length, position and font style.

E D I T M E N UPreferences
4-8 myVGL Manual Release 2.0
4

Release 2.0 myVGL Manual 5-1
. . . . .
. . . . . . . . . . . . . . . . . . . . . . . . . . . . . . . . . . . . . . . . . .INSTRUMENTS MENU 5
ou can perform various measurements like distances, gray values, angles and more on your data with the utilities available in the Instruments menu of myVG L . Each new instrument will be accompa-
nied by an annotation containing the respective measured value(s) and rep-resented by an entry in the Scene Tree (see chapter Scene Tree tool).
Warning For useful results, the object must have been calibrated.
Measurement instruments are visible in the 2D views and—unless hidden by opaque material—in the 3D view. See Table 5-1: Instruments menu options for an overview.
. . . . . . . . . . . . . . . . . . . . . . . . . . . . . . . . . . . . . . . . . . . . . . . . . . . . General
Handl ing of inst rumentsTo create a new instrument, choose one of the options in the Instruments menu and click with the mouse into a slice window. The polyline instru-
Option Icon Description. . . . . . . . . . . . . . . . . . . . . . . . . . . . . . . . . . . . . . . . . . . . . . . . . . . . Indicator Left-click to create a new indicator to measure
gray value and position of a single voxelDistance instru-ment
Left-click and draw with the mouse to measure a distance
Angle instru-ment
Left-click to create a new angle instrument
Polyline instru-ment
Left-click to create a new polyline instrument
Caliper instru-ment
Left-click and draw with the mouse to measure a distance rectangular to a surface
Activate naviga-tion cursor
Left-click while pressing the <Ctrl>-key to position the navigation cursor, left-click and drag to move it
Snap modes Choose a mode from the submenu to deter-mine the snapping behavior when setting points or handles. . . . . . . . . . . . . . . . . . . . . . . . . . . . . . . . . . . . . . . . . . . . . . . . . . . .
TABLE 5-1: INSTRUMENTS MENU OPTIONS
Y

I N S T R U M E N T S M E N UGeneral
5-2 myVGL Manual Release 2.0
5
ment, the indicator and the navigation cursor can also be positioned in the 3D window.
To modify an instrument, select it in a slice window, 3D window (polyline instrument, indicator and navigation cursor only) or Scene Tree (see chapter Scene Tree tool) and resize it with the left mouse button: Click one of its handles to drag it, click onto the instrument’s base line to move the whole instrument.
Warning In the 3D window, instruments are manipulated differently than in the 2D windows: In the 3D window, double-click instruments with the left mouse button to select them, and hold <Ctrl> while left-clicking to create new points (polyline instrument) or set it to another point (indicator and navigation cursor).In the 2D windows, a single left-click is sufficient for both actions.
Selecting an instrument in 2D or 3D will change the slice display such that all 2D views display the slices in which the instrument is located.
Display of instrumentsAn instrument is always displayed in the 2D views, whether or not the cur-rent slice is the slice the instrument is located in. The way the instrument is displayed is subject to its position relative to the current slice. You can modify the display properties in the preferences (see Preferences in chapter Edit menu on page 4-2). The default settings are as follows.
• Display of punctiform measurement instrumentsIndicator and navigation cursor are displayed in
• red if located in the current slice,
• green if located in a higher slice,
• white if located in a lower slice.
• Display of linear measurement instruments• If a measurement line is located in the current slice, it will be displayed
as a solid green line with red handles. The handles will only be displayed in the slice in which they are located.
• If a measurement line is located in a lower slice, it will be displayed as a solid green line without handles.
• If a measurement line is located in a higher slice, it will be displayed as a dashed green line without handles.

. . .
. .I N S T R U M E N T S M E N UIndicator
Release 2.0 myVGL Manual 5-3
This also applies for parts of the line. If a line runs diagonally through the object, the upper part of it will be displayed dashed and the lower part solid.
Tips and tricks For the linear measurement instruments, you can view the gray value profile along the measurement line (see chapter Window menu) or perform a dimensioning (see chapter Measurements menu).
Annotat ionsSpecify the positioning of the instrument’s annotation in the view. Move your mouse over the annotation and click on the small button appearing above the upper right corner of the annotation to switch between the fol-lowing modes:
• A (Automatic positioning mode)Places the annotation automatically, thereby avoiding intersections between the annotation line and the instrument line. This option is only available for Distance and Caliper instruments.
• F (Fixed positioning mode)Places the annotation at a fixed position in the respective 2D window.
• R (Relative positioning mode)Places the annotation at a position relative to the instrument.
For advanced measurement features, coordinate measuring and coordinate system options see chapter Measurements menu.
. . . . . . . . . . . . . . . . . . . . . . . . . . . . . . . . . . . . . . . . . . . . . . . . . . . . Indicator
The indicator is a 3D cross-hair that points to a single voxel. Its annotation contains the gray value of the voxel and its x/y/z coordinates in units of the selected coordinate system. If the coordinate system is the grid of the object, the position will be given in voxels.
. . . . . . . . . . . . . . . . . . . . . . . . . . . . . . . . . . . . . . . . . . . . . . . . . . . . Distance instrument
Use this tool to measure a distance between two points. If you want to mea-sure e.g. the material thickness, activate the snap option as explained above (see Annotations on page 5-3) so that the handles of the distance instru-ment are automatically positioned on the material boundary.
The handles of the distance instrument can be dragged using the left mouse button. Hold down <Shift+Ctrl> while doing so to leave the direction of the distance instrument unchanged (other than changes of 45°).

I N S T R U M E N T S M E N UAngle instrument
5-4 myVGL Manual Release 2.0
5
If you hold <Shift> while dragging a handle, its movement is restricted to the horizontal or vertical direction in the respective 2D window.
The whole distance instrument can be moved by dragging the line between the handles (using the left mouse button).
To measure another distance with the same distance instrument, simply draw at a new position. Select another object or deselect the instrument in the Scene Tree to stop modifying this distance instrument.
To measure another distance with an additional distance instrument, choose this menu entry again.
. . . . . . . . . . . . . . . . . . . . . . . . . . . . . . . . . . . . . . . . . . . . . . . . . . . . Angle instrument
Use this tool to measure the angle between two edges. The angle instrument consists of two lines, each with two handles.
You can drag the handles with the left mouse button. By doing so you define the angle between the two lines which is displayed within the anno-tation of to the angle instrument.
If you hold <Shift+Ctrl> while dragging a handle, the direction of the cor-responding line is locked and will only change in steps of 45°.
If you hold <Shift> while dragging a handle, its movement is restricted to the horizontal or vertical direction in the respective 2D window.
The whole angle instrument can be moved by dragging one of the green lines between the handles (using the left mouse button).
. . . . . . . . . . . . . . . . . . . . . . . . . . . . . . . . . . . . . . . . . . . . . . . . . . . . Polyl ine instrument
Use this tool to measure the outline of an arbitrary shape by fitting a polyline to that shape. Click the left mouse button to create control points for the polyline instrument. The new points are added to the start or the end of the polyline, depending on whether the cursor is nearer to the current start or end point, respectively. The start and end point are distinguished from the other points by their different display. Each successive line segment adds to the total length. Insert a point between two existing points using the middle mouse button. Remove a point by clicking it with the middle mouse button.
Manipulate the polyline instrument in the 3D view by holding down <Ctrl> during the respective mouse clicks. To move an existing point of a selected polyline instrument no modifier key is needed. Double click the polyline instru-ment with the left mouse button to select it.

. . .
. .I N S T R U M E N T S M E N UCaliper instrument
Release 2.0 myVGL Manual 5-5
Choose the polyline type from the floating toolbar:
• Linear connects the points with straight lines.
• CatmullRom connects the points by a Catmull-Rom-Spline. Modify the Slope factor to increase or decrease the curvature of the. A Slope factor of 0.0 leads to the same result as a Linear polyline.
The annotation shows the distance measured along the polyline.
. . . . . . . . . . . . . . . . . . . . . . . . . . . . . . . . . . . . . . . . . . . . . . . . . . . . Caliper instrument
Like the distance instrument, the caliper instrument is used to measure dis-tances. The caliper can be regarded as a distance instrument enhanced by a additional line at each end. The additional lines are in a fixed right angle to the distance measurement line. Use the additional line to position one end of the distance measurement line rectangular to a surface. Then position the other end of the distance measurement line, e.g. onto the opposite surface, to measure the distance.
If you hold <Shift+Ctrl> while dragging a handle, the direction of the cor-responding line is locked and will only change in steps of 45°.
If you hold <Shift> while dragging a handle, its movement is restricted to the horizontal or vertical direction in the respective 2D window.
If you change the coordinate system, the additional lines of the caliper will not be displayed. They become visible again if you switch back to the coor-dinate system in which they have been created.
. . . . . . . . . . . . . . . . . . . . . . . . . . . . . . . . . . . . . . . . . . . . . . . . . . . . Activate navigation cursor
The navigation cursor allows easy navigation in the scene: Hold <Ctrl> and left-click a point in any (2D or 3D) window to position the navigation cursor there. The position specified this way will be shown in the other 3 win-dows; 2D windows will update their slice index to do so. Use the left mouse button to drag the navigation cursor around. Hold <Ctrl> and left-click somewhere to set the cursor to a new position.
Tips and tricks If you are interested in a specific point located on the surface of the object, position the navigation cursor on this point by <Ctrl>-clicking it in 3D. All 2D windows will display the slices for this point so that you can investigate it further.

I N S T R U M E N T S M E N USnap
5-6 myVGL Manual Release 2.0
5
If another instrument is selected, the navigation cursor can be brought back to focus in the 3D window by <Ctrl>-clicking somewhere within it.
. . . . . . . . . . . . . . . . . . . . . . . . . . . . . . . . . . . . . . . . . . . . . . . . . . . . Snap
Activate one of the snap options from the pull down menu to automatically snap the points/handles you set for the measurement instruments. The snap works both for volume and geometry objects in the 2D view. If a volume object has been calibrated, the calibrated isosurface can be used for snap-ping.Activate this option to display a square capture frame. The point snaps inside this capture frame. Define the snapping area inside the preferences (see Preferences in chapter Edit menu on page 4-2).Disable this option to set the points/handles exactly where you click. Enable an arbitrary snapping mode for geometry objects to snap onto their surface.
Use one of the following snap options from the pull down menu for the instruments in the 2D view:
Snap modes > MinSnaps to the lowest gray value in the snap area.
Snap modes > MaxSnaps to the highest gray value in the snap area.
Snap modes > GradientSnaps to the position with the largest gray value difference in the snap
area.
Snap modes > NearestSnaps to the nearest isosurface created by the calibration in the snap
area. If there is no calibration present, this modes works like the snap mode Local.
Snap modes > LocalPerforms a temporary, local calibration within the snap range and
snaps to the resulting temporary isosurface.

Release 2.0 myVGL Manual 6-1
. . . . .
. . . . . . . . . . . . . . . . . . . . . . . . . . . . . . . . . . . . . . . . . .OBJECT MENU 6
he Object menu of myVG L allows you to manipulate the objects in the scene (like voxel objects or polygon models, but also clipping planes etc.).
See Table 6-1: Object menu options for an overview.
. . . . . . . . . . . . . . . . . . . . . . . . . . . . . . . . . . . . . . . . . . . . . . . . . . . . Rotate / Move
Toggle between rotate mode and move mode for the selected object(s) in the 3D window. The current mode can be identified by the color of the bounding box of the object in the 3D window: A red bounding box indi-cates rotate mode, a green bounding box indicates move mode.
For more details please refer to Move / Rotate mode in chapter Workspace on page 2-2.
. . . . . . . . . . . . . . . . . . . . . . . . . . . . . . . . . . . . . . . . . . . . . . . . . . . . Clipping
Either create a clipping plane, a clipping box or an aligned clipping box for the selected object(s). For more information about clipping objects, please refer to chapter Clipping tool.
Option Icon Description. . . . . . . . . . . . . . . . . . . . . . . . . . . . . . . . . . . . . . . . . . . . . . . . . . . . Rotate Enables rotating the object in 3D.Move Enables moving the object in 3D.Create clipping plane
Creates a clipping plane for the selected object.
Create aligned clipping box
Creates an aligned clipping box for the selected object.
Create clipping box
Creates a clipping box for the selected object.
Properties Displays object properties.. . . . . . . . . . . . . . . . . . . . . . . . . . . . . . . . . . . . . . . . . . . . . . . . . . . . TABLE 6-1: OBJECT MENU OPTIONS
T

O B J E C T M E N UProperties
6-2 myVGL Manual Release 2.0
6
. . . . . . . . . . . . . . . . . . . . . . . . . . . . . . . . . . . . . . . . . . . . . . . . . . . . Properties
Displays information about the selected object. For more information, please refer to Properties in chapter Scene Tree tool on page 12-4.

Release 2.0 myVGL Manual 7-1
. . . . .
. . . . . . . . . . . . . . . . . . . . . . . . . . . . . . . . . . . . . . . . . .RESULT MENU 7
hrough the Results menu of myVG L you can access results of advanced analysis features. With myVG L , you can view the results of, but not perform, an analysis.
See Table 7-1: Results menu options for an overview.
. . . . . . . . . . . . . . . . . . . . . . . . . . . . . . . . . . . . . . . . . . . . . . . . . . . . Nominal/Actual comparison
Visualizes the variations between the calibrated surface of a voxel object and the surface of a polygon model.
See chapter Nominal/actual comparison module for details.
. . . . . . . . . . . . . . . . . . . . . . . . . . . . . . . . . . . . . . . . . . . . . . . . . . . . Wall thickness
Visualizes the material thickness of a voxel object.
See chapter Wall thickness module for details.
. . . . . . . . . . . . . . . . . . . . . . . . . . . . . . . . . . . . . . . . . . . . . . . . . . . . Defect detection
Visualizes the material defects of a voxel object.
See chapter Defect detection module for details.
. . . . . . . . . . . . . . . . . . . . . . . . . . . . . . . . . . . . . . . . . . . . . . . . . . . . CM Reporting
Visualizes the material defects of a voxel object.
See chapter Measurements menu for details.
Option Icon Description. . . . . . . . . . . . . . . . . . . . . . . . . . . . . . . . . . . . . . . . . . . . . . . . . . . . Defect detection Open the results of a Defect detection analysis.
Nominal/Actual comparison
Open the results of a Nominal/Actual comparison.
Wall thickness Open the results of a Wall thickness analysis.
CM reporting Open the results of Coordinate measurements.. . . . . . . . . . . . . . . . . . . . . . . . . . . . . . . . . . . . . . . . . . . . . . . . . . . . TABLE 7-1: RESULTS MENU OPTIONS
T

R E S U L T M E N UCM Reporting
7-2 myVGL Manual Release 2.0
7

Release 2.0 myVGL Manual 8-1
. . . . .
. . . . . . . . . . . . . . . . . . . . . . . . . . . . . . . . . . . . . . . . . .TOOLS MENU 8
ctivate various tools by checking their entry in the Tools menu of myVG L .
See Table 8-1: Tools menu options for an overview.
Check a tool to activate it. An activated tool will be displayed either in one of the tool docks or as a floating tool. It might be minimized to its title bar or maximized. Position and size of the tool depends on its status before it was deactivated.
Uncheck a tool to deactivate it. You can reactivate the tool at any time.
Deactivating a tool via the Tools menu is equivalent to closing the tool via the corresponding icon in its title bar.
For details on the tools, refer to the respective chapters.
Option Icon. . . . . . . . . . . . . . . . . . . . . . . . . . . . . . . . . . . . . . . . . . . . . . . . . . . . Volume Ren-dering
define opacity, intensity and color mappings for volume objects
Scene Tree access and control elements (and their subele-ments) in the scene, this includes camera and light sources, volume objects and surface mod-els, measurement features, clipping planes, and others
Clipping control the clipping planePolygon Ren-dering
specify the rendering of surface models
Transform access and control the transformation proper-ties of volume objects and surface models, these include the position, rotation, resolution and center of an object
Light access and control the properties of light sources in the scene, these include the type (e.g., spot light source), color, shadow, and others
Camera access and control the properties of the cam-era, these include its position and focal point, the rendering mode and others. . . . . . . . . . . . . . . . . . . . . . . . . . . . . . . . . . . . . . . . . . . . . . . . . . . .
TABLE 8-1: TOOLS MENU OPTIONS
A
TO O L S M E N U
8-2 myVGL Manual Release 2.0
8
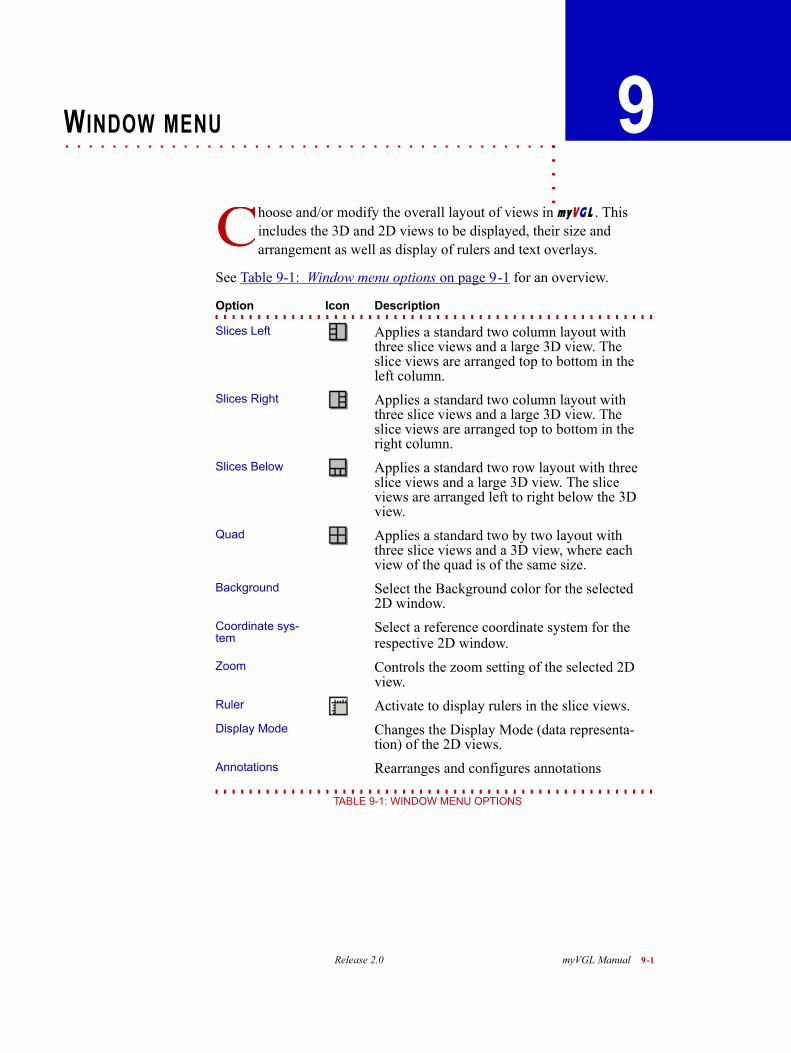
Release 2.0 myVGL Manual 9-1
. . . . .
. . . . . . . . . . . . . . . . . . . . . . . . . . . . . . . . . . . . . . . . . .WINDOW MENU 9
hoose and/or modify the overall layout of views in myVG L . This includes the 3D and 2D views to be displayed, their size and arrangement as well as display of rulers and text overlays.
See Table 9-1: Window menu options on page 9-1 for an overview.
Option Icon Description. . . . . . . . . . . . . . . . . . . . . . . . . . . . . . . . . . . . . . . . . . . . . . . . . . . . Slices Left Applies a standard two column layout with
three slice views and a large 3D view. The slice views are arranged top to bottom in the left column.
Slices Right Applies a standard two column layout with three slice views and a large 3D view. The slice views are arranged top to bottom in the right column.
Slices Below Applies a standard two row layout with three slice views and a large 3D view. The slice views are arranged left to right below the 3D view.
Quad Applies a standard two by two layout with three slice views and a 3D view, where each view of the quad is of the same size.
Background Select the Background color for the selected 2D window.
Coordinate sys-tem
Select a reference coordinate system for the respective 2D window.
Zoom Controls the zoom setting of the selected 2D view.
Ruler Activate to display rulers in the slice views.Display Mode Changes the Display Mode (data representa-
tion) of the 2D views.Annotations Rearranges and configures annotations. . . . . . . . . . . . . . . . . . . . . . . . . . . . . . . . . . . . . . . . . . . . . . . . . . . .
TABLE 9-1: WINDOW MENU OPTIONS
C

W I N D O W M E N USlices Left/Right/Below
9-2 myVGL Manual Release 2.0
9
. . . . . . . . . . . . . . . . . . . . . . . . . . . . . . . . . . . . . . . . . . . . . . . . . . . . Sl ices Left /Right/Below
Select one of the window layouts with a larger 3D view and apply it to your current workspace.
. . . . . . . . . . . . . . . . . . . . . . . . . . . . . . . . . . . . . . . . . . . . . . . . . . . . Quad
Select this layout to apply a standard two by two layout with three slice views and a 3D view.
. . . . . . . . . . . . . . . . . . . . . . . . . . . . . . . . . . . . . . . . . . . . . . . . . . . . Background
Specify the background color of the 2D windows here.
. . . . . . . . . . . . . . . . . . . . . . . . . . . . . . . . . . . . . . . . . . . . . . . . . . . . Coordinate System
Here you can specify a reference coordinate system for the selected 2D window. Other 2D windows will not be affected by this choice. Select Fol-low global coordinate system to reference the coordinate system active in the Coordinate system iconbar.
. . . . . . . . . . . . . . . . . . . . . . . . . . . . . . . . . . . . . . . . . . . . . . . . . . . . Zoom
You can zoom in or out, fit an object or a scene to the window or reset to the original zoom factor.
. . . . . . . . . . . . . . . . . . . . . . . . . . . . . . . . . . . . . . . . . . . . . . . . . . . . Ruler
Select this option to toggle the ruler at the borders of each 2D window.
Level/Window mode
Toggles the 2D view Level/Window (Con-trast/brightness) mode.
Slice step width Defines step width to be used for navigation in 2D view (if not in “Grid” coordinate system).
Text overlay editor
Configures text overlays for slice views and/or 3D view
Option Icon Description. . . . . . . . . . . . . . . . . . . . . . . . . . . . . . . . . . . . . . . . . . . . . . . . . . . .
. . . . . . . . . . . . . . . . . . . . . . . . . . . . . . . . . . . . . . . . . . . . . . . . . . . . TABLE 9-1: WINDOW MENU OPTIONS

. . .
. .W I N D O W M E N UDisplay mode
Release 2.0 myVGL Manual 9-3
. . . . . . . . . . . . . . . . . . . . . . . . . . . . . . . . . . . . . . . . . . . . . . . . . . . . Display mode
The Display mode determines the way by which the slice images in the 2D views are rendered.
Origina lDisplays the slice images using their original color, brightness and contrast.
ColorDisplays the slice images using their original brightness and contrast, but applies the color setting from the Volume Rendering tool. Also displays the contour of the calibrated surface.
Color and Opaci tyDisplays the slice images using the brightness, contrast and color settings of the Volume Rendering tool. Also displays the contour of the calibrated sur-face.
. . . . . . . . . . . . . . . . . . . . . . . . . . . . . . . . . . . . . . . . . . . . . . . . . . . . Annotations
Select Arrange, Minimize, Maximize to modify the display of the currently vis-ible annotations.
Refer to e.g. Annotations in chapter Nominal/actual comparison module on page 20-6 for instructions on how to create an annotation.
. . . . . . . . . . . . . . . . . . . . . . . . . . . . . . . . . . . . . . . . . . . . . . . . . . . . Level/Window mode
Launches the Level/Window (contrast/brightness) tool. This can be used to change the displayed Level/Window of the volumetric data independent of the Volume Render settings. The chosen settings are taken into account in all the Display Mode settings.
. . . . . . . . . . . . . . . . . . . . . . . . . . . . . . . . . . . . . . . . . . . . . . . . . . . . Sl ice step width
Here, you can define the step width to be used when scrolling through slices in the 2D views. It is only active when one is not in a “Grid of ...” coordinate system.
. . . . . . . . . . . . . . . . . . . . . . . . . . . . . . . . . . . . . . . . . . . . . . . . . . . . Text overlay
Launches the Text Overlay Editor for the 2D and 3D windows. Via this tool additional information such as slice position and company logos can con-

W I N D O W M E N UText overlay
9-4 myVGL Manual Release 2.0
9
figured and rendered on top of the 2D and 3D views. For further details see chapter Text Overlay Editor.

Release 2.0 myVGL Manual 10-1
. . . . .
. . . . . . . . . . . . . . . . . . . . . . . . . . . . . . . . . . . . . . . . . .HELP MENU 10
he Help menu of myVG L 2 . 0 provides information about the software and provides access to the manual.
. . . . . . . . . . . . . . . . . . . . . . . . . . . . . . . . . . . . . . . . . . . . . . . . . . . . About
Displays product information including the version (release) and build number.
Always provide version and build number when requesting support or reporting a bug.
. . . . . . . . . . . . . . . . . . . . . . . . . . . . . . . . . . . . . . . . . . . . . . . . . . . . Show manual
Displays this reference manual.
Option Icon Description. . . . . . . . . . . . . . . . . . . . . . . . . . . . . . . . . . . . . . . . . . . . . . . . . . . . About Display product informationShow manual Displays the reference manual. . . . . . . . . . . . . . . . . . . . . . . . . . . . . . . . . . . . . . . . . . . . . . . . . . . .
TABLE 10-1: HELP MENU OPTIONS
T

H E L P M E N UShow manual
10-2 myVGL Manual Release 2.0
1 0

Release 2.0 myVGL Manual 11-1
. . . . .
. . . . . . . . . . . . . . . . . . . . . . . . . . . . . . . . . . . . . . . . . .VOLUME RENDERING TOOL 11
olume objects can be visualized with various rendering techniques by myVG L 2 . 0 . The Volume Rendering tool allows to manipulate the look of volume objects or parts of them in various ways: You can
choose a color for each object, apply user-defined transfer functions to its opacity, set its overall transparency, and pick a rendering algorithm.
. . . . . . . . . . . . . . . . . . . . . . . . . . . . . . . . . . . . . . . . . . . . . . . . . . . . Preset selection
If you choose one of the default or user defined settings most changes in the tool are overwritten and lost. The red flag next to a preset name indi-cates that changes were made to it.
To save your own presets choose Save preset from the right pull down menu.
To save and load the settings into or from a file choose Export preset or Import preset.
When saving, you can choose if you want to save an Absolute Preset, i.e. a preset that maps properties to absolute grayvalues. If the checkbox is not activated, properties are saved relative to the histogram length.
You can choose between the following predefined presets:
• Ramp sets a ramp from left bottom to right top in the Opacity manipulation area, sets the colors to white and causes the object to be rendered as a volume.The result is a gray shaded volume object. Low gray values have high transparency and are shown with low intensity. High gray values have high opacity and are shown with high intensity.
• Inverse Ramp sets a ramp from left top to right bottom in the Opacity manipulation area, sets the colors to white and causes the object to be rendered as a volume.The result is a gray shaded volume object. Low gray values have high opacity and are shown with high intensity. High gray values have high transparency and are shown with low intensity.
• Components sets the opacity to maximum for all gray values, sets a color gradient for Ambient and causes the object to be rendered as a volume.The result is a completely colored object. Every gray value has another
V

VO L U M E R E N D E R I N G T O O LOpacity manipulation area
11-2 myVGL Manual Release 2.0
11
color. This is a good setting to visually detect the components of the object. Use the aligned clipping box to look into the object.
• Isosurface Transparent sets the colors to white and causes the object’s surface(s) to be rendered transparently. The threshold of the iso surface is shown as a red vertical line in the Opacity manipulation area. Change it with the mouse interactively.
. . . . . . . . . . . . . . . . . . . . . . . . . . . . . . . . . . . . . . . . . . . . . . . . . . . . Opacity manipulation area
In this area you see a histogram of the selected object and can specify the opacity of its voxels depending on their gray value using the opacity transfer function. The opacity transfer function is represented by the gray line plotted over the histogram. It can be manipulated as described in the following.
Manipulat ion of the opaci ty t ransfer funct ionSet handles by clicking with the middle mouse to define supporting points of the transfer function. The transfer function is linearly interpolated between the supporting points.You can move handles or whole sections of the opacity transfer function by dragging them with the left mouse button.Delete handles by middle-clicking them or by right-clicking them and choosing Delete handle from the context menu.Move the mouse over the handle to see its gray value followed by its assigned opacity value.Choose Reset opacity curve > from the context menu and the respective sub menu entry to set the transfer function to Default (Ramp), Full transparent or Full opaque.Choose Copy opacity curve from the context menu and Paste opacity curve to copy the curve into the area of another object.
Warning The opacity transfer function has no effect on the 3D window when the isosurface renderer is chosen. You can however still see the effects in the 2D window when you set them to Color and Opcacity mode.
Gray va lue h istogram and zoomClick into the background of the histogram with the left mouse to show its zoom level and gray value range. Move the mouse now up or down to change the zoom.Use the icon or - icon to reduce or enlarge the section of the gray values.Choose Histogram > Disable histogram to disable the histogram in the back-ground.

. . .
. .VO L U M E R E N D E R I N G T O O LAppearance
Release 2.0 myVGL Manual 11-3
Tips and tricks Dock the tool window out from the tool bar and resize the window horizontally as large as possible to see the histogram in more detail if you have an object with thousands of gray values.
In tervalsUse the intervals to disable or enable a gray value range. If an interval is disabled the opacity is set to zero for its gray value range.Per default you work always in the Interval 1. Move the mouse to the right or left border of the area, hold down the left mouse and move into the mid-dle of the area to create an additional interval. Move the blue boundary line of the interval to scale both the opacity and color transfer function. Click with the left mouse onto the name of the interval to change it.
The context menu allows various options:Choose New interval > At left side to divide up the existing interval into two intervals on the actual mouse position with the new interval on the left side.Choose Delete interval > Expand left neighbor to delete the interval on the actual mouse position and merge the freed region with left interval.Choose Disable or Enable interval to disable or enable the interval on the actual mouse position.Define the surface of the selected object by moving the red vertical line with the mouse. This sets the gray value at which the isosurface renderer dis-plays the surface of the object.
Tips and tricks If the object was calibrated you have to click the small icon on the right to unlock the vertical line if you want to set the surface by hand.
. . . . . . . . . . . . . . . . . . . . . . . . . . . . . . . . . . . . . . . . . . . . . . . . . . . . Appearance
Define the color transfer functions, overall transparency and some isosur-face specifics here.The color and intensity defines how much of the light is reflected from the object’s volume or surface.
AmbientSpecify the properties of the Ambient component of light reflected from the selected object here. See Color and Intensity in chapter Light tool on page 16-3 for details on the different light components.
Set handles by clicking with the middle mouse to define supporting points of the transfer function. This defines a mapping between the gray value of the object and the color. The transfer function is linearly interpolated between the supporting points.

VO L U M E R E N D E R I N G T O O LAppearance
11-4 myVGL Manual Release 2.0
11
Move the handles by clicking with the left mouse.Use the right mouse on a handle and delete it by choosing Delete handle from the context menu.Click the handle with the left mouse to see its gray value.
Choose Set handle color > to set the color for a handle. Choose Set color between handles > to set the color between handles. Choose Set interval color > to set the color for the whole interval.
Warning Set interval color > removes all handles inside the interval.
Copy the interval color by choosing Copy interval color and Paste interval color from the context menu.
Use the spinbox to set the Intensity of the color.
Dif fuseSpecify the properties of the Diffuse component of light reflected from the selected object here. See Color and Intensity in chapter Light tool on page 16-3 for details on the different light components.
Set the color transfer function in the same way as done for Ambient above.
Use shared color to use exactly the same transfer function for the diffuse component as for the ambient component. Change the intensity indepen-dent from that. The old transfer function is restored if the option is deacti-vated.
SpecularSpecify the properties of the Specular component of light reflected from the selected object here. See Color and Intensity in chapter Light tool on page 16-3 for details on the different light components.
Double click the quadratic box to choose the color for the Specular compo-nent. Use the spinbox to set the Intensity of the color.
The Shininess controls the size and brightness of the highlight of the specu-lar component.
TransparencyUse the spinbox to set the overall Transparency of the selected object. This changes the intensity of the opacity in the Opacity manipulation area. The opacity is the inverse of the transparency. It is the equivalent of the Intensity of the color transfer functions Ambient and Specular.
Enable Remove hidden surfaces to disable the rendering of surfaces inside the object. This has an effect only if the surfaces are transparent.

. . .
. .VO L U M E R E N D E R I N G T O O LRendering settings
Release 2.0 myVGL Manual 11-5
SwapChoose Swap inner/outer areas to set inner areas to outer areas and vice versa. This is for the Isosurface renderer only. The figure below illustrates a common use of this switch.
. . . . . . . . . . . . . . . . . . . . . . . . . . . . . . . . . . . . . . . . . . . . . . . . . . . . Rendering sett ings
For each object in the scene, you can specify which rendering algorithm to use to display it in the 3D window (and any screenshots or movies derived from it).
Isosurface rendererThis algorithm displays the surface of the selected object as defined by the iso-level (red line in the Opacity manipulation area). It is recommended for the analysis and visualization of industrial CT data sets: This algorithm pro-duces high quality photorealistic images at interactive speeds almost inde-pendently of the size of the data set. The most common use of the isosurface renderer is to render the object at the iso-level defined by the calibration, i.e. showing the actual calibrated surface of the object.
Volume renderer (Phong)This algorithm is a volume rendering algorithm which emphasizes the local gradients within the voxel data. The full support of lighting sources and clipping objects makes it most suitable for animations.
Volume renderer (Scat ter HQ)This algorithm is a volume rendering algorithm. It is the “all-rounder” amongst the visualization algorithms of myVG L . It is well suited for the visualization of faint gray value differences within the voxel data as well as to visualize surface structure details.

VO L U M E R E N D E R I N G T O O LRendering settings
11-6 myVGL Manual Release 2.0
11
Hardware renderer (Scat ter HQ)In contrast to all other renderers, which all use the CPU (s) for rendering, the Hardware renderer uses the graphics card for direct-volume-rendering. This delivers the best rendering performance on most systems but uses the least features of the light and clipping objects. However, for data sets larger than the graphics card memory the Hardware renderer can be used as pre-view only, because the volume has to be downsampled and looses detail.
X-RayThe X-ray algorithm casts one ray per display pixel into the dataset. The higher the integrated opacity of voxels along a ray, the darker the corre-sponding pixel.
Sum along RayThe Sum along Ray algorithm casts one ray per display pixel into the dataset. The higher the integrated opacity of voxels along a ray, the brighter the cor-responding pixel.
Maximum Project ionThe Maximum intensity projection algorithm casts one ray per display pixel into the dataset. The maximum intensity of the voxels along a ray determines the gray value of the corresponding pixel.
Scat ter (v1.2)This algorithm is a volume rendering algorithm which is suited best for the visualization of transparent structures only, e.g. in computational fluid dynamics.
Scat ter HQ (v1.2)This is the standard volume rendering algorithm from myVG L 1.2. See “Vol-ume renderer (Scatter HQ)” for more details.
Scat ter Gradient (v1 .2)This algorithm is a volume rendering algorithm which emphasizes the local gradients within the voxel data. Therefore it is suited best to visualize objects with a clearly defined surface structure.
. . . . . . . . . . . . . . . . . . . . . . . . . . . . . . . . . . . . . . . . . . . . . . . . . . . . R E M A R K S O N R E N D E R E R S
Some renderers are adopted from VG Studio Max 1.2: VGStudio MAX 1.2 (Scat-ter), VGStudio MAX 1.2 (Scatter HQ), VGStudio MAX 1.2 (Scatter HQ Gradient), VGStudio MAX 1.2 (X-Ray), VGStudio MAX 1.2 (Sum along Ray) and VGStudio MAX 1.2 (Maximum Projection). You can use those to display data that was saved in VG Stud io Max 1.2 or VG Studio 1.2.

. . .
. .VO L U M E R E N D E R I N G T O O LLimitations of specific renderers
Release 2.0 myVGL Manual 11-7
Tips and tricks Note that the VGStudio MAX 1.2 (X-Ray), VGStudio MAX 1.2 (Sum along Ray) and VGStudio MAX 1.2 (Maximum Projection) are not dedicated to old data sets only, but can be used with their full functionality in myVG L 2 . 0 .
The renderers Volume renderer (Scatter HQ) and Volume renderer (Phong) are similar to VGStudio MAX 1.2 (Scatter HQ) and VGStudio MAX 1.2 (Scatter HQ Gradient) respectively, but fully support the attributes of light and clipping objects of myVG L 2 . 0 and have higher precision by nearly the same perfor-mance.
Oversampl ingSet the oversampling to a factor larger than 1.0 to sample the object more precisely than one voxel distance. The higher the oversampling the slower the rendering but the better the image quality.
Normal ize gradientsSwitch on to normalize the gradients for lighting calculations. This is sup-ported by the Volume renderer (Scatter HQ), Volume renderer (Phong) and the Isosurface renderer.
. . . . . . . . . . . . . . . . . . . . . . . . . . . . . . . . . . . . . . . . . . . . . . . . . . . . Limitations of specif ic renderers
The renderers Volume renderer (Phong) and Iso surface renderer support all attributes of the light sources and clipping objects. To be compatible to the myVG L 1.2.1 renderers the Volume renderer (Scatter HQ) does not support the specular component and behaves very similar to the VGStudio MAX 1.2 (Scat-ter HQ).
The VGStudio MAX 1.2 (x) renderers have some limitations:
• Only two light sources on the camera are supported. The first one is always interpreted as directional light shining frontal onto the object. The second one always is a directional light, too, and shines angular from the right side. Shadow is supported on second light source only. The specular component is not supported.
• The inversion of the clipping region of clipping boxes and the opacity setting of all clipping objects is not supported.
The Hardware renderer has the following limitations:
• Only the colors and intensities of light sources are supported.
• Neither inverting the clipping region of clipping boxes nor opacity settings of any clipping object are supported.Due to restrictions of OpenGL, most systems support only up to six

VO L U M E R E N D E R I N G T O O LLimitations of specific renderers
11-8 myVGL Manual Release 2.0
11
clipping planes. In this context, every side of a clipping box that actually clips the object counts as a separate clipping plane.
• Overlays used by the wall thickness and defect detection analysis to dye certain wall thicknesses or defects are not supported.

Release 2.0 myVGL Manual 12-1
. . . . .
. . . . . . . . . . . . . . . . . . . . . . . . . . . . . . . . . . . . . . . . . .SCENE TREE TOOL 12
he scene in myVG L consists of all elements currently loaded. This not only includes volume objects and polygon models, but also measurement features, light sources etc. The scene is hierarchically
structured: For example, a volume object is at top-level, all measurements and analysis results belonging to this object are ordered below it. This hier-archical structure is depicted in the Scene Tree. The Scene Tree tool allows you to access the elements of the scene.
Entries in the Scene Tree are preceded by an icon indicating the current locking state of this element, clicking this icon will change the state. The checkbox will toggle the visibility state. Additional access is provided by the context menu which you can open by right-clicking the entry (or entries) in question.
. . . . . . . . . . . . . . . . . . . . . . . . . . . . . . . . . . . . . . . . . . . . . . . . . . . . Entries in the Scene Tree
Click an entry in the Scene Tree to select it. Use the <Ctrl> key while click-ing to select multiple objects.
A selected object is highlighted in the Scene Tree. In the 3D window, its bounding box is displayed.
Any object-related operations will refer to the selected object. Selecting an object in the Scene Tree is equivalent to selecting it in the 3D window. Select an object in the 3D window by double-clicking it, deselect an object by double-clicking another object or by double-clicking the background.
Tips and tricks Double-clicking a volume or polygon object in the Scene Tree will show a dialog listing all available properties of that object.
DeleteDelete a selected entry by pressing the <Del> key on your keyboard.
RenameTo rename a selected entry, click it or press the <F2> key.
Vis ib i l i tyActivate the checkbox in front of an object to display it in the scene. Deac-tivate the checkbox if the object shall not be displayed in the 2D and 3D
T
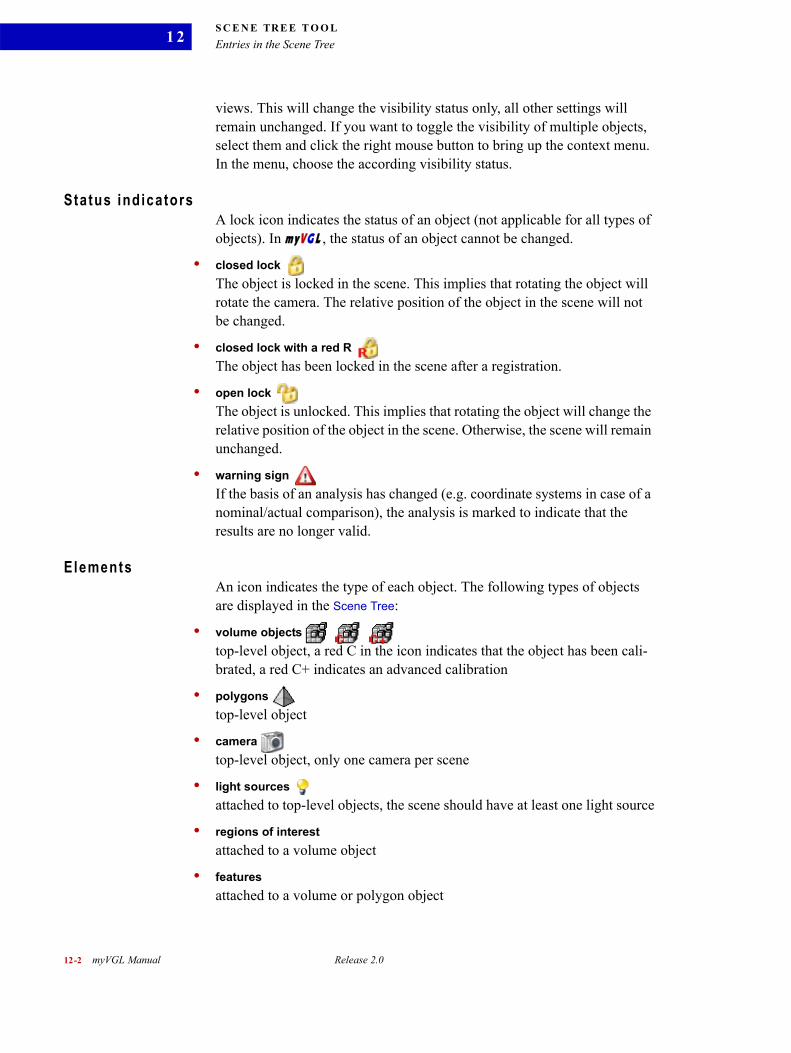
S C E N E TR E E T O O LEntries in the Scene Tree
12-2 myVGL Manual Release 2.0
1 2
views. This will change the visibility status only, all other settings will remain unchanged. If you want to toggle the visibility of multiple objects, select them and click the right mouse button to bring up the context menu. In the menu, choose the according visibility status.
Status indicatorsA lock icon indicates the status of an object (not applicable for all types of objects). In myVG L , the status of an object cannot be changed.
• closed lockThe object is locked in the scene. This implies that rotating the object will rotate the camera. The relative position of the object in the scene will not be changed.
• closed lock with a red R The object has been locked in the scene after a registration.
• open lock The object is unlocked. This implies that rotating the object will change the relative position of the object in the scene. Otherwise, the scene will remain unchanged.
• warning sign If the basis of an analysis has changed (e.g. coordinate systems in case of a nominal/actual comparison), the analysis is marked to indicate that the results are no longer valid.
ElementsAn icon indicates the type of each object. The following types of objects are displayed in the Scene Tree:
• volume objects top-level object, a red C in the icon indicates that the object has been cali-brated, a red C+ indicates an advanced calibration
• polygons top-level object
• camera top-level object, only one camera per scene
• light sources attached to top-level objects, the scene should have at least one light source
• regions of interestattached to a volume object
• featuresattached to a volume or polygon object

. . .
. .S C E N E TR E E T O O LMenu options
Release 2.0 myVGL Manual 12-3
• instrumentsattached to a volume or polygon object
• reference objectsattached to a volume or polygon object
• wall thickness resultsattached to a volume object or a ROI, results of wall thickness analyses
• defect detection resultsattached to a volume object or a ROI, results of defect detections
• nominal/actual comparisonsattached to a volume object or a ROI, results of nominal/actual compari-sons
• annotationsattached to analyses
• clipping objects attached to a volume or polygon object
• groupstop-level object, groups of top-level objects or of lower-level objects
. . . . . . . . . . . . . . . . . . . . . . . . . . . . . . . . . . . . . . . . . . . . . . . . . . . . Menu options
Right-click an entry in the Scene Tree tool for a menu listing available options for the selected object(s). The menu will differ depending on the type of the object(s). Menu options available for the selected object type but currently not applicable will be disabled.
New >The options in this submenu will differ depending on the type of the selected object.
. . . . . . . . . . . . . . . . . . . . . . . . . . . . . . . . . . . . . . . . . . . . . . . . . . . . G E N E R A L O P T I O N S
• Clipping plane / Clipping box / Aligned clipping boxCreates a clipping object of the selected type. The clipping will be applied to the selected items in the Scene Tree.
. . . . . . . . . . . . . . . . . . . . . . . . . . . . . . . . . . . . . . . . . . . . . . . . . . . . A N A L Y S I S A N D M E A S U R E M E N T O P T I O N S
• Annotation (defect detection / nominal/actual comparison / wall thickness)Creates an annotation for the selected defect detection, nominal/actual comparison or wall thickness analysis respectively.

S C E N E TR E E T O O LMenu options
12-4 myVGL Manual Release 2.0
1 2
Import >Import templates and apply them to the selected object.
• Indicator annotationsImports a template of indicator annotations containing information about their positions, names and group affiliation.
Al ign s l ices to object• Align slices to object
Aligns the slice views axis-parallel to a selected reference object or a selected clipping plane.
Vis ib i l i ty on / o f fToggle the visibility of the selected item. This menu entry corresponds to the visibility checkbox of each item but allows you to toggle the visibility of multiple items at the same time.
DeleteDeletes the selected item. Equivalent to Edit > Delete.
RenameRenames the selected item. If multiple items are selected, this menu entry changes to Rename (multi) and leads to a dialog in which you can systemati-cally modify the naming of multiple objects.
ResetResets the position and orientation of objects that are not locked to their inital state.
Proper t iesDisplays properties of the selected volume object, polygon model or analy-sis object. You can also open this dialog by double-clicking an entry. Choosing the properties option on analysis objects will show the according analysis dialog. See the respective chapters for a detailed description.
For render objects the properties dialog consists of two tabs, General and File list. The general property information varies depending on the type of object (volume object or polygon model).
. . . . . . . . . . . . . . . . . . . . . . . . . . . . . . . . . . . . . . . . . . . . . . . . . . . . G E N E R A L P R O P E R T I E S ( V O L U M E O B J E C T S )
The Data info section contains information on Endianness and Datatype (for volume objects).

. . .
. .S C E N E TR E E T O O LMenu options
Release 2.0 myVGL Manual 12-5
The overall scanned area is quantified in the Bounding box info. Note that this usually comprises the surrounding air, not only the scanned object. The bounding box is displayed in the 3D window.
The bounding box related information contains
• the Dimensions [voxel] in x, y, and z
• the Resolution on the x, y, and z axis, i.e. the size of a voxel in this axis
• the overall Voxel count in the bounding box
• the Dimensions in the scene unit (e.g. mm)
The Object info provides information on the scanned object as defined by the calibration. This includes the dimensions of the smallest possible bounding box around the object and the volume of the material (as defined by cali-bration) in this bounding box. If the object is not calibrated, the results will depend on the renderer (volume renderer or isosurface renderer).
. . . . . . . . . . . . . . . . . . . . . . . . . . . . . . . . . . . . . . . . . . . . . . . . . . . . G E N E R A L P R O P E R T I E S ( P O L Y G O N M O D E L S )
The section Object info contains information on the number of vertices (Ver-tex count) and triangles (Triangle count) defining the polygon. The object is analyzed for Bad edges and Bad triangles.
Click the Update button if you are interested in the Surface area and the Dimensions (x, y, and z). The dimensions describe the smallest possible bounding box around this object.
Clicking Update will analyze the angles in the triangles and display the number of occurrences of the angles in a diagram.
. . . . . . . . . . . . . . . . . . . . . . . . . . . . . . . . . . . . . . . . . . . . . . . . . . . . F I L E L I S T
Displays a list of the files on disk containing the data of the selected object. The information refers to the data as stored in the file. Thus the volume size can vary from the volume size of the object in the scene if the object has for example been imported applying a ROI.

S C E N E TR E E T O O LMenu options
12-6 myVGL Manual Release 2.0
1 2

Release 2.0 myVGL Manual 13-1
. . . . .
. . . . . . . . . . . . . . . . . . . . . . . . . . . . . . . . . . . . . . . . . .CLIPPING TOOL 13
lipping objects enable you to render parts of a volumetric/polygo-nal object transparent independent of the Render Settings of the volu-metric/polygonal object. This is done by cutting away parts of the
volumetric/polygonal object using a geometric (plane or box) object.
. . . . . . . . . . . . . . . . . . . . . . . . . . . . . . . . . . . . . . . . . . . . . . . . . . . . General
Clipping objects can be created either directly from the Object menu or from the context menus of the 3D window and the Scene Tree (invoke a context menu with a right mouse click).
A clipping plane can also be created using the Scissors icon at the bottom of each of the 2D windows or from the 2D windows context menu. In this case the plane is automatically located at the slice location shown in the 2D window from which the clipping plane is created.
The transformation and scaling of a clipping object can be reset to its default values via the Reset function in the context menu.
Multiple clipping objects can be combined to achieve more complex clip-ping regions.
To share a clipping object between multiple volume/polygon objects, group these together and define the clipping object for the group.
Cl ipping p laneDefines a planar geometry for clipping. Any parts of the volumetric/polyg-onal object laying above the plane in the direction of its surface normal will be clipped.
Tips and tricks Use the <Ctrl> key in conjunction with any of the modes for finer control.
. . . . . . . . . . . . . . . . . . . . . . . . . . . . . . . . . . . . . . . . . . . . . . . . . . . . R O T A T E M O D E
Click and draw with the mouse:
Use the left mouse button to rotate the clipping plane around its origin.
The middle mouse button will spin the clipping plane around its origin and the viewing direction.
C

C L I P P I N G T O O LGeneral
13-2 myVGL Manual Release 2.0
1 3
. . . . . . . . . . . . . . . . . . . . . . . . . . . . . . . . . . . . . . . . . . . . . . . . . . . . M O V E M O D E
Click and draw with the mouse:
Use the left mouse button to translate the clipping plane up/down and left/right relative to the 3D view, i.e. perpendicular to the viewing direc-tion.
The middle mouse button will translate the clipping plane in/out relative to the 3D view, i.e. along the viewing direction.
Cl ipping boxSpecifies a box for clipping. Any parts of the volumetric/polygonal object outside the box will be clipped.
Pressing and holding the left mouse button over any of the yellow handles on the sides of the clipping box enables you to resize the clipping box inde-pendently of the rotation/translation mode of the 3D window. Press, hold and drag in the directions perpendicular to the side to resize the clipping box.
. . . . . . . . . . . . . . . . . . . . . . . . . . . . . . . . . . . . . . . . . . . . . . . . . . . . R O T A T I O N M O D E
Click and draw with the mouse:
Use the left mouse button to rotate the clipping box around its origin.
The middle mouse button will spin the clipping box around its origin and the viewing direction.
. . . . . . . . . . . . . . . . . . . . . . . . . . . . . . . . . . . . . . . . . . . . . . . . . . . . T R A N S L A T I O N M O D E
Click and draw with the mouse:
Use the left mouse button to translate the clipping box up/down and left/right relative to the 3D view, i.e. perpendicular to the viewing direc-tion.
The middle mouse button will translate the clipping box in/out relative to the 3D view, i.e. along the viewing direction.
Al igned c l ipping boxSpecifies an object aligned box for clipping. Any parts of the volumet-ric/polygonal object outside the box will be clipped. The aligned clipping box can not be rotated or translated nor can it be scaled to be any larger that the original volumetric object on which it was defined.
A left mouse click will position the mouse over any of the yellow handles on the sides of the clipping box. Press, hold and drag in the directions per-pendicular to the side to resize it.

. . .
. .C L I P P I N G T O O LStatus Information
Release 2.0 myVGL Manual 13-3
Warning The aligned clipping box is only available for volumetric objects.
. . . . . . . . . . . . . . . . . . . . . . . . . . . . . . . . . . . . . . . . . . . . . . . . . . . . Status Information
Displays the name of the selected clipping object in green color. If no clip-ping object is currently selected in the Scene Tree, the text “No clipping object selected” is displayed in red and all controls are disabled.
. . . . . . . . . . . . . . . . . . . . . . . . . . . . . . . . . . . . . . . . . . . . . . . . . . . . General
This tab shows all controls applicable to all types of clipping objects.
AppearanceActivate the checkbox to invert the region used for clipping. For clipping planes, inverting the clipping region will swap the sides used for clipping. For (aligned) clipping boxes, inverting the clipping region will render any-thing inside the clipping box transparent.
Opaci tyControls the opacity value of the clipped region. Move the slider to modify the opacity or enter an opacity value in the edit box. The value will be clipped to the range [0;1].
The opacity setting is not available for clipped polygon objects.
ResetResets the rotation, translation and scaling of the selected clipping object to the default values (Opacity and inversion state are left unchanged).
. . . . . . . . . . . . . . . . . . . . . . . . . . . . . . . . . . . . . . . . . . . . . . . . . . . . Al igned Clipping box
This tab is only enabled if an aligned clipping box is selected.
BoundaryThe minimum and maximum values (in voxels) of the clipping region.
ResetResets the boundary of the aligned clipping box to its default values which corresponds to the bounding box of the respective sample grid of the vol-ume.

C L I P P I N G T O O LAligned Clipping box
13-4 myVGL Manual Release 2.0
1 3

Release 2.0 myVGL Manual 14-1
. . . . .
. . . . . . . . . . . . . . . . . . . . . . . . . . . . . . . . . . . . . . . . . .TRANSFORM TOOL 14
he Transform tool is designed to manipulate spatial properties like position and orientation, and geometric properties like center, scale and resolution for a selected object. The tool is organized into sev-
eral tab pages in which you inspect and modify the specific properties.
. . . . . . . . . . . . . . . . . . . . . . . . . . . . . . . . . . . . . . . . . . . . . . . . . . . . Status information
This section displays information about the current status of the Transform tool. If a valid object is selected it‘s name is displayed in green color. A valid object is either a voxel data set, a polygonal model or a region of interest. The Status information display also gives you a hint if the transform property tool is deactivated for your current selection in the Scene Tree (e.g. No object with transformation selected).
. . . . . . . . . . . . . . . . . . . . . . . . . . . . . . . . . . . . . . . . . . . . . . . . . . . . Coordinate system
Select a coordinate system from the pull down to inspect and manipulate values relative to the selected coordinate system.
. . . . . . . . . . . . . . . . . . . . . . . . . . . . . . . . . . . . . . . . . . . . . . . . . . . . Posit ion (Pos)
To modify the position, enter the exact position value in x, y and z coordi-nates. You may also use the up and down arrows to increase or reduce the values. Click the Reset button to restore the initial position.
. . . . . . . . . . . . . . . . . . . . . . . . . . . . . . . . . . . . . . . . . . . . . . . . . . . . Rotation (Rot)
Specify the rotation of an object either in Standard or Advanced mode. Switch between Standard/Advanced mode by clicking the Standard/Advanced button.
• StandardThe Standard dialog provides you with an interface where you enter incre-mental rotation values for each axis. Enter the incremental rotation around the x, y, or z axis or use the up and down arrows to increase or reduce the rotation values.
T

TR A N S F O R M T O O LCenter
14-2 myVGL Manual Release 2.0
1 4
• AdvancedThe Advanced dialog provides you with an interface where you enter abso-lute rotation values for the selected object. The absolute rotation is defined by a normalized vector in 3D space serving as rotational axis and a rotation angle around this vector.
Enter the x, y or z coordinates to define the rotational axis or use the up and down arrows to increase or reduce the x, y or z values.
Enter the absolute rotation angle around the rotational axis defined by the x, y and z values or use the up and down arrows to increase or reduce the rotation angle.
Press the Reset button to reset the orientation of the selected object to its original value.
. . . . . . . . . . . . . . . . . . . . . . . . . . . . . . . . . . . . . . . . . . . . . . . . . . . . Center
Specify the center of the selected object. By default the origin of an object is at (Xmax/2, Ymax/2, Zmax/2), where Xmax, Ymax and Zmax describe the extent of the object’s bounding box.
Enter the x, y or z coordinates of the desired center or use the up and down arrows to increase or reduce the x, y, or z values.
Press the Reset button to restore the default center values.
The center of an object is important for rotations, as it defines the position of the axis of rotation.
. . . . . . . . . . . . . . . . . . . . . . . . . . . . . . . . . . . . . . . . . . . . . . . . . . . . Resolution
This Option can only be applied to voxel data sets. Specify the size of a voxel by modifying the resolution values.
Warning Modifying the resolution will change the geometry of the voxel data set and therefore invalidate any existing analysis results for this voxel data set.
Press the Override button to show the Override resolution dialog. Enter the x, y or z resolution values or use the up and down arrows to increase or reduce the x, y, or z values.

Release 2.0 myVGL Manual 15-1
. . . . .
. . . . . . . . . . . . . . . . . . . . . . . . . . . . . . . . . . . . . . . . . .POLYGON RENDERING TOOL 15
olygon rendering is supported by myVG L 2 . 0 .Supported formats (in alphabetical order):
• Stereolithography File Format (*.stl, *.STL)General Stereolithography (STL) files.
• Stereolithography ASCII File Format(*.stl, *.STL)ASCII coded Stereolithography (STL) files.
• Stereolithography Binary File Format (*.stl, *.STL)Binary coded Stereolithography (STL) files.
Polygon objects can be assigned separate materials for front and back face. In addition, polygon objects can be clipped by clipping planes or clipping boxes (see chapter Clipping tool) and can be illuminated by different light sources (see chapter Light tool).
Warning Due to restrictions of OpenGL, most systems support only up to six clipping planes. In this context, every side of a clipping box that actually clips the object counts as a separate clipping plane.
In the 3D view only the front face of the polygon object is rendered by default. The material properties for front and back face can be specified independently. The polygon object can not only be rendered solid, but also as wireframe or point cloud.
In the 2D view one slice of the polygon object is rendered. The color of the outline can be chosen.
. . . . . . . . . . . . . . . . . . . . . . . . . . . . . . . . . . . . . . . . . . . . . . . . . . . . Status information
Displays the name of the selected polygon object.
. . . . . . . . . . . . . . . . . . . . . . . . . . . . . . . . . . . . . . . . . . . . . . . . . . . . General
Preset se lect ionSave your changes by choosing Save preset from right pull down menu. With Export preset and Import preset the settings made in the tool can be saved and loaded into a file. Choose one of the default presets to exclu-
P

P O L Y G O N R E N D E R I N G T O O LGeneral
15-2 myVGL Manual Release 2.0
1 5
sively set one of the following options: Render solid, Render wireframe, Ren-der point cloud. All changes made in the tool are overwritten by choosing a preset.
Render sol idActivate this option to render the triangles of the polygon object.
. . . . . . . . . . . . . . . . . . . . . . . . . . . . . . . . . . . . . . . . . . . . . . . . . . . . S H A D I N G M O D E L
Choose Flat to show each triangle of the polygon object. The color between the triangle vertices is not interpolated.
Choose Smooth to get the color of the triangle vertices interpolated. This results in a much cleaner object surface.
. . . . . . . . . . . . . . . . . . . . . . . . . . . . . . . . . . . . . . . . . . . . . . . . . . . . C U L L F A C E
In the Cull face pull-down menu you specify the face of the polygon object that is not rendered. Choose Front to render the back face only. Choose Back to render the front face only. Choose Disabled to render both faces.
The image below shows a polygonal object that is rendered solid.
Render wiref rameActivate this option to render the wireframe of the polygon object, i.e. the lines between the triangle vertices.
Double click the quadratic box to select the line Color. Use the spin box to specify the Line width in pixels.

. . .
. .P O L Y G O N R E N D E R I N G T O O LMaterial
Release 2.0 myVGL Manual 15-3
The image below shows a the wireframe of a polygonal object.
Render point c loudActivate this option to render the point cloud of the polygon object, i.e. tri-angle vertices.
Double click the quadratic box to select the point Color. Use the spin box to specify the Point size in pixels.
The image below shows a the point cloud of a polygonal object.
. . . . . . . . . . . . . . . . . . . . . . . . . . . . . . . . . . . . . . . . . . . . . . . . . . . . Material
Assign a material to every face of the polygon object and a color to the out-line in the 2D view.
Tips and tricks The ambient and diffuse color of the front face of a certain polygon define the color of the corresponding icon in the Scene Tree to allow an easy identification.

P O L Y G O N R E N D E R I N G T O O LMaterial
15-4 myVGL Manual Release 2.0
1 5
Mater ia l face set t ingsChoose Front face or Back face whether you want to change the Color and Intensity of the front or back side of the polygon object.
Tips and tricks The Back face of the polygon object is only relevant if you clip the object or if you search visually for mesh defects. Switch off rendering the Back face by choosing Back from the Cull face pull down menu in the Advanced tab to gain rendering performance.
Color and Intensi tyDouble click the respective quadratic box to choose the color for the Ambi-ent, Diffuse or Specular component of the material. Use the spin box to choose the intensity of the material color component.
The color and intensity of the material defines how much of the light is reflected from the object’s surface in each of the three components ambi-ent, diffuse and specular. The Shininess controls the size and brightness of the highlight of the specular component.
Sl ice colorDouble click the quadratic box to choose the Color for the outline of the polygon object in the 2D views.

Release 2.0 myVGL Manual 16-1
. . . . .
. . . . . . . . . . . . . . . . . . . . . . . . . . . . . . . . . . . . . . . . . .LIGHT TOOL 16
ight sources in myVG L 2 . 0 can be of type directional, point and spot. Both volume and polygon objects can be illuminated with the phong shading algorithm. Shadows are supported by software vol-
ume renderers only and have to be activated for each light source.
The light sources can be created by choosing New > and the type of light source from the context menu of the Scene Tree Tool. Only if selected in the Scene Tree the light source is shown in the 2D and 3D view and can be modified there with the mouse:
• In the 3D view it can be rotated and moved.
• In the 2D view start and end point can be modified. To initially place a light source click somewhere in the window and move the mouse into the light direction while holding down the left mouse button.
Warning The light object can be modified only if the lock icon in the Scene Tree is opened for this object.
. . . . . . . . . . . . . . . . . . . . . . . . . . . . . . . . . . . . . . . . . . . . . . . . . . . . Status information
Displays the name of the selected light source.
. . . . . . . . . . . . . . . . . . . . . . . . . . . . . . . . . . . . . . . . . . . . . . . . . . . . General
Preset se lect ionChoose Default light to set the default attributes for the light source. This overwrites all changes in the tool. To save your own changes choose Save preset from the right pull down menu.With Export preset and Import preset the attributes of the light source can be saved and loaded into a file.
TypeSelect the type of the light source.
• DirectionalA light source sending out a parallel bundle of light rays in a particular
L

L I G H T T O O LGeneral
16-2 myVGL Manual Release 2.0
1 6
direction. The light intensity does not drop with distance. See the figure below for an example of a Directional light source.
• PointA single point in space sending out light equally in all directions. The intensity of the light decreases proportional to the square of the distance to the light source. This is comparable to an infinitely small unshaded light bulb. See the figure below for an example of a Point light source.
• SpotSimilar to a point light but emission is limited to within a cone much like a regular desk lamp. Thus this light type has an angular setting to define the size of the cone: The Cutoff Angle and an additional attenuation

. . .
. .L I G H T T O O LGeneral
Release 2.0 myVGL Manual 16-3
Exponent can be set in the Advanced tab.See the figure below for an example of a Spot light source.
Color and Intensi tySpecify the intensity and color of the light components here: Double click the quadratic box to select the color of the respective light component. Enter its intensity into the text field.
• OverallSets the light intensity globally and affects all three light components: ambient, diffuse and specular.
Tips and tricks You can also modify the overall intensity of a selected light source by moving the scroll wheel while the mouse pointer is over the 3D window.
• AmbientThe light component for general illumination.
• DiffuseThe light component that comes from one direction and scatters equally into all directions.
• SpecularThe light component that comes from a particular direction and bounces of into a preferred direction. It is responsible for the shininess of a lighted object.

L I G H T T O O LAdvanced
16-4 myVGL Manual Release 2.0
1 6
See the figure below for an illustration of the different light components.
Shadow modeSwitch shadows of the selected light source on or off here. Not all render-ers support shadows or only for one light source.
. . . . . . . . . . . . . . . . . . . . . . . . . . . . . . . . . . . . . . . . . . . . . . . . . . . . Advanced
Attenuat ionPoint and spot light sources support attenuation. This is the intensity decrease of the light source along the light direction. The easiest way to work with it is to use the Constant or Gradient buttons:

. . .
. .L I G H T T O O LAdvanced
Release 2.0 myVGL Manual 16-5
• Constant sets the light source to have no attenuation at all. The Linear and Quadratic factors are set to 0. The Constant factor is set to 1. This is the default.
• Gradient sets the attenuation so that the half of the intensity decrease of the light source lies within the 2D view. This intensity is shown by a dashed circle around the light source and can be modified with the mouse.
Spot• The spot light source supports a Cutoff Angle for its shade. You can either
enter a value in the text box or modify it with the mouse: Use <Ctrl> + left mouse button on it and move up or down in the 2D view to open or close the shade.
• The Exponent value controls the decrease of the light intensity along the cone radius. The higher the exponent, the faster the decrease of the light intensity.

L I G H T T O O LAdvanced
16-6 myVGL Manual Release 2.0
1 6

Release 2.0 myVGL Manual 17-1
. . . . .
. . . . . . . . . . . . . . . . . . . . . . . . . . . . . . . . . . . . . . . . . .CAMERA TOOL 17
he 3D view of myVG L is rendered using a virtual camera placed in the scene together with the volumetric/polygonal data. Various properties such as camera position, viewing direction and aperture
angle can be controlled using this tool.
. . . . . . . . . . . . . . . . . . . . . . . . . . . . . . . . . . . . . . . . . . . . . . . . . . . . General
Camera Or ientat ion
. . . . . . . . . . . . . . . . . . . . . . . . . . . . . . . . . . . . . . . . . . . . . . . . . . . . D E F A U L T C A M E R A V I E W S .
The Camera tool includes shortcuts to fourteen default camera views, rela-tive to the selected coordinate system. They can be used for quick viewing and generation of reference screenshots. These default views are along the three major axis (in both directions) as well as from positions along each of the four diagonals (one position for each corner).
The button centers the selected object in the 3D view (via a transla-tion along the screen plane).
The button focuses the selected object in the 3D view (via a transla-tion along the viewing direction).
. . . . . . . . . . . . . . . . . . . . . . . . . . . . . . . . . . . . . . . . . . . . . . . . . . . . P O S I T I O N
Display and manipulate the position of the camera (in the current coordi-nate system) here.
. . . . . . . . . . . . . . . . . . . . . . . . . . . . . . . . . . . . . . . . . . . . . . . . . . . . F O C A L P O I N T
Display and manipulate the position to which the camera is focused here.
The view direction can be obtained by subtracting the Position coordinates from the Focal point coordinates (and normalizing the result).
. . . . . . . . . . . . . . . . . . . . . . . . . . . . . . . . . . . . . . . . . . . . . . . . . . . . U P V E C T O R
Specifies the vertical orientation of the camera, that means it implicitly sets the axial rotation of the camera relative to the view direction.
T

C A M E R A T O O LStereo
17-2 myVGL Manual Release 2.0
1 7
Project ion mode
. . . . . . . . . . . . . . . . . . . . . . . . . . . . . . . . . . . . . . . . . . . . . . . . . . . . P E R S P E C T I V E
Renders the 3D models as seen by a single human eye: Spatial forshorten-ing and apparent size as a function of distance is taken into account. That means that objects look smaller the further away they are.
. . . . . . . . . . . . . . . . . . . . . . . . . . . . . . . . . . . . . . . . . . . . . . . . . . . . P A R A L L E L
Renders the 3D models without perspective correction such that the rela-tive proportions of an object are maintained independent of distance.
. . . . . . . . . . . . . . . . . . . . . . . . . . . . . . . . . . . . . . . . . . . . . . . . . . . . S T E R E O - P E R S P E C T I V E
Renders a pair of perspective images of the scene. The camera positions of the two images are slightly offset to mimic for example the offset between the right and left eye. When viewed correctly the image pair will create the perception of observing the objects in the scene in three dimensions.
Stereo viewing requires additional hardware either in the form of special glasses or dedicated displays.
View AngleSpecifies the vertical viewing angle (in degrees) of the camera.
. . . . . . . . . . . . . . . . . . . . . . . . . . . . . . . . . . . . . . . . . . . . . . . . . . . . Stereo
This tab is only active when Projection mode: Stereo-Perspective is chosen.
Image mode
. . . . . . . . . . . . . . . . . . . . . . . . . . . . . . . . . . . . . . . . . . . . . . . . . . . . A N A G L Y P H I M A G E R E D - G R E E N , R E D - B L U E , R E D - C Y A N
Encodes the left and right eye images into the respective color channels of the display (anachrome stereo). To view the result in stereo, a pair of (inex-pensive) 2 color glasses are required.
. . . . . . . . . . . . . . . . . . . . . . . . . . . . . . . . . . . . . . . . . . . . . . . . . . . . I N T E R L A C E D
Encodes the left and right eye images into one image where either the rows or columns are alternatively taken from the left or right image. This mode requires special display video formats and/or special glasses.
. . . . . . . . . . . . . . . . . . . . . . . . . . . . . . . . . . . . . . . . . . . . . . . . . . . . L E F T I M A G E O N L Y
Displays the left eye image only.

. . .
. .C A M E R A T O O LStereo
Release 2.0 myVGL Manual 17-3
. . . . . . . . . . . . . . . . . . . . . . . . . . . . . . . . . . . . . . . . . . . . . . . . . . . . R I G H T I M A G E O N L Y
Displays the right eye image only.
. . . . . . . . . . . . . . . . . . . . . . . . . . . . . . . . . . . . . . . . . . . . . . . . . . . . O P E N G L
Alternates between showing the left and right eye images (active stereo). This mode requires additional hardware for stereo viewing (stereo glasses and a synchronization transmitter).
Sett ings modeThe degree of stereo perception depends on the relative scale of such parameters as eye, focal and image plane distances relative to the distance to the viewed object and its size. By tuning these parameters to the specific scene the 3D experience can be optimized.
. . . . . . . . . . . . . . . . . . . . . . . . . . . . . . . . . . . . . . . . . . . . . . . . . . . . F I X E D F O C A L D E P T H
Lets you vary the focal distance, but uses fixed scaling.
. . . . . . . . . . . . . . . . . . . . . . . . . . . . . . . . . . . . . . . . . . . . . . . . . . . . F I X E D V I E W E R - S C E N E S C A L I N G
Assumes an infinite focal distance and lets you scale the viewing parame-ters relative to the Scene (Scene Zoom).
Eye d istanceSets the interocular (eye) distance.
Display d istanceSets the distance between the eyes/cameras and the 2D image plane.
Focal depthSet the distance at which the eyes are focused, i.e the distance at which the view vectors from each eye/camera cross. Only available in the Fixed Focal Depth mode.
Scene ZoomSets the scale between the viewing parameters and the Scene. Only avail-able in the Fixed viewer-scene scaling mode.

C A M E R A T O O LStereo
17-4 myVGL Manual Release 2.0
1 7

Release 2.0 myVGL Manual 18-1
. . . . .
. . . . . . . . . . . . . . . . . . . . . . . . . . . . . . . . . . . . . . . . . .TEXT OVERLAY EDITOR 18
he Text overlay editor is designed to decorate 2D windows and the 3D window with customizable text overlays. The text overlays will supply you with additional information (e.g. current slice position,
the window name or even DICOM tags) about the specific 2D/3D view. This feature is useful for reporting/documentation purposes (see also Save image(s)... in chapter File menu on page 3-9 and Save AVI/image stack ... in chapter File menu on page 3-10).
Configure the text overlay via Window > Text overlay editor or by right-click-ing into the 3D or 2D windows and choosing Text overlay > Configure...
The dialog is organized into two tab pages, the Slice views and the Scene view tab page. Both pages are structured identically. Click the Font settings button to show the preferences available for fonts. Click the Ok button to apply the current settings and close the editor. Click the Cancel button to close the dialog without applying any changes. Click the Apply button to get a preview of the current settings.
. . . . . . . . . . . . . . . . . . . . . . . . . . . . . . . . . . . . . . . . . . . . . . . . . . . . Sl ice Views (and Scene View)
On each tab page you modify and inspect your text overlays.
Preset Select ionIn the Preset selection section you manage text overlay presets. Select a pre-set from the pull down to apply it to the current text overlay settings.
• SaveClick the Save button to execute the Save preset dialog. Enter a name for the preset or choose an entry from the pull down and click the Save button to store the current text overlay settings.Click the Cancel button to abort the save process
• RemoveClick the Remove button to remove a preset from the pull down preset list.
• ResetClick the Reset button to reset any modifications made on the active preset.
T

TE X T O V E R L A Y E D I T O RAvailable default text labels:
18-2 myVGL Manual Release 2.0
1 8
Text labelsThe Text labels section contains the currently available text labels. Select either predefined text labels or create custom text labels. The Available text labels section is a table containing the currently available text labels. The Selected text labels section is a table containing the currently selected text labels. Select an entry from the Available text labels table and click the > but-ton to add an entry to the Selected text labels table. Select an entry from the Selected text labels table and click the < button to remove the entry from the Selected text labels table.
. . . . . . . . . . . . . . . . . . . . . . . . . . . . . . . . . . . . . . . . . . . . . . . . . . . . Available default text labels:
The following text labels are available by default.
• <CoordinateSystem>Displays the name of the currently active coordinate system for the respec-tive window.
• <SlicePosition>Displays the current slice position (only available for 2D windows)
• <ViewZoom>Displays the current zoom factor (only available for 2D windows)
• <WindowName>Displays the name of the window. The name indicates the window type, e.g., Top, Front or Back refers to a 2D window, whereas Scene refers to a 3D window.
• <PatientID>Displays the PatienID DICOM tag (only available for DICOM data sets).
• <PatientName>Displays the PatientName DICOM tag (only available for DICOM data sets).
• <PixelSize>Displays the size of a pixel respective to the currently selected application unit.
• <SerialNumber>Displays the SerialNumber DICOM tag (only available for DICOM data sets)
• <StudyDescription>Displays the StudyDescription DICOM tag (only available for DICOM data sets)

. . .
. .TE X T O V E R L A Y E D I T O RAvailable default text labels:
Release 2.0 myVGL Manual 18-3
• Ex: <StudyID>Displays the StudyID DICOM tag (only available for DICOM data sets)
• Se: <StudyNumber>Displays the StudyNumber DICOM tag (only available for DICOM data sets)
• <CustomLogo>Displays your custom logo. Drag this entry into the Selected text labels sec-tion and double-click it to show the Select logo image dialog. In the dialog you specify the location of your custom logo.
• <CustomText> Displays your custom text. Drag this entry into the Selected text labels sec-tion and double-click it to modify its text.
PreviewThe Preview area shows eight boxes in which you can place the selected text labels. The boxes indicate where the text labels will be positioned inside either the 2D or the 3D window. You can insert multiple text labels in each box.

TE X T O V E R L A Y E D I T O RAvailable default text labels:
18-4 myVGL Manual Release 2.0
1 8

Release 2.0 myVGL Manual 19-1
. . . . .
. . . . . . . . . . . . . . . . . . . . . . . . . . . . . . . . . . . . . . . . . .MEASUREMENTS MENU 19
he Measurements menu of VG Studio MAX 2 .0 provides means for coordinate measuring, i.e. enables you to fit reference objects to your calibrated volumetric or geometric data and define measure-
ments on the data based on the reference objects.
Coordinate measurement (CM) is an optional add-on module for VG Stud io MAX 2 .0 . It is not available for myVG L . However, if a project contains coor-dinate measurements, those measurements are available in myVG L .
If you are interested in more extensive functionality than the one offered by myVG L , you have the chance to evaluate our other products, VG Studio 2 .0 or VG Stud io MAX 2 .0 :
www.volumegraphics.com/products/evaluation/form.html
For further questions about our product portfolio, please contact
In myVG L , there are seven types of Reference Objects (see description below), an arbitrary number of which can be shown for any calibrated vol-umetric or geometric object. In the Scene Tree, Reference objects are listed in the Coordinate Measurement > Reference Objects section.
Based on existing reference objects, features show measured positions, dis-tances, angles and radii.
Features rely on the definition of distinct coordinate systems.
. . . . . . . . . . . . . . . . . . . . . . . . . . . . . . . . . . . . . . . . . . . . . . . . . . . . Point
A reference point was fitted to the object based on one or more fit points. A point’s only geometric property is its position.
. . . . . . . . . . . . . . . . . . . . . . . . . . . . . . . . . . . . . . . . . . . . . . . . . . . . Line
A reference line was fitted to the object based on two or more fit points. A line’s geometric properties are its position and direction.
T

M E A S U R E M E N T S M E N UCircle
19-2 myVGL Manual Release 2.0
1 9
. . . . . . . . . . . . . . . . . . . . . . . . . . . . . . . . . . . . . . . . . . . . . . . . . . . . Circle
A reference circle was fitted to the object based on three or more fit points. A circle’s geometric properties are its center position, its orientation nor-mal and its radius.
. . . . . . . . . . . . . . . . . . . . . . . . . . . . . . . . . . . . . . . . . . . . . . . . . . . . Pplane
A reference plane was fitted to the object based on three or more fit points. A plane’s geometric properties are its center position and orientation nor-mal.
. . . . . . . . . . . . . . . . . . . . . . . . . . . . . . . . . . . . . . . . . . . . . . . . . . . . Sphere
A reference sphere was fitted to the object based on four or more fit points. A sphere’s geometric properties are its center position and radius.
. . . . . . . . . . . . . . . . . . . . . . . . . . . . . . . . . . . . . . . . . . . . . . . . . . . . Cylinder
A reference cylinder was fitted to the object based on three or more fit points. A cylinder’s geometric properties are its center position, its direc-tion and its radius.
. . . . . . . . . . . . . . . . . . . . . . . . . . . . . . . . . . . . . . . . . . . . . . . . . . . . Cone
A reference cone was fitted to the object based on three or more fit points. A cone’s geometric properties are its center position, its direction, its center radius and its conicity angle.
. . . . . . . . . . . . . . . . . . . . . . . . . . . . . . . . . . . . . . . . . . . . . . . . . . . . Dialog: Reference object properties
Warning In myVG L , all grayed settings are displayed for informational value only. Editing those settings or making new measurements is only possible using VG Stud io MAX 2 .0 with the Measurements module installed.
To show the properties of a reference object either double click the refer-ence object in the Scene Tree or select the Properties option from the Scene Tree context menu.

. . .
. .M E A S U R E M E N T S M E N UDialog: Reference object properties
Release 2.0 myVGL Manual 19-3
Warning Be aware that all geometric properties like positions and directions will be displayed with respect to the currently selected coordinate system!
Proper t iesShows geometric and status properties of the reference object.
. . . . . . . . . . . . . . . . . . . . . . . . . . . . . . . . . . . . . . . . . . . . . . . . . . . . D E S C R I P T I O N
The object’s type and name. The name can be edited.
. . . . . . . . . . . . . . . . . . . . . . . . . . . . . . . . . . . . . . . . . . . . . . . . . . . . C O N S T R U C T I O N M E T H O D
Information about how this object was defined:
• [Least-squares/Minimum-zone] fitted
• Result of [intersection/combination/projection/...]
• Manually defined reference object
. . . . . . . . . . . . . . . . . . . . . . . . . . . . . . . . . . . . . . . . . . . . . . . . . . . . S I Z E S T A T U S
Status information about how the actual size of the reference object is determined. In most cases, the size of fitted reference objects depends on all its fit points, and the size of intersected/combined objects depends on their source objects. Other sizing methods can be forced by Measurements > Resize reference objects.
. . . . . . . . . . . . . . . . . . . . . . . . . . . . . . . . . . . . . . . . . . . . . . . . . . . . F I T S T A T U S
Status information about the last fitting process of the reference object:
• Valid: Successfully fitted to current calibrated materialLast fitting or refitting process succeeded without problems. Reference object is synchronized with current situation.
• Invalid: Not synchronized with current situation (calibration change?)The underlying data (voxel data, calibration material, polygon data) has changed since the last fitting process.
• Invalid: Automatic refit failedLast refitting process (due to resolution adjustment or template import) failed, most likely because too few fit points could be adjusted to the new underlying surface.
• Valid: Isosurface not found for iteration >0, but previous result could be takenLast (iterative) refitting process (due to resolution adjustment or template import) did not succeed completely, but a valid result could still be taken from a previous iteration.

M E A S U R E M E N T S M E N UDialog: Reference object properties
19-4 myVGL Manual Release 2.0
1 9
For derived reference objects, i.e. manipulation results, the status informa-tion has similar meanings, but it refers to the status of the source objects: if one of the source objects has a warning or error status, this status will be repeated for the derived object.
. . . . . . . . . . . . . . . . . . . . . . . . . . . . . . . . . . . . . . . . . . . . . . . . . . . . P O S I T I O N / R A D I U S / C O N I C I T Y / D I R E C T I O N / N O R M A L
Geometric parameters. Position always denotes the center of the object. Direction and normal vectors are normalized to unit length. For cones, the radius at the center position is given.
. . . . . . . . . . . . . . . . . . . . . . . . . . . . . . . . . . . . . . . . . . . . . . . . . . . . D E V I A T I O N S
Statistic measures of the fit point distribution. Peak/valley deviations denote the maximum positive/negative distances of any fit point to the ref-erence object’s surface. The form deviation equals the sum of peak and val-ley.Notes:
• For circles, the deviation is the distance to the actual circle outline, not merely the circle’s plane.
• For lines that were initially specified in a 2D window, the 2D orientation at fitting time is stored and used to provide a “left of line / right of line” distinction for signed distances (like for all other reference object types except the point). If a line has no orientation information, all distances, will be positive (valley deviation zero per definition).
• The deviation signs are chosen such that positive deviations indicate points outside the calibrated material.
Fi t pointsShows a list of the fit points used to calculate the properties of the reference object. The list includes information such as the position, deviation and gray value for each point. The list can be sorted according to each property by selecting the property column. Points can be visualized individually or in groups by selecting them in the list.
HistogramShows the histogram plot of the fit point count against deviation. The col-oring is determined by the reference deviation in the Colors section.
. . . . . . . . . . . . . . . . . . . . . . . . . . . . . . . . . . . . . . . . . . . . . . . . . . . . B I N N I N G
In the Binning pull-down menu, you can choose between no binning and a binning according to the sections of the color bar.

. . .
. .M E A S U R E M E N T S M E N UCM Reporting
Release 2.0 myVGL Manual 19-5
CumulatedShows the accumulated percentile of fitpoints against their deviation. The accumulated statistics can be shown for fitpoints with either a positive or negative deviation or for all fitpoints as a function of their absolute numer-ical deviation by selecting the corresponding entry in the Cumulation box. By moving the green cross-hair in the diagram the percentage of points within a given deviation (or alternatively the max deviation for a given per-centage) can be obtained. The latter is also possible by directly typing in the values in the Deviation or Percentage dialogs.
Tips and tricks In contrast to the other properties sections, the Histogram and Cumulated graphs are also available when multiple reference objects are selected. They will then reflect the union of both sets of fit points.
ColorsSets the interval width and colors used in the histogram plot and for the color-coded visible fit points in 2D and 3D. By default the interval width is in units of the automatically determined standard deviation. This is the standard deviation of all selected reference objects or (if no objects are selected) all reference objects found in the scene.By unchecking the auto box a custom value can be specified. To change the color used for a specific interval range double click the corresponding color bar to launch the color selection tool.
. . . . . . . . . . . . . . . . . . . . . . . . . . . . . . . . . . . . . . . . . . . . . . . . . . . . CM Reporting
Warning In myVG L , all grayed settings are displayed for informational value only. Editing those settings or making new measurements is only possible using VG Stud io MAX 2 .0 with the Measurements module installed.
Use the CM reporting dialog to view, edit and print detailed information about reference objects and features. The dialog will show reference objects and features connected to a single volume/polygon, which depends on the current Scene Tree selection. The name of the current volume/poly-gon is shown in the caption of the dialog.
Tips and tricks myVG L will automatically show the CM reporting dialog when you double-click on any CM feature in the Scene Tree.

M E A S U R E M E N T S M E N UCM Reporting
19-6 myVGL Manual Release 2.0
1 9
General remarksThe Features and Reference objects pages basically employ myVG L ’s stan-dard reporting table functionality:
. . . . . . . . . . . . . . . . . . . . . . . . . . . . . . . . . . . . . . . . . . . . . . . . . . . . T A B L E S E L E C T I O N
Select one or more table rows by left-clicking while holding <Ctrl> or <Shift> or by using the up-down arrow-keys while holding <Shift>. Selecting rows will also select corresponding objects in the Scene Tree.
. . . . . . . . . . . . . . . . . . . . . . . . . . . . . . . . . . . . . . . . . . . . . . . . . . . . E D I T I N G
Double-click into text cells with white background to edit their contents (e.g. object name). Grayed-out cells are not editable.
. . . . . . . . . . . . . . . . . . . . . . . . . . . . . . . . . . . . . . . . . . . . . . . . . . . . S C R E E N S H O T S
Use the Screenshots section below the table to capture images from one of the 2D or 3D views for the currently selected item in the table. Only avail-able if exactly one row is selected.You can provide a description for every captured image by clicking the default <no description> text.Delete existing screenshots by pressing <Del>.
. . . . . . . . . . . . . . . . . . . . . . . . . . . . . . . . . . . . . . . . . . . . . . . . . . . . C O N T E X T M E N U
Right-click anywhere in the table to bring up the table’s context menu:
• Columns: Toggle the visibility of any available column
• Store current visibilities and widths as default settings: Store column visibility and order on disk to remember them for the next time you restart myVG L .
• Remove entries: Removes a complete row from the table.• Export as CSV: Exports the table values as CSV (Comma Separated
Values) list.
• Copy to clipboard: Copy the selected rows (and the table header texts) into the system’s clipboard. The clipboard information is provided both as plain text and a rich-text table, so when pasting into a rich-text-capable application like a wordprocessor, you will see a proper table with cells borders and bold headers.
. . . . . . . . . . . . . . . . . . . . . . . . . . . . . . . . . . . . . . . . . . . . . . . . . . . . C O L U M N - O R D E R
Left-click on any table header on top of each column while holding <Ctrl>. You can now move the column left or right to another place.
. . .
. .M E A S U R E M E N T S M E N UCM Reporting
Release 2.0 myVGL Manual 19-7
. . . . . . . . . . . . . . . . . . . . . . . . . . . . . . . . . . . . . . . . . . . . . . . . . . . . R O W - S O R T I N G
Left-click on any table header on top of each column to sort the entire table according to this column. Click again to reverse the sort order. The current sort order is indicated by an arrow inside the column header.
. . . . . . . . . . . . . . . . . . . . . . . . . . . . . . . . . . . . . . . . . . . . . . . . . . . . S P E C I A L C O L U M N S
In addition to text cells, some columns contain combo-boxes for selecting special options.
FeaturesLists all existing reference objects and their properties here.
As each feature is defined in a distinct coordinate system, lengths and posi-tions displayed in the table do not refer to the currently selected coordinate system, but to the coordinate system of the feature itself!
. . . . . . . . . . . . . . . . . . . . . . . . . . . . . . . . . . . . . . . . . . . . . . . . . . . . F E A T U R E L I S T
• NameThe name of the feature. Column is editable.
• TypeThe type of the feature. Can be one of the following:
• DistanceDefault distance measuring method. The distance line between the center positions of the two reference objects is calculated.
• Distance (mid perpendicular)Reference object A is considered as finite, while reference object B is considered as infinitely extended. The mean between minimum and maximum distance (orthogonal to reference object A) between the two objects is determined.
• Distance (min perpendicular)Reference object A is considered as finite, while reference object B is considered as infinitely extended. The minimum distance (orthogonal to reference object A) between the two objects is determined.
• Distance (max perpendicular)Reference object A is considered as finite, while reference object B is considered as infinitely extended. The maximum distance (orthogonal to reference object A) between the two objects is determined.
• Distance (min finite)Both reference objects are considered as finite. The minimum distance between the two objects is determined.

M E A S U R E M E N T S M E N UCM Reporting
19-8 myVGL Manual Release 2.0
1 9
• Distance (max finite)Both reference objects are considered as finite. The maximum distance between the two objects is determined.
• Distance (min infinite)Both reference objects are considered as infinitely extended. The minimum distance between the infinite objects is determined if they are not intersecting.
• Distance (min)Reference object A is considered as finite, while reference object B is considered as infinitely extended. The minimum distance (orthogonal to reference object B) between the two objects is determined.
• Distance (centroid)The distance between the geometrical center of all fit points used to fit reference object A and object B is determined. Please note that the geometrical center of an object is calculated with respect to the fit point coordinates only. It is not calculated as the geometrical center of the fitted reference object A or B.
• AngleAngle between two reference objects. Angles can be measured between line and line, line and plane or plane and plane.
• PositionDetermines the position of a single reference object in the current Coordinate system, that is its distance to the origin.
• RadiusRadius of a single reference object. Radii can be measured for circles, spheres, cylinders and cones. For spheres and cones, the position of the radius measurement, which is determined at creation time, is relevant. For circles, cylinders and cones, radius features are only well-defined if their coordinate system is aligned to the measured object’s axis/normal.
• DiameterDiameter of a single reference object. Equals twice the Radius.
• ProjectionAvailable for Distance, Position and Angle features. These can be projected along one or two spatial dimensions:
A dX (or dY or dZ) Distance/Position feature refers to the x (or y or z)-compo-nent of the measured distance-line only.A dXY (or dXZ or dYZ) Distance/Position feature refers to the distance-line projected onto the according plane.
If no projection is desired, use a dXYZ feature.

. . .
. .M E A S U R E M E N T S M E N UCM Reporting
Release 2.0 myVGL Manual 19-9
Angles cannot be projected onto a single axis. For Angle features, only dXY, dXZ, dYZ and dXYZ projections are available.
Projection directions are always referring to the axes of the feature’s Coordi-nate system.
• ViewDistance or position features with dX, dY or dZ Projection can exist in two possible orientations (a dX-feature can show up in a Top/Bottom (XY)-slice or a Front/Back (XZ)-slice). The View determines this orientation.
• Coordinate systemSpecifies the coordinate system in which the feature is defined.
• Source A / Source BThe reference object(s) used to define this feature. For position, radius and diameter features, only Source A is present. Distance and angle features have both source objects.
• RelativeAvailable and relevant for projected (non-dXYZ) distance features only. In relative mode, the feature does not visualize the measured distances directly, but rather visualizes the distances to the coordinate system origin for each endpoint.The Relative setting has no effect on the numerical value of the feature.
• DepthAvailable and relevant for projected (non-dXYZ) features only. The feature depth determines the position in which the projected feature is visualized in 3D. The feature’s orientation being determined by its Projection and View, there is still one degree of freedom when displaying it in a 3D view. When dragging a feature in a 2D view, the initial depth is determined from the slice position in which the feature was dragged out. The depth can later be changed freely.
• SnapAvailable and relevant for projected (non-dXYZ) distance features only. The snap fixes the feature’s Depth to either the start- or the end-point of the distance measurement (Begin/End), or retains the given depth (Free).
• ValueThe feature’s numerical value. For angle features, the value is displayed in the current angle unit, for all other types of features it is displayed in the current length unit.
• NominalThe desired nominal value for the feature. This cell is editable. Together with the Tolerance neg./pos. settings, myVG L will determine whether the fea-ture is inside the prescribed tolerance band and set the features status

M E A S U R E M E N T S M E N UCM Reporting
19-10 myVGL Manual Release 2.0
1 9
accordingly. If either nominal value or tolerances are not set, the tolerance test is omitted.
• Tolerance neg. / Tolerance pos.The allowed tolerance of the feature’s actual Value towards the given Nomi-nal value. This column is editable. After initially entering one of the neg./pos. tolerance values, the other value will be set to the same value, providing a symmetric tolerance band. Afterwards, you can change the positive and negative tolerances independently.
• StatusStatus information about the feature:
• OkNo errors or warnings. Feature and source objects are well defined.Tolerance band is present and feature lies within.
• Ok, but no tolerance settingsFeature and source objects are well defined, but no tolerance band is given. The feature value is not tested against any allowed range.
• Out of tolerance bandFeature and source objects are well defined, but the feature’s actual value lies outside the prescribed tolerance band.
• Invalid measurementAlthough the source objects are valid, measurement of the desired feature is not possible. This can happen in case of undefined measurement modes (such as a centroid-distance between objects without fit points).
• Invalid source object(s)The feature’s source objects indicate an error status.
• Inconsistent source object(s)Feature could be measured, but its source objects are indicate a warning status. Probably the source objects need to be refitted, or the last refit succeeded only partially.
• ImageChoose On if you want a detailed 2D-image and feature description to be generated on a separate page of the report. myVG L will automatically create a suitable slice image for the feature.
Note that the generated image will only contain the reported feature, its source reference objects and its parent volume/polygon. All other reference objects, features, analyses etc. will be hidden. The 2D slice position used for taking the image is determined by the feature’s position. The zoom fac-

. . .
. .M E A S U R E M E N T S M E N UCM Reporting
Release 2.0 myVGL Manual 19-11
tor of the image is chosen such that the entire parent volume/polygon is vis-ible. For all features with a preferred orientation (namely all except dXYZ-positions and -distances), a single image in this orientation will be created. Otherwise an orthographic projection with three orthogonal views relative to the feature’s coordinate system is generated.
• CapturesThe number of images captured for this objects in the Screenshots section.
Reference objectsLists all existing reference objects and their properties.
Warning All geometric properties like positions and directions will be displayed and reported with respect to the currently selected coordinate system and the currently selected display unit.
For possible details on reference object properties refer to Dialog: Refer-ence object properties on page 19-2.
. . . . . . . . . . . . . . . . . . . . . . . . . . . . . . . . . . . . . . . . . . . . . . . . . . . . R E F E R E N C E O B J E C T L I S T
• NameThe name of the reference objects. This column is editable.
• TypeThe object’s type. Either point, line, circle, plane, sphere, cylinder, cone.
• Position X / Position Y / Position ZThe object’s position in physical length units.
• Direction X / Direction Y / Direction ZThe object’s normalized direction vector (available for line, cylinder, cone).
• Normal X / Normal Y / Normal ZThe object’s normalized normal vector (available for circle, plane).
• RadiusThe object’s radius (available for circle, sphere, cylinder, cone).
• ConicityThe object’s conicity in angle units (available for cone).
• Form / Peak / ValleyThe object’s fit point deviation measures (available for fitted reference objects only).
• Construction methodThe object’s construction method (see Properties on page 19-3).

M E A S U R E M E N T S M E N UCM Reporting
19-12 myVGL Manual Release 2.0
1 9
• ImageChoose an option other than None if you want a detailed 2D-image and object description to be generated on a separate page of the report. The selected option determines the type of image myVG L will automatically cre-ate for the object. Orthographic projection will produce three orthogonal views, the Top, Bottom, Left, Right, Front, Back options each produce a single 2D view in the specified orientation.
The image orientation is relative to the currently selected coordinate sys-tem!
Note that the generated image will only contain the reported reference object and its parent volume/polygon. All other reference objects, features, analyses etc. will be hidden. The reference object is always shown without visible fit points and in a “highlighted” visual state. The 2D slice position used for taking the image is determined by the reference object’s position. The zoom factor of the image is chosen such that the entire parent vol-ume/polygon is visible.
• Zoomed imageThe zoom view is almost identical to the Detail view, but will generate an image that is additionally zoomed in by a Zoom factor prescribed on the Report page.
• Histogram imageChoose whether to include the fit point histogram and/or the cumulated his-togram in the reporting details for this reference object (available for fitted reference objects only).
• CapturesThe number of images captured for this objects in the Screenshots section.
Capture imagesThe Capture images tab allows to take screenshots from the selected work-space widget. The captured images are listed separately within the final report apart from screenshots created in the Features or Reference objects section.
ReportThe Report page lets you specify the content and layout of the final report.
Use the Print button to show the Print preview dialog. There, use the Previous page and Next page buttons to navigate through the report preview. Click the Layout button to bring up the Print layout dialog. There you can specify the orientation (Portrait or Landscape), the paper size and the desired output resolution.
Use the Save button to save the report to disk in the desired format:

. . .
. .M E A S U R E M E N T S M E N UCM Reporting
Release 2.0 myVGL Manual 19-13
• Rich Text Format: Save the entire report with tables and images as an .rtf-document.
• HTML Format: Save the entire report with tables and images as an .html-document.
• Comma Separated Values: Save only the table(s) without images and further formatting as a .csv-file.
. . . . . . . . . . . . . . . . . . . . . . . . . . . . . . . . . . . . . . . . . . . . . . . . . . . . R E P O R T S E C T I O N S
Choose whether the report should contain the list of Features and/or Refer-ence objects.
. . . . . . . . . . . . . . . . . . . . . . . . . . . . . . . . . . . . . . . . . . . . . . . . . . . . D E T A I L I M A G E S S E T T I N G S
Use these settings to change the appearance of the detail images you speci-fied in the Features and/or Reference objects tables. Zoom factor sets the zoom level for all Detail zoom view images in the respective tables. By enabling the Manual check box you can change Color mode and or the Background color of the various workspace widget screenshots created within the analysis.
. . . . . . . . . . . . . . . . . . . . . . . . . . . . . . . . . . . . . . . . . . . . . . . . . . . . L O G O
Specify an image file that should be utilized as a logo within the report.
. . . . . . . . . . . . . . . . . . . . . . . . . . . . . . . . . . . . . . . . . . . . . . . . . . . . C E L L S
Each report page will contain a set of user defined cells. These cells are part of the report layout and their content is customizable. Simply click on a cell and select an attribute from the pull down. Either assign the attribute to the Cell title or to the Cell content. The Cell title is a textual description of the cell content. The Cell content defines what shall be displayed within the cell. You can append attributes to previous attributes by clicking the assign button again.

M E A S U R E M E N T S M E N UCM Reporting
19-14 myVGL Manual Release 2.0
1 9

Release 2.0 myVGL Manual 20-1
. . . . .
. . . . . . . . . . . . . . . . . . . . . . . . . . . . . . . . . . . . . . . . . .NOMINAL/ACTUAL COMPARISON MODULE 20
he nominal/actual comparison tool is designed to compare voxel data sets with CAD polygonal models or voxel data sets with voxel data sets. As a result of such an analysis the user will get a
detailed report about the detected deviations and a false color coded data set for documentation purposes.
Nominal/actual comparison is an optional add-on module for VG Stud io MAX 2 .0 . It is not available for myVG L . However, if a project contains an analy-sis, the result of this analysis is available in myVG L .
If you are interested in more extensive functionality than the one offered by myVG L , you have the chance to evaluate our other products, VG Studio 2 .0 or VG Stud io MAX 2 .0 :
www.volumegraphics.com/products/evaluation/form.html
For further questions about our product portfolio, please contact
The nominal/actual comparison dialog consists of several pages in which you can inspect the nominal/actual analysis result. Each page shares in its display a Close button which closes the dialog without performing an anal-ysis. A status bar at the bottom of each page signals the current status of the analysis. The status can either be
• ready to go
Everything needed for the analysis is available.
• analysis is up to date
The current analysis result is valid.
• analysis update required
Some user action led to an invalidation of the current analysis result.
• object is not calibrated
No calibration information is available for actual object.
• no valid reference object
The nominal object is either missing or (if it is a volume data set) not prop-erly calibrated.
T
N O M I N A L / A C T U A L C O M P A R I S O N M O D U L ESettings
20-2 myVGL Manual Release 2.0
2 0
. . . . . . . . . . . . . . . . . . . . . . . . . . . . . . . . . . . . . . . . . . . . . . . . . . . . Sett ings
Warning In myVG L , all grayed settings are displayed for informational value only. Editing those settings or running the analysis is only possible using VG Stud io MAX 2 .0 with the Nominal/Actual comparison module installed.
Preset Select ionSelect or remove a user defined preset from the preset selection pull down. Any parameter set applied within the Settings page can be saved as a user defined preset. Presets can be deleted, exported or imported via the respec-tive buttons.
Calculat ion parametersIn the Nominal/Reference object pull-down menu select the nominal object against which the actual object will be compared.
The surface of the nominal object can be either above or below the surface of the actual object within a certain distance. Specify the Max. distance to determine how far away from one surface the other will be sought. Dis-tances exceeding the specified Max. distance value will be marked as unde-fined.
The Skip X, Skip Y and Skip Z parameters can be used to skip voxels and thus reduce the time to perform the analysis at the cost of lower accuracy.
OptionsIf the surface of the nominal object is below the surface of the actual object the variance between the two surfaces is positive. If the surface of the nom-inal object is above the surface of the actual object the variance is negative. If both surfaces match there is zero variance. By enabling the swap distance signs option, you invert the variance value. The variance must be between +/- Max. distance. Variances above or below +/- Max. distance are marked as undefined which is represented through the special values +/- inf.
. . . . . . . . . . . . . . . . . . . . . . . . . . . . . . . . . . . . . . . . . . . . . . . . . . . . Colors
Here you can specify a color coding scheme used for the representation of the analysis result mask.
LUTGives you a preview of how the color lookup table is partitioned into color sections.

. . .
. .N O M I N A L / A C T U A L C O M P A R I S O N M O D U L EColors
Release 2.0 myVGL Manual 20-3
Sect ionsIn the Sections element the appearance of each color section is defined. Cre-ate smooth will generate one color section. Clicking the button will show the Create smooth table dialog. Define the variance range by entering from and to values.
Create stepped generates a set of color sections. Clicking the button will show the Create stepped table dialog. Define the variance range by entering from, to and step values.
Clicking Auto scale fits the LUT to the range of analysis results.
There are two special color sections defining the color value for variances above and below the specified Max. Distance. The variances above the posi-tive Max. Thickness are marked as +inf, the variances below the negative Max. Thickness are marked as -inf.
Each generated color section can be modified individually. In the Sections table simply click onto an entry to modify its value. From and To define the start and end values of the color sections. Type switches between the color-ing schemes Constant, Gradient, Rainbow and Reverse Rainbow. Detail lets you modify the appearance of the selected Type color scheme. Right-clicking onto a color section shows a context menu with the options split and merge. Splitting a color section divides it up into two new color sections where each represents half of the original section. Merging several color sections results into a single color section. Only consecutive intervals can be merged.
OptionsVariance values outside the specified Max. Distance value (see Calculation parameters on page 20-2) are coded with specific color values. Select the Yes option from the Clamp outside distances pull down to map the color of these variances to the one specified in the Clamp colors section on the Colors page.
Tips and tricks Use this option if you have several nominal/actual analyses with different Max. Thickness values. In this case, every analysis shares a common LUT, whose +/- inf values are specified by the analysis with the largest Max.
Thickness. This might obscure the variance values of analyses with smaller Max. Thickness values.
By choosing Yes or No for Show 3D result overlay or Show 2D result overlay you determine whether the color coded result is visible in the 3D and 2D views respectively. If the comparison has been performed, switching these settings will be of immediate effect in the views.

N O M I N A L / A C T U A L C O M P A R I S O N M O D U L EHistogram
20-4 myVGL Manual Release 2.0
2 0
Clamp colorsSelect a color for the clamped variance values by clicking on the Negative and/or Positive labeled color chooser (see Options on page 20-3).
Tickmarks on color barIf Auto tickmarks is enabled, equidistant tick marks are produced for the color bars. If Auto tickmarks is disabled, tick marks appear only at the color section boundaries.
Preset se lect ionHere you can load, save, delete, import and export LUT presets.
When saving a LUT, you can choose if you want to save an Absolute Preset, i.e. a preset that maps colors to absolute variance. If the checkbox is not activated, colors are saved relative to the range of the analysis.
. . . . . . . . . . . . . . . . . . . . . . . . . . . . . . . . . . . . . . . . . . . . . . . . . . . . Histogram
This tab shows a histogram of the calculated deviations over the entire ana-lyzed surface of the actual object. The histogram bars are colored accord-ing to the current Colors settings.
TypeHistograms of the Type: Point count are based upon a finite number of tested positions on the actual object’s surface. If you switch to Type: Surface, the histogram is calculated with regard to the physical surface covered by each test position. The label of the y-axis will adjust accordingly. This switch is significant for strongly anisotropic data sets where the mapping of probed positions to their covered surface is recommended.
BinningIn the Binning pull-down menu, you can choose between no binning and a binning according to the sections of the color bar.
Context menuRight-click the histogram area to bring up a context menu offering the fol-lowing options:
• Copy to clipboardCopies a screenshot of the histogram to the system clipboard.
• Show grid lines X/YToggles the display of dashed indicator lines for the respective axis.

. . .
. .N O M I N A L / A C T U A L C O M P A R I S O N M O D U L ECumulated
Release 2.0 myVGL Manual 20-5
• Reset zoomZooms the entire histogram to the current window size.
. . . . . . . . . . . . . . . . . . . . . . . . . . . . . . . . . . . . . . . . . . . . . . . . . . . . Cumulated
This tab displays the cumulated percentage relative of deviations. It is derived from the Histogram data. You can use the Cumulated curve to answers questions like “How many percent of the analyzed surface differ less than x mm from the nominal value?” or, conversely, “What is the smallest deviation that ninety percent of the analyzed surface do not exceed?“.
TypeThe Type pull-down menu is the same as in Histogram tab. See Histogram on page 20-4 for more details.
Cumulat ionCumulation does not make sense for mixed positive and negative devia-tions. Thus, you can choose either a Cumulation of Absolute deviations, or restrict the cumulation to Only positive or Only negative deviations. The label of the x-axis will adjust accordingly.
Deviat ion / PercentageThe Deviation and Percentage controls show the cumulated percentage value below a certain deviation. They are synchronized with the green indicator lines in the graphical view. You can enter a desired reference deviation or percentage in the controls or drag the indicator lines with the mouse to change the current position.
Context menuRight-click within the graph to bring up a context menu offering the fol-lowing options:
• Copy to clipboardCopies a screenshot of the graph to the system clipboard.
• Show grid lines X/YToggles the display of dashed indicator lines for the respective axis.
• Reset zoomZooms the entire histogram to the current window size.

N O M I N A L / A C T U A L C O M P A R I S O N M O D U L EGeneral table features
20-6 myVGL Manual Release 2.0
2 0
. . . . . . . . . . . . . . . . . . . . . . . . . . . . . . . . . . . . . . . . . . . . . . . . . . . . General table features
Right click anywhere into the Annotations table to show its context menu. The menu contains the following options:
• ColumnsHere you toggle the visibility status of each column by enabling / disabling the respective checkbox.
• Save as default column layoutAny modifications applied to the table e.g. changing the sorting order of a column, enabling / disabling of columns or changing the order in which each column appears can be saved as default column layout. This layout will be active until you selected Original column layout.
• Original column layoutRestores the original table layout and discards any modifications applied by the user.
• Copy to clipboardCopies the table into the clipboard.
• Export as CSV ...Exports the table values as CSV (Comma Separated Values) list.
• Remove entriesRemoves a complete row from the table
To change the order in which each column appears in the table press <Ctrl> and left click the desired column header. Keep the <Ctrl> key pressed and drag the mouse over the available column headers until the new position is reached. Release the mouse button to insert the column at its new position.
. . . . . . . . . . . . . . . . . . . . . . . . . . . . . . . . . . . . . . . . . . . . . . . . . . . . Annotations
The Annotations table lists every annotation created for the selected analy-sis. Here you can see or edit information about the annotations.
The Annotations table lists every annotation created for the selected nomi-nal/actual analysis. Here you can inspect information supplied by the anno-tations or edit annotations properties.
To create an annotation select the desired nominal/actual analysis within the Scene Tree and click the right mouse button to show the analysis con-text menu. Select New > Analysis annotation and click into any 2D window or the 3D window to position the annotation.

. . .
. .N O M I N A L / A C T U A L C O M P A R I S O N M O D U L EAnnotations
Release 2.0 myVGL Manual 20-7
The annotation is designed as a movable label displaying informations about the current analysis. A nominal/actual annotation contains the anno-tation name, the current Variance (Var), the tolerance values specified via Tolerance from and Tolerance to and the position of the annotation.
The Variance value is color coded. The green color signalizes an available Variance value for the current position and the current tolerance values. The yellow color signalizes that for the current annotation position there is no Variance value available. This happens if the annotation is moved outside the nominal/actual result area.The red color signalizes that the Variance value at the current annotation position is not inside the specified tolerance interval.
To minimize/maximize the annotation double-click anywhere inside the annotation.
Furthermore, you can arrange all annotations automatically by right-click-ing within the respective window and choosing Annotations > Arrange.
The individual columns within the nominal/actual‘s Annotations table are:
• Name
The name of the annotation.
• in Comparison
The name of the Nominal/Actual comparison the annotation belongs to.
• Pos (X, Y, Z)
Position of the annotation.
• Variance
The nominal/actual variance of the analyzed voxel set at the given annota-tion position.
• Tolerance from/to
The maximum nominal/actual deviation for the respective annotation.• Description
Enter a description of the annotation used for reporting.
• Detail view
Select a view mode for reporting. Either choose one of the six view direc-tions (top, bottom, front, back, right or left) or choose orthographic projection.
• Detail zoom view
Select a zoomed Detail view for reporting.
• Images
Displays the amount of images generated with the Capture from function. Below the Annotations table is an area reserved for screenshots. To capture

N O M I N A L / A C T U A L C O M P A R I S O N M O D U L ECapture images
20-8 myVGL Manual Release 2.0
2 0
a screenshot first select a view from the pull down, then click the Capture from button. Each screenshot will be displayed in the area above. The screenshots can be chosen to appear in the final report. You can specify a name for the image by clicking the <no description> label twice.
. . . . . . . . . . . . . . . . . . . . . . . . . . . . . . . . . . . . . . . . . . . . . . . . . . . . Capture images
The Capture images page allows to take screenshots from the selected workspace widget. The captured images are listed separately within the final report apart from screenshots created in the Annotations section.
. . . . . . . . . . . . . . . . . . . . . . . . . . . . . . . . . . . . . . . . . . . . . . . . . . . . Report
The Report page lets you specify the content and the layout of the final report. Either save the report as .rtf (Rich Text Format) or .html document by clicking the Save button, or print it by clicking the Print button. The Print button will show you a Print preview dialog. Use the Previous page and Next page button to navigate through the report preview. Click the Layout button to bring up the Print layout dialog. There you specify the orientation (Portrait or Landscape), the paper size and the resolution.
Report sect ionsSelect which sections of the analysis should be included or excluded from the report be either enabling or disabling the corresponding checkboxes Settings, Annotations, Deviation histogram or Cumulated histogram.
Detai l images set t ingsUse these settings to change the appearance of the detail images you speci-fied in the Annotations table. Zoom factor sets the zoom level for the Detail zoom view images in the respective tables. By enabling the Manual check box you can change Color mode and or the Background color of the various workspace widget screenshots created within the analysis.
LogoSpecify an image file that should be utilized as a logo within the report.
Cel lsEach report page will contain a set of user defined cells. These cells are part of the report layout and their content is customizable. Simply click on a cell and select an attribute from the pull down. Either assign the attribute to the Cell title or to the Cell content. The Cell title is a textual description of the cell content. The Cell content defines what shall be displayed within the
. . .
. .N O M I N A L / A C T U A L C O M P A R I S O N M O D U L EReport
Release 2.0 myVGL Manual 20-9
cell. You can append attributes to previous attributes by clicking the assign button again.

N O M I N A L / A C T U A L C O M P A R I S O N M O D U L EReport
20-10 myVGL Manual Release 2.0
2 0

Release 2.0 myVGL Manual 21-1
. . . . .
. . . . . . . . . . . . . . . . . . . . . . . . . . . . . . . . . . . . . . . . . .DEFECT DETECTION MODULE 21
he Defect Detection tool is designed to process voxel data sets for internal defects and provides detailed analysis results with informa-tion on each individual defect as well as overall statistical informa-
tion. A defect analysis report will be generated, containing information like position, size, surface and volume of each individual defect.
Defect detection is an optional add-on module for VG Stud io MAX 2 .0 . It is not available for myVG L . However, if a project contains an analysis, the result of this analysis is available in myVG L .
If you are interested in more extensive functionality than the one offered by myVG L , you have the chance to evaluate our other products, VG Studio 2 .0 or VG Stud io MAX 2 .0 :
www.volumegraphics.com/products/evaluation/form.html
For further questions about our product portfolio, please contact
The defect detection dialog consists of several pages in which you can inspect the defect detection analysis result. All pages share the button Close.
• CloseExits the dialog without performing an analysis. Parameter settings will be saved. Reopen the analysis by double-clicking its entry in the Scene Tree.
A status bar at the bottom of each page signals the current status of the analysis. The status can be one of the following:
• ready to goParameters are specified and consistent.
• analysis is up to dateThe current analysis result is valid..
• analysis update requiredSome user action led to an invalidation of the current analysis result.
• invalid parameter
At least one of the parameters has an invalid value. Check the parameters or click Close.
T

D E F E C T D E T E C T I O N M O D U L ESettings
21-2 myVGL Manual Release 2.0
2 1
Tips and tricks An invalid or not up-to-date status of an analysis is accentuated in the Scene Tree with a warning sign. Double-click this analysis to open it and check the status bar for messages.
. . . . . . . . . . . . . . . . . . . . . . . . . . . . . . . . . . . . . . . . . . . . . . . . . . . . Sett ings
Warning In myVG L , all grayed settings are displayed for informational value only. Editing those settings or running the analysis is only possible using VG Stud io MAX 2 .0 with the Defect detection module installed.
Preset Select ionSelect or remove a user defined preset from the preset selection pull down. Any parameter set applied within the Settings page can be saved as a user defined preset. Presets can be deleted, exported or imported via the respec-tive buttons.
Algor i thmSelect an algorithm from the pull down which the defect detection should use for the analysis. Based on the selected algorithm the Calibration parame-ters will differ.
The defect detection procedure consists of two steps.
• Check each voxel if it might be part of a defect or not. Create groups of connected defect candidates.
• Check each group of defect candidates if it fits the parameters specified by the user.
The following algorithms are available:
• Only thresholdEvery group of candidate defects matching the size specifications is con-sidered a defect if the gray value is below the specified threshold.
• DefaultTo allow for gray value variations, a more sophisticated approach is used, thus also detecting defects, e.g., in dark areas.
• EnhancedThis is a variation of the Default algorithm in a more fine-grained mode, thus providing more sophisticated results but requiring more time.

. . .
. .D E F E C T D E T E C T I O N M O D U L ESettings
Release 2.0 myVGL Manual 21-3
• Custom defect maskThe defect analysis is based on a region of interest (ROI). The ROI is sup-posed to contain the defect candidates. To each voxel group of the ROI the analysis parameters will be applied. Define the ROI manually, by import-ing a ROI template or via a defect mask.
See the definition of the parameters for more detailed information on the algorithms.
Cal ibrat ion parameters(This section is not available for the Custom defect mask algorithm; see Defect mask selection on page 21-4 for parameters applicable to this algo-rithm instead).
• Threshold (Only Threshold algorithm only)
Defect voxels are defined only by a gray value threshold. Threshold defines the maximum defect gray value, every voxel with a gray value below Threshold is considered as part of a defect.
• Defect Max(Default and Enhanced algorithms only)
Seed voxels (defect candidates) are identified in an iterative manner. The gray value of these seed voxels has to be below the Defect Max value.
• Background(Default and Enhanced algorithms only)
Background is the lower limit of the interval for the iterations. Changing this value has less significance than changing Defect Max or Runs.
• Runs(Default and Enhanced algorithms only)
In Default algorithm, the number of the Runs determines the number of iter-ations when determining and flooding a potential defect. High values will lead to more reliable results at the cost of longer processing time.
In Enhanced algorithm, Runs determines the fineness when identifying seed voxels. Flooding will be executed until a precision of one gray value is reached.
• Use calibrationClick Use calibration to set Defect Max and Background values automatically based on the calibration of the object. This mode is recommended for sin-gle material objects and images with only a very low noise level.

D E F E C T D E T E C T I O N M O D U L ESettings
21-4 myVGL Manual Release 2.0
2 1
• Define manuallyClick Define manually to specify background and material gray values by sample areas. This procedure is similar to a calibration, but does not (re-)calibrate the object. This mode is recommended for multi-material objects and/or images with an average or above average noise level as it allows you to select the sample areas specifically with regard to defects.
Defect mask se lect ion(This section is only available for the Custom defect mask algorithm; see Calibration parameters on page 21-3 for parameters applicable to other algorithms instead).
• Custom defect maskChoose the defect mask defining which voxels are part of defects and which are not from the drop-down list.
Analysis parametersThe analysis parameters influence the second stage of the defect detection procedure.
• Min. size / Max. sizeSpecified minimum and maximum defect size.
Due to the nature of CT data, the value for Min. size should be no less than 8 voxel edge lengths (i.e. an area of 2x2x2 voxels). Increase the value decreasing data quality.
When specifying the Max. size of the defect, consider that longish cracks have a rather large volume and that an accumulation of nearby very small defects might be interpreted as one large defect. Specify the Max. size rather generously.
• Probability thresholdAll potential defect areas passing the size check will be further processed by several analysis stages. These stages try to differentiate between real defects and artifacts by utilizing sophisticated image processing algo-rithms. Each detected defect is tagged with a value indicating the probabil-ity that it is a real defect. Specify the Probability threshold so that only defects with a probability above the threshold will be included in the list.

. . .
. .D E F E C T D E T E C T I O N M O D U L ESettings
Release 2.0 myVGL Manual 21-5
The figure below shows two defects with different Probabilities where the left defect has a ten times higher Probability than the defect on the right hand side.
• check neighborhoodIf this option is enabled the defect detection algorithm compares the poten-tial defect with its local neighborhood. If a potential defect‘s appearance is very similar to the surrounding structure, its probability will be reduced. This option is useful to reduce the number of erroneously detected artifacts. The figure below illustrates the effect of this option: The image on the left hand side has been obtained without, the one on the right hand side with neighborhood check.
• ignore streak artifactsBeam artifacts may appear within (industrial) CT data as linear dark streaks. If Ignore streak artifacts is activated these structures are detected and

D E F E C T D E T E C T I O N M O D U L ESettings
21-6 myVGL Manual Release 2.0
2 1
assigned with a low defect probability value. See the figure below for an example.
Warning A real defect might not be detected with ignore streak artifacts activated if it is connected to and/or fits into the shape of a beam artifact.A beam artifact might not be removed by the ignore streak artifacts algorithm in cases where a beam artifact is connected to another defect so that the total shape of both is no longer a straight line-like structure.
• ignore circular CT-artifactsCircular artifacts may appear within (industrial) CT data as dark circles or arcs. See the figure below for an example.
Activate ignore circular CT-artifacts to avoid an erroneous interpretation of those circular structures as defects. A dialog will prompt you to draw a cir-cle around such artifacts. Position the cross hair cursor within the center of a circular artifact. All circular structures around this center (but not the cen-ter itself) will be considered circular artifacts and will be discounted when building the defects list.

. . .
. .D E F E C T D E T E C T I O N M O D U L ESettings
Release 2.0 myVGL Manual 21-7
The center will not be visibly marked. To redefine it, deactivate and then reactivate the option.
Warning A real defect connected to a circular artifact will not be detected if ignore circular CT-artifacts is activated.A real defect with the shape of a circle (or a part of a circle) will not be detected if the center of this circle would be the rotation center defined.
• ignore center CT-artifactsThe pixel in the rotation center may appear as a dark area within (indus-trial) CT data. See the figure below for an example.
Activate ignore center CT-artifacts to avoid an erroneous interpretation of this center pixel as defect. A dialog will prompt you to draw a circle around the rotation center. Position the cross hair cursor within the center pixel.
Warning A real defect connected to a center artifact will not be detected if ignore center CT-artifacts is activated.A real defect with a point-like shape will not be detected if it is positioned in the rotation center defined.
Addi t ional defect proper t iesThe Defects table has columns for size (SizeX, SizeY, SizeZ) and projections along one axis (PX, PY, PZ). These values will only be calculated if the cal-culate size and projections checkbox is activated.
The projection values are the area of the defect projected flat along one of the axes of the currently selected coordinate system (see Coordinate Sys-tem in chapter Window menu on page 9-2).
See Defects on page 21-11 for further information on the columns of the Defects table.

D E F E C T D E T E C T I O N M O D U L EColors
21-8 myVGL Manual Release 2.0
2 1
ProcessEnable the defect size color coding checkbox to apply the color scheme defined in the Colors page to the detected defects.
Warning If this option is enabled the analysis requires more memory and needs more time for the calculation.
. . . . . . . . . . . . . . . . . . . . . . . . . . . . . . . . . . . . . . . . . . . . . . . . . . . . Colors
By default, defects are marked in red in the CT data. Apply a color coding scheme to mark defects depending on their size in different colors.
LUTPreview how the detected defects are grouped according to size and mapped to a specified color.
Sect ionsThe Sections table defines intervals of defect sizes and assignes a color or a color gradient to each interval. Define the size range of defects that are to be colored by entering a minimum and maximum defect volume (From and To, respectively).
The coloring can be based on a single size interval or a number of size intervals. To create an interval, click Create smooth or Create stepped:
• Create smooth Generates one single color section. Clicking the button will show the Create smooth table dialog.
• Create stepped Generates a set of color sections. Clicking the button will show the Create stepped table dialog. Define the defect size range covered by the sections and the step size.
Clicking Auto scale fits the LUT to the range of analysis results.
Warning Clicking Create smooth or Create stepped will delete all sections in the table and create new sections.
Each generated color section can be modified individually. In the Sections table simply click onto an entry to modify its value.
• From / To Define the start and end values of the color sections (size intervals).

. . .
. .D E F E C T D E T E C T I O N M O D U L EColors
Release 2.0 myVGL Manual 21-9
• Type Switches between the coloring schemes Constant, Gradient, Rainbow and Reverse Rainbow, thereby applying a single color or a multi-color scheme to the selected interval.
• Detail Modifies the appearance of the selected Type color scheme. Double-click to open a dialog to select a color and/or specify color attributes (for the rain-bow schemes, only the alpha channel can be modified).
• split / mergeRight-clicking onto a color section produces a context menu with the options split and merge. Splitting a color section divides it up into two new color sections where each represents half of the original section. Merging several color sections results into a single color section. Only consecutive intervals can be merged.
OptionsSelect an entry from the Defect opacity mode pull-down menu to specify the opacity of a defect. Each defect consists of a voxel set. Each voxel has an assigned intensity. Based on the intensity and the selected mode the defect opacity is calculated. The following modes are available:
• RampThe lower the defects intensity value the lower is its opacity value. The higher the defects intensity value the higher is its opacity value.
• Inverse rampThe lower the defects intensity value the higher is its opacity value. The higher the defects intensity value the lower is its opacity value.
• ConstantEvery defect is fully opaque independently of its intensity value.
Other colorsSelect a color from the Uncoded defect color chooser by double-clicking the colored area with the left mouse button. A Select color dialog will appear in which you choose the desired color.
This option only influences the color coding of the detected defects if you did not enable the defect size color coding option on the Settings page (see Process on page 21-8).
Tickmarks on color barIf Auto tickmarks is enabled, equidistant tickmarks are produced for the color bars. If Auto tickmarks is disabled, tickmarks appear only at the color section boundaries.

D E F E C T D E T E C T I O N M O D U L EGeneral table features (Context Menus)
21-10 myVGL Manual Release 2.0
2 1
Preset se lect ionSelect, remove, export or import a user defined preset from the preset selec-tion pull down.
When saving a LUT, you can choose if you want to save an Absolute Preset, i.e. a preset that maps colors to absolute defect size. If the checkbox is not activated, colors are saved relative to the range of the analysis.
. . . . . . . . . . . . . . . . . . . . . . . . . . . . . . . . . . . . . . . . . . . . . . . . . . . . General table features (Context Menus)
Right click anywhere into the Defects or Annotations tables to show their context menu. The menu contains the following options:
• ColumnsHere you toggle the visibility status of each column by enabling / disabling the respective checkbox.
• Save as default column layoutAny modifications applied to the table e.g. changing the sorting order of a column, enabling / disabling of columns or changing the order in which each column appears can be saved as default column layout. This layout will be active until you selected Original column layout.
• Original column layoutRestores the original table layout and discards any modifications applied by the user.
• Copy to clipboardCopies the table into the clipboard.
• Export as CSV ...Exports the table values as CSV (Comma Separated Values) list.
• Remove entriesRemoves a complete row from the table
• Create annotationsCreates annotations for the selected defects.
To change the order in which each column appears in the table press <Ctrl> and left click the desired column header. Keep the <Ctrl> key pressed and drag the mouse over the available column headers until the new position is reached. Release the mouse button to insert the column at its new position.
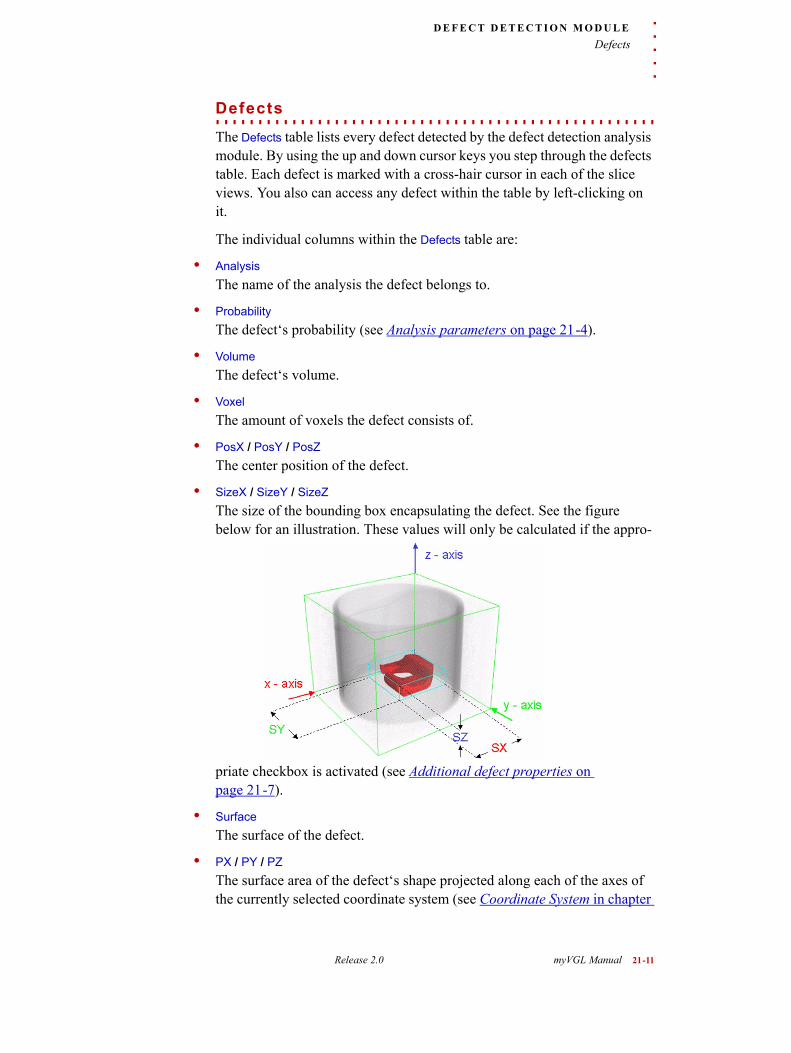
. . .
. .D E F E C T D E T E C T I O N M O D U L EDefects
Release 2.0 myVGL Manual 21-11
. . . . . . . . . . . . . . . . . . . . . . . . . . . . . . . . . . . . . . . . . . . . . . . . . . . . Defects
The Defects table lists every defect detected by the defect detection analysis module. By using the up and down cursor keys you step through the defects table. Each defect is marked with a cross-hair cursor in each of the slice views. You also can access any defect within the table by left-clicking on it.
The individual columns within the Defects table are:
• AnalysisThe name of the analysis the defect belongs to.
• ProbabilityThe defect‘s probability (see Analysis parameters on page 21-4).
• VolumeThe defect‘s volume.
• VoxelThe amount of voxels the defect consists of.
• PosX / PosY / PosZThe center position of the defect.
• SizeX / SizeY / SizeZThe size of the bounding box encapsulating the defect. See the figure below for an illustration. These values will only be calculated if the appro-
priate checkbox is activated (see Additional defect properties on page 21-7).
• SurfaceThe surface of the defect.
• PX / PY / PZThe surface area of the defect‘s shape projected along each of the axes of the currently selected coordinate system (see Coordinate System in chapter

D E F E C T D E T E C T I O N M O D U L EDefects
21-12 myVGL Manual Release 2.0
2 1
Window menu on page 9-2). See the figure below for an illustration. These
values will only be calculated if the appropriate checkbox is activated (see Additional defect properties on page 21-7)
• MinThe minimum gray value within the defect.
• MaxThe maximum gray value within the defect.
• MeanThe mean gray value within the defect.
• DeviationThe gray value deviation within the defect.
• DescriptionEnter a description for the component used for reporting.
• Detail viewSelect a view mode for reporting. Either choose one of the six view direc-tions top, bottom, front, back, right or left or choose orthographic projec-tion.
• Detail zoom viewSelect a zoomed Detail view for reporting.
• ImagesDisplays the amount of images generated with the Capture from function. Below the Components table is an area reserved for screenshots. To cap-ture a screenshot first select a view from the pull down, then click the Cap-ture from button. Each screenshot will be displayed in the area above. The screenshots can be chosen to appear in the final report.You can specify a name for the image by clicking the <no description> label twice.

. . .
. .D E F E C T D E T E C T I O N M O D U L EStatistics
Release 2.0 myVGL Manual 21-13
. . . . . . . . . . . . . . . . . . . . . . . . . . . . . . . . . . . . . . . . . . . . . . . . . . . . Statistics
You inspect various statistical data on this page. The page consists of a his-togram showing the defect volume distribution within the voxel data set, the Options area and the two sections Defects and Material.
OptionsIn the Binning pull-down menu, you can choose between no binning and a binning according to the sections of the color bar.
Furthermore, you can choose between Linear and Logarithmic scaling for both axes in the Scale X and Scale Y pull-down menus.
DefectsThe Defects section contains the following statistical values:
• Σ VoxelThe sum over all voxels contained within defects
• Σ VolumeThe sum over all defect volumes
• Σ SurfaceThe sum over all defect surfaces
• Σ PX / PY / PZThe sum over all projected defect surfaces
Mater ia lThe Material section contains the following values:
• Iso valueSpecify an iso value which defines the material boundary of the to be ana-lyzed voxel data set. This option is only available if your volume is not cal-ibrated.
• VolumeThe volume of the to be analyzed voxel data set. It is either defined by an Iso value, in case your object is not calibrated or by the calibration.
• DefectsThe sum over all defect volumes.
• PorosityThe defect volume/(material volume + defect volume) ratio.

D E F E C T D E T E C T I O N M O D U L EAnnotations
21-14 myVGL Manual Release 2.0
2 1
. . . . . . . . . . . . . . . . . . . . . . . . . . . . . . . . . . . . . . . . . . . . . . . . . . . . Annotations
The Annotations table lists every annotation created for the selected defect detection analysis. Here you can inspect information supplied by the anno-tations or edit annotation properties.
To create an annotation select the desired defect detection analysis within the Scene Tree and click the right mouse button to show the analysis con-text menu. Select New > Analysis annotation and click into any 2D window or the 3D window to position the annotation.
The annotation is designed as a movable label displaying informations about the current analysis. A defect detection annotation contains the anno-tation name, the defect‘s Volume (Vol), the defect‘s Probability (Prob) and the position of the annotation.
The Volume value is color coded. The green color signalizes an available Volume value for the current position. The yellow color signalizes that for the current annotation position there is no Volume value available. This hap-pens if the annotation is moved outside a defect.
To minimize/maximize the annotation double-click anywhere inside the annotation.
Furthermore, you can arrange all annotations automatically by right-click-ing within the respective window and choosing Annotations > Arrange.
The individual columns within the defect detection’s Annotations table are:
• AnalysisThe name of the analysis the annotation belongs to.
• NameThe name of the annotation.
• PosX / PosY / PosZPosition of the annotation.
• VolumeThe volume of the defect at the given annotation position.
• DescriptionEnter a description for the annotation used for reporting.
• ImageSelect a view mode for reporting. Either choose one of the six view direc-tions top, bottom, front, back, right or left or choose orthographic projec-tion.
• Zoomed imageSelect a zoomed Detail view for reporting.
. . .
. .D E F E C T D E T E C T I O N M O D U L ECapture images
Release 2.0 myVGL Manual 21-15
• CapturesDisplays the amount of images generated with the Capture from function. Below the Annotations table is an area reserved for screenshots. To capture a screenshot first select a view from the pull down, then click the Capture from button. Each screenshot will be displayed in the area above. The screenshots can be chosen to appear in the final report You can specify a name for the image by clicking the <no description> label twice.
. . . . . . . . . . . . . . . . . . . . . . . . . . . . . . . . . . . . . . . . . . . . . . . . . . . . Capture images
The Capture images page allows to take screenshot from the selected work-space widget. The captured images are listed separately within the final report apart from screenshots created in the Defects or Annotations section.
. . . . . . . . . . . . . . . . . . . . . . . . . . . . . . . . . . . . . . . . . . . . . . . . . . . . Report
The Report page lets you specify the content and the layout of the final report. Either save the report as .rtf (Rich Text Format) or .html document by clicking the Save button, or print it by clicking the Print button. The Print button will show you a Print preview dialog. Use the Previous page and Next page button to navigate through the report preview. Click the Layout button to bring up the Print layout dialog. There you specify the orientation (Portrait or Landscape), the paper size and the resolution.
Report sect ionsSelect which sections of the analysis should be included or excluded from the report be either enabling or disabling the corresponding checkboxes Settings, Defects, Statistics or Annotations.
Detai l images set t ingsUse these settings to change the appearance of the detail images you speci-fied in the Components and/or Annotations tables. Zoom factor sets the zoom level for the Detail zoom view images in the respective tables. By enabling the Manual check box you can change Color mode and or the Background color of the various workspace widget screenshots created within the analysis.
LogoSpecify an image file that should be utilized as a logo within the report.
Cel lsEach report page will contain a set of user defined cells. These cells are part of the report layout and their content is customizable. Simply click on a cell and select an attribute from the pull down. Either assign the attribute
D E F E C T D E T E C T I O N M O D U L EReport
21-16 myVGL Manual Release 2.0
2 1
to the Cell title or to the Cell content. The Cell title is a textual description of the cell content. The Cell content defines what shall be displayed within the cell. You can append attributes to previous attributes by clicking the assign button again.

Release 2.0 myVGL Manual 22-1
. . . . .
. . . . . . . . . . . . . . . . . . . . . . . . . . . . . . . . . . . . . . . . . .WALL THICKNESS MODULE 22
he Wall Thickness Analysis tool processes a voxel data set for areas within a user defined wall thickness interval (or, inversely, gap width interval). As a result of such an analysis the user will get a
detailed report about the detected wall thickness and a miscolored data set for documentation purposes.
Wall thickness analysis is an optional add-on module for VG Stud io MAX 2 .0 . It is not available for myVG L . However, if a project contains an analysis, the result of this analysis is available in myVG L .
If you are interested in more extensive functionality than the one offered by myVG L , you have the chance to evaluate our other products, VG Studio 2 .0 or VG Stud io MAX 2 .0 :
www.volumegraphics.com/products/evaluation/form.html
For further questions about our product portfolio, please contact
The wall thickness dialog consists of several pages in which you can inspect the wall thickness analysis result. Each page shares in its display a Close button which closes the dialog.
A status bar at the bottom of each page signals the current status of the analysis. The status can either be
• ready to go
Everything needed for the analysis is available.
• analysis is up to date
The current analysis result is valid.
• analysis update required
Modifying any Settings parameters will lead to an invalidation of the cur-rent analysis result.
• object is not calibrated
No calibration information is available.
T

WA L L T H I C K N E S S M O D U L ESettings
22-2 myVGL Manual Release 2.0
2 2
. . . . . . . . . . . . . . . . . . . . . . . . . . . . . . . . . . . . . . . . . . . . . . . . . . . . Sett ings
Warning In myVG L , all grayed settings are displayed for informational value only. Editing those settings or running the analysis is only possible using VG Stud io MAX 2 .0 with the Wall thickness module installed.
Preset Select ionSelect or remove a user defined preset from the preset selection pull down. Any parameter set applied within the Settings page can be saved as a user defined preset.
Mater ia lIf Use calibration is enabled, the analysis uses the calibration information to determine the transition between background and material. This requires the object to be calibrated before performing the analysis. If Use calibration is disabled, an iso value has to be specified manually.
Under Analysis mode, you can specify if you want the algorithm to run on the actual Material or on the Background. The latter option can be used deter-mine the gap width of objects.
Wal l th icknessUse the Min. thickness and Max. thickness values to specify which wall thick-ness interval you are interested in.
To measure meaningful distances, VG Stud io MAX 2 .0 searches the opposite surface by sending a measurement line orthogonal to the current surface. The surface area of the opposite surface is taken into account for the end point of the measurement line is defined by a search cone. Search angle specifies the search cone‘s aperture angle. See the figure below for an illus-tration of this principle.

. . .
. .WA L L T H I C K N E S S M O D U L EColors
Release 2.0 myVGL Manual 22-3
Component analys isThe Min. volume value specifies the minimal size for a component to be listed as a result.
In the Position property pull-down menu you can specify which part of a component is to be it recognized as its position: the point of its Min. thick-ness, Max. thickness or its Spatial center. This influences for example the val-ues in the Pos X/Y/Z column of the Components table.
Algor i thm deta i lsBy activating Create closed surface, additional boundaries are introduced. For example if the analysis is performed within a region of interest (ROI) and Closed surface is enabled, the ROI boundaries can be interpreted as opposite surface. See the figure below for an illustration of this principle: The image on the left hand side has been obtained using the Create closed surface option, the image on the right hand side without this option.
Enabling the Advanced mode reduces the chance to get gaps in the analysis - at the cost of significantly longer computing time.
When the High encoding precision option is enabled, the algorithm uses a finer sampling rate which will produce more precise results at the cost of significantly higher computing time. The resulting precision is displayed below this option.
. . . . . . . . . . . . . . . . . . . . . . . . . . . . . . . . . . . . . . . . . . . . . . . . . . . . Colors
Define the color coding scheme used for the representation of the analysis result mask.
LUTThe color lookup table (LUT) preview shows the partitioning into color sections.

WA L L T H I C K N E S S M O D U L EColors
22-4 myVGL Manual Release 2.0
2 2
Sect ionsIn the Sections element the appearance of each color section is defined. Cre-ate smooth will generate one color section. Clicking the button will show the Create smooth table dialog. There the wall thickness range represented by the respective section is defined.
Create stepped generates a set of color sections. Clicking the button will show the Create stepped table dialog. Define the thickness range by entering from and to values.
Clicking Auto scale fits the LUT to the range of analysis results.
Each generated color section can be modified individually. In the Sections table simply click onto an entry to modify its value. From and To define the start and end values of the color sections. Type switches between the color-ing schemes Constant, Gradient, Rainbow and Reverse Rainbow. Detail lets you modify the appearance of the selected Type color scheme. Right-clicking onto a color section shows a context menu with the options split and merge. Splitting a color section divides it up into two new color sections where each represents half of the original section. Merging several color sections results into a single color section. Only consecutive intervals can be merged.
OptionsShow result lets you enable/disable the visual representation of your analysis result. It does not modify the analysis result itself.
Select an entry from the Display mode pull-down menu to specify visual rep-resentation of the analysis results. The following modes are available:
• RampThe lower the gray value of the respective wall segment, the lower is its opacity value. The higher the defects intensity value the higher is its opac-ity value.
• Inverse rampThe lower the gray value of the respective wall segment the higher is its opacity value. The higher the defects intensity value the lower is its opacity value.
• ConstantEvery wall segment is fully opaque independently of its gray value.
• OverlayThe color of the analyzed object will be set according to its local wall thickness. This mode does not make sense if the analysis was run on the Background of an object.

. . .
. .WA L L T H I C K N E S S M O D U L EGeneral table features
Release 2.0 myVGL Manual 22-5
Tickmarks on color barIf Auto tickmarks is enabled, equidistant tick marks are produced for the color bars. If Auto tickmarks is disabled, tick marks appear only at the color section boundaries.
Preset se lect ionSelect, remove, export or import a user defined preset from the preset selec-tion pull down.
When saving a LUT, you can choose if you want to save an Absolute Preset, i.e. a preset that maps colors to absolute wall thickness. If the checkbox is not activated, colors are saved relative to the range of the analysis.
. . . . . . . . . . . . . . . . . . . . . . . . . . . . . . . . . . . . . . . . . . . . . . . . . . . . General table features
Right click anywhere into the Components or Annotations tables to show their context menu. The menu contains the following options:
• ColumnsHere you toggle the visibility status of each column by enabling / disabling the respective checkbox.
• Save as default column layoutAny modifications applied to the table e.g. changing the sorting order of a column, enabling / disabling of columns or changing the order in which each column appears can be saved as default column layout. This layout will be active until you selected Original column layout.
• Original column layoutRestores the original table layout and discards any modifications applied by the user.
• Copy to clipboardCopies the table into the clipboard.
• Export as CSV ...Exports the table values as CSV (Comma Separated Values) list.
• Remove entriesRemoves a complete row from the table
To change the order in which each column appears in the table press <Ctrl> and left click the desired column header. Keep the <Ctrl> key pressed and drag the mouse over the available column headers until the new position is reached. Release the mouse button to insert the column at its new position.

WA L L T H I C K N E S S M O D U L EComponents
22-6 myVGL Manual Release 2.0
2 2
. . . . . . . . . . . . . . . . . . . . . . . . . . . . . . . . . . . . . . . . . . . . . . . . . . . . Components
The Components table lists connected regions detected by the wall thickness analysis.
Warning Removing a Components entry will invalidate the current analysis. Click the Update button to update the analysis.
The individual columns within the Components table are:
• Analysis
The name of the analysis the component belongs to. If you select more than one wall thickness analysis, the annotations of every wall thickness analy-sis are listed. With the analysis information you can distinguish between annotations belonging to different wall thickness analyses.
• Min thickness
The minimal thickness detected within the component.
• Max thickness
The maximum thickness detected within the component.
• PosX, PosY, PosZ
Depending on what has been chosen as Position property (see Component analysis on page 22-3), this column lists the position of the Min. thickness, Max. thickness or Spatial center of the respective component.
• Bottom (X, Y, Z) and Top (X, Y, Z)
The bottom and top values for each direction provide information about the extent of an individual component.
• Volume
The volume of the component.
• Description
Enter a description for the component used for reporting.
• Images
Select a view mode for reporting. Either choose one of the six view direc-tions top, bottom, front, back, right or left or choose orthographic projec-tion.
• Zoomed image
Select a zoomed Detail view for reporting.

. . .
. .WA L L T H I C K N E S S M O D U L EAnnotations
Release 2.0 myVGL Manual 22-7
• Captures
Displays the amount of images generated with the Capture from function. Below the Components table is an area reserved for screenshots. To capture a screenshot first select a view from the pull down, then click the Capture from button. Each screenshot will be displayed in the area above. The screenshots can be chosen to appear in the final report. You can specify a name for the image by clicking the <no description> label twice.
. . . . . . . . . . . . . . . . . . . . . . . . . . . . . . . . . . . . . . . . . . . . . . . . . . . . Annotations
The Annotations table lists every annotation created for the selected wall thickness analysis. Here you can inspect information supplied by the anno-tations or edit annotations properties.
To create an annotation select the desired wall thickness analysis within the Scene Tree and click the right mouse button to show the analysis context menu. Select New > Analysis annotation, hold down <Ctrl> and click into any 2D window or the 3D window to position the annotation.
The annotation is designed as a movable label displaying informations about the current analysis. A wall thickness annotation contains the annota-tion name, the current Thickness, the tolerance values specified via Min thick-ness and Max thickness and the position of the annotation.
The Thickness value is color coded. The green color signalizes an available Thickness value for the current position and the current tolerance values. The yellow color signalizes that for the current annotation position there is no Thickness value available. This happens if the annotation is moved out-side the wall thickness result area. The yellow color can also mean that within the chosen encoding precision (see Algorithm details on page 22-3) it can not be decided if the annotation lies inside the specified tolerance inter-val.The red color signalizes that the Thickness value at the current annota-tion position is not inside the specified tolerance interval.
To minimize/maximize the annotation double-click anywhere inside the annotation.
Furthermore, you can arrange all annotations automatically by right-click-ing within the respective window and choosing Annotations > Arrange.
The individual columns within the wall thickness‘s Annotations table are:
• Analysis
The name of the analysis the annotation belongs to.
• Name
WA L L T H I C K N E S S M O D U L EAnnotations
22-8 myVGL Manual Release 2.0
2 2
The name of the annotation.
• Pos (X, Y, Z)
Position of the annotation.
• Thickness
The thickness of the analyzed voxel set at the given annotation position.
• Enc. precision
This column is disabled per default and can be enabled via the context menu. It displays the thickness interval for the respective component. The displayed uncertainty results from the chosen encoding precision.
• Min thickness
By specifying Min thickness you introduce a tolerance value which states that the thickness at the annotation‘s position must not be smaller than Min thickness.
• Max thickness
By specifying Max thickness you introduce a tolerance value which states that the thickness at the annotation‘s position must not be larger than Max thickness.
• Description
Enter a description for the annotation used for reporting.
• Image
Select a view mode for reporting. Either choose one of the six view direc-tions top, bottom, front, back, right or left or choose orthographic projec-tion.
• Zoomed image
Select a zoomed Detail view for reporting.
• Captures
Displays the amount of images generated with the Capture from function. Below the Annotations table is an area reserved for screenshots. To capture a screenshot first select a view from the pull down, then click the Capture from button. Each screenshot will be displayed in the area above. The screenshots can be chosen to appear in the final report. You can specify a name for the image by clicking the <no description> label twice.

. . .
. .WA L L T H I C K N E S S M O D U L ECapture images
Release 2.0 myVGL Manual 22-9
. . . . . . . . . . . . . . . . . . . . . . . . . . . . . . . . . . . . . . . . . . . . . . . . . . . . Capture images
The Capture images page allows to take screenshots from the selected work-space widget. The captured images are listed separately within the final report apart from screenshots created in the Components or Annotations sec-tion.
. . . . . . . . . . . . . . . . . . . . . . . . . . . . . . . . . . . . . . . . . . . . . . . . . . . . Report
The Report page lets you specify the content and the layout of the final report. Either save the report as .rtf (Rich Text Format) or .html document by clicking the Save button, or print it by clicking the Print button. The Print button will show you a Print preview dialog. Use the Previous page and Next page button to navigate through the report preview. Click the Layout button to bring up the Print layout dialog. There you specify the orientation (Portrait or Landscape), the paper size and the resolution.
Report sect ionsSelect which sections of the analysis should be included or excluded from the report be either enabling or disabling the corresponding checkboxes Settings, Components or Annotations.
Detai l images set t ingsUse these settings to change the appearance of the detail images you speci-fied in the Components and/or Annotations tables. Zoom factor sets the zoom level for the Detail zoom view images in the respective tables. By enabling the Manual check box you can change Color mode and or the Background color of the various workspace widget screenshots created within the analysis.
LogoSpecify an image file that should be utilized as a logo within the report.
Cel lsEach report page will contain a set of user defined cells. These cells are part of the report layout and their content is customizable. Simply click on a cell and select an attribute from the pull down. Either assign the attribute to the Cell title or to the Cell content. The Cell title is a textual description of the cell content. The Cell content defines what shall be displayed within the cell. You can append attributes to previous attributes by clicking the assign button again.

WA L L T H I C K N E S S M O D U L EReport
22-10 myVGL Manual Release 2.0
2 2
Release 2.0 myVGL Manual 23-1
. . . . .
. . . . . . . . . . . . . . . . . . . . . . . . . . . . . . . . . . . . . . . . . .SHORTCUTS 23
his chapter lists shortcuts used by myVG L 2 . 0 .
. . . . . . . . . . . . . . . . . . . . . . . . . . . . . . . . . . . . . . . . . . . . . . . . . . . . Shortcuts in 2D / 3D window
<Ctr l> + scrol l wheelZoom to/away from position of the mouse pointer.
double-c l ick middle mouse but tonSwitch between Rotate and Move mode.
. . . . . . . . . . . . . . . . . . . . . . . . . . . . . . . . . . . . . . . . . . . . . . . . . . . . Shortcuts in 2D window
scrol l wheelScroll through slices.
hold middle mouse but ton + move mouseDrag the slice around in the 2D window.
. . . . . . . . . . . . . . . . . . . . . . . . . . . . . . . . . . . . . . . . . . . . . . . . . . . . Shortcuts in 3D window
hold middle mouse but ton and move mouse up/downIn Move mode, this brings the camera closer to/farther away from the object.
In Rotate mode, this rotates the object clockwise/counterclockwise.
<Ctr l> + move/rotate objectMove/rotate the object in fine steps.
<Shi f t> + move/rotate objectMove/rotate the object along the vertical or horizontal direction only.
double-c l ick objectSelect object (double-click into the background to deselect it)
T

S H O R T C U T SShortcuts in Scene Tree
23-2 myVGL Manual Release 2.0
2 3
<Ctr l> + double-c l ick objectSelect/deselect multiple objects.
scrol l wheel ( i f l ight source se lected)Modify intensity of selected light source.
. . . . . . . . . . . . . . . . . . . . . . . . . . . . . . . . . . . . . . . . . . . . . . . . . . . . Shortcuts in Scene Tree
double-c l ick objectOpen the properties dialog of the respective object, e.g. Render object prop-erties dialog for a voxel object, parameter settings for an analysis.
. . . . . . . . . . . . . . . . . . . . . . . . . . . . . . . . . . . . . . . . . . . . . . . . . . . . Shortcuts for menu entries
<Ctr l> + NNew
<Ctr l> + OOpen
<Ctr l> + ZUndo
<Ctr l> + YRedo
<Del>Delete
<Ctr l> + <Shi f t> + RRotate
<Ctr l> + <Shi f t> + MMove

Release 2.0 myVGL Manual 24-1
. . . . .
. . . . . . . . . . . . . . . . . . . . . . . . . . . . . . . . . . . . . . . . . .GLOSSARY 24
his chapter explains some of the terms used throughout the docu-mentation and in the software. The explanations are tailored to the usage of the respective term in the myVG L environment.
. . . . . . . . . . . . . . . . . . . . . . . . . . . . . . . . . . . . . . . . . . . . . . . . . . . . C
• Coordinate systemmyVG L uses right-handed, Cartesian coordinate systems to display data. The orientation of each 2D or 3D window with respect to the currently chosen coordinate system is indicated by the tripod in the lower left corner. To align the slices seen in the 2D windows in different ways, you can choose between several coordinate systems.
• Comma separated values (.csv)Files of the .csv format store tabular data using a comma to separate values.
. . . . . . . . . . . . . . . . . . . . . . . . . . . . . . . . . . . . . . . . . . . . . . . . . . . . E
• EndiannessThis specifies the byte order used to represent certain data. There are two choices: big-endian and little-endian.
. . . . . . . . . . . . . . . . . . . . . . . . . . . . . . . . . . . . . . . . . . . . . . . . . . . . P
• Partial Volume EffectThis describes the effect that due to the limited resolution of CT-scans, properties of different materials can be merged within a single voxel. For
T

G L O S S A R YR
24-2 myVGL Manual Release 2.0
2 4
example, if you zoom into an air-metal transition, you will see voxels with intermediate gray values (see picture below).
VG Stud io MAX 2 .0 uses these voxels of intermediate gray value to find the surface of an object with sub-voxel precision.
• PolygonA polygon is a plane figure enclosed by straight line segments, for example a triangle. In computer graphics, triangular polygons are used to model and display surfaces of objects.
• PresetIn myVG L 2 . 0 , you can save various sets of parameters as presets, for exam-ple the settings made for a specific object in the Volume Rendering tool. You can load these presets later to apply them to different objects or export them to different computers.
. . . . . . . . . . . . . . . . . . . . . . . . . . . . . . . . . . . . . . . . . . . . . . . . . . . . R
• Reference objectVG Stud io MAX 2 .0 offers the following reference objects: points, lines, cir-cles, planes, spheres, cylinders and cones. They are fitted to your data and can be used to measure features of your data. Reference objects can also be combined to measure for example the angle between two planes. Further-more, you can use reference objects to register an object.
• RegistrationIn some cases multiple data sets belong to one object, for example a scanned object and its CAD model or partly overlapping sub-volumes of an object too large to be scanned in one pass. The process of transforming these different data sets into one coordinate system is called registration. VG Stud io MAX 2 .0 offers various algorithms to perform 3-D registration.
• RenderingThe process of computing and displaying an image based on a model is called rendering. The rendering process can include the application of shadows, lighting, perspective and texture.
Release 2.0 myVGL Manual 25-1
. . . . .
. . . . . . . . . . . . . . . . . . . . . . . . . . . . . . . . . . . . . . . . . .FILE EXTENSIONS 25
his chapter lists file extensions used by myVG L 2 . 0 .
Warning We strictly warn you against editing or deleting files in the project folder: This can lead to inconsistencies and systems crashes or simply destroy your project.
• .actDenotes a color table file. Do not edit these files.
• .licDenotes a license file. To activate the software, copy the license file into the installation directory of myVG L . Do not edit, delete or otherwise modify these files as this will invalidate your license.
• .lutDenotes a color table file. Do not edit these files.
• .pstDenotes a preset file. Presets are available for various areas of the applica-tion. Each preset combines parameters of a specific area. You can transfer these files to another computer, but be warned that presets of the same name will be overwritten on that computer. Do not edit these files.
• .vglDenotes a project file. Project files include references to all imported objects, modifications such as rotation, opacity settings and analysis results. Do not edit these files.
One .vgl files combines with a correspondingly named project folder to a project. None is usable without the other.
• .vgpDenotes a file that contains preview information that can be used by file managers to create thumbnails. Do not edit or delete these files.
• .vgrDenotes a file containing information about ROIs (references to a .vgm file). Do not edit or delete these files.
T

F I L E E X T E N S I O N S
25-2 myVGL Manual Release 2.0
2 5
• .vgsDenotes a file containing information about polygons or point clouds. Do not edit or delete these files.
• .vgtDenotes a measurement template file. Do not edit or delete these files.
• .vgxDenotes a CT-reconstruction parameter file. Do not edit or delete these files.

Release 2.0 myVGL Manual 26-1
. . . . .
. . . . . . . . . . . . . . . . . . . . . . . . . . . . . . . . . . . . . . . . . .INDEX
Symbols.avi 3-11.bmp 3-10, 3-11.jp2 3-10, 3-11.jpg 3-10, 3-11.ppm 3-10, 3-11.stl 15-1.tif 3-10, 3-11.vgi 3-1.vgl 3-1
Numerics2D Windows 2-532 bit float 3-53D Window 2-2
Aabsolute preset 11-1, 20-4, 21-10, 22-5Activate Navigation Cursor 5-5advanced calibration 6-2algorithm
of defect detection 21-2aligned clipping box 13-2ambient 11-3, 15-4, 16-3anaglyph image 17-2Angle instrument 5-4annotations 2-4, 2-8, 5-3
for defect detection 21-14for nominal/actual comparison 20-6for Wall Thickness Analysis 22-7
arrange 20-7, 21-14, 22-7attenuation
of light sources 16-4auto
scale 20-3, 21-8, 22-4tickmarks 20-4, 21-9, 22-5
AVI movie 3-11
BBackground 9-2Bitmap 3-10, 3-11box 2-4
CCAD 20-1
calculate projections 21-7Calibration
advanced 6-2Caliper instrument 5-5camera
orientation 17-1Camera tool 17-1cells
of actual/nominal comparison report 20-8of defect detection report 21-15of wall thickness analysis report 22-9
center 14-2check neighborhood 21-5Circle 19-2clamp
colors 20-4outside distances 20-3
Clear undo queue 4-2Clipping
box 13-2objects 13-1plane 13-1tool 13-1
closed surface 22-3CM Reporting 19-5Color and Opacity mode 2-7, 9-3Color mode 2-7, 9-3components (Volume Rendering presets) 11-1Cone 19-2constant
attenuation 16-5context menu
of 2D window 2-7of 3D window 2-4
Coordinate System 9-2create closed surface 22-3create smooth 20-3, 21-8, 22-4create stepped 20-3, 21-8, 22-4cull face 15-2cumulated 20-5cutoff Angle 16-5Cylinder 19-2
Ddata range mapping 3-5, 3-7Defect detection module 21-1

I N D E X
26-2 myVGL Manual Release 2.0
Defect opacity mode 21-9defect size color coding 21-8Delete 4-2Deviation 20-5, 21-12diffuse 11-4, 15-4, 16-3directional 16-1Display
distance 17-3mode 9-3
display mode 22-4Display unit 2-10Distance instrument 5-3
EExport
preset 11-1, 15-1, 16-1eye distance 17-3
Ffile types 3-1focal
depth 17-3point 17-1
force isotropic resampling 3-4
Ggap width 22-2gradient
attenuation, 16-5snap mode 5-6
gray value 3-5histogram 11-2intervals 11-3
HHardware renderer (Scatter HQ) 11-6high encoding precision 22-3histogram
in Import dialog 3-7of nominal/actual comparison 20-4
Iicon bars 2-9ignore
center CT-artifacts (in defect detection) 21-7circular CT-artifacts (in defect detection) 21-6streak artifacts (in defect detection) 21-5
image stack 3-1Import
Polygon 3-9preset 11-1, 15-1, 16-1
Indicator instrument 5-3Instruments 5-1
Angle 5-4Caliper 5-5
Distance 5-3Indicator 5-3Polyline 5-4
interlaced 17-2intervals (of gray values) 11-3inverse ramp
for gray value import 3-6Volume Rendering preset 11-1
inverse sawtooth 3-6iso-level 11-5Isosurface renderer 11-5isosurface transparent 11-2
JJPEG images 3-10, 3-11JPEG2000 images 3-10, 3-11
Lleft image only 17-2Level/Window mode 9-3light sources 16-1
directional 16-1point 16-2spot 16-2
Light tool 16-1line 19-1Local
Snap mode 5-6lock
slice position 2-6logo 18-3, 20-8, 21-15, 22-9lookup table 22-3LUT 20-2, 21-8, 22-3
Mmaterial face settings 15-4Max
distance 20-2, 20-3Snap mode 5-6thickness 22-6, 22-7
Maximum Projection 11-6Min
Snap mode 5-6thickness 22-6, 22-7
min/maxsize of defects 21-4
mirroraxes 3-7
Move mode 2-3, 13-2
NNavigation Cursor 5-5Nearest
Snap mode 5-6No slice interpolation beyond... 3-4

. . .
. .I N D E X
Release 2.0 myVGL Manual 26-3
Normalize gradients 11-7
Oopacity 11-4
manipulation area 11-2opacity transfer function 11-2OpenGL 17-3Original display mode 2-7, 9-3overlays 3-10override resolution 3-4, 14-2oversampling 11-7
Pparallel 17-2partial volume effect 3-8percentage 20-5perspective 17-2Phong 11-5point 16-2, 19-1Polygon Rendering tool 15-1Polyline instrument 5-4Portable Pixmap 3-10, 3-11position 14-1Pplane 19-2Preferences 4-2preset 2-5, 2-8, 11-1, 15-1, 16-1, 18-1, 20-2, 20-4, 21-2, 21-10, 22-2, 22-5, 24-2, 25-1preview
in Import dialog 3-8reduction factor 2-3
Printimage(s)... 3-11layout 20-8, 21-15, 22-9preview 20-8, 21-15, 22-9
probability 21-14threshold 21-4
project files 3-1projection
mode 17-2parallel 17-2perspective 17-2stereo-perspective 17-2
propertiesof reference objects 19-3
QQuad 9-2
Rrainbow 20-3, 21-9, 22-4ramp 3-6
Volume Rendering preset 11-1Redo 4-1reference
object 24-2Region of Interest
See ROIRender
point cloud 15-3solid 15-2wireframe 15-2
reportof defect detection 21-15of nominal/actual comparison 20-8of wall thickness analysis 22-9
resolution 14-2reverse
rainbow 20-3, 21-9, 22-4rgb8 3-5right image only 17-3ROI 3-6Rotate mode 2-3, 13-1rotation 14-1Ruler 9-2
SSave
AVI/image stack ... 3-10image(s)... 3-9
sawtooth 3-6Scatter (v1.2) 11-6Scatter Gradient (v1.2) 11-6Scatter HQ
Hardware Renderer 11-6Volume Renderer 11-5
Scatter HQ (v1.2) 11-6scene 3-1
zoom 17-3Selection
of objects 2-2shadows 16-1, 16-4shared color 11-4shininess 11-4, 15-4show result 22-4signed
16 bit 3-532 bit 3-58 bit 3-5
skip 3-7X/Y/Z 20-2
Slice step width 9-3Slices Left/Right/Below 9-2Snap 5-6specular 11-4, 15-4, 16-3Sphere 19-2spot 16-2Stereolithography
ASCII File Format 15-1Binary File Format 3-9, 15-1File Format 15-1

I N D E X
26-4 myVGL Manual Release 2.0
stereo-perspective 17-2Sum along Ray 11-6swap 11-5
axes 3-7distance signs 20-2
Ttext labels 18-2Text Overlay Editor 18-1thickness 22-2, 22-7tickmarks on color bar 20-4, 21-9, 22-5Tiff images 3-10, 3-11toggle
transform mode 2-7tolerance 20-7tooldocks 2-9Tools menu 8-1Transformation
tool 14-1transparency 11-4tripod 2-4type
point count 20-4surface 20-4
Uuncoded defect color 21-9Undo 4-1
Clear undo queue 4-2unit 2-10unsigned
16 bit 3-532 bit 3-58 bit 3-5
up vector 17-1
Vvariance 20-7view Angle 17-2volume 21-14Volume renderer (Phong) 11-5Volume renderer (Scatter HQ) 11-5Volume Rendering presets
components 11-1inverse ramp 11-1isosurface transparent 11-2ramp 11-1
Volume Rendering tool 11-1
WWall thickness module 22-1Window menu 9-1workspace 2-1
XX-Ray 11-6