refrigerants and greenhouse gases · 10/12/2008 · refrigerants and greenhouse gases . ... 5.2...
TRANSCRIPT

Refrigerants and Greenhouse Gases White Paper on Approaches to Reducing Leakage and Improving the Performance of Supermarket Refrigeration Systems December 10, 2008 HMG Project No: 0821 CTG Project No: 66033
Submitted to:
Southern California Edison Co. Devin Rauss, Project Manager
(626) 812-7372 [email protected]
Submitted by:
HESCHONG MAHONE GROUP, INC. 11626 Fair Oaks Blvd. #302 Fair Oaks, CA 95628 Phone:(916) 962-7001 Fax: (916) 962-0101 e-mail: [email protected] website: www. h-m-g.com
CTG Energetics, Inc.
16 Technology #109 P.O. Box 57057
Irvine, CA 92618 (949) 790-0010
[email protected] www.CTGEnergetics.com
C:\Documents and Settings\mbrook\Desktop\supermarket standard\Supermarket Refrigerant GHG White Paper - Dft 1.doc, Douglas Mahone
HMG and CTG Southern California Edison Co.
Refrigerants and GHG
TABLE OF CONTENTS 1. ABSTRACT & INTRODUCTION ...............................................................................1
1.1 Abstract ..............................................................................................................1
1.2 Introduction ........................................................................................................1
2. Climate Change Background .........................................................................................2
2.1 Introduction to Climate Change .........................................................................2
2.2 The Costs of Greenhouse Gases ........................................................................3
2.3 Life-Cycle Carbon Metrics ................................................................................6 2.3.1 Global Warming Potential and Carbon Dioxide Equivalent .................... 6 2.3.2 Total Equivalent Warming Impact (TEWI) ............................................... 7 2.3.3 Life Cycle Climate Performance (LCCP) .................................................. 7 2.3.4 Life-Cycle Direct Global Warming Index (LCGWI ) ................................ 7 d
2.3.5 Dollar Equivalency .................................................................................... 8 3. Commercial REFRIGERATION SYSTEM CHARACTERISTICS .............................9
3.1 Background ........................................................................................................9 3.1.1 Commercial Refrigeration Energy Use ..................................................... 9 3.1.2 California Commercial Refrigeration Statistics ...................................... 11
3.2 Refrigerants ......................................................................................................12 3.2.1 Refrigerant Use in Commercial Refrigeration Equipment ...................... 12 3.2.2 Refrigerant Costs ..................................................................................... 15 3.2.3 Tradeoffs Between Ozone and Climate Impacts ...................................... 15 3.2.4 Energy Efficiency Impacts of Refrigerant Selection ................................ 19 3.2.5 Operational Refrigerant Leakage Rates .................................................. 21 3.2.6 End-of-Life Refrigerant Loss ................................................................... 22
3.3 Commercial Refrigeration Systems .................................................................22 3.3.1 Self-Contained/Stand-Alone System ........................................................ 22 3.3.2 Multiplex System ...................................................................................... 23 3.3.3 Single-Compressor System ...................................................................... 25
3.4 Reduced Charge Refrigeration Systems ..........................................................25 3.4.1 Low-Charge Multiplex System ................................................................ 25 3.4.2 Distributed Compressor System .............................................................. 25 3.4.3 Advanced Self-Contained Systems ........................................................... 26
i

HMG and CTG Southern California Edison Co.
Refrigerants and GHG
3.4.4 Secondary Loop Systems ......................................................................... 27 3.5 Analysis of Commercial Refrigeration System GHG Reduction Opportunities28
3.5.1 Focus on Reducing Refrigerant Leakage ................................................ 33 3.5.2 Grid Carbon Intensity and RPS Standards .............................................. 34 3.5.3 Evaporative Condensers .......................................................................... 35 3.5.4 Low-Charge Refrigeration Systems ......................................................... 35 3.5.5 End of Life Refrigerant Charge Recovery ............................................... 35 3.5.6 Impacts of Low Refrigerant Charge on Energy Consumption ................ 36
3.6 Integrated Building HVAC/ Commercial Refrigeration Analysis Tools and Methodologies..................................................................................................36
3.6.1 eQuest ...................................................................................................... 38 3.6.2 EnergyPlus .............................................................................................. 39 3.6.3 EPRI’s Supermarket Simulation Tool (SST) ............................................ 41 3.6.4 Other Programs ....................................................................................... 42
4. REGULATORY AUTHORITIES & MANDATES ....................................................43
4.1 Air Resources Board ........................................................................................43
4.2 California Energy Commission ........................................................................45 4.2.1 Title 24 Building Energy Efficiency Standards ....................................... 45 4.2.2 Title 20 Appliance Efficiency Standards ................................................. 46
4.3 California Public Utilities Commission ...........................................................47
4.4 United States Environmental Protection Agency ............................................47
5. TITLE 24 AND 20 STANDARDS OPTIONS ............................................................49
5.1 Existing Regulatory Requirements and Their Effectiveness ...........................49 5.1.1 California Title 20 and Federal Energy Efficiency Standards for Walk-ins49
5.2 Potential Title 24/20 Standards Approaches to Problems ................................52 5.2.1 Title 24/20 Standards Development Considerations ............................... 52 5.2.2 Title 24/20 Standards Options ................................................................. 56
5.3 Future Research Needs ....................................................................................56 5.3.1 Further Quantification of Annual Refrigerant Loss Rates ...................... 56 5.3.2 Further Quantification of End-of-Life Refrigerant Losses ...................... 56 5.3.3 Additional Refrigeration Systems Modeling ............................................ 57 5.3.4 Enhance Integrated HVAC / Refrigeration Analysis Tools ..................... 57
5.4 Potential Utility Program(s) Roles ...................................................................57
ii

HMG and CTG Southern California Edison Co.
Refrigerants and GHG
LIST OF FIGURES
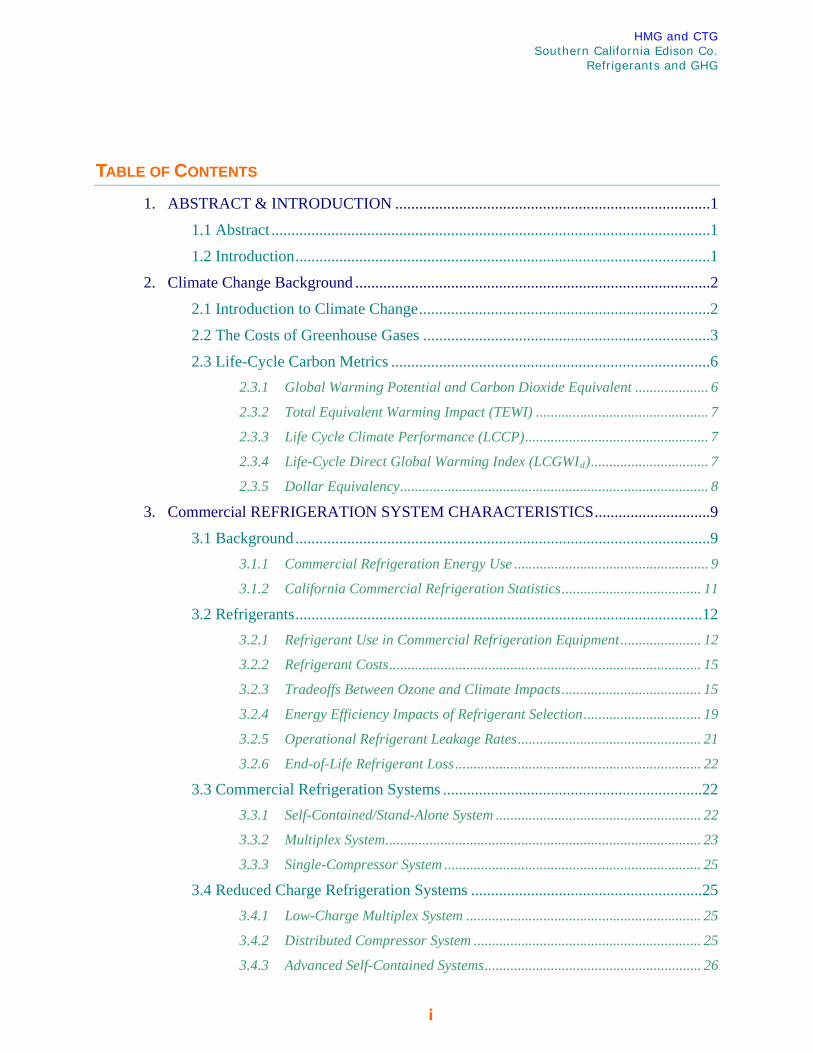
Figure 2-1: Carbon costs under the European Union Emissions Trading Scheme ............5
Figure 2-2: California carbon price estimates 2010 – 2037)..............................................6
Figure 3-1: Nationwide refrigeration electricity use by building type ................................9
Figure 3-2: Total electricity use for commercial refrigeration, by building use type .......10
Figure 3-3: Refrigeration electricity use as a percent of total electricity use, by building use type.........................................................................................................................10
Figure 3-4: U.S. Anthropogenic Emissions of HFCs ........................................................16
Figure 3-5: California GHG Emissions by Source............................................................17
Figure 3-6: California HFC Emissions .............................................................................17
Figure 3-7: Climate verses ozone impacts of various refrigerants ...................................18
Figure 3-8: Climate verses ozone impacts of HCFC and HFC refrigerants .....................19
Figure 3-9: Modeled COP’s for various refrigerants .......................................................20
Figure 3-10: Typical multiplex system layout ...................................................................24
Figure 3-11: Distributed compressor system with a water-cooled condenser ..................26
Figure 3-12: Secondary loop system .................................................................................27
Figure 3-13: Prototypical supermarket layout for ORNL analysis ...................................29
Figure 3-14: Comparison of analysis results for different refrigeration system types and refrigerant leakage rates (CA average electricity grid carbon intensity factors with RPS effects) ..................................................................................................................32
Figure 3-15: Life-cycle GHG contributions from a typical multiplex system with a 30% leakage rate. .................................................................................................................33
Figure 3-16: GHG contributions, including electricity grid emissions, for a typical multiplex system with a 30% leakage rate. ..................................................................35
Figure 3-16: Screen-shot of eQuest’s refrigeration system input screen ..........................39
iii

HMG and CTG Southern California Edison Co.
Refrigerants and GHG
iv
LIST OF TABLES
Table 3-1: Refrigerants and key properties .......................................................................13
Table 3-2: Refrigerant costs ..............................................................................................15
Table 3-3: U.S. HFC emissions .........................................................................................16
Table 3-4: Modeled COP’s for various refrigerants .........................................................21
Table 3-5: Updated ORNL refrigeration system analysis using Average CA electricity grid emission factors and RPS impacts (20% renewables by 2020) ...........................30
Table 3-6: Updated ORNL refrigeration system analysis using SCE average electricity grid emission factors and RPS impacts (20% renewables by 2020) ...........................31
Table 3-7: Refrigeration system tools analysis tool summary ...........................................37

HMG and CTG Southern California Edison Co.
Refrigerants and GHG
1. ABSTRACT & INTRODUCTION
1.1 Abstract Supermarket refrigeration systems can contribute to the problems of global warming, both through the carbon emissions that result from their use of electricity, and through their use of refrigerants that are, in themselves, potent greenhouse gasses. The leakage of refrigerants from these systems may pose a global warming threat that is as substantial as their electricity-related carbon emissions. This White Paper explains the climate change background, the refrigeration system characteristics, and the opportunities for reducing the GHG problems associated with refrigeration. It also explores the policy and regulatory approaches that might be adopted to improve refrigeration systems design and operation. It is intended to
1.2 Introduction Supermarket refrigeration is a vital commercial process that ensures the availability of products. It is also associated with a set of economic and environmental impacts, including energy costs, ozone depletion, and the direct and indirect emission of greenhouse gases. The impacts of supermarket refrigeration systems reflect a complex combination of operational requirements, market constraints, system design requirements, technologies, and, increasingly, mandates for greater energy efficiency and contribution to state efforts to reduction greenhouse gas emissions.
This White Paper has been commissioned by Southern California Edison Co. to support the efforts of the California Energy Commission and the Air Resources Board to reduce the greenhouse gas (GHG) and energy impacts of supermarket refrigeration systems. This report reviews fundamental relationships contributing to economic and environmental impacts of supermarket refrigeration and identifies opportunities for policy action. The report was prepared as a summary of current knowledge, rather than a research project to develop new information. It is hoped that this compilation will be useful to policymakers and program managers, in helping them to set the course for improving the design and operation of supermarket refrigeration systems, and for reducing the harmful emissions of carbon and refrigerants they produce.
1

HMG and CTG Southern California Edison Co.
Refrigerants and GHG
2. Climate Change Background
2.1 Introduction to Climate Change Global climate change refers to changes in average climatic conditions on Earth as a whole, including changes in temperature, wind patterns, precipitation, and storms. Global warming is the observed increase in average temperature of the Earth’s surface and atmosphere. One identified cause of global warming is an increase of greenhouse gases (GHGs) in the atmosphere. GHGs are those compounds in the Earth’s atmosphere that play a critical role in determining the Earth’s surface temperature. Specifically, GHGs allow high-frequency solar radiation to enter the Earth’s atmosphere, but trap the low-frequency, long-wave energy which is radiated back from the Earth to space, resulting in a warming of the atmosphere. The earthward movement of this long-wave radiation is known as the “greenhouse effect.”
Studies indicate that the effects of global climate change may include rising surface temperatures, loss of snow pack, sea level rise, more extreme heat days per year, and more drought years.1 Understanding of the fundamental processes responsible for global climate change has improved over the past decade and predictive capabilities are advancing. However, there remain scientific uncertainties surrounding the response of the Earth’s climate system to combinations of changes, particularly at regional and local scales. Consequently, the scientific community has developed scenarios reflecting current understanding about the plausible range of variation in social and economic responses and considered them with multiple, independent computer simulation models. The result is a range of potential future conditions given differences in social and economic conditions and the response of the Earth’s climate system to anthropogenic perturbations, such as continued emissions of heat-trapping greenhouse gases.
The six most globally important GHGs are carbon dioxide (CO2), methane (CH4), nitrous oxide (N2O), sulfur hexafluoride (SF6), hydrofluorocarbons (HFCs), and perfluorocarbons (PFCs).2 Carbon dioxide is the most abundant GHG, and it is
1 Existing climate change models also show that climate warming portends a variety of impacts on agriculture, including loss of microclimates that support specific crops, increased pressure from invasive weeds and diseases, and loss of productivity due to changes in water reliability and availability. 2 California Health & Safety Code § 38505(g) recognizes the six listed gases as greenhouse gases. Recently, some groups have advocated for the inclusion of “black carbon” in analyses of climate change under CEQA. Black carbon is a form of particulate air pollution that is most often produced from the burning of biomass, cooking with solid fuels, and diesel exhaust. Some studies have implicated black carbon as a source of global climate change; however, the potential impact of black carbon on climate change is currently under substantial dispute. Some studies indicate that less than 15% of the man-made portion of global warming is due to black carbon. “Effects of Black Carbon and Other Non-Kyoto Pollutants on Climate,” Mark Z. Jacobson, Stanford University, Presentation to the Economic and Technology Advancement Advisory Committee California Air Resources Board, September 6, 2007. A high-end estimate indicates that black carbon could be responsible for 60 percent of the global warming. Ramanathan and Carmichael, “Global and Regional Climate Changes Due to Black Carbon,” Nature Geoscience, 2008.
2

HMG and CTG Southern California Edison Co.
Refrigerants and GHG
conventionally used as a benchmark of the relative heat trapping potential of atmospheric pollutants. These gases have different potentials for trapping heat in the atmosphere, called global warming potential (“GWP”). For example, one pound of methane has 21 times more heat capturing potential than one pound of carbon dioxide, nitrous oxide has 310 times more heat capturing potential than one pound of carbon dioxide, and sulfur hexafluoride has 3,200 times more heat capturing potential than one pound of carbon dioxide. When dealing with an array of emissions, the gases are converted to their carbon dioxide equivalents for comparison purposes and expressed in units of metric tons of carbon dioxide equivalent (“CO2e”) units. A metric ton is approximately 2,205 lbs.
2.2 The Costs of Greenhouse Gases Greenhouse gas emissions are a global externality. They impose costs to society that is not represented in the cost of goods or services. More specifically, the combustion of fossil fuels without consideration for greenhouse gas emissions provides relatively inexpensive energy. Short-term benefits accrue to a subset of society, while the true costs of these benefits are borne by society as a whole. Moreover, future costs of greenhouse gas emissions are likely to fall disproportionately on poor and vulnerable populations, such as low-lying developing countries. It is possible to help internalize the true cost of greenhouse gas emissions by adding the value of carbon emissions to the price of fossil fuel combustion. Currently, this price reflects the relatively cost of abatement for a tonne of CO2. However, it is important to note that the abatement cost of carbon is only part of the global externality associated with past, present, and future greenhouse gas emissions and represents only a fraction of the real costs of the emission of greenhouse gases. For example, impacts on shorelines and natural ecosystems are not addressed by abatement-based pricing. This means that abatement-based carbon prices substantially understate the real cost of greenhouse gas emissions.
Most industrialized countries in the world participate in carbon trading markets based on the Kyoto Protocol. These markets seek to help countries establish carbon prices that reflect the cost of abatement required to achieve Kyoto targets. The US is not bound by Kyoto GHG emissions targets, and it is not possible to directly sell US emissions reductions through Kyoto-based markets. In the US, carbon emissions and allowances are
Black carbon is not assessed in this report for three primary reasons. First, no regulatory authority has classified black carbon as a greenhouse gas and it is not regulated under AB 32 or any other law implemented to address global climate change. Second, the tools are simply not available to quantify black carbon emissions at this time. Emissions factors for black carbon have not been published by the California Air Resources Board, the U.S. Environmental Protection Agency, or other reputable bodies. While some calculation methodologies have been postulated, the methodologies have not been confirmed by actual measurements of sources. Third, no guidance on the importance, evaluation, or mitigation of black carbon has been provided by the agencies leading the climate change issue. The South Coast Air Quality Management District (SCAQMD) has not included black carbon in their discussion of GHG significance thresholds. There does not appear to be any guidance provided in recent guidelines released by the California Office of Planning and Research (OPR) or the California Air Pollution Control Officers Association (CAPCOA). Nor does black carbon appear to be addressed in current efforts to implement AB 32, the primary legislation designed to reduce California’s impact on climate change. Therefore, while the Proposed Project will generate some black carbon, the quantities are indeterminable at this time. The potential impact of the black carbon emissions on climate change is also unknown at this time. As such, black carbon is not analyzed herein.
3

HMG and CTG Southern California Edison Co.
Refrigerants and GHG
traded voluntary through state and regional exchanges, the national Chicago Climate Exchange (CCX), and emerging compliance markets (e.g., for participants in the Northeast states Regional Greenhouse Gas Initiative).
Trading on the CCX provides one measure of current abatement costs in the US. Participants in the CCX market make a voluntary commitment to reduce their emissions by 6% from a baseline of average emissions from 1998 to 2001 by 2010. This reduction targets motivates participants to identify internal emissions reductions and consider purchasing offsets from other market participants. One metric ton of CO2e has traded on the CCX between $1.50 and $1.70 in the month of November 2008; this is essentially the lowest price at which it has traded for all of 2008. The price peaked in May at $7.40/metric ton [source: CCX]. The market under RGGI is a compliance market that only applies to electric power plants. RGGI completed its first auction of emissions allowances on September 25, 2008. 70,000 allowances were auctioned, with a clearing price of $3.07/short ton CO2e, or $3.38/metric ton CO2e [Source: RGGI]. Auctions are scheduled to take place quarterly, which the next occurring on December 17, 2008.
In Europe, the majority of carbon trading takes place under the European Union Emissions Trading Scheme (EU ETS) a compliance market that was created by the Kyoto Protocol. The two principal instruments that are traded under this scheme are Certified Emissions Reductions (CERs) and European Union Emissions Allowances (EUAs). CERs are offsets that are generated under the Clean Development Mechanism. EUAs are emissions allowances that have been allocated to participating countries and are tradable. CERs and EUAs are fungible but not identical; for instance, the European Commission has signaled its intent to curtail the use of CERs in Phase III of EU ETS [Source: ec.europa.eu]. In 2008, the price of EUAs has been between €15 and €35 per metric ton of CO2e, with the price generally higher for vintages in later years. (Vintage refers to the year in which either the emission is allowed to take place or in which the emission is abated.) In the month between November 3rd and December 3rd, 2008, the price for 2009 EUAs has stayed between €16 and €19.50 per ton CO2e, for 2012 EUAs, the range is €18-22. In 2008, CERs have generally traded between €14-26 per metric ton CO2e, again with later vintages typically commanding a higher price (although the latest CERs currently being traded are 2012, which is the same year Phase III of EU ETS begins). In the month between November 3rd and December 3rd, 2008, the range has been €13.50-16. [Source: Cantor CO2e]
4
HMG and CTG Southern California Edison Co.
Refrigerants and GHG
Figure 2-1: Carbon costs under the European Union Emissions Trading Scheme
California has established working estimates of potential future carbon prices to guide the design of energy and energy efficiency programs. These are not market-based prices for abatements, and they represent only one highly speculative scenario for future carbon prices. The expectation is that these prices would be transferred indirectly to energy end-users through higher energy costs (e.g., utility rates). As with other abatement-oriented pricing, these carbon price estimates will understate the true costs of greenhouse gas emissions and the true benefits of emissions reductions activities. They are not a measure of the societal costs of the emission of greenhouse gases.
5

HMG and CTG Southern California Edison Co.
Refrigerants and GHG
Figure 2-2: California carbon price estimates 2010 – 2037)
2.3 Life-Cycle Carbon Metrics
2.3.1 Global Warming Potential and Carbon Dioxide Equivalent Global Warming Potential (GWP) is a measure of how much a particular greenhouse gas contributes to global warming. It depends on (1) which wavelengths the gas absorbs, (2) how effective the gas is at absorbing those wavelengths and (3) the persistence of the gas in the atmosphere. Simply put, it integrates – over some time period – the energy absorbed by the gas that would have otherwise escaped the atmosphere multiplied by some function that accounts for the gas’s decay. This value is related to carbon dioxide by dividing by carbon dioxide’s figure over the same time horizon. Hence, carbon dioxide has a GWP of one by definition. Time horizon plays an essential role in this metric, because gases that decay quickly will have relatively higher GWPs over shorter time scales than they would over longer time scales. The IPCC recommends a 100 year time horizon. [Source: IPCC 2001]. All GWP’s used in this document are based on a 100 year time horizon.
Carbon dioxide equivalent (CO2e) is a metric that is equivalent to the weighted sum of GWP’s for a set of greenhouse gases. For a particular type and quantity of gas, it is the amount of carbon dioxide that would have the same GWP, again over a specific time period. [EPA]
6

HMG and CTG Southern California Edison Co.
Refrigerants and GHG
2.3.2 Total Equivalent Warming Impact (TEWI) Total Equivalent Warming Impact (TEWI) is a metric that describes the total direct and indirect greenhouse gas impacts. TEWI is the sum of the direct (scope 1) GHG emissions from refrigerant leakage and venting during equipment decommissioning, and indirect (scope 2) emissions from refrigeration system electricity use. TEWI is usually expressed in carbon dioxide equivalents.
2.3.3 Life Cycle Climate Performance (LCCP) Life Cycle Climate Change Performance (LCCP) is a metric that describes cradle-to-grave GHG emissions. It includes both the direct and indirect emissions described by TEWI, as well as manufacturing and end-of-life emissions (typically scope 3 emissions). LCCP is usually expressed in carbon dioxide equivalents.
LCCP is the sum of emissions associated with the manufacturing of the equipment and refrigerant, the operational GHG emissions from refrigerant leakage, the indirect emissions from refrigeration system electricity use, the emissions from the recovery/discharge of the refrigerant charge at decommissioning, and any other end-of-life disposal/recycling related emissions.
The literature is not always consistent on what is reported in LCCP numbers. Typically, the embodied carbon required to manufacture the refrigerants is included. However, the embodied energy for manufacturing the equipment itself is not consistently reported. One of the challenges with this metric is the availability of accurate data for some of the cradle and grave processes.
2.3.4 Life-Cycle Direct Global Warming Index (LCGWId) The US Green Building Council has commissioned an informative study on the tradeoffs between the ozone and climate impacts of refrigerants1. They define two metrics to define the life-cycle impacts of a refrigeration system for climate and ozone. The Life-Cycle Ozone Depletion Index (LCODI) is measured in pounds of CFC-11 equivalents per ton-year (with tons being the refrigeration system capacity. A similar metric, the Life-Cycle Direct Global Warming Index (LCGWId) is a measure of the direct (refrigerant losses only) climate impacts. It does not include indirect (energy-related GHG emissions). These are defined as:
1 Reva Rubenstein, David Didion, and Jeff Dozier, The Treatment by LEED® of the Environmental Impact of HVAC
Refrigerants, November 8, 2004, http://www.usgbc.org/Docs/LEED_tsac/TSAC_Refrig_Report_Final-Approved.pdf.
7

HMG and CTG Southern California Edison Co.
Refrigerants and GHG
where:
The LCGWId is very similar to TEWI, except it does not include the indirect, energy-related GHG impacts.
2.3.5 Dollar Equivalency The CO2e reported by TEWI, LCCP, or similar metrics can be monetized by multiplying the lifecycle or annual CO2e emissions by the appropriate cost of carbon. Refer to the previous section for a more detailed discussion on GHG costs.
8
HMG and CTG Southern California Edison Co.
Refrigerants and GHG
3. Commercial REFRIGERATION SYSTEM CHARACTERISTICS
3.1 Background
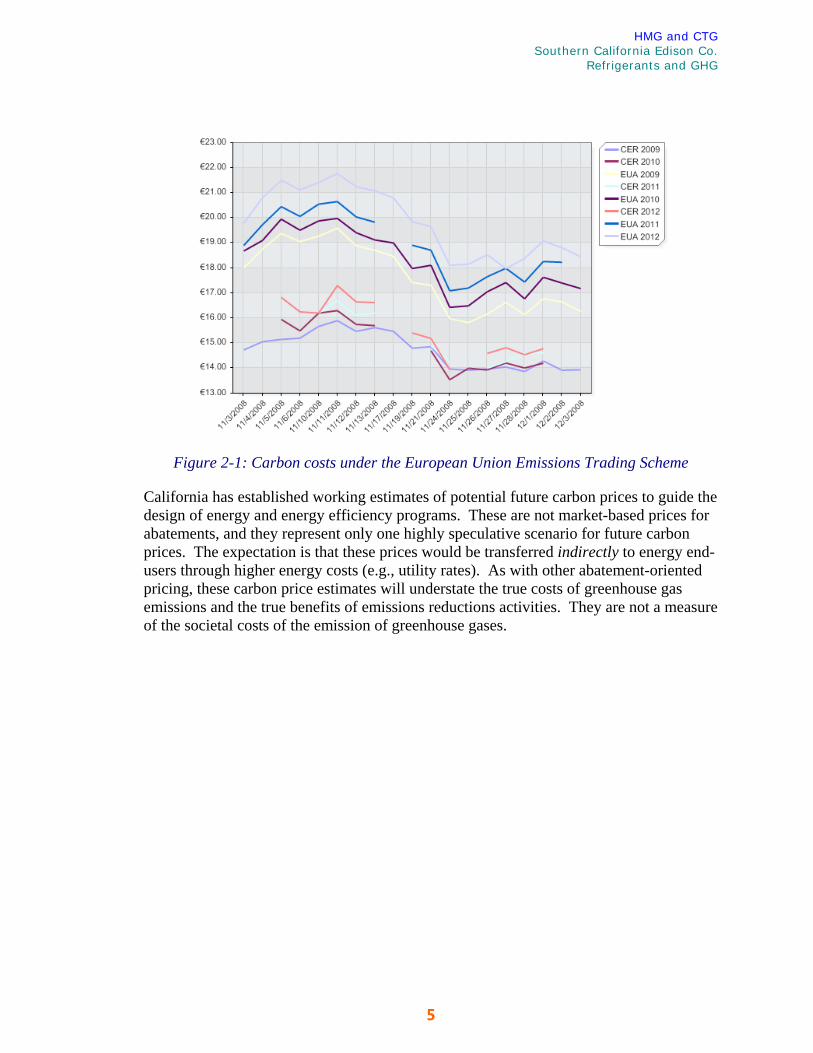
3.1.1 Commercial Refrigeration Energy Use Nationwide, refrigeration consumes 104 billion kWh per year in commercial buildings, or 12% of the total building electricity use.1 This results in 79 million metric tons of Carbon dioxide-equivalents (mTCO2e)2 from electricity use alone, not including the greenhouse gas emissions from refrigerant leakage.
The following figure breaks down refrigeration electricity use by building use type3. The largest users of refrigeration are food sales facilities4, followed by food service facilities5.
Figure 3-1: Nationwide refrigeration electricity use by building type
1 U.S. Energy Information Administration, “Commercial Buildings Energy Consumption Survey (CBECS), 2003
Data,” December 2006, http://www.eia.doe.gov/emeu/cbecs/ 2 Greenhouse gas emissions from electricity are based on a national average conversion factor of 1.67 lb CO2e/kWh,
per Mike Deru and Paul Torcellini, Source Energy and Emission Factors for Energy Use in Buildings, June 2007, http://www.nrel.gov/docs/fy07osti/38617.pdf
3 The Energy Information Agency (EIA) conducts a detailed survey of commercial building energy use every 4 years (“Commercial Building Energy Consumption Survey”, or CBECS, www.eia.doe.gov/emeu/cbecs/). The latest data is from the 2003 survey. The majority of the data used in this section is based on the CBECS study.
4 This includes all retail and wholesale food sales facilities, such as grocery stores, food markets, gas stations with a convenience store, and convenience stores.
5 Restaurants, cafeterias and fast-food.
9

HMG and CTG Southern California Edison Co.
Refrigerants and GHG
Annual refrigeration electricity use by facility type is shown below.
Figure 3-2: Total electricity use for commercial refrigeration, by building use type
Food sales and service facilities are not only the largest refrigeration users, but refrigeration loads represent very high proportions of their total electricity use, as shown in the following figure.
Figure 3-3: Refrigeration electricity use as a percent of total electricity use, by building
use type
10

HMG and CTG Southern California Edison Co.
Refrigerants and GHG
Food sales facilities are the largest user of commercial refrigeration equipment, consuming 35 billion kWh/year. Refrigeration accounts for 57% of food sales building’s electricity use. This results in 26.5 million metric tons of carbon dioxide-equivalents (mTCO2e). In terms of total energy use, food sales facilities consume 251 trillion BTU of energy per year: 208 trillion BTU/year is for site electricity (equivalent to 629 trillion BTU/year primary electricity), and 39 trillion BTU/year for natural gas. Refrigeration represents 47% of the total energy use. Annual energy costs for food sales facilities are $4.990 billion total, $4.627 billion for electricity, and $332 million for natural gas. Refrigeration electricity use costs are 2.64 billion/year1.
There are approximately 226,000 food sales buildings in the U.S. with a total of 1,255 million square feet. The median facility size is 2,800 ft2, and the average facility size is 5,600 ft2. The average facility is in operation 107 hours per week. There are 1.433 million people working in these buildings (877 ft2/worker)2.
The largest, and most energy intensive type of food sales buildings are supermarkets. Typical supermarkets have sales floor areas of 40,000 – 60,000 ft2 and consume approximately 2 -3 million kWh/year in total energy3. The typical North America supermarket has 88 kW (300,000 Btu/h) of low temperature refrigeration and 264 kW (900,000 Btu/h) of medium temperature refrigeration4.
Food service facilities are the second largest commercial refrigeration user, consuming 20 billion kWh/year nationwide for refrigeration. This results in ~15 million metric tons of CO2e emissions. Refrigeration accounts for 32% of the total electricity use, and 16% of total energy use5.
3.1.2 California Commercial Refrigeration Statistics A preliminary estimate of total California Supermarket GHG emissions has been performed for the California Air Resources Board6. California has an estimated 3,360 supermarkets. Each supermarket has three to five multiplex direct-expansion refrigeration systems. These collectively consume an estimated 5.4 TWh/year of electricity, producing 2.3 MTCO2e. Refrigerant leakage rates are around 30% of the system refrigerant charge
1 U.S. Energy Information Administration, “Commercial Buildings Energy Consumption Survey (CBECS), 2003
Data.” 2 Ibid. 3 Van Baxter, Advances in Supermarket Refrigeration Systems,
http://www.arb.ca.gov/cc/commref/adv_supmkt_ref_syst.pdf. 4 James Sand, Steven Fischer, and Van Baxter, Energy and Global Warming Impacts of HFC Refrigerants and
Emerging Technologies (Oak Ridge National Laboratory, 1997), http://www.ornl.gov/sci/engineering_science_technology/eere_research_reports/electrically_driven_heat_pumps/fluids_development/cfc_and_hcfc_replacements/tewi_3/tewi_3.pdf
5 U.S. Energy Information Administration, “Commercial Buildings Energy Consumption Survey (CBECS), 2003 Data.”
6 California Air Resources Board, “Draft Concept Paper: Specifications for Commercial Refrigeration,” http://www.arb.ca.gov/cc/hgwpss/meetings/021508/RWC_Commercial_Refrig_Draft_Concept_Paper.pdf.
11
HMG and CTG Southern California Edison Co.
Refrigerants and GHG
per year. This results in an annual total of approximately 2.7 MMTCO2e of GHG emissions from fugitive refrigerant emissions. Approximately 50% of these systems use HCFC-22, and the other 50% use R404a and R507a. Substitutes for ozone depleting refrigerants are growing at a rate of approximately 2% per year1. Replacement refrigerants are typically R404a and R507.
3.2 Refrigerants A refrigerant is the working fluid in a refrigeration system. Refrigerants have unique properties which enable them to work with the refrigeration equipment to pump heat across a thermal gradient. Refrigerants are selected for their desirable thermal-physical properties, compatibility with the refrigeration system’s refrigerant cycle/ equipment, stability, safety, cost, environmental impacts and efficiency. This section provides an overview of key refrigerant properties that impact energy use and the environment.
3.2.1 Refrigerant Use in Commercial Refrigeration Equipment Common refrigerants used in air-conditioning and commercial refrigeration applications can be grouped into the following categories: Chlorofluorocarbons (CFC’s), Hydrochlorofluorocarbons (HCFC’s), Hydrofluorocarbons (HFC’s), and non-halogenated refrigerants (commonly referred to as “natural” refrigerants).
Prior to the Montreal Protocol, almost all commercial refrigeration systems used CFC and HCFC refrigerants, specifically CFC-12, R-502, and HCFC 22. Existing stocks of CFC’s continue to be used in some older equipment, but the majority of equipment has been retrofitted with HCFC and HFC blends. HCFC-22 blends are the primary retrofit refrigerant used for medium temperature equipment, and R404a and R507 (HFC’s) are the two primary blends used to replace R502 in low temperature refrigeration applications. New equipment is increasingly using R404a and R507 HFC blends. It is estimated that approximately 50% of the commercial systems in operation today use HCFC-22, and another 50% use HFC’s (R404a and R507). HFC’s are replacing CFC’s and HFC’s at a rate of ~2% per year in the commercial refrigeration sector2,3.
The following table summarizes key refrigerant properties for some of the refrigerants used in commercial refrigeration and HVAC applications, as well as some of the potential alternatives.
1 Ibid. 2 Arthur D. Little, Inc., Global Comparative Analysis of HFC and Alternative Technologies for Refrigeration, Air
Conditioning, Foam, Solvent, Aerosol Propellant, and Fire Protection Applications, March 21, 2002, http://www.arap.org/adlittle/HFCstudy3-22JD.pdf
3 California Air Resources Board, “Draft Concept Paper: Specifications for Commercial Refrigeration.”
12

HMG and CTG Southern California Edison Co.
Refrigerants and GHG
R-# Name Application ODP GWP Source
R-11 CFC-11 Common pre-Montreal refrigerant used in centrifugal chillers 1 4,680 1
R-12 CFC-12Common pre-Montreal refrigerant used in chillers and refrigerators; still used in legacy equipement. 1 10,720 1
R-114 CFC-114 Pre-Montreal refrigerant used in centrifugal chillers 0.94 9,800 1R-500 CFC-500 Pre-Montreal refrigerant used in centrifugal chillers and humidifiers 0.61 7,900 1
R-502 R-502 CFC/ HCFC blend; Pre-Montreal refrigerant used for low-temeprature refrigeration 0.22 4,600 1
R-22 HCFC-22Common refrigerant, used in air-coniditioning applications, chillers and refrigeration systems 0.04 1,780 1
R-123 HCFC-123 CFC-11 replacement 0.02 76 1
R-23 HFC-23 Very-low temperature refrigeration ~0 12,240 1R-125 HFC-125 Component in many refrigerant blends, such as R404a ~0 3,400 1
R-134a HFC-134aVery widely used refrigerant; also component of other refrigerant blends, such as R404a ~0 1,320
R-143a HFC-143a Component in many refrigerant blends, such as R404a and R507 ~0 4,300 2R-152a HFC-152a Component in many refrigerant blends ~0 120 2R-236ea HFC-236ea Refrigerant ~0 9,400 2R-245ca HFC-245ca Possible refrigerant in future ~0 640 2R-245fa HFC-245fa Insulation agent, centrifugal chillers ~0 1,020 1
R-365mfcHFC-365mfc Possible refrigerant in future ~0 950 2
R-404a HFC-404a Low-temperature refrigeration ~0 3,900 1R-407c HFC-407c HFC-22 replacement ~0 1,700 1R-410a HFC-410A Air-Conditioning ~0 1,890 1R-507a HFC-507A Low-temperature refrigeration ~0 3,900 1
R-744 CO2 Secondary loop systems, potential refrigerant for automotive AC and others 0 1 1
R-717NH3
(ammonia) Commercial refrigeration 0 0 1R-290 Propane Commercial refrigeration, refrigerators/freezers, more common in Europe 0 3 1R-600 Butane Commercial refrigeration, refrigerators/freezers, more common in EuropeR-729 Air Specialty/research applications; Nnot commercially used. 0 0
Water Industrial refrigeration; heat-drive refrigeration cycles 0 0
References:1) Rubenstein, Reva, David Didion, and Jeff Dozier. The Treatment by LEED® of the Environmental Impact of HVAC Refrigerants. 2) EPA statistics based on WMO 2006 and IPCC 2001 data.
Natural Refrigerants
Chlorofluorocarbons (CFCs)
Hydrochlorofluorocarbons (HCFCs)
Hydrofluorocarbons (HFCs)
Table 3-1: Refrigerants and key properties
Chlorofluorocarbons (CFC’s)
Until implementation of the Montreal Protocol, CFC’s were the primary refrigerant type used in commercial refrigeration. Approximately 50% of the HVAC chillers used in existing buildings are still operating on CFC-11. These systems tend to be old and leaky.
13

HMG and CTG Southern California Edison Co.
Refrigerants and GHG
HCFC-123 can be used as a retrofit refrigerant for CFC-11 chillers, although this is only cost-effective for newer equipment1. CFC’s have thermo-physical properties the work very well in vapor-compression refrigeration cycles, are safe, and very stable. However, they have a very long atmospheric life. They migrate to the stratosphere, and are broken apart by UV radiation, where the freed chlorine reacts with o and contributes to the destruction of the ozone layer. CFC’s are being phased out under the Montreal Protocol. CFC’s have high ozone depletion potentials (ODP’s) and high global warming potentials.
Hydrochlorofluorocarbons (HCFC’s),
HCFC’s are designed to be relatively stable within the refrigeration equipment, but have relatively short atmospheric lifetimes. This reduces their ODP’s. R-22 is one the most common HCFC refrigerant and is used fairly extensively in commercial refrigeration equipment. HCFC’s are also scheduled to be phased out under the Montreal Protocol.
Hydrofluorocarbons (HFC’s)
HFC’s have no chlorine atoms, and are one of the primary refrigerants being used to replace CFC and HCFC refrigerants. They have negligible impact on stratospheric ozone depletion, Unfortunately, HFC refrigerants generally have very high global warming potentials and are a very potent greenhouse gases.
Non-Halogenated “Natural” Refrigerants
There are five non-halogenated refrigerants that have low atmospheric impacts, and have been termed “natural” refrigerants. These include water, air, carbon dioxide, ammonia, and hydrocarbons.
Water (H20) is used as a refrigerant for ice-making in some industrial applications and in some adsorption (heat-driven) refrigeration systems. Water has a very low vapor pressure, which requires equipment size to be much larger than most CFC/HCFC/HFC based systems used today. Water vapor absorbs infra-red radiation (heat) in the atmosphere. However, it has a very short atmospheric life (9 days) and is not considered a greenhouse gas.
Air is being used as a refrigerant in a number of specialty/research applications, including very low-temperature refrigeration and possibly railcar refrigeration in Europe. However, air tends to be a very inefficient for HVAC and commercial refrigeration applications and is not a current option for commercial refrigeration.
Carbon Dioxide (CO2) is a refrigerant that is currently used in low-temperature secondary loop commercial refrigeration systems. This is used more commonly in Europe, although is receiving increased interest in the United States for use in low-charge commercial refrigeration systems. Carbon dioxide has a global warming potential of one (1).
1 Rubenstein, Didion, and Dozier, The Treatment by LEED® of the Environmental Impact of HVAC Refrigerants.
14

HMG and CTG Southern California Edison Co.
Refrigerants and GHG
Ammonia (NH3) is widely used in industrial refrigeration and has excellent thermodynamic performance. However, it has safety concerns and is not commonly used in commercial applications. Building, fire and safety codes limit its use inside of buildings.
Hydrocarbons (HC’s) including propane, butane, ethane, isobutene and isopentane have properties that make them good refrigerants. HC’s have found greater application in Europe, particularly in residential refrigerators in Germany. They are used in HFC refrigerant blends. HC’s have obvious flammability concerns.
3.2.2 Refrigerant Costs The following table provides approximate costs for common refrigerants.
R-# Name Application Cost, $/lb
Cost, $/kg
R-11 CFC-11 Common pre-Montreal refrigerant used in centrifugal chillers $11.8 $ 5.3
R-12 CFC-12Common pre-Montreal refrigerant used in chillers and refrigerators; still used in legacy equipement. $25.0 $11.3
R-500 CFC-500 Pre-Montreal refrigerant used in centrifugal chillers and humidifiers $16.0 $ 7.3
R-502 R-502 CFC/ HCFC blend; Pre-Montreal refrigerant used for low-temeprature refrigeration $20.0 $ 9.1
R-22 HCFC-22Common refrigerant, used in air-coniditioning applications, chillers and refrigeration systems $ 6.6 $ 3.0
R-134a HFC-134aVery widely used refrigerant; also component of other refrigerant blends, such as R404a $ 4.0 $ 1.8
R-404a HFC-404a Low-temperature refrigeration $ 9.8 $ 4.4 R-410a HFC-410A Air-Conditioning $ 9.6 $ 4.3 R-507a HFC-507A Low-temperature refrigeration $10.2 $ 4.6
Chlorofluorocarbons (CFCs)
Hydrochlorofluorocarbons (HCFCs)
Hydrofluorocarbons (HFCs)
Table 3-2: Refrigerant Costs1
3.2.3 Tradeoffs Between Ozone and Climate Impacts There is a difficult environmental trade-off between refrigerants. Refrigerants tend to be either bad for ozone and good for climate, or good for ozone and bad for climate.
CFC and HCFC refrigerant emissions are damaging to the ozone layer, and are being phased out under the Montreal Protocol (implemented in 1989). The Ozone Depletion Potential (ODP) of a compound is the ratio of the destruction of ozone of that chemical to the impact of the same mass of CFC-11 [EPA]. Most CFCs and HCFCs have ODPs between 0.01 and 1.0. Halons have ODPs up to 10. HFCs have ODPs of nearly zero because they do not contain chlorine. Newer refrigerants (HFCs and HFC blends) have
1 Cost data from Discount Refrigerants, Inc., http://www.koolit.net/index.php
15

HMG and CTG Southern California Edison Co.
Refrigerants and GHG
ODPs that are zero or very close to zero, but they can be substantial contributors to global warming.
HFC refrigerants are the primary replacement for CFC and HCFC refrigerants. While not damaging to the ozone layer, HFC refrigerants have high global warming potentials (GWPs) and contribute to climate change. HFC refrigerant emissions have started to rise steadily since 1990, as shown in the following figure and table. Note that these emissions are for all HFC emissions, not just those from commercial refrigeration (no finer breakdown was identified).
Figure 3-4: U.S. Anthropogenic Emissions of HFCs1
Table 3-3: U.S. HFC emissions
In California, high GWP gasses, including HFC refrigerants, constitute 2.9% of total GHG emissions, as shown in the following figure.
1 U.S. Energy Information Administration, Emissions of Greenhouse Gases
in the United States 2007, December 2008, ftp://ftp.eia.doe.gov/pub/oiaf/1605/cdrom/pdf/ggrpt/057307.pdf
16

HMG and CTG Southern California Edison Co.
Refrigerants and GHG
Figure 3-5: California GHG Emissions by Source1
HFC refrigerant use and emissions has been increasing rapidly since implementation of the Montreal Protocol. R-134a, a primary CFC/HCFC replacement, is the largest source of high GWP emissions, as shown in the following figure.
Figure 3-6: California HFC Emissions
The US Green Building Council (USGBC) commissioned a study on the tradeoffs between the ozone and climate impacts of refrigerants in commercial heating, ventilation,
1 California Energy Commission, Inventory of California Greenhouse Gas Emissions and Sinks: 1990 to 2004, Staff
Final Report, December 2006, http://www.energy.ca.gov/2006publications/CEC-600-2006-013/CEC-600-2006-013-SF.PDF
17

HMG and CTG Southern California Edison Co.
Refrigerants and GHG
and cooling (HVAC) systems1. The data and some of the conclusions from the USGBC study are also relevant to the consideration of commercial refrigeration systems.
This study defines two metrics to describe the life-cycle impacts of a refrigeration system for climate and ozone. The Life-Cycle Ozone Depletion Index (LCODI) is measured in pounds of CFC-11 equivalents per ton-year (with tons being the refrigeration system capacity. A similar metric, the Life-Cycle Direct Global Warming Index (LCGWId) is a measure of the direct (refrigerant losses only) climate impacts. It does not include indirect (energy-related GHG emissions)2. Plotting the LCGWId verses the LCODI provides insight into the relative impacts the various refrigerants have on the atmosphere.
Figure 3-7: Climate verses ozone impacts of various refrigerants3
1 Rubenstein, Didion, and Dozier, The Treatment by LEED® of the Environmental Impact of HVAC Refrigerants 2 Refer to section 3 Ibid.
18

HMG and CTG Southern California Edison Co.
Refrigerants and GHG
The following graph plots the same data for HCFC’s and HFC’ on a rescaled axis for clarity.
Figure 3-8: Climate verses ozone impacts of HCFC and HFC refrigerants1
The authors of the USGBC concluded that there was no optimal trade-off between ODP and GWP. They recommended changes in LEED requirements to provide recognition for the selection of systems and refrigerants that balance both LCGWI and LCODI. They concluded that it was possible to identify HVAC refrigerants that fall in the lower left quadrant of Figure 3-8.
3.2.4 Energy Efficiency Impacts of Refrigerant Selection “Refrigerant efficiency” is a complex issue. Although there are many studies and much data in the literature, the data and conclusions are not always consistent. Refrigeration system efficiency is complexly related to equipment design, compressor type, heat exchanger configuration, component sizing, refrigerant properties, operating regimes, desired refrigeration temperatures, environmental conditions, and other factors. Furthermore, the literature takes different approaches to assessing refrigerant efficiency, including comparison to idealized cycles, modeling, and empirical data. Care must be taken to understand the efficiency numbers presented to ensure that correct conclusions are drawn.
1 Ibid.
19

HMG and CTG Southern California Edison Co.
Refrigerants and GHG
While a full analysis of the energy efficiency impacts of refrigerant choice is beyond the scope of this paper, the following data provides useful insight. This data plots steady state modeled COP’s for refrigeration systems operating at different temperatures and using different refrigerants. The refrigeration system and operating conditions are the same for each case, with the exception that the compressor is scaled in order to maintain equal refrigeration capacity1. There are several observations. First, the system operating temperature (air-conditioning/ medium temperature refrigeration, or low temperature refrigeration) has a much larger impact on system efficiency than refrigerant selection. Second, there is not a clear relationship between refrigerant type (CFC, CFC, HFC, or natural refrigerants) and efficiency. Some HFC refrigerants are more efficient than HCFC-22 and some less. Third, the variation in COP dampens out as operating temperature drops.
Figure 3-9: Modeled COP’s for various refrigerants2
1 Market Transformation Program, Characteristics of Refrigerants in Relation to Efficiency, January 7, 2008,
http://www.mtprog.com/spm/download/document/id/702 2 Ibid.
20

HMG and CTG Southern California Edison Co.
Refrigerants and GHG
Refrigerant
Air-conditioning
(+21°C)
Medium temp.
refrigeration (+5°C)
Low temp. refrigeration
(-18°C) CFC CFC-12 – 3.15 1.51
HCFC HCFC-22 5.8 3.31 1.55
HFC HFC-134a – 2.98 1.42
HFC HFC-404a 5.39 2.96 1.33
HFC HFC-407c 4.99 2.88 1.37
HFC HFC-410A 5.92 3.25 1.48
Natural R-600a (Butane) – 2.93 1.42
Natural R-290 (Propane) 6.13 3.42 1.57
Natural R-1270 (Propylene) 6.46 3.56 1.62
Natural CO2 7.12 3.84 1.7
Table 3-4: Modeled COP’s for various refrigerants
3.2.5 Operational Refrigerant Leakage Rates Commercial refrigeration systems have very high leakage rates compared to HVAC refrigeration systems. HVAC refrigeration equipment has annual leakage rates ranging from 0.5% to 3% of the total charge1. In contrast, currently used commercial refrigeration systems have typical annual leakage rates of 15% to 30%. This is due to the extensive use of field-erected, direct-expansion refrigerant piping used in typical food sales facilities. A typical Wall-Mart store uses 24,170 feet (4.6 miles) of refrigerant pipe on average2. This piping is designed for ease and speed of assembly, not leak-resistance. Equipment vibration, thermal expansion, the use of threaded verses soldered/brazed joints and other factors exacerbate leakage. Refer to Section 3.3 for more discussion on operational refrigerant leakage.
Sections 608 and 609 of the Clean Air Act Amendments (CAAAs) imposes some control of CFC and HFC refrigerants in systems with refrigerant charges of 50 pounds or more. This includes some record-keeping obligations, certification requirements, refrigeration recovery requirements, and a 35% annual leak rate cap (leaks greater than this require reporting within a month). California’s SQAQMD requires annual reporting refrigerant use for systems with charges greater than 50 pounds. HFC’s are not regulated to the same extent and are only subject to a “no venting” requirement under sections 608 and 609 of
1 Rubenstein, Didion, and Dozier, The Treatment by LEED® of the Environmental Impact of HVAC Refrigerants 2 Hill Phoenix, “Press Release: Hill Phoenix Second Nature (R) Technology Helps Lower Energy Consumption and
Carbon Footprint at New Wal-Mart Supercenter,” March 17, 2008, http://www.hillphoenix.com/communications/Press_Releases/Wal-Mart%20Las%20Vegas%2003-17-08_FINAL.pdf
21

HMG and CTG Southern California Edison Co.
Refrigerants and GHG
the CAAAs. California ARB proposed refrigerant rules outline an increasingly stringent leak detection requirements over the coming years.1
3.2.6 End-of-Life Refrigerant Loss In addition to refrigerant leakage during normal operation, there are refrigerant losses during equipment decommissioning at its end-of-life. While refrigerant is not supposed to be vented per the Sections 608 and 609 of the Clean Air Act Amendments, there are inevitably some losses. Data for end-of-life loss rates for commercial refrigeration equipment was not identified. However, it can be reasonably assumed that the loss rates will be similar for HVAC refrigeration equipment, which are estimated to be on the order of 2% to 10% of the total charge2. Loss rates for commercial refrigeration equipment may be higher than that reported for HVAC equipment due to the complexity of commercial refrigeration equipment and the extensive amount of the refrigerant piping.This needs furt
her study.
3.3 Commercial Refrigeration Systems Commercial refrigeration systems can be classified into the following categories:
Self-Contained
Multiplex
Single-Compressor
Distributed-Compressor,
Advanced Self-Contained
Secondary Loop systems.
The first three (Self-Contained, Multiplex, and Single Compressor are the most prevalent systems in use today. Self-Contained systems are typically used in smaller markets, or in areas of larger stores that are not accessible to the multiplex refrigerant lines (e.g., beverage case at the checkout stand). The most prevalent technology in supermarket-type applications is the multiplex system. This is considered the “baseline” system.
The other systems are “advanced” systems that hold promise for reducing GHG emissions. Currently used systems are described in more detail below. The advanced systems are described in the next section.
3.3.1 Self-Contained/Stand-Alone System A self-contained, or stand-alone commercial refrigeration systems is a factory-assembled unit that contains the compressor, evaporator coil, and air-cooled condenser all in one
1 California Air Resources Board. 2008. DRAFT Proposed Regulation Order. Regulation for Management of High
Global Warming Potential Refrigerants. Released for public review September 8, 2008. 27 pages. 2 Rubenstein, Didion, and Dozier, The Treatment by LEED® of the Environmental Impact of HVAC Refrigerants
22

HMG and CTG Southern California Edison Co.
Refrigerants and GHG
unit. This includes beverage coolers, vending machines and similar types of equipment similar to residential refrigerators and freezers.
Self contained equipment is typically used in convenience stores, markets, and near the checkout lines in supermarkets. One problem with self-contained units is that they reject heat directly into the conditioned space. This increases air-conditioning loads and energy use. Furthermore, there is a limit on how many stand-alone systems can be installed in a space before their collective heat rejection results in noticeable temperature increases.
The efficiency of self-contained commercial refrigeration equipment lags behind residential refrigerators. Test methods, efficiency standards and voluntary programs (e.g., Energy Star) are not as well developed. The EPA has initiated rulemaking in late 2006 to develop more stringent efficiency standards1.
3.3.2 Multiplex System The most common supermarket refrigeration system is the multiplex direct expansion system. This system is composed of several compressors connected in parallel, sharing a common discharge line and suction line. The compressors are located in a central equipment room or on the building roof. The compressors are connected to one or more larger condensers, and share a number of other components including a single oil-management system. The condenser is typically air-cooled, although it can be water-cooled. The compressors are connected to multiple evaporator coils serving different refrigeration equipment. The following figure illustrates the system configuration.
1 California Air Resources Board, “Draft Concept Paper: Specifications for Commercial Refrigeration.”
23

HMG and CTG Southern California Edison Co.
Refrigerants and GHG
Figure 3-10: Typical multiplex system layout1
A typical grocery store or supermarket generally has at least one multiplex system that serves the medium temperature loads (dairy, meat, produce, etc.), and a second system that serves the low temperature loads (frozen foods, ice cream). Often, there are two or more medium temperature systems and two or more low temperature systems.
Due to the distance from the compressors to the refrigeration equipment, thousands of feet to miles of refrigerant pipe are required. This large amount of piping requires a large amount of refrigerant. Refrigerant charge sizes can be as much as 4,000 lbs2, with an average charge of 2,800 lbs in California3. The typical unit charge is 4 – 5 kg/kW of refrigeration capacity4.
In addition to increasing the refrigeration charge requirements, the long pipe runs are a major source of refrigerant leaks. Most of the refrigerant lines are field-installed. Pipe joints have historically been designed for ease and rapidity of installation, and tend to be
1 Van Baxter, IEA Annex 26: Advanced Supermarket Refrigeration/Heat Recovery Systems, April 2003,
http://www.ornl.gov/~webworks/cppr/y2003/rpt/117000.pdf. 2 California Air Resources Board, “Draft Concept Paper: Specifications for Commercial Refrigeration.” 3 Ibid. 4 Baxter, IEA Annex 26: Advanced Supermarket Refrigeration/Heat Recovery Systems.
24
HMG and CTG Southern California Edison Co.
Refrigerants and GHG
quite leaky. Threaded pipe joints, equipment vibration and thermal expansion from normal operation tends to cause and exacerbate the leaks. Leak rates in multiplex DX systems range from 15% for a “best case” new installation, to 30% or more for older installations1. To compound matters, refrigerant piping is sometimes run through inaccessible locations which make finding and fixing leaks difficult to impossible.
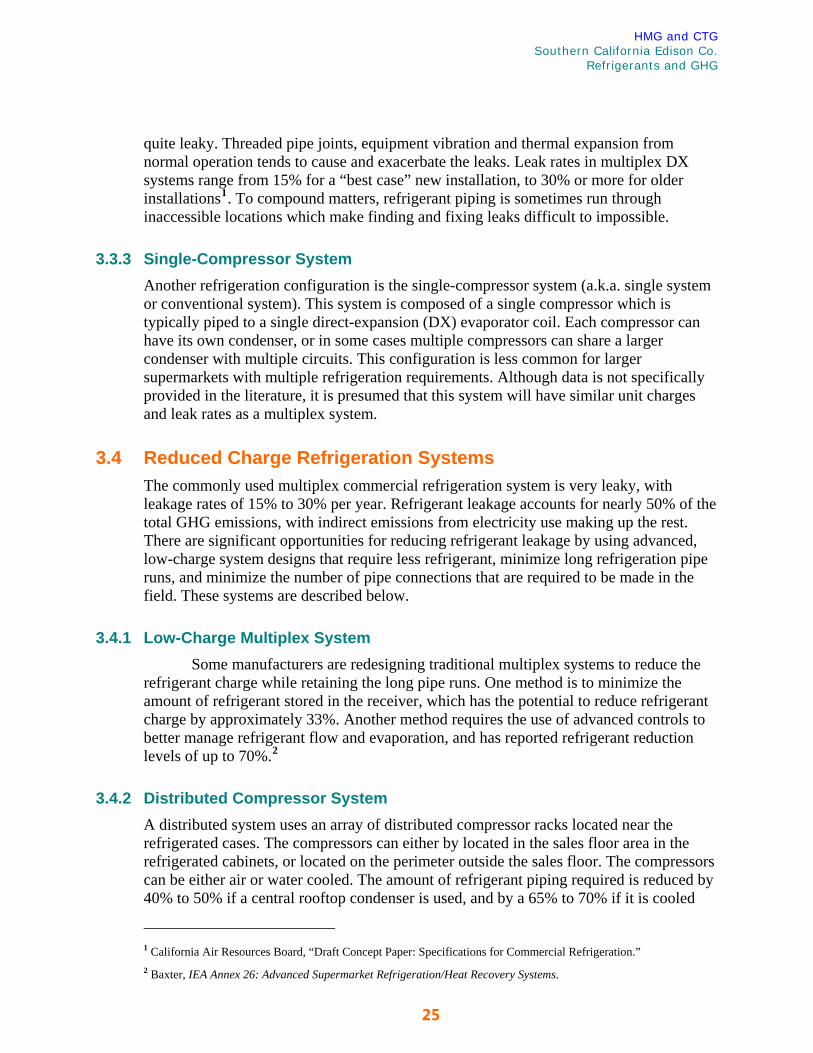
3.3.3 Single-Compressor System Another refrigeration configuration is the single-compressor system (a.k.a. single system or conventional system). This system is composed of a single compressor which is typically piped to a single direct-expansion (DX) evaporator coil. Each compressor can have its own condenser, or in some cases multiple compressors can share a larger condenser with multiple circuits. This configuration is less common for larger supermarkets with multiple refrigeration requirements. Although data is not specifically provided in the literature, it is presumed that this system will have similar unit charges and leak rates as a multiplex system.
3.4 Reduced Charge Refrigeration Systems The commonly used multiplex commercial refrigeration system is very leaky, with leakage rates of 15% to 30% per year. Refrigerant leakage accounts for nearly 50% of the total GHG emissions, with indirect emissions from electricity use making up the rest. There are significant opportunities for reducing refrigerant leakage by using advanced, low-charge system designs that require less refrigerant, minimize long refrigeration pipe runs, and minimize the number of pipe connections that are required to be made in the field. These systems are described below.
3.4.1 Low-Charge Multiplex System Some manufacturers are redesigning traditional multiplex systems to reduce the refrigerant charge while retaining the long pipe runs. One method is to minimize the amount of refrigerant stored in the receiver, which has the potential to reduce refrigerant charge by approximately 33%. Another method requires the use of advanced controls to better manage refrigerant flow and evaporation, and has reported refrigerant reduction levels of up to 70%.2
3.4.2 Distributed Compressor System A distributed system uses an array of distributed compressor racks located near the refrigerated cases. The compressors can either by located in the sales floor area in the refrigerated cabinets, or located on the perimeter outside the sales floor. The compressors can be either air or water cooled. The amount of refrigerant piping required is reduced by 40% to 50% if a central rooftop condenser is used, and by a 65% to 70% if it is cooled
1 California Air Resources Board, “Draft Concept Paper: Specifications for Commercial Refrigeration.” 2 Baxter, IEA Annex 26: Advanced Supermarket Refrigeration/Heat Recovery Systems.
25

HMG and CTG Southern California Edison Co.
Refrigerants and GHG
with a water heat rejection circulation loop. This system uses a greater number of factory-made joints which helps reduce refrigerant leak rates. Furthermore, some efficiency gains are obtained due to the proximity of the compressor to the evaporator, and using more compressors that can be better matched to the refrigeration systems temperature setpoints. The cost premium for a distributed system is approximately 15% more than a conventional multiplex system1.
Figure 3-11: Distributed compressor system with a water-cooled condenser2
3.4.3 Advanced Self-Contained Systems The distributed compressor system concept can be taken a step further and all of the refrigeration equipment could be self-contained. A water heat rejection loop would likely be required for this system. This has the potential to reduce the refrigerant charge by 90% to 95%.
1 Ibid. 2 Ibid.
26

HMG and CTG Southern California Edison Co.
Refrigerants and GHG
3.4.4 Secondary Loop Systems A secondary loop system uses a chiller to cool a secondary fluid. This fluid is then circulated to the refrigeration equipment. The primary advantage of a secondary loop system is that the amount of refrigerant can be dramatically reduced by 85% – 90% (compared to a typical multiplex system). Secondly, most of the joints are made at the factory, and are less prone to leaking.
Figure 3-12: Secondary loop system1
A typical store using a secondary loop system would require a minimum of two loops. In the US, the medium temperature loop fluid is typically a propylene glycol/water mix, and the low temperature loop is typically a potassium formate/water mix. In Europe, CO2 is a popular secondary loop for both medium and low temperatures2. CO2 is receiving increased interest in the US.
Reported cost premiums for secondary loop systems compared to typical multiplex systems range from 0% to 40%, with a likely range of a 0% to 15% cost premium. Maintenance costs are reported to be 25% lower, and operating (energy) costs are reported to be 0% to 15% lower. Refer to [Baxter 2003] for more details.
1 Ibid. 2 Ibid.
27
HMG and CTG Southern California Edison Co.
Refrigerants and GHG
A new “second-generation, High-Efficiency (HE.2)” Wal-Mart Supercenter opened in Las Vegas on March 17, 20081. This store uses a secondary loop system for its medium temperature refrigeration needs. It uses different-sized modular chillers tied to a secondary refrigeration loop composed of a 65/35 water/glycol mix. This replaces R401a. Refrigerant use is reported to be reduced by 90% compared to its prototypical store design. It also uses an innovative 3-stage heat reclaim loop that can get a 22oF temperature rise. This recovers heat from the refrigeration system and uses it for building HVAC, saving 10,000 Therms of natural gas per year. Wal-Mart has also taken steps to reduce the amount of refrigerant piping required by placing refrigeration units on the roof directly above the refrigeration equipment, rather than a central mechanical pod. This Supercenter uses 11,350 feet (2 miles) of copper, while typical Wall-Marts uses an average of 24,170 feet (4.6 miles).
3.5 Analysis of Commercial Refrigeration System GHG Reduction Opportunities A simple analysis has been performed to assess the efficacy of the various energy efficiency, advanced system design, and refrigerant loss reduction measures for reducing total lifetime GHG emissions. This analysis is based on a detailed analysis of supermarket refrigeration systems performed by Oak Ridge National Laboratory (ORNL) in support of the International Energy Agency’s “Advanced Supermarket Refrigeration/Heat Recovery Systems” program2. ORNL’s annual energy use results for each system configuration are used directly3, but the emission factors are updated to California values4, updated GWP values are used (Table 3-1), RPS effects are accounted for (i.e., a reduction in the carbon intensity of delivered electricity over the refrigeration system’s 15 year lifetime and the effects of a 20% renewables contribution in 2020 is factored in), end-of-life refrigerant losses are calculated, and estimated losses from low refrigerant charge are explored.
The analysis is based on a prototypical 40,000 ft2 supermarket with a configuration as illustrated in the figure below. The total refrigeration load is 328 kW (82 kW for the low-temperature loads, and 246 kW for the medium-temperature refrigeration loads). The base-case refrigeration system is a multiplex direct expansion system using R-22 for the medium-temperature circuits and R-404A for the low-temperature circuits. Three
1 Hill Phoenix, “Press Release: Hill Phoenix Second Nature (R) Technology Helps Lower Energy Consumption and
Carbon Footprint at New Wal-Mart Supercenter.” 2 Baxter, IEA Annex 26: Advanced Supermarket Refrigeration/Heat Recovery Systems. 3 The ORNL model was run using Washington D.C. Weather to calculate annual refrigeration system energy use. The
model could not be obtained and rerun with local climatic conditions. However, the existing refrigeration system energy use results are sufficient to illustrate the differences advanced designs have on GHG emissions, and relative ranking of GHG emissions.
4 The original ORNL report used an electricity system emission factor of 0.65 kg CO2e/kWh, which is more than double the average California emission factor of 0.315 kg CO2e /kWh and SCE’s emission factor of 0.290 kg CO2e/kWh. This would overstate indirect electricity emissions by a factor of ~2. For reference, LADWP’s emission factor is 0.562 kg CO2e/kWh.
28

HMG and CTG Southern California Edison Co.
Refrigerants and GHG
advanced system designs are modeled: a low-charge multiplex system, a distributed compressor system, and a secondary loop system. The impacts of air vs. evaporative condenser cooling is modeled (if applicable), and a range of typical refrigerant leakage rates for each system is explored.
Figure 3-13: Prototypical supermarket layout for ORNL analysis
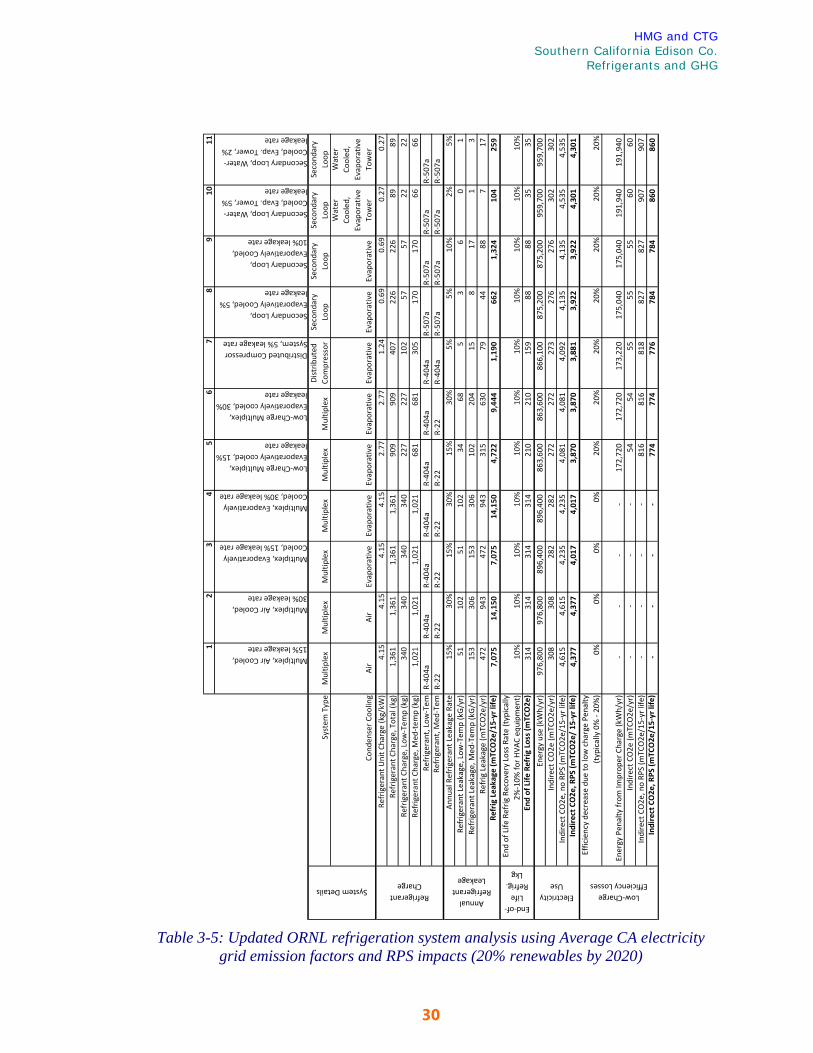
Updated results are summarized in the following two tables.
29
HMG and CTG Southern California Edison Co.
Refrigerants and GHG
12
34
56
78
910
Multiplex, Air Cooled, 15% leakage rate
Multiplex, Air Cooled, 30% leakage rate
Multiplex, Evaporatively Cooled, 15% leakage rate
Multiplex, Evaporatively Cooled, 30% leakage rate
Low‐Charge Multiplex, Evaporatively cooled, 15% leakage rate
Low‐Charge Multiplex, Evaporatively cooled, 30% leakage rate
Distributed Compressor System, 5% leakage rate
Secondary Loop, Evaporatively Cooled, 5% leakage rate
Secondary Loop, Evaporatively Cooled, 10% leakage rate
Secondary Loop, Water‐Cooled, Evap. Tower, 5% leakage rate
Secondary Loop, Water‐Cooled, Evap. Tower, 2% leakage rate
System
Type
Multiplex
Multiplex
Multiplex
Multip
lex
Multiplex
Multiplex
Distributed
Co
mpressor
Second
ary
Loop
Second
ary
Loop
Second
ary
Loop
Second
ary
Loop
Cond
enser Co
oling
Air
Air
Evaporative
Evaporative
Evaporative
Evaporative
Evaporative
Evaporative
Evaporative
Water
Cooled
, Evaporative
Tower
Water
Cooled
, Evaporative
Tower
Refrigerant U
nit C
harge (kg/kW
)4.15
4.15
4.15
4.15
2.77
2.77
1.24
0.69
0.69
0.27
0.27
Refrigerant C
harge, Total (kg)
1,36
1
1,36
1
1,36
1
1,36
1
909
909
407
226
226
89
89
Refrigerant C
harge, Low
‐Tem
p (kg)
340
340
340
340
227
227
102
57
57
22
22
Refrigerant C
harge, M
ed‐tem
p (kg)
1,02
1
1,02
1
1,02
1
1,02
1
681
681
305
170
170
66
66
Refrigerant, Low
‐Tem
R‐40
4aR‐40
4aR‐40
4aR‐40
4aR‐40
4aR‐40
4aR‐40
4aR‐50
7aR‐50
7aR‐50
7aR‐50
7aRe
frigerant, M
ed‐Tem
R‐22
R‐22
R‐22
R‐22
R‐22
R‐22
R‐40
4aR‐50
7aR‐50
7aR‐50
7aR‐50
7aAnn
ual Refrigerant Leakage Rate
15%
30%
15%
30%
15%
30%
5%5%
10%
2%5%
Refrigerant Leakage, Low
‐Tem
p (kG/yr)
51
102
51
102
34
68
5
3
6
0
1
Refrigerant Leakage, M
ed‐Tem
p (kG/yr)
153
306
153
306
102
204
15
8
17
1
3
Refrig Leakage (m
TCO2e/yr)
472
943
472
943
315
630
79
44
88
7
17
Refrig Leakage
(mTC
O2e/15‐yr life)
7,07
5
14,150
7,07
5
14,150
4,72
2
9,44
4
1,19
0
662
1,32
4
104
259
End of Life
Refrig Re
covery Loss Ra
te (typically
2%‐10%
for HVA
C eq
uipm
ent)
10%
10%
10%
10%
10%
10%
10%
10%
10%
10%
10%
End of Life
Refrig Loss (m
TCO2e)
314
314
314
314
210
210
159
88
88
35
35
Energy use (kWh/yr)
976,80
0
976,80
0
896,40
0
896,40
0
863,60
0
863,60
0
866,10
0
875,20
0
875,20
0
959,70
0
959,70
0
Indirect CO2e
(mTC
O2e/yr)
308
308
282
282
272
272
273
276
276
302
302
Indirect CO2e, no RP
S (m
TCO2e/15‐yr life)
4,61
5
4,61
5
4,23
5
4,23
5
4,08
1
4,08
1
4,09
2
4,13
5
4,13
5
4,53
5
4,53
5
Indirect CO2e, R
PS (m
TCO2e
/ 15
‐yr life)
4,37
7
4,37
7
4,01
7
4,01
7
3,87
0
3,87
0
3,88
1
3,92
2
3,92
2
4,30
1
4,30
1
Efficiency de
crease due
to low charge Pe
nalty
(typically 0% ‐ 20
%)
0%0%
0%0%
20%
20%
20%
20%
20%
20%
20%
Energy Pen
alty from
Improp
er Charge (kWh/yr)
‐
‐
‐
‐
172,72
0
172,72
0
173,22
0
175,04
0
175,04
0
191,94
0
191,94
0
Indirect CO2e
(mTC
O2e/yr)
‐
‐
‐
‐
54
54
55
55
55
60
60
Indirect CO2e, no RP
S (m
TCO2e/15‐yr life)
‐
‐
‐
‐
816
816
818
827
827
907
907
Indirect CO2e, R
PS (m
TCO2e/15‐yr life)
‐
‐
‐
‐
774
774
776
784
784
860
860
System DetailsAnnual
Refrigerant Leakage
Refrigerant Charge
End‐of‐Life
Refrig. Lkg
Electricity Use
Low‐Charge Efficiency Losses
11
Table 3-5: Updated ORNL refrigeration system analysis using Average CA electricity
grid emission factors and RPS impacts (20% renewables by 2020)
30

HMG and CTG Southern California Edison Co.
Refrigerants and GHG
12
34
56
78
910
Multiplex, Air Cooled, 15% leakage rate
Multiplex, Air Cooled, 30% leakage rate
Multiplex, Evaporatively Cooled, 15% leakage rate
Multiplex, Evaporatively Cooled, 30% leakage rate
Low‐Charge Multiplex, Evaporatively cooled, 15% leakage rate
Low‐Charge Multiplex, Evaporatively cooled, 30% leakage rate
Distributed Compressor System, 5% leakage rate
Secondary Loop, Evaporatively Cooled, 5% leakage rate
Secondary Loop, Evaporatively Cooled, 10% leakage rate
Secondary Loop, Water‐Cooled, Evap. Tower, 5% leakage rate
Secondary Loop, Water‐Cooled, Evap. Tower, 2% leakage rate
System
Type
Multip
lex
Multip
lex
Multip
lex
Multip
lex
Multip
lex
Multip
lex
Distributed
Co
mpressor
Second
ary
Loop
Second
ary
Loop
Second
ary
Loop
Second
ary
Loop
Cond
enser Co
oling
Air
Air
Evaporative
Evaporative
Evaporative
Evaporative
Evaporative
Evaporative
Evaporative
Water
Cooled
, Evaporative
Tower
Water
Cooled
, Evaporative
Tower
Refrigerant U
nit C
harge (kg/kW
)4.15
4.15
4.15
4.15
2.77
2.77
1.24
0.69
0.69
0.27
0.27
Refrigerant C
harge, Total (kg)
1,36
1
1,36
1
1,36
1
1,36
1
909
909
407
226
226
89
89
Refrigerant C
harge, Low
‐Tem
p (kg)
340
340
340
340
227
227
102
57
57
22
22
Refrigerant C
harge, M
ed‐tem
p (kg)
1,02
1
1,02
1
1,02
1
1,02
1
681
681
305
170
170
66
66
Refrigerant, Low
‐Tem
R‐404a
R‐40
4aR‐40
4aR‐40
4aR‐40
4aR‐40
4aR‐40
4aR‐50
7aR‐507a
R‐50
7aR‐50
7aRe
frigerant, M
ed‐Tem
R‐22
R‐22
R‐22
R‐22
R‐22
R‐22
R‐40
4aR‐50
7aR‐507a
R‐50
7aR‐50
7aAnn
ual Refrigerant Leakage Rate
15%
30%
15%
30%
15%
30%
5%5%
10%
2%5%
Refrigerant Leakage, Low
‐Tem
p (kG/yr)
51
102
51
102
34
68
5
3
6
0
1
Refrigerant Leakage, M
ed‐Tem
p (kG/yr)
153
306
153
306
102
204
15
8
17
1
3
Refrig Leakage (m
TCO2e/yr)
472
943
472
943
315
630
79
44
88
7
17
Refrig Leakage (m
TCO2e
/15‐yr life)
7,07
5
14,150
7,075
14,150
4,72
2
9,44
4
1,19
0
662
1,32
4
104
259
End of Life
Refrig Re
covery Loss Ra
te (typically
2%‐10%
for HVA
C eq
uipm
ent)
10%
10%
10%
10%
10%
10%
10%
10%
10%
10%
10%
End of Life
Refrig Loss (m
TCO2e)
314
314
314
314
210
210
159
88
88
35
35
Energy use (kWh/yr)
976,80
0
976,80
0
896,40
0
896,40
0
863,60
0
863,60
0
866,10
0
875,20
0
875,200
959,70
0
959,70
0
Indirect CO2e
(mTC
O2e/yr)
283
283
260
260
250
250
251
254
254
278
278
Indirect CO2e, no RP
S (m
TCO2e/15‐yr life)
4,24
9
4,24
9
3,89
9
3,89
9
3,75
7
3,75
7
3,76
8
3,80
7
3,807
4,17
5
4,17
5
Indirect CO2e, R
PS (m
TCO2e/ 15
‐yr life)
4,13
4
4,13
4
3,794
3,79
4
3,65
5
3,65
5
3,66
6
3,70
4
3,70
4
4,06
2
4,06
2
Efficiency de
crease due
to low charge Penalty
(typically 0% ‐ 20
%)
0%0%
0%0%
20%
20%
20%
20%
20%
20%
20%
Energy Pen
alty from
Improp
er Charge (kWh/yr)
‐
‐
‐
‐
172,72
0
172,72
0
173,22
0
175,04
0
175,040
191,94
0
191,94
0
Indirect CO2e
(mTC
O2e/yr)
‐
‐
‐
‐
50
50
50
51
51
56
56
Indirect CO2e, no RP
S (m
TCO2e/15‐yr life)
‐
‐
‐
‐
751
751
754
761
761
835
835
Indirect CO2e, R
PS (m
TCO2e
/15‐yr life)
‐
‐
‐
‐
731
731
733
741
741
812
812
System DetailsAnnual
Refrigerant Leakage
Refrigerant Charge
End‐of‐Life
Refrig. Lkg
Electricity Use
Low‐Charge Efficiency Losses
11
Table 3-6: Updated ORNL refrigeration system analysis using SCE average electricity
grid emission factors and RPS impacts (20% renewables by 2020)
31
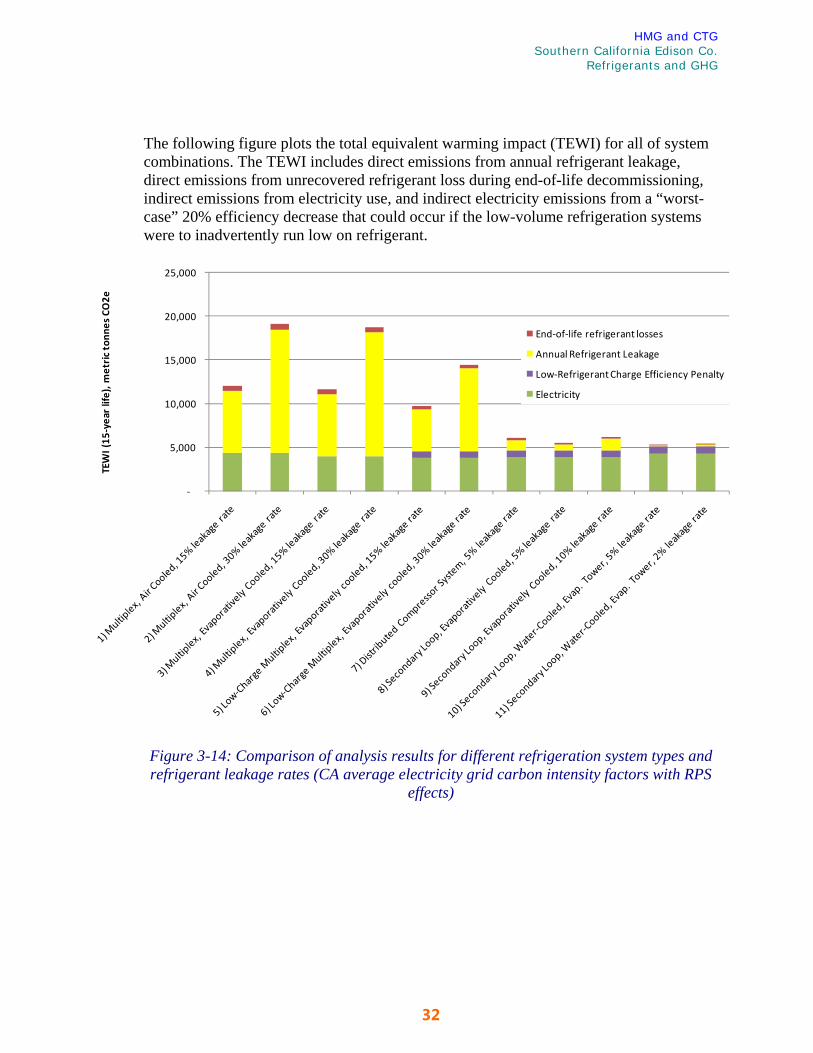
HMG and CTG Southern California Edison Co.
Refrigerants and GHG
The following figure plots the total equivalent warming impact (TEWI) for all of system combinations. The TEWI includes direct emissions from annual refrigerant leakage, direct emissions from unrecovered refrigerant loss during end-of-life decommissioning, indirect emissions from electricity use, and indirect electricity emissions from a “worst-case” 20% efficiency decrease that could occur if the low-volume refrigeration systems were to inadvertently run low on refrigerant.
‐
5,000
10,000
15,000
20,000
25,000
TEWI (15
‐year life), m
etric tonn
es CO2e
End‐of‐life refrigerant losses
Annual Refrigerant Leakage
Low‐Refrigerant Charge Efficiency Penalty
Electricity
Figure 3-14: Comparison of analysis results for different refrigeration system types and refrigerant leakage rates (CA average electricity grid carbon intensity factors with RPS
effects)
32

HMG and CTG Southern California Edison Co.
Refrigerants and GHG
The following figure plots the life-cycle GHG contributions for a typical multiplex system with a 30% leak rate (system 2).
Annual Refrigerant Leakage75%
End‐of‐life refrigerant losses3%
Electricity22%
Figure 3-15: Life-cycle GHG contributions from a typical multiplex system with a 30%
leakage rate.
There are a number of immediate conclusions from the data:
3.5.1 Focus on Reducing Refrigerant Leakage Refrigerant leakage is clearly the primary source of greenhouse gas emissions in existing multiplex refrigeration systems. The “best-case” leakage rate for newly constructed multiplex systems is around 15% of the total refrigerant charge per year, but is widely reported to be closer to 30% for older systems. This represents up to 75% of the total lifetime GHG emissions! Reducing refrigerant leakage in existing multiplex systems should be the number one priority.
There are a number of steps that could be taken to reduce fugitive refrigerant emissions. Enhanced reporting requirements for refrigerant usage for large food sales refrigeration systems could help refine the magnitude of the problem and identify mitigation opportunities, and may encourage facility operators to reduce leakage by bringing attention to the problem. In addition to the GHG impacts, the ~200 – 400 kg of annual refrigerant leakage may be costing facilities from $2,000 to $4,000 per year in replacement refrigerant (see Table 3-2).
In addition to reporting, leak detection programs would be advantageous. Both local detection practices (e.g., the periodic use of electronic leak detectors, helium and HFC mass spectrometry, etc.) and automated performance monitoring systems that monitor system temperatures and pressures should explored.
These observations support the emphasis on reporting and leak detection in ARB’s September 8, 2008 proposed rules for the management of high GWP refrigerants. These
33
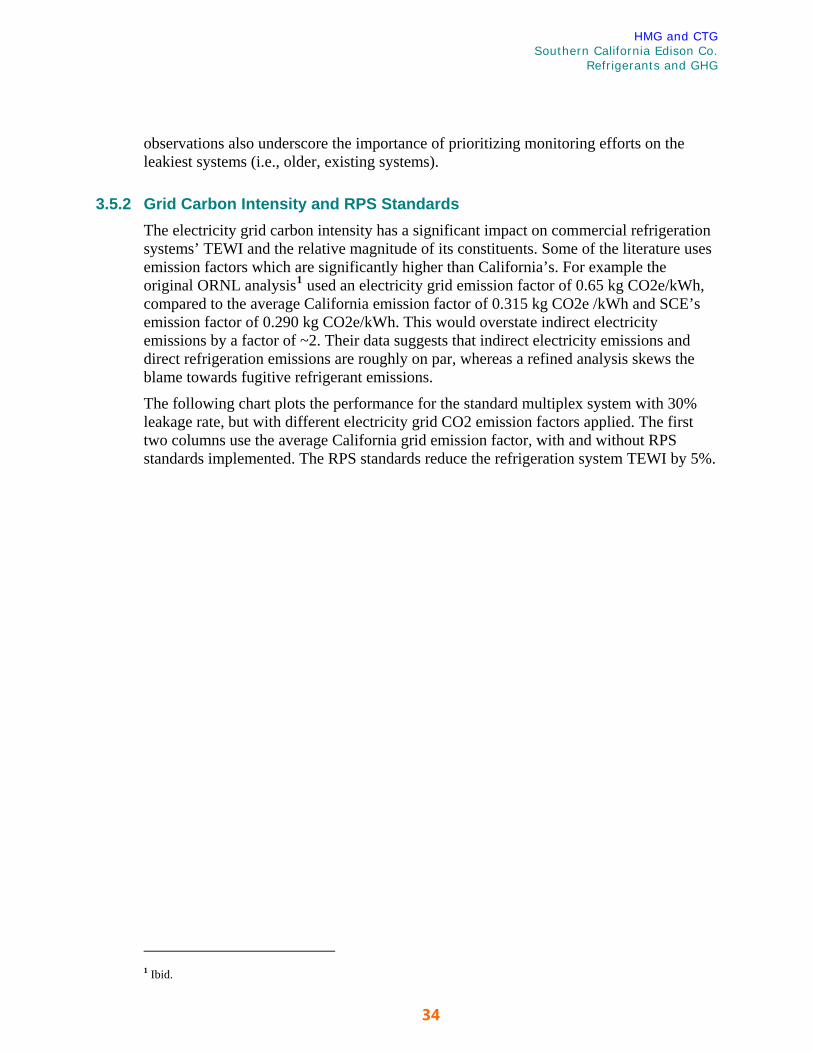
HMG and CTG Southern California Edison Co.
Refrigerants and GHG
observations also underscore the importance of prioritizing monitoring efforts on the leakiest systems (i.e., older, existing systems).
3.5.2 Grid Carbon Intensity and RPS Standards The electricity grid carbon intensity has a significant impact on commercial refrigeration systems’ TEWI and the relative magnitude of its constituents. Some of the literature uses emission factors which are significantly higher than California’s. For example the original ORNL analysis1 used an electricity grid emission factor of 0.65 kg CO2e/kWh, compared to the average California emission factor of 0.315 kg CO2e /kWh and SCE’s emission factor of 0.290 kg CO2e/kWh. This would overstate indirect electricity emissions by a factor of ~2. Their data suggests that indirect electricity emissions and direct refrigeration emissions are roughly on par, whereas a refined analysis skews the blame towards fugitive refrigerant emissions.
The following chart plots the performance for the standard multiplex system with 30% leakage rate, but with different electricity grid CO2 emission factors applied. The first two columns use the average California grid emission factor, with and without RPS standards implemented. The RPS standards reduce the refrigeration system TEWI by 5%.
1 Ibid.
34
HMG and CTG Southern California Edison Co.
Refrigerants and GHG
‐
5,000
10,000
15,000
20,000
25,000
TEWI (15
‐year life), m
etric tonn
es CO2e
End‐of‐life refrigerant losses
Annual Refrigerant Leakage
Low‐Refrigerant Charge Efficiency PenaltyElectricity
Figure 3-16: GHG contributions, including electricity grid emissions, for a typical
multiplex system with a 30% leakage rate.
3.5.3 Evaporative Condensers Evaporative condensers are more efficient than air-cooled condensers, and the data shows that they do reduce the systems TEWI. However, fugitive refrigerant emissions appear to significantly outweigh efficiency improvements in terms of GHG reduction opportunities.
3.5.4 Low-Charge Refrigeration Systems Low-charge multiplex systems help reduce total leakage, but they are still very leaky and have significant refrigerant emissions, as is evident in the graphs. Leak-reduction measures could potentially have a larger bang for the buck. Distributed compressor systems and secondary loop systems are much more effective at reducing refrigerant leakage and should be focused on over low-charge multiplex systems.
3.5.5 End of Life Refrigerant Charge Recovery Maximizing refrigerant end-of-life recovery is important. The data in the literature was sparse on actual recovery rates for commercial systems. A 20% loss rate is believed to be a conservative estimate, but this is not certain. The results and conclusions presented above are potentially sensitive to changes or real world variation in this assumption.
35

HMG and CTG Southern California Edison Co.
Refrigerants and GHG
3.5.6 Impacts of Low Refrigerant Charge on Energy Consumption There is some concern that some of the advanced low-charge refrigeration systems may be susceptible to running low on refrigerant charge due to routine leakage, and that this would lead to situations where the equipment runs at sub-optimal efficiency levels and therefore increase GHG emissions. This situation is most likely for the low-charge multiplex systems which have reduced charge but are still exposed to high leakage rates from the miles of refrigerant piping. This is much less of a concern for secondary loop and distributed systems. Although these systems have significantly reduced refrigerant charges, they have significantly less refrigerant piping (a major source of leaks), a greater percent of the pipe fittings can be made at the factory, and leakage rates are significantly less.
A review of the literature did not reveal any papers specifically addressing vulnerabilities of advanced commercial refrigeration systems operating on incomplete refrigerant charges. However, data suggests that in general, vapor compression cycle efficiency may decrease by up to 20% for low refrigerant charges. In order to make a preliminary assessment of the life-cycle GHG impacts that operating on an insufficient refrigerant charge could have, the annual energy use was increased by 20% in the low-charge systems (the blue bars in Figure 3-14. The penalty is assumed to occur for the entire 15 year life of the system to bracket the worst-case conditions. It is hoped that the insufficient refrigerant charge would be a shorter-term event. Furthermore, potential refrigerant leak monitoring and reporting would reduce the possibility of this situation occurring for long periods of time without notice. Although this efficiency penalty definitely does increase lifecycle GHG emissions, it is small compared to the fugitive refrigerant leakage impacts. The benefits that advanced, low-charge refrigerant systems have in reducing refrigerant leakage offsets potential efficiency penalties if these systems are operated on insufficient charges.
3.6 Integrated Building HVAC/ Commercial Refrigeration Analysis Tools and Methodologies Commercial refrigeration systems are closely coupled to the building HVAC systems. Refrigeration loads are significantly impacted by the temperature and humidity conditions in the store and by store operating hours. And vice-versa, the refrigerated cases provide zonal cooling, and in some cases refrigeration condensers are located in conditioned space (e.g., stand-alone equipment and some distributed compressor systems), both of which impact HVAC loads. There are also significant opportunities to recover heat from the refrigeration system and use this for space-heating. Controlling commercial refrigeration system indirect GHG emissions will therefore require close coordination with building HVAC energy analysis and energy code compliance.
A review of the existing building energy modeling and commercial refrigeration system analysis tools has been performed to identify potential enhancements required in the modeling/compliance tools. There are three primary programs that are capable of bridging the nexus of building HVAC energy use and commercial refrigeration system energy use. This includes a special “refrigeration” versions of eQuest, the latest version
36

HMG and CTG Southern California Edison Co.
Refrigerants and GHG
of Energy+ and EPRI’s Supermarket Simulation Tool (SST). Several other tools were also reviewed, but these do not appear to be as applicable as the first three.
The following table summarizes the key features of the analytical tools identified as capable of analyzing combined HVAC and commercial refrigeration system energy use. One of the shortcomings of all the programs reviewed were that none appeared to explicitly estimate refrigerant direct emissions (either on an annual or lifecycle basis).
eQuest Energy+
Supermarket Simulation Tool
(SST) Cost Free Free $250
Out
puts
Direct refrigerant emissions in CO2e (annual leakage)
Direct refrigerant emissions in CO2e (lifecycle)
Indirect emissions from energy use in CO2e for refrigeration systems
Total refrigeration-related emissions in CO2e (annual)
Total refrigeration-related emissions in CO2e (lifetime)
Ref
riger
ant S
yste
ms M
odel
ed
Multiplex
Low-Charge Multiplex
Self-Contained
Advanced Self-Contained
Distributed Compressor ?
Secondary Loop ? ?
Air Cooled Condenser
Evaporative Cooled Condenser
Water Cooled Condenser ? ?
Detailed Component-Level Modeling
HV
AC
In
tegr
atio
n Water-Source Heat Pump Integration ? ? ?
Whole-Building Loads
Heat Reclaim ? (“ “ indicates the presence of a feature, “x” indicates the absence of a feature, “?” indicates that the
availability of the feature if unknown)
Table 3-7: Refrigeration system tools analysis tool summary
37

HMG and CTG Southern California Edison Co.
Refrigerants and GHG
3.6.1 eQuest eQuest (http://doe2.com/equest/index.html) is a detailed building energy simulation program that is widely used in California. There is a special “refrigeration” version of eQuest available that can model commercial refrigeration systems. The refrigeration modeling approach is flexible and appears like it should provide a robust platform for modeling integrated HVAC/commercial refrigeration systems.
There are two challenges though. First, the refrigeration version of eQuest is not certified for Title-24 Compliance analysis. Second, adding the refrigeration system module required a major rewriting of some of the HVAC and water loop code, and it appears that a significant amount of the water-side components have not been re-written1:
1 http://doe2.com/equest/index.html
38

HMG and CTG Southern California Edison Co.
Refrigerants and GHG
Figure 3-17: Screen-shot of eQuest’s refrigeration system input screen
3.6.2 EnergyPlus The U.S. Department of Energy has been developing the “next generation” of building energy simulation software, EnergyPlus, for some time. It is a very capable program, however, a steep learning curve and limited easy-to-use interfaces has precluded its widespread commercial use. This will likely shift in coming years as development progresses.
The newest release of EnergyPlus (11/2008) has expanded refrigeration analysis capabilities. EnergyPlus appears to provide a very capable simulation environment that should be able to handle most integrated commercial refrigeration/HVAC analyses. However, there will likely be some learning curve/teething requirements. Furthermore, EnergyPlus is not certified for CA Title 24 compliance use, which could be an issue.
39

HMG and CTG Southern California Edison Co.
Refrigerants and GHG
The following pages are excerpted from the EnergyPlus user’s guide and engineering reference guide and provide a more detailed description of its analysis capabilities.
40

HMG and CTG Southern California Edison Co.
Refrigerants and GHG
Documentation: http://apps1.eere.energy.gov/buildings/energyplus/documentation.cfm
Engineering Reference http://apps1.eere.energy.gov/buildings/energyplus/pdfs/engineeringreference.pdf
3.6.3 EPRI’s Supermarket Simulation Tool (SST) Approximately 10 years ago, the Electric Power Research Institute (EPRI) funded the development of a detailed model capable of analyzing integrated building HVAC energy loads as well commercial refrigeration systems. This appears to be a very capable program that could perform the necessary analysis. A few challenges to using this program would be working out appropriate licensing agreements, and possibly the need to develop a mechanism for continued program maintenance and development. Further description of EPRI’s SST program is available here:
http://www.cdhenergy.com/presentations/IEA%20October%202000%20Supermarket%20Energy%20Use.pdf
41

HMG and CTG Southern California Edison Co.
Refrigerants and GHG
3.6.4 Other Programs There are many other refrigerant analysis programs on the market. These are generally very specialized focus and do not appear to provide integrated building HVAC/commercial refrigeration analysis that would likely be required for some type of GHG reduction program.
42

HMG and CTG Southern California Edison Co.
Refrigerants and GHG
4. REGULATORY AUTHORITIES & MANDATES
This chapter describes and discusses the existing authorities and mandates of the cognizant agencies which may be concerned with the issues and possible solutions discussed in this report.
4.1 Air Resources Board In September 2006, Governor Arnold Schwarzenegger signed the California Global Warming Solutions Act of 2006, also known as AB 32, into law. AB 32 commits the State to achieving the following:
2000 GHG emission levels by 2010 (which represents an approximately 11 percent reduction from “business-as-usual”)
1990 levels by 2020 (approximately 30% percent below “business-as-usual”)
To achieve these goals, AB 32 mandates that the California Air Resources Board (ARB) establish a quantified emissions cap, institute a schedule to meet the cap, implement regulations to reduce Statewide GHG emissions from stationary sources, and develop tracking, reporting, and enforcement mechanisms to ensure that reductions are achieved.
The California Air Resources Board recently released a Climate Change Proposed Scoping Plan required by AB 32.1 ARB described this discussion draft version of the Scoping Plan as a “framework for change.” The Proposed Scoping Plan proposes a “comprehensive set of actions designed to reduce overall carbon emissions in California, improve our environment, reduce our dependence on oil, diversify our energy sources, save energy, and enhance public health while creating new jobs and enhancing growth in California’s economy.”
The Proposed Scoping Plan indicates that “reducing greenhouse gas emissions to 1990 levels requires a relative reduction of approximately 30 percent from business-as-usual emission levels projected for 2020, or about 10 percent from today’s [absolute] levels”. The Proposed Scoping Plan defines “business-as-usual” (BAU) as emissions in the absence of GHG reduction measures (i.e., the 2020 BAU forecast does not take credit for reduction from AB 1493 GHG emissions reduction standards for vehicles, implementation of the Renewables Portfolio Standard, or reductions in emissions associated with the Low Carbon Fuel Standard).
The Scoping Plan calls for a “coordinated set of solutions” to address all major categories of GHG emissions.
Transportation emissions will be addressed through a combination of higher standards for vehicle fuel economy, implementation of the Low Carbon Fuel
1 Available at http://www.arb.ca.gov/cc/scopingplan/document/psp.pdf.
43

HMG and CTG Southern California Edison Co.
Refrigerants and GHG
Standard, and greater consideration to reducing trip length and generation through land use planning and transit-oriented development.1
Buildings, land use, and industrial operations will be encouraged and, sometimes, required to use energy more efficiently.
Utility energy supplies will change to include more renewable energy sources through implementation of the Renewables Portfolio Standard. This will be complemented with emphasis on local generation, including rooftop photovoltaics and solar hot water installations.
Direct and indirect greenhouse gas emissions from supermarket refrigeration are an important part of meeting AB 32’s emission reduction goals. It is important to recognize that consideration for greenhouse gas emissions does not necessarily recognize traditional distinctions associated with the design, conservation, and operation of facilities. AB 32 requires reductions in absolute greenhouse gas emissions by specific dates. Improvements in efficiency are useful only so far as they contribute to the ultimate goal of reducing absolute emissions. Moreover, the achievement of AB 32 goals is evaluated against an integrated measure of total state-wide emissions. This means that from the perspective of AB 32 implementation, there is no substantive difference between CO2e associated with refrigerants and those “indirectly” associated with the use of purchased electricity. Both actions contribute to greenhouse gas emissions and offer opportunities for emissions reductions.
The California Environmental Quality Act (CEQA) also provides a potentially important tool for understanding greenhouse gas emissions associated with proposed plans and projects and providing opportunities for tangible emissions reductions. The California Attorney General and the Office of Planning and Research have both recognized that climate change must be considered under CEQA. OPR has primary responsibility for the preparation of state guidance for the implementation of CEQA, and OPR has requested assistance in the development of GHG significance thresholds from ARB, CEC, and CPUC.
The need to consider GHG emissions under CEQA potentially creates new considerations when examining supermarket refrigeration. First, it is essential the projects going through planning and entitlement under CEQA have tools for systematic quantification of refrigeration-related emissions from proposed projects. This must include both direct emissions associated with high GWP refrigerants and energy use. The ability to quantify emissions is an essential part of public disclosure required under CEQA. The type of tools available for quantification must be appropriate for the coarse level of detail typically available for projects at this phase of planning and permitting. Second, CEQA
1 There has also been California legislative activity acknowledging the relationship between land use planning and
transportation sector GHG emissions. California Senate Bill 375 (passed Assembly on 8/25/2008; passed Senate on 8/30/2008; signed by the Governor on September 30, 2008) links regional planning for housing and transportation with the greenhouse gas reduction goals outlined in AB 32. Reductions in GHG emissions would be achieved by, for example, locating housing closer to jobs, retail, and transit. Under the bill, each Metropolitan Planning Organization would be required to adopt a sustainable community strategy to encourage compact development so that the region will meet a target, created by ARB, for reducing GHG emissions.
44

HMG and CTG Southern California Edison Co.
Refrigerants and GHG
lead agencies need a metric for evaluating the relative performance of projects involving refrigeration. Specifically, CEQA lead agencies need to understand what commitments may be required of a proposed project to ensure that it fully supports the implementation of AB 32. Lead agencies need guidance as to the combinations of facility design and operations, system design, and refrigerant specifications needed to reduce both absolute and relative emissions.
Local governments are also likely to require similar combinations of tools and technical guidance when evaluating existing buildings. ARB’s Proposed Scoping Plan for the implementation of AB 32 recognizes that local governments must contribute to reducing absolute emissions, and, in many areas, the majority of emissions reductions must come from renovations and retrofits to existing buildings. AB 32 creates the imperative to understand the performance of existing supermarket refrigeration systems and to develop processes for monitoring and, in some cases, direct action to address both older refrigerants and energy use. Research suggests that consideration of legacy refrigeration systems can lead to fundamentally different trade-offs between system design, refrigerant selection, and energy efficiency. This review primarily focuses on new construction, and full consideration of policy considerations for legacy systems is beyond the scope of this paper. However, this is an issue that is likely to require further consideration to assist with local action to support and comply with AB 32.
4.2 California Energy Commission The California Energy Commission (CEC) is the lead agency responsible for the development of both building and appliance efficiency standards. The CEC has traditionally regulated on the basis of source energy reductions and the life cycle cost effectiveness of energy saving measures, and in recent years has incorporated time of use and carbon emissions into its cost effectiveness calculations. It would be possible to expand this to include other greenhouse gasses within the regulatory goals of the CEC standards.
The CEC standards employ two basic regulatory approaches to energy efficiency, one for buildings and another for appliances.
4.2.1 Title 24 Building Energy Efficiency Standards Under the Title 24 Building Energy Efficiency Standards, the efficiency of buildings and their energy systems are regulated through the mechanism of building permits and inspections. The enforcement actions are actually carried out by local jurisdictions - cities or counties - which issue the building permits, check that plans conform to the standards, and inspect construction projects to verify proper installation. The CEC supports this process by developing computer simulation procedures, preparing compliance forms, specifying acceptance testing methods, publishing user manuals, providing training procedures for enforcement, and other efforts to make compliance with the building standards as universal and effective as possible. These methods are primarily addressed to new buildings and major renovations, although in recent years the CEC has been expanding its standards to cover some of the more routine remodeling
45

HMG and CTG Southern California Edison Co.
Refrigerants and GHG
activities (such as re-roofing of commercial buildings with cool roofs, or use of high efficiency units when residential windows are replaced).
The Title 24 standards comprise three basic types of requirements for building designers and contractors:
Mandatory measures specify requirements for equipment or materials that must be met whenever the applicable measures are used.
Prescriptive measures specify straightforward efficiency requirements for building systems, such as insulation levels or lighting power limits
Performance budgets specify the upper limit on whole building energy use, while allowing designers to make trade-offs among building components. For example a less efficient cooling system could be used if a more efficient lighting system was used to offset the reduced cooling efficiency
The CEC’s ability to regulate building systems is subject to the strengths and limitations of the building permit process, and is most effective for new buildings and major renovations. The effectiveness of the standards can be affected by the knowledge and resources of building department personnel in local jurisdictions; for the most part the jurisdictions do their best to enforce the Title 24 standards, but there is evidence that this is not true for all jurisdictions, or for the more complex areas of the efficiency standards. In recent years, the CEC has been working to strengthen enforcement through better education of building officials and inspectors, through simplification and standardization of standards requirements, and through the use of third-party experts to help enforce the more complex provisions of the standards. Acceptance testing by specially trained inspectors, for example, is used to ensure that building and systems controls are installed and operating correctly.
The Title 24 building standards could be used to regulate the design and controls of supermarket refrigeration systems, in much the same way that the standards have always regulated the design and control of HVAC (comfort conditioning) systems. To do so, however, would require the development of comparable levels of support for compliance, such as mandatory methods, prescriptive requirements, performance calculation methods, compliance forms, acceptance tests, etc. And the enforcement methods would have to be workable within the context of local building enforcement jurisdictions and personnel.
4.2.2 Title 20 Appliance Efficiency Standards Under the Title 20 Appliance Efficiency Standards, the CEC regulates the manufacture and/or sale of energy using equipment, such as air conditioners, furnaces, water heaters, lamps and ballasts, portable electric spas, certain electronic equipment, etc. Regulated equipment must be certified by their manufacturer as meeting California’s appliance efficiency standards. The CEC maintains publicly accessible electronic databases of certified equipment. Regulated equipment which does not meet the applicable Title 20 standards may not be offered for sale in California. The CEC enforces its Title 20 standards largely through voluntary cooperation from manufacturers, and provides spot checks, testing and information to help insure against cheating.
46

HMG and CTG Southern California Edison Co.
Refrigerants and GHG
There is a linkage between the Title 20 and the Title 24 standards, in that building designers may not specify covered equipment that does not comply with the Title 20 standards. Building inspectors help to enforce these requirements.
For many types of equipment, the California appliance standards are preempted by federal appliance efficiency standards. Nevertheless, the basic enforcement mechanisms apply. The primary constraint is that California may not adopt a stricter
The appliance standards, either federal or state, could be used to regulate the components of supermarket refrigeration systems, but not the overall system design. The effectiveness of the regulations will depend on industry compliance and on any associated enforcement efforts.
A more detailed discussion of current state and federal appliance standards for refrigeration systems is found below in section 5.1.1.
4.3 California Public Utilities Commission Brief discussion of CPUC requirements on utility program administrators, and on program cost effectiveness. Carbon is incorporated into the avoided costs used to calculate program cost effectiveness. Goals are in units of kWh, kW and therms, so there are no explicit GHG targets for programs to meet. Consequently, it is unclear whether program administrators are authorized to expend ratepayer dollars on efforts targeted solely at GHG, with little or no energy/demand/gas savings.
<expand & cite>
4.4 United States Environmental Protection Agency Refrigerant emissions are currently regulated by the US EPA under its ozone layer depletion (OLD) regulatory programs, which govern refrigerant sales, distribution, and reclamation, system leakage repair, and technician certification.
Under authorization by amendment to the Clean Air Act in 1990, the US EPA established OLD regulations aimed at reducing the use and emission of ozone depleting substances, including many types of refrigerants. Title 40, Part 82 of the Code of Federal Regulations (CFR) contains the detailed EPA OLD regulations. The sections on stationary refrigeration and air conditioning provide requirements related to supermarket and commercial refrigeration sectors. They address system service practices, refrigerant sales, reclamation, disposal, and leakage repair, as well as technician certification. The EPA OLD regulations are enforced by the EPA Office of Enforcement and Compliance Assurance.
Regarding refrigerant leakages, EPA’s reporting and recordkeeping requirements provide a mechanism to track refrigerant usage and leakage rate:
CFR Title 40, Part 82, Subpart F, § 82.166 (k) “Owners/operators of appliances normally containing 50 or more pounds of refrigerant must keep servicing records documenting the date and type of service, as well as the
47

HMG and CTG Southern California Edison Co.
Refrigerants and GHG
quantity of refrigerant added. The owner/operator must keep records of refrigerant purchased and added to such appliances in cases where owners add their own refrigerant. Such records should indicate the date(s) when refrigerant is added.”
CFR Title 40, Part 82, Subpart F, § 82.166 (o) “The owners or operators of appliances must maintain on-site and report to EPA at the address specified in §82.160 the following information where such reporting and recordkeeping is required and in the timelines specified in §82.156 (i)(7) and (i)(8), in accordance with §82.156 (i)(7) and (i)(8). This information must be relevant to the affected appliance and must include:
(1) The identification of the industrial process facility;
(2) The leak rate;
(3) The method used to determine the leak rate and full charge;
(4) The date a leak rate above the applicable allowable rate was discovered.
(5) The location of leaks(s) to the extent determined to date;
(6) Any repair work that has been completed thus far and the date that work was completed;
(7) A plan to complete the retrofit or retirement of the system;
(8) The reasons why more than one year is necessary to retrofit or retire the system;
(9) The date of notification to EPA; and
(10) An estimate of when retrofit or retirement work will be completed. If the estimated date of completion changes from the original estimate and results in extending the date of completion, the owner or operator must submit to EPA the new estimated date of completion and documentation of the reason for the change within 30 days of discovering the need for the change, and must retain a dated copy of this submission.”
The regulations further require owners or operators of appliances with more than 50 pounds of refrigerant to perform leakage repair, if the leakage rates are above certain thresholds. For commercial applications, the threshold is 35% in a 12 month period. The repair shall be performed or a retrofit/retirement plan shall be developed within 30 days of leakage discovery. This requirement would cap the maximum annual leakage rate to 35%, if it is well enforced. However, it is not clear how this threshold was established or if this threshold is too high.
It should be noted that the EPA OLD regulations only cover Class I and Class II ozone depleting substances, which include chlorofluorocarbons (CFC) and hydrochlorofluorocarbons (HCFC, such as R-11, R12, R-22, R-123), but not hydro fluorocarbons (HFC, such as R-134a and R-410a). However, EPA regulations do prohibit intentional release of any refrigerant and substitute into the atmosphere during maintenance, repair, service, and disposal of refrigeration equipment. As discussed in the previous sections, certain CFC substitutes have much higher GWP than CFCs. This scope limitation would definitely reduce the regulation effectiveness for dealing with new refrigerants.
48
HMG and CTG Southern California Edison Co.
Refrigerants and GHG
5. TITLE 24 AND 20 STANDARDS OPTIONS
5.1 Existing Regulatory Requirements and Their Effectiveness There are several federal and California state regulations pertaining to energy efficiency of supermarkets and commercial refrigeration facilities. California Title 24, Part 6 Building Energy Efficiency Standards prescribe detailed energy efficiency requirements for commercial buildings, including supermarket buildings. Several areas of building energy efficiency have traditionally been considered in improving Title 24 regulations. These include lighting, building envelope, space conditioning, and service hot water heating. Before the 2008 Title 24 standards, refrigeration efficiencies have only been addressed by the Title 20 Appliance Energy Efficiency Standards. The 2008 Title24 standards added an additional section to accommodate refrigerated warehouse standards. The following sections focus on existing regulations and ongoing standards development efforts for refrigeration systems. Federal regulations are discussed, along with their effects of preempting California energy efficiency regulations.
5.1.1 California Title 20 and Federal Energy Efficiency Standards for Walk-ins Walk-in refrigerators (coolers) and freezers, or walk-ins, are medium temperature and low temperature refrigerated spaces large enough for a person to enter. Walk-ins are a major part of a supermarket refrigeration systems for product storage and processing. They are also widely used in many other commercial applications. Most walk-ins have dedicated refrigeration systems, and so can be regulated as large appliances. However, supermarkets walk-ins are more typically served by central refrigeration systems, which also serve refrigerated display cases in the store. In these cases, the refrigerant compressors, condensers, and other system components are site-built and not directly covered by the Title 20 standards.
California adopted Title 20 energy efficiency standards for walk-ins in 2004 based on the code change proposal developed by the PG&E Codes and Standards Enhancement (CASE) study on walk-ins. The standards took effect for walk-ins manufactured on or after January 1, 2006. Title 20 Walk-ins included a list of prescriptive measures for following components:
Auto Door Closer
Thicker Envelope Insulation
High Efficiency Evaporative Fan and Condenser Fan Motors
Anti-sweat Heater Controls
Triple-pane Glass
Maxima for Door Rail, Glass, and Frame Heater Power Draws
49

HMG and CTG Southern California Edison Co.
Refrigerants and GHG
The Energy Independence and Security Act of 2007 (EISA 2007) took similar measures, with additional requirements on lighting efficacy and floor insulation for walk-in freezers, in the federal energy efficiency standards with an effective date of January 1, 2009 (Pub. Law 110-140, H.R. 6). EISA also set a schedule for DOE to develop performance based standards for these systems. In order to obtain opportunities to further improve Title 20 walk-ins standards without being preempted by the federal standards, California IOUs intervened with the EISA development. ACEEE negotiated with the Air-conditioning and Refrigeration Institute (ARI1), the trade association representing refrigeration equipment manufacturers, and obtained a special preemption term for California (HR6, Section 345). It allows that any walk-ins standards adopted before January 1, 2011 will not be preempted before the establishment of federal performance standards in 2018.
SCE is currently conducting a CASE study on walk-ins aimed at using this window opportunity to boost the existing Title 20 walk-in standards and to set a higher performance baseline in California that would influence future federal standards development. The SCE CASE study has identified a list of cost-effective measures that could be adopted as new prescriptive standards:
Infiltration reduction with strip curtains or spring hinged doors
High efficacy lighting or lighting controls (to match Federal standard)
Freezer floor insulation of at least R-28 (to match Federal standard)
Floating head pressure control
Compressors capable of operating at 70ºF condensing temperatures
Variable speed evaporator fans
Temperature termination defrost controls
Anti-sweat heater wattage limits and with humidity responsive controls
Both state and federal regulations focus on walk-ins with dedicated refrigeration systems. Inherently, they cannot adequately address issues and energy savings opportunities in central refrigeration systems installed in supermarkets. These regulations are limited to prescriptive measures for major components and subsystems of a stand-alone system. They provide some baseline conditions for future walk-ins performance standards. The following paragraphs provide a summary of the prescriptive requirements for Title 20 and federal standards.
Title 24, Part 6, of the California Code of Regulations for Refrigerated Warehouses
The latest CEC Title 24 rulemaking adopted building energy efficiency standards for refrigerated warehouses proposed by the PG&E. Title 24 defines a refrigerated warehouse as a building constructed for storage of products, where mechanical
1 ARI merged with Gas Appliances Manufacturers Association (GAMA) in 2007 and formed the Air-Conditioning,
Heating, and Refrigeration Institute (AHRI).
50

HMG and CTG Southern California Edison Co.
Refrigerants and GHG
refrigeration is used to maintain the space temperature at 55oF or less. Although they are independent from supermarkets, they have many similarities with supermarkets in refrigeration systems energy efficiency and refrigerant leakage issues. The development of refrigerated warehouse standards was closely related to that of walk-ins standards. PG&E started the CASE study in 2004 and its development directly influenced the EISA development on walk-ins.
There is not clear a boundary between the walk-ins and refrigerated warehouses. The Title 20 standards have no specific definitions to differentiate large walk-ins from small refrigerated warehouses. The 2008 Title 24 standards define the refrigerated warehouses as a building of more than 3000 sq ft. It also specified that equipment smaller than 3000 sq ft would be regulated by the Title 20 walk-ins standards. Therefore all supermarket walk-ins would fall into the Title 20 walk-ins category. California IOUs successfully negotiated to have the same cutoff line to be included in the EISA 2007, so that Title 24 refrigerated warehouses won’t be preempted.
The Title 24 refrigerated warehouse standards are also limited to prescriptive measures. The current Title 24 reference computer simulation method (DOE-2.1E) was not suitable for refrigerated warehouse analysis. When the PG&E CASE study was conducted, the CEC had not certified any modeling software that could be used for compliance enforcement. Therefore, no performance-based approach was developed.
Federal Energy Efficiency Standards Development on Display Cases
EPACT 2005 amended EPCA to require the DOE to develop energy efficiency standards for commercial refrigeration equipment by not later than January 1, 2009 (42 USC 6313(c)(4)(A)). This provision covers a broad range of commercial refrigeration equipment, including remote condensing commercial refrigerators, freezers, and refrigerator-freezers, all of which are widely used in supermarkets. DOE conducted the Notice of Proposed Rulemaking (NOPR) Public Meeting in September 2008 and scheduled to issue the Final Rule in December 2008. The new standards will be effective for equipment manufactured on or after January 1, 2012.
The proposed DOE standards will prescribe maximum daily energy consumption limits for different class of equipment, and therefore are performance based. DOE adopted ANSI/ARI Standard 1200–2006, Performance Rating of Commercial Refrigerated Display Merchandisers and Storage Cabinets, as the product rating standards. The ANSI/ARI Standard 1200–2006 uses ANSI/ASHRAE Standard 72-2005, Method of Testing Commercial Refrigerators and Freezers, as the underlying testing standard. For remote condensing systems, the compressor energy consumption is not required to be measured directly. Instead, ANSI/ARI standard provide a formula to estimate condenser energy consumption based on display merchandiser/storage cabinet load and default compressor efficiencies. Therefore, the DOE standard will have no regulatory effect on compressor efficiencies of supermarket central refrigeration systems.
It should be noted that SCE provided technical support to DOE’s open display case development. After attending the Advanced Notice of Proposed Rulemaking (ANOPR) Public Meeting in August 23, 2007, SCE submitted a comment letter requesting DOE to
51

HMG and CTG Southern California Edison Co.
Refrigerants and GHG
consider several energy efficiency measures, including the same energy standard for equipment with and without doors. It also requested for clarification that remote refrigeration equipment (compressors, condensers etc) not be covered and not be pre-empted from appropriate California building regulations. SEMPRA also submitted a comment letter to support SCE’s positions. DOE disagreed with many of the SCE comments including the one to request the same standards for equipment with and without doors, and didn’t response on the preemption issue.
Title 20 and Title 24 Enforcement
Title 20 is enforced by the CEC. The enforcement mechanisms include product marking, certified test data reporting, product inspection, and enforcement testing. Title 20 standards have specific product information marking requirements for many products under regulation (Section 1607). Manufacturers are required to send certified product test data to the CEC (Section 1606), which are organized into a database available for public access. Title 20 Section 1608 (d) requires the CEC to conduct periodic inspection of appliances sold in California and section 1608 (e) requires the CEC to conduct periodic appliance enforcement testing. Since there are no testing requirements for walk-ins and many of them are custom made, the effective enforcement approach is through inspection.
Title 24 standards are enforced by local building departments. For new construction projects and alteration/addition/repair projects that are affected by Title 24 standards, specific compliance documents need to be filed with local building departments to obtain building permits. For building designs using the Title 24 performance method, permit applicants are also required to submit corresponding compliance software input files. Local building officers are responsible for plan check and construction inspection to validate Title 24 compliance. The level of final compliance strongly depends on enforcement efforts by local building departments.
5.2 Potential Title 24/20 Standards Approaches to Problems
5.2.1 Title 24/20 Standards Development Considerations In developing potential regulatory strategies for improving supermarket energy efficiency and for reducing refrigerant leakage induced GHG emissions, several aspects of the problem need to be considered:
Title 20 appliance standards vs. Title 24 building standards
California regulations vs. federal regulations (especially Title 20 preemption)
Mandatory measures, performance vs. prescriptive methods
Integrated vs. disaggregated energy and GHG metrics
Whole building energy systems vs. refrigeration systems
Mandatory Regulations vs. voluntary utility programs
52

HMG and CTG Southern California Edison Co.
Refrigerants and GHG
Brief discussion of each above aspects is provided before final strategy suggestions are presented.
Title 20 appliance standards vs. Title 24 building standards
A typical supermarket has a centralized refrigeration system with remote condensers that provide liquid refrigerant to walk-ins and display cases. Walk-ins are covered by both Title 20 and EISA as appliances. Display cases will be regulated soon by new DOE standards for commercial refrigeration equipment. Walk-ins for supermarket applications will be considered as appliance under the definition of EISA. Therefore, Title 20 will still be the regulatory choice for walk-ins.
Due to federal preemption, the CEC will likely not consider any Title 20 measures for display cases, at least in the short term. Title 24 could provide an approach regulating supermarket refrigeration systems without been preempted by federal standards. Detailed discussion of this option will be provided in the next section. Title 24 is better suited for integrated energy/GHG regulation and a whole building regulation approach.
Therefore, both Title 20 and Title 24 development should be considered.
California regulations vs. federal regulations
EISA gives California a window opportunity to improve its Title 20 walk-in standards by 2011. California needs to fully take advantage this opportunity to maximize energy savings and to set reasonably high standards that future federal standards cannot easily override.
The new federal standards for commercial refrigeration equipment will be released soon. California will then lose the opportunity to set higher standards for display cases. The new federal performance limitations will include energy consumption by remote condensers, which, according the adopted ANSI/ARI test standards, will be estimated values using assumed compressor efficiencies. The scope for commercial refrigeration equipment, as defined in EPCA, didn’t include remote condensers. The inclusion of condenser power consumption is purely due to the reason ANSI/ARI standards, not the statuary authorization. The method used by the ANSI/ARI standard 1200-2006 would not reflect real power consumption and is not a solid method for system performance evaluation.
A performance standard for walk-ins could include performance of remote compressors. New Title 20 walk-in standards should consider including the performance of remote compressor systems.
A comprehensive Title 24 supermarket refrigeration system standard is another way to regulate overall refrigeration system performance. Since there are already standards for walk-ins and display cases, such a standard would be focused on the compressor system, its components and its system performance characteristics. This approach could also allow us to have integral energy efficiency and GHG emission regulation.
53
HMG and CTG Southern California Edison Co.
Refrigerants and GHG
Mandatory measures, performance vs. prescriptive methods
Mandatory measures for basic system features, such as refrigerant line accessibility or necessary system controls, would be a logical first step toward better supermarket refrigeration system design. The selection and specification of mandatory measures would be done in consultation with the supermarket refrigeration industry.
Performance standards for overall system efficiency are preferred to simple prescriptive requirements for several reasons:
Regulation on energy efficiency and GHG emission, including refrigerant leakage can be better integrated through system modeling, with appropriate GHG metrics such as TEWI, LCCP, etc. (discussed above in section 2.3).
Total Energy consumption and GHG emission budgets can be better controlled as the baseline performance will be established. Performance budgets can then be tightened over time.
A performance approach could effectively cover a very broad range of system configurations, reducing loopholes and improving industry standards for systems design
It provides more flexible compliance options, therefore, is more likely to be followed by industry practitioners
The challenge for a performance approach is that it is difficult to establish a performance metric, which requires baseline data representing the variety applications found in the industry. It requires either a system test method or a simulation tool as a compliance test. Given the size and complexity of supermarket systems, an overall system test method is probably out of the question. Development of suitably capable simulation tools will enable performance approach implementation and will facilitate the identification cost-effective prescriptive measures. It can also help the industry in future technology improvements. However, it could take a lot of time and resources to develop a simulation tool (building on the existing tools discussed above in section 3.6) that can meet the regulatory requirements, either at just the refrigeration system level or at the whole building level.
Given the urgency for GHG reduction, the short timeline to meet AB 32, the limited window opportunity to avoid federal preemption, we need to consider prescriptive measures that could be adopted more quickly to realize energy and GHG reduction as soon as possible.
A prescriptive approach would provide distinct requirements for system configuration and control practices. For energy efficiency of supermarket refrigeration systems, there have been standards development efforts, e.g. IOU walk-in and refrigerated, CASE studies, aimed at specific prescriptive measures. These measures also represent the largest energy savings opportunities. Many of those measures are close to being fully evaluated and proposed for code changes. In the short term, we could focus on these measures.
54

HMG and CTG Southern California Edison Co.
Refrigerants and GHG
For refrigerant leakage regulation, a leakage test protocol could be developed for key equipment, e.g. compressors or refrigerant line sets, to set leakage performance standards at the equipment or system level. This would cover new installation as well as equipment replacement. Many leaks are apparently caused by imperfect field installation practices which could be dealt with through better piping system designs and field leakage tests. Prescriptive measures could be developed to mandate good piping design practices. A site leakage acceptance test could be developed and implemented to ensure that real leakage performance met expectations. These kinds of measures would all be based on industry best practices, and would provide the foundation for a performance standard, which would take longer to properly develop.
Integrated vs. disaggregated energy and GHG metrics
Energy efficiency improvements will directly contribute to GHG emission reductions. Adding the cost of GHG emissions into the current Title 24/20 cost effectiveness analysis method will increased the incentive for more stringent energy efficiency measures, while also encouraging better refrigerant leakage controls. The link between energy efficiency and refrigerant leakage is not easy to establish in practice (notwithstanding the what-if analysis discussed above in section 3.5). If refrigerant charge and leakage have significant impacts on system energy efficiency, we could easily argue for an integrated metric to address both issues under Title24/20. If the, however, effect is primarily a GHG issue, then the CEC would have to adopt new metrics and performance levels for the refrigerants and leakage problems.
In meeting goals set by the AB32, it could be more effective for California to use the Title 24/20 framework, along with its enforcement system, to regulate GHG emissions from buildings and appliances, including supermarket refrigerant leakage. There might be issues related to statutory authority for Title 24/20 to regulate GHG emissions. However, setting up a separate set of regulations for GHG emission could potentially face other statuary challenges. We leave these questions to the regulatory authorities to decide
For either an integrated or a disaggregated approach, we will need carbon cost information to justify proposed measures. Either approach cannot avoid the potentially controversial issue of carbon price forecasting.
Title 24 standards provide the tradeoff mechanism to encourage measures that are not ready as mandate requirements. This mechanism might be used to encourage good practices in controlling refrigerant leakage, such as following preferred piping design practices, meeting leakage test requirements, using equipment with low leakage. Energy budget credits could be provided as encouragement. Exact tradeoff methods can be determined using the evaluation methods discussed in section 3.6 to ensure positive overall system benefits.
In terms of compliance enforcement, individual equipment leakage performance requirements may be enforced through Title 20 appliance regulations. Piping system design and field acceptance test requirements will be potentially implemented in Title 24. Therefore, they could be enforced through Title the 24 enforcement mechanisms.
55
HMG and CTG Southern California Edison Co.
Refrigerants and GHG
Whole building energy systems vs. refrigeration systems
Our previous discussion has been focused on only the refrigeration system, which is the key issue for this white paper and is a complicated subject by itself. There exist additional opportunities for energy savings from overall building design and operation. There is no additional regulatory barrier for implementing whole building performance regulation. The difficulty lies more on the technical side, as we need better understanding of the interactions between refrigeration systems and other building systems, especially the HVAC system.
5.2.2 Title 24/20 Standards Options IOUs have spent extensive resources in helping Title 24/20 development. They have ongoing energy efficiency programs, including C&S programs, targeting commercial refrigeration systems. Efforts by IOUs and the CEC should coordinate in developing the CASE study scope and rulemaking schedule, to address the comprehensive supermarket standards development. This would include careful coordination in:
Enforcement approaches - building departments, trade practices, licensing
Potential mandatory measures - leak detection devices, acceptance testing, controls, etc.
Prescriptive approaches - component requirements for different system configurations
Performance approaches - system performance metrics, compliance/analysis methods
Refrigeration system stand-alone regulations - performance criteria for various system types; enhanced modeling capability
5.3 Future Research Needs The following are suggestions for additional research that is needed to fully address the issues discussed in this report.
5.3.1 Further Quantification of Annual Refrigerant Loss Rates The single largest source of life-cycle GHG emissions is refrigerant leakage. Further research is needed to refine actual loss rates in California, identify common failure modes, and develop /test strategies that will minimize refrigerant leakage.
5.3.2 Further Quantification of End-of-Life Refrigerant Losses Adequate data for end-of-life refrigerant loss rates for commercial refrigeration equipment was not identified in the literature. Additional research is required to identify this. End-of-life loss rates for HVAC refrigeration equipment is reported to be on the
56

HMG and CTG Southern California Edison Co.
Refrigerants and GHG
57
order of 2% to 10% of the total charge1. It is conceivable that loss rates for commercial refrigeration equipment may be significantly higher than this due to the complexity of commercial refrigeration equipment and the extensive amount of the refrigerant piping. Shorter equipment life (15-20 year life for commercial refrigeration equipment verses 20 – 25 year lifetimes for HVAC equipment) and significantly larger refrigeration charges could make end-of-life refrigerant losses a significant part of the total GHG emissions.
5.3.3 Additional Refrigeration Systems Modeling Additional refrigeration system modeling using California’s climate zone data is required. This will be necessary to further refine the estimated GHG and energy savings that can be achieved through advanced system design and energy efficiency measures.
5.3.4 Enhance Integrated HVAC / Refrigeration Analysis Tools A review of the current building energy simulation software shows that while the two major energy modeling program eQuest and EnegyPlus) can model the energy use and HVAC interactions of commercial refrigeration systems, both need to be expanded to include an analysis of refrigerant leakage and lifecycle greenhouse gas emissions (e.g., TEWI). It is important that this design guidance and feedback be incorporated into the modeling tools.
Furthermore, although eQuest can currently perform some integrated HVAC/refrigeration system modeling in the “refrigeration” version of the program, extensive changes have been made to the underlying engine and there is still additional programming required to fully implement all of the building HVAC capabilities.
5.4 Potential Utility Program(s) Roles Establish GHG reduction goals and measurement mechanisms with CPUC
Sponsor CASE initiative(s) for new refrigeration standards
Conduct training, provide technical assistance
<expand & cite>
1 Rubenstein, Didion, and Dozier, The Treatment by LEED® of the Environmental Impact of HVAC Refrigerants