regional alternative education programs board of education 2005 annual report regional alternative...
TRANSCRIPT

VIRGINIA BOARD OF EDUCATION
2005 Annual Report
REGIONAL ALTERNATIVE
EDUCATION PROGRAMS
PRESENTED TO
GOVERNOR MARK R. WARNER
AND THE VIRGINIA GENERAL ASSEMBLY
October 26, 2005

Jo LYNNE DEMARY, Ed.D.Superintendent of Public Instruction
Office: (804) 225-2023Fax: (804) 371-2099November 4, 2005
The Honorable Mark R. WarnerGovernor of VirginiaPatrick Henry Building, 3rd FloorRichmond, Virginia 23219
Members of the General Assembly of VirginiaState Capitol BuildingRichmond, Virginia 23219
Dear Governor Warner and Members of the General Assembly:
Pursuant to Section 22.1-209.1 :2 of the Code of Virginia, I am pleased to submitthe 2005 Annual Report on Regional Alternative Education Programs. The report wasapproved at the October 26,2005, meeting of the Board of Education.
Section 22.1-209.1:2 of the Code requires that a report be provided annually bythe Board of Education to the Governor and the General Assembly on the effectiveness ofthe Regional Alternative Education Programs.
If you have questions or require additional infonnation, please do not hesitate tocontact Ms. Diane Jay, education specialist, at (804) 225-2905 orDiane.J av(Q),doe. vir2:inia.2:ov.
Sincerely,
~ o(~~)t.o')t."..J k;;;~/Jo Lynne DeMary .:::.., rJ
JLD/djEnclosurecc: Mr. Thomas M. Jackson, Jr., President, Virginia Board of Education
DEPARTMENT OF EDUCATIONP.o. Box 2120
Richmond, Virginia 23218-2120

VIRGINIA BOARD OF EDUCATION
PREFACE
Section 22.1-209.1:2 of the Code of Virginia requires that a report be provided annually by the Board of Education to the Governor and the General Assembly on the effectiveness of the Regional Alternative Education Programs. The primary objectives of this evaluation are as follows:
1. Provide a general overview of the programs, student populations, staff, program resources and support, and parental and community support.
2. Review the program administrators’ perceptions of the adequacy of the programs’ resources and policies.
3. Evaluate the performance of the programs and students.
The staff member assigned to the preparation of the report was Diane L. Jay, specialist, Office of Program Administration and Accountability, Division of Instruction, Virginia Department of Education, P. O. Box 2120, Richmond, Virginia 23218-2120. Questions concerning the report should be directed to Ms. Jay at (804) 225-2905 or by e-mail at [email protected].
Regional Alternative Education Programs i

VIRGINIA BOARD OF EDUCATION
TABLE OF CONTENTS
SUMMARY REPORT Page
Executive Summary iii Chapter One 1
Purpose 1 Objectives And Scope of Evaluation 1 Data Sources 2
Chapter Two 3 Background and Summary Information 3 Chapter Three 4 Regional Alternative Education Program Overview 4
A. Characteristics of Programs and Student Population 4 B. Staff 10 C. Program Resources and Support 11 D. Parental and Community Involvement 12
Chapter Four 14 Perceived Adequacy of Program Attributes and Functions 14 Chapter Five 16
Program and Student Performance 16 A. Considerations for Evaluating Regional Programs and Student Performance 16 B. Measures of Achievement 16 C. Summary 19
ATTACHMENTS Attachment A1: Listing of Programs 20 Attachment A2: Profile of Programs 23 Attachment A3: Profile of Student Status End of School Year 24
Regional Alternative Education Programs ii

VIRGINIA BOARD OF EDUCATION
EXECUTIVE SUMMARY
Research Dimensions, Inc., conducted the evaluation of Virginia’s 29 regional alternative education programs. These programs were established by the General Assembly in 1993-1994 with the intent of involving two or more school divisions working in collaboration to establish options for students who have a pending violation of school board policy, have been expelled or suspended on a long-term basis, or are returning from juvenile correctional centers. Section 22.1-209.1:2 of the Code of Virginia requires that a report be provided annually by the Board of Education to the Governor and the General Assembly on the effectiveness of the regional alternative education programs. These regional alternative education programs are designed to meet the specific individual needs of students assigned to the programs. While there is some variation in programs, the legislation outlines the following components:
an intensive, accelerated instructional program with rigorous standards for academic achievement and student behavior;
a low pupil-teacher ratio to promote a high level of interaction between the student and teacher;
a plan for transitioning the enrolled students into the relevant school division’s regular program;
a current program of staff development and training; a procedure for obtaining the participation and support from parents as well as
community outreach to build school, business, and community partnerships; and measurable goals and objectives and an evaluation component to determine the
program’s effectiveness.
The number of students enrolled increased from 217 students in four regional programs in 1993-1994 to 2,297 students in 29 regional programs in the 1996-1997 school year. The number of students served has subsequently increased to slightly more than 3,900 during 2004-2005, a 70 percent increase in students served within the same number of programs. The state funding level has increased 32.5 percent during this same time period.
Key Observations and Findings
General Conclusions:
The regional alternative education programs state they are achieving their individual “program purposes” of correcting dysfunctional and dangerous behavior, building self-esteem, reducing dropout rates, identifying career interests and securing employment, graduating students, and having students gain admission to higher education.
The programs have succeeded in helping students remain in school, graduate, or receive General Education Development certificates through the Individual Student Achievement Education Plan (ISAEP).
Regional Alternative Education Programs iii
VIRGINIA BOARD OF EDUCATION
The return on the public’s investment for regional alternative education programs is favorable.
Conclusions Related to Specific Program Attributes, Services, and Policies:
Approximately 80 percent of program administrators reported academic improvement in their responses regarding perceived changes in student academic performance.
The program administrators reported decreased discipline, crime, and violence incidences for students while in the program.
Program administrators reported being satisfied about most key aspects of their programs such as academics, student services, assessment services, discipline policies, staff development, availability and use of technology, and parental involvement.
Staffing is a critical function of the regional alternative education programs. Eighty two (82) percent of the administrators state the number of teachers is adequate. Several administrators indicated a need for staffing the programs with full-time teachers instead of part-time teachers. Additionally, administrators indicated a need for more teachers in specific content areas not currently available to these programs. Approximately 61 percent of these programs reported that the number of counselors available to their programs is adequate and about 56 percent report that the number of school psychologists available to their programs is adequate.
The dropout rate for these students is 7 percent. The expulsion or dismissal rate is 6.7 percent.
Key Performance Results:
Approximately two-thirds of the eligible regional alternative students served during the 2004-2005 school year graduated or received GED certificates (through ISAEP).
Of the remaining students who were not eligible to graduate in the 2004-2005 school year, approximately 70 percent remained in school at the beginning of the 2005-2006 school year.
Regional Alternative Education Programs iv

VIRGINIA BOARD OF EDUCATION
CHAPTER ONE
Purpose
Virginia’s regional alternative education programs are established to provide options for students who no longer have access to traditional school programs because they were suspended for violations of school board policy. Suspensions leading to assignment to these programs include violations related to weapons, drugs or alcohol, intentional injury, chronic disruptive behavior, theft, verbal threats, malicious mischief, chronic truancy, vandalism, and other serious offenses. These programs also can accommodate students returning from juvenile correctional centers or those who are otherwise assigned by the school divisions.
This report provides the results of an external evaluation of these programs conducted for the Virginia Department of Education (VDOE) by Research Dimensions, Inc. The evaluation examined the 29 programs in operation during the 2004-2005 school year. A total of 114 school divisions worked in collaboration to form these 29 programs; some of the divisions have multiple subprograms and sites. Attachment A1 provides a complete listing of the programs and participating school divisions.
Objectives and Scope of Evaluation
Section 22.1-209.1:2 of the Code of Virginia requires that a report be provided annually by the Board of Education to the Governor and the General Assembly on the effectiveness of the regional alternative education programs. The primary objectives of this evaluation are as follows:
1. Provide a general overview of the programs, student populations, staff, program resources and support, and parental and community support.
2. Review adequacy issues related to program resources and policies. 3. Evaluate the performance of the programs and students.
The goals of the 29 regional alternative education programs included in this evaluation are similar in that they are all designed to provide alternative and experiential learning opportunities for their students. They serve students who have been assigned to the school by local boards of education because: (1) the traditional school systems are not equipped to address their needs; and (2) the alternative education programs can provide a wide variety of student services and educational approaches that are tailored to these needs. While the general goals among programs are similar, there are also significant differences such as:
• grade levels served; • size of the student bodies; • characteristics of the students enrolled; • characteristics of the student enrollment expectations (e.g., very short term versus
long-term); • educational approaches and priorities; and • program resources available.
Regional Alternative Education Programs 1
VIRGINIA BOARD OF EDUCATION
Data Sources
The information, observations, and findings in this summary report are primarily based on the following sources:
Information collected by the Virginia Department of Education through an annual Information Data Collection Instrument and supplemental information provided with these reports. In June 2005, the reports were submitted by each of the 29 programs to the department for the 2004-2005 school year.
Follow-up communications with program administrators and personnel. Relevant information included in previous regional alternative education program
evaluations published by the Virginia Department of Education.
Regional Alternative Education Programs 2
VIRGINIA BOARD OF EDUCATION
CHAPTER TWO
Background and Summary Information
In 1993, the General Assembly directed the Board of Education to establish and implement four regional pilot projects to provide an educational alternative for certain students in violation of school board policy. The General Assembly subsequently provided state funding, augmented for several years by federal funds, to make regional alternative education programs available on a statewide basis. A Virginia Department of Education formula based on staffing patterns and the composite index of local ability to pay determines state funding.
No local matching funding is required; however, local and federal monies are sometimes used to augment these programs by providing in-kind support for such items as special services (e.g., social workers, mental health workers, and psychologists), instructional materials, additional staff, pupil transportation, and facilities.
Alternative education programs are designed to meet the specific individual needs of students assigned to the programs. While there is some variation in programs, the legislation outlines the following components:
an intensive, accelerated instructional program with rigorous standards for academic achievement and student behavior;
a low pupil-teacher ratio to promote a high level of interaction between the student and teacher;
a plan for transitioning the enrolled students into the relevant school division’s regular program;
a current program of staff development and training; a procedure for obtaining the participation and support from parents as well as
community outreach to build school, business, and community partnerships; and measurable goals and objectives and an evaluation component to determine the
program’s effectiveness. The delivery of services includes traditional and non-traditional forms of classroom instruction, distance learning, and other technology-based educational approaches. Delivery of services also includes day, after school, and evening programs. Alternative education centers have flexibility with regard to their organizational structure, schedule, curriculum, programs, and disciplinary policies. While the centers may differ in method of delivery, the services they provide typically fall into the following categories:
educational (core subject instruction, vocational, remediation, tutoring); counseling (individual, group, family); social skills training; career counseling (transitioning to the world of work, job shadowing, mentoring,
work/study agreements); technology-related education (direct instruction, Internet research, keyboarding); conflict resolution and mediation; and drug prevention education.
Regional Alternative Education Programs 3
VIRGINIA BOARD OF EDUCATION
CHAPTER THREE
Regional Alternative Education Program Overview This chapter provides an overview of the regional alternative education program in terms of program and student trends, program purposes, organization, innovative practices, sources of students and reasons for student enrollment, student selection processes, academic offerings, student services, student assessments, and general and discipline policies.
A. Characteristics of Programs and Student Population
Statistical Overview – Of the 29 regional programs, all except one serve students in grades 9-12. The remaining program serves only middle school students in grades 6-8. Almost 90 percent of the programs also serve grades seven and eight; slightly over 60 percent serve sixth grade students. Three programs serve students in grades K-5. Additionally, slightly over 65 percent of the programs report serving General Educational Development (GED) certificate students.
The programs report having 2,455 assigned slots and serving more than 3,900 students during the 2004-2005 school year. Since in some programs students are assigned for short periods of time (e.g., a week in some cases), they are able to serve multiple students per slot. Attachment A2 provides a more detailed statistical overview of the 29 programs.
Over the first four years of Virginia’s regional alternative education program, the number of programs grew rapidly from the four pilot sites in 1993-1994 to 29 programs by 1996-1997. Since that time, the number of programs has remained constant. During this same period, state funding increased from the initial General Assembly appropriation of $1.2 million for 1993-1994 to a total state funding level of almost $5.5 million for 2004-2005. Programs are permitted to receive additional funding and in-kind support from other sources although no local match is required.
The number of students enrolled increased from 217 students in four regional programs in 1993-1994 to 3,900 students in 29 regional programs in 2004-2005. The state funding level has increased 32.5 percent during this same time period.
Table 1 summarizes trends for the number of regional alternative education programs in Virginia, state funding levels for these programs, and numbers of students served since the 1993-1994 school year.
Regional Alternative Education Programs 4

VIRGINIA BOARD OF EDUCATION
Table 1. Trends in Regional Alternative Education Programs
School Year Number Of Programs [1]
State Funding [2] Number of Students Served
1993-1994 4 $1,200,000 217
1994-1995 [3] 13 $1,200,000 849
1995-1996 [3] 19 $1,200,000 1,550
1996-1997 29 $4,142,000 2,297
1997-1998 29 $3,716,652 2,350
1998-1999 29 $4,431,089 3,255
1999-2000 29 $4,484,123 3,494
2000-2001 30 $5,766,626 3,347
2001-2002 30 $5,386,590 3,895
2002-2003 30 $5,386,590 3,509
2003-2004 29 $5,210,891 3,534
2004-2005 29 $5,486,348 3,903
Note [1]: Some data refer to sites and some refer to programs. Note [2]: State funding will be $5,463,139 for 2005-2006 and $5,563,652 for 2006-2007. Note [3]: Federal funds were used to supplement state funds to support expanding the program during the
1994-1995 and 1995-1996 school years.
Program Purpose – The regional alternative education programs are designed to meet the specific individual needs of students assigned to the programs. These needs dictate a somewhat different set of “program purposes,” or objectives than would be encountered in the traditional school system. Consequently, as part of the 2004-2005 data collection effort for this evaluation, administrators were asked to identify the objectives most appropriate for the various sites operating within their programs. The “program purposes” reported by all programs to be consistent with their program are:
reducing the dropout rate; building self-esteem and responsibility; returning students to the sending high school to graduate; and correcting dysfunctional or dangerous behavior.
An expanded list of program purposes, as reported by the responding program administrators, is portrayed in Figure 1.
Regional Alternative Education Programs 5

VIRGINIA BOARD OF EDUCATION
Figure 1. Purpose of Program
0 10 20 30 40 50 60 70 80 90 100
Earn a GED Certif icate through an ISAEP
Obtain a diploma from the sending school in abstentia
Identify career interests
Gain admission to community or four-year college/university
Correct dysfunctional or dangerous behavior
Return to the sending high school to graduate
Build self-esteem and responsibility
Reduce dropout rate
Percentage of Programs Reporting
Program Organization and Innovative Practices – The programs included in this evaluation reflect a wide variety of educational and operational models and processes. Most programs report operating between 9 and 10 months a year, but the range is 6 to 11 months. Almost 40 percent of the programs offer evening, as well as daytime classes. Classes are more frequently organized by subject or course rather than by grade level. Over 70 percent of the programs report that at least some students worked independently on computer-based curricula.
Program administrators were asked to identify innovative practices that they deem to have been most effective in their program. While the 92 responses vary and address initiatives directed towards both students and faculty, the following student-related innovative practices provide insight as to how these programs are serving the needs of their student populations:
Courses operated by the program staff and external organizations that address character, self-esteem building, cooperation, financial/credit literacy, planning, and other critical life skills;
Field trips to correctional facilities and visits with prisoners in these facilities to better understand the implications of poor decisions and inappropriate behavior;
Education-related technology in the classroom and external to the program permitting expanded student access to educational curricula as well as to material tailored to the students’ educational needs and otherwise not available to them;
Regional Alternative Education Programs 6

VIRGINIA BOARD OF EDUCATION
Studying one subject at a time permitting students to better focus on the substance
and to achieve earlier tangible evidence of success; One-on-one and small group teaching and tutoring; Partnerships with local agencies and institutions of higher education to permit
psychological/mental health and other services otherwise not available to the students; and
Student incentive programs tailored toward behavioral modification.
Reasons for Student Enrollment and Student Selection Process – Students are typically assigned to regional alternative education programs because they have received long-term suspensions, are returning from juvenile correctional centers, or are otherwise deemed by the school divisions to be best served by these programs. Consequently, these programs are structured to better address the special needs of these students who are often older than the students at the same grade level in the traditional school system and whose histories are typically defined by academic failure and behavioral problems. Table 2 provides additional insight as to the primary reasons leading to student enrollments for the 2004-2005 school year.
Table 2. Reasons for Enrollment in Regional Alternative Education Programs 2004-2005
Source of Students Served Total [1] Percent [2]
Suspensions for violation of School Board Policy [3] 3,432 87.9
Weapons 201 5.6
Drugs or alcohol 524 14.7
Intentional Injury 331 9.3
Chronic Disruptive Behavior 831 23.3
Theft 44 1.2
Combination of above 280 7.8
Other [4] 1,221 34.2
Released from youth correctional centers 141 3.9
Total Suspensions and Released from Youth Correctional Centers 3,573 100
Note [1]: All but one program responded to these questions. The total responses for these questions add to about 92 percent of all students reported to have been served.
Note [2]: Percentage of 3,573 or the total students reported in response to these questions. Note [3]: Included pending violations. Note [4]: Verbal threats, malicious mischief, bomb threats, destruction of property, chronic truancy,
vandalism, and other serious offenses.
There is no standardized student selection process. Like the students assigned to these programs, the student selection process including guidelines and criteria for admittance and denial of admission varies from program to program.
Regional Alternative Education Programs 7

VIRGINIA BOARD OF EDUCATION
Most of the programs report that students were assigned to them “as a last chance option.” Almost all of the programs report that parents and/or students are required to participate in an interview prior to an admission decision. Most also indicate that they have the option to deny admission and that students have to sign a contract (e.g., commit to the program) before admission. Figure 2 illustrates the attributes of the student selection process.
Figure 2. Attributes of the Student Selection Process
0 10 20 30 40 50 60 70 80 90 100
Psychological assessments are done on students prior toselection
Students and parent(s) must sign a contract beforeadmission
Students can be denied admission to alternative program
Students are placed or assigned to alternative program as alast chance option
Parents must participate in an interview prior to selection
Students must participate in an interview prior to admission
Percentage of Programs Reporting
Academic Offerings and Student Services – An intense, accelerated instructional program with rigorous standards for academic achievement and student behavior is a legislative requirement of the regional alternative education programs. The range of students served (e.g., K-12 grade levels, a wide variety of behavioral issues, a wide range of cognitive capabilities) and academic approaches used produce a wide spectrum of courses offered, academic initiatives, and student services. However, at a general level, there are many core academic offerings and student services common to these regional alternative education programs.
All 28 programs that serve high school students offer standard diploma courses. About 75 percent of these programs offer GED preparatory courses, slightly more than half offer vocational or technical course work, and slightly less than half offer independent study and work study components. Several programs indicated the need to expand the following:
content delivery capacity for academic offerings (e.g., in-school teachers as well as computer- and Internet-based curricula);
tutoring support for students; placement support for students; and content delivery and monitoring capacity for vocational/technical initiatives.
Regional Alternative Education Programs 8
VIRGINIA BOARD OF EDUCATION
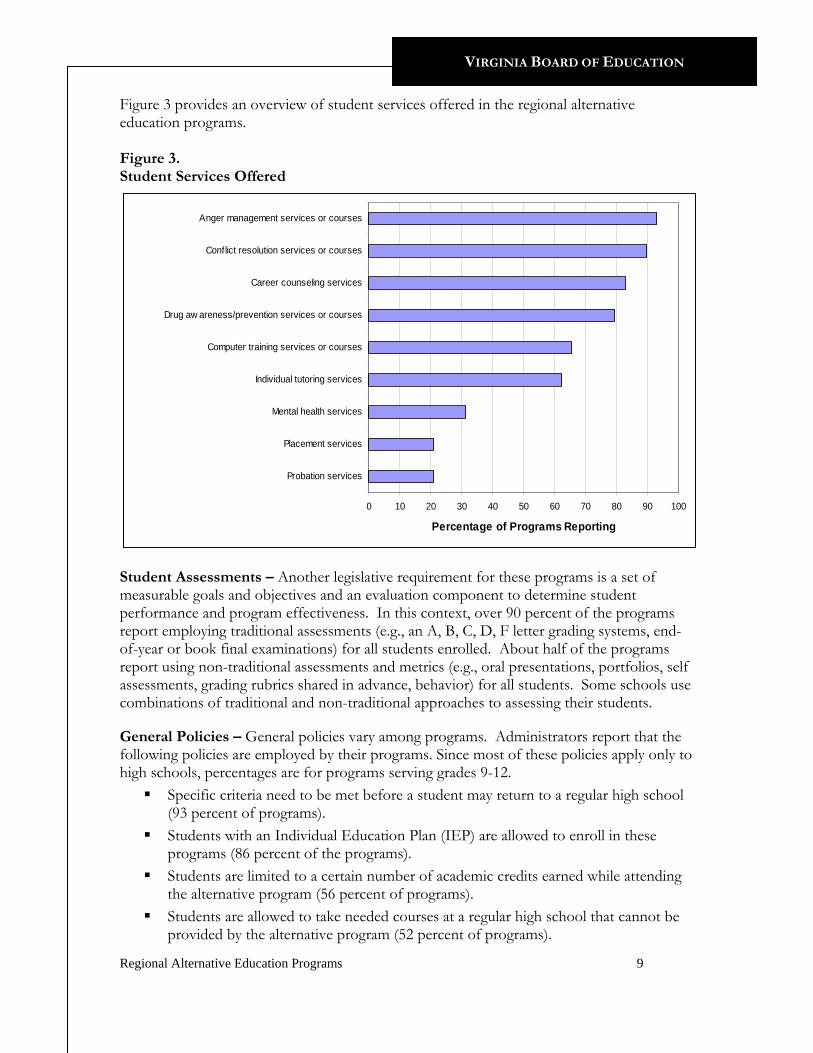
Figure 3 provides an overview of student services offered in the regional alternative education programs. Figure 3. Student Services Offered
0 10 20 30 40 50 60 70 80 90 100
Probation services
Placement services
Mental health services
Individual tutoring services
Computer training services or courses
Drug aw areness/prevention services or courses
Career counseling services
Conflict resolution services or courses
Anger management services or courses
Percentage of Programs Reporting
Student Assessments – Another legislative requirement for these programs is a set of measurable goals and objectives and an evaluation component to determine student performance and program effectiveness. In this context, over 90 percent of the programs report employing traditional assessments (e.g., an A, B, C, D, F letter grading systems, end-of-year or book final examinations) for all students enrolled. About half of the programs report using non-traditional assessments and metrics (e.g., oral presentations, portfolios, self assessments, grading rubrics shared in advance, behavior) for all students. Some schools use combinations of traditional and non-traditional approaches to assessing their students.
General Policies – General policies vary among programs. Administrators report that the following policies are employed by their programs. Since most of these policies apply only to high schools, percentages are for programs serving grades 9-12.
Specific criteria need to be met before a student may return to a regular high school (93 percent of programs).
Students with an Individual Education Plan (IEP) are allowed to enroll in these programs (86 percent of the programs).
Students are limited to a certain number of academic credits earned while attending the alternative program (56 percent of programs).
Students are allowed to take needed courses at a regular high school that cannot be provided by the alternative program (52 percent of programs).
Regional Alternative Education Programs 9

VIRGINIA BOARD OF EDUCATION
Students are not required to return to the high school from which they were suspended or expelled (46 percent of programs).
Students are required to return to their sending high schools (43 percent of programs).
Students are required to return to their sending high school in order to graduate with a standard diploma (33 percent of programs).
Discipline Policies – Discipline policies vary among programs, but several of these policies are common to most programs. (Percentages shown reflect all 29 programs.) These include:
Students are subject to all of the discipline policies and rules of the sending school (90 percent of programs).
The alternative program also has its own discipline system (83 percent of programs).
Behavioral contracts between students and teachers are used in the program (79 percent of programs).
B. Staff
Program Staffing – Administrators of the 29 programs reported a total of 286 teachers (in terms of full time equivalents), 67 counselors, and 49 school psychologists. The program administrators’ perceived adequacy of these numbers of teachers, counselors, and psychologists is discussed in Chapter Four.
A low pupil-to-teacher ratio is a legislative requirement for these programs. In 2004-2005, the programs report an 11:1 ratio of students to teachers, which is slightly higher than the approximately 10:1 ratio reported in previous years.
Professional Development – A current program of staff development and training is another legislative requirement for this program. The extensive and diverse special needs and challenges of the students assigned to the regional alternative education programs present additional needs for staff development.
Improving and expanding staff development is frequently mentioned as a primary concern of program administrators. These needs include a broad spectrum of professional development related to content areas, use of technology, programmatic and administrative issues as well as an even broader spectrum of areas that relate to the behavioral problems common to the students served. Table 3 provides more detailed information regarding the extent to which the needs for staff professional development in the regional alternative education programs were addressed during the 2004-2005 school year.
Regional Alternative Education Programs 10

VIRGINIA BOARD OF EDUCATION
Table 3 Professional Development
Staff Development Programs Percentage of
Teachers in Program
Content work 91.1
Technology 87.8
Discipline 87.7
Violence 85.2
Conflict management 85.3
Alternative education practices 84.9
Alcohol and drug abuse 66.0
Counseling 45.7
C. Program Resources and Support
General Resources – The regional alternative education programs report that their program resources are generally satisfactory. Approximately 80 percent of all responses from the program administrators, across all categories, indicate that they perceived their program resources as either “excellent” or “good” and only three percent of the responses reflect a “poor” ranking. Size of, access to, and geographic location of facilities had the most mixed responses. Figure 4 indicates the percentage of program administrators’ responses ranking various major categories of these program resources as either “excellent” or “good.”
Figure 4. Quality of Program Resources
0 10 20 30 40 50 60 70 80 90 100
Size of facilities
Availability of other technology
Availability of equipment
Access to facilities
Geographic location of facilities
Level of funding
Availability of instructionalmaterials
Availability of computers
Percentage of Programs Rating Resources as "Good" or "Excellent"
Regional Alternative Education Programs 11

VIRGINIA BOARD OF EDUCATION
External Program Support – A program for community outreach to build school, business, and community partnerships is a legislative component of the regional alternative education programs. All programs report extensive efforts to build external support and, the program administrators report that they generally receive very good external support.
Administrators report that their school boards, localities, and area agencies generally provide excellent support. Over 90 percent of the responses regarding these sources indicate “excellent” or “good” support.
Figure 5 provides a graphical summary of the percentage of responses for each external support category that were either “good” or “excellent.”
Figure 5. External Program Support
0 10 20 30 40 50 60 70 80 90 100
Support from the businesscommunity
Support from communityinvolvement in the program
Support from sending schools
Support from the judicial system
Support from localities and areaagencies
Support from the school board
Percentage of Programs Rating Support as "Good" or "Excellent"
D. Parental and Community Involvement
A procedure for obtaining the participation and support from parents is a legislative requirement of the regional alternative education program. Each program reports multiple initiatives addressing these objectives.
Perceptions regarding community involvement in the regional alternative education programs are mixed. Of the responding administrators, 21.4 percent report that community involvement in their program is “excellent”, 39.3 percent report “good” community involvement, 25 percent report “fair” community involvement, and 14.3 percent reported that the community involvement in their program was “poor.”
Regional Alternative Education Programs 12

VIRGINIA BOARD OF EDUCATION
Parental support and involvement is particularly critical to the students served by these programs. The potential of having these students successfully graduate is dependent on the combined efforts of the teachers, administrators, parents or guardians, and others. Administrators report concerns with improving parental interaction and involvement. One frequently reported concern is that the parents often have issues that impede the desired levels of involvement in the students’ school activities. Illustrative parental involvement initiatives and the percentage of programs employing these approaches are portrayed in Figure 6.
Figure 6. Parental Involvement
0 10 20 30 40 50 60 70 80 90 100
Program offers home visits byschool personnel
Parent orientation is offered
Program offers parent-student-school contracts
Program provides parentsprogress reports
Program provides parentsnotif ication of problems
Program offers parent-teacherconferences
Percentage of Programs Reporting
Regional Alternative Education Programs 13

VIRGINIA BOARD OF EDUCATION
CHAPTER FOUR
Perceived Adequacy of Program Attributes and Functions
The number of programs in 2004-2005 is the same as it was in 1996-1997. While the number of sites has not increased, the state funding has increased approximately 33 percent, and the number of students has increased about 70 percent. As part of the 2004-2005 regional alternative education program data collection process, administrators were asked to rate the overall quality or adequacy of various aspects of their program.
General Program Attributes, Services, and Policies – The responding administrators indicate that they are generally satisfied about most aspects of their programs. As indicated in Table 4, approximately 90 percent of the administrators’ ranked their program attributes, services, and policies as “excellent” or “good”. Overall, based on the responses provided, none of the aspects of the regional alternative education programs shown in Table 6 were reported as inadequate.
Table 4. Quality of Program Attributes
How would you rate your program? Excellent Good Fair Poor Non-
response
Academic Program 10 19 0 0 0
Student Services 9 16 3 1 0
Student Assessment Services 7 21 1 0 0
Student Selection Process 11 15 2 0 1
Discipline Policy 14 12 3 0 0
Staff Development 11 14 4 0 0
Technology Availability / Use 10 16 1 2 0
Parental Involvement 9 14 5 1 0
Totals 81 127 19 4 1
Distribution of Totals 34.9% 54.7% 8.2% 1.7% 0.4%
Staffing and Related Resources – An intensive, accelerated instructional program with rigorous standards for academic achievement and student behavior and a low pupil-teacher ratio to promote a high level of interaction between the student and teacher are legislative requirements for the program. Developing a quality staff is a particularly critical function of the regional alternative education program and the key to achieving the legislative mandates outlined above.
As part of the data collection process, administrators were asked to rate the adequacy of several key staffing and staff-related functions, teachers in the program, counselors and psychologists available to the program. Approximately 82 percent of the programs report
Regional Alternative Education Programs 14
VIRGINIA BOARD OF EDUCATION
that the number of teachers is adequate. Several administrators indicated a need for more full-time versus part-time teachers. Additionally, administrators indicated a need for more teachers in specific content areas.
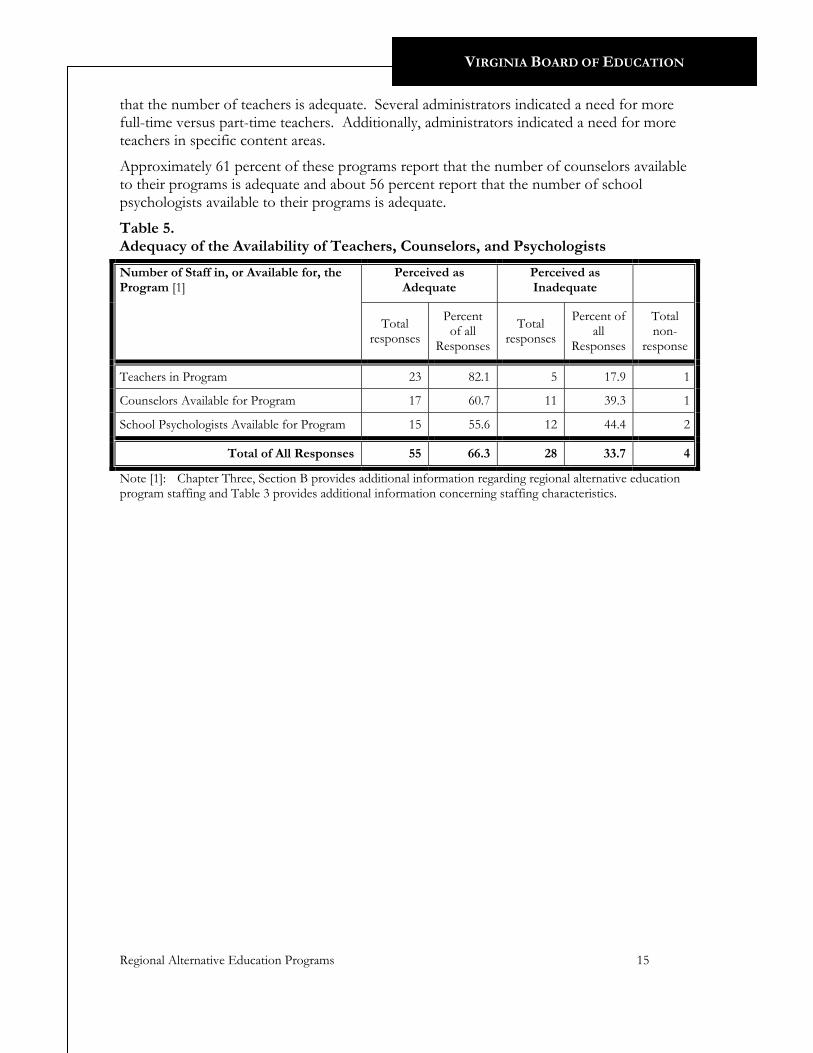
Approximately 61 percent of these programs report that the number of counselors available to their programs is adequate and about 56 percent report that the number of school psychologists available to their programs is adequate.
Table 5. Adequacy of the Availability of Teachers, Counselors, and Psychologists
Number of Staff in, or Available for, the Program [1]
Perceived as Adequate
Perceived as Inadequate
Total responses
Percent of all
Responses
Total responses
Percent of all
Responses
Total non-
response
Teachers in Program 23 82.1 5 17.9 1
Counselors Available for Program 17 60.7 11 39.3 1
School Psychologists Available for Program 15 55.6 12 44.4 2
Total of All Responses 55 66.3 28 33.7 4
Note [1]: Chapter Three, Section B provides additional information regarding regional alternative education program staffing and Table 3 provides additional information concerning staffing characteristics. Regional Alternative Education Programs 15

VIRGINIA BOARD OF EDUCATION
CHAPTER FIVE
Program and Student Performance
Defining and measuring performance are different for the alternative education population than it would be in the traditional school systems.
A. Considerations for Evaluating Regional Alternative Education Program and Student Performance
These student populations present challenges because the assigned students often have histories of dysfunctional behavioral problems, low self-esteem, and academic failure. Since these are generally students who have been suspended, these programs are deemed as the only remaining academic option (e.g., 85 percent of programs report that students are placed or assigned to their program as “a last chance option”).
The student body of any given program has less continuity from year-to-year (often from month-to-month) than a traditional school. Programs are generally small, leaving limited resources to address an extensive array of needs. The combination of these needs and the operational constraints of the programs dictate different policies, administrative procedures, and academic approaches. They also dictate a different approach to evaluating both program and student performance.
One approach for assessing program and student performance is the programs’ self-reported “program purposes” as presented in Section III.A. These include:
Correct dysfunctional or dangerous behavior; Build self-esteem and responsibility; Reduce dropout rate; Identify career interests and opportunities and, for some students, secure
employment or work/study before being graduated; Graduation (return to sending school to graduate, obtain diploma from sending
school in abstentia, earn alternative school diploma, obtain and adult diploma, or earn a GED diploma); and
Gain admission to community or four-year college/university.
B. Measures of Achievement
Standard measurements such as SOL tests, attendance, and dropout rates may not be considered in the same way as they would be considered for traditional schools because the student populations, educational models, and operational models are different.
Standards of Learning – Standards of Learning (SOL) test results for 2004-2005 were not available for analysis as this report was being prepared. The ability to correlate SOL test results with students who have spent time in a regional alternative education program will not be available until the 2005-2006 school year.
Regional Alternative Education Programs 16

VIRGINIA BOARD OF EDUCATION
Dropout Rates –The total 2004-2005 dropouts reported by the program administrators for this evaluation equals a seven percent dropout rate (i.e., 275 dropouts versus 3,903 students served). The state average for dropouts for traditional schools for 2003-2004 was 2.05 percent. However, most regional alternative education students are considered dropout risks prior to being assigned to these programs.
Attendance – Because of data issues, the fluidity of the student population, and the wide range in delivery of models, attendance is difficult to measure.
Perceptions of Changes in Student Academic Performance – Administrators were asked to provide their perceptions of changes in their students’ academic performance. The administrators perceive somewhat or substantial improvement in approximately 80 percent of students served. High school student improvement is estimated to be slightly better than middle school student improvement.
Table 6. Reported Change in Academic Performance
Reported Change During Assignment to Alternative Education
Substantially Improved
Somewhat Improved
Somewhat Decreased
Substantially Decreased
No Apparent Change
Total Responses
Middle Grades – Math 11.5% 65.4% 15.4% 0.0% 7.7% 26Middle Grades – English 19.2% 61.5% 11.5% 0.0% 7.7% 26
High School – Math 28.6% 46.4% 10.7% 0.0% 14.3% 28
High School – English 46.4% 42.9% 7.1% 0.0% 3.6% 28
Perceptions of Changes in Student Disciplinary Incidences – Correcting dysfunctional behavior is a primary goal of regional alternative education programs. As in academic performance, evaluation measures are limited by the lack of longitudinal data at the student level, by limitations in the existing data, and by the fluidity of the student population. Consequently, administrators also were asked to provide their perceptions of changes in student disciplinary incidences.
Approximately 30 percent of the administrators indicate that overall disciplinary incidences “substantially decreased” and another 30 percent report that overall incidences “decreased somewhat” for a combined 60 percent of responses reflecting at least some decrease in discipline, crime, and violence incidence. For the more serious physical violence and firearms categories, 65 percent of the responses reflect some or substantial decreases in incidences. Only seven percent of the responses represent perceived increases in disciplinary incidences and two-thirds of those are related to the less severe or violent substance abuse violations and offenses against property.
End of Year Status of 2004-2005 Students – Data discussed previously in this report suggest that many of the 3,903 students that the programs served in 2004-2005 were assigned as a “last chance.” Most of these students were at risk of dropping out, being expelled permanently, or failing academically. Some had already been incarcerated, and the
Regional Alternative Education Programs 17

VIRGINIA BOARD OF EDUCATION
violations that led to their suspensions (see Table 2) suggest many others were candidates for future incarceration. Figure 8 depicts the status of the 2004-2005 students served by the regional alternative education programs based on data provided by the programs as of July 1, 2005. A more detailed 2004-2005 end of year status of students in each of the 29 regional alternative education programs is provided in Attachment A3.
Figure 8. End of Year Status of 2004-2005 Students from the Perspective of the Programs
Students returning to sending school for 2005-
2006, 38.0%
Students remaining in program for 2005-2006,
22.1%
Students that dropped out during 2004-2005,
7.0%
Students dismissed/expelled from program during
2004-2005, 6.7%
Students that otherwise left program [1] during
2004-2005, 15.2%
Students that graduated/received GEDs during 2004-
2005, 10.9%
Note [1]: Students who may have transferred to other programs (e.g., adult programs, other high school
programs, promoted), withdrawn, switched to home-bound schooling, been moved to detention/state facilities, moved to another geographic location, or otherwise left the program during the 2004-2005 school year)
Based on these data, slightly over 60 percent of the students served in the 2004-2005 regional alternative education programs remain in school – either returning to the regional alternative program for 2005-2006 (22 percent) or returning to their sending school for 2005-2006 (38 percent). For this population, remaining in school is an accomplishment and a stated goal of the regional alternative education programs.
One noteworthy aspect of these results is that the programs reported that 425 of their students either graduated or were awarded a GED. This total amounts to almost 11 percent of the total K-12 regional alternative education program population. Regional Alternative Education Programs 18

VIRGINIA BOARD OF EDUCATION
C. Summary
While defining and measuring performance is difficult for the alternative education population, the mosaic of available 2004-2005 data suggests that:
1. The regional alternative education programs, to a great extent, appear to be achieving the self-reported “program purposes.”
2. The numbers of students remaining in school, graduating, or receiving a GED are above expectations.
3. The return on the public’s investment for regional alternative education programs appears favorable.
Dr. Daniel Duke, University of Virginia professor, who performed several of the earlier evaluations of Virginia’s regional alternative education programs once wrote,
Had it not been for the Regional Alternative Education Projects, supported by state and local tax dollars, many of these students would have been unable to continue their formal education, return to the school of origin, earn a GED, or graduate from high school.
This evaluation finds that these programs not only have provided the opportunity for the students assigned to Virginia’s regional alternative education programs during the 2004-2005 school year to continue their formal education, but they have made a contribution towards helping these student remain in school, earn a GED certificate, or graduate from high school.
Regional Alternative Education Programs 19

VIRGINIA BOARD OF EDUCATION
ATTACHMENTS
Attachment A1
Listing of Regional Alternative Education Programs – 2004-2005
Table A1. Regional Alternative Education Programs – 2004-2005
School Division--Fiscal Agent
Other Participating Divisions Program Name
Bristol City Public Schools
Washington County Public Schools Crossroads Alternative Education Program
Brunswick County Public Schools
Greensville and Mecklenburg County Public Schools Southside LINK
Carroll County Public Schools
Galax City Public Schools
Carroll-Galax Regional Alterative Education Program (The RAE Center)
Fairfax County Public Schools
Alexandria City Public Schools Transition Support Resource Center
Fauquier County Public Schools
Rappahannock County Public Schools
The Regional Continuum of Alternative Education Services
Fluvanna County Public Schools
Alleghany, Bath, Botetourt, Buchanan, Charles City, Clarke, Craig, Culpeper, Floyd, Franklin, Giles, Grayson, Greene, Halifax, Highland, Lancaster, Madison, Orange, Shenandoah, and Smyth County Public Schools; Radford City Public Schools
Project RETURN
Henry County Public Schools
Martinsville City and Patrick County Public Schools Breaking Barriers
Regional Alternative Education Programs 20

VIRGINIA BOARD OF EDUCATION
School Division--Fiscal Agent
Other Participating Divisions Program Name
King William County Public Schools
Gloucester, Mathews, Middlesex, Essex, King and Queen, and New Kent County Public Schools; Town of West Point Public Schools
Middle Peninsula Regional Alternative Program
Lynchburg City Public Schools
Appomattox, Amherst, Bedford, and Nelson County Public Schools
Regional Alternative Education Project
Montgomery County Public Schools
Pulaski County Public Schools Regional Program for Behaviorally Disturbed Youth
Newport News City Public Schools
Hampton City Public Schools Enterprise Academy
Norfolk City Public Schools
Chesapeake, Franklin, Portsmouth, Suffolk, and Virginia Beach City Public Schools; Isle of Wight and Southampton County Public Schools
Southeastern Cooperative Education Program
Northampton County Public Schools
Accomack County Public Schools Project Renew
Nottoway County Public Schools
Amelia, Buckingham, Charlotte, Cumberland, Lunenburg, and Prince Edward County Public Schools
Piedmont Regional Alternative School
Petersburg City Public Schools
Dinwiddie, Prince George, and Sussex County Public Schools; Colonial Heights and Hopewell City Public Schools
Bermuda Run Educational Center Regional Alternative Program
Pittsylvania County Public Schools
Danville City Public Schools
Pittsylvania County/Danville City Regional Alternative School
Powhatan County Public Schools
Goochland and Louisa County Public Schools
Project Return Regional Alternative Education Program
Regional Alternative Education Programs 21

VIRGINIA BOARD OF EDUCATION
School Division--Fiscal Agent
Other Participating Divisions Program Name
Prince William County Public Schools
Manassas City and Manassas Park Public Schools
New Dominion Alternative School
Richmond City Public Schools
Hanover and Henrico County Public Schools
Metro-Richmond Alternative Education Program
Roanoke City Public Schools
Salem City Public Schools Roanoke/Salem Regional
Roanoke County Public Schools
Bedford County Public Schools R.E. Cook Regional Alternative School
Russell County Public Schools
Tazewell County Public Schools Project Bridge
Scott County Public Schools
Lee County Public Schools Renaissance Program
Stafford County Public Schools
Caroline, King George, and Spotsylvania County Public Schools; Fredericksburg City Public Schools
The Regional Alternative Education Program
Staunton City Public Schools
Harrisonburg and Waynesboro City Public Schools; Augusta County Public Schools
Genesis Alternative School
Westmoreland County Public Schools
Northumberland and Richmond County Public Schools
Northern Neck Regional Alternative Education Program
Wise County Public Schools
Dickenson County and Norton City Public Schools
Regional Learning Academy
Wythe County Public Schools
Bland County Public Schools Wythe/Bland Alternative Education Program
York County Public Schools
Poquoson City and Williamsburg/James City County Public Schools
Three Rivers Project-Enterprise Academy
Regional Alternative Education Programs 22

VIRGINIA BOARD OF EDUCATION
Attachment A2
Profile of Regional Alternative Education Programs – 2004-2005
Table A2. Profile of Available Slots, Students Served, and Grades Served – 2004-2005
School Division Grades Served by Each of the Number of Number of Number of StudentsFiscal Agent Regional Alternative Education Programs Students Slots Grades per
K 1 2 3 4 5 6 7 8 9 10 11 12 Served Available Served Grade
Bristol City x x x x x x 92 68 6 15
Brunswick County x x x x x x 105 84 6 18
Carroll County x x x x x x 38 29 6 6
Fairfax County x x x x x x 82 50 6 14
Fauquier County x x x x x x 134 65 6 22
Fluvanna County x x x x x x x x x x x x x 300 66 13
Henry County x x x x x x x 37 52 7 5
King William County x x x x x x x 154 104 7 22
Lynchburg City x x x x x x x 117 67 7 17
Mongomery County x x x x x x x 384 116 7 55
Newport News City x x x x x x x 390 166 7 56
Norfolk City x x x x x x x 387 258 7 55
Northampton County x x x x 42 46 4 11
Nottoway County x x x x x x 122 91 6 20
Petersburg City x x x x x x x 62 28 7 9
Pittsylvania County x x x x x x x 73 36 7 10
Powhatan County x x x x 55 55 4 14
Prince William County x x x 152 120 3 51
Richmond City x x x x x x x 54 41 7 8
Roanoke City x x x x x x 196 220 6 33
Roanoke County x x x x x x x x x x 54 40 10 5
Russell County x x x x x x x x x x x x x 235 156 13 18
Scott County x x x x x x x 127 61 7 18
Stafford County x x x x 171 182 4 43
Staunton City x x x x x x x 107 95 7 15
Westmoreland County x x x x x x x 104 41 7 15
Wise County x x x x x x x 50 59 7 7
Wythe County x x x x x 18 25 5 4
York County x x x x x x x 61 34 5 12
Totals = 2 2 2 3 3 3 19 26 27 29 29 29 29 3,903 2,455
23
Regional Alternative Education Programs 23

VIRGINIA BOARD OF EDUCATION
Attachment A3
Profile of Regional Alternative Education Program Student Status End of School Year – 2004-2005
Table A3. Status of Students at the End of the 2004-2005 School Year
Total Number of Students Who….School Division Number Remain Returned to Graduated Dropped Out or Otherwise
Fiscal Agent of in the Sending School or Received Were Expelled/ Left ProgramStudents Program for for GED in Dismissed in DuringServed 2005-2006 [1] 2005-2006 [1] 2004-2005 [1] 2004-2005 [1] 2004-2005 [2]
Bristol City 92 40 43% 24 26% 21 23% 7 8% 0 0%Brunswick County 105 38 36% 16 15% 10 10% 18 17% 23 22%
Carroll County 38 12 32% 12 32% 0 0% 14 37% 0 0%Fairfax County 82 7 9% 56 68% 3 4% 12 15% 4 5%
Fauquier County 134 60 45% 27 20% 29 22% 18 13% 0 0%Fluvanna County 300 67 22% 156 52% 35 12% 42 14% 0 0%
Henry County 37 4 11% 21 57% 5 14% 6 16% 1 3%King William County 154 19 12% 100 65% 24 16% 5 3% 6 4%
Lynchburg City 117 25 21% 45 38% 0 0% 6 5% 41 35%Mongomery County 384 9 2% 32 8% 1 0% 38 10% 304 79%
Newport News City [3] 451 33 7% 239 53% 12 3% 121 27% 46 10%Norfolk City 387 107 28% 194 50% 8 2% 78 20% 0 0%
Northampton County 42 18 43% 6 14% 13 31% 5 12% 0 0%Nottoway County 122 17 14% 36 30% 13 11% 27 22% 29 24%
Petersburg City 62 4 6% 18 29% 6 10% 10 16% 24 39%Pittsylvania County 73 12 16% 21 29% 8 11% 22 30% 10 14%
Powhatan County 55 13 24% 16 29% 12 22% 12 22% 2 4%Prince William County 152 53 35% 67 44% 0 0% 4 3% 28 18%
Richmond City 54 6 11% 48 89% 0 0% 0 0% 0 0%Roanoke City 196 123 63% 30 15% 15 8% 21 11% 7 4%
Roanoke County 54 17 31% 19 35% 8 15% 4 7% 6 11%Russell County 235 32 14% 44 19% 123 52% 9 4% 27 11%
Scott County 127 41 32% 54 43% 29 23% 2 2% 1 1%Stafford County 171 19 11% 88 51% 30 18% 34 20% 0 0%
Staunton City 107 52 49% 8 7% 11 10% 13 12% 23 21%Westmoreland County 104 15 14% 86 83% 1 1% 2 2% 0 0%
Wise County 50 18 36% 16 32% 7 14% 4 8% 5 10%Wythe County 18 3 17% 6 33% 1 6% 2 11% 6 33%
Totals = 3,903 864 22% 1,485 38% 425 11% 536 14% 593 15% Note [1]: Estimates based on data reported by the programs and follow-up communications. Note [2]: Includes students who may have transferred to other programs (e.g., adult
programs, other high school programs, promoted/transferred), withdrawn, switched to home-bound schooling, been moved to detention/state facilities, moved to another geographic location, or otherwise left the program during the 2004-2005 school year.
Note [3]: Also includes data from York County Three Rivers Project - Enterprise Academy. Regional Alternative Education Programs 24