regional and bilateral trade agreements lance graef
TRANSCRIPT
Regional and Bilateral Trade Agreements
Lance Graefwww.nathaninc.com
22
Some terms
• Regional and bilateral FTAs and preferential trade agreements are exceptions to Article I of GATT/WTO (MFN)
• Free trade agreements
– Reciprocal
– Bound (committed in a schedule) Disciplined safeguard action
– Subject to dispute resolution
• Preferential trade arrangements
– Unilateral
– Not scheduled Expedited safeguard actions
– Not subject to dispute resolution (except as provided for the preference offering country)
33
WTO exceptions for RTAs/PTAs
• Goods
– Article XXIVCover substantially all tradeNot raise barriers to non-members Implement in 10 years
– Enabling Clause
• Services
– Article V
• Doha Round Rules Group
44
RTAs—pluses and minuses
• Economic benefits
– Trade creation– Larger market (returns to scale)– Attractive to FDI
– Lower prices due to tariff elimination
– Increased efficiency resulting from greater competition
• Economic costs
– Trade diversion
– Rise in prices if absorbed in tariff cut– Complex difficult to implement rules especially rules of origin
– Revenue loss
– Structural adjustment within the RTA
55
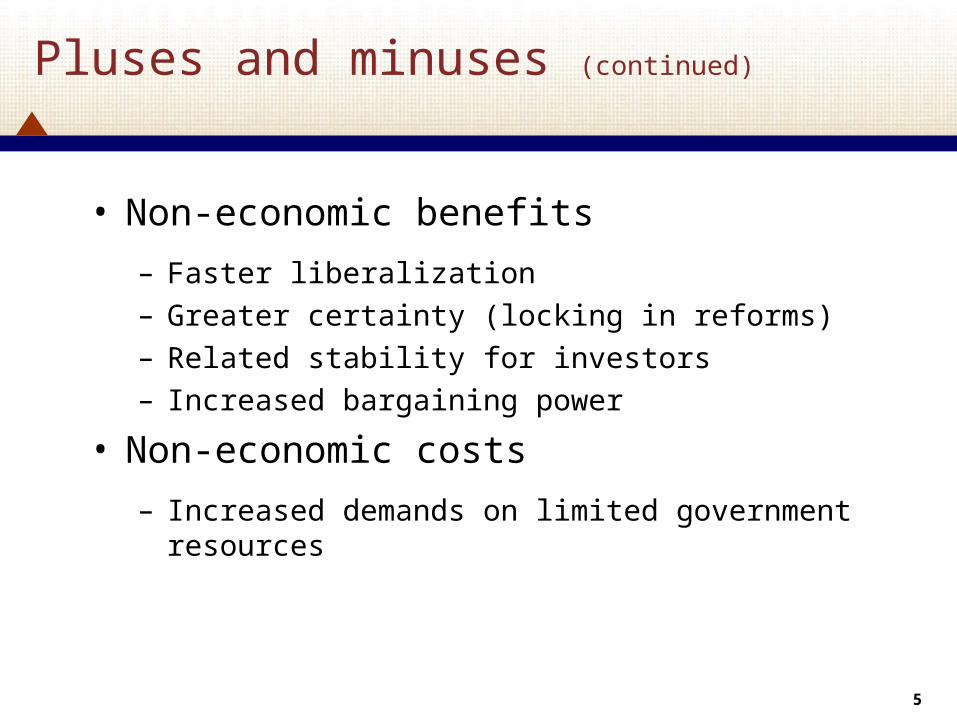
Pluses and minuses (continued)
• Non-economic benefits
– Faster liberalization
– Greater certainty (locking in reforms)
– Related stability for investors
– Increased bargaining power
• Non-economic costs
– Increased demands on limited government resources
66
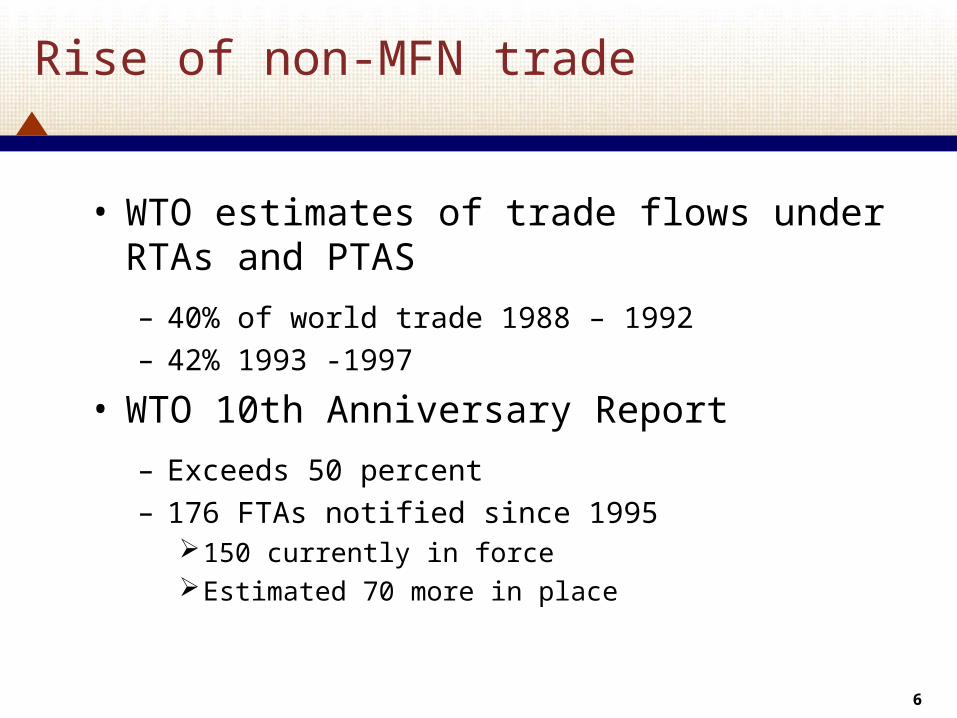
Rise of non-MFN trade
• WTO estimates of trade flows under RTAs and PTAS
– 40% of world trade 1988 – 1992
– 42% 1993 -1997
• WTO 10th Anniversary Report
– Exceeds 50 percent
– 176 FTAs notified since 1995150 currently in forceEstimated 70 more in place
77
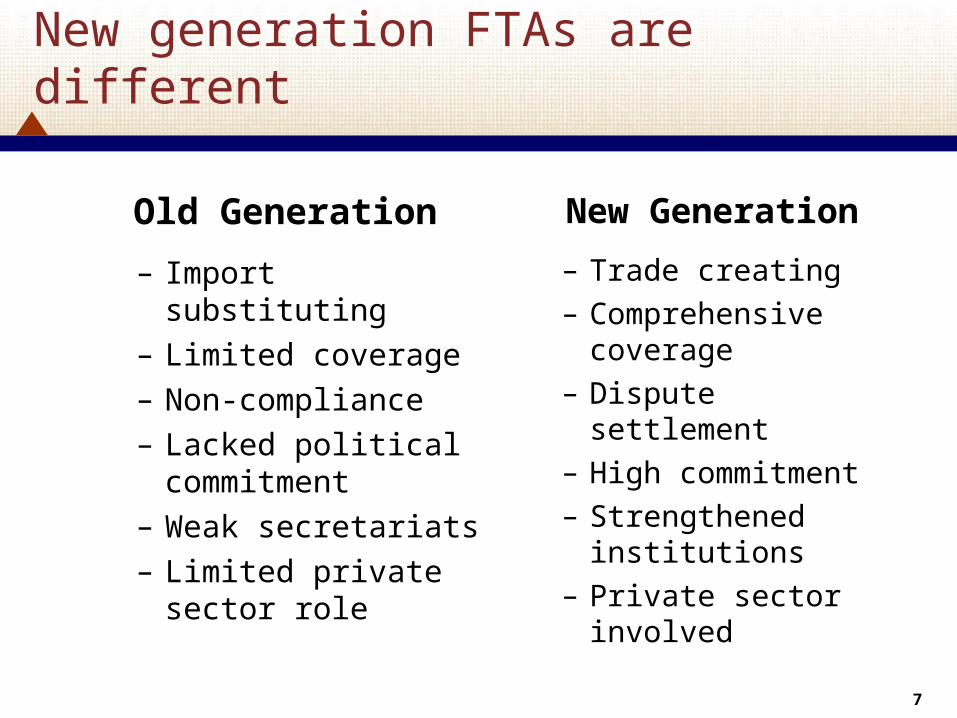
New generation FTAs are different
Old Generation
– Import substituting– Limited coverage– Non-compliance– Lacked political
commitment– Weak secretariats– Limited private sector
role
New Generation
– Trade creating– Comprehensive
coverage– Dispute settlement– High commitment– Strengthened
institutions– Private sector
involved
88
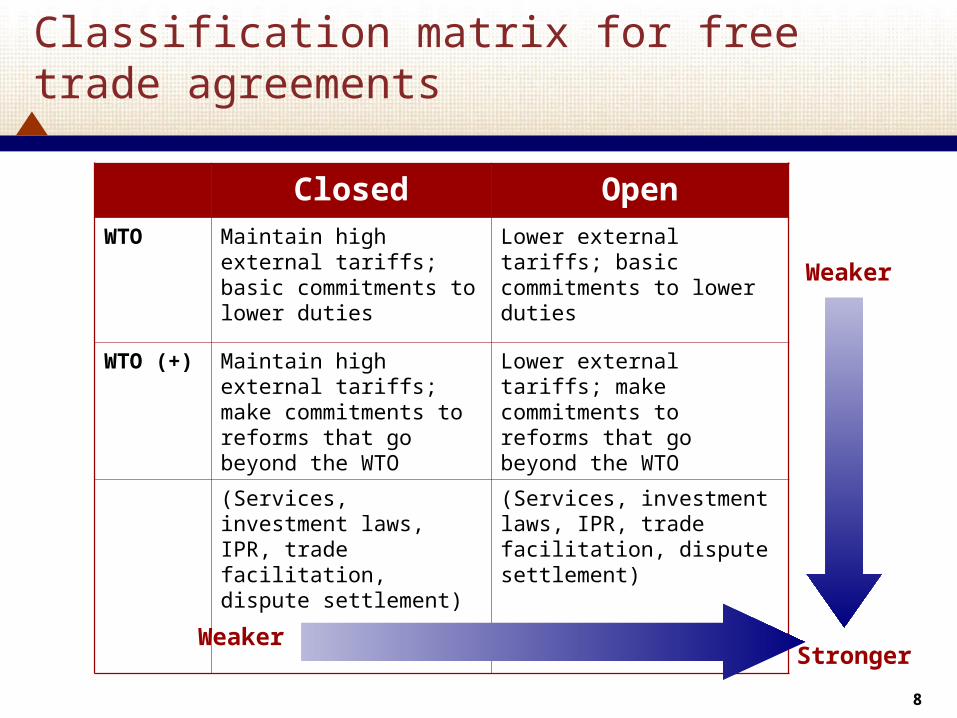
Classification matrix for free trade agreements
Closed OpenWTO Maintain high external
tariffs; basic commitments to lower duties
Lower external tariffs; basic commitments to lower duties
WTO (+) Maintain high external tariffs; make commitments to reforms that go beyond the WTO
Lower external tariffs; make commitments to reforms that go beyond the WTO
(Services, investment laws, IPR, trade facilitation, dispute settlement)
(Services, investment laws, IPR, trade facilitation, dispute settlement)
WeakerStronger
Weaker
99
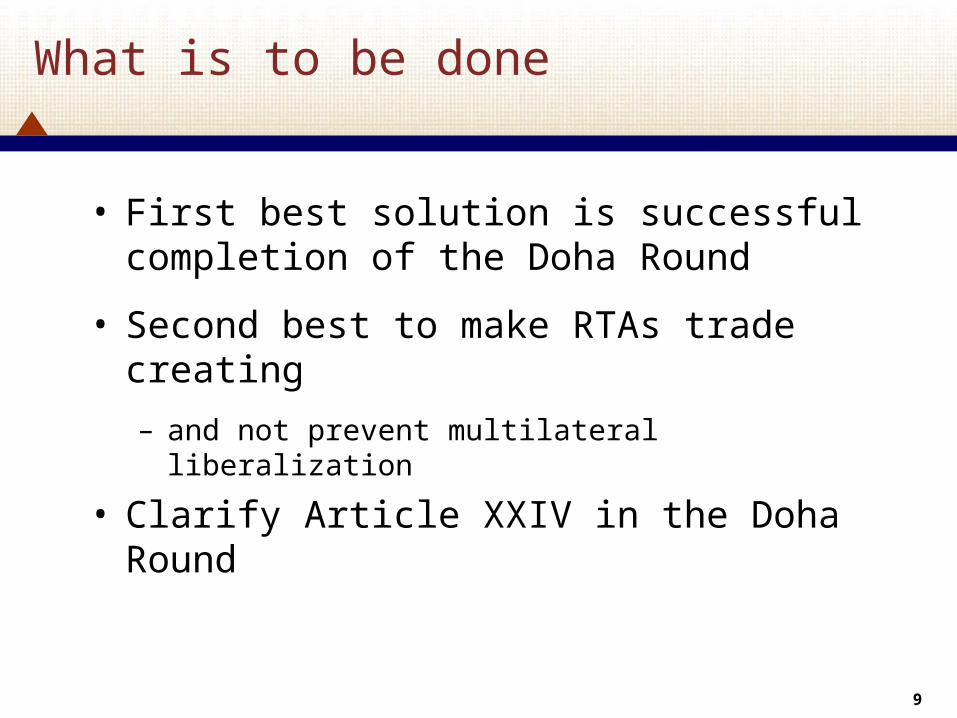
What is to be done
• First best solution is successful completion of the Doha Round
• Second best to make RTAs trade creating
– and not prevent multilateral liberalization
• Clarify Article XXIV in the Doha Round
Trends in Mozambique’s Trade with SADC—the Agenda
1111
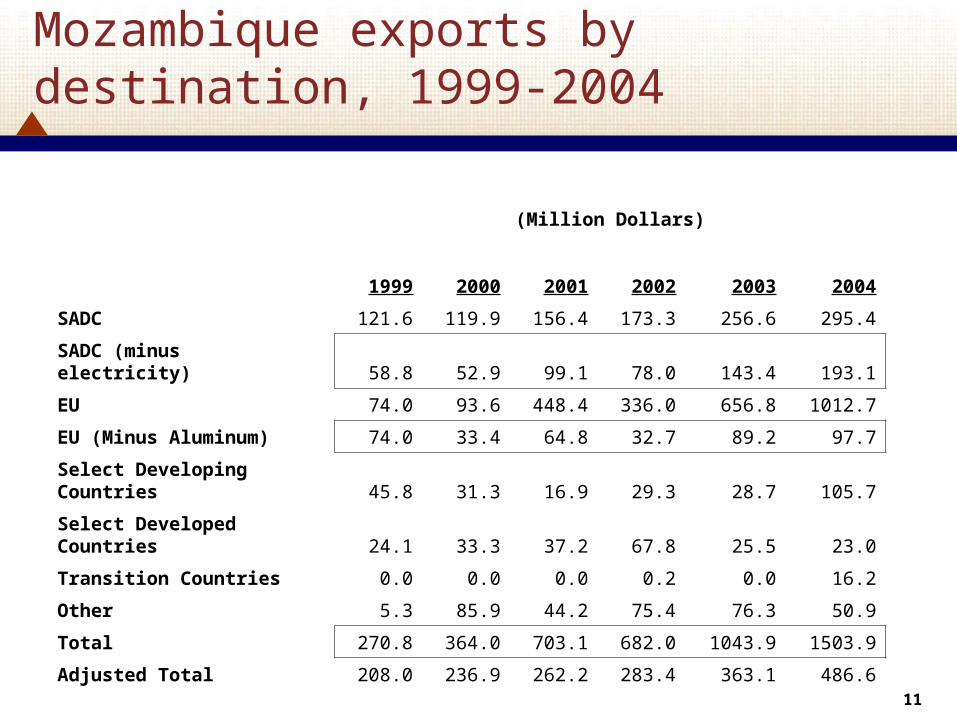
Mozambique exports by destination, 1999-2004
(Million Dollars)
1999 2000 2001 2002 2003 2004
SADC 121.6 119.9 156.4 173.3 256.6 295.4
SADC (minus electricity) 58.8 52.9 99.1 78.0 143.4 193.1
EU 74.0 93.6 448.4 336.0 656.8 1012.7
EU (Minus Aluminum) 74.0 33.4 64.8 32.7 89.2 97.7
Select Developing Countries 45.8 31.3 16.9 29.3 28.7 105.7
Select Developed Countries 24.1 33.3 37.2 67.8 25.5 23.0
Transition Countries 0.0 0.0 0.0 0.2 0.0 16.2
Other 5.3 85.9 44.2 75.4 76.3 50.9
Total 270.8 364.0 703.1 682.0 1043.9 1503.9
Adjusted Total 208.0 236.9 262.2 283.4 363.1 486.6
Source:INE
1212
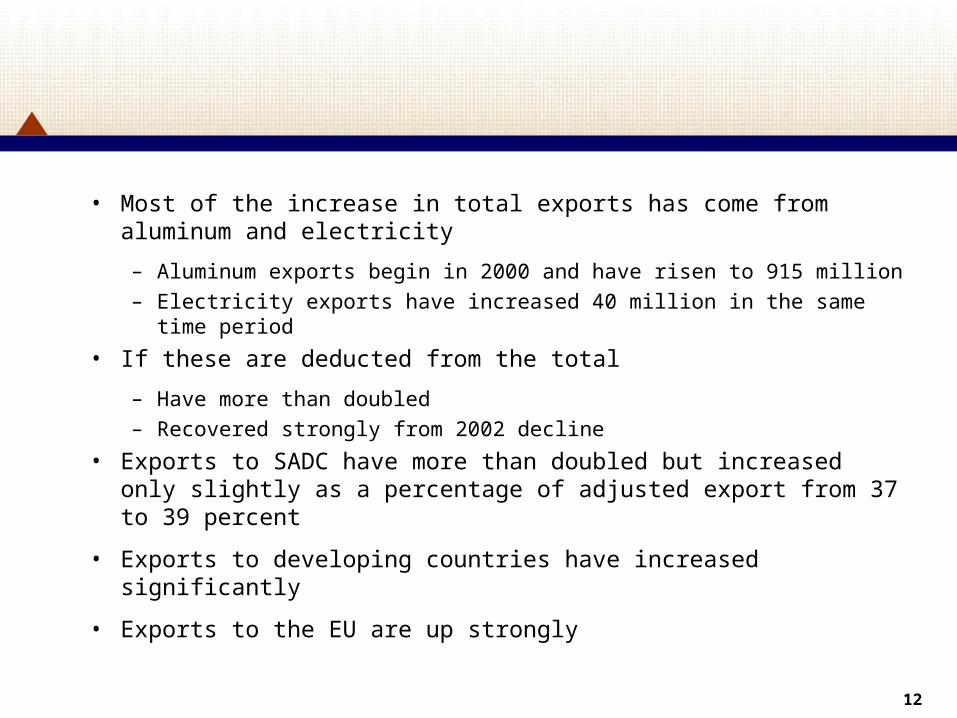
• Most of the increase in total exports has come from aluminum and electricity
– Aluminum exports begin in 2000 and have risen to 915 million
– Electricity exports have increased 40 million in the same time period
• If these are deducted from the total
– Have more than doubled
– Recovered strongly from 2002 decline
• Exports to SADC have more than doubled but increased only slightly as a percentage of adjusted export from 37 to 39 percent
• Exports to developing countries have increased significantly
• Exports to the EU are up strongly
1313
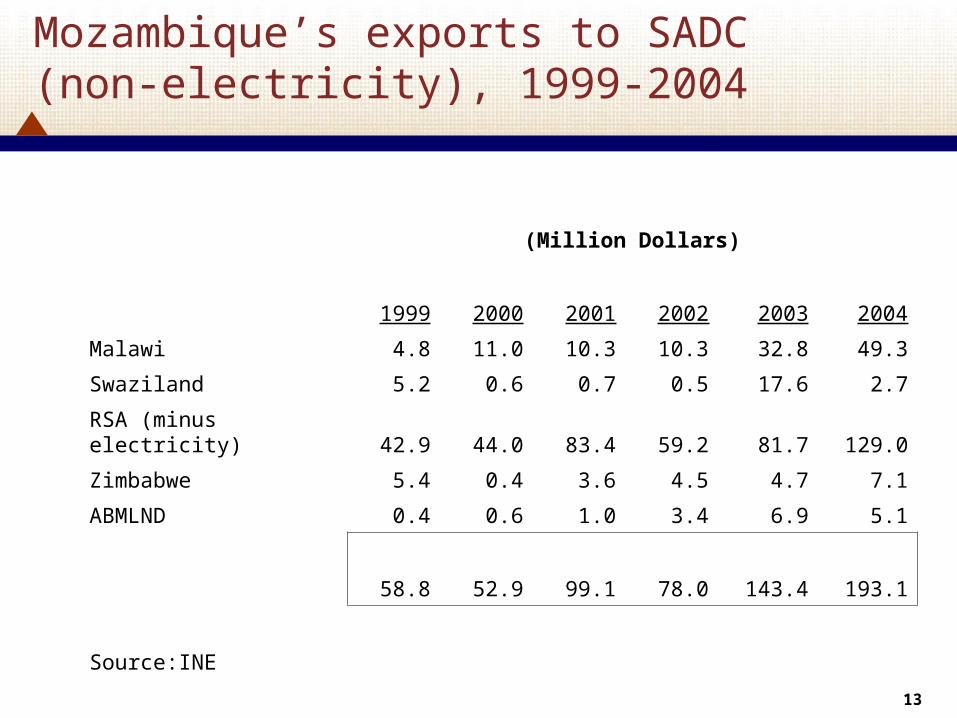
Mozambique’s exports to SADC (non-electricity), 1999-2004
(Million Dollars)
1999 2000 2001 2002 2003 2004
Malawi 4.8 11.0 10.3 10.3 32.8 49.3
Swaziland 5.2 0.6 0.7 0.5 17.6 2.7
RSA (minus electricity) 42.9 44.0 83.4 59.2 81.7 129.0
Zimbabwe 5.4 0.4 3.6 4.5 4.7 7.1
ABMLND 0.4 0.6 1.0 3.4 6.9 5.1
58.8 52.9 99.1 78.0 143.4 193.1
Source:INE
1414
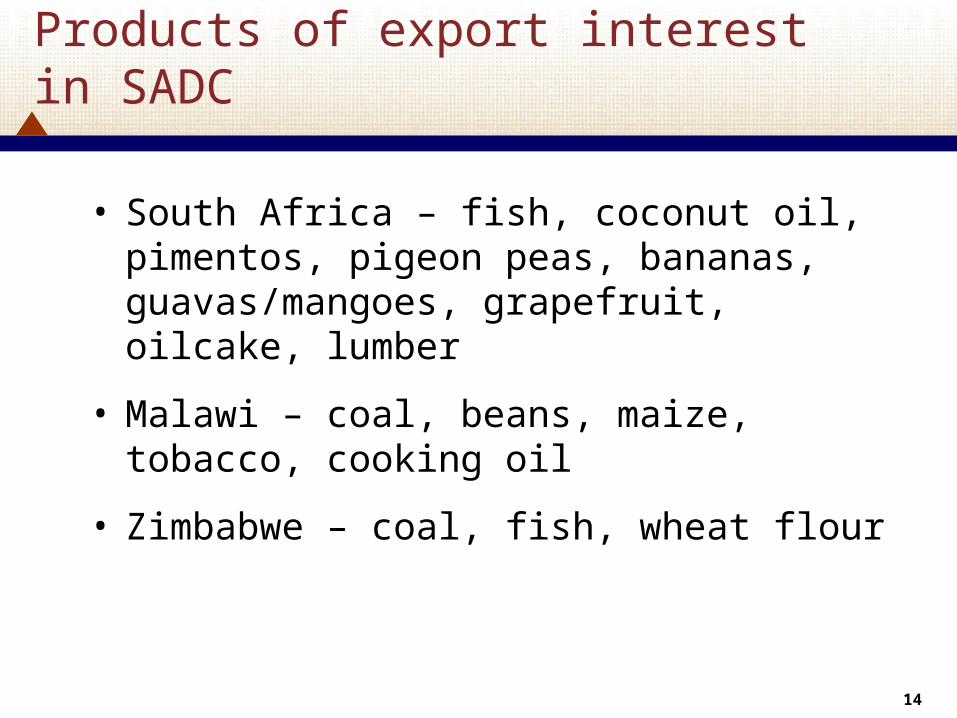
Products of export interest in SADC
• South Africa – fish, coconut oil, pimentos, pigeon peas, bananas, guavas/mangoes, grapefruit, oilcake, lumber
• Malawi – coal, beans, maize, tobacco, cooking oil
• Zimbabwe – coal, fish, wheat flour
1515
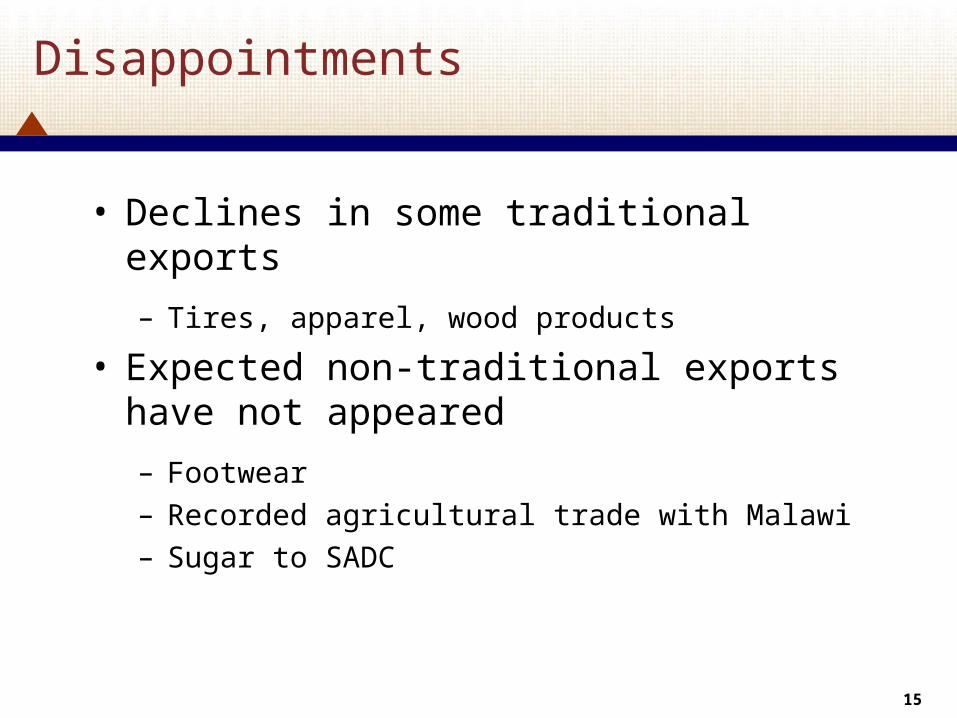
Disappointments
• Declines in some traditional exports
– Tires, apparel, wood products
• Expected non-traditional exports have not appeared
– Footwear
– Recorded agricultural trade with Malawi
– Sugar to SADC
1616
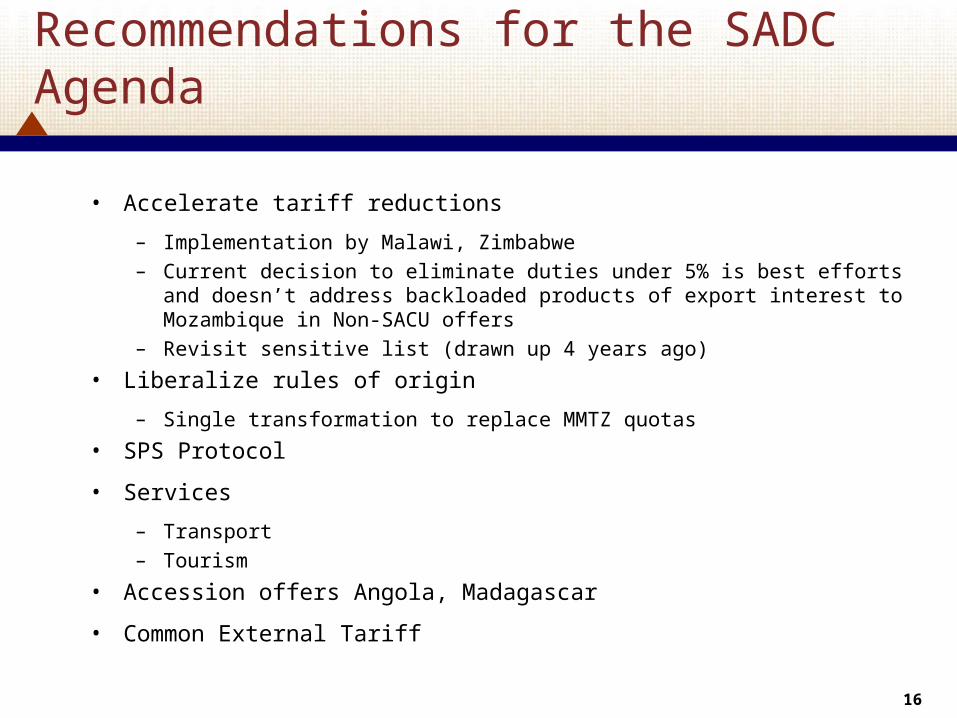
Recommendations for the SADC Agenda
• Accelerate tariff reductions
– Implementation by Malawi, Zimbabwe– Current decision to eliminate duties under 5% is best efforts and doesn’t
address backloaded products of export interest to Mozambique in Non-SACU offers
– Revisit sensitive list (drawn up 4 years ago)
• Liberalize rules of origin
– Single transformation to replace MMTZ quotas
• SPS Protocol
• Services
– Transport– Tourism
• Accession offers Angola, Madagascar
• Common External Tariff
1717
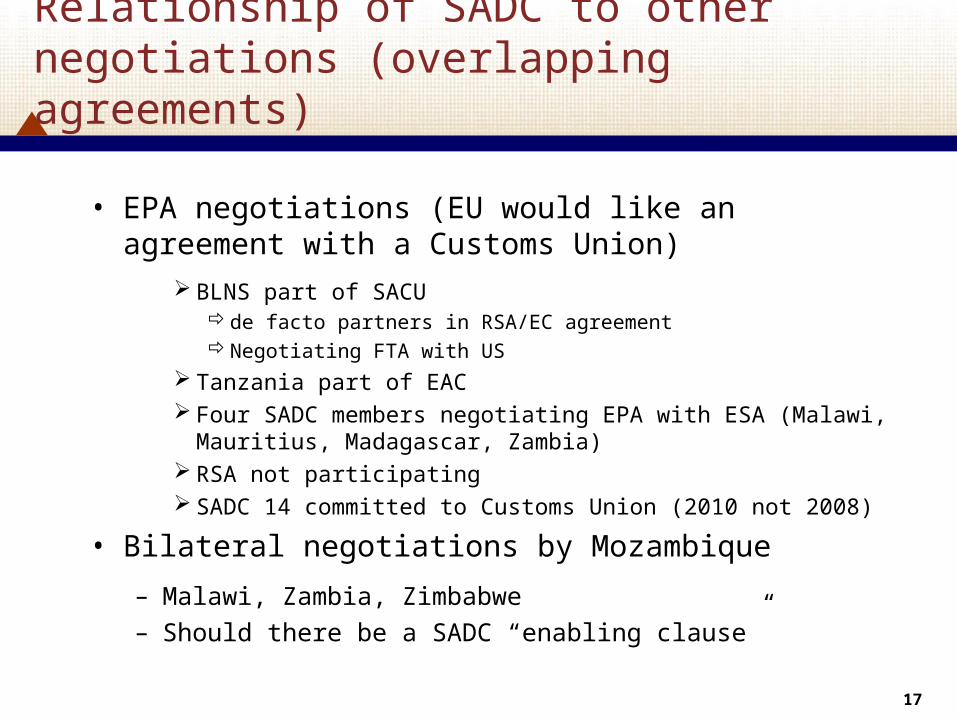
Relationship of SADC to other negotiations (overlapping agreements)
• EPA negotiations (EU would like an agreement with a Customs Union)
BLNS part of SACU de facto partners in RSA/EC agreementNegotiating FTA with US
Tanzania part of EAC Four SADC members negotiating EPA with ESA (Malawi, Mauritius,
Madagascar, Zambia) RSA not participating SADC 14 committed to Customs Union (2010 not 2008)
• Bilateral negotiations by Mozambique
– Malawi, Zambia, Zimbabwe
– Should there be a SADC “enabling clause”
Economic Partnership Agreement
1919
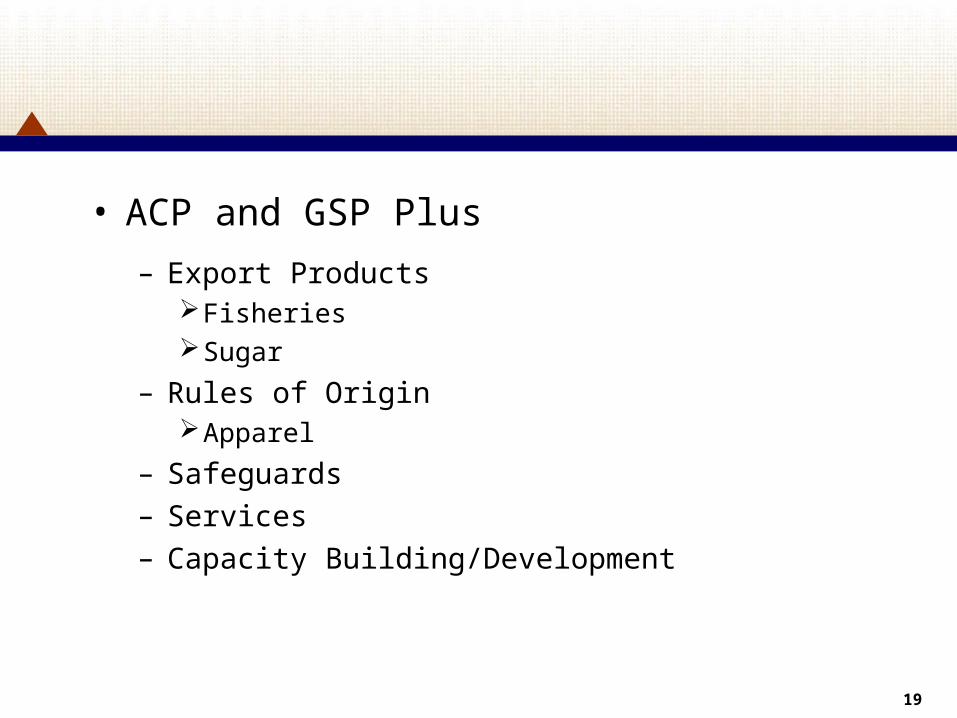
• ACP and GSP Plus
– Export ProductsFisheriesSugar
– Rules of OriginApparel
– Safeguards
– Services
– Capacity Building/Development
2020
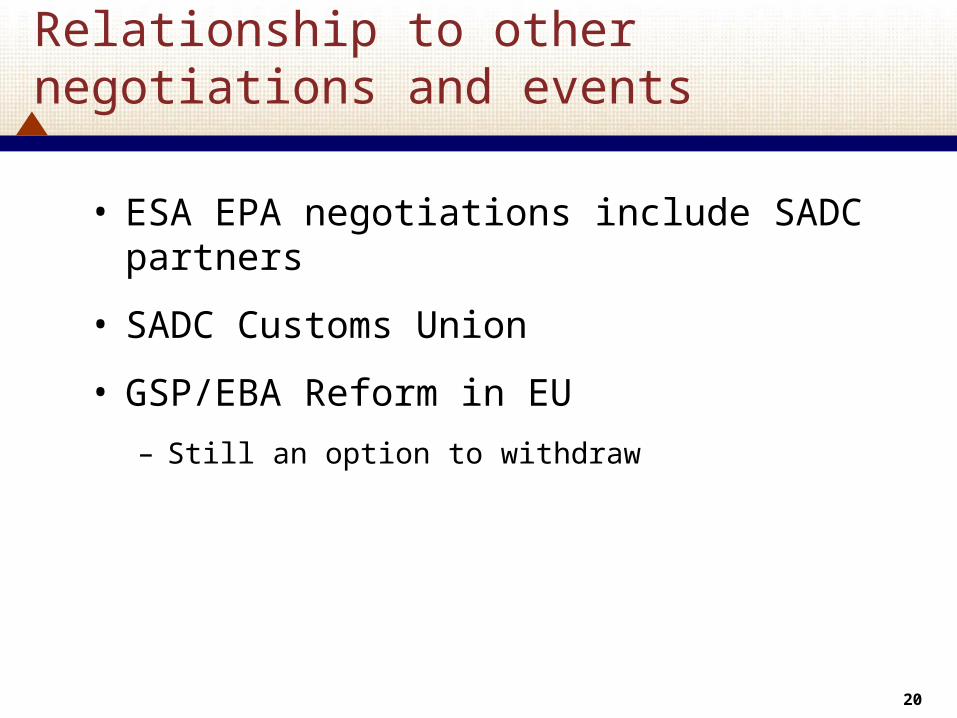
Relationship to other negotiations and events
• ESA EPA negotiations include SADC partners
• SADC Customs Union
• GSP/EBA Reform in EU
– Still an option to withdraw
2121
Mozambique’s assignment
• Negotiating strategy for non-agricultural and fisheries market access
Export Trade
2323
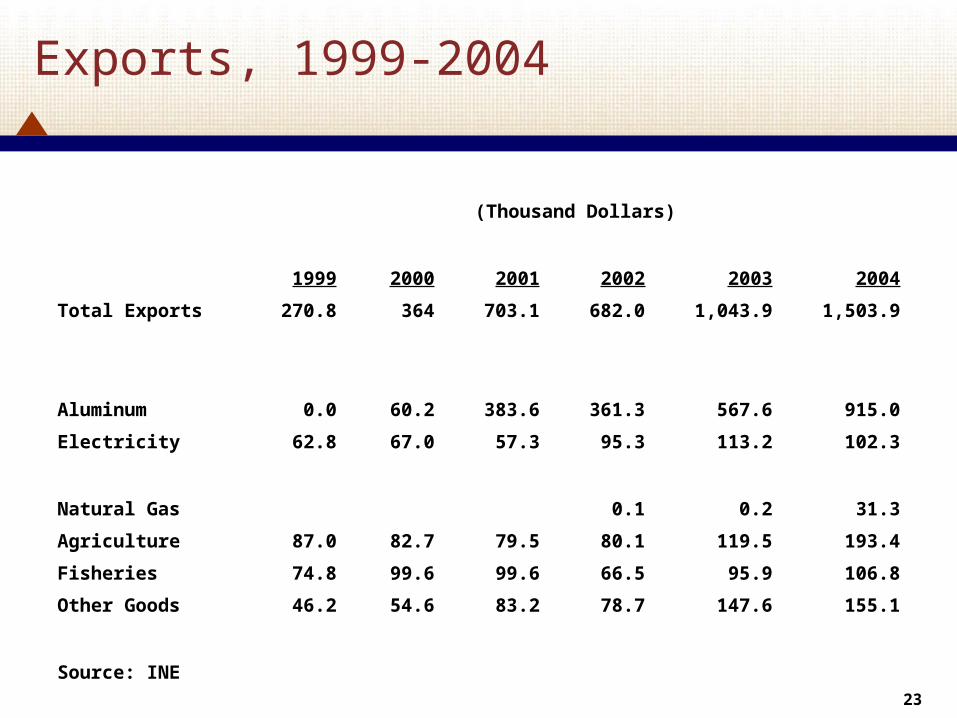
Exports, 1999-2004
(Thousand Dollars)
1999 2000 2001 2002 2003 2004
Total Exports 270.8 364 703.1 682.0 1,043.9 1,503.9
Aluminum 0.0 60.2 383.6 361.3 567.6 915.0
Electricity 62.8 67.0 57.3 95.3 113.2 102.3
Natural Gas 0.1 0.2 31.3
Agriculture 87.0 82.7 79.5 80.1 119.5 193.4
Fisheries 74.8 99.6 99.6 66.5 95.9 106.8
Other Goods 46.2 54.6 83.2 78.7 147.6 155.1
Source: INE
Preferential Arrangements—GSP, EBA, AGOA
2525
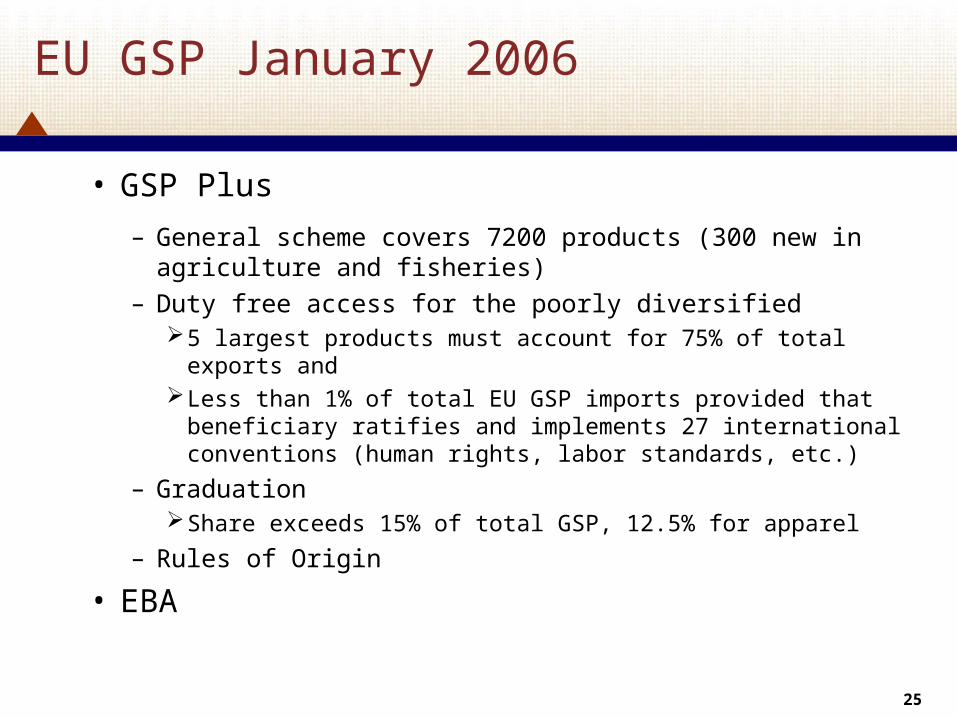
EU GSP January 2006
• GSP Plus
– General scheme covers 7200 products (300 new in agriculture and fisheries)
– Duty free access for the poorly diversified5 largest products must account for 75% of total exports andLess than 1% of total EU GSP imports provided that beneficiary
ratifies and implements 27 international conventions (human rights, labor standards, etc.)
– GraduationShare exceeds 15% of total GSP, 12.5% for apparel
– Rules of Origin
• EBA
2626
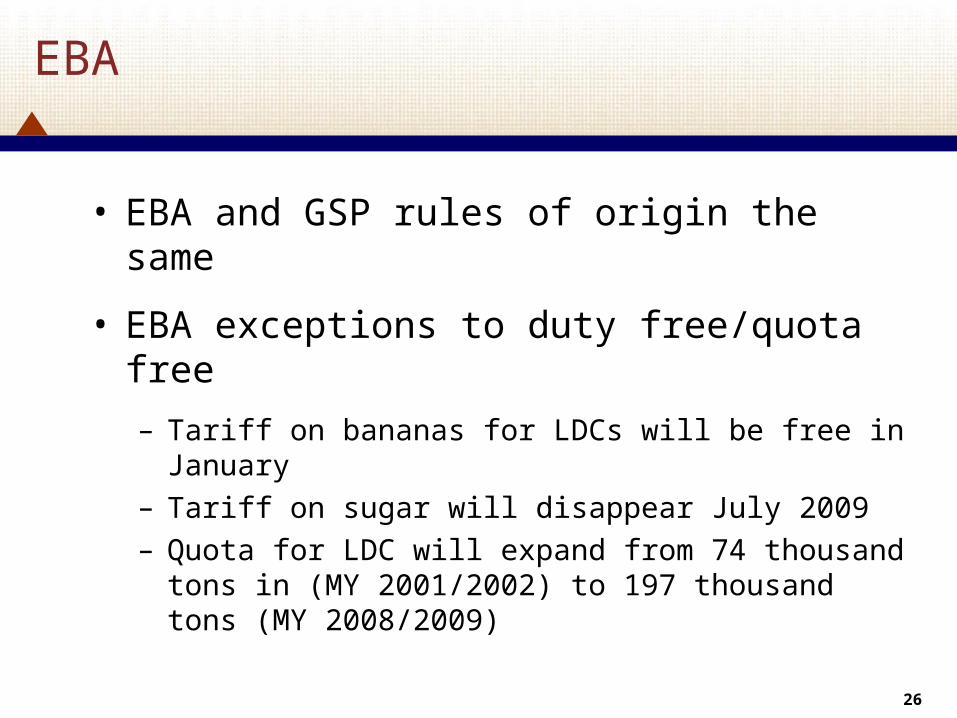
EBA
• EBA and GSP rules of origin the same
• EBA exceptions to duty free/quota free
– Tariff on bananas for LDCs will be free in January
– Tariff on sugar will disappear July 2009
– Quota for LDC will expand from 74 thousand tons in (MY 2001/2002) to 197 thousand tons (MY 2008/2009)
2727
AGOA
• Mozambique participation low and declining
– Apparel declining
– Offset by tobacco appearing ??
Exports, Destinations, and WTO Negotiations
2929
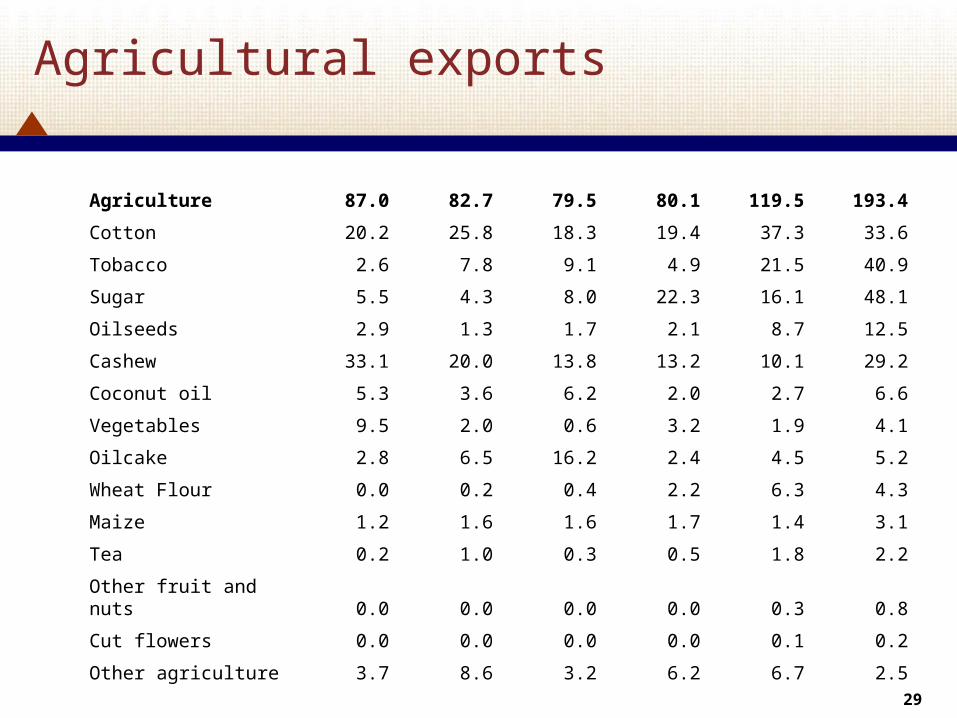
Agricultural exports
Agriculture 87.0 82.7 79.5 80.1 119.5 193.4
Cotton 20.2 25.8 18.3 19.4 37.3 33.6
Tobacco 2.6 7.8 9.1 4.9 21.5 40.9
Sugar 5.5 4.3 8.0 22.3 16.1 48.1
Oilseeds 2.9 1.3 1.7 2.1 8.7 12.5
Cashew 33.1 20.0 13.8 13.2 10.1 29.2
Coconut oil 5.3 3.6 6.2 2.0 2.7 6.6
Vegetables 9.5 2.0 0.6 3.2 1.9 4.1
Oilcake 2.8 6.5 16.2 2.4 4.5 5.2
Wheat Flour 0.0 0.2 0.4 2.2 6.3 4.3
Maize 1.2 1.6 1.6 1.7 1.4 3.1
Tea 0.2 1.0 0.3 0.5 1.8 2.2
Other fruit and nuts 0.0 0.0 0.0 0.0 0.3 0.8
Cut flowers 0.0 0.0 0.0 0.0 0.1 0.2
Other agriculture 3.7 8.6 3.2 6.2 6.7 2.5
3030
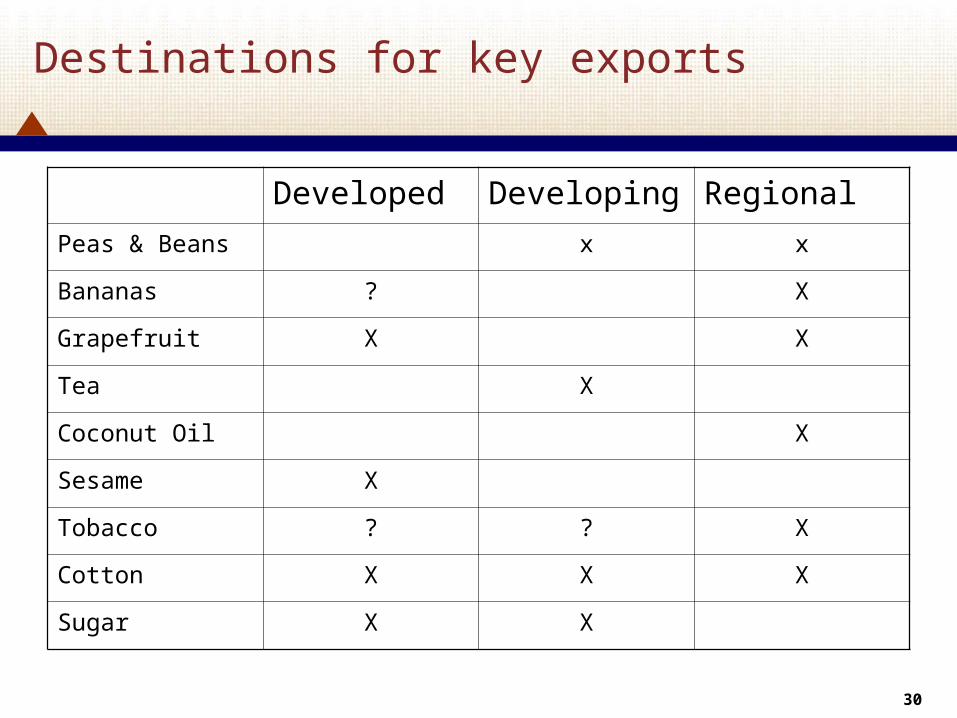
Destinations for key exports
Developed Developing Regional
Peas & Beans x x
Bananas ? X
Grapefruit X X
Tea X
Coconut Oil X
Sesame X
Tobacco ? ? X
Cotton X X X
Sugar X X
3131
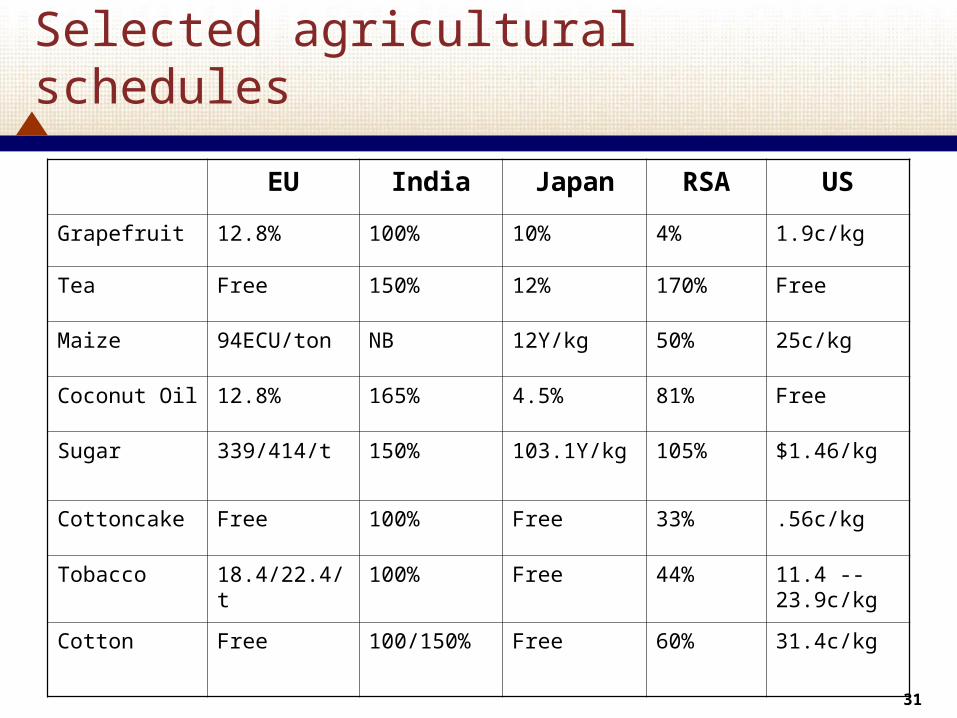
Selected agricultural schedules
EU India Japan RSA US
Grapefruit 12.8% 100% 10% 4% 1.9c/kg
Tea Free 150% 12% 170% Free
Maize 94ECU/ton NB 12Y/kg 50% 25c/kg
Coconut Oil 12.8% 165% 4.5% 81% Free
Sugar 339/414/t 150% 103.1Y/kg 105% $1.46/kg
Cottoncake Free 100% Free 33% .56c/kg
Tobacco 18.4/22.4/t 100% Free 44% 11.4 --23.9c/kg
Cotton Free 100/150% Free 60% 31.4c/kg
3232
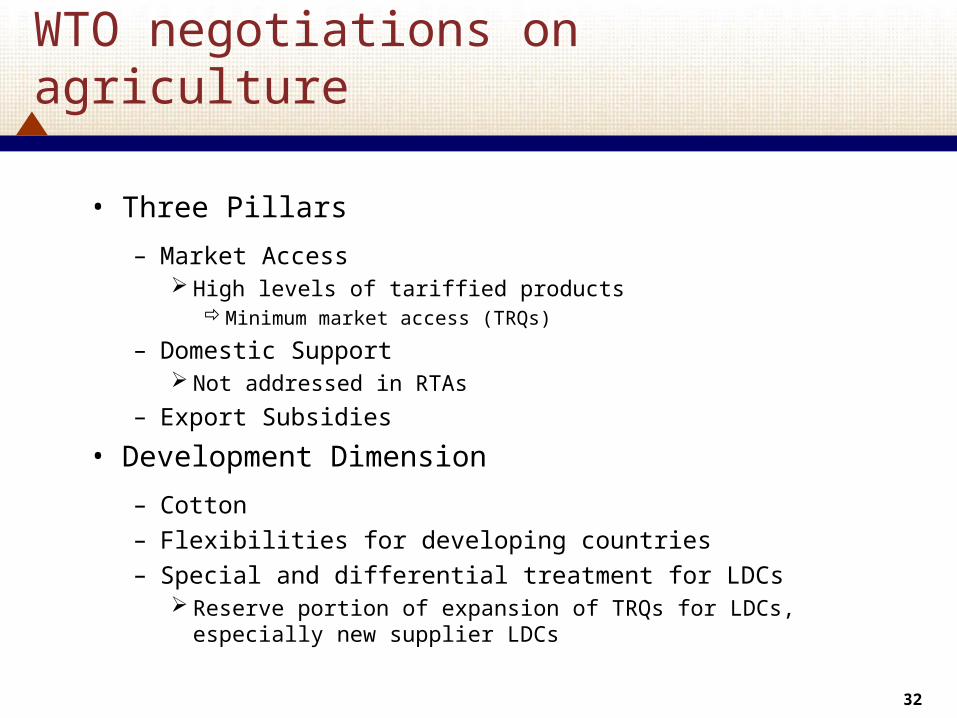
WTO negotiations on agriculture
• Three Pillars
– Market Access High levels of tariffied products
Minimum market access (TRQs)
– Domestic Support Not addressed in RTAs
– Export Subsidies
• Development Dimension
– Cotton– Flexibilities for developing countries– Special and differential treatment for LDCs
Reserve portion of expansion of TRQs for LDCs, especially new supplier LDCs

3333
Exports of non-agricultural goods
Fisheries 74.8 99.6 99.6 66.5 95.9 106.8
Prawns 64.6 91.2 90.2 63.7 75.7 91.7
Other seafood 10.2 8.4 9.4 2.8 20.1 15.1
Other Goods 46.2 54.6 83.2 78.7 147.6 155.1
Wood 9.2 14.3 12.3 17.4 16.0 30.4
unprocessed 7.0 10.8 8.7 14.0 11.0 23.5
processed 2.2 3.5 3.6 3.4 5.0 6.9
Apparel 5.8 6.7 18.1 6.0 13.5 3.9
Coal 0.5 0.4 0.8 0.1 0.5 2.5
Steel containers/cables 0.3 0.4 3.5 0.6 1.0 2.3
3434
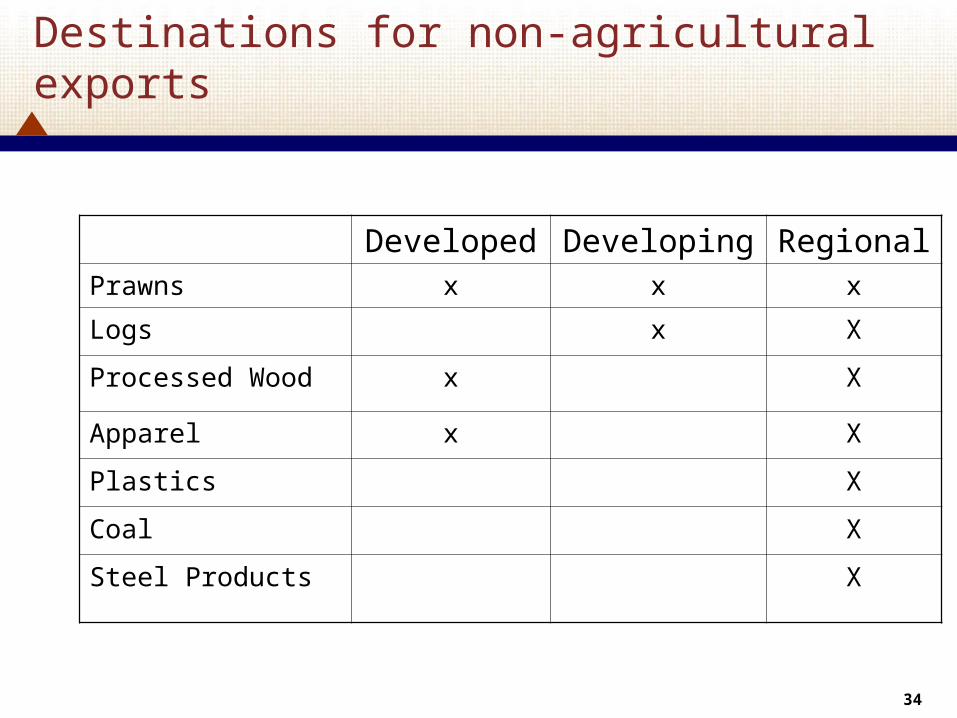
Destinations for non-agricultural exports
Developed Developing RegionalPrawns x x x
Logs x X
Processed Wood x X
Apparel x X
Plastics X
Coal X
Steel Products X
3535
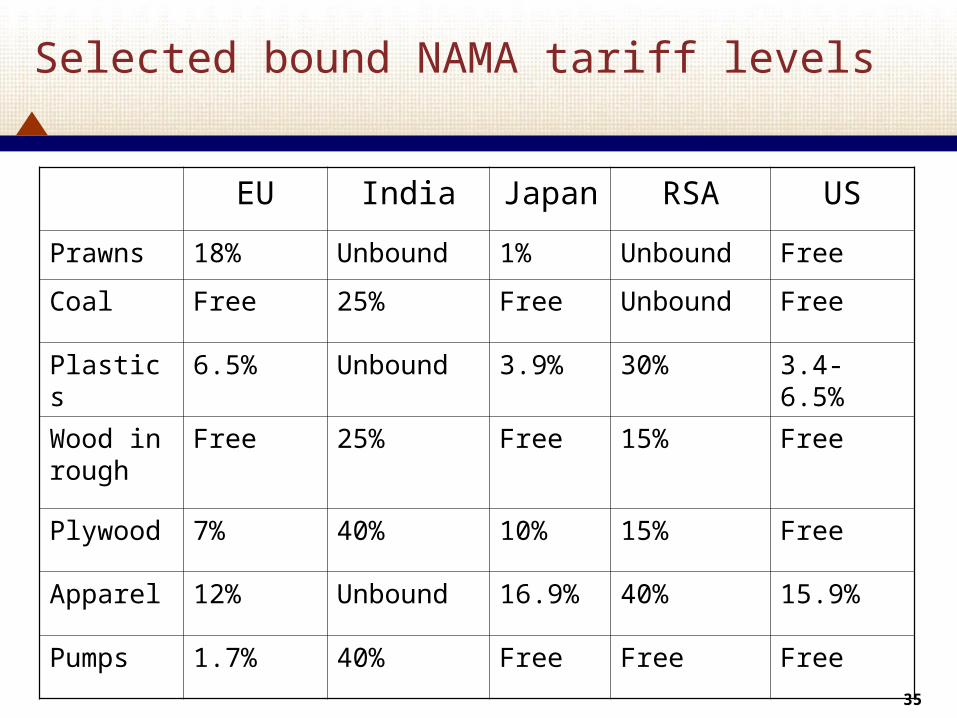
Selected bound NAMA tariff levels
EU India Japan RSA US
Prawns 18% Unbound 1% Unbound Free
Coal Free 25% Free Unbound Free
Plastics 6.5% Unbound 3.9% 30% 3.4-6.5%
Wood in rough
Free 25% Free 15% Free
Plywood 7% 40% 10% 15% Free
Apparel 12% Unbound 16.9% 40% 15.9%
Pumps 1.7% 40% Free Free Free
3636
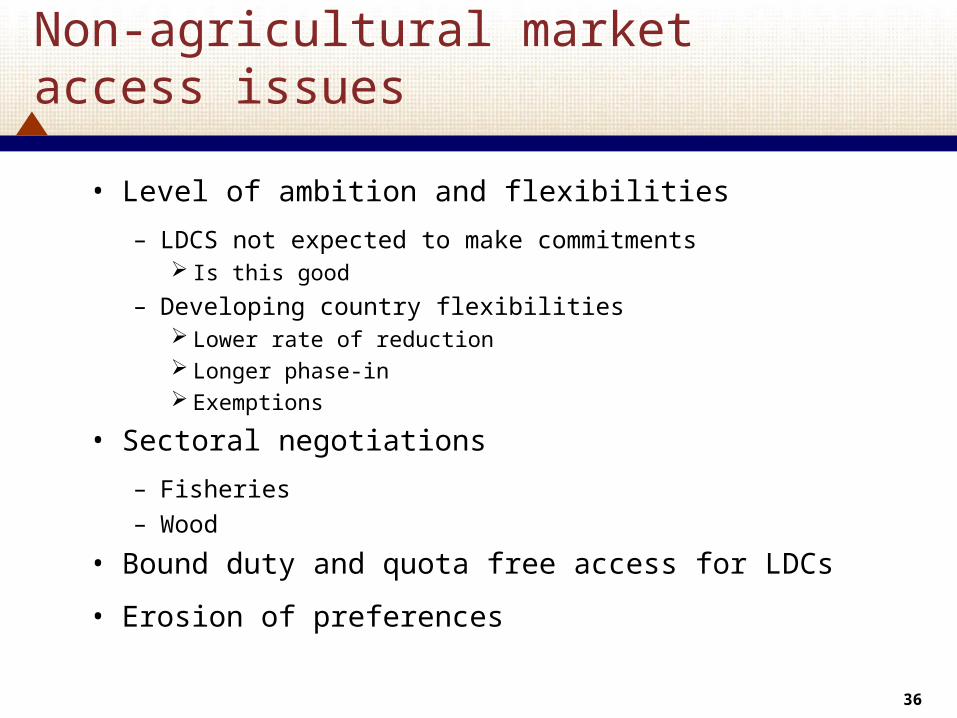
Non-agricultural market access issues
• Level of ambition and flexibilities
– LDCS not expected to make commitments Is this good
– Developing country flexibilities Lower rate of reduction Longer phase-in Exemptions
• Sectoral negotiations
– Fisheries– Wood
• Bound duty and quota free access for LDCs
• Erosion of preferences
3737
Other WTO interests
• Services
– Tourism
– Telecommunications
– Other reforms ???
3838
Why trade facilitation?
• Increase in competitive position
– Equivalent of reducing tariff on inputs between 26.5 points
• Increase in transparency equals increase in predictability
– Uniform application of procedures/regulations– Advance ruling
• Improved investment environment
• Facilitation measures already widely used
– Especially in Asia
3939
Trade facilitation mandate
• Clarify and improve GATT to expedite the movement, release and clearance of goods
– Article V Transit
– Article VIII Fees and Formalities
– Article X Transparency
• Enhance technical assistance/capacity building
– During Negotiations
– Post-Negotiations
• Establish provisions for effective cooperation between customs and other appropriate authorities
• Facilitation issues
• Compliance issues
4040
Trade facilitation mandate (continued)
• Special and Differential Treatment
– Developing countries and LDCs separate
– LDC’s consistent with administrative/institutional capabilities
• Take into account implementation capacities
• Including investment in infrastructure
• Negotiations required to address concerns related to cost implications of proposed measures
4141
All concepts are not new
• Transparency (concepts in the Agreement on Rules of Origin)
– Notification and Publication
– Advance Rulings
– Appeals
4242
Trade facilitation
• Other important proposals/concepts
– Fees and charges
– Reduction in procedures/formalities
– Expedited release in goods Pre-arrival clearances Risk management Post-clearance audits
• Regional agreements
• Transit