regional approaches for improving air quality · regional approaches for improving air quality...
TRANSCRIPT
Regional Approaches for Regional Approaches for Improving Air QualityImproving Air Quality
Second US-China NOx and SO2 Control Workshop
DalianDalian August 2August 2--5, 20055, 2005Dale Evarts, US EPADale Evarts, US EPA
Second USSecond US--China China NOxNOx and SO2 Control Workshopand SO2 Control Workshop
OverviewOverview
Why take a regional approach to managing air Why take a regional approach to managing air pollution?pollution?Regional approaches in the USRegional approaches in the US–– Acid Rain ProgramAcid Rain Program–– Regional Regional NOxNOx ReductionsReductions–– Clean Air Interstate Rule (CAIR)Clean Air Interstate Rule (CAIR)–– Regional Planning OrganizationsRegional Planning Organizations
Illustrate impacts of regional pollution on BeijingIllustrate impacts of regional pollution on BeijingChallenges for the power sectorChallenges for the power sector
Second USSecond US--China China NOxNOx and SO2 Control Workshopand SO2 Control Workshop
Key PointsKey PointsLocal reductions alone cannot achieve desired air quality manageLocal reductions alone cannot achieve desired air quality management ment goalsgoals–– Need to address regional sources at the same timeNeed to address regional sources at the same time–– Not addressing regional sources can lead local areas to delay Not addressing regional sources can lead local areas to delay
implementing controls (cleaning up their own sources) as they implementing controls (cleaning up their own sources) as they ““blameblame””problems on external sourcesproblems on external sources
Use multiUse multi--pollutant approaches to addressing pollution from coalpollutant approaches to addressing pollution from coal--fired fired power sectorpower sector–– Generally more costGenerally more cost--effective to address controls at onceeffective to address controls at once
Need authority to force states to participate and to ensure compNeed authority to force states to participate and to ensure compliance liance with regional approacheswith regional approaches–– Methods for verification (e.g., continuous emission monitors) anMethods for verification (e.g., continuous emission monitors) and strong d strong
penalties for nonpenalties for non--compliancecompliance–– Result: high rate of complianceResult: high rate of compliance
Set performance targets and allow flexibility in how to meet theSet performance targets and allow flexibility in how to meet the targetstargets–– This encourages competition among technologies, fuels, etc.This encourages competition among technologies, fuels, etc.
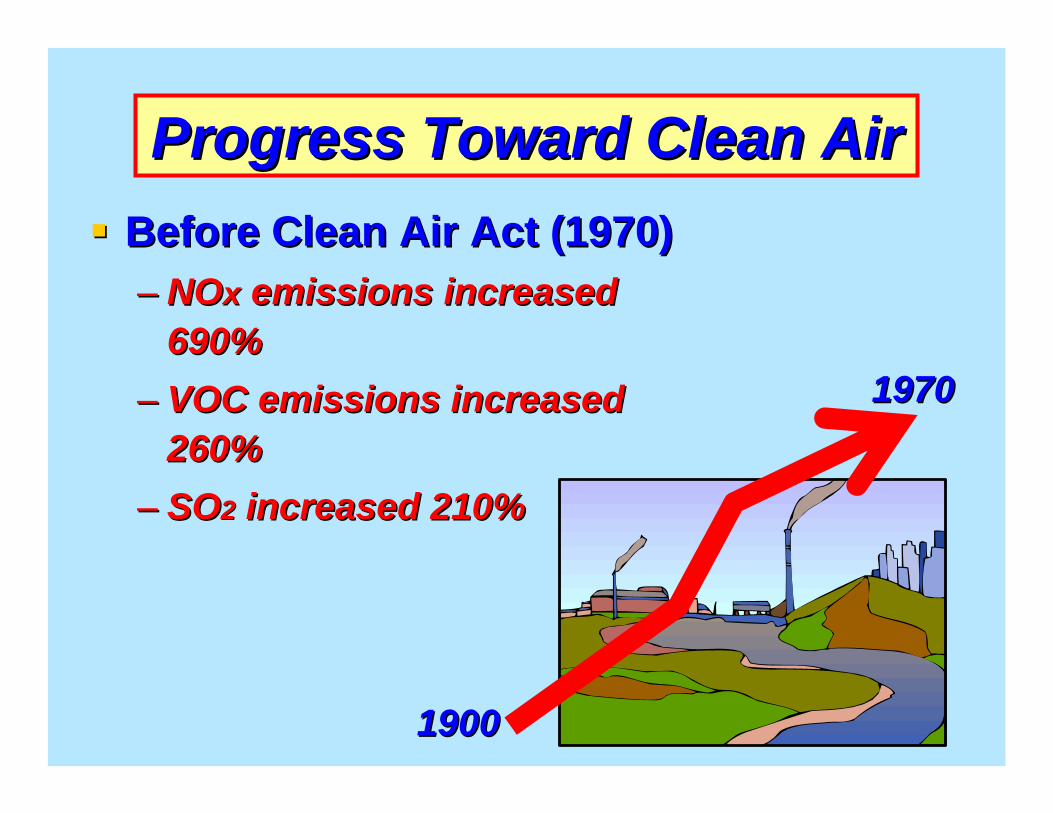
Progress Toward Clean AirProgress Toward Clean AirBefore Clean Air Act (1970)Before Clean Air Act (1970)–– NONOxx emissions increased emissions increased
690%690%–– VOC emissions increased VOC emissions increased
260%260%–– SOSO22 increased 210%increased 210%
19001900
19701970

Second USSecond US--China China NOxNOx and SO2 Control Workshopand SO2 Control Workshop
Why take a regional approach to Why take a regional approach to managing air pollution?managing air pollution?
Air pollution travelsAir pollution travelsWe are all downwind (and upwind) of somebodyWe are all downwind (and upwind) of somebodyRegional air pollution can overwhelm local efforts Regional air pollution can overwhelm local efforts to control urban air pollutionto control urban air pollutionRegional controls can complement local air Regional controls can complement local air pollution reduction measurespollution reduction measures–– And be more costAnd be more cost--effective too!effective too!
We are capable of assessing the sources, We are capable of assessing the sources, transport, fate and effects of air pollution on a transport, fate and effects of air pollution on a local, regional, national and international scalelocal, regional, national and international scale
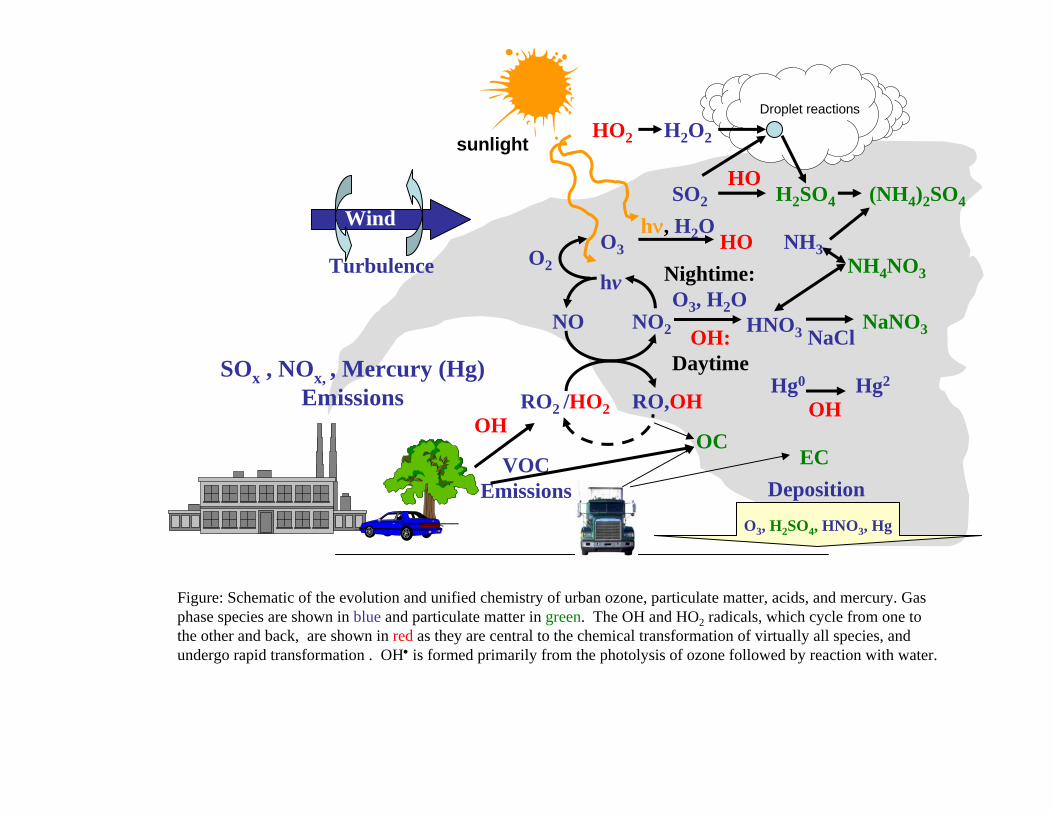
Figure: Schematic of the evolution and unified chemistry of urban ozone, particulate matter, acids, and mercury. Gas phase species are shown in blue and particulate matter in green. The OH and HO2 radicals, which cycle from one to the other and back, are shown in red as they are central to the chemical transformation of virtually all species, and undergo rapid transformation . OH• is formed primarily from the photolysis of ozone followed by reaction with water.
SOx , NOx, , Mercury (Hg)Emissions
VOCEmissions
Wind
DepositionO3, H2SO4, HNO3, Hg
NO
hv
RO2 /HO2 RO,OH
NO2
O2O3
HNO3OH:Daytime
OH
Nightime:O3, H2O
NaClNaNO3
NH3NH4NO3
OC
SO2 H2SO4
EC
(NH4)2SO4
H2O2HO2
hν, H2O HO
Hg0 Hg2
Turbulence
Droplet reactions
OH
HOsunlight
Air Toxics
PM
Acid Rain
Visibility
Ozone
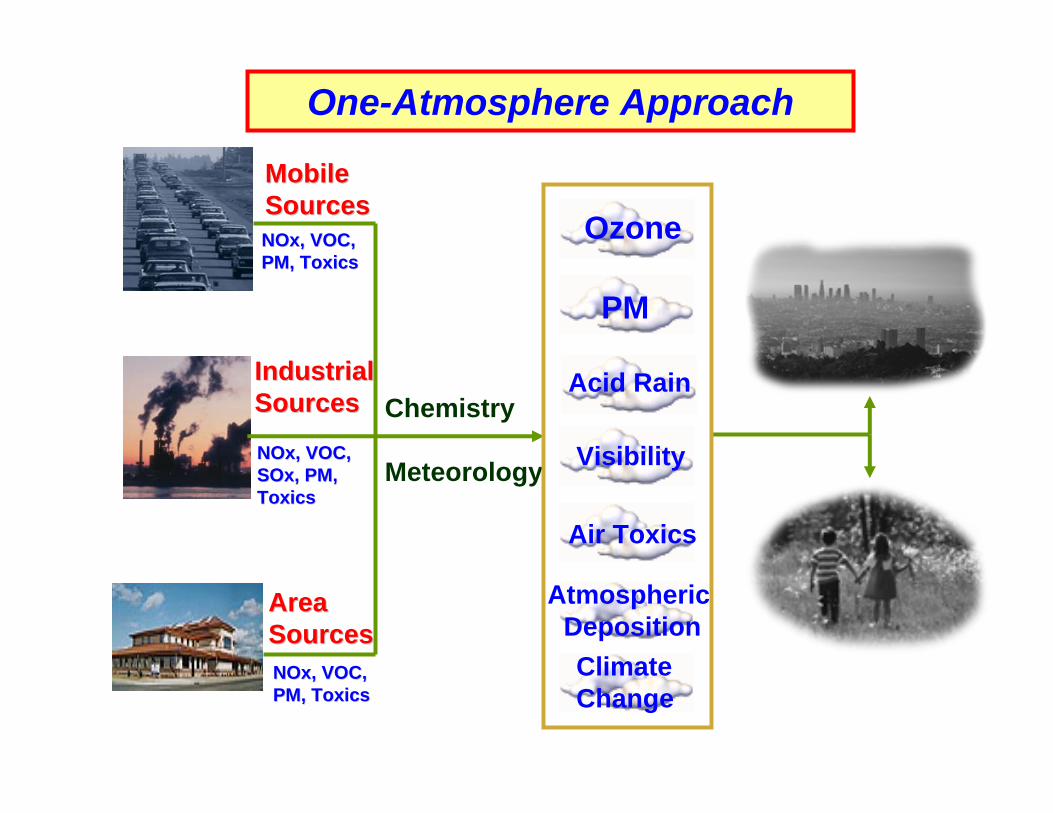
One-Atmosphere Approach
Mobile Mobile SourcesSources
Industrial Industrial SourcesSources
Area Area SourcesSources
(Cars, trucks, planes,boats, etc.)
(Power plants, refineries/chemical plants, etc.)
(Residential, farmingcommercial, biogenic, etc.)
NOx, VOC,NOx, VOC,PM, ToxicsPM, Toxics
NOx, VOC, NOx, VOC, SOx, PM,SOx, PM,ToxicsToxics
NOx, VOC,NOx, VOC,PM, ToxicsPM, Toxics
Chemistry
Meteorology
Atmospheric DepositionClimate Change
Acid Rain(SO42- deposition)
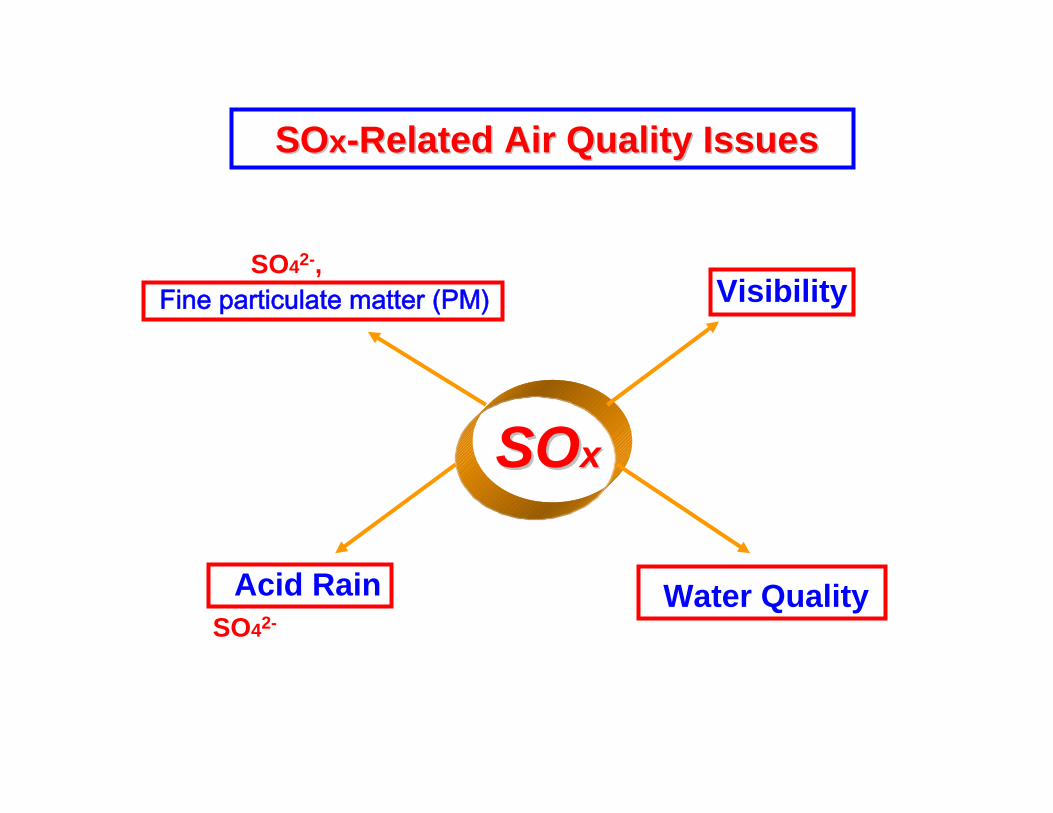
SOSOxx
(Fine PM)Visibility
(SO42-, NH4+)Fine particulate matter (PM)
SOSOxx--Related Air Quality IssuesRelated Air Quality Issues
Water Quality(Lake acidification)

Acid Rain(NO3- deposition)
Water Quality(Nitrogen deposition,
acidification & eutrophication)
NONOxx
Visibility(Fine PM)
(NOx + VOC + hv) -->Ozone
(NO3-, NH4+)Fine particulate matter (PM)
NONOxx--Related Air Quality IssuesRelated Air Quality Issues
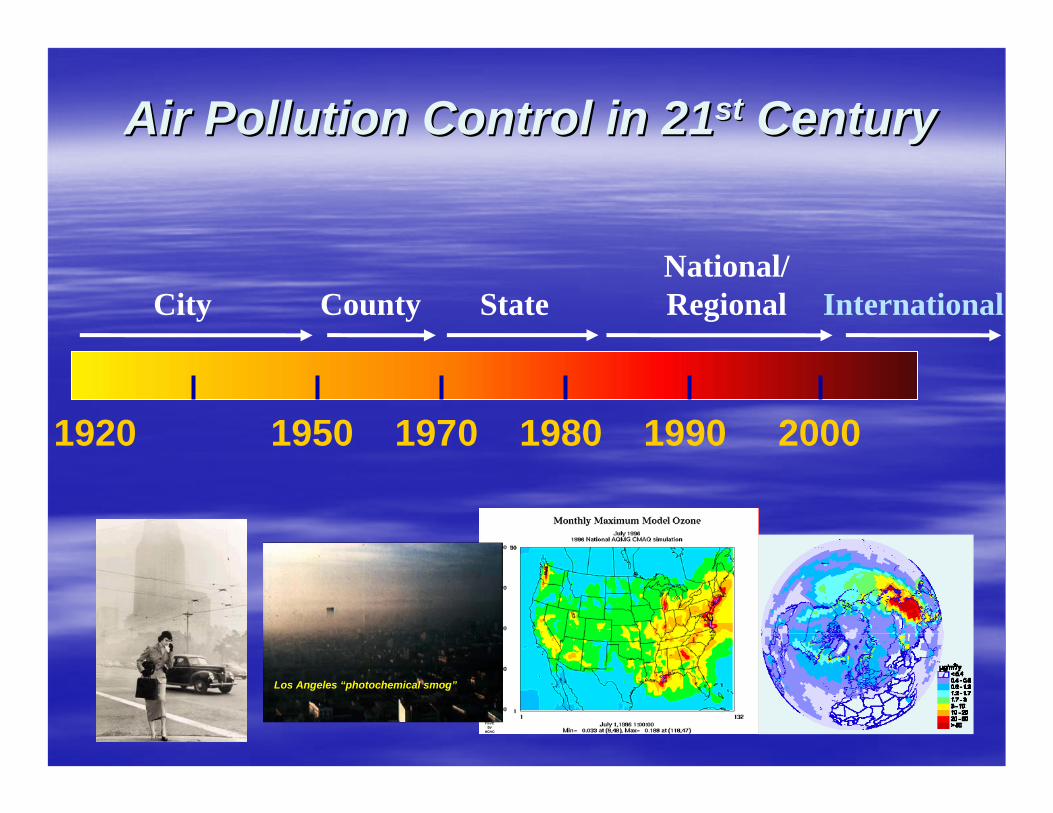
1920 1950 1970 1980 1990 2000
City County StateNational/Regional
Air Pollution Control in 21Air Pollution Control in 21stst CenturyCentury
International
Los Angeles “photochemical smog”
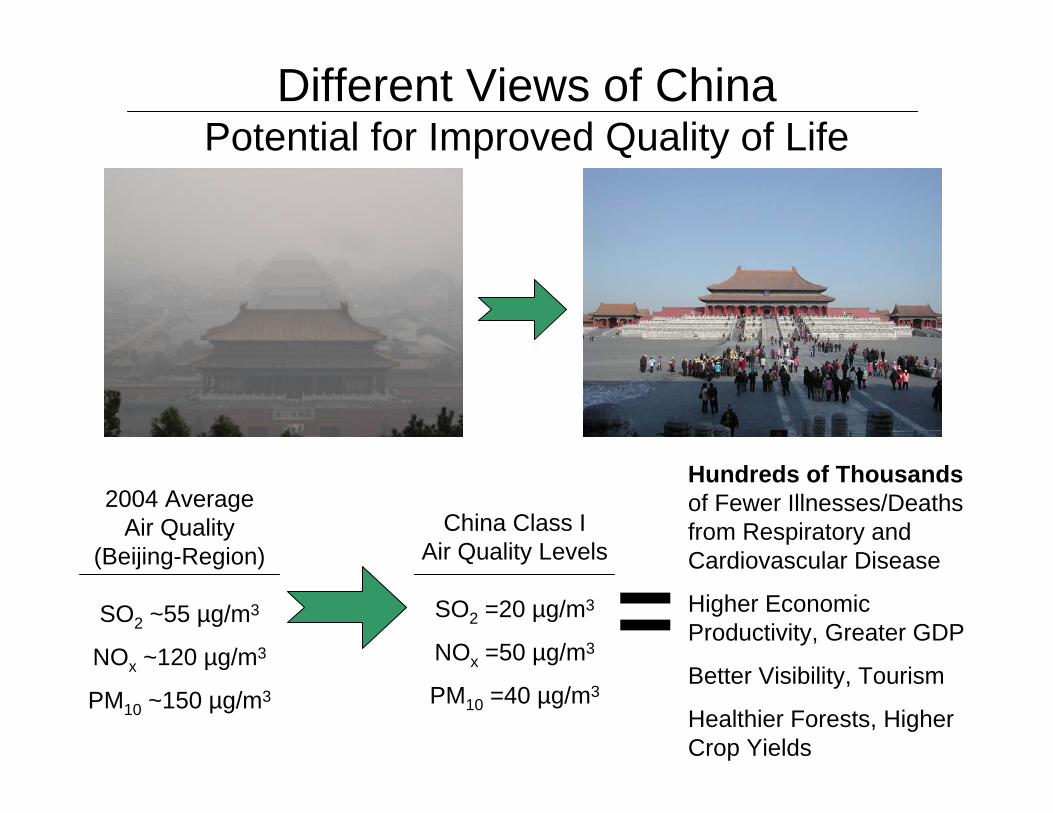
Different Views of ChinaPotential for Improved Quality of Life
2004 AverageAir Quality
(Beijing-Region)
SO2 ~55 µg/m3
NOx ~120 µg/m3
PM10 ~150 µg/m3
=China Class I
Air Quality Levels
SO2 =20 µg/m3
NOx =50 µg/m3
PM10 =40 µg/m3
Hundreds of Thousandsof Fewer Illnesses/Deaths from Respiratory and Cardiovascular Disease
Higher Economic Productivity, Greater GDP
Better Visibility, Tourism
Healthier Forests, Higher Crop Yields
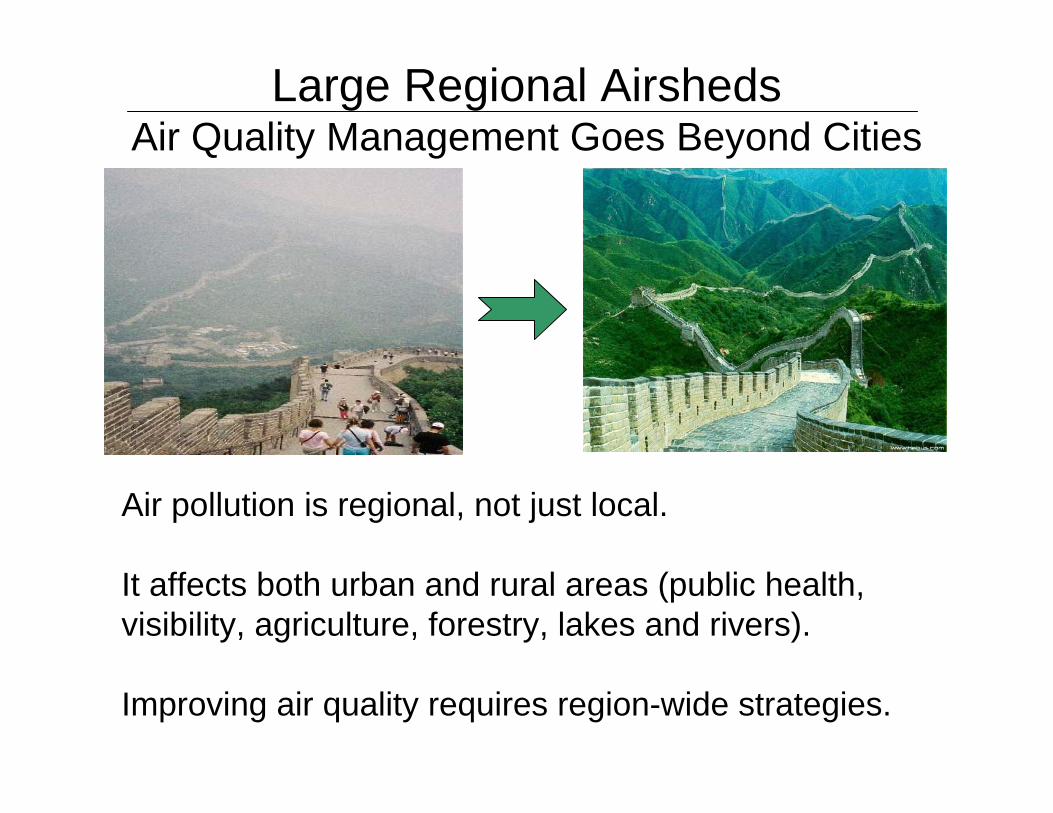
Large Regional AirshedsAir Quality Management Goes Beyond Cities
Air pollution is regional, not just local.
It affects both urban and rural areas (public health, visibility, agriculture, forestry, lakes and rivers).
Improving air quality requires region-wide strategies.
Second USSecond US--China China NOxNOx and SO2 Control Workshopand SO2 Control Workshop
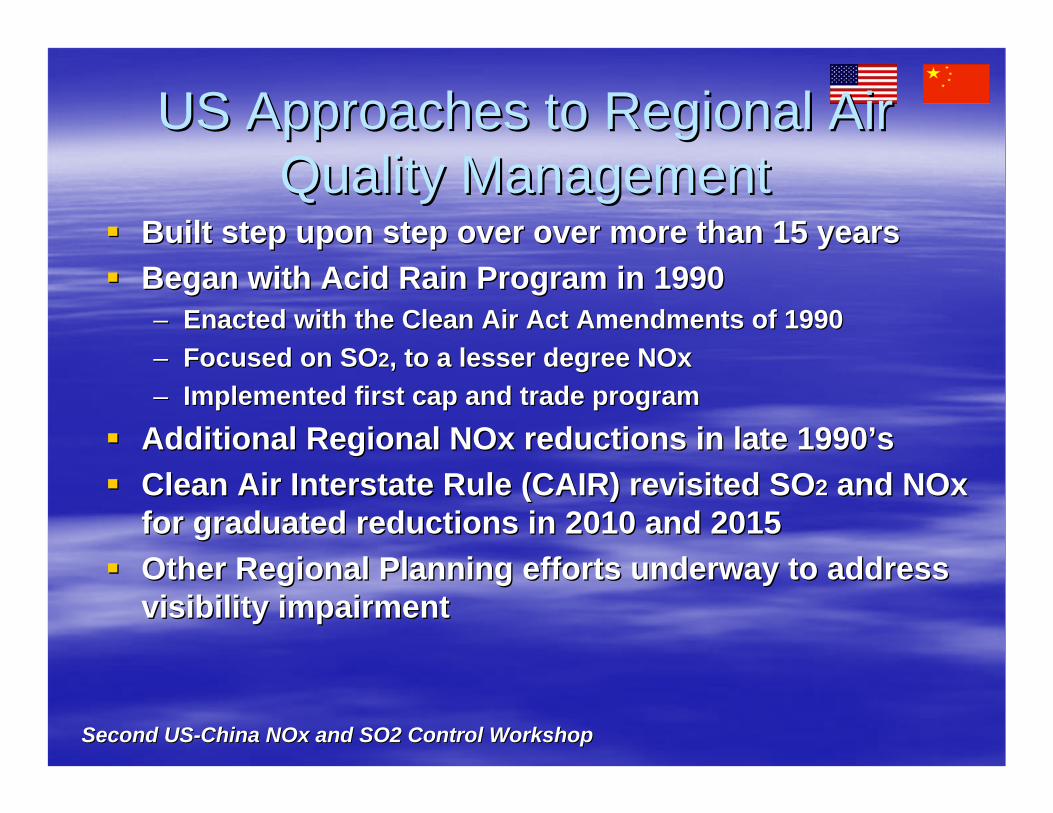
US Approaches to Regional Air US Approaches to Regional Air Quality ManagementQuality Management
Built step upon step over over more than 15 yearsBuilt step upon step over over more than 15 yearsBegan with Acid Rain Program in 1990Began with Acid Rain Program in 1990–– Enacted with the Clean Air Act Amendments of 1990Enacted with the Clean Air Act Amendments of 1990–– Focused on SOFocused on SO22, to a lesser degree , to a lesser degree NOxNOx–– Implemented first cap and trade programImplemented first cap and trade program
Additional Regional Additional Regional NOxNOx reductions in late 1990reductions in late 1990’’ssClean Air Interstate Rule (CAIR) revisited SOClean Air Interstate Rule (CAIR) revisited SO22 and and NOxNOxfor graduated reductions in 2010 and 2015for graduated reductions in 2010 and 2015Other Regional Planning efforts underway to address Other Regional Planning efforts underway to address visibility impairmentvisibility impairment
Second USSecond US--China China NOxNOx and SO2 Control Workshopand SO2 Control Workshop
Acid Rain Program GoalsAcid Rain Program Goals
Achieve environmental benefits through Achieve environmental benefits through reductions in S02 and reductions in S02 and NOxNOx emissions. emissions. Facilitate active trading of allowances and Facilitate active trading of allowances and use of other compliance options to:use of other compliance options to:–– minimize compliance costs, minimize compliance costs, –– maximize economic efficiency, and maximize economic efficiency, and –– allow strong economic growth. allow strong economic growth. Promote pollution prevention and energy Promote pollution prevention and energy efficient strategies and technologies. efficient strategies and technologies.

LOCATION OF ACID RAIN PROGRAM POWER PLANTSLOCATION OF ACID RAIN PROGRAM POWER PLANTS
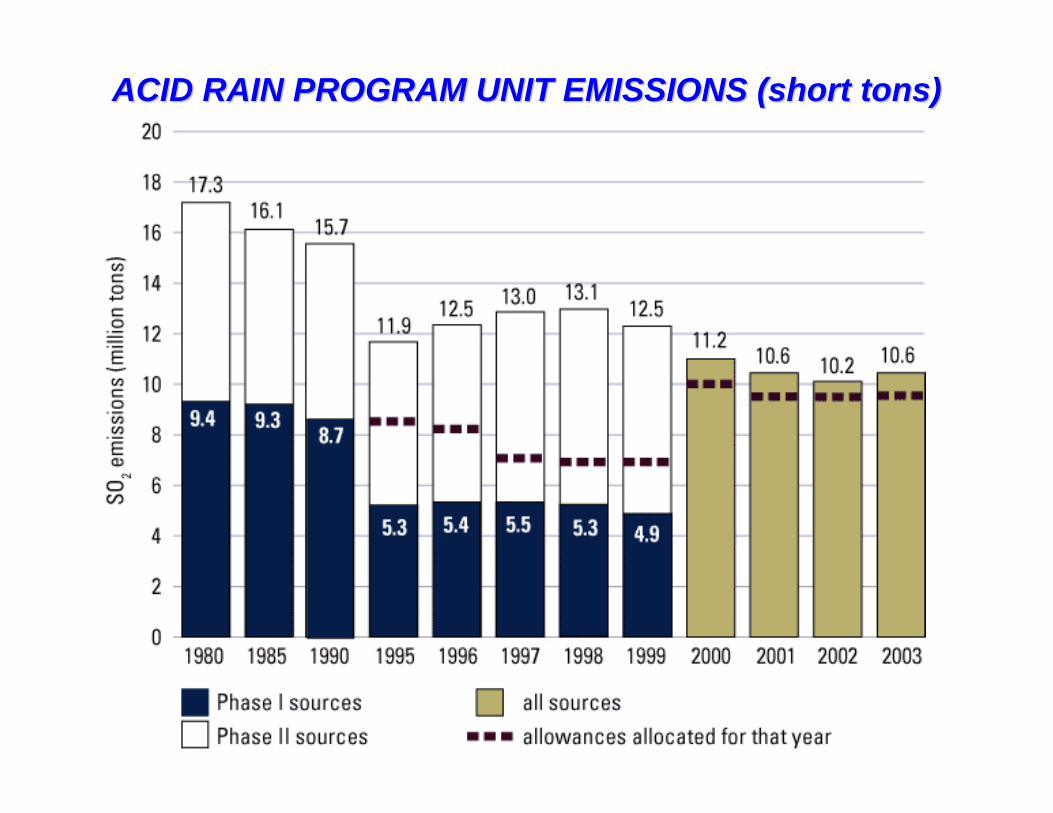
ACID RAIN PROGRAM UNIT EMISSIONS (short tons)ACID RAIN PROGRAM UNIT EMISSIONS (short tons)
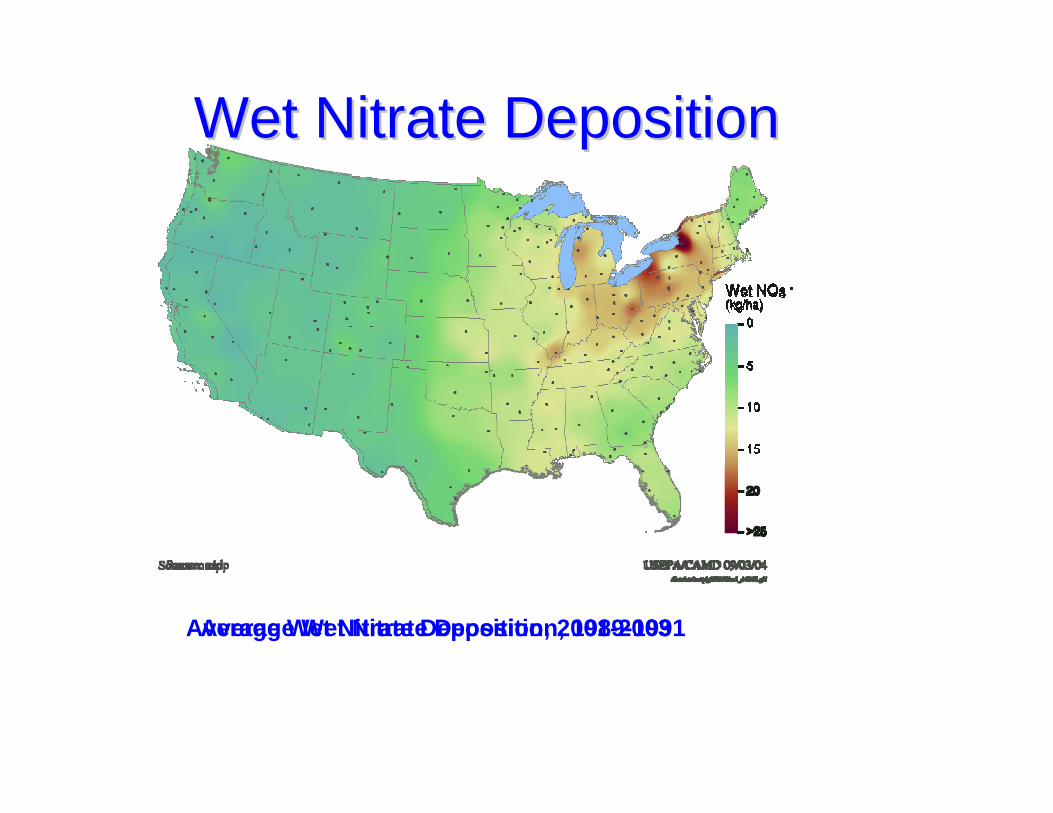
Average Wet Nitrate Deposition, 1989-1991Average Wet Nitrate Deposition, 2001-2003
Wet Nitrate DepositionWet Nitrate Deposition
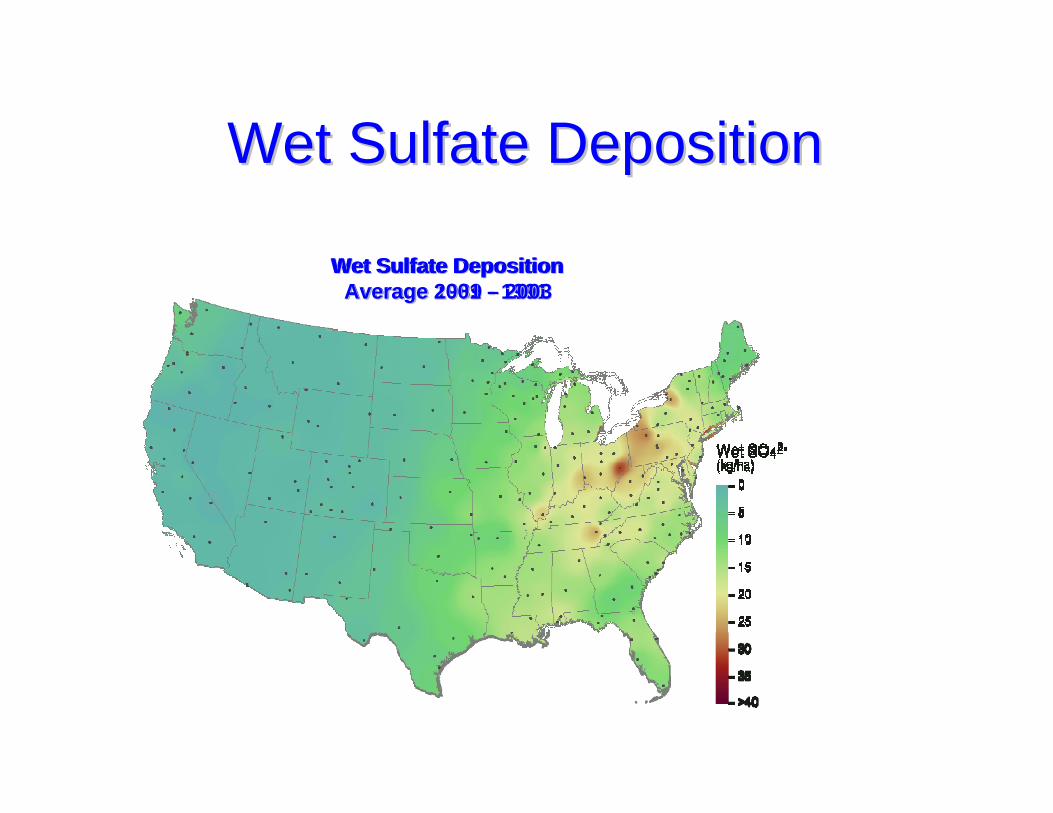
Wet Sulfate Deposition Wet Sulfate Deposition Average 1989 Average 1989 -- 19911991
Wet Sulfate Deposition Wet Sulfate Deposition Average 2001 Average 2001 –– 20032003
Wet Sulfate DepositionWet Sulfate Deposition

Second USSecond US--China China NOxNOx and SO2 Control Workshopand SO2 Control Workshop
Significant Health BenefitsSignificant Health Benefits
Health Benefits in 2010• $50 billion in annual
health benefits / annum
• 29,000 premature deaths avoided / annum
Second USSecond US--China China NOxNOx and SO2 Control Workshopand SO2 Control Workshop
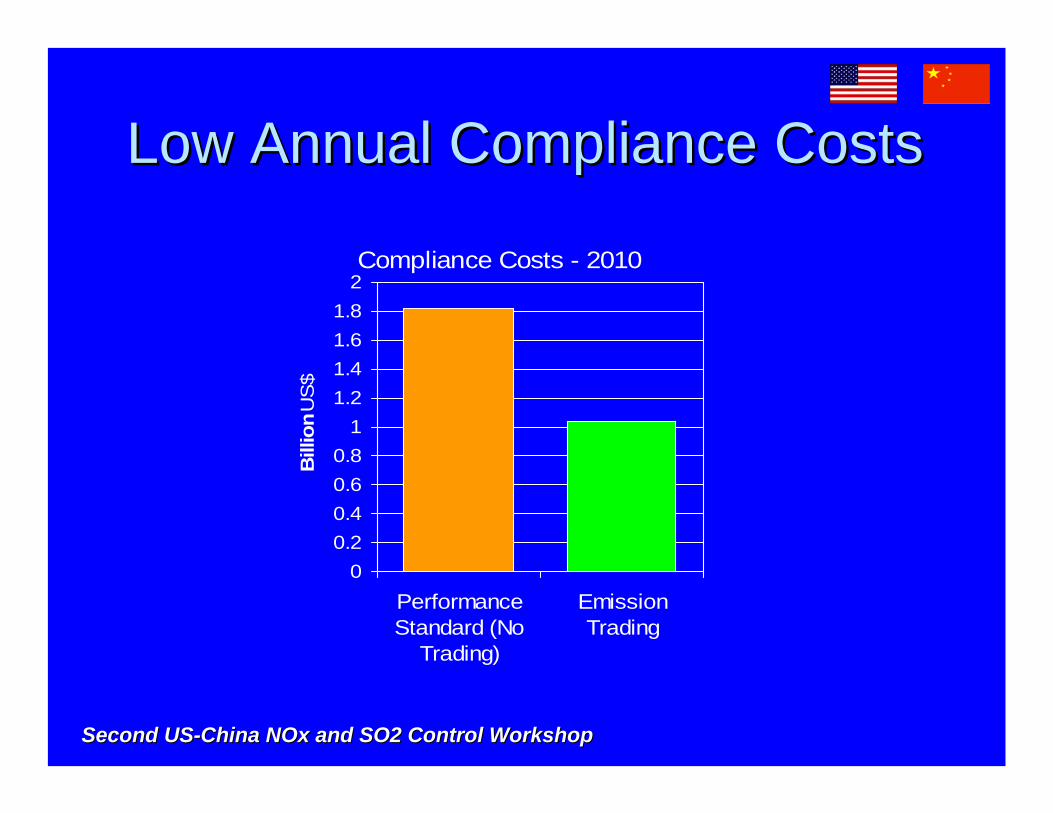
Low Annual Compliance CostsLow Annual Compliance Costs
Compliance Costs - 2010
00.20.40.60.8
11.21.41.61.8
2
PerformanceStandard (No
Trading)
EmissionTrading
Bill
ion
US
$
Second USSecond US--China China NOxNOx and SO2 Control Workshopand SO2 Control Workshop
Regional NOx Reduction RuleRegional NOx Reduction Rule((““NOxNOx SIP CallSIP Call””))
Addressed regional transport of ozone in the Eastern Addressed regional transport of ozone in the Eastern U.S. during the summertime ozone seasonU.S. during the summertime ozone seasonUsed existing legal authorities in the US Clean Air ActUsed existing legal authorities in the US Clean Air ActRequired emission reduction measures to be in place Required emission reduction measures to be in place by May 2004by May 2004Established Established NOxNOx budgets for affected states and budgets for affected states and allowed trading of allowed trading of NOxNOx allowances between sources in allowances between sources in these statesthese statesReduces summertime NOx emissions by about 23% Reduces summertime NOx emissions by about 23% (approximately 900,000 tons) from 1996 levels (mostly (approximately 900,000 tons) from 1996 levels (mostly from the power sector)from the power sector)
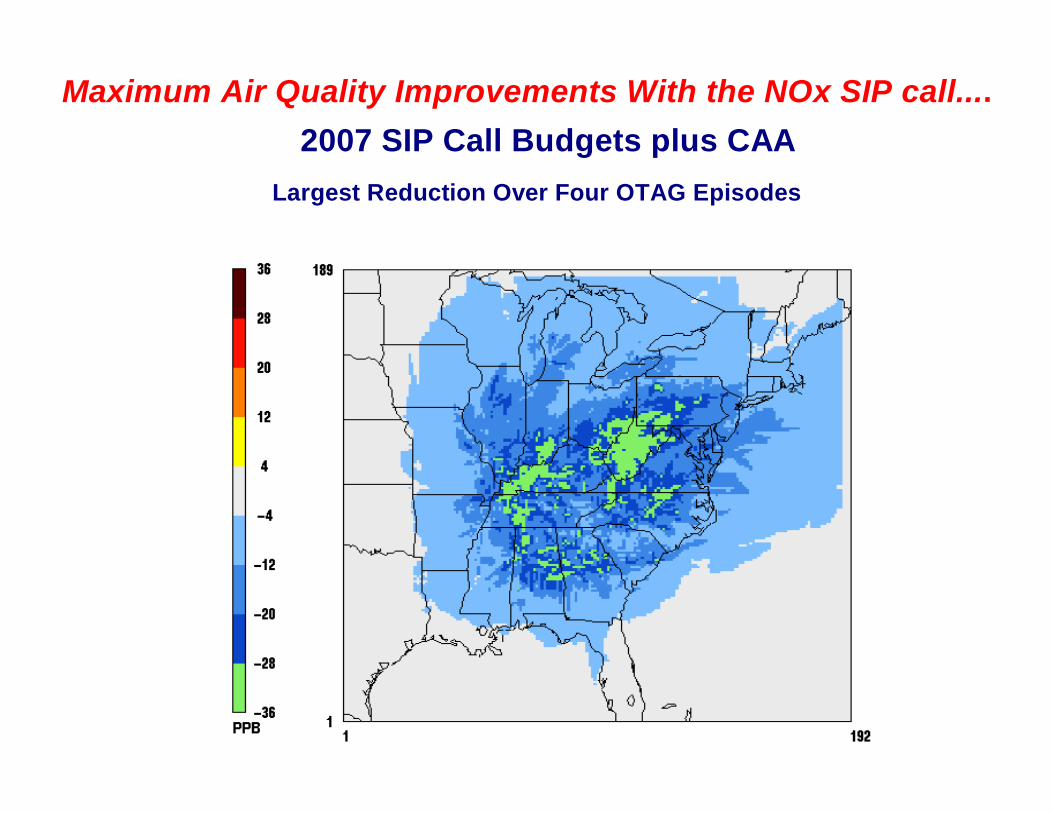
Maximum Air Quality Improvements With the NOx SIP call....2007 SIP Call Budgets plus CAA
Largest Reduction Over Four OTAG Episodes
Second USSecond US--China China NOxNOx and SO2 Control Workshopand SO2 Control Workshop
Clean Air Interstate RuleClean Air Interstate RuleClean Air Interstate Rule (CAIR) will significantly cut emissionClean Air Interstate Rule (CAIR) will significantly cut emissions of s of SOSO22 and and NOxNOx from power plantsfrom power plants
Helps cities and States in the East meet new, more stringent Helps cities and States in the East meet new, more stringent national ambient air quality standards (NAAQS) for ozone and finnational ambient air quality standards (NAAQS) for ozone and fine e particlesparticles
Guarantees substantial benefits for public health and environmenGuarantees substantial benefits for public health and environmentt
Achieves the largest reduction in air pollution in more than a Achieves the largest reduction in air pollution in more than a decadedecade
Provides one of the largest investments in pollution control Provides one of the largest investments in pollution control technology in historytechnology in history
Serves as the single most important step to take now to improve Serves as the single most important step to take now to improve air quality in the U.S.air quality in the U.S.
Ozone and Fine Particle Nonattainment Areas (April 2005)
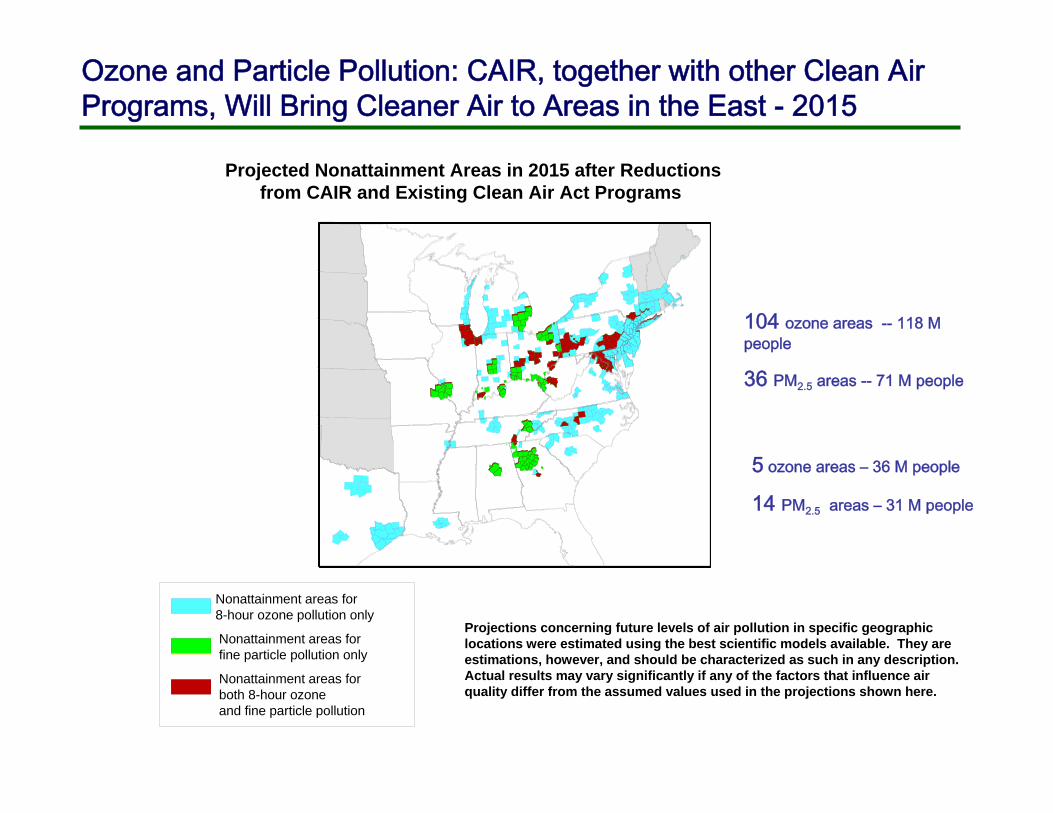
Projections concerning future levels of air pollution in specific geographic locations were estimated using the best scientific models available. They are estimations, however, and should be characterized as such in any description. Actual results may vary significantly if any of the factors that influence air quality differ from the assumed values used in the projections shown here.
Ozone and Particle Pollution: CAIR, together with other Clean Air Programs, Will Bring Cleaner Air to Areas in the East - 2015
Nonattainment areas for both 8-hour ozone and fine particle pollution
Nonattainment areas for fine particle pollution only
Nonattainment areas for 8-hour ozone pollution only
5 ozone areas – 36 M people
14 PM2.5 areas – 31 M people
Projected Nonattainment Areas in 2015 after Reductionsfrom CAIR and Existing Clean Air Act Programs
104 ozone areas -- 118 M people
36 PM2.5 areas -- 71 M people
Second USSecond US--China China NOxNOx and SO2 Control Workshopand SO2 Control Workshop
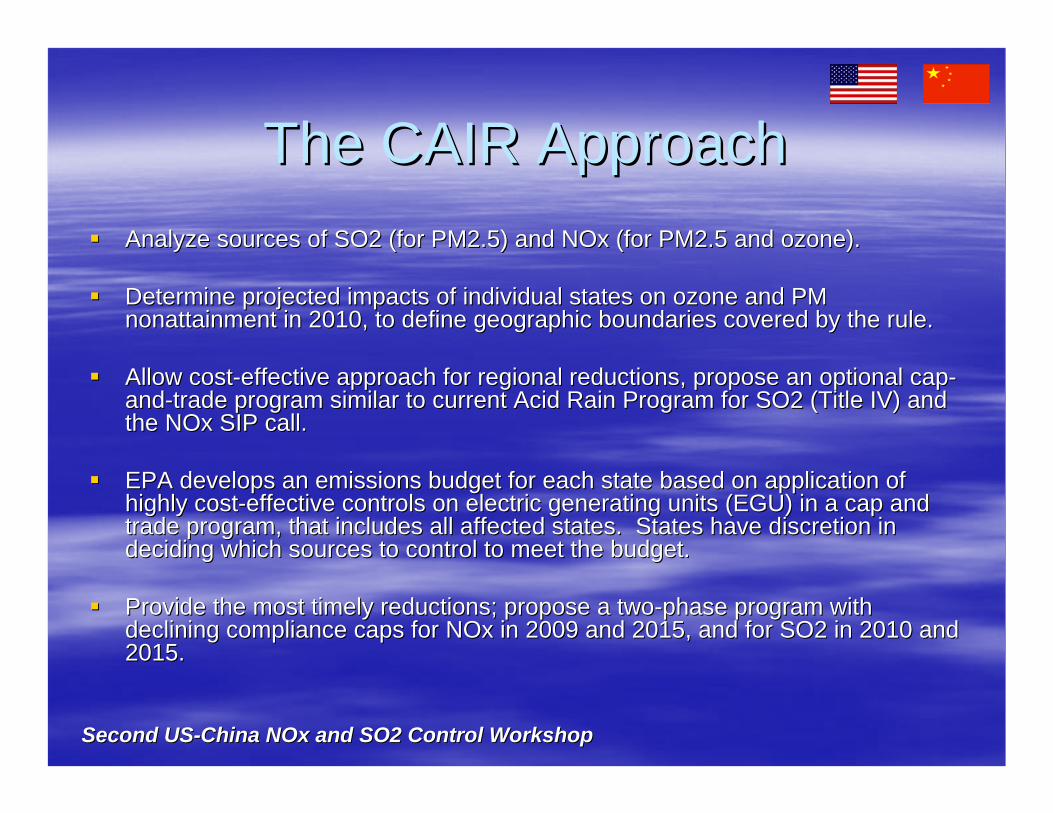
The CAIR ApproachThe CAIR ApproachAnalyze sources of SO2 (for PM2.5) and Analyze sources of SO2 (for PM2.5) and NOxNOx (for PM2.5 and ozone).(for PM2.5 and ozone).
Determine projected impacts of individual states on ozone and PMDetermine projected impacts of individual states on ozone and PMnonattainmentnonattainment in 2010, to define geographic boundaries covered by the rule. in 2010, to define geographic boundaries covered by the rule.
Allow costAllow cost--effective approach for regional reductions, propose an optional effective approach for regional reductions, propose an optional capcap--andand--trade program similar to current Acid Rain Program for SO2 (Titltrade program similar to current Acid Rain Program for SO2 (Title IV) and e IV) and the the NOxNOx SIP call.SIP call.
EPA develops an emissions budget for each state based on applicaEPA develops an emissions budget for each state based on application of tion of highly costhighly cost--effective controls on electric generating units (EGU) in a cap aeffective controls on electric generating units (EGU) in a cap and nd trade program, that includes all affected states. States have dtrade program, that includes all affected states. States have discretion in iscretion in deciding which sources to control to meet the budget.deciding which sources to control to meet the budget.
Provide the most timely reductions; propose a twoProvide the most timely reductions; propose a two--phase program with phase program with declining compliance caps for declining compliance caps for NOxNOx in 2009 and 2015, and for SO2 in 2010 and in 2009 and 2015, and for SO2 in 2010 and 2015. 2015.
Second USSecond US--China China NOxNOx and SO2 Control Workshopand SO2 Control Workshop
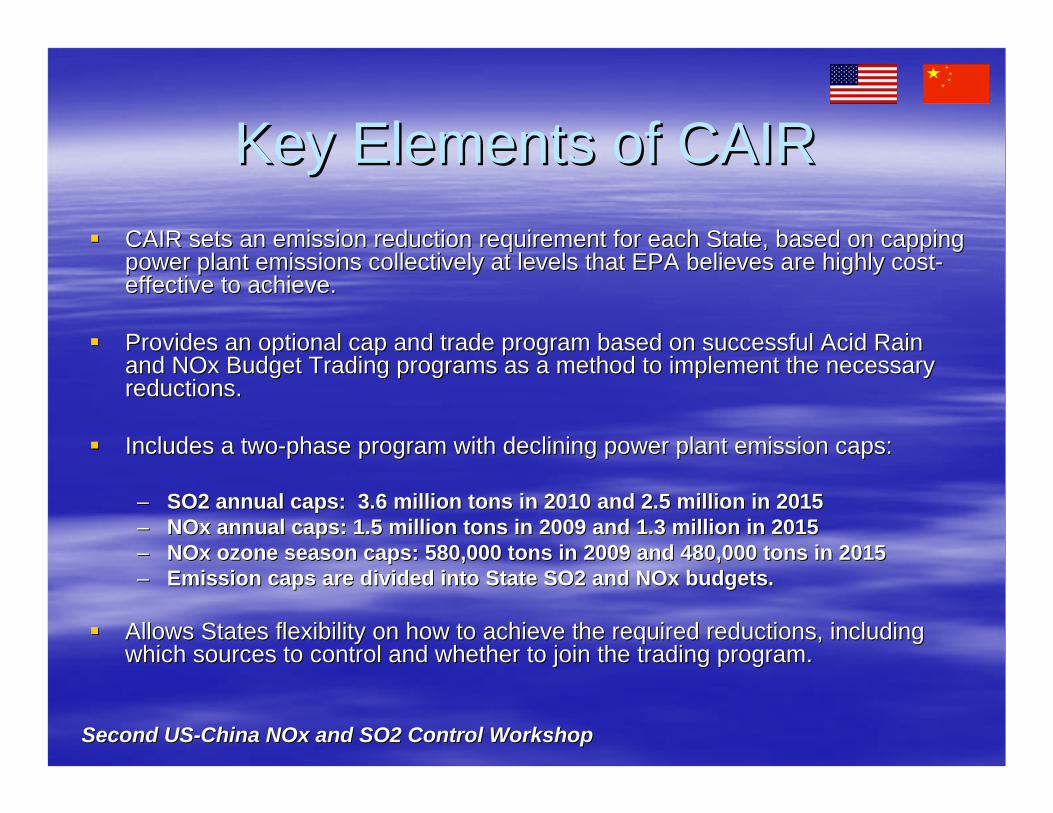
CAIR sets an emission reduction requirement for each State, baseCAIR sets an emission reduction requirement for each State, based on capping d on capping power plant emissions collectively at levels that EPA believes apower plant emissions collectively at levels that EPA believes are highly costre highly cost--effective to achieve.effective to achieve.
Provides an optional cap and trade program based on successful AProvides an optional cap and trade program based on successful Acid Rain cid Rain and and NOxNOx Budget Trading programs as a method to implement the necessary Budget Trading programs as a method to implement the necessary reductions.reductions.
Includes a twoIncludes a two--phase program with declining power plant emission caps:phase program with declining power plant emission caps:
–– SO2 annual caps: 3.6 million tons in 2010 and 2.5 million in 20SO2 annual caps: 3.6 million tons in 2010 and 2.5 million in 201515–– NOxNOx annual caps: 1.5 million tons in 2009 and 1.3 million in 2015annual caps: 1.5 million tons in 2009 and 1.3 million in 2015–– NOxNOx ozone season caps: 580,000 tons in 2009 and 480,000 tons in 201ozone season caps: 580,000 tons in 2009 and 480,000 tons in 20155–– Emission caps are divided into State SO2 and Emission caps are divided into State SO2 and NOxNOx budgets.budgets.
Allows States flexibility on how to achieve the required reductiAllows States flexibility on how to achieve the required reductions, including ons, including which sources to control and whether to join the trading programwhich sources to control and whether to join the trading program..
Key Elements of CAIRKey Elements of CAIR
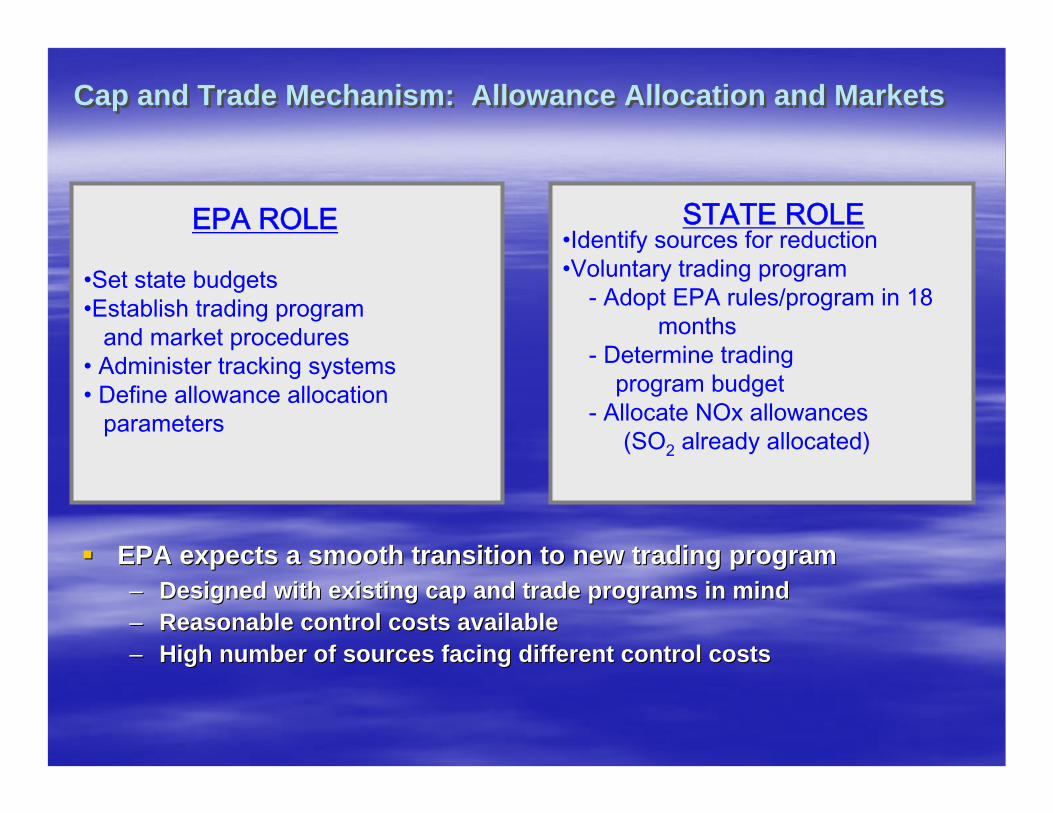
Cap and Trade Mechanism: Allowance Allocation and MarketsCap and Trade Mechanism: Allowance Allocation and Markets
EPA expects a smooth transition to new trading programEPA expects a smooth transition to new trading program–– Designed with existing cap and trade programs in mindDesigned with existing cap and trade programs in mind–– Reasonable control costs availableReasonable control costs available–– High number of sources facing different control costsHigh number of sources facing different control costs
•Set state budgets•Establish trading program
and market procedures• Administer tracking systems • Define allowance allocation
parameters
•Identify sources for reduction•Voluntary trading program
- Adopt EPA rules/program in 18 months
- Determine trading program budget
- Allocate NOx allowances(SO2 already allocated)
EPA ROLE STATE ROLE
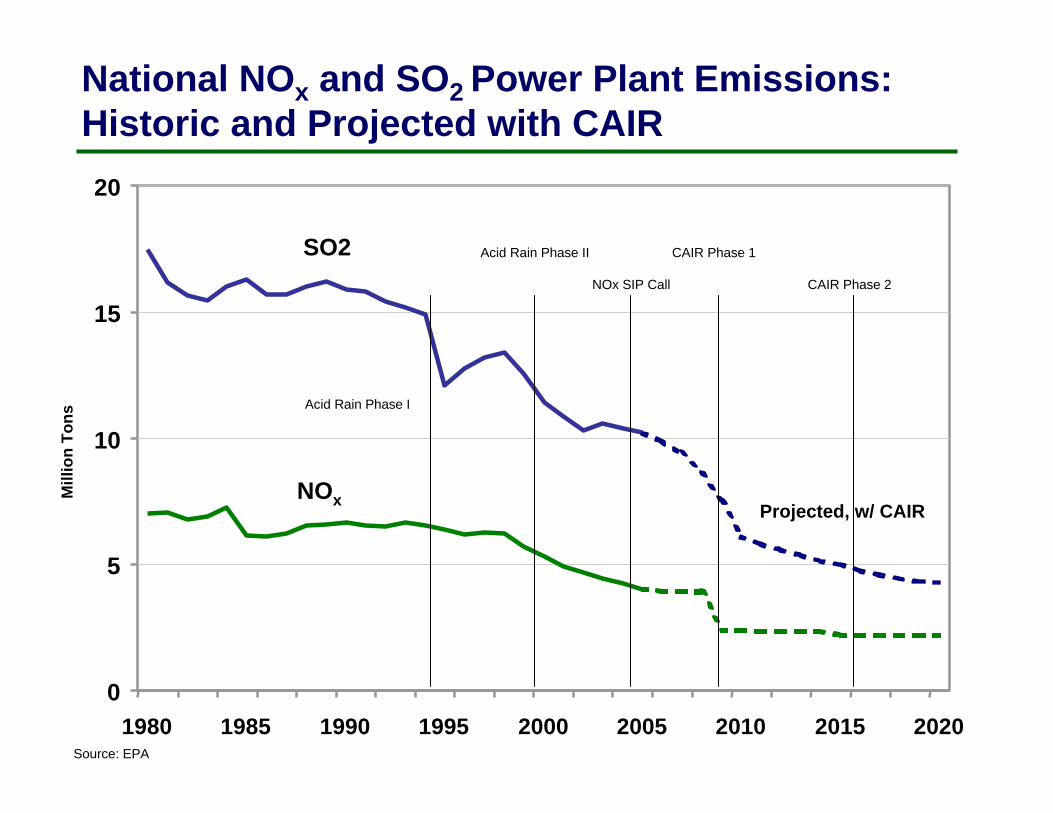
National NOx and SO2 Power Plant Emissions:Historic and Projected with CAIR
Source: EPA
0
5
10
15
20
1980 1985 1990 1995 2000 2005 2010 2015 2020
Mill
ion
Tons
NOx Projected, w/ CAIR
Acid Rain Phase I
Acid Rain Phase II
NOx SIP Call
CAIR Phase 1
CAIR Phase 2
SO2
0
2
4
6
8
10
12
14
16
18
20
1980 1990 2000 2010 2020
Mill
ion
Tons
$-
$2,000
$4,000
$6,000
$8,000
$10,000
$12,000
$14,000
$16,000
$18,000
$20,000
Billion ($1999)
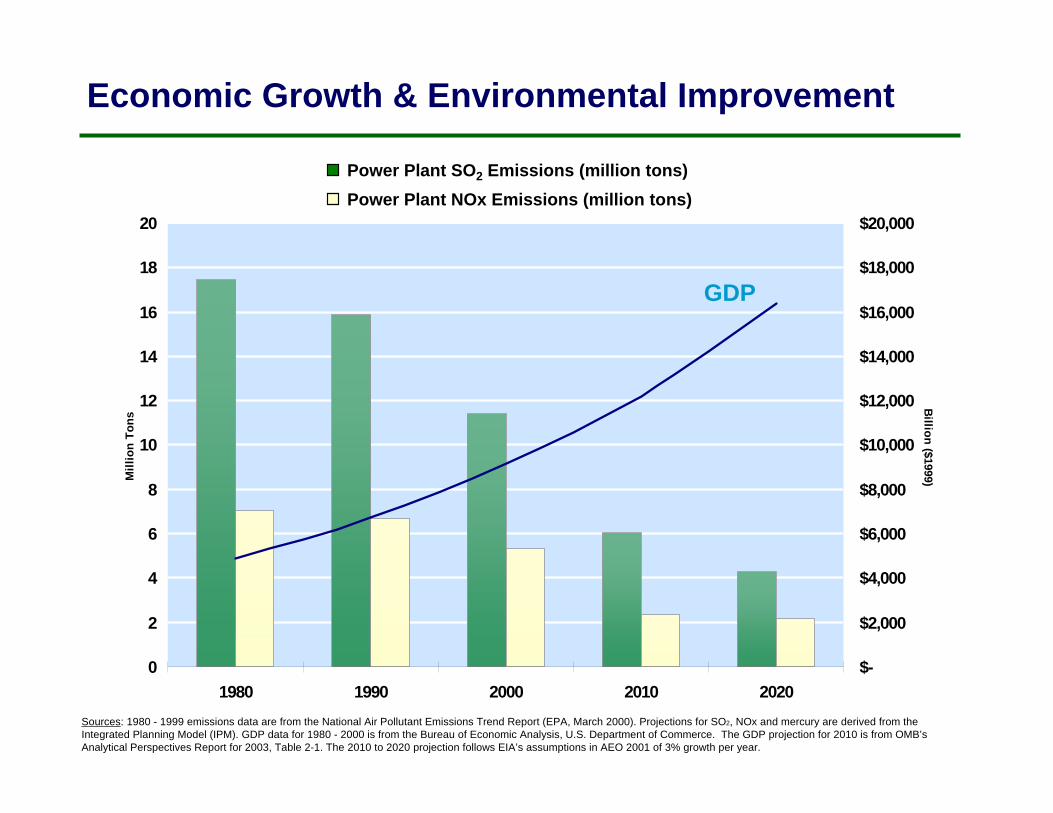
Economic Growth & Environmental Improvement
Sources: 1980 - 1999 emissions data are from the National Air Pollutant Emissions Trend Report (EPA, March 2000). Projections for SO2, NOx and mercury are derived from the Integrated Planning Model (IPM). GDP data for 1980 - 2000 is from the Bureau of Economic Analysis, U.S. Department of Commerce. The GDP projection for 2010 is from OMB’s Analytical Perspectives Report for 2003, Table 2-1. The 2010 to 2020 projection follows EIA’s assumptions in AEO 2001 of 3% growth per year.
Power Plant SO2 Emissions (million tons)Power Plant NOx Emissions (million tons)
GDP
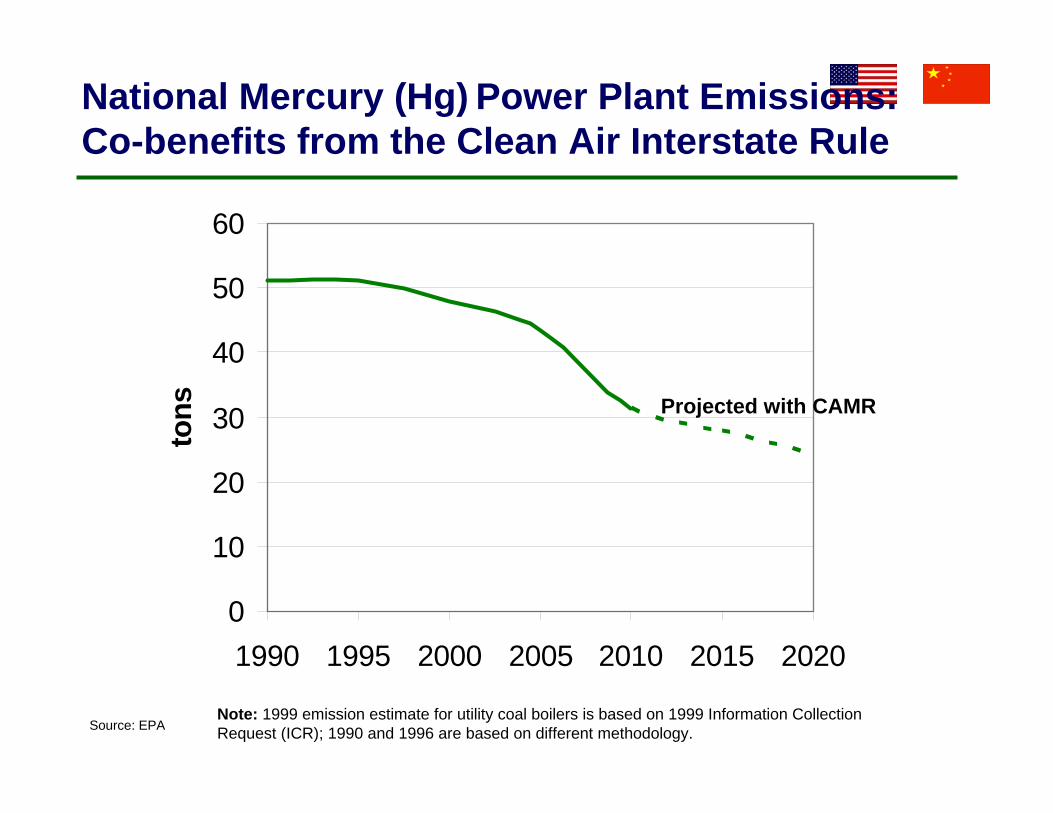
National Mercury (Hg) Power Plant Emissions:Co-benefits from the Clean Air Interstate Rule
Source: EPANote: 1999 emission estimate for utility coal boilers is based on 1999 Information Collection Request (ICR); 1990 and 1996 are based on different methodology.
0
10
20
30
40
50
60
1990 1995 2000 2005 2010 2015 2020
tons Projected with CAMR
Second USSecond US--China China NOxNOx and SO2 Control Workshopand SO2 Control Workshop
Regional HazeRegional HazeRegional haze can originate from sources located Regional haze can originate from sources located across broad geographic areasacross broad geographic areasEPA has encouraged the States and Tribes across EPA has encouraged the States and Tribes across the U.S. to address visibility impairment from a the U.S. to address visibility impairment from a regional perspectiveregional perspectiveRegional Planning Organizations (Regional Planning Organizations (RPORPO’’ss):):–– Evaluate technical information to better understand how Evaluate technical information to better understand how
their States and Tribes impact national park and their States and Tribes impact national park and wilderness areas (Class I areas) across the country, and wilderness areas (Class I areas) across the country, and
–– Pursue the development of regional strategies to reduce Pursue the development of regional strategies to reduce emissions of particulate matter and other pollutants emissions of particulate matter and other pollutants leading to regional hazeleading to regional haze

Visibility Impairment
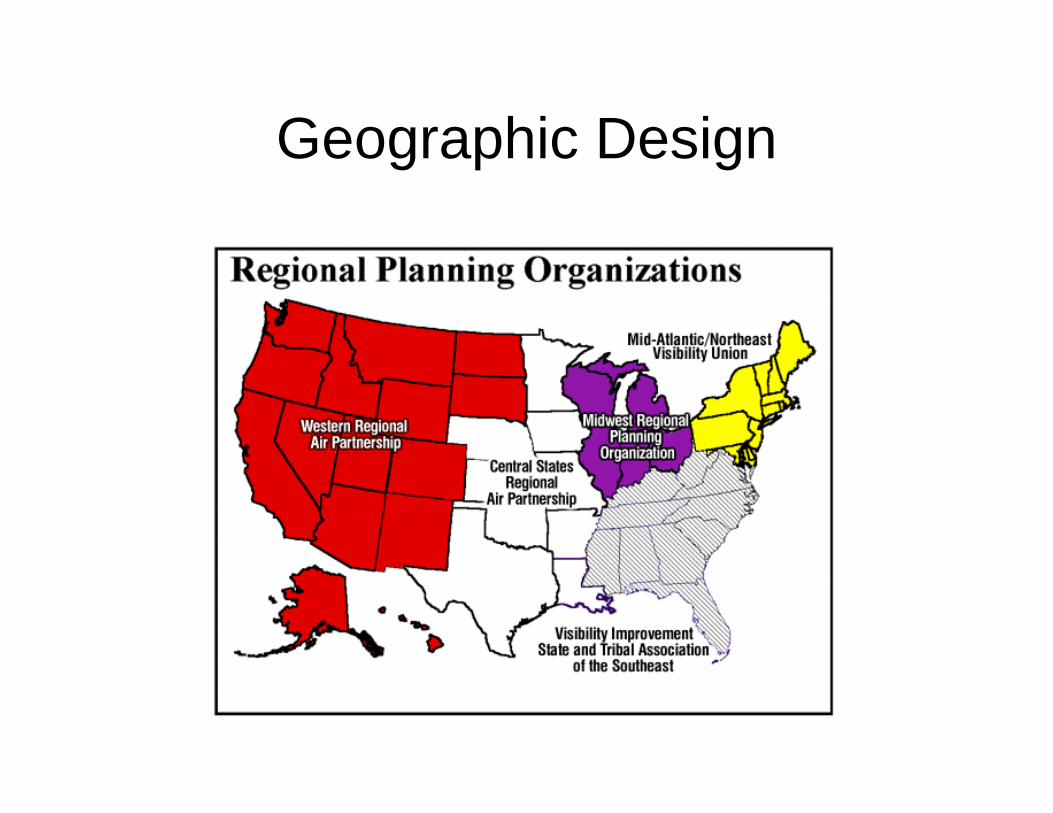
Geographic Design
Second USSecond US--China China NOxNOx and SO2 Control Workshopand SO2 Control Workshop
Impacts on Beijing from Regional TransportImpacts on Beijing from Regional Transport
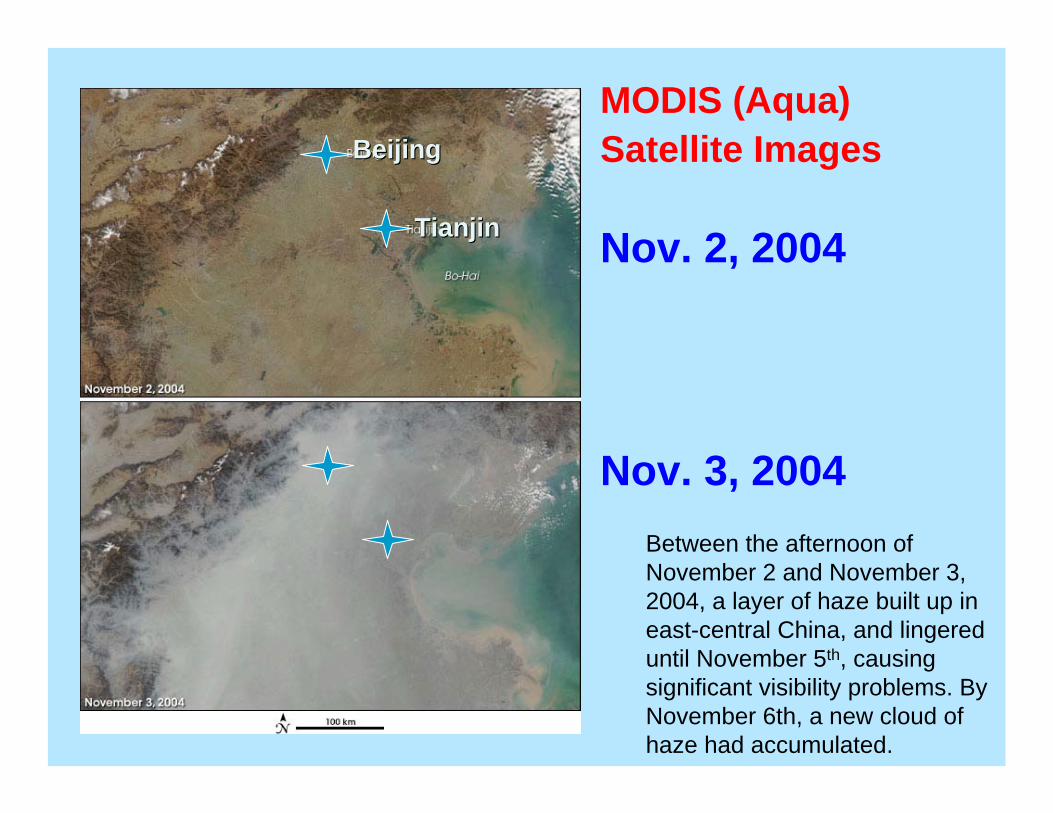
Modeling analysis initiated in 2003Modeling analysis initiated in 2003Collaboration with Collaboration with TsinghuaTsinghua University and University and DOE/Argonne National LabDOE/Argonne National LabDemonstrates significant regional transport Demonstrates significant regional transport contributions for PMcontributions for PM2.52.5 and ozoneand ozoneImpact demonstrated by modeling Impact demonstrated by modeling andandsatellite imagery.satellite imagery.
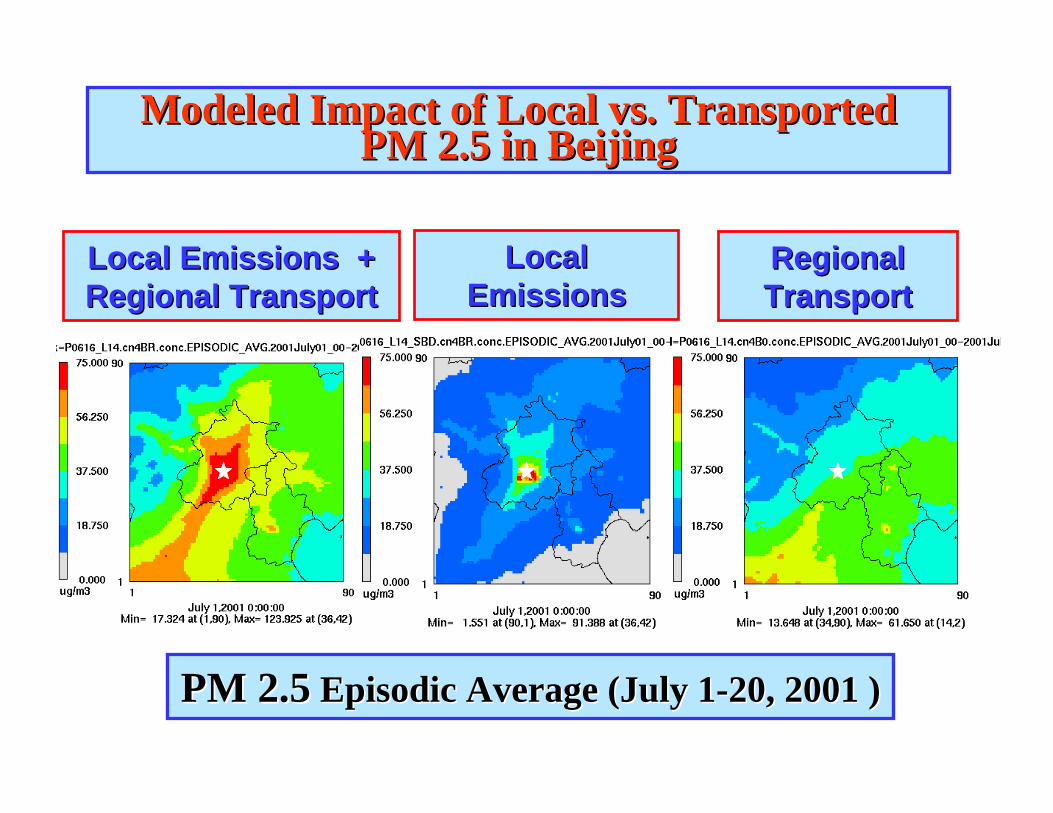
PM 2.5PM 2.5 Episodic Average (July 1Episodic Average (July 1--20, 2001 )20, 2001 )
Modeled Impact of Local vs. Transported Modeled Impact of Local vs. Transported PM 2.5 in BeijingPM 2.5 in Beijing
Local Local EmissionsEmissions
Local Emissions + Local Emissions + Regional TransportRegional Transport
Regional Regional TransportTransport
(Insert Beijing air quality modeling simulation)
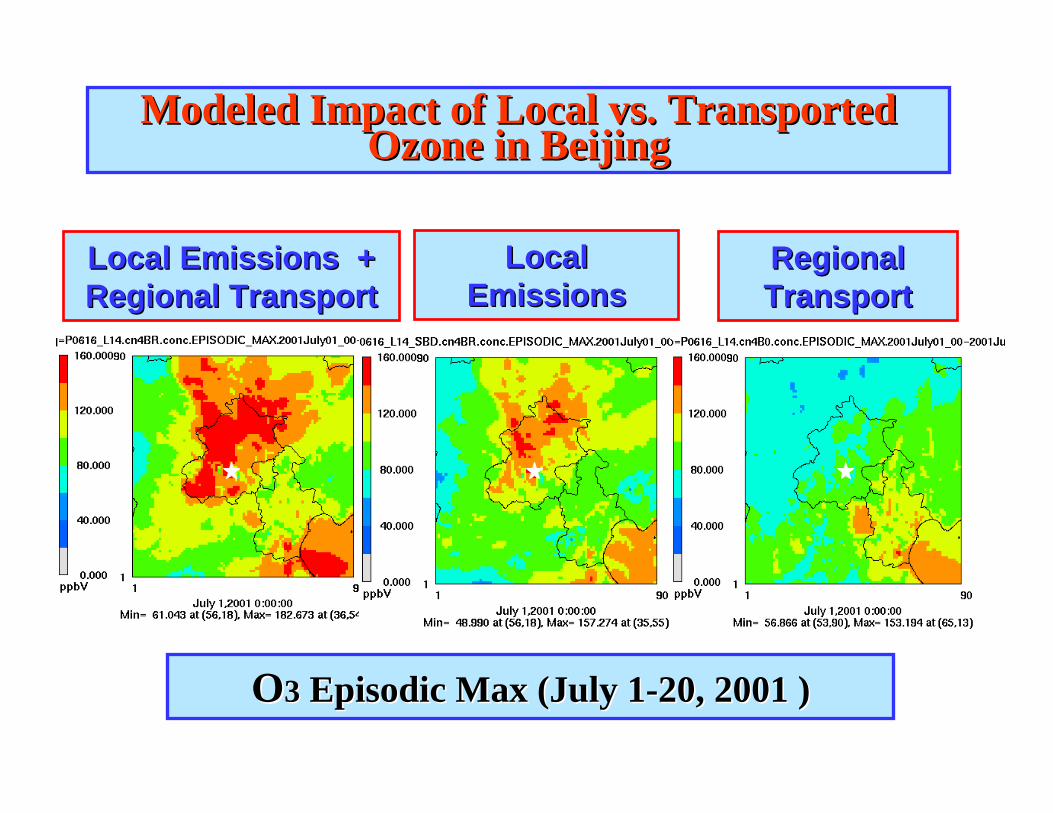
OO33 Episodic Max (July 1Episodic Max (July 1--20, 2001 )20, 2001 )
Modeled Impact of Local vs. Transported Modeled Impact of Local vs. Transported Ozone in BeijingOzone in Beijing
Local Local EmissionsEmissions
Local Emissions + Local Emissions + Regional TransportRegional Transport
Regional Regional TransportTransport
BeijingBeijing
TianjinTianjin
MODIS (Aqua) Satellite Images
Nov. 2, 2004
Nov. 3, 2004Between the afternoon of November 2 and November 3, 2004, a layer of haze built up in east-central China, and lingered until November 5th, causing significant visibility problems. By November 6th, a new cloud of haze had accumulated.

Second USSecond US--China China NOxNOx and SO2 Control Workshopand SO2 Control Workshop
Final PointsFinal PointsLocal reductions alone cannot achieve desired air quality manageLocal reductions alone cannot achieve desired air quality management ment goalsgoals–– Need to address regional sources at the same timeNeed to address regional sources at the same time–– Not addressing regional sources can lead local areas to delay Not addressing regional sources can lead local areas to delay
implementing controls (cleaning up their own sources) as they implementing controls (cleaning up their own sources) as they ““blameblame””problems on external sourcesproblems on external sources
Use multiUse multi--pollutant approaches to addressing pollution from coalpollutant approaches to addressing pollution from coal--fired fired power sectorpower sector–– Generally more costGenerally more cost--effective to address controls at onceeffective to address controls at once
Need authority to force states to participate and to ensure compNeed authority to force states to participate and to ensure compliance liance with regional approacheswith regional approaches–– Methods for verification (e.g., continuous emission monitors) anMethods for verification (e.g., continuous emission monitors) and strong d strong
penalties for nonpenalties for non--compliancecompliance–– Result: high rate of complianceResult: high rate of compliance
Set performance targets and allow flexibility in how to meet theSet performance targets and allow flexibility in how to meet the targetstargets–– This encourages competition among technologies, fuels, etc.This encourages competition among technologies, fuels, etc.
Second USSecond US--China China NOxNOx and SO2 Control Workshopand SO2 Control Workshop
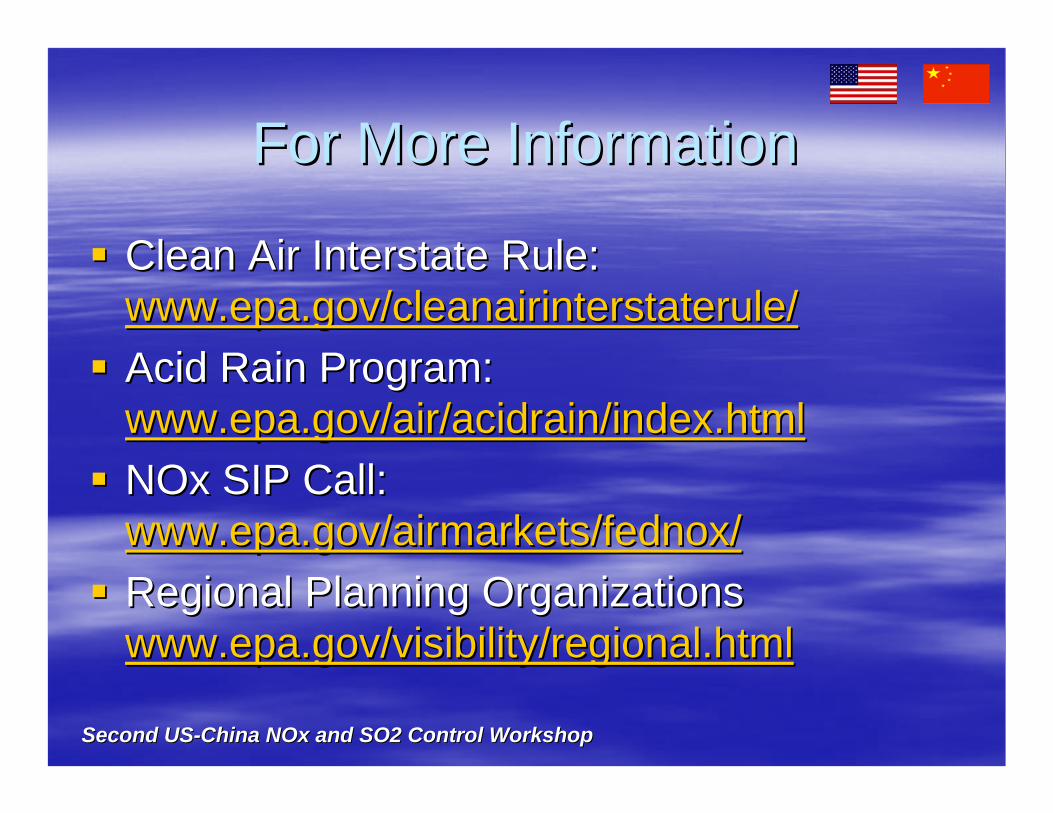
For More InformationFor More Information
Clean Air Interstate Rule: Clean Air Interstate Rule: www.epa.gov/cleanairinterstaterule/www.epa.gov/cleanairinterstaterule/Acid Rain Program: Acid Rain Program: www.epa.gov/air/acidrain/index.htmlwww.epa.gov/air/acidrain/index.htmlNOxNOx SIP Call: SIP Call: www.epa.gov/airmarkets/fednox/www.epa.gov/airmarkets/fednox/Regional Planning Organizations Regional Planning Organizations www.epa.gov/visibility/regional.htmlwww.epa.gov/visibility/regional.html
Second USSecond US--China China NOxNOx and SO2 Control Workshopand SO2 Control Workshop
THANK YOU!THANK YOU!谢谢谢谢
Dale EvartsDale EvartsUS EPAUS EPAOffice of Air Quality Planning and StandardsOffice of Air Quality Planning and [email protected]@epa.gov