regional assessments of the nation’s water quality
TRANSCRIPT

These regional SPARROW modeling assessments•Provide the most comprehensive studies to date of the sources,
transport, and fate of nutrients in the streams of six major regions of the conterminous United States (U.S.), based on national compilations of water-resource geospatial data from federal, state, and local water agencies. Advances in scientificunderstandingandmodelingtoolsmadefromtheseassessments can be used by decision-makers to evaluate the sources and environmental factors that control stream nutrients at scales ranging from small catchments and counties to large watersheds, states, and regions.
•Confirmtheimportanceofurbanandagriculturalsourcesasmajor contributors of nutrients to U.S. streams but provide new information about local and regional differences in nutrient contributions from contrasting types of agricultural (farm fertilizersandanimalmanure)andurban(wastewatereffluentand diffuse runoff from developed land) sources.
Regional Assessments of the Nation’s Water Quality—Improved Understanding of Stream Nutrient Sources Through Enhanced Modeling Capabilities
The U.S. Geological Survey (USGS) recently completed assessments of stream nutrients in six major regions extending over much of the conterminous United States. SPARROW (SPAtially Referenced Regressions On Watershed attributes) models were developed for each region to explain spatial patterns in monitored stream nutrient loads in relation to human activities and natural resources and processes. The model information, reported by stream reach and catchment, provides contrasting views of the spatial patterns of nutrient source contributions, including those from urban (wastewater effluent and diffuse runoff from developed land), agricultural (farm fertilizers and animal manure), and specific background sources (atmospheric nitrogen deposition, soil phosphorus, forest nitrogen fixation, and channel erosion).
• Indicate that highly diffuse background sources of nutrients that may be natural or anthropogenic in origin are the dominant sources of nutrients to many U.S. streams where other large sources are not present. This adds newinformationthathasbeendifficulttoquantifyinlocalwater-qualityassessmentsyetisneededtodevelopcomprehensive and realistic nutrient-management goals.
•Describethesourcesandquantitiesofnutrientsthataredelivered to downstream sensitive water bodies, such as reservoirs and estuaries, where nutrient inputs can contribute toexcessivealgalgrowthanddegradedwater-qualityconditions. These results account for the effects of natural factors (such as climate, soils, and hydrology) and human-relatedfactors(suchasfarmtiledrainage)thatinfluencetheattenuation and transport of nutrients at local scales in small drainages as well as at regional scales in large watersheds.
ForestAtmosphericCroplandManurePoint sourceDeveloped land
Largest sources of nitrogen to streams
Major river basin boundary
Largest sources of phosphorus to streams
BackgroundCroplandManurePoint sourceDeveloped land
Major river basin boundary
>200
<50
Total phosphorus yields—In kilograms per square kilometers per year
50 to 100100 to 150150 to 200
EXPLANATIONTotal nitrogen yields—
EXPLANATION
In kilograms per square kilometers per year
>2,000
<500500 to 1,0001,000 to 1,5001,500 to 2,000
Figure 1. Estimates developed from separate regional models for six large regions of the conterminous United States illustrate the spatial distribution of total nitrogen and total phosphorus yield from individual stream-reach drainages and the largest contributing source to each stream reach drainage.
Fact Sheet 2011–3114October 2011
U.S. Department of the InteriorU.S. Geological Survey Printed on recycled paper

2
Urban and Agricultural Sources of Nutrients to Streams
On a regional basis, urban sources (wastewatereffluent,diffuserunofffromdeveloped land) contribute from 12 to 48 percent of the nitrogen to streams and from 19 to 63 percent of the phosphorus; the largest contributions occur in the Northeast and Mid-Atlantic regions. Wastewatereffluentcontributesthelargestshare of nutrient mass to urban streams (more than 69 percent) and can compose a relatively large percentage of the total load to downstream receiving waters. In some areas, nutrients from wastewater-effluentdischargesaretransportedoverhundreds of kilometers in streams and are the largest contributor among all sources to distant downstream water bodies. Urban diffuse runoff contributes less overall mass of nutrients, but given its highly diffuse nature, it affects a larger number of urban streams and is the larger local source to 43 to 98 percent of urban streams, depending on the region.
Agricultural sources (farm fertilizers, animal manure) contribute from 23 to 70 percent of the nitrogen and 13 to 59 percent of the phosphorus to streams; the largest contributions occur in the Midwest and central regions of the Nation. Over broad areas of these regions and in selected areas of the East, animal manure contributeslargerquantitiesofnitrogenand phosphorus compared to farm fertilizer (fig.1).Inmostotherareas,farmfertilizers(and the associated runoff from cultivated lands) generally contribute more nitrogen tostreamsandnearlyequalquantitiesofphosphorus compared to animal manure.
Background Sources of Nutrients to Streams
In all drainages, some of the nutrient mass transported to streams is due to highly diffuseorevenubiquitoussourcesthatcould be natural or anthropogenic in origin.Forexample,nitrogenfixationorplant degradation are naturally occurring processes that provide some nitrogen to streams broadly across the landscape. Soil erosion occurring across an entire region can add phosphorus to streams that could be naturally occurring or that could have originated from human activities. Lastly atmospheric deposition is a widespread source of nitrogen that is highly diffuse in nature but is entirely anthropogenic in
origin. In general, we refer to these highly diffuse sources as “background” simply becausetheytendtooccurubiquitouslythroughoutthelandscapeandaredifficulttoquantifywithoutamodellikeSPARROW.Further, these diffuse sources are important because they can be the largest sources in some drainages, and accounting for them iscriticalforestablishingwater-qualitymanagement goals that are both appropriate and feasible. The SPARROW model resultsdescribedhereinprovideuniqueinformationforidentifyingandquantifyingbackgroundsourcesforsuchwater-qualitymanagement goals.
Natural background sources are the largest contributors of nutrients, among allsources,inmanystreamsinthePacificNorthwest, the Northeast and mid-Atlantic, and the Southeast where other major nutrientsourcesdonotoccur.InthePacificNorthwest, forests contribute 51 percent of the nitrogen to streams and represent the largest source to 70 percent of the stream miles. Forests (especially red alderstandsthatfosternitrogenfixation)contribute as much as 97 percent of the nitrogen to streams of the western Cascade Mountains.Forestlandalsowasidentifiedas a source of phosphorus in a number of the regional models. However, forest land generally serves as a surrogate indicator of sources that are assumed to be from the erosion of soil or geologic material, or from plant degradation that may be associated with forests.
Background sources of phosphorus identifiedbythemodelsincludestream-channel erosion, geologic properties (soils), and forested lands. Stream-channel erosion is an especially important phosphorus source in the Missouri River basin, where it contributed 23 percent to stream reaches on average and as much as 97 percent to some streams. Phosphorus in eroded sediments may originate from both natural sources (such as soils) and human sources (such as wastewater-treatmenteffluent).Soilsareamajor natural phosphorus source to streams of the Southeast, contributing 41 percent on average and more than 73 percent to some streams. Forests are important natural background sources in three regions including the Northeast and upper and lower Midwest.
Atmospheric deposition from local and distant anthropogenic sources is the largest contributor of nitrogen to many streams in the south-central, mid-Atlantic, and northeastern U.S. Across the six regions
atmospheric deposition contributes from 5 to 46 percent of the total mass of nitrogen to streams. The largest contributions occur to streams of the Southeast, where atmospheric deposition contributes up to 46 percent of the nitrogen and is the largest source to 78 percent of the stream miles. Although atmospheric deposition contributes less than 20 percent of the nitrogen to the streams of the Northeast, it is the largest source to nearly 50 percent of the stream miles in this region. Atmospheric sources in the models primarilyreflectnitrogendepositionfromdistant stationary emission sources, such as power plants, but also include minor contributions from local ammonia emissions associated with farm fertilizers and livestock and nitrogen from urban sources associated with automotive exhaust.
Environmental Processes Affecting Nutrient Delivery to Streams and Downstream Waters
Natural environmental processes and some human activities on the landscape can affect the delivery rates of nutrients to streams either by enhancing delivery or by reducing it through attenuation processes. Knowledge of the effects of these environmental factors can be used to identify high-priority watersheds with low levels of natural at tenuation where nutrient-source reductions generally would be
0 to 2525 to 5050 to 7575 to 100
Incremental yield—In percentage due to
geologic material
Percentage of Phosphorus Yield Due to Naturally Occurring Geologic Material
Figure 2. A substantial amount of the phosphorus transported to streams in some areas of the
Southeast is derived from naturally occurring geologic sources. Understanding the distribution of natural and human sources of phosphorus transported to streams is critical in developing realistic nutrient-reduction strategies.
ATLA
NTIC O
CEAN
GULF OF MEXICO

3
remove nutrients before they can reach downstream waters.
Large differences in nutrient yields fromwesttoeastacrosstheU.S.(fig.1)areexplained in part by variations in climatic factors (precipitation and temperature). These are fundamental measures of water and energy availability that control the rates of nutrient movement and loss on the land and in streams and reservoirs. For example, nutrient yields are among the lowest throughout much of the West because of the prevailing arid conditions that limit nutrient runoff and delivery to streams and downstream waters. This occurs despite a diversity of important sources,
expected to have greater downstream benefits—thatis,themostefficientresponse per unit of upstream reduction. Conversely, watersheds with high natural attenuation of nutrients could be given lower priority if the goal was to improve downstreamwaterquality.
In most areas of the country, only a small fraction of the nutrient mass that is input to watersheds on an annual basis is actually delivered to streams and downstream water bodies. This is because nitrogen and phosphorus commonly are attenuated during transport as a result of the effects of many physical and biochemical processes. These may
include nutrient uptake by plants, adsorp-tion to soil particles, storage in the subsurface from leaching to groundwater, anddenitrification(theconversionofreactive nitrogen to an inert gaseous form that is released to the atmosphere). Human activities also can affect the rates of nutrient attenuation. For example, largequantitiesofnutrientsoncultivatedlands (from farm fertilizers or natural nitrogenfixation)areassimilatedincrops and exported from watersheds in harvested grains and plant residues. In addition, natural processes in streams and reservoirs (such as assimilation, settlingandstorageofanddenitrification)
In kilograms per square kilometers per yearIncremental yield—
<240240 to 320320 to 400
400 to 580>580
0 to 3030 to 6060 to 90
>12090 to 120
In kilograms per square kilometers per yearIncremental yield—
Water-resource managers and policy makers have relied on hydrologic and chemicalmodelstoestimatecurrentwater-qualityconditionsandpredicthowconditions might change in response to a selected policy decision. It is often difficult,however,fordecisionmakerstoreadilyaccessmodelinformationanduse models directly to evaluate a range of alternative scenarios. The SPARROW Decision Support System provides easy access to SPARROW model results. By making this capability available over the Internet in a user interface with familiar controls, modelers and water-resource managers alike can experiment with hypothetical scenarios and develop science-based estimates regarding theeffectsthatspecificcontaminantsourcesorchangesmayhaveonwaterquality.Theseestimatescanthenbeeasilycommunicatedtostakeholdersandthegeneralpublicthroughthesamewebsite.Equallyimportant,theDecision Support System provides estimates of model uncertainty to inform managers about the range of variability in model predictions of stream loads that can be attributed to uncertainties about how well the models describe actualwater-qualityconditionsandthefactorsthatinfluencetheseconditions.
Comprehensive information on how the SPARROW models were developed, data sets used to calibrate the models, and instructional videos are availableontheDecisionSupportSystem.Usersalsocansaveuser-definedmanagement scenarios and share the session with colleagues. Options also are available to export model output data from selected areas for use in other applications.
The Decision Support System can produce a variety of maps to show the spatial variability in nutrient yields and the sources that contribute the largest amounts of nutrients throughout a large region, such as the southeastern U.S.
SPARROW Decision Support System—Informing Nutrient Management Decisions
Fertilizer
Point sources
Total yield
The SPARROW Decision Support System can be accessed at http://water.usgs.gov/nawqa/sparrow/dss.
Urban areas

4
–25 to –20–20 to –15–15 to –10–10 to –5–5 to 0
Change in total delivered load
of nitrogen,in percentage,
to Apalachicola Bay
> 420
0 to 7575 to 150150 to 300300 to 420
In kilograms per square kilometers per year
Incrementaldelivered yield—
> 1400 to 2525 to 5050 to 100
100 to 140
In kilograms per square kilometers per yearIncremental delivered yield—
ATLA
NTIC
OCE
AN
NC
FL
GA
ALFL
GA
ALTN
SC
GULF OF MEXICO
Atlanta
ApalachicolaRiver basin
Over past decades, human activities have accelerated nutrient inputs to U.S. estuaries, thus contributing to excessive algal growth and degraded conditions in the estuaries. About two-thirds of the138U.S.estuarieshavemoderatetohighlevelsofeutrophication,withaboutone-halfidentifiedas having impaired human or ecological uses that are associated with eutrophic conditions (Bricker and others, 1999). Managers can use the Decision Support System to identify the watersheds and sources that contribute the largest amounts of nutrients that are delivered to nutrient-sensitive estuaries. These capabilities are illustrated for the Apalachicola Bay where agriculture (fertilizer applications to cultivated lands) and atmospheric deposition account for about two-thirds of the total nitrogen load enteringthebay,withwastewatereffluentcontributingnearly20percentofthetotalload.Additionaldisplays from the system can be used to identify inland watersheds that deliver the highest amounts of nitrogen to the bay and may, therefore, be useful for ranking management actions. Watersheds contributing the highest amounts to the bay are near Atlanta (from point sources) and in the southern parts of Georgia and Alabama (from the atmosphere and fertilizer). Reductions in the stream-nutrient loads leaving the watersheds with the highest contributions generally would be expected to lead to a moreefficientreductioninloadsenteringthebay—thatisthereduction in load to the bay per unit of load removed upstream would be expected to be larger for these watersheds compared to the reduced loads in watersheds with relatively low delivered yields. A notable management challenge faced in the Apalachicola Bay, as in other southeastern coastal waters where atmospheric deposition is a large source, is that atmospheric nitrogen frequentlyoriginatesfromdistantsources (such as power plants) located outside of the watershed.
The Decision Support System can be used to evaluate nutrient-reduction scenarios. The model estimates that a 25-percent reduction in point, atmospheric, or fertilizer sources individually results in a less than 10-percent reduction in the nitrogen load delivered to Apalachicola Bay. Reducing all three sources by 25 percent would reduce the nitrogen load delivered to the bay by 21 percent.
Understanding the sources and which watersheds contribute the largest amounts of nutrients to nutrient-sensitive waters can assist managers in the development of nutrient-management strategies.
Nitrogen Delivery to Estuaries
Nitrogen Yields Delivered from Upland Watersheds to Apalachicola Bay
Three Nitrogen Reduction Scenarios 25-Percent Reduction in Nitrogen Inputs
Fertilizer
Fertilizer
Atmosphere
Atmosphere
5 percent 9 percent 7 percent
Point sources
Point sourcesTotal yield
Reduction in nitrogen load delivered to Apalachicola Bay
ApalachicolaBay
ApalachicolaBay

5
ranging from agriculture and atmospheric deposition in drier areas of the Midwest to forest and other background sources in the PacificNorthwest.Bycontrast,nutrientyields are generally higher in the more humid watersheds of the Midwest and East. Figure 3 illustrates precipitation patterns and phosphorus yields in the Missouri River basin where the highest delivered yields to the mouth of the river occur in the lower end where precipitation rates are higher. Nutrients generated in the upper portions of the drainage tend to have low delivery rates due in part to lower precipitation and other environmental characteristics that may affect delivery to streams or limit the amount transported downstream.
Soil and topographic properties (soil permeability and depth, erodibility, acidity, organic matter, and land slope) were found to be important factors affecting nutrient delivery to streams in many of the regional models. Soil permeability was important in three of the six regions and was inversely related to nutrient loads in streams; the observance of lower nutrient loads in streams of watersheds with higher soil perme-abilitymayreflecttheeffectsofgreaterinfiltrationofwaterandnutrientsinthesewatershedswithsubsequentstorageand(or)denitrification-relatedlossesinsoilsand groundwater. Farm-management activities also can affect soil drainage and nutrient delivery to streams. For example, the nitrogen transport to streams in the Midwest and the Missouri River basin was appreciably affected by the use of irrigation and tile drains. Stream nitrogen
loads entering the Mississippi River from the Missouri River basin were estimated to be reduced by as much as 17 percent as a result of increased anoxia and denitrificationonirrigatedfarmlands.By contrast, nitrogen loads in streams of the upper Midwest region were found to increase with the percentage of land area drained by tile-drainage systems which are extensively used in the Midwest to support corn and soybean cultivation.
Nutrient attenuation processes in streams and reservoirs, caused by denitrificationandthenutrientstorageinparticulates,reducethequantitiesofnutrients delivered to local and distant downstream waters in many of the regions. Nutrient removal in reservoirs wasidentifiedasimportantinfiveofthesix regions. Approximately 16 percent of the nitrogen load and 33 percent of the phosphorus load in the Missouri River were removed with nearly half of the total removal occurring in the eight largest reservoirs. The rates of nitrogen removal in streams (expressed as a fraction of the nutrient mass removed per unit of water travel time) declined with increases in stream depth (stream size) in many of the regions, thereby indicating that the largest rates of in-stream nutrient removal generally occur in the smallest streams. Thisrelationreflectsthereducedcapabilityof streams to remove nitrogen as water volumes increase with stream size, leading to less particulate settling (nitrogen and phosphorus storage) and less water and nitrogen contact with benthic sediments (wheredenitrificationoccurs).
Development of Regional SPARROW Models for the Conterminous United States
The USGS developed the spatial water-qualitymodelSPARROWtoassistwith the interpretation of available water-resource data and provide predictions of waterqualityinunmonitoredstreams.The modeling framework was developed originally for and applied at the national scale, but models have since been developedforspecificregionsoftheU.S.andoutsideoftheU.S.forspecificcountries. SPARROW is a hybrid empirical and process-based mass-balance model that has been used previously in major U.S. river basins to estimate the primary sources and environmental factors that affect the supply, transport, and fate of contaminants in streams for mean annual conditions (see http://water.usgs.gov/nawqa/sparrow/ for a more detailed description).
Recently, the USGS developed new SPARROW models to assess nutrient conditions in streams of six large regions of the conterminous U.S. (Major River Basins;fig.4).Thedocumentationforthese models and the results and example nutrient-management applications were published as part of a featured collection in the Journal of the American Water Resources Association (Preston and others, 2011). These regional models provide an updated assessment of nutrients in most streams of the conterminous U.S. based on amorecurrentandrefinedsetofnationalgeospatial data. Major advances were made in expanding the number of sites
Precipitation—In millimeters
High: 2,875
Low: 144
Yield—In kilograms per square kilometers per year
<5
5 to 20
>20 to 50
>50 to 200
>200 to 1,000
>1,000 to 2,000
>2,000
Total phosphorus yieldsfrom watersheds Precipitation
Missouri Riverbasin
Mississippi R
EXPLANATION
EXPLANATION
Minnesota
Iowa
South Dakota
North Dakota
Wyoming
Montana
Nebraska
KansasMissouri
Colorado
Missouri R
Figure 3. The amount of phosphorus transported to streams in the Missouri River basin is related to climatic conditions. The highest phosphorus yields occur in the lower part of the basin in part because greater rainfall allows more agriculture and in part because greater rainfall increases the transport of phosphorus to streams.
6
with stream loads derived from monitoring information, developing a data base fordescribingeffluentdischargesfromindustrial and municipal wastewater-treatment facilities, and developing data sets for describing background nutrient sources. All of these data were used with other national geospatial data (for example farm fertilizer, animal manure, land-use, climate, soils, topography, stream-network properties) to calibrate the SPARROW models to provide accurate accounting of nutrient sources and environmental processes for reliable predictions of nutrient loads in unmonitored streams.
Streamwater-qualitymonitoringdata were obtained from approximately 125,000 sites operated by 186 govern mental agencies across the country through retrievals from public data bases and contacts with agency personnel. The data were screened to ensure that the number andlengthofthewater-qualityandstreamflowrecordsweresufficientforestimating long-term loads. This resulted in the selection of approximately 2,700 sites (from 73 monitoring agencies) with sufficientdatatocalibratethemodels.Notethat one important reason for the sizeable lossofwater-qualitydatafromthescreeningprocessreflectsthecommonpracticeofcollectingwater-qualitysamplesfromstream locations without a nearby water flowgage;measuresofstreamflowarenecessary to calculate a reliable measure ofthenutrientmass(load)asrequiredforsource-transport models such as SPARROW.
The estimates of long-term nutrient loads at monitoring sites used to calibrate theregionalmodelreflectwater-qualityconditionsfor2002,andalsoreflectlong-termmeanstreamflowsoverthe1975to2005 period. The use of the long-term mean streamflowstoestimatethemonitoringsiteloads,ratherthantheflowsduringonly 2002, ensures that the SPARROW regional model estimates of stream nutrient load, source contribution to streams, and environmental processes that govern the mean rates of nutrient removal and transport in watersheds are representative of long-term hydrologic variability.
Estimates of the nutrient loads in effluentdischargesfrom23,481industrialand municipal wastewater-treatment facilities were based on data retrievals from the U.S. Environmental Protection Agency (USEPA) Permit Compliance System.Theloadsreflecttheapplication
of systematic procedures by USGS to evaluateandenhancethequalityofthedata for estimating loads. The procedures included the validation of facility locations, correction of erroneous data, and the use of“typical”effluentconcentrationvalues
By Stephen D. Preston, Richard B. Alexander, and Michael D. Woodside
ReferencesBricker, S.B., Clement, C.G., Pirhalla, D.E,
Orlando, S.P., and Farrow, D.R.G., 1999, National estuarine eutrophication assessment: Effects of nutrient enrichment in the Nation’s estuaries: Silver Springs, MD, National Oceanic and Atmospheric Administration, National Ocean Service, Special Projects OfficeandNationalCentersforCoastalOcean Science, 71 p.
to represent missing or unreported data. The resulting data base provides the discharge estimates and point locations for nearly all of the major facilities that contribute the large majority of the point-source nutrient loads to streams.
Preston, S.D., Alexander, R.B., and Wolock, D.M., 2011, SPARROW modelingtounderstandwater-qualityconditions in major regions of the United States: A featured collection introduc-tion: Journal of the American Water Resources Association (JAWRA), 4 p., available online at http://onlinelibrary.wiley.com/doi/10.1111/j.1752-1688.2011. 00585.x/pdf.
Major river basin boundaryMonitoring site
EXPLANATION
New Englandand
Mid-Atlantic
South Atlantic–Gulf and Tennessee
Great Lakes, Ohio, Upper Mississippi, and Souris–Red–Rainy
Missouri
Lower Mississippi,Arkansas–White–Red,
and Texas–Gulf
Rio Grand, Colorado, and Great Basin
Pacific Northwest
California
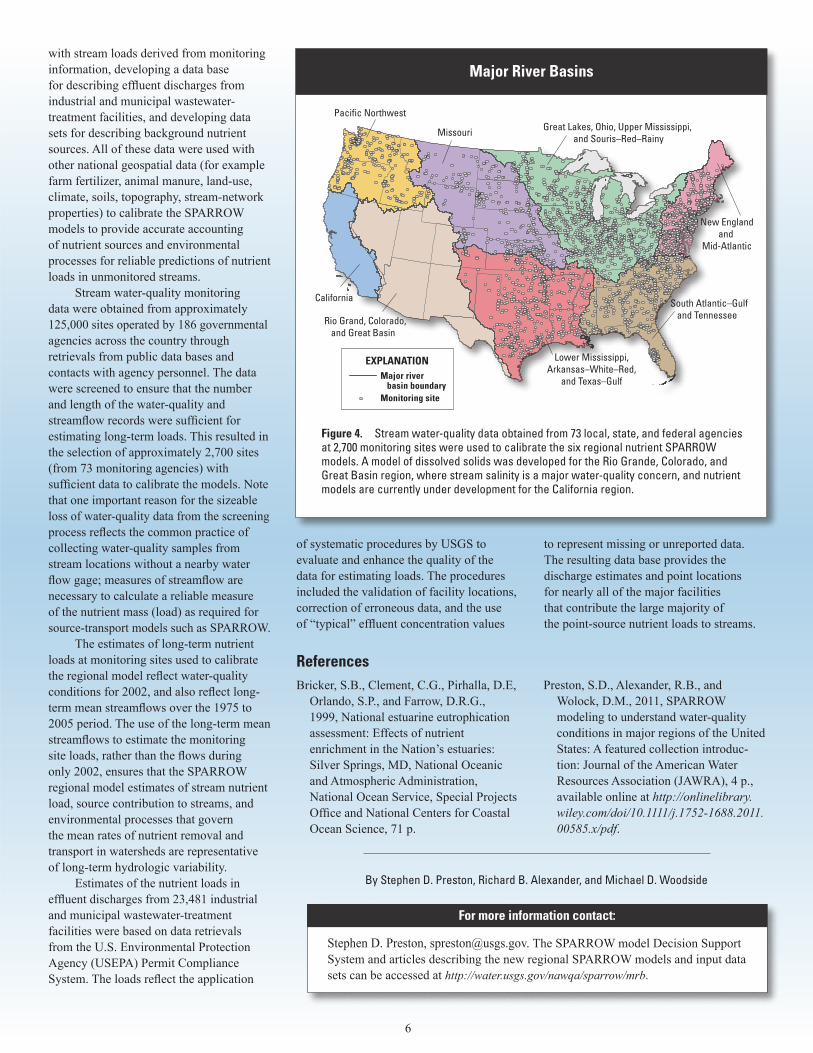
Figure 4. Stream water-quality data obtained from 73 local, state, and federal agencies at 2,700 monitoring sites were used to calibrate the six regional nutrient SPARROW models. A model of dissolved solids was developed for the Rio Grande, Colorado, and Great Basin region, where stream salinity is a major water-quality concern, and nutrient models are currently under development for the California region.
For more information contact:
Stephen D. Preston, [email protected]. The SPARROW model Decision Support System and articles describing the new regional SPARROW models and input data sets can be accessed at http://water.usgs.gov/nawqa/sparrow/mrb.
Major River Basins