regional conference on sustainable integrated … · digital camera. formulation of a ... pumping...
TRANSCRIPT

Planning of Rural Sanitation Projects
Kafr El-Sheikh Governorate Case Study (Horizon 2020 Project)
Dr. Ahmad H Gaber
Chairman, Chemonics Egypt Consultants
Regional Conference on Sustainable Integrated Wastewater Treatment and Reuse
December 2014, Sharm El-Sheikh, Egypt
Acknowledgement
This project has been implemented during the period Dec.
2011- April 2013 by WS Atkins, HCL, and Chemonics Egypt
Consultants within the Mediterranean Hot Spot
Investment Programme, Horizon2020 and financed by
European Investment Bank, EIB.
The planning process in this study has followed the National Rural Sanitation Strategy, HCWW, published 2008

Structure of the Presentation
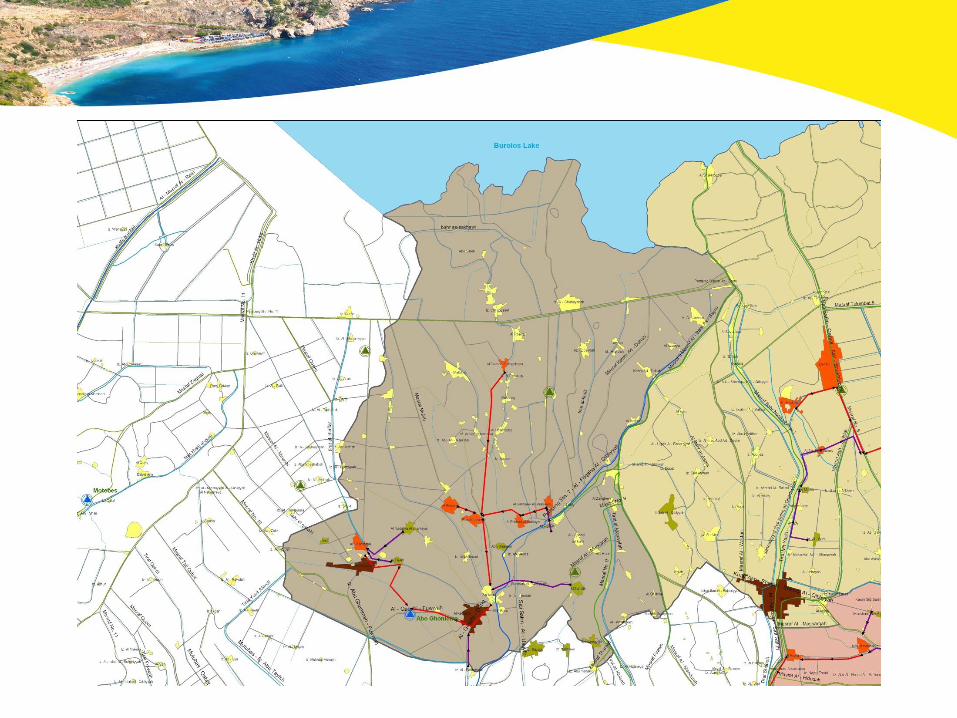
A. Project area, overview.
B. Planning of rural sanitation in the project area .
C. Results of planning stage.
Planning of Rural Sanitation Projects
Kafr El-Sheikh Governorate Case Study
Part A Project Area Overview: Kafr El-Sheikh Governorate, Rural Sanitation Situation

Item 2006
census 2012
Total Area, km2 3748
Population 2,622,705 3,021,621
No. of Cities 10 10
No. of
Local Units 55 78
No. of
Mother Villages 208 216
Total Number of
Rural
Communities
2501 ?
General characteristics
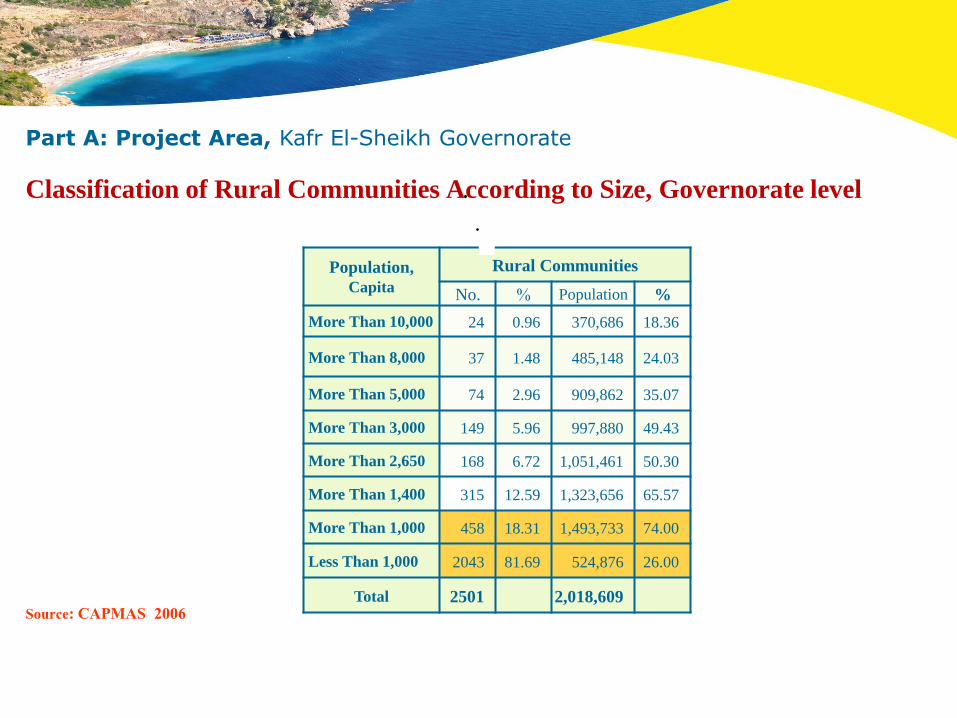
Part A: Project Area, Kafr El-Sheikh Governorate
Population,
Capita
Rural Communities
No. % Population %
More Than 10,000 24 0.96 370,686 18.36
More Than 8,000 37 1.48 485,148 24.03
More Than 5,000 74 2.96 909,862 35.07
More Than 3,000 149 5.96 997,880 49.43
More Than 2,650 168 6.72 1,051,461 50.30
More Than 1,400 315 12.59 1,323,656 65.57
More Than 1,000 458 18.31 1,493,733 74.00
Less Than 1,000 2043 81.69 524,876 26.00
Total 2501 2,018,609 Source: CAPMAS 2006
Classification of Rural Communities According to Size, Governorate level
Part A: Project Area, Kafr El-Sheikh Governorate
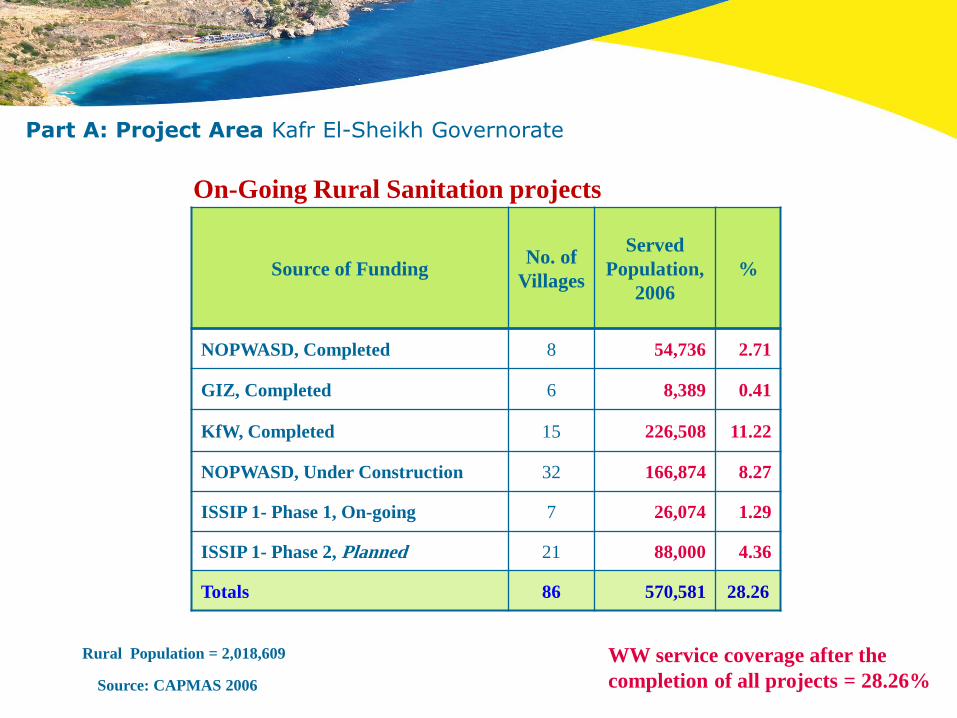
Part A: Project Area Kafr El-Sheikh Governorate
On-Going Rural Sanitation projects
%
Served
Population,
2006
No. of
Villages Source of Funding
2.71 54,736 8 NOPWASD, Completed
0.41 8,389 6 GIZ, Completed
11.22 226,508 15 KfW, Completed
8.27 166,874 32 NOPWASD, Under Construction
1.29 26,074 7 ISSIP 1- Phase 1, On-going
4.36 88,000 21 ISSIP 1- Phase 2, Planned
28.26 570,581 86 Totals
WW service coverage after the
completion of all projects = 28.26% Source: CAPMAS 2006
Rural Population = 2,018,609
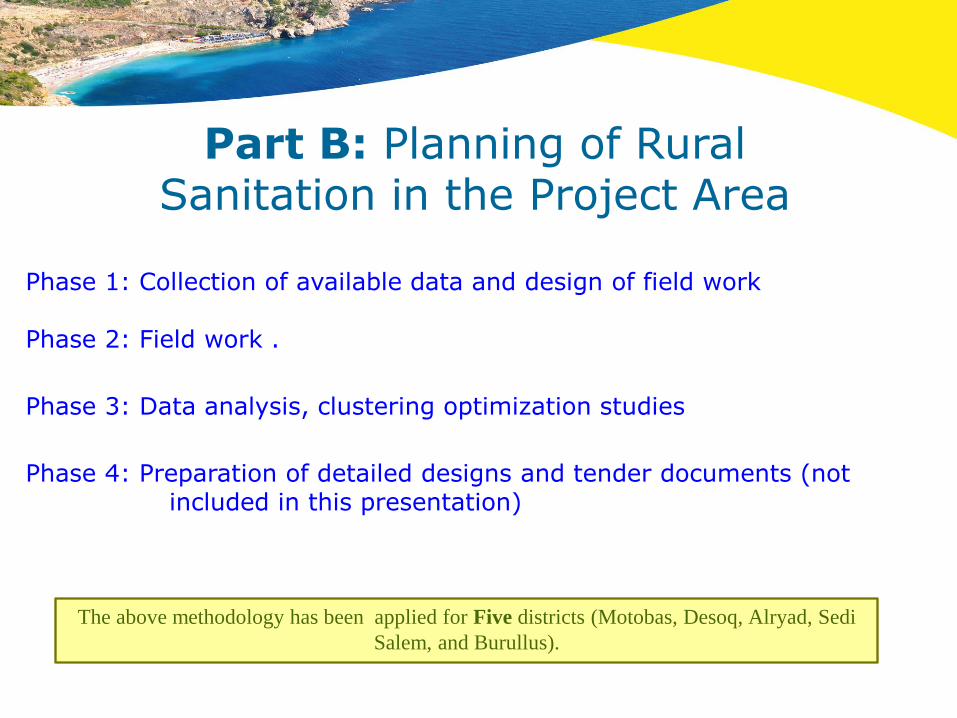
Phase 1: Collection of available data and design of field work Phase 2: Field work .
Phase 3: Data analysis, clustering optimization studies
Phase 4: Preparation of detailed designs and tender documents (not
included in this presentation)
Part B: Planning of Rural Sanitation in the Project Area
The above methodology has been applied for Five districts (Motobas, Desoq, Alryad, Sedi
Salem, and Burullus).

Phase 1: collection of available data and design of field work
• Stakeholders engagement.
• Team building.
• Collection of available maps and drawings.
• Collection of data available on water and wastewater flows and
composition in the project area.
• Collection of demographic data and main economic activities .
• Analysis of collected data and identification of data gaps..
• Data collection on unit cost data related to wastewater projects.
Part B: Planning of Rural Sanitation in the Project Area
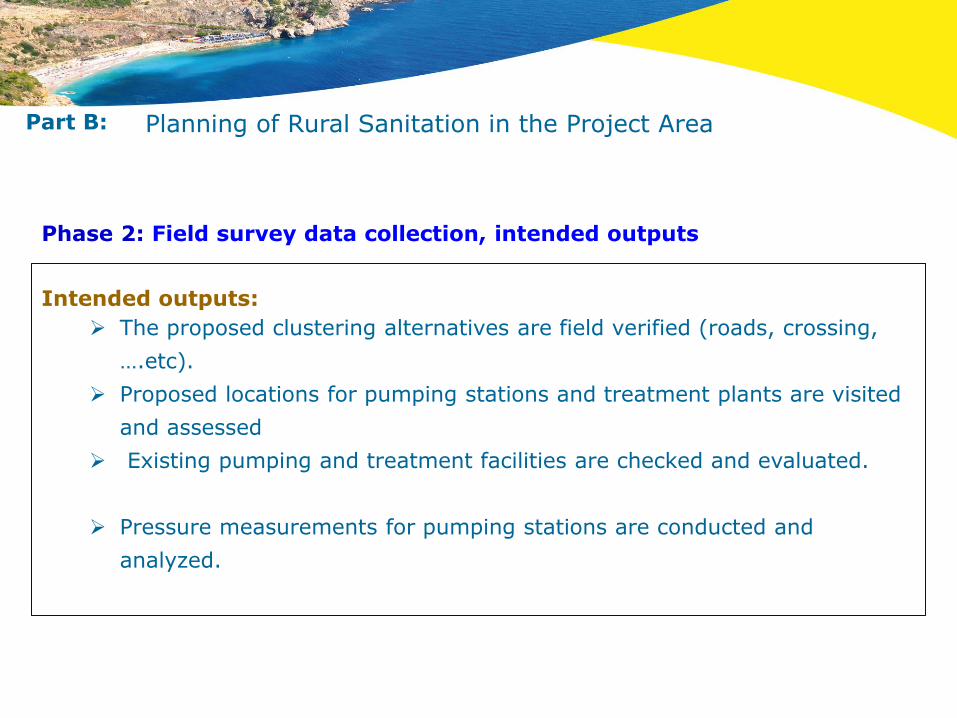
Phase 2: Field survey data collection, intended outputs
Part B:
Intended outputs:
The proposed clustering alternatives are field verified (roads, crossing,
….etc).
Proposed locations for pumping stations and treatment plants are visited
and assessed
Existing pumping and treatment facilities are checked and evaluated.
Pressure measurements for pumping stations are conducted and
analyzed.
Planning of Rural Sanitation in the Project Area

Phase 2: Field work
Part B:
Preparatory work prior to field visits
Formulation of basic engineering team for every district
ready with field data collection forms, GPS devices, and a
digital camera.
Formulation of a specialized team to assess WWTPs and
pump stations.
Formulation of a specialized team on flow and pressure
measurements in WWTPs.
.
Planning of Rural Sanitation in the Project Area
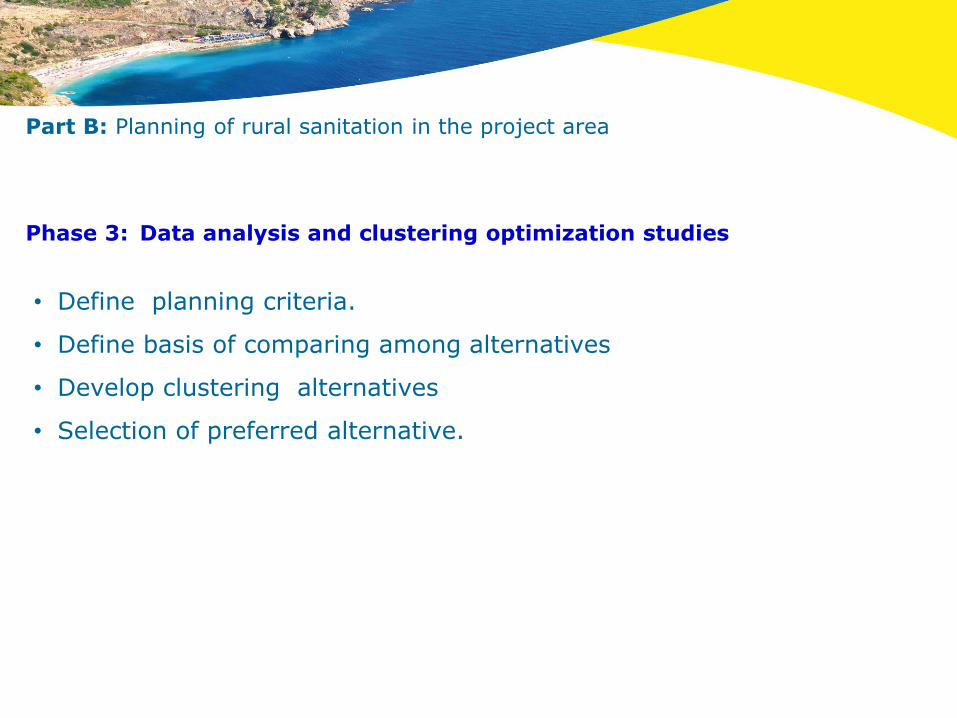
• Define planning criteria.
• Define basis of comparing among alternatives
• Develop clustering alternatives
• Selection of preferred alternative.
Phase 3: Data analysis and clustering optimization studies
Part B: Planning of rural sanitation in the project area

No. Criterion Score
1 Population 30 2 Cost of wastewater service per capita 25 3 Effect of sub-soil water level (visual effect) and vacuum evacuation rate 10 4 Pollution of water bodies (environmental effect) 10
5 Importance of village location with respect to wastewater system (the center of
villages)
10
6 Cooperation of local authorities (land availability for plant construction) 5
7 Type village economic activities (Touristic-Business and industrial-agricultural) 5
8 Possibility of connection to an existing wastewater treatment plant 5
Total 100
Proposed methodology for prioritization of Village selection
1. Population 30 2.Cost of wastewater service per capita 25
Criterion Indication Score Criterion Indication Score
More than or equal 5000 capita 30 Less than 1500 L.E. 25
From 4001 to 5000 capita 25 From 1500 to 2000 L.E. 20
From 3001 to 4000 capita 20 From 2000 to 2500 L.E. 15
From 2001 to 3000 capita 15 From 2500 to 3000 L.E. 10
From 1401 to 2000 capita 10 More than 3000 L.E. 5
Less than 1400 5
3. Effect of sub-soil water
(visual effect) and vacuum
evacuation rate
10 4. Adjacent water streams
(environmental effect) 10
Criterion Indication Score Criterion Indication Score
Strong 10 Inside the village 10
Medium 5 500 m far or less 5 Weak 2 500 m far or more 2
Part B: Planning of rural sanitation in the project area
Illustration of part of the methodology
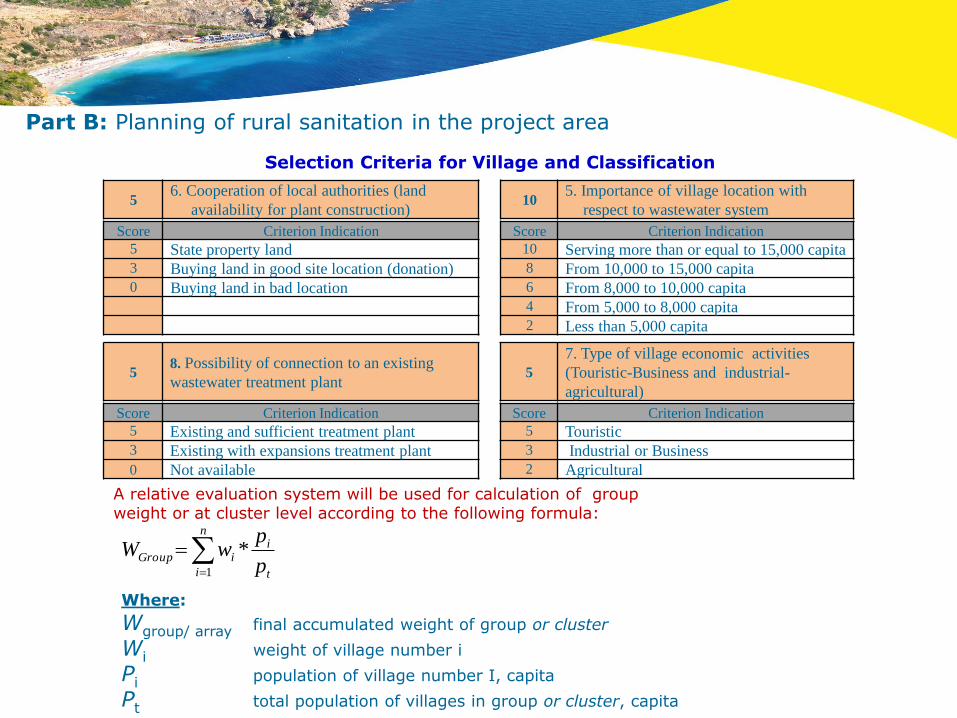
5. Importance of village location with
respect to wastewater system 10
6. Cooperation of local authorities (land
availability for plant construction) 5
Criterion Indication Score Criterion Indication Score
Serving more than or equal to 15,000 capita 10 State property land 5
From 10,000 to 15,000 capita 8 Buying land in good site location (donation) 3
From 8,000 to 10,000 capita 6 Buying land in bad location 0
From 5,000 to 8,000 capita 4
Less than 5,000 capita 2
7. Type of village economic activities
(Touristic-Business and industrial-
agricultural)
5 8. Possibility of connection to an existing
wastewater treatment plant 5
Criterion Indication Score Criterion Indication Score
Touristic 5 Existing and sufficient treatment plant 5
Industrial or Business 3 Existing with expansions treatment plant 3
Agricultural 2 Not available 0
A relative evaluation system will be used for calculation of group weight or at cluster level according to the following formula:
n
i t
iiGroup
p
pwW
1
*
Where:
Wgroup/ array final accumulated weight of group or cluster
Wi weight of village number i
Pi population of village number I, capita
Pt total population of villages in group or cluster, capita
Selection Criteria for Village and Classification
Part B: Planning of rural sanitation in the project area
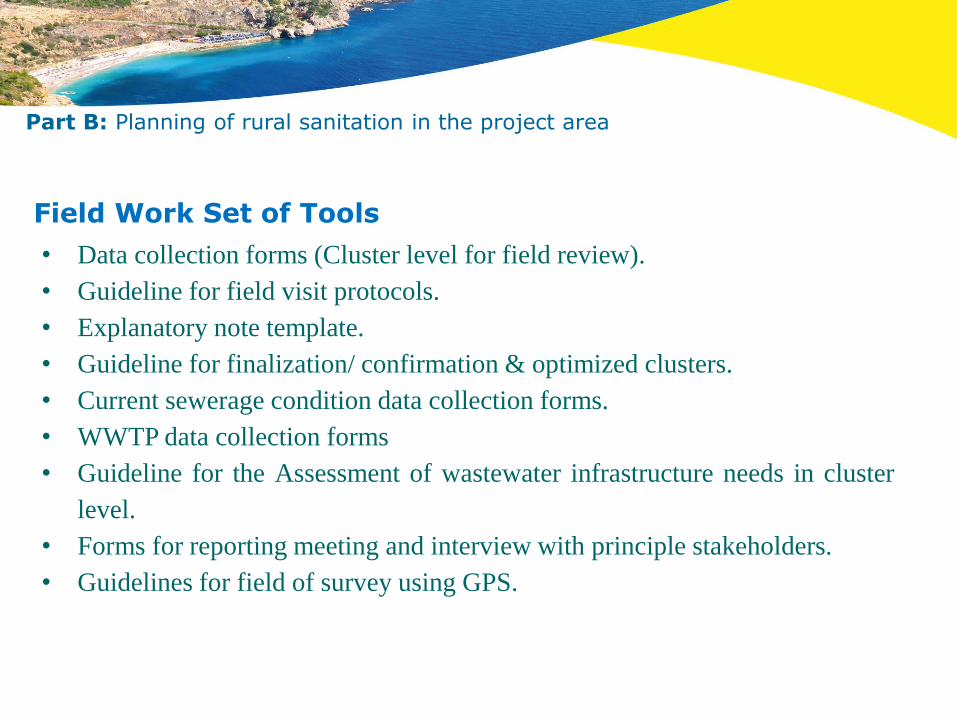
• Data collection forms (Cluster level for field review).
• Guideline for field visit protocols.
• Explanatory note template.
• Guideline for finalization/ confirmation & optimized clusters.
• Current sewerage condition data collection forms.
• WWTP data collection forms
• Guideline for the Assessment of wastewater infrastructure needs in cluster
level.
• Forms for reporting meeting and interview with principle stakeholders.
• Guidelines for field of survey using GPS.
Field Work Set of Tools
Part B: Planning of rural sanitation in the project area
Part C Study Results
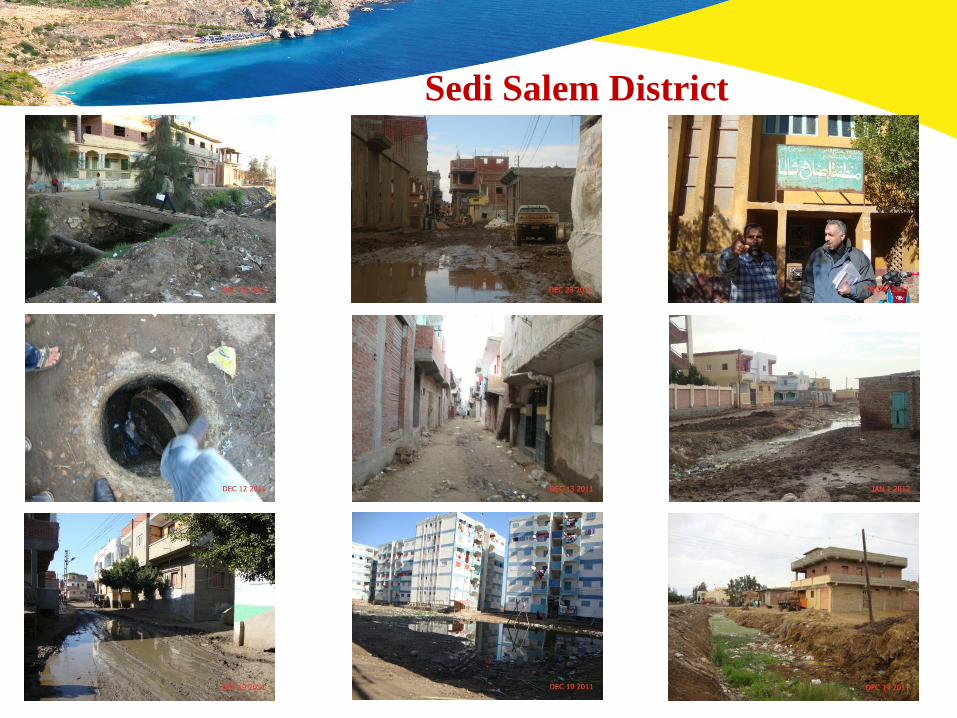
Sedi Salem District
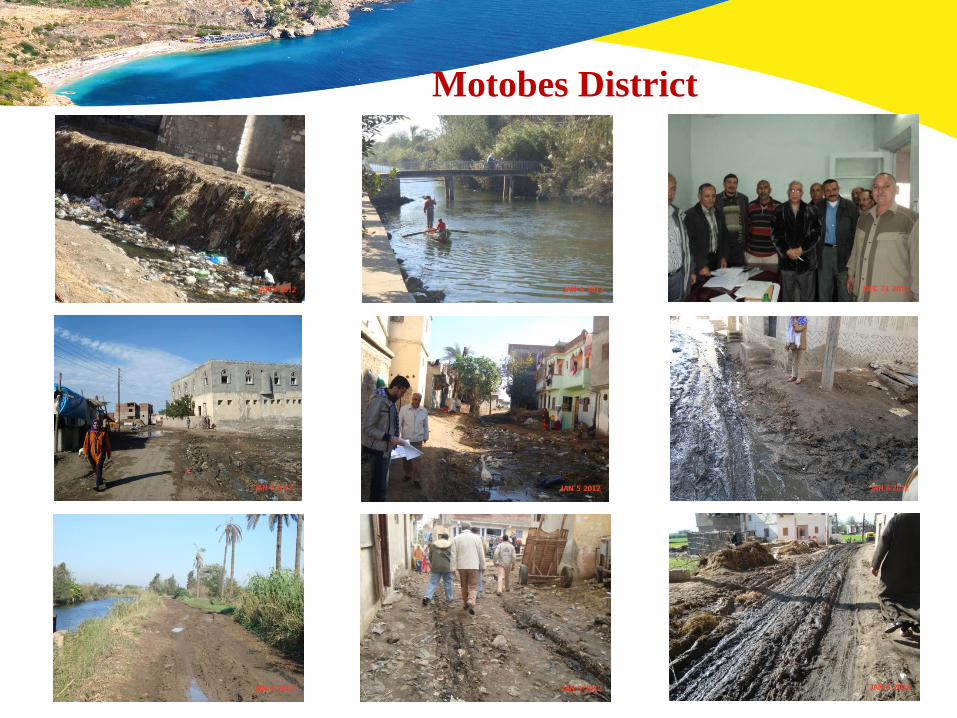
Motobes District

Part C: Results Number of villages as found during field visits
compared to 2006 census data
District Number of Local
Units Number of Mother Village
Census Actual* Census Actual*
Sedi Salem 6 15 26 31
Motobas 4 4 17 17
Burullus 3 6 10 10
Alryad 3 13 17 19
Desoq 10 11 34 35
Total 26 49 104 112
* Changes in period 2006- 2012
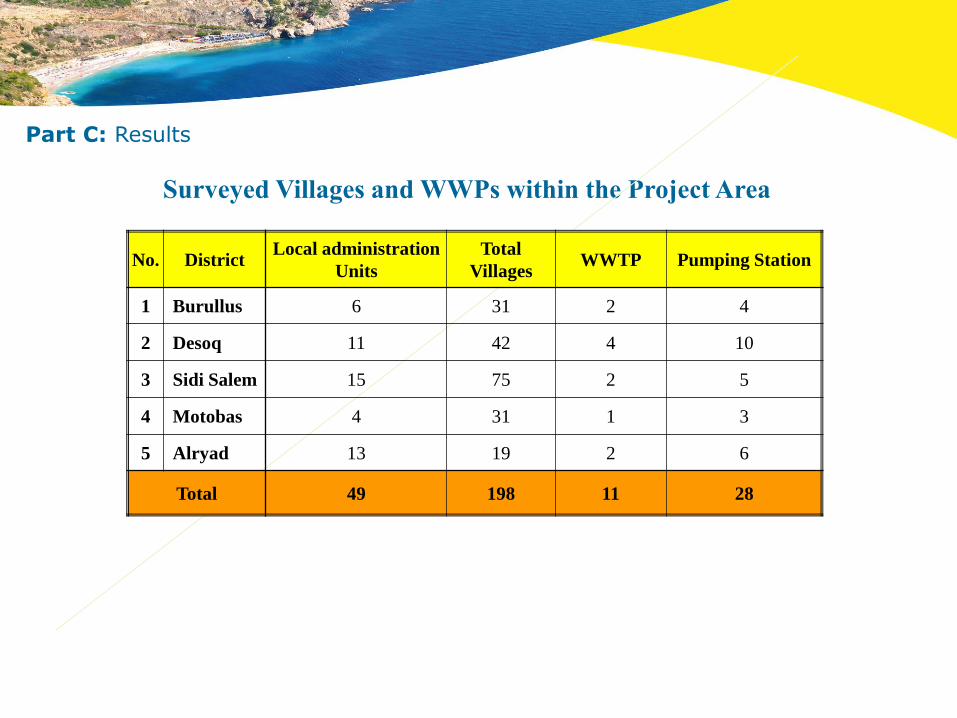
Surveyed Villages and WWPs within the Project Area
No. District Local administration
Units
Total
Villages WWTP Pumping Station
1 Burullus 6 31 2 4
2 Desoq 11 42 4 10
3 Sidi Salem 15 75 2 5
4 Motobas 4 31 1 3
5 Alryad 13 19 2 6
Total 49 198 11 28
Part C: Results
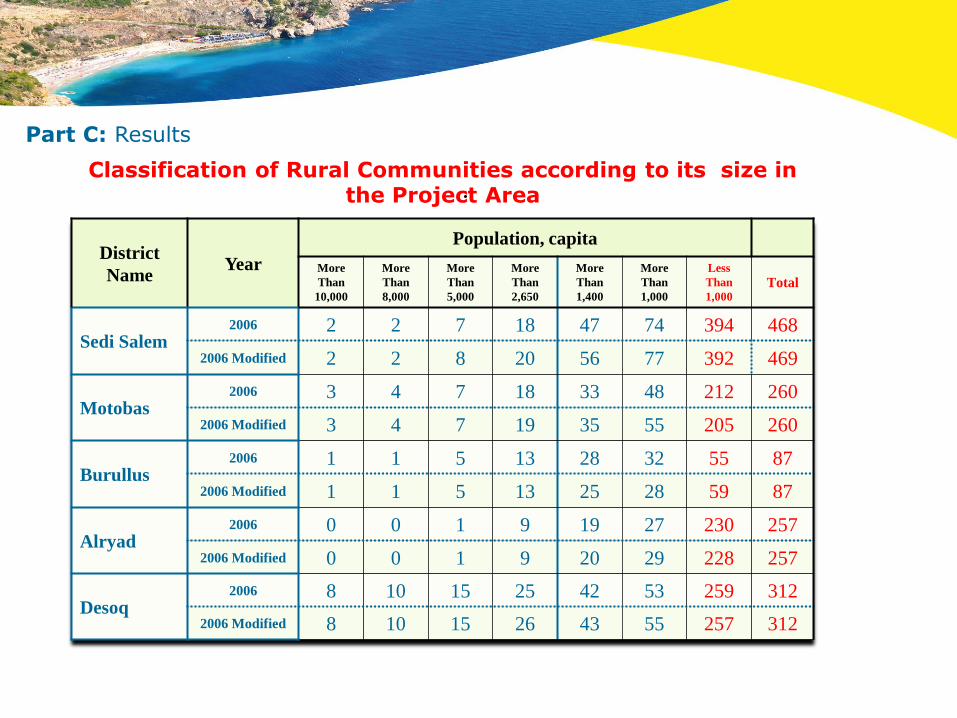
Classification of Rural Communities according to its size in the Project Area
Part C: Results
District
Name Year
Population, capita
More
Than
10,000
More
Than
8,000
More
Than
5,000
More
Than
2,650
More
Than
1,400
More
Than
1,000
Less
Than
1,000
Total
Sedi Salem 2006 2 2 7 18 47 74 394 468
2006 Modified 2 2 8 20 56 77 392 469
Motobas 2006 3 4 7 18 33 48 212 260
2006 Modified 3 4 7 19 35 55 205 260
Burullus 2006 1 1 5 13 28 32 55 87
2006 Modified 1 1 5 13 25 28 59 87
Alryad 2006 0 0 1 9 19 27 230 257
2006 Modified 0 0 1 9 20 29 228 257
Desoq 2006 8 10 15 25 42 53 259 312
2006 Modified 8 10 15 26 43 55 257 312
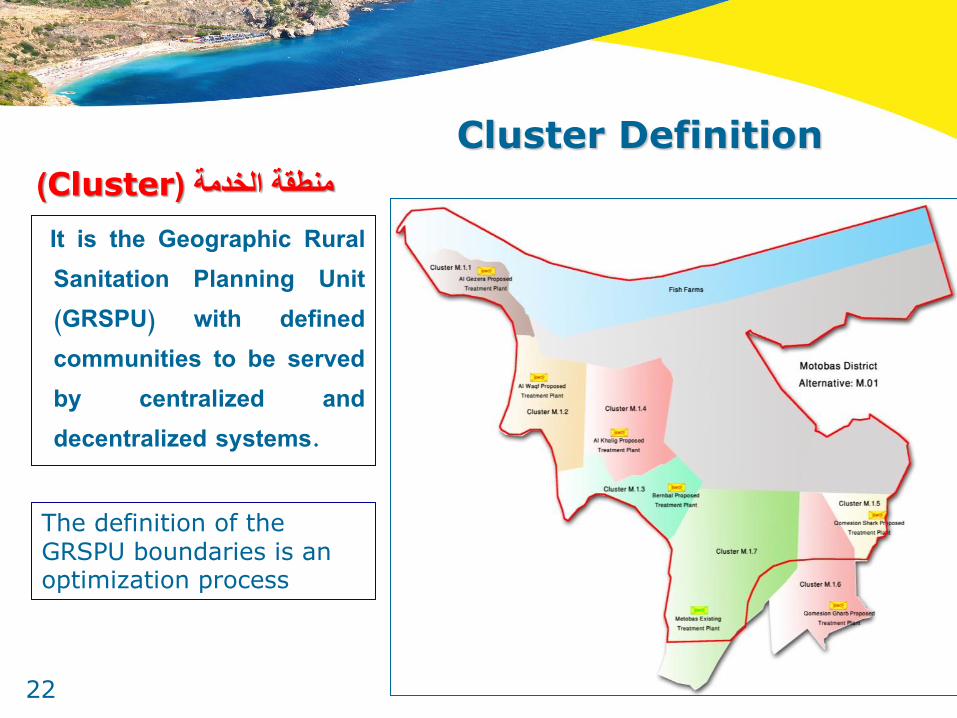
Cluster Definition
22
It is the Geographic Rural Sanitation Planning Unit (GRSPU) with defined communities to be served by centralized and decentralized systems.
(Cluster)منطقة الخدمة
The definition of the GRSPU boundaries is an optimization process

23
The sub-cluster Level (an array of villages)
It is part of the cluster. The array connects a series of villages, satellites and finally connect to the cluster WWTP by only one force main. The array can be used in prioritization on sub-cluster level in case of a limited available funds for all cluster projects.


Schematic Diagram of Villages of Arrays on Sub-cluster Level
Array B Array A
Collection
Primary Pumping
Inter-connecting
force main
Main Pumping Stations
Main Pumping
Force mains
WWTP
(E or N)
Sludge Mangt.
Agriculture Drain System
Effluent Disposal
WWTP
Sludge Reuse
Evacuation Trucks
Evacuation
Trucks
Pumping Sub-station
V1
V2
V1
V2
EZ1
EZ2
EZ1
EZ2
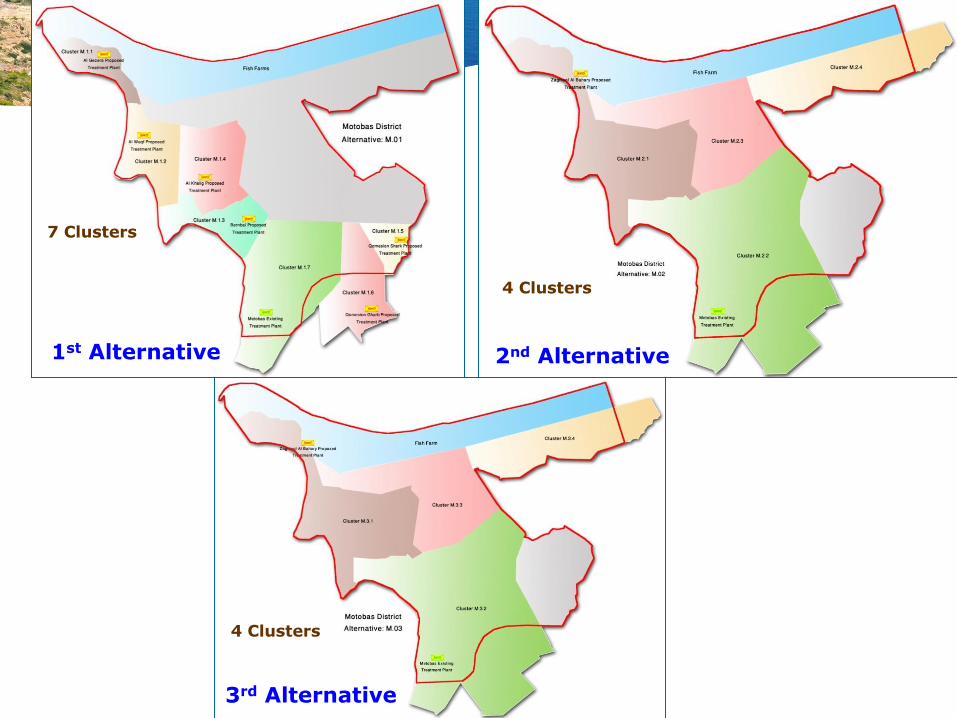
1st Alternative 2nd Alternative
3rd Alternative
7 Clusters
4 Clusters
4 Clusters
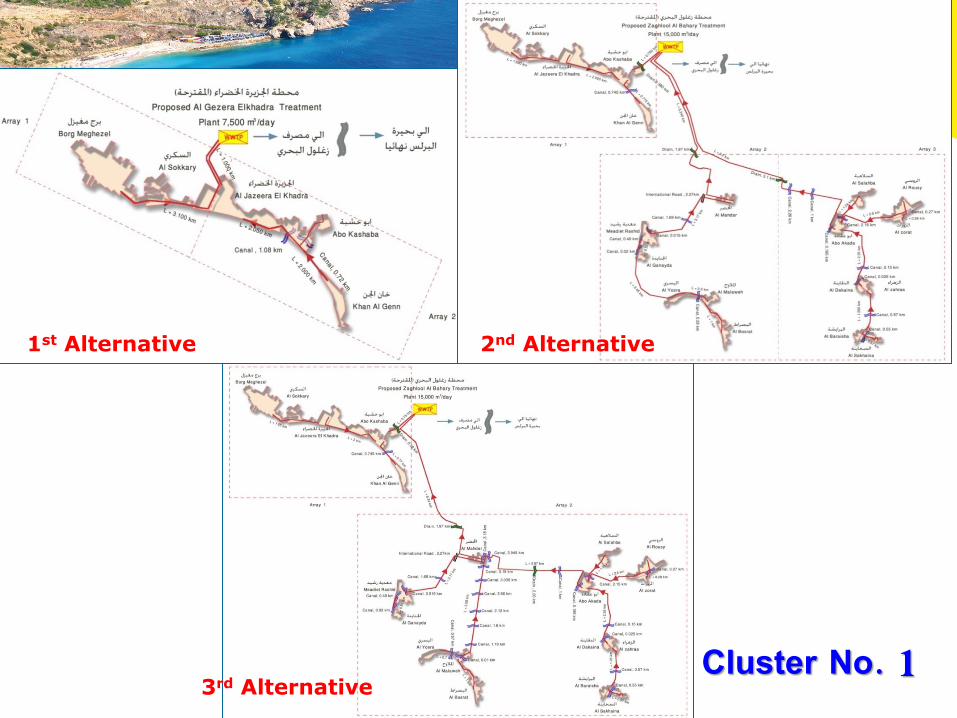
Cluster No. 1
1st Alternative 2nd Alternative
3rd Alternative

1st Alternative 2nd Alternative
3rd Alternative
Cluster No. 2

Main Features of the Three Sanitation Planning Alternatives Clusters
District Item 1
st
Alternative
2nd
Alternative
3rd
Alternative
Motobas
No of sanitation service areas (clusters( 7 4 4
Population with no sanitation service (2012( 141,721 135,428 135,428
Population to be served through centralized sewerage 129,396 119,246 119,246
Area of villages to be served with centralized sewerage
(feddan) 1,139 1,043 1,043
No of villages with sewerage service existing or under
constructions 3 3 3
No of villages to be served with sewerage networks
(population ≥ 1,400 capita in 2006) 28 25 25
No of villages to be served with sewerage networks
(population ≤ 1,400 capita) 5 2 2
No of villages to be served with on-site sanitation
systems 4 12 12
Total length of force mains (km) 54 56 51
Total length of gravity sewers (km) 287 263 263
No of wastewater treatment plants to be expanded in
capacity 1 1 1
No of proposed new wastewater treatment plants 6 1 1
Total cost of sewerage excluding wastewater treatment
plants (million L.E.) 198 195 188
Total cost of wastewater treatment plants (million L.E.) 276 101 101
Total cost of sewerage including wastewater treatment
plants (million L.E.) 474 296 290
Total cost further including WWTP land acquisition cost
(million L.E.) 484 299 292
Average sewerage service cost (L.E.)* 3,740 2,507 2,448
Average sewerage service cost per feddan (L.E.)** 425 287 280
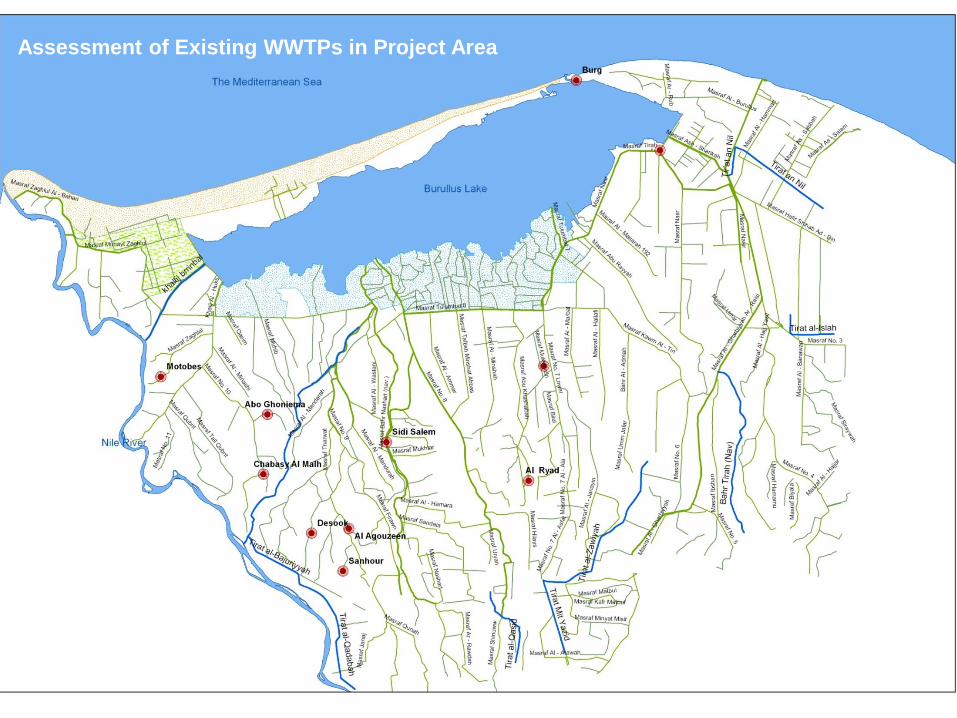
Assessment of Existing WWTPs in Project Area
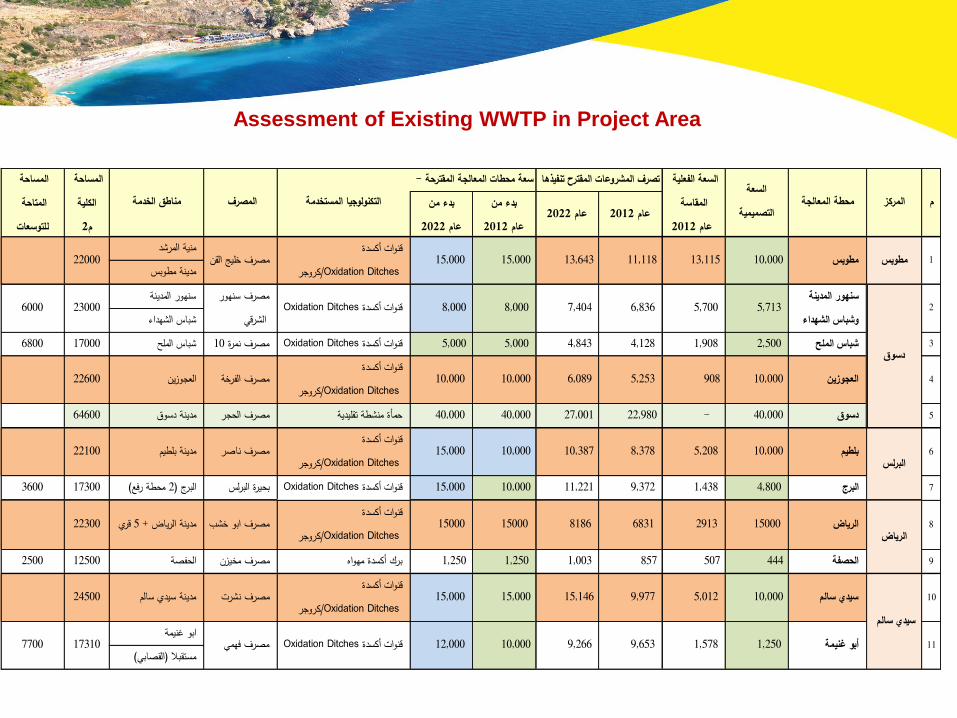
Assessment of Existing WWTP in Project Area
عام 2022عام 2012بدء من
عام 2012 بدء من
عام 2022منية المرشد
مدينة مطوبس
سنهور المدينةشباس الشهداء
170006800شباس الملحمصرف نمرة 10قنوات أكسدة Oxidation Ditches 5,000 5,000 4,843 4,128 1,908 2,500شباس الملح3
10,000 10,000 6,089 5,253 908 10,000العجوزين4قنوات أكسدة
Oxidation Ditches/كروجر22600العجوزينمصرف الفرخة
64600مدينة دسوقمصرف الحجرحمأة منشطة تقليدية 40,000 40,000 27,001 22,980 - 40,000دسوق5
15,000 10,000 10,387 8,378 5,208 10,000بلطيم6قنوات أكسدة
Oxidation Ditches/كروجر22100مدينة بلطيممصرف ناصر
173003600البرج )2 محطة رفع(بحيرة البرلسقنوات أكسدة Oxidation Ditches 15,000 10,000 11,221 9,372 1,438 4,800البرج7
150002913683181861500015000الرياض8قنوات أكسدة
Oxidation Ditches/كروجر22300مدينة الرياض + 5 قريمصرف ابو خشب
125002500الحفصةمصرف مخيزنبرك أكسدة مهواه 1,250 1,250 1,003 857 507 444الحصفة9
15,000 15,000 15,146 9,977 5,012 10,000سيدي سالم 10قنوات أكسدة
Oxidation Ditches/كروجر24500مدينة سيدي سالم مصرف نشرت
ابو غنيمةمستقبال )القصابي(
7700
المساحة المتاحة للتوسعات
22000
230006000 5,700
1,578
سعة محطات المعالجة المقترحة - السعة الفعلية المقاسة
عام 2012
28,000
10,000
115,000
17310
6,836 7,404 مصرف سنهور
الشرقي
محطة المعالجةالمركزم
سنهور المدينةوشباس الشهداء
دسوق
10,000مطوبسمطوبس
المساحة الكليةم2
مناطق الخدمة المصرف
مصرف خليج القن 11,118 13,643
البرلس
مصرف فهمي Oxidation Ditches قنوات أكسدة 11 9,266 9,653 12,000أبو غنيمة 1,250
سيدي سالم
التكنولوجيا المستخدمة
Oxidation Ditches قنوات أكسدة 5,713
قنوات أكسدة Oxidation Ditches/كروجر
15,000
8,000
السعةالتصميمية
تصرف المشروعات المقترح تنفيذها
13,115
الرياض
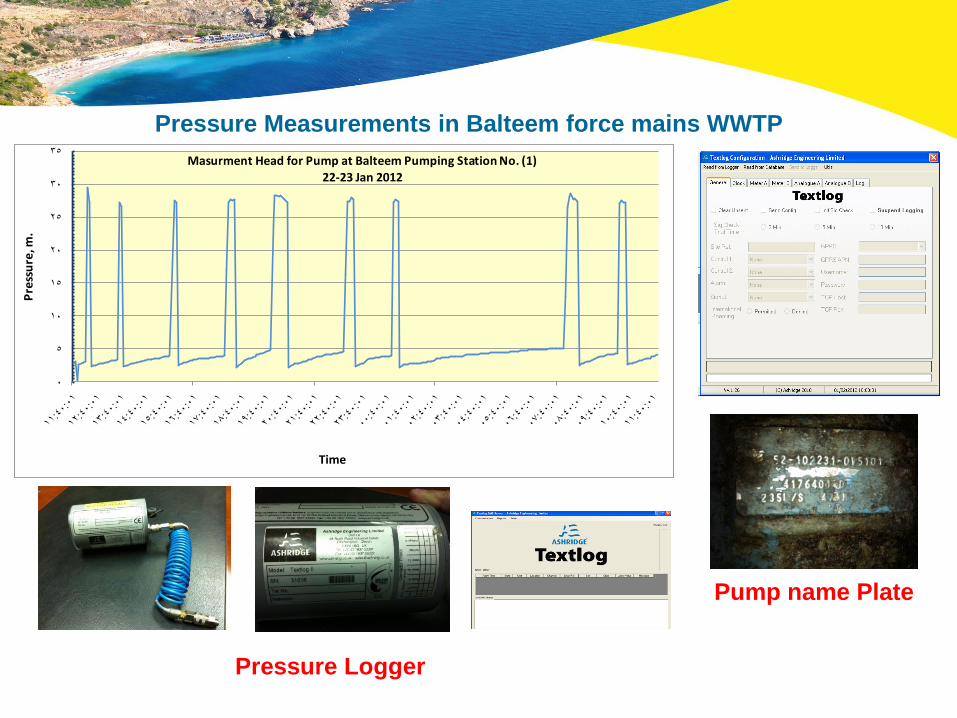
Pressure Measurements in Balteem force mains WWTP
Pre
ssu
re, m
.
Time
Masurment Head for Pump at Balteem Pumping Station No. (1)
22-23 Jan 2012
Pump name Plate
Pressure Logger
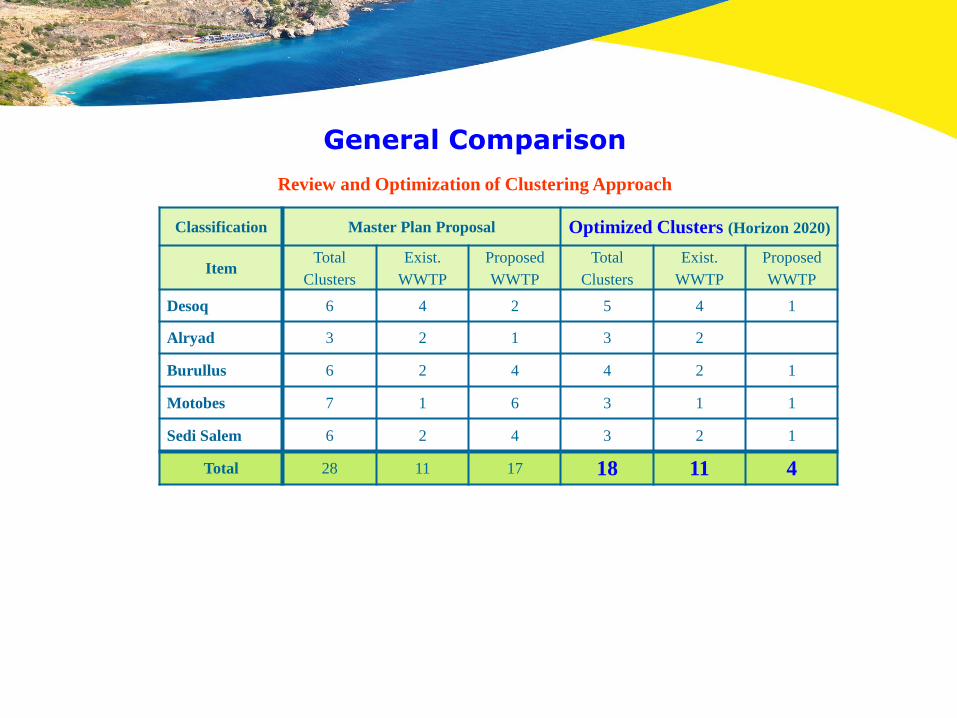
General Comparison
Classification Master Plan Proposal Optimized Clusters (Horizon 2020)
Item Total
Clusters
Exist.
WWTP
Proposed
WWTP
Total
Clusters
Exist.
WWTP
Proposed
WWTP
Desoq 6 4 2 5 4 1
Alryad 3 2 1 3 2
Burullus 6 2 4 4 2 1
Motobes 7 1 6 3 1 1
Sedi Salem 6 2 4 3 2 1
Total 28 11 17 18 11 4
Review and Optimization of Clustering Approach

Final Evaluation of Clusters
Population % > 1400 < 1400 Population % Population %
M.03.1 71,5 20 79,622 1,964 79,622 33
M.03.2 78,4 7 17,718 7 39,621 5,286 39,621 16
S. 03.1 3 6,054
Total 30 240,212 17,718 7 125,297 7,250 84,873 119,243 50 0 0
A.03.1 59.44 7 23,837 17 22,148 22,148 16
A.03.2 22 7,731 6 6,171
S. 03.3 4 5,827
Total 11 136,844 31,568 23 27,975 6,171 71,130 0 0 22,148 16
S.03.1 65.14 16 28,162 8 36,014 36,014 10
S.03.2 63.07 26 8,333 2 59,357 59,357 17
S.03.3 65.64 28 80,877 6,050 80,877 23
Total 70 353,901 36,495 10 176,248 6,050 135,098 116,891 33 59,357 17
B.03.1 85,65 8 25,397 25,397 17
B.03.2 69 7 15,151 15,151 10
B.03.3 71 12 64,314 42 19,044 19,044 13
Total 27 151,727 64,314 42 59,592 0 20,686 59,592 39 0 0
D.02.1 67,6 5 35,871 10 26,954 26,954 7
D.02.2 72,17 4 21,013 6 15,408 15,408 4
D.02.3 56,29 3 61,758 17 6,768 6,768 2
D.02.4 64,3 13 38,266 38,266 10
D.02.5 77,76 15 83,166 83,166 22
Total 40 372,561 118,642 32 170,562 0 83,325 125,528 34 45,034 12
178 1,255,245 268,737 21 559,674 19,471 407,342 421,254 34 126,539 10* Served, Study Phase or Construction Phase Rural Population = 2,018,609Service on Governorate level, Rural areaExisting Service 28.26 Class A 20.87 Class B 6.27 Total 55.40
Total Population,
2012
(Cluster -Class A)Served Population*
240,212 84,873
71,130136,844
Desouq
Sewerage
Collection
Evacuation Trucks Collection
Sedi Salem353,901
Burullus
135,098
20,686
No. of
Villages
83,325
Proposed Project for Collection & Treatment Total Population,
2012
(Cluster - Class B)
151,727
372,561
Motobas
District Cluster
Alryad
Total Population,
2012
Capita
Cluster
Grade
%
Grand Total

Summary of our Planning Approach
Step1: Study of geography and demography of all villages: with
the District boundary
Step2: Intensive field surveys: Demography, Geography,
Roads, Water bodies, Existing Collection Systems,
Existing Treatment, measurements, and Review of the
base Alternative.
Step3: Synthesis of Alternative Plans (Min. Two): Cluster
boundaries, Arrays within each cluster.
Step4: Conceptual design of rural sanitation Management
Alternatives in each cluster.
Step5: Preliminary Cost estimation of all Alternatives in each
Cluster.
Step6: Selection of the recommended Alternative Clusters
Step7: Prioritization of Clusters based on village and array
related criteria.